Embed Size (px)
Citation preview

C H E N R Y A N A S S O C I A T E S | 2 3 9 L A U R E L S T R E E T , S U I T E 2 0 3S A N D I E G O , C A L I F O R N I A 9 2 1 0 1
Lilac Hills RanchTraffic Impact Study
A C C R E T I V E I N V E S T M E N T , I N C .1 2 2 7 5 E l C a m i n o R e a l , S t e . 1 1 0
S a n D i e g o , C A 9 2 1 3 0
P r e p a r e d f o r
P r e p a r e d b y
F E I RJ u l y 1 , 2 0 1 5
Chen Ryan

Prepared for:
Investments, Inc.
12275 El Camino Real, Ste. 110 San Diego, CA 92130
Prepared by:
239 Laurel Street, Ste. 203 San Diego, CA 92101 July 1, 2015
Traffic Impact Study
Lilac Hills Ranch
FEIR
Summary ‐ 1 Lilac Hills Ranch TIS
Executive Summary
The proposed Lilac Hills Ranch project is located in the Valley Center and Bonsall Community Planning Areas of the unincorporated County of San Diego with State Route 76 to the north, Valley Center proper to the east, the City of Escondido to the south, and Interstate 15 and Old Highway 395 to the west. The project consists of a mix of residential, commercial and institutional uses, along with parks and open space. Specifically, the project proposes commercial uses comprised of 61,500 square feet of local serving small scale specialty retail, 28,500 square feet of office uses and a 50 ‐room country inn; 903 traditional single‐family detached homes; 375 multi‐family homes (for‐rent and for‐sale at 20 or more dwelling units per acre); 468 age‐restricted single family homes (senior community); necessary facilities and amenities to serve the senior population (including a senior community center, an assisted living and group residential facility); and civic facilities include a Community Purpose Facility (CPF) area that would be comprised of a fire station and recreational facility not to exceed a total of 40,000 square feet for the combined CPF area, a K‐8 school site, 23.6 acres of public and private neighborhood parks, a private recreational center, and other recreational amenities. An interim fire station with up to 3‐staff could be located anywhere within the project site. However, this fire station would be built in place of two equivalent dwelling units and would not result in additional traffic to the overall project. Also planned within the project site are an on‐site Recycling and Green Waste Drop‐off Facility (RF), a potential Water Reclamation Facility (WRF) and other supporting infrastructure. Open space is proposed to retain some of the existing citrus and avocado groves, along with 104.1 acres of sensitive biological/wetland habitat. The proposed Lilac Hills Ranch project would generate a total of 15,141 external daily trips by buildout of the project, including 1,171 AM peak hour trips and 1,432 PM peak hour trips. Based on the County of San Diego significance criteria and the SANTEC/ITE Guidelines, the proposed project would result in direct traffic impacts at the following four (4) roadway segments:
Gopher Canyon Road, between E. Vista Way and I‐15 SB Ramps – 238th EDU triggers the need for the construction of a dedicated westbound (Gopher Canyon Road approach) right‐turn lane at the intersection of E. Vista Way / Gopher Canyon Road;
E. Vista Way, between SR‐76 and Gopher Canyon Road – 238th EDU triggers the need for the construction of a dedicated westbound (Gopher Canyon Road approach) right‐turn lane and 476th EDU triggers the need for the construction of a dedicated northbound (E. Vista Way approach) right‐turn lane at the intersection of E. Vista Way / Gopher Canyon Road;
E. Vista Way, between Gopher Canyon Road and Osborne Street – 238th EDU triggers the need for the construction of a dedicated westbound (Gopher Canyon Road approach) right‐turn lane and 476th EDU triggers the need for the construction of a dedicated

Summary ‐ 2 Lilac Hills Ranch TIS
northbound (E. Vista Way approach) right‐turn lane at the intersection of E. Vista Way / Gopher Canyon Road; and
W. Lilac Road, between Old Highway 395 and Main Street – need to be improved to 2.2C as designated in the County’s adopted Mobility Element by 929th EDU.
The proposed project would also result in direct traffic impacts at the following five (5) intersections:
E. Vista Way / Gopher Canyon Road – 238th EDU triggers the need for the construction of a dedicated westbound (Gopher Canyon Road approach) right‐turn lane at the intersection of E. Vista Way / Gopher Canyon Road. The additional mitigation measure (a dedicated northbound right‐turn lane) required for the segment of E. Vista Way, between Gopher Canyon Road and Osborne Street would further improve the operations at this intersection to LOS D during peak hours;
Old Highway 395 / W. Lilac Road – 585th EDU triggers the need for signalization and the construction of the left‐turn lane at the westbound W. Lilac Road approach;
Old Highway 395 / Circle R Drive – 210th EDU from combined Phases 4 and 5 or 1,220th total EDU triggers the need for signalization;
I‐15 SB Ramps / Gopher Canyon Road – 1st EDU of Phase 4 or 363rd total EDU triggers the need for signalization. However, this intersection is a Caltrans facility over which the County does not have jurisdiction. In addition, Caltrans does not have a plan or program in place; therefore, the impacts would remain significant and unavoidable; and,
I‐15 NB Ramps / Gopher Canyon Road – 1st EDU of Phase 4 or 363rd total EDU triggers the need for signalization. However, this intersection is a Caltrans facility over which the County does not have jurisdiction. In addition, Caltrans does not have a plan or program in place; therefore, the impacts would remain significant and unavoidable.
In addition to the direct impacts identified above, traffic generated by the proposed project would result in cumulative impacts at nine (9) study area roadway segments and 11 intersections; including: Roadway Segments
Camino Del Rey, between Old River Road and W. Lilac Road;
Gopher Canyon Road, between Little Gopher Canyon Road and I‐15 SB Ramps;
E. Vista Way, between SR‐76 and Gopher Canyon Road;
E. Vista Way, between Gopher Canyon Road and Osborne Street;
Cole Grade Road, between Fruitvale Road and Valley Center Road;
W. Lilac Road, between Old Highway 395 and Main Street;
Gopher Canyon Road, between E. Vista Way and Little Gopher Canyon Road;
Pankey Road, between Pala Mesa Drive and SR‐76; and
Summary ‐ 3 Lilac Hills Ranch TIS
Lilac Road, between Old Castle Road and Anthony Road. Intersections
E. Vista Way / Gopher Canyon Road (County);
Old Highway 395 / W. Lilac Road (County);
I‐15 SB Ramps / Old Highway 395 (Caltrans);
I‐15 NB Ramps / Old Highway 395 (Caltrans);
I‐15 SB Ramps / Gopher Canyon Road (Caltrans);
I‐15 NB Ramps / Gopher Canyon Road (Caltrans);
SR‐76 / Old Highway 395 (Caltrans);
SR‐76 / Pankey Road (Caltrans);
Old Highway 395 / E. Dulin Road (County);
Old Highway 395 / Circle R Drive (County); and
Miller Road / Valley Center Road (County). Generally, cumulative impacts to facilities listed in the County’s TIF would be mitigated through payment of TIF fees. Although the improvement is slated for implementation based upon the currently approved TIF Program; it is anticipated that the currently approved TIF Program will be updated by the County to accommodate the land use changes that would result from the project’s approval. This update would revise fee rates associated with adding the project’s land uses to the program. For facilities not included in the County’s TIF program, specific mitigation measures are proposed.
The proposed project would also have cumulative impacts to I‐15 between SR‐78 and the Riverside County boundary, and these impacts would remain significant and unmitigable. Proposed Mobility Element Classification Changes The project proposes to downgrade W. Lilac Road, between Main Street and the planned Road 3 from 2.2C (as classified in the currently adopted General Plan) to 2.2F.
This proposal is supported by the low (less than 6,100 ADT) forecast daily traffic volumes when Road 3 is deleted from the Mobility Element system. In October, 2011, after adoption of the County General Plan Update, the San Diego Association of Governments (SANDAG) acquired the 902‐acre Rancho Lilac property through its Environmental Mitigation Program (EMP). SANDAG recorded a conservation easement over the entire 902 acres and designated this land as part of a 1,600 acre open space preserve in the State Route 76 corridor in North San Diego County. This acquisition may prevent implementation of the County’s planned Road 3, and make the deletion of Road 3 from the currently adopted Mobility Element a potential roadway network scenario. Summary of Major Changes to the Traffic Impact Study (TIS)

Summary ‐ 4 Lilac Hills Ranch TIS
The following four (4) changes to the public review version of the TIS (dated 6/28/2013) resulted in additional deficient facilities, traffic impacts, and/or General Plan inconsistencies:
Change 1 – Change to project access. Only the southern portion of the Phase 5 (SFS‐5, SFS‐6, P‐11 and the church as shown in Figure 1‐3) can access Mountain Ridge Road. The public review version of the TIS assumed that both Phases 4 and 5 have access to Mountain Ridge Road. Change 1 affects “Existing + Phase D”, “Existing + Phase E”, “Existing + Cumulative Projects + Project”, and “Horizon 2030 + Project” scenarios.
Change 2 – Change to horizon year traffic volumes. The Lilac Hills Ranch Development occupies portions of three Traffic Analysis Zones (TAZs 157, 183, and 4694) in the currently adopted GP transportation forecast model, and these TAZs generate a total of 4,957 daily trips. The public review version of the TIS assumed that the Lilac Hills Ranch Development would replace approximately 75% (an acreage percentage) of the 4,957 trips which wasn’t conservative enough. The TIS in now updated so that the project would only replace 110 rural residential units (1,320 ADT) of the GP approved land uses. The Horizon Year 2030 Base traffic volumes were revised to reflect the adopted GP forecast; while the Horizon Year 2030 Base Plus Project traffic volumes were derived by adding the proposed Lilac Hills Ranch project traffic (subtracting traffic generated by the 110 units) to the Base Year GP modeled volumes. Change 2 affects both Horizon Year 2030 “Base” and “Base + Project” scenarios.
Change 3 – Change to existing roadway capacities reflecting field conditions. A 10% capacity reduction is now applied to these roadways that are not built to County public road standards. Since each of these roads provides one lane in each direction (the most important indication of capacity), shoulder width and minimum curve radius do not have significant effects on roadway capacity especially when the substandard sections/curves only represent a small portion of the studied roadway, a 10% reduction was deemed reasonable and adequate. Change 3 affects “Existing”, all five “Existing + Project”, and “Existing + Cumulative Projects + Project” scenarios.
Change 4 – Change to the cumulative project list. The Sierra (former Merriam Mountains) Development project (#106 in Table 6.1) located west of I‐15, between Gopher Canyon Road and Deer Springs Road is expected to request the construction of approximately 2,100 residential units and a small amount of commercial development. The public review version of the TIS (dated 6/28/2013) only included 1,162 DU based on the County GPA Property Specific Workplan list of 56 projects (dated June 28, 2012). Therefore additional traffic was added. In addition, a number of projects from the Valley Center County GPA Property Specific Workplan (VC7, 11, 20A, 20B, 54, 61, 66) list of 56 projects was also added, such as #110 in Table 6.1. These small PSRs represent a total of 261 units of single family rural residential located east of I‐15, between W. Lilac Road and Mountain Ridge Road. Change 4 affects the “Existing + Cumulative Projects + Project” scenario.
Changes 1 and 2 above contribute to additional GP inconsistencies under the Horizon Year, including:

Summary ‐ 5 Lilac Hills Ranch TIS
Old Highway 395, between W. Lilac Road and I‐15 SB Ramps under Horizon Year with Road 3 scenario; and
W. Lilac Road, between Old Highway 395 and Main Street under Horizon Year without Road 3 scenario.
Change 3 results in an additional project direct impact at the following location under the “Existing + Project (Phase A)” and “Existing + Project (Phase B)” conditions:
Gopher Canyon Road, between E. Vista Way and I‐15 SB Ramps. Change 4 results in an additional cumulative impact at the following location under the “Existing + Cumulative Projects + Project” scenario:
W. Lilac Road, between Old Highway 395 and Main Street.

Page i Lilac Hills Ranch TIS
Table of Content
1.0 Introduction ....................................................................................................................... 1 1.1 Purpose of the Report ............................................................................................................ 1 1.2 Project Location and Description ........................................................................................... 1 1.3 Study Scenarios .................................................................................................................... 13 1.4 Report Organization ............................................................................................................. 14
2.0 Analysis Methodology ...................................................................................................... 16 2.1 Level of Service Definition .................................................................................................... 16 2.2 Roadway Segment Level of Service Standards and Thresholds ........................................... 16 2.3 Peak Hour Intersection Level of Service Standards and Thresholds .................................... 18
2.3.1 Signalized Intersection Analysis ..................................................................................... 18 2.3.2 Unsignalized Intersection Analysis ................................................................................. 19
2.4 Two‐Lane Highway Level of Service Standards and Thresholds .......................................... 20 2.5 Freeway/State Highway Level of Service Standards and Thresholds .................................. 21 2.6 Ramp Intersection Capacity Analysis ................................................................................... 21 2.7 Ramp Metering Analysis ....................................................................................................... 22 2.8 Determination of Significant Impacts ................................................................................... 22
3.0 Existing Conditions ........................................................................................................... 27 3.1 Existing Transportation Network ......................................................................................... 27 3.2 Existing Intersection and Roadway Volumes ....................................................................... 36 3.3 Existing Level of Service Analysis ......................................................................................... 36 3.4 Existing Parking, Transit, and On‐Site Circulation ................................................................ 49
4.0 Project Traffic .................................................................................................................. 50 4.1 Project Description ............................................................................................................... 50 4.2 Project Phasing ..................................................................................................................... 51 4.3 Project Trip Generation, Distribution, and Assignment ....................................................... 60
4.3.1 Project Trip Generation .................................................................................................. 60 4.3.2 Project Trip Distribution ................................................................................................. 73 4.3.3 Project Trip Assignment ................................................................................................. 75
4.4 Vehicle Miles of Travel (VMT) Analysis .............................................................................. 105 5.0 Existing Plus Project Conditions ..................................................................................... 108
5.1 Existing Plus Project (Phase A) Conditions ......................................................................... 108 5.1.1 Existing Plus Project (Phase A) Roadway Network and Traffic Volumes ..................... 108 5.1.2 Existing Plus Project (Phase A) Traffic Conditions ........................................................ 108 5.1.3 Existing Plus Project (Phase A) Impact Significance and Mitigation ............................ 124
5.2 Existing Plus Project (Phase B) Conditions ......................................................................... 126 5.2.1 Existing Plus Project (Phase B) Roadway Network and Traffic Volumes ..................... 126 5.2.2 Existing Plus Project (Phase B) Traffic Conditions ........................................................ 127 5.2.3 Existing Plus Project (Phase B) Impact Significance and Mitigation ............................ 143
5.3 Existing Plus Project (Phase C) Conditions ......................................................................... 146 5.3.1 Existing Plus Project (Phase C) Roadway Network and Traffic Volumes ..................... 146 5.3.2 Existing Plus Project (Phase C) Traffic Conditions ........................................................ 147 5.3.3 Existing Plus Project (Phase C) Impact Significance and Mitigation ............................ 164
5.4 Existing Plus Project (Phase D) Conditions ......................................................................... 170 5.4.1 Existing Plus Project (Phase D) Roadway Network and Traffic Volumes ..................... 170

Page ii Lilac Hills Ranch TIS
5.4.2 Existing Plus Project (Phase D) Traffic Conditions........................................................ 171 5.4.3 Existing Plus Project (Phase D) Impact Significance and Mitigation ............................ 188
5.5 Existing Plus Project (Phase E – Project Buildout) Conditions............................................ 191 5.5.1 Existing Plus Project (Buildout) Roadway Network and Traffic Volumes .................... 191 5.5.2 Existing Plus Project (Buildout) Traffic Conditions ....................................................... 192 5.5.3 Existing Plus Project (Buildout) Impact Significance and Mitigation ........................... 208
6.0 Cumulative Traffic Conditions ........................................................................................ 212 6.1 Cumulative Projects............................................................................................................ 212 6.2 Existing Plus Cumulative Projects Plus Project Roadway Network and Traffic Volumes ... 228 6.3 Existing Plus Cumulative Projects Plus Project Traffic Conditions ..................................... 234 6.4 Existing Plus Cumulative Projects Plus Project Impact Significance and Mitigation .......... 252
7.0 Site Access and On‐Site Circulation ................................................................................ 264 7.1 Site Access .......................................................................................................................... 264 7.2 On‐Site Circulation ............................................................................................................. 266
8.0 Hazards to Pedestrians and Bicyclists ............................................................................. 272 9.0 General Plan Consistency Analyses ................................................................................ 274
9.1 Horizon Year Roadway Network and Traffic Volumes ....................................................... 275 9.2 Horizon Year with Road 3 Traffic Conditions ..................................................................... 277
9.2.1 Horizon Year Base with Road 3 .................................................................................... 277 9.2.2 Horizon Year Base Plus Project with Road 3 ................................................................ 282 9.2.3 Horizon Year with Road 3 GP Inconsistencies .............................................................. 294
9.3 Horizon Year without Road 3 Traffic Conditions ................................................................ 298 9.3.1 Horizon Year Base without Road 3............................................................................... 298 9.3.2 Horizon Year Base Plus Project without Road 3 ........................................................... 305 9.3.3 Horizon Year without Road 3 Impact Significance and Mitigation .............................. 314
10.0 Findings and Recommendations .................................................................................... 318 10.1 Summary of Roadway Segment Analysis ........................................................................... 318 10.2 Summary of Intersection Analysis ...................................................................................... 318 10.3 Summary of Freeway Analysis ............................................................................................ 318 10.4 Summary of Ramp Intersection Capacity Analysis ............................................................. 318 10.5 Summary of Significant Impacts and Mitigation Recommendations ................................. 318
11.0 Construction Traffic ....................................................................................................... 331 11.1 Construction Related Traffic Generation ........................................................................... 331 11.2 Construction Related Traffic Impacts ................................................................................. 332
12.0 No‐School Alternative .................................................................................................... 333 12.1 No‐School Project Trip Generation .................................................................................... 333 12.2 Students Trip Generation, Distribution, and Assignment .................................................. 333 12.3 Project Buildout (Phase E) without On‐Site School Traffic Impact .................................... 337
13.0 Weekend Church Traffic ................................................................................................. 339 14.0 North County Specific Residential Trip Generation and Effects ....................................... 341
14.1 Trip Generation Comparison .............................................................................................. 341 14.2 Effects of the North County Specific Rates ........................................................................ 342
15.0 Transportation Demand Management Program ............................................................. 346

Page iii Lilac Hills Ranch TIS
Appendices Appendix A Roundabout Peer Review by Reid Middleton Appendix B Mountain Ridge Road and Circle R. Drive Design Exception #8 Appendix C Travel Time Survey ‐ W. Lilac Road Appendix D Travel Speed Survey ‐ Mountain Ridge Road and Circle R. Drive Appendix E Traffic Counts Appendix F Peak Hour Intersection Capacity Worksheets ‐ Existing Conditions Appendix G Ramp Intersection Capacity Analysis Worksheets ‐ Existing Conditions Appendix H Fire Station Trip Generation Survey Appendix I SANDAG Select Zone Assignment for Project Internal Capture & ITE Internal Multi‐Use
Generation Calculation Appendix J SANDAG Land Use Description and ITE Office Trip Generation Appendix K SANDAG Select Zone Assignments for Project Trip Distribution Appendix L Project Trip Distribution along Frontage and Access Roads by Phase Appendix M LHR VMT Model Run – Land Use Assumptions Appendix N LHR VMT Model Run – Mode Choice Reports Appendix O Bird Song Drive Traffic Operation Analysis Appendix P Peak Hour Intersection Capacity Worksheets ‐ Existing Plus Project (Phase A) Conditions Appendix Q Ramp Intersection Capacity Analysis Worksheets
‐ Existing Plus Project (Phase A) Conditions Appendix R Arterial Analysis ‐ Existing Plus Project (Phase A) Conditions With and Without Mitigation Appendix S Mitigated Peak Hour Intersection Capacity Worksheets
‐ Existing Plus Project (Phase A) Conditions Appendix T Arterial Analysis ‐ Existing Plus Project (Phases B) Conditions Appendix U Peak Hour Intersection Capacity Worksheets ‐ Existing Plus Project (Phase B) Conditions Appendix V Ramp Intersection Capacity Analysis Worksheets
‐ Existing Plus Project (Phase B) Conditions Appendix W Traffic Signal Warrants ‐ Existing Plus Project (Phase B) Conditions Appendix X Mitigated Peak Hour Intersection Capacity Worksheets
‐ Existing Plus Project (Phase B) Conditions Appendix Y Arterial Analysis ‐ Existing Plus Project (Phases C) Conditions Appendix Z Peak Hour Intersection Capacity Worksheets ‐ Existing Plus Project (Phases C) Conditions Appendix AA Ramp Intersection Capacity Analysis Worksheets
‐ Existing Plus Project (Phases C) Conditions Appendix AB Traffic Signal Warrants ‐ Existing Plus Project (Phases C) Conditions Appendix AC Mitigated Peak Hour Intersection Capacity Worksheets
‐ Existing Plus Project (Phases C) Conditions Appendix AD Arterial Analysis ‐ Existing Plus Project (Phase D) Conditions Appendix AE Peak Hour Intersection Capacity Worksheets ‐ Existing Plus Project (Phase D) Conditions Appendix AF Ramp Intersection Capacity Analysis Worksheets
‐ Existing Plus Project (Phase D) Conditions Appendix AG Traffic Signal Warrants ‐ Existing Plus Project (Phase D) Conditions Appendix AH Mitigated Peak Hour Intersection Capacity Worksheets
‐ Existing Plus Project (Phase D) Conditions Appendix AI Arterial Analysis ‐ Existing Plus Project (Buildout) Conditions Appendix AJ Peak Hour Intersection Capacity Worksheets ‐ Existing Plus Project (Buildout) Conditions Appendix AK Ramp Intersection Capacity Analysis Worksheets
‐ Existing Plus Project (Buildout) Conditions
Page iv Lilac Hills Ranch TIS
Appendix AL Traffic Signal Warrants ‐ Existing Plus Project (Buildout) Conditions Appendix AM Mitigated Peak Hour Intersection Capacity Worksheets
‐ Existing Plus Project (Buildout) Conditions Appendix AN SANDAG Trip Generation Report Including the List of Cumulative Projects Appendix AO Peak Hour Intersection Capacity Worksheets
‐ Existing Plus Cumulative Projects Plus Project Appendix AP Ramp Intersection Capacity Analysis Worksheets
‐ Existing Plus Cumulative Projects Plus Project Appendix AQ Arterial Analysis ‐ Existing Plus Cumulative Projects Plus Project Appendix AR Traffic Signal Warrants – Existing Plus Cumulative Projects Plus Project Appendix AS Mitigated Peak Hour Intersection Capacity Worksheets
‐ Existing Plus Cumulative Projects Plus Project Appendix AT Sight Distance Analysis by Landmark Consulting Appendix AU Arterial Analysis ‐LHR Internal Roadways Appendix AV Lilac Hills Ranch Road / Covey Lane Traffic Operation Analysis Appendix AW Arterial Analysis – Horizon Year With Road 3 Base Plus Project Conditions Appendix AX Arterial Analysis – Horizon Year Without Road 3 Base Plus Project Conditions Appendix AY AM Peak Hour Intersection Capacity Worksheets
‐ Existing Plus Project Buildout w/o On‐Site School Conditions Appendix AZ Mountain Ridge Road Weekend ADT Counts Appendix AAA North County Specific Residential Trip Generation Surveys by LOS Engineering
List of Tables Table 2.1 Level of Service (LOS) Definitions ..................................................................................... 17 Table 2.2 County of San Diego Roadway Segment Daily Capacity and LOS Standards .................... 17 Table 2.3 Signalized Intersection LOS Highway Capacity Manual Operational Analysis Method .... 19 Table 2.4 LOS Criteria for Stop Controlled Unsignalized Intersections ............................................ 20 Table 2.5 County of San Diego Two‐Lane Highway LOS Thresholds with Signalized Intersection Spacing Over One Mile ........................................................ 20 Table 2.6 Freeway and State Highway Segment LOS Definitions ..................................................... 21 Table 2.7 Traffic Flow Conditions at Ramp Intersections at Various Levels of Operation ............... 21 Table 2.8 Measures of Significant Project Impacts to Congestion on Road Segments: Allowable Increases on Congested Road Segments ......................................................... 23 Table 2.9 Measures of Significant Project Impacts to Congestion on Intersections: Allowable Increases on Congested Intersections ............................................................. 23 Table 2.10 Measures of Significant Project Impacts to Congestion: Allowable Increases on Two‐Lane Highways with Signalized Intersection Spacing Over One Mile ....................... 25 Table 2.11 Measures of Significant Project Impacts to Congestion: Allowable Increases on Two‐Lane Highways with Signalized Intersection Spacing Under One Mile ..................... 25 Table 2.12 SANTEC/ITE Measure of Significant Project Traffic Impacts ............................................. 26 Table 3.1 Reduced Roadway Thresholds for Key Segments ............................................................. 41 Table 3.2 Roadway Segment LOS Results ‐ Existing Conditions ....................................................... 41 Table 3.3 Peak Hour Intersection LOS Results ‐ Existing Conditions ................................................ 44 Table 3.4 Two‐Lane Highway LOS Results ‐ Existing Conditions ....................................................... 45 Table 3.5 Freeway Segment LOS Results ‐ Existing Conditions ........................................................ 47 Table 3.6 Ramp Intersection Capacity Analysis ‐ Existing Conditions .............................................. 49 Table 4.1 Project Land Use by Specific Plan Phasing by SANDAG Land Use Category ..................... 53 Table 4.2 Traffic Analysis Phasing and Access Requirements .......................................................... 54

Page v Lilac Hills Ranch TIS
Table 4.3 Project Land Uses by Traffic Analysis Phasing by SANDAG Land Use Category ............... 60 Table 4.4 Lilac Hills Ranch Project Trip Generation ‐ Phase A by SANDAG Land Use Category ....... 61 Table 4.5 Lilac Hills Ranch Project Trip Generation ‐ Phase B by SANDAG Land Use Category ....... 61 Table 4.6 Lilac Hills Ranch Project Trip Generation ‐ Phase C by SANDAG Land Use Category ....... 62 Table 4.7 Lilac Hills Ranch Project Trip Generation ‐ Phase D by SANDAG Land Use Category ....... 63 Table 4.8 Lilac Hills Ranch Project Trip Generation ‐ Phase E (Buildout) by Sandag Land Use Category .......................................................... 64 Table 4.9 Trip Generation Comparison ............................................................................................ 72 Table 4.10 Lilac Hills Ranch Internal and External Project Trips Horizon Year – GP Consistency Analysis ........................................................................... 74 Table 4.11 Mode Choice Model Scenarios ....................................................................................... 106 Table 4.12 Vehicle Miles Travel & Average Trip Length ................................................................... 106 Table 5.1 Roadway Segment LOS Results ‐ Existing Plus Project (Phase A) Conditions ................. 114 Table 5.2 Peak Hour Intersection LOS Results ‐ Existing Plus Project (Phase A) Conditions .......... 117 Table 5.3 Two‐Lane Highway LOS Results ‐ Existing Plus Project (Phase A) Conditions ................ 121 Table 5.4 Freeway Segment LOS Results ‐ Existing Plus Project (Phase A) Conditions .................. 121 Table 5.5 Ramp Intersection Capacity Analysis ‐ Existing Plus Project (Phase A) Conditions ........ 124 Table 5.6 Arterial LOS Results After Mitigation ‐ Existing Plus Project (Phase A) Conditions ........ 125 Table 5.7 Mitigated Intersection LOS ‐ Existing Plus Project (Phase A) Conditions ....................... 125 Table 5.8 Impact and Mitigation Summary ‐ Existing Plus Project (Phase A) Conditions .............. 126 Table 5.9 Roadway Segment LOS Results ‐ Existing Plus Project (Phase B) Conditions ................. 132 Table 5.10 Arterial LOS Results ‐ Existing Plus Project (Phase B) Conditions ................................... 135 Table 5.11 Peak Hour Intersection LOS Results ‐ Existing Plus Project (Phase B) Conditions .......... 136 Table 5.12 Two‐Lane Highway LOS Results ‐Existing Plus Project (Phase B) Conditions.................. 140 Table 5.13 Freeway Segment LOS Results ‐ Existing Plus Project (Phase B) Conditions .................. 141 Table 5.14 Ramp Intersection Capacity Analysis ‐ Existing Plus Project (Phase B) Conditions ........ 143 Table 5.15 Mitigated Intersection LOS ‐ Existing Plus Project (Phase B) Conditions ........................ 144 Table 5.16 Impact and Mitigation Summary ‐ Existing Plus Project (Phase B) Conditions ............... 146 Table 5.17 Roadway Segment LOS Results ‐ Existing Plus Project (Phase C) Conditions ................. 153 Table 5.18 Arterial LOS Results ‐ Existing Plus Project (Phase C) Conditions ................................... 156 Table 5.19 Peak Hour Intersection LOS Results ‐ Existing Plus Project (Phase C) Conditions .......... 157 Table 5.20 Two‐Lane Highway LOS Results ‐ Existing Plus Project (Phase C) Conditions ................. 161 Table 5.21 Freeway Segment LOS Results ‐ Existing Plus Project (Phase C) Conditions .................. 162 Table 5.22 Ramp Intersection Capacity Analysis ‐ Existing Plus Project (Phase C) Conditions ........ 164 Table 5.23 Arterial LOS Results After Mitigation ‐ Existing Plus Project (Phase C) Conditions ........ 166 Table 5.24 Mitigated Intersection LOS ‐ Existing Plus Project (Phase C) Conditions ........................ 169 Table 5.25 Impact and Mitigation Summary ‐ Existing Plus Project (Phase C) Conditions ............... 170 Table 5.26 Roadway Segment LOS Results ‐ Existing Plus Project (Phase D) Conditions ................. 177 Table 5.27 Arterial LOS Results ‐ Existing Plus Project (Phase D) Conditions ................................... 180 Table 5.28 Peak Hour Intersection LOS Results ‐ Existing Plus Project (Phase D) Conditions .......... 181 Table 5.29 Two‐Lane Highway LOS Results ‐ Existing Plus Project (Phase D) Conditions ................ 185 Table 5.30 Freeway Segment LOS Results ‐ Existing Plus Project (Phase D) Conditions .................. 186 Table 5.31 Ramp Intersection Capacity Analysis ‐ Existing Plus Project (Phase D) Conditions ........ 188 Table 5.32 Mitigated Intersection LOS ‐ Existing Plus Project (Phase D) Conditions ....................... 190 Table 5.33 Impact and Mitigation Summary ‐ Existing Plus Project (Phase D) Conditions .............. 191 Table 5.34 Roadway Segment LOS Results ‐ Existing Plus Project (Phase E – Buildout) Conditions .................................................. 197 Table 5.35 Arterial LOS Results ‐ Existing Plus Project (Phase E – Buildout) Conditions .................. 200 Table 5.36 Peak Hour Intersection LOS Results

Page vi Lilac Hills Ranch TIS
‐ Existing Plus Project (Phase E – Buildout) Conditions .................................................. 201 Table 5.37 Two‐Lane Highway LOS Results ‐ Existing Plus Project (Phase E – Buildout) Conditions .................................................. 205 Table 5.38 Freeway Segment LOS Results ‐ Existing Plus Project (Phase E – Buildout) Conditions .................................................. 206 Table 5.39 Ramp Intersection Capacity Analysis ‐ Existing Plus Project (Phase E ‐ Buildout) Conditions ................................................... 208 Table 5.40 Arterial LOS Results After Mitigation ‐ Existing Plus Project (Phase E ‐ Buildout) Conditions ................................................... 209 Table 5.41 Mitigated Intersection LOS ‐ Existing Plus Project (Phase E ‐ Buildout) Conditions ....... 210 Table 5.42 Impact and Mitigation Summary ‐ Existing Plus Project (Phase E ‐ Buildout) Conditions ................................................... 211 Table 6.1 Cumulative Projects ........................................................................................................ 213 Table 6.2 Roadway Segment LOS Results ‐ Existing Plus Cumulative Projects Plus Project Conditions ........................................... 239 Table 6.3 Peak Hour Intersection LOS Results ‐ Existing Plus Cumulative Projects Plus Project Conditions ........................................... 243 Table 6.4 Two‐Lane Highway LOS Results ‐ Existing Plus Cumulative Projects Plus Project Conditions ........................................... 248 Table 6.5 Freeway Segment LOS Results ‐ Existing Plus Cumulative Projects Plus Project Conditions ........................................... 250 Table 6.6 Ramp Intersection Capacity Analysis ‐ Existing Plus Cumulative Projects Plus Project Conditions ........................................... 252 Table 7.1 Internal Roadway Arterial LOS Results ........................................................................... 268 Table 7.2 On‐Site Circulation / Spine Roads Design Features ........................................................ 269 Table 7.3 Peak Hour Intersection LOS Results ‐ Lilac Hills Ranch Road/Covey Lane ...................... 270 Table 7.4 Covey Lane and Mountain Ridge Road ........................................................................... 271 Table 9.1 Roadway Segment LOS Results ‐ Horizon Year Base Conditions (with Road 3) .............. 279 Table 9.2 Freeway Segment LOS Results ‐ Horizon Year Base Conditions (with Road 3) ............... 283 Table 9.3 Roadway Segment LOS Results ‐ Horizon Year Base Plus Project Conditions (with Road 3) ............................................ 287 Table 9.4 Freeway Segment LOS Results ‐ Horizon Year Base Plus Project Conditions (with Road 3) ............................................ 292 Table 9.5 Arterial LOS Results ‐ Horizon Year Base Plus Project Conditions (with Road 3) ............ 295 Table 9.6 GP Consistencies Summary ‐ Horizon Year Base Plus Project Conditions (with Road 3) ............................................ 296 Table 9.7 Roadway Segment LOS Results ‐ Horizon Year Base Conditions (without Road 3) ........ 298 Table 9.8 Freeway Segment LOS Results ‐ Horizon Year Base Conditions (without Road 3) ......... 303 Table 9.9 Roadway Segment LOS Results ‐ Horizon Year Base Plus Project Conditions (without Road 3) ....................................... 307 Table 9.10 Freeway Segment LOS Results ‐ Horizon Year Base Plus Project Conditions (without Road 3) ....................................... 312 Table 9.11 Arterial LOS Results ‐ Horizon Year Base Plus Project Conditions (without Road 3) ....................................... 315 Table 9.12 GP Consistencies Summary ‐ Horizon Year Base Plus Project Conditions (without Road 3) ....................................... 316 Table 10.1 Summary of Roadway Segment LOS Results Table 10.2 Summary of Intersection Peak Hour LOS Results ........................................................... 323 Table 10.3 Summary of Freeway Segment LOS Results ................................................................... 325

Page vii Lilac Hills Ranch TIS
Table 10.4 Summary of Ramp Intersection Capacity Analysis ......................................................... 327 Table 10.5 Summary of Significant Impacts and Mitigation Measures ............................................ 328 Table 11.1 Project Construction Trip Generation ............................................................................. 331 Table 11.2 Worst Case Trip Generation During Construction .......................................................... 332 Table 12.1 Lilac Hills Ranch Internal and External Project Trips ‐ No School Alternative ................ 334 Table 12.2 Lilac Hills Ranch Student Trip Generation ....................................................................... 337 Table 12.3 AM Peak Hour Intersection LOS Results ‐ Existing Plus Project Buildout Without On‐Site School Conditions .............................. 337 Table 13.1 Mountain Ridge Road Weekend ADT with Church Services ........................................... 339 Table 14.1 Residential Trip Generation Rate Comparisons .............................................................. 341 Table 14.2 Significant Impact Comparisons North County Specific Rates vs. SANDAG Rates .......... 343
List of Figures Figure 1‐1 Project Regional Location ................................................................................................... 2 Figure 1‐2 Project Study Area .............................................................................................................. 3 Figure 1‐3 Project Site Plan .................................................................................................................. 5 Figure 1‐4A Design Exceptions (1‐8) ....................................................................................................... 6 Figure 1‐4B Design Exceptions (9 and 10) .............................................................................................. 7 Figure 3‐1A Roadway Geometrics – Existing Conditions ...................................................................... 31 Figure 3‐1B Intersection Geometrics – Existing Conditions ................................................................. 33 Figure 3‐2A Roadway Average Daily Traffic Volumes – Existing Conditions ........................................ 37 Figure 3‐2B Intersection Peak Hour Traffic Volumes – Existing Conditions ......................................... 38 Figure 4‐1 Project Site Plan by Specific Plan Phasing ........................................................................ 52 Figure 4‐2.A Project Site Plan and Access ‐ Traffic Analysis Phase A .................................................... 55 Figure 4‐2.B Project Site Plan and Access ‐ Traffic Analysis Phase B .................................................... 56 Figure 4‐2.C Project Site Plan and Access ‐ Traffic Analysis Phase C..................................................... 57 Figure 4‐2.D Project Site Plan and Access ‐ Traffic Analysis Phase D .................................................... 58 Figure 4‐2.E Project Site Plan and Access ‐ Traffic Analysis Phase E (Buildout) .................................... 59 Figure 4‐3 Project Trip Distribution (Phase A) – Existing Network .................................................... 76 Figure 4‐4 Project Trip Distribution (Phase B) – Existing Network .................................................... 77 Figure 4‐5 Project Trip Distribution (Phase C) – Existing Network .................................................... 78 Figure 4‐6 Project Trip Distribution (Phase D) – Existing Network .................................................... 79 Figure 4‐7 Project Trip Distribution (Buildout) – Existing Network ................................................... 80 Figure 4‐8 Project Trip Distribution (Buildout) – Horizon Year Network with Road 3 ....................... 81 Figure 4‐9 Project Trip Distribution (Buildout) – Horizon Year Network without Road 3 ................. 82 Figure 4‐10A Project (Phase A) Trip Assignment (Roadway) – Existing Network .................................. 83 Figure 4‐10B Project (Phase A) Trip Assignment (Intersection) – Existing Network .............................. 84 Figure 4‐11A Project (Phase B) Trip Assignment (Roadway) – Existing Network ................................... 87 Figure 4‐11B Project (Phase B) Trip Assignment (Intersection) – Existing Network .............................. 88 Figure 4‐12A Project (Phase C) Trip Assignment (Roadway) – Existing Network ................................... 91 Figure 4‐12B Project (Phase C) Trip Assignment (Intersection) – Existing Network .............................. 92 Figure 4‐13A Project (Phase D) Trip Assignment (Roadway) – Existing Network .................................. 95 Figure 4‐13B Project (Phase D) Trip Assignment (Intersection) – Existing Network .............................. 96 Figure 4‐14A Project (Buildout) Trip Assignment (Roadway) – Existing Network.................................. 99 Figure 4‐14B Project (Buildout) Trip Assignment (Intersection) – Existing Network ........................... 100 Figure 4‐15A Project (Buildout) Trip Assignment (Roadway)

Page viii Lilac Hills Ranch TIS
– Horizon Year Network with Road 3 .............................................................................. 103 Figure 4‐16A Project (Buildout) Trip Assignment (Roadway) – Horizon Year Network without Road 3 ........................................................................ 104 Figure 5‐1A Roadway Average Daily Traffic Volumes – Existing Plus Project (Phase A) Conditions ................................................................... 109 Figure 5‐1B Intersection Peak Hour Traffic Volumes – Existing Plus Project (Phase A) Conditions ................................................................... 110 Figure 5‐2A Roadway Average Daily Traffic Volumes – Existing Plus Project (Phase B) Conditions ................................................................... 128 Figure 5‐2B Intersection Peak Hour Traffic Volumes – Existing Plus Project (Phase B) Conditions ................................................................... 129 Figure 5‐3A Roadway Average Daily Traffic Volumes – Existing Plus Project (Phase C) Conditions ................................................................... 148 Figure 5‐3B Intersection Peak Hour Traffic Volumes – Existing Plus Project (Phase C) Conditions .................................................................. 149 Figure 5‐4 E. Vista Way/Gopher Canyon Road Intersection Conceptual Improvement .................. 168 Figure 5‐5A Roadway Average Daily Traffic Volumes – Existing Plus Project (Phase D) Conditions ................................................................... 173 Figure 5‐5B Intersection Peak Hour Traffic Volumes – Existing Plus Project (Phase D) Conditions ................................................................... 174 Figure 5‐6A Roadway Average Daily Traffic Volumes – Existing Plus Project (Buildout) Conditions .................................................................. 193 Figure 5‐6B Intersection Peak Hour Traffic Volumes – Existing Plus Project (Buildout) Conditions .................................................................. 194 Figure 6‐1 Cumulative Project Locations ......................................................................................... 229 Figure 6‐2A Roadway Geometrics ‐ Existing Plus Cumulative Projects Plus Project Conditions ........ 230 Figure 6‐2B Intersection Geometrics ‐ Existing Plus Cumulative Projects Plus Project Conditions ........................................... 231 Figure 6‐3A Roadway Average Daily Traffic Volumes – Existing Plus Cumulative Projects Plus Project Conditions ......................................... 235 Figure 6‐3B Intersection Peak Hour Traffic Volumes – Existing Plus Cumulative Projects Plus Project Conditions .......................................... 236 Figure 7‐1 Project Gated Access ...................................................................................................... 265 Figure 7‐2 Estimated Internal ADTs ................................................................................................. 267 Figure 8‐1 Trails Plan ........................................................................................................................ 273 Figure 9‐1 Roadway Geometrics – Horizon Year Conditions ........................................................... 276 Figure 9‐2 Roadway Average Daily Traffic Volumes – Horizon Year Base Conditions with Road 3 .................................................................. 278 Figure 9‐3 Roadway Average Daily Traffic Volumes – Horizon Year Base Plus Project Conditions with Road 3 .............................................. 285 Figure 9‐4 Roadway Average Daily Traffic Volumes – Horizon Year Base Conditions without Road 3 ............................................................ 301 Figure 9‐5 Roadway Average Daily Traffic Volumes – Horizon Year Base Plus Project Conditions without Road 3 ....................................... 306 Figure 12‐1 Intersection AM Peak Hour Volumes – Existing Plus Project Buildout w/o On‐Site School ....................................................... 336

Page 1 Lilac Hills Ranch TIS
1.0 Introduction
1.1 Purpose of the Report
The purpose of this Traffic Impact Study (TIS) is to identify and document potential traffic impacts related to the development of the Lilac Hill Ranch project. This report also recommends mitigation measures for any identified intersection, roadway or freeway/highway deficiencies associated with the project.
1.2 Project Location and Description
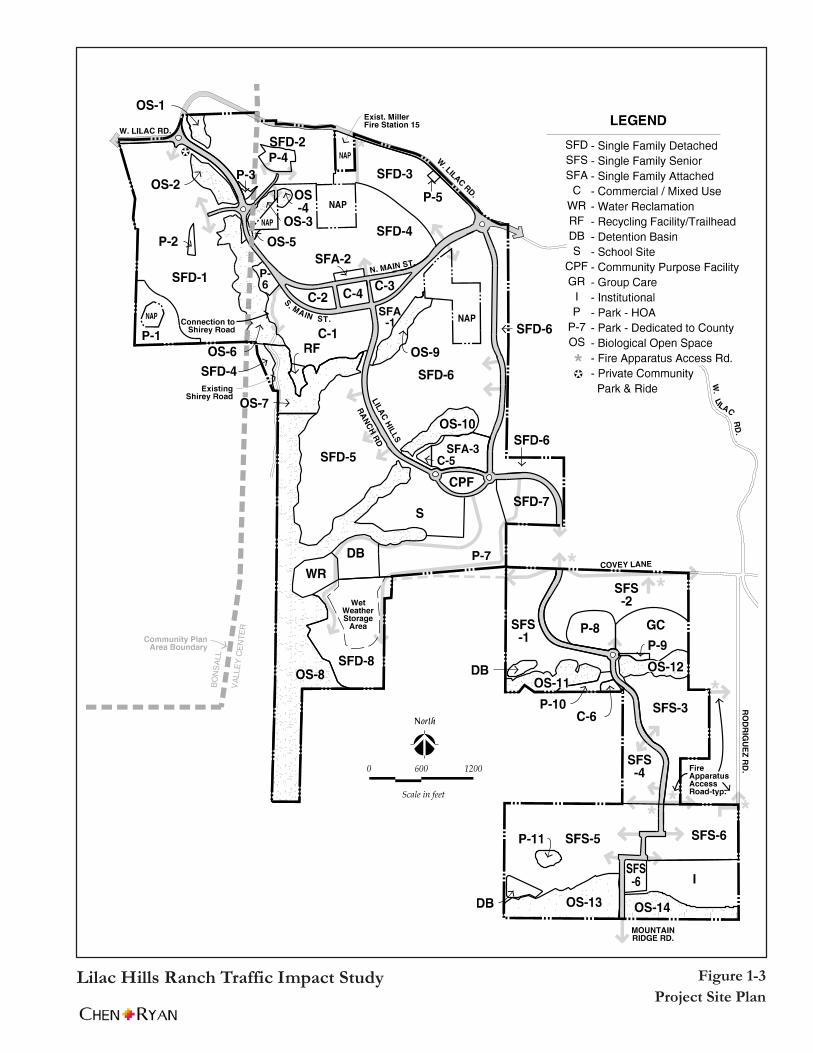
The proposed Lilac Hills Ranch project is located in the Valley Center and Bonsall Community Planning Areas of the unincorporated County of San Diego with State Route 76 to the north, Valley Center proper to the east, the City of Escondido to the south, and Interstate 15 and Old Highway 395 to the west. Project access is provided at W. Lilac Road via Main Street, Circle R Drive via Mountain Ridge Road (restricted access to only southern half of the Phase 5 (SFS‐5 and SFS‐6) of the senior community and unrestricted access to the church site), as well as Covey Lane. Figure 1‐1 displays the project’s location within the region, while Figure 1‐2 illustrates the project study area. The project consists of a mix of residential, commercial and institutional uses, along with parks and open space. Specifically, the project proposes commercial uses comprised of 61,500 square feet of local serving small scale specialty retail, 28,500 square feet of office uses and a 50 ‐room country inn; 903 traditional single‐family detached homes; 375 multi‐family homes (for‐rent and for‐sale at 20 or more dwelling units per acre); 468 age‐restricted single family homes (senior community); necessary facilities and amenities to serve the senior population (including a senior community center, and an assisted living facility); and civic facilities include a Community Purpose Facility (CPF) area that would be comprised of a fire station and recreational facility not to exceed a total of 40,000 square feet for the combined CPF area, a K‐8 school site, 23.6 acres of public and private neighborhood parks, a private recreational center, and other recreational amenities. An interim fire station with up to 3‐staff could be located anywhere within the project site. However, this fire station would be built in place of two equivalent dwelling units and would not result in additional traffic to the overall project. Also planned within the project site are an on‐site Recycling and Green Waste Drop‐off Facility (RF), a potential Water Reclamation Facility (WRF) and other supporting infrastructure. Open space is proposed to retain some of the existing citrus and avocado groves, along with 104.1 acres of sensitive biological/wetland habitat. The project is proposed to be developed in five (5) phases. The project application includes a General Plan Amendment (GPA 12‐001), a Specific Plan (SP12‐001), a Master Tentative Map (TM 5571 RPL 4), an Implementing Tentative Map for Phase 1 (TM 5572 RPL 4); and a Major Use Permit (MUP 12‐005) for the Water Reclamation Facility. The project would be implemented in five phases. Additional discretionary permits will be needed to implement later phases, as identified in the Specific Plan.

§̈¦805
·|}þ125
·|}þ905
§̈¦8
§̈¦15
·|}þ54
·|}þ78
·|}þ67·|}þ52
·|}þ163
·|}þ125
§̈¦805
§̈¦5
City of Chula Vista
City ofSan Diego
City ofNational
City
City ofImperial
Beach
City ofCoronado
City ofLemon Grove
City of La Mesa
City of El Cajon
City of Santee
UnincorporatedCounty
City of San Diego
§̈¦5
Tijuana, B.C., Mexico
City ofPoway
City ofCarlsbad
City ofEncinitas
City ofOceanside City of
Vista
City ofSan Marcos City of
Escondido
·|}þ56
·|}þ94
·|}þ94
§̈¦15
City ofSolanaBeach
City ofDel Mar
ProjectLocation
NFigure 1-1Lilac Hills Ranch Traffic Impact Study
Regional Project Location

Figure 1-2Lilac Hills Ranch Traffic Impact StudyProject Study Area
!
!
! !
!
!
!
!
!
!
!
!!!!!
! !!
!
!
! !
!!
Osbourne St
Shamrock Rd
Covey Ln
Couser Canyon Rd
Circle R Dr
Betsworth Rd
Lawrence Welk Dr
Woods Valley Rd
Fruitvale Rd
Vesper Rd
Valley Center Rd
Lilac Rd
Anth
ony R
d
Pala R
d
Rd
W. Lilac Rd
Mission Rd
Pala Mesa Dr
Gird R
d
Monserate
Via
4
9
8
7
6
53
2
1
18
2524
23
22
21
2019
17
16151413
12
11
10
§̈¦15
·|}þ76
·|}þ76
·|}þ76
W. Lilac Rd
W. Lilac Rd
W. Lilac Rd
E. Dulin Rd
Cam Del C ielo
Oliv e Hill Rd
Cam Del Rey
Old Castle Rd
E. Vista Wy
Old River Rd
Old Hwy 395
Old Hwy 3
95
Circle R Valley Ln
Champagne Bl
Mountain Ridge Rd
Li lac Rd
Lilac Rd
Valle
y Cen
ter R
dM
iller R
d
Col e
G ra d
e Rd
Misty Oak Rd
!
!
!!
! !3130
29
28
27
26
0 10.5 Miles
Project Area Inset
See Gopher Canyon Rd Inset
Pankey Rd
Mission Av
Gopher Canyon
!
!
! ! !
!
!
!
17
161514
13
Old Castle Rd
Circle R Valley Ln
Circle R Dr
Champagne Bl
Old Hwy 395
Gopher Canyon Rd
Gopher Canyon Rd Inset
§̈¦15
Street "Z"
Main St
W. Lilac RdW. Lilac Rd
W. Lilac Rd
S treet "F "
Lilac
Hills
Ranc
h Rd
See Project Area Inset
0 800400 Feet
0 1,000500 Feet
ProjectArea
<
<
Legend
Study Intersection!X
ProjectArea
N
Future Roadway
N
N
Stre et "O" Street "C"

Page 4 Lilac Hills Ranch TIS
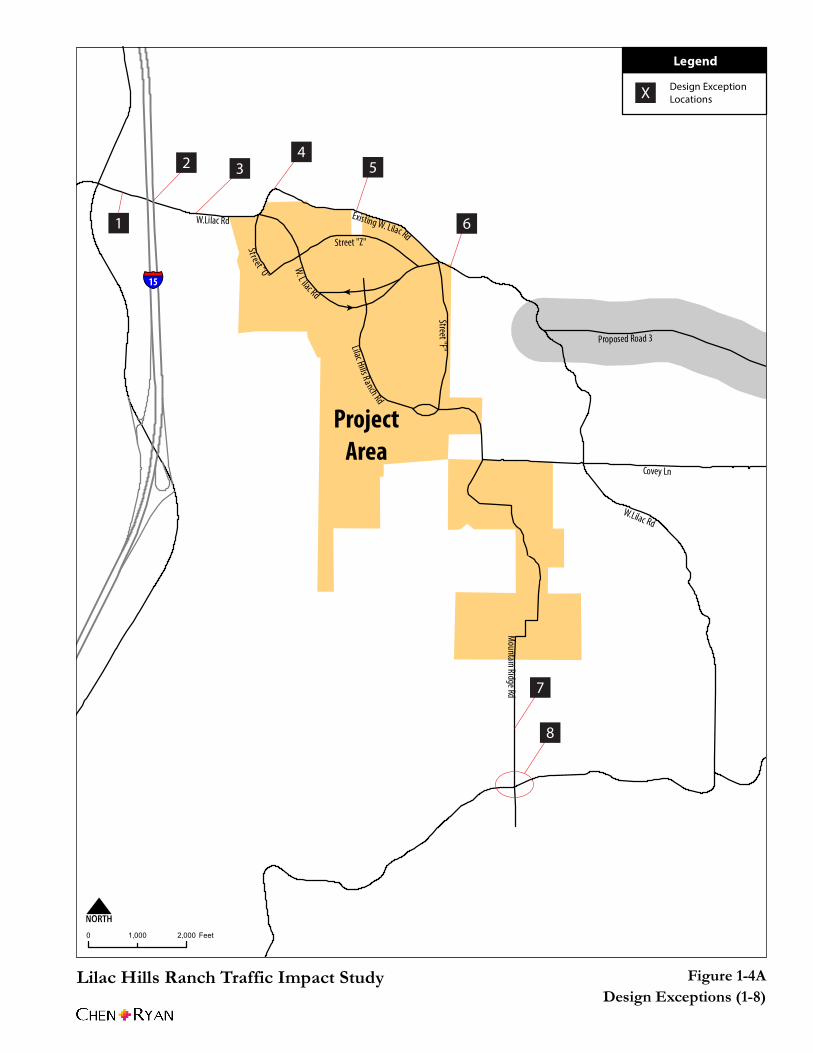
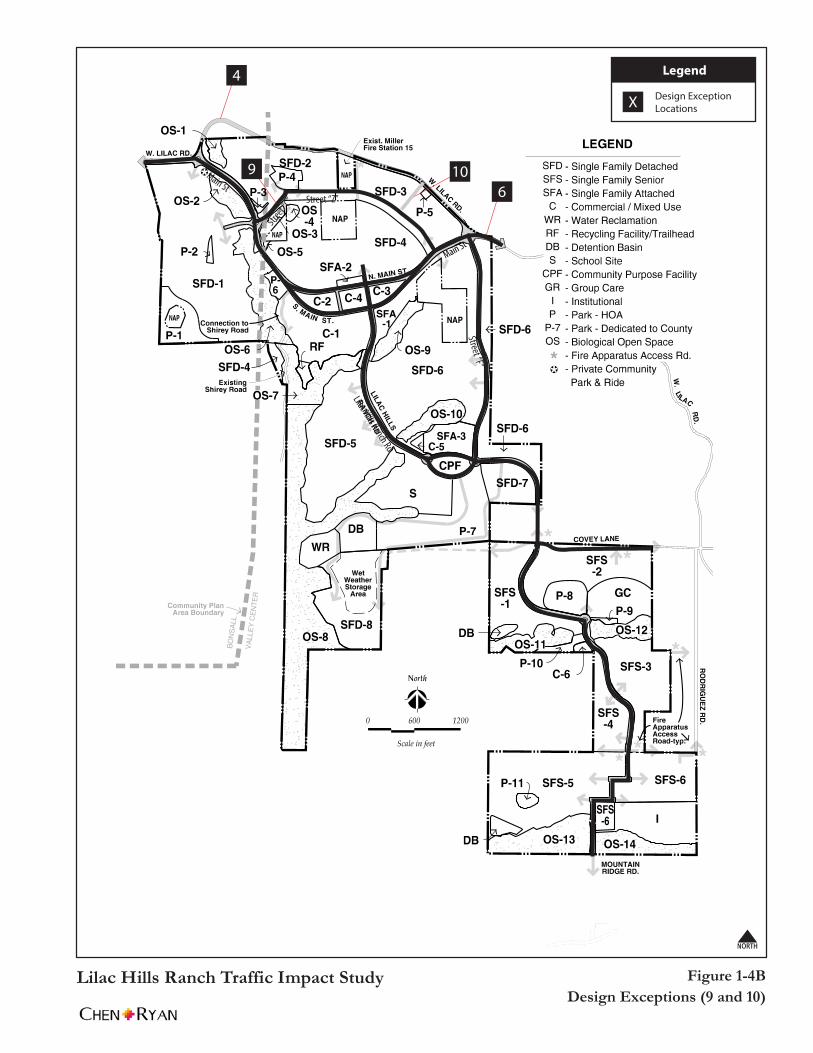
Figure 1‐3 displays the proposed site plan. Detailed land use and trip generation information are described in Chapter 4. Proposed Project Design Exceptions Ten (10) design exceptions are proposed (final recommendations of the requests are pending) as part of this project and displayed in Figures 1‐4A and 1‐4B. For purpose of explanation and ease of reading, the following summaries describe the design exception requests and the resulting effects on roadway capacity:
1. West Lilac Road, from Old Highway 395 to the I‐15 bridge
a. Request to reduce the parkway width (the walkable portion of the right‐of‐way)
from 12 feet to 2 feet on the north side, and from 12 feet to 6 feet on the south
side.
i. A “Parkway” is defined as “the distance measured from the curb face to the property line of a road right‐of‐way.” The actual drivable portion of the road is called the “Pavement Width,” which is further defined as “the specified width of pavement of the roadbed and is measured from curb face to curb face. In the absence of curbs, the pavement width is measured from the edges of the roadbed.” (County of San Diego Department of Public Works “Public Road Standards,” March 12, 2012)
b. Reduce the north side shoulder from 8 feet to 6 feet.
The reduction in parkway width will not affect vehicular travel speed because the travel lanes will be built to the full 12‐foot standard. The reduced shoulder width from 8 feet to 6 feet will still allow full size vehicles to pull off to the side of the road on those rare occasions when that is necessary. Therefore, the proposed design exception will not affect roadway capacity and a capacity reduction was not applied.
2. West Lilac Road, over the I‐15 bridge
a. Reduce the shoulder from 8 feet to 6 feet along the north and from 8 feet to 4 feet
along the south.
b. Reduce the parkway from 12 feet to 0 feet along the north and from 12 feet to 6
feet along the south.
The reduced shoulder widths from 8 feet to 6 feet and 4 feet with full 12‐foot travel lanes will still allow vehicles to pull off to the side of the road on those rare occasions when that is necessary. Parkway width is not used by drivers and therefore no negative impact to capacity would occur by reducing the width. Therefore, the proposed design exception will not affect roadway capacity and a capacity reduction was not applied.
LILAC HILLS RANCH SPECIFIC PLAN
FIGURE 14
Lilac Hills Ranch Traffic Impact Study Figure 1-3
Project Site Plan
Existing W. Lilac RdStreet "Z"St reet "O"
W. L ilac Rd
<
<
Lilac Hills Ranch Rd
S treet "F"
Mountain Ridge Rd
Proposed Road 3
ProjectArea
Covey Ln
Figure 1-4ALilac Hills Ranch Traffic Impact StudyDesign Exceptions (1-8)
N0 2,0001,000 Feet
W.Lilac Rd
W.Lilac Rd
§̈¦15
Legend
Design ExceptionLocations
4
1
2 3 5
6
7
8
X
LILAC HILLS RANCH SPECIFIC PLAN
FIGURE 14
Main St
Design ExceptionLocations
Main StStreet “Z”
Street
“C”
Lilac Hills Ranch Rd
Street “F”
Lilac Hills Ranch Traffic Impact Study Figure 1-4BDesign Exceptions (9 and 10)
N
4
X
69 10

Page 8 Lilac Hills Ranch TIS
3. West Lilac Road, from the I‐15 bridge to project boundary
a. Reduce the shoulder width from 8 feet to 6 feet.
b. Reduce parkway width from 12 feet to 2 feet on the north side and from 12 feet
to 6 feet on the south side.
The reduction in parkway width would not affect vehicular travel and the shoulder width reduction from 8 feet to 6 feet occurs outside of the standard 12‐foot vehicle travel lanes; only affecting the shoulders. Therefore it will not change the speed and capacity of this road as it would still provide two full 12‐foot travel lanes and two 6‐foot shoulders that are still wide enough for vehicles to pull off the road on those rare occasions when that is necessary. Therefore, the proposed design exception will not affect roadway capacity and a capacity reduction was not applied.
4. West Lilac Road, from the westerly roundabout to the northern project boundary
c. Reduce the design speed along West Lilac Road for 225 feet from 40 mph to 25
mph as the road enters into the proposed roundabout.
i. The Transportation Research Board (TRB) in cooperation with US department of Transportation and Federal Highway Administration (FHWA) published the National Cooperative Highway Research Program (NCHRP) Report 672 ‐ Roundabouts: An Informational Guide (2nd Edition). The guide states that the operating speed of a roundabout is widely recognized as one of its most important attributes in terms of safety, and speed management is often a combination of managing speeds at the roundabout itself and managing speeds on the approaching roadways. It recommends that the maximum entering design speeds based on a theoretical fastest path should be 20 to 25 mph (32 to 40 km/h) at single‐lane roundabouts. Hence, the reduction in design speed would improve safety in and around the westerly roundabout (Street “O”/W. Lilac Road/Main Street). In addition, it has been well documented by the La Jolla Bird Rock roundabouts and other national‐level research that 2 lanes of travel (one in each direction) with roundabouts can carry up to 25,000 cars per day, which well exceeds the capacity threshold for a 2.2C facility. Finally, roundabout experts, Reid Middleton, provided a peer review (included as Appendix A) on the design and analysis of the proposed roundabouts. Based on their analysis, both roundabouts along W. Lilac Road would operate at LOS A with low volume‐to‐capacity ratios. Therefore, the proposed design exception will not affect roadway capacity and a capacity reduction was not applied.
5. West Lilac Road, along the northerly project boundary
d. Allow the construction of a half‐width road improvement.
Page 9 Lilac Hills Ranch TIS
e. Allow the northerly half to remain in its existing condition, which deviates from
the current standards:
i. The shoulder width can remain at 0 feet (from the required 2 feet).
ii. The parkway width can remain at 0 feet (from the required 12 feet).
The southerly half of the roadway will be built to a full 2.2F standard,
combined with two standard 12‐foot travel lanes. The 2‐foot shoulder on
the north side and the 12‐foot parkway on the north side would require
offsite acquisition. However, this exception would not affect capacity due
to the short 2,600‐foot distance. Therefore, the proposed design
exception will not affect roadway capacity and a capacity reduction was
not applied.
f. Reduce the horizontal design from a minimum 400‐foot tangent length (between
curves) to an 80‐foot tangent length.
i. A tangent length is the straight segment of road that is found in between
two curved pieces of road. The current minimum straight segment of road
of existing West Lilac Road is 80 feet rather than 400 feet. This section is
controlled by two roundabouts and therefore, the shorter tangent length
does not negatively impact capacity. In addition, it has been well
documented by the La Jolla Bird Rock roundabouts and other national‐
level research that 2 lanes of travel with roundabouts can carry up to
25,000 cars per day, which well exceeds the capacity threshold for a 2.2F
or 2.2C facility. In addition, roundabout experts, Reid Middleton, provided
a peer review (included as Appendix A) on the design and analysis of the
proposed roundabouts. Based on their analysis, both roundabouts along
W. Lilac Road would operate at LOS A with low volume‐to‐capacity ratios.
Therefore, the proposed design exception will not affect roadway
capacity and a capacity reduction was not applied.
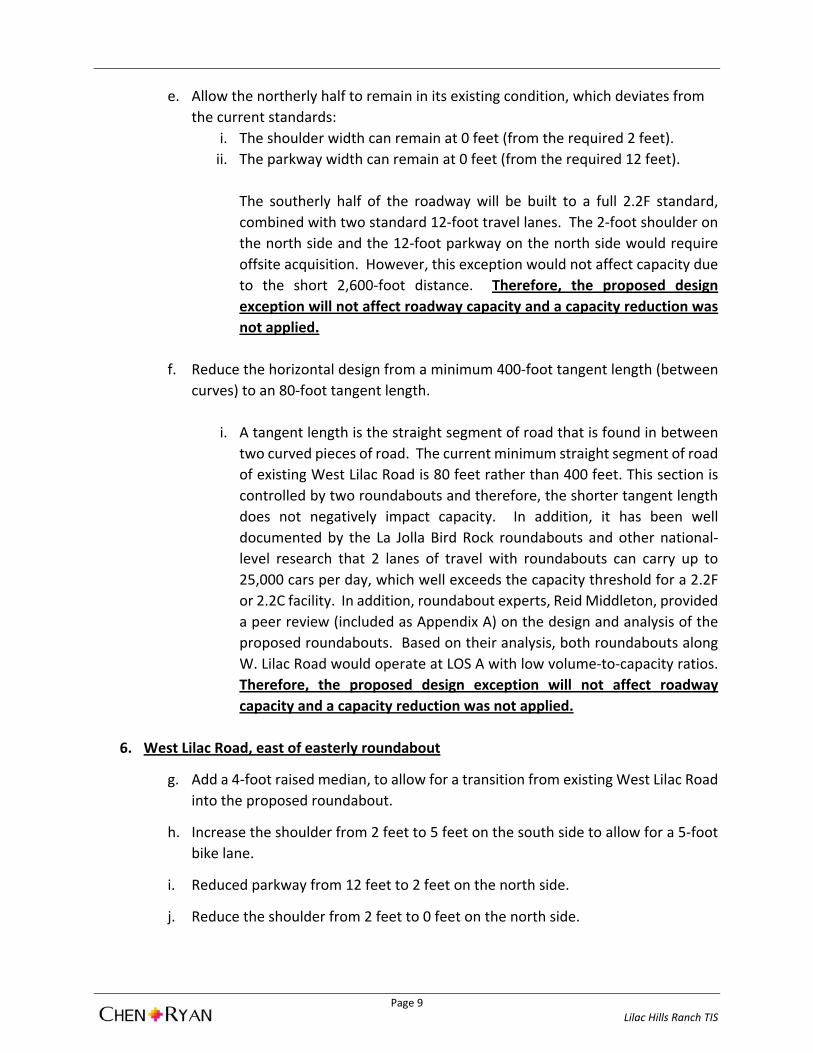
6. West Lilac Road, east of easterly roundabout
g. Add a 4‐foot raised median, to allow for a transition from existing West Lilac Road
into the proposed roundabout.
h. Increase the shoulder from 2 feet to 5 feet on the south side to allow for a 5‐foot
bike lane.
i. Reduced parkway from 12 feet to 2 feet on the north side.
j. Reduce the shoulder from 2 feet to 0 feet on the north side.

Page 10 Lilac Hills Ranch TIS
i. The modification only occurs for 240 feet at the project’s easterly entrance
at West Lilac Road where a roundabout is proposed. Since the
modification only occurs for a short distance of 240 feet at the
roundabout, no material effect to the carrying capacity of West Lilac
Road would occur and a capacity reduction was not applied.
7. Mountain Ridge Road
k. Design speed reduction from 30 mph to 15 mph.
Mountain Ridge Road is a narrow 20 feet wide road which currently serves a small
amount of homes and is proposed to provide access to a small portion of the
project site (only the senior residential units in SFS‐5 and SFS‐6, the park and the
church). Since the project will add traffic to Mountain Ridge Road, this road was
assessed using two methodologies outlined in the County of San Diego Guidelines
for Determining Significance, Traffic and Transportation, June 30, 2009 and
modified August 24, 2011 (County Guidelines). The first was from a capacity
standpoint as outlined at the end of Section 4.1 (Non Circulation Element
Residential Streets). The second was from a hazards standpoint as outlined in
Section 4.6 of the County Guidelines.
i. CARRYING CAPACITY
Mountain Ridge Road is an unclassified roadway. Per Section 4.1 of the
County Guidelines, Level of Service is not applied to residential streets such
as Mountain Ridge Road. Therefore, per County requirements, the post‐
project volumes on Mountain Ridge Road were compared to the design
capacities that are outlined in the County’s Private Road Standards.
The current volume on Mountain Ridge Road is 160 ADT. The project will add approximately 840 ADT to Mountain Ridge Road for a total of 1,190 ADT (2030 plus Project, see Table 7.2 from the traffic study). As recommended in Section 4.1 of the County Guidelines, the County private road standard table (Page 8) was used to determine whether adequate capacity exists on Mountain Ridge Road to serve 1,190 ADT. Table on the following page shows a comparison between the County private road parameters that would serve 751‐2500 ADT and the proposed Mountain Ridge Road parameters. As can be seen, Mountain Ridge Road will meet all criteria other than vertical design speed once the proposed improvements are implemented. Since the forecasted ADT is only over the 751 minimum threshold by 440 daily trips and Mountain Ridge Road will meet 7 of the 8 criteria, it is concluded that Mountain Ridge Road can accommodate 1,190 ADT. It should also be noted that since 1,190 ADT correlates to about 119 peak hour trips, Mountain Ridge Road will only need to accommodate about 2 cars per minute during peak periods, which is a very small amount.

Page 11 Lilac Hills Ranch TIS
ADT 100 or less 101-750 751-2500 Existing Proposed
Graded Width 28ft 28ft 28ft 28ft 28ft
Improvement Width 24ft 24ft 24ft 20ft 24ft
Horizontal Radius 100ft 100ft 100ft N/A N/A
Vertical Design Speed 20MPH 25MPH 30MPH ~5MPH(min) 15MPH
Maximum Grade 20% 20% 20% 21.00% 16.60%
Minimum Length-Vertical Curve 40' 40' 40' 80' 100'
Maximum Angle of Departure 7% 7% 7% negligible negligible
Minimum Vertical Clearance 14.5ft 14.5ft 14.5ft No limit No limit Source: San Diego County Standards for Private Roads, Landmark Consulting
ii. HAZARDS DUE TO AN EXISTING TRANSPORTATION DESIGN FEATURE
Mountain Ridge Road is a residential serving road with several vertical
curves and design speed as low as approximately 5 mph along certain
sections. Since the road is not currently built to County private road
standards, an assessment according to Section 4.6 of the County
Guidelines was completed considering the following factors:
1) Design features/physical configurations of access roads may
adversely affect the safe movement of all users along the
roadway.
2) The percentage or magnitude of increased traffic on the road
due to the proposed project may affect the safety of the
roadway.
3) The physical conditions of the project site and surrounding area, such as curves, slopes, walls, landscaping or other
barriers, may result in conflicts with other users or stationary
object.
4) Conformance of existing and proposed roads to the
requirements of the private or public road standards, as
applicable.
The following is a discussion of each of these four individual factors:
1) There are several vertical curves along Mountain Ridge Road,
some of which have grades exceeding 20%. The design speed
along certain sections is only about 5 mph as constructed.
Therefore, due to the presence of these curves and the design
Page 12 Lilac Hills Ranch TIS
speed below County Standards, it is concluded that the current
road may adversely affect the movement of users.
2) The project is forecasted to increase the ADT on Mountain
Ridge Road from the current 160 ADT to 1,190 ADT. While this
is a high percentage increase, an ADT of 1,190 ADT is only about
2 cars per minute during peak periods, and this amount would
not significantly contribute to any safety issues along the
roadway.
3) The presence of several vertical curves was described in Item 1)
above. There are no horizontal curves on the roadway, nor are
there any slopes, walls, or barriers that could cause conflicts.
Therefore, no issues are expected due to this item.
4) Table on the previous page shows County private road standards for various roadway types depending on the level of
ADT served by the roadway. Two columns were added to the
Table. The first is an indication of each of the measurable
criteria for Mountain Ridge Road. As can be seen, Mountain
Ridge Road meets the standards of a 751‐2,500 ADT road in all
cases except for the vertical design speed.
Since Mountain Ridge Road currently has design features, namely several vertical curves, that may affect the movement of users (#1) and does not fully conform to County private road standards (#4), it is concluded that a potentially significant impact could occur in terms of roadway hazards. The improvements being made to the existing Mountain Ridge Road are to widen the paved width from 20 feet to 24 feet, as well as lengthening one of the vertical curves to increase the minimum design speed from 5mph to 15 mph.
8. Mountain Ridge Road and Circle R Drive intersection
a. Reduce the standard intersection angle from 90 degrees to the pre‐existing 72
degrees by eliminating the required taper on the east side and allowing right hand
turning movements from westbound Circle R Drive to northbound Mountain Ridge
Road across the southbound travel lanes (See Appendix B).
iii. The County Public Road Standards state that the angle between centerlines and intersections is to be at nearly a right angle and in no case less than 70 degrees or greater than 110 degrees. [Angles between 70‐80 (or 100‐110) degrees will require a taper on the acute angle for right turn movement]. This modification only deletes the need for a taper at the acute intersection angle on Circle R Drive at Mountain Ridge Road for the westbound right turn movement. Not providing this taper would not

Page 13 Lilac Hills Ranch TIS
have a material effect on the carrying capacity of Circle R Drive and a capacity reduction was not applied.
9. Street “C”
a. Design speed reduction from 30 mph to 20 mph for 500 feet
i. Modification 9 involves an internal street which was not analyzed in the traffic study.
10. Street “E”
a. Design speed reduction from 25 mph to 20 mph for 300 feet
i. Modification 10 involves an internal street which was not analyzed in the traffic study.
1.3 Study Scenarios
A total of nine (9) scenarios are analyzed in this study, including: 1. Existing Conditions – establishes the existing baseline of traffic operations within the study
area. 2. Existing Plus Project (Phase A) Conditions – represents the existing transportation network
with the addition of traffic from Phase 1 of the proposed project.
3. Existing Plus Project (Phase B) Conditions – represents the existing transportation network with the addition of traffic from Phases 1 and 4 of the proposed project.
4. Existing Plus Project (Phase C) Conditions – represents the existing transportation network
with the addition of traffic from Phases 1, 4 and 2 of the proposed project. 5. Existing Plus Project (Phase D) Conditions – represents the existing transportation network
with the addition of traffic from Phases 1, 4, 2 and 5 of the proposed project. 6. Existing Plus Project (Phase E, project buildout) Conditions – represents the existing
transportation network with the addition of traffic from buildout of the proposed project. 7. Cumulative Traffic Conditions – represents cumulative traffic conditions, including existing
baseline traffic, traffic from anticipated land development projects, and traffic from buildout of the proposed project.
8. Horizon Year Plan‐to‐Plan (Proposed vs. Adopted) Analysis – provides a plan‐to‐plan analysis
assessing potential impacts to the adopted County’s General Plan Mobility Element roadways within the project study area, resulting from proposed changes in development land use, density, and/or intensity associated with the proposed project.

Page 14 Lilac Hills Ranch TIS
9. Horizon Year Plan‐to‐Plan (Proposed vs. “Without Road 3”) Analysis – In October 2011, after
adoption of the County General Plan Update, the San Diego Association of Governments (SANDAG) acquired the 902‐acre Rancho Lilac property through its Environmental Mitigation Program (EMP). SANDAG recorded a conservation easement over the entire 902 acres and designated this land as part of a 1,600 acre open space preserve in the State Route 76 corridor in North San Diego County. This acquisition may prevent implementation of the County’s planned Road 3. For this reason, an additional plan‐to‐plan analysis was performed as part of this TIS in order to assess the potential project traffic impacts to the County’s mobility network without Road 3.
1.4 Report Organization
Following the Introduction chapter, this report is organized into the following sections: 2.0 Analysis Methodology – This chapter describes the methodologies and standards utilized
to analyze roadway, intersection, and state highway/freeway traffic conditions. This chapter also documents the traffic forecast modeling process and assumptions for this project.
3.0 Existing Conditions – This chapter describes the existing traffic network within the study
area and provides analysis results for existing traffic conditions. 4.0 Project Description – This chapter describes the proposed project including project traffic
generation, trip distribution patterns, and roadway assignments. The project trip distribution was developed via a computer generated “Select Zone” analysis utilizing the Series 12 SANDAG transportation model.
5.0 Existing Plus Project Conditions – This chapter describes the existing traffic network with
additional traffic generated by the various traffic analysis phases of the proposed project. Mitigation measures, if necessary, for project‐related impacts are also identified.
6.0 Cumulative Traffic Conditions – This chapter describes cumulative land development
projects anticipated to generate additional traffic within the study area. Analysis results are provided for the existing plus cumulative projects plus proposed project condition, along with recommended mitigation measures (if necessary).
7.0 Site Access and On‐Site Circulation – This chapter presents an assessment of transportation facilities providing access to the proposed project. It also recommends functional classifications for all roadways internal to the project.
8.0 Hazards to Pedestrians and Bicyclists – This chapter describes existing and proposed
pedestrian and bicycle facilities in the vicinity of the project site, as well as potential impacts to cyclists and pedestrians.

Page 15 Lilac Hills Ranch TIS
9.0 General Plan Consistency Analyses – This chapter provides two plan‐to‐plan analyses assessing potential traffic impacts to the County’s General Plan Mobility Element roadways due to changes in the proposed project’s land use, density, and/or intensity. The two plan‐to‐plan analyses include comparisons of, first, the proposed project and the currently adopted GP (with Road 3); and second, the proposed project and the “Without Road 3” network. The purpose of these analyses is to determine whether the land use changes proposed by this project can be supported by the County’s Mobility Element. If deficiencies are identified, appropriated mitigation measures are recommended.
10.0 Findings and Recommendations – This chapter summarizes overall study findings and
identifies recommended project‐related mitigation measures.
11.0 Construction Traffic – This chapter identifies potential traffic impacts associated with the Lilac Hills Ranch project construction traffic.
12.0 No‐School Alternative – This chapter discusses the “No School” on‐site alternative and how this alternative would affect the study area network and operations.
13.0 Weekend Church Traffic – This chapter documents potential traffic impacts associated with weekend church traffic, particularly on Sundays.
14.0 North County Specific Residential Trip Generation and Effects – This chapter summarizes the North County specific residential trip generation rates survey and discusses how these rates would affect traffic impact identifications.
15.0 Transportation Demand Management – This chapter discusses the potential Transportation Demand Management (TDM) program developed in an effort to reduce vehicle trips in favor of alternative modes of transportation.

Page 16 Lilac Hills Ranch TIS
2.0 Analysis Methodology
The traffic analyses prepared for this study were performed in accordance with County of San Diego traffic impact guidelines, the enhanced California Environmental Quality Act (CEQA) project review process, and SANTEC/ITE Guidelines for TIS in the San Diego region. The SANTEC/ITE guidelines require delineation of a project study area based on the following criteria:
All local roadway segments (including all State surface routes), intersections, and mainline freeway locations where the proposed project will add 50 or more peak‐hour trips in either direction to the existing roadway traffic.
All freeway entrance and exit ramps where the proposed project will add a significant number of peak‐hour trips to cause any traffic queues to exceed ramp storage capacities.
In addition to the SANTEC/ITE requirements, the project study area also includes all County Mobility Element roadways and intersections where 25 or more peak hour project trips are projected to travel as per County’s requirements.
2.1 Level of Service Definition
Level of service (LOS) is a quantitative stratification of performance measures (speed, travel time, comfort, etc.) that represent quality of service. Quality of service describes how well a transportation facility or service operates from a traveler’s perspective. A vehicle level of service definition generally describes these conditions in terms of such factors as speed, travel time, freedom to maneuver, comfort, convenience, and safety. LOS A represents the best operating conditions from a driver’s perspective, while LOS F represents the worst. Table 2.1 describes generalized definitions of roadway systems operating at LOS A through F.
2.2 Roadway Segment Level of Service Standards and Thresholds
Roadway segment level of service standards and thresholds provide the basis for analysis of arterial roadway segment performance. The analysis of roadway segment level of service is based on the functional classification of the roadway, the maximum capacity, roadway geometrics, and existing or forecast Average Daily Traffic (ADT) volumes. Table 2.2 presents the roadway segment capacity and level of service standards utilized to analyze roadway segments within the unincorporated County of San Diego.

Page 17 Lilac Hills Ranch TIS
TABLE 2.1
LEVEL OF SERVICE DEFINITIONS
LOS Characteristics
A Primarily free-flow operation. Vehicles are completely unimpeded in their ability to maneuver within the traffic stream. Controlled delay at the boundary intersections is minimal. The travel speed exceeds 85% of the base free-flow speed.
B Reasonably unimpeded operation. The ability to maneuver within the traffic stream is only slightly restricted and control delay at the boundary intersections is not significant. The travel speed is between 67% and 85% of the base free-flow speed.
C Stable operation. The ability to maneuver and change lanes at mid-segment locations may be more restricted than at LOS B. Longer queues at the boundary intersections may contribute to lower travel speeds. The travel speed is between 50% and 67% of the base free-flow speed.
D
Less stable condition in which small increases in flow may cause substantial increases in delay and decreases in travel speed. This operation may be due to adverse signal progression, high volume, or inappropriate signal timing at the boundary intersections. The travel speed is between 40% and 50% of the base free-flow speed.
E Unstable operation and significant delay. Such operations may be due to some combination of adverse signal progression, high volume, and inappropriate signal timing at the boundary intersections. The travel speed is between 30% and 40% of the base free-flow speed.
F
Flow at extremely low speed. Congestion is likely occurring at the boundary intersections, as indicated by high delay and extensive queuing. The travel speed is 30% or less of the base free-flow speed. Also, LOS F is assigned to the subject direction of travel if the through movement at one or more boundary intersections have a volume-to-capacity ratio greater than 1.0.
Source: Highway Capacity Manual 2010, Chapter 16.
TABLE 2.2
COUNTY OF SAN DIEGO ROADWAY SEGMENT DAILY CAPACITY AND LEVEL OF SERVICE STANDARDS
No. Travel Lanes
Design Speed
Road Classification Level of Service (in ADT)
A B C D E
6.1 6 65 mph Expressway 36,000 54,000 70,000 86,000 108,000
6.2 6 65 mph Prime Arterial 22,200 37,000 44,600 50,000 57,000
4.1A
4 55 mph
Major Road with Raised Median 14,800 24,700 29,600 33,400 37,000
4.1B Major Road with Intermittent Turn Lanes
13,700 22,800 27,400 30,800 34,200
4.2A
4 40 mph
Boulevard with Raised Median 18,000 21,000 24,000 27,000 30,000
4.2B Boulevard with Intermittent Turn Lane
16,800 19,600 22,500 25,000 28,000
2.1A
2 45 mph
Community Collector with Raised Median 10,000 11,700 13,400 15,000 19,000
2.1B Community Collector w/ Continuous Turn Lane
3,000 6,000 9,500 13,500 19,000

Page 18 Lilac Hills Ranch TIS
TABLE 2.2 COUNTY OF SAN DIEGO
ROADWAY SEGMENT DAILY CAPACITY AND LEVEL OF SERVICE STANDARDS
No. Travel Lanes
Design Speed
Road Classification Level of Service (in ADT)
A B C D E
2.1C
2 45 mph
Community Collector w/ Intermittent Turn Lane
3,000 6,000 9,500 13,500 19,000
2.1D Community Collector with
Improvement Options 3,000 6,000 9,500 13,500 19,000
2.1E Community Collector 1,900 4,100 7,100 10,900 16,200
2.2A
2 40 mph
Light Collector with Raised Median 3,000 6,000 9,500 13,500 19,000
2.2B Light Collector with Continuous Turn
Lane 3,000 6,000 9,500 13,500 19,000
2.2C Light Collector with Intermittent Turn Lanes
3,000 6,000 9,500 13,500 19,000
2.2D Light Collector with Improvement
Options 3,000 6,000 9,500 13,500 19,000
2.2E Light Collector 1,900 4,100 7,100 10,900 16,200
2.2F Light Collector with Reduced
Shoulder 5,800 6,800 7,800 8,700 9,700
2.3A
2 35 mph
Minor Collector with Raised Median 3,000 6,000 7,000 8,000 9,000
2.3B Minor Collector with Intermittent Turn Lane
3,000 6,000 7,000 8,000 9,000
2.3C Minor Collector 1,900 4,100 6,000 7,000 8,000 Source: County of San Diego Public Road Standards; March 2012
These standards are generally used as long‐range planning guidelines to determine the functional classification of roadways. The actual capacity of a roadway facility varies according to its physical attributes. Typically, the performance and level of service of a roadway segment is heavily influenced by the ability of the arterial intersections to accommodate peak hour volumes.
For the purposes of this traffic analysis, LOS D is considered acceptable for Mobility Element roadway segments within the unincorporated County of San Diego.
2.3 Peak Hour Intersection Level of Service Standards and Thresholds
This section presents the methodologies used to perform peak hour intersection capacity analysis, including both signalized and unsignalized intersections. 2.3.1 Signalized Intersection Analysis
The signalized intersection analysis utilized in this study conforms to the operational analysis methodology outlined in Chapter 18 of the HCM 2010. The HCM 2010 methodology defines

Page 19 Lilac Hills Ranch TIS
intersection level of service as a function of intersection control delay in terms of seconds per vehicle (sec/veh).
The HCM 2010 methodology sets 1,900 passenger‐cars per hour per lane (pcphpl) as the ideal saturation flow rate at signalized intersections based upon the minimum headway that can be sustained between departing vehicles at a signalized intersection. The service saturation flow rate, which reflects the saturation flow rate specific to the study facility, is determined by adjusting the ideal saturation flow rate for lane width, on‐street parking, bus stops, pedestrian volume, traffic composition (or percentage of heavy vehicles), and shared lane movements (e.g. through and right‐turn movements sharing the same lane). The level of service criteria used for this technique are described in Table 2.3. The computerized analysis of intersection operations was performed utilizing the Synchro 8.0 Build 802 traffic analysis software (by Trafficware).
TABLE 2.3 SIGNALIZED INTERSECTION LEVEL OF SERVICE
HIGHWAY CAPACITY MANUAL OPERATIONAL ANALYSIS METHOD
Average Stopped Delay Per Vehicle
(seconds) Level of Service (LOS) Characteristics
<10.0 LOS A occurs when the volume-to-capacity ratio is low and either progression is exceptionally favorable or the cycle length is very short. If it is due to favorable progression, most vehicles arrive during the green indication and travel through the intersection without stopping.
10.1 – 20.0 LOS B occurs when the volume-to-capacity ratio is low and either progression is highly favorable or the cycle length is short. More vehicles stop than with LOS A.
20.1 – 35.0 LOS C occurs when progression is favorable or the cycle length is moderate. The number of vehicles stopping is significant, although many vehicles still pass through the intersection without stopping.
35.1 – 55.0 LOS D occurs when the volume-to-capacity ratio is high and either progression is ineffective or the cycle length is long. Many vehicles stop and individual cycle failures are noticeable.
55.1 – 80.0 LOS E occurs when the volume-to-capacity ratio is high, progression is unfavorable, and the cycle length is long. Individual cycle failures are frequent.
>80.0 LOS F occurs when the volume-to-capacity ratio is very high, progression is very poor, and the cycle length is long. Most cycles fail to clear the queue.
Source: 2010 Highway Capacity Manual, Chapter 18.
2.3.2 Unsignalized Intersection Analysis
Unsignalized intersections, including two‐way and all‐way stop controlled intersections, were analyzed using the Chapters 19 and 20 methodology of the HCM 2010. The level of service for a two‐way stop controlled (TWSC) intersection is determined by the computed or measured control delay at each minor‐street movement. LOS F would occur when the volume‐to‐capacity ratio exceeds 1.0, regardless of the control delay. Table 2.4 summarizes the level of service criteria for unsignalized intersections.

Page 20 Lilac Hills Ranch TIS
TABLE 2.4 LEVEL OF SERVICE CRITERIA FOR
STOP CONTROLLED UNSIGNALIZED INTERSECTIONS
Average Control Delay (sec/veh) Level of Service (LOS)
<10.0 A
10.1 – 15.0 B
15.1 – 25.0 C
25.1 – 35.0 D
35.1 – 50.0 E
>50.0 F
Source: 2010 Highway Capacity Manual, Chapters 19 & 20.
County of San Diego considers LOS D during the AM and PM peak hours to be the minimum standard for intersection level of service.
2.4 Two-Lane Highway Level of Service Standards and Thresholds
The existing Old Highway 395 is considered a Mobility Element roadway, but operates as a two‐lane highway. As directed in Section 4.3 of the County of San Diego Guidelines for Determining Significance, Old Highway 395 is analyzed as a two‐lane highway under Existing, Existing Plus Project, and Existing Plus Cumulative Projects Plus Project conditions in this report.
Under “Horizon Year” analyses, Old Highway 395 is treated as a Mobility Element road since the majority of this facility, with exception of the segment between SR‐76 and W. Lilac Road, is classified as either a 4‐lane Major or 4‐lane Boulevard in the County’s General Plan.
Table 2.5 displays the two‐lane highway ADT thresholds for LOS E and LOS F, when signalized intersection spacing is greater than one mile.
TABLE 2.5 COUNTY OF SAN DIEGO
TWO-LANE HIGHWAY LEVEL OF SERVICE THRESHOLDS WITH SIGNALIZED INTERSECTION SPACING OVER ONE MILE
LOS LOS Criteria
LOS E > 16,200 ADT
LOS F > 22,900 ADT Source: County of San Diego
Note: Where detailed data are available, the Director of Public Works may also accept a detailed level of service analysis based upon the two-lane highway analysis procedures provided in the Chapter 20 Highway Capacity Manual.
For two‐lane highways where signalized intersection spacing is less than one mile, the level of service is determined by the intersections along the subject highway.

Page 21 Lilac Hills Ranch TIS
2.5 Freeway/State Highway Level of Service Standards and Thresholds
Freeway level of service and performance analysis is based upon procedures developed by Caltrans District 11. The procedure for calculating freeway level of service involves estimating a peak hour volume to capacity (V/C) ratio. Peak hour volumes are estimated from the application of design hour (“K”), directional (“D”) and truck (“T”) factors to Average Daily Traffic (ADT) volumes. The base capacity is assumed to be 2,350 pc/h/ln.
The resulting V/C is then compared to acceptable ranges of V/C values corresponding to the various levels of service for each facility classification, as shown in Table 2.6. The corresponding level of service represents an approximation of existing or anticipated future freeway operating conditions in the peak direction of travel during the peak hour.
TABLE 2.6 FREEWAY AND STATE HIGHWAY SEGMENT LEVEL OF SERVICE DEFINITIONS
LOS V/C Congestion/Delay Traffic Description
"A" <0.41 None Free flow.
"B" 0.42-0.62 None Free to stable flow, light to moderate volumes.
"C" 0.63-0.79 None to minimal Stable flow, moderate volumes, freedom to maneuver noticeably restricted.
"D" 0.80-0.92 Minimal to substantial Approaches unstable flow, heavy volumes, very limited freedom to maneuver.
"E" 0.93-1.00 Significant Extremely unstable flow, maneuverability and psychological comfort extremely poor.
"F" >1.00 Considerable Forced or breakdown flow. Delay measured in average travel speed (MPH). Signalized segments experience delays >60.0 seconds/vehicle.
Source: SANTEC/ITE Guidelines for TIS in the San Diego Region
LOS D or better is used in this study as the threshold for acceptable freeway operations based upon Caltrans and the SANDAG Regional Growth Management Strategy (RGMS) requirements.
2.6 Ramp Intersection Capacity Analysis
Consistent with Caltrans’ requirements, all signalized intersections at freeway ramps were analyzed using Intersecting Lane Volume (ILV) procedures as described in Topic 406 of the Caltrans Highway Design Manual (HDM). This methodology is based upon an assessment of individual intersections as isolated units, without consideration of the effects of adjacent intersections. For this reason, the ILV analysis is utilized as an additional validation of signalized ramp intersection operations derived from the HCM 2010 methodology. Table 2.7 provides values of ILV/hr associated with various traffic flow thresholds.
TABLE 2.7 TRAFFIC FLOW CONDITIONS AT RAMP INTERSECTIONS
AT VARIOUS LEVELS OF OPERATION

Page 22 Lilac Hills Ranch TIS
ILV/hr Description
<1200: (Under Capacity)
Stable flow with slight, but acceptable delay. Occasional signal loading may develop. Free midblock operations.
1200-1500: (At Capacity)
Unstable flow with considerable delays possible. Some vehicles occasionally wait two or more cycles to pass through the intersection. Continuous backup occurs on some approaches.
>1500: (Over Capacity)
Stop-and-go operation with severe delay and heavy congestion(1). Traffic volume is limited by maximum discharges rates of each phase. Continuous backup in varying degrees occurs on all approaches. Where downstream capacity is restrictive, mainline congestion can impede orderly discharge through the intersection.
Source: Caltrans Highway Design Manual, Topic 406 Note: (1) The amount of congestion depends on how much the ILV/hr value exceeds 1500. Observed flow rates will normally not exceed 1500ILV/hr,
and the excess will be delayed in a queue.
2.7 Ramp Metering Analysis
Ramp metering analysis should be conducted, based upon SANDAG’s CMP guidelines, to calculate delays and queues at the study area freeway on‐ramps. However, since no ramp meters exist within the project study area, ramp metering analysis is not required and therefore not included in this study.
2.8 Determination of Significant Impacts
This section outlines the thresholds for determination of significant project‐related impacts to roadways and intersections in the County of San Diego. County of San Diego Traffic Impact Criteria Mobility Element Roads Traffic volume increases from public or private projects that result in one or more of the following criteria will have a significant traffic volume or level of service traffic impact on a road segment, unless specific facts show that there are other circumstances that mitigate or avoid such impacts:
The additional or redistributed ADT generated by the proposed project will significantly increase congestion on a Mobility Element Road or State Highway currently operating at LOS E or LOS F as identified in Table 2.8, or will cause a Mobility Element Road or State Highway to operate at LOS E or LOS F as a result of the proposed project, or
The additional or redistributed ADT generated by the proposed project will cause a residential street to exceed its design capacity.

Page 23 Lilac Hills Ranch TIS
TABLE 2.8 MEASURES OF SIGNIFICANT PROJECT IMPACTS TO CONGESTION ON ROAD SEGMENTS:
ALLOWABLE INCREASES ON CONGESTED ROAD SEGMENTS
Level of Service Two-Lane Road Four-Lane Road Six-Lane Road
LOS E 200 ADT 400 ADT 600 ADT
LOS F 100 ADT 200 ADT 300 ADT Source: County of San Diego
Notes: 1. By adding proposed project trips to all other trips from a list of projects, this same table must be used to determine if total cumulative impacts
are significant. If cumulative impacts are found to be significant, each project that contributes any trips must mitigate a share of the cumulative impacts.
2. The County may also determine impacts have occurred on roads even when a project’s traffic or cumulative impacts do not trigger an unacceptable level of service, when such traffic uses a significant amount of remaining road capacity.
Signalized Intersections Traffic volume increases from public or private projects that result in one or more of the following criteria will have a significant traffic volume or level of service traffic impact on a roadway segment:
The additional or redistributed ADT generated by the proposed project will significantly increase congestion at a signalized intersection currently operating at LOS E or LOS F as identified in Table 2.9, or will cause a signalized intersection to operate at LOS E or LOS F.
Based upon an evaluation of existing accident rates, the signal priority list, intersection geometrics, proximity of adjacent driveways, sight distance or other factors, the project would significantly impact the operations of the intersection.
TABLE 2.9
MEASURES OF SIGNIFICANT PROJECT IMPACTS TO CONGESTION ON INTERSECTIONS: ALLOWABLE INCREASES ON CONGESTED INTERSECTIONS
Level of Service Signalized Unsignalized
LOS E Delay of 2 seconds 20 peak hour trips on a critical movement
LOS F Delay of 1 second, or 5 peak hour trips on
a critical movement 5 peak hour trips on a critical movement
Source: County of San Diego Notes: 1. A critical movement is one that is experiencing excessive queues. 2. By adding proposed project trips to all other trips from a list of projects, this same table is used to determine if total cumulative impacts
are significant. If cumulative impacts are found to be significant, each project that contributes any trips must mitigate a share of the cumulative impacts.
3. The County may also determine impacts have occurred on roads even when a project’s traffic or cumulative impacts do not trigger an unacceptable level of service, when such traffic uses a significant amount of remaining road capacity.
Unsignalized Intersections
Page 24 Lilac Hills Ranch TIS
Traffic volume increases from public or private projects that result in one or more of the following criteria will have a significant traffic volume or level of service traffic impact on a road segment:
The additional or redistributed ADT generated by the proposed project will add 20 or more peak hour trips to a critical movement of an unsignalized intersection, and cause an unsignalized intersection to operate below LOS D, or
The additional or redistributed ADT generated by the proposed project will add 20 or more peak hour trips to a critical movement of an unsignalized intersection currently operating at LOS E, or
The additional or redistributed ADT generated by the proposed project will add 5 or more peak hour trips to a critical movement of an unsignalized intersection, and cause the unsignalized intersection to operate at LOS F, or
The additional or redistributed ADT generated by the proposed project will add 5 or more peak hour trips to a critical movement of an unsignalized intersection currently operating at LOS F, or
Based upon an evaluation of existing accident rates, the signal priority list, intersection geometrics, proximity of adjacent driveways, sight distance or other factors, the project would significantly impact the operations of the intersection.
Two‐Lane Highways when Signalized Intersection Spacing Over One Mile Traffic volume increases from public or private projects that result in one or more of the following criteria will have a significant traffic volume or level of service traffic impact on a two‐lane highway facility with signalized intersection spacing greater than one mile:
The additional or redistributed ADT generated by the proposed project will significantly increase congestion on a two‐lane highway segment currently operating at LOS E or LOS F, as identified in Table 2.10, or will cause a two‐lane highway segment to operate at LOS E or LOS F as a result of the proposed project.
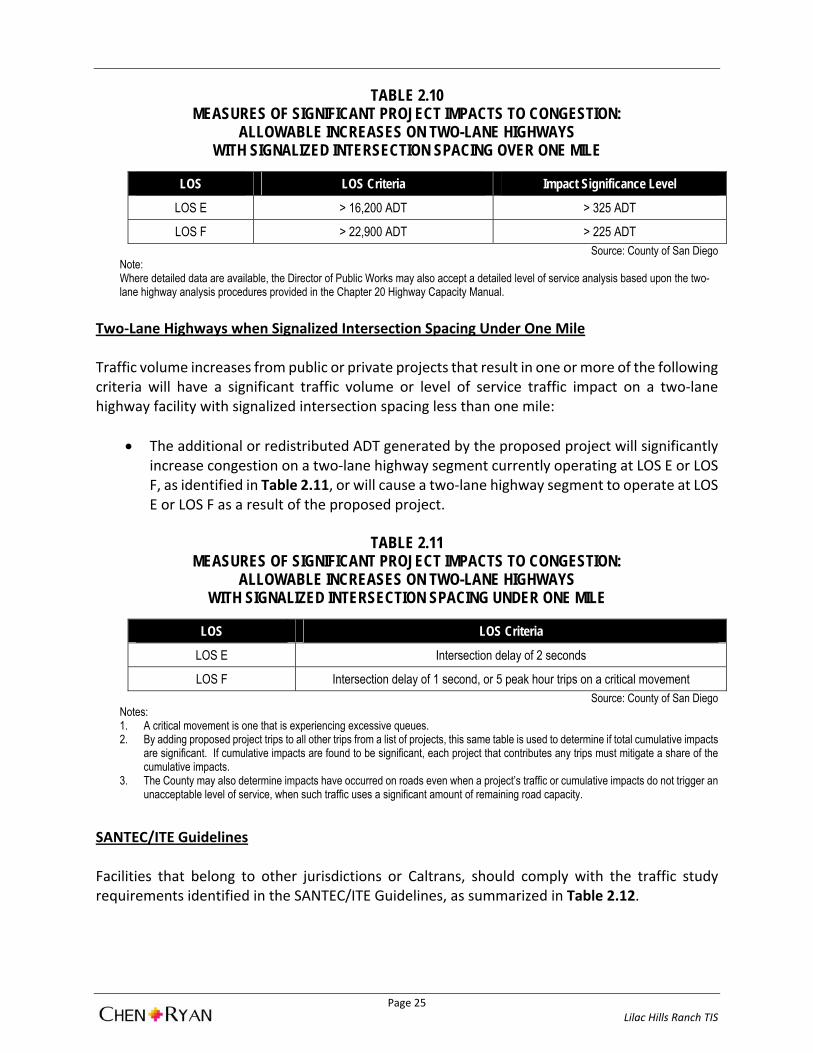
Page 25 Lilac Hills Ranch TIS
TABLE 2.10 MEASURES OF SIGNIFICANT PROJECT IMPACTS TO CONGESTION:
ALLOWABLE INCREASES ON TWO-LANE HIGHWAYS WITH SIGNALIZED INTERSECTION SPACING OVER ONE MILE
LOS LOS Criteria Impact Significance Level
LOS E > 16,200 ADT > 325 ADT
LOS F > 22,900 ADT > 225 ADT Source: County of San Diego
Note: Where detailed data are available, the Director of Public Works may also accept a detailed level of service analysis based upon the two-lane highway analysis procedures provided in the Chapter 20 Highway Capacity Manual.
Two‐Lane Highways when Signalized Intersection Spacing Under One Mile Traffic volume increases from public or private projects that result in one or more of the following criteria will have a significant traffic volume or level of service traffic impact on a two‐lane highway facility with signalized intersection spacing less than one mile:
The additional or redistributed ADT generated by the proposed project will significantly increase congestion on a two‐lane highway segment currently operating at LOS E or LOS F, as identified in Table 2.11, or will cause a two‐lane highway segment to operate at LOS E or LOS F as a result of the proposed project.
TABLE 2.11
MEASURES OF SIGNIFICANT PROJECT IMPACTS TO CONGESTION: ALLOWABLE INCREASES ON TWO-LANE HIGHWAYS
WITH SIGNALIZED INTERSECTION SPACING UNDER ONE MILE
LOS LOS Criteria
LOS E Intersection delay of 2 seconds
LOS F Intersection delay of 1 second, or 5 peak hour trips on a critical movement Source: County of San Diego
Notes: 1. A critical movement is one that is experiencing excessive queues. 2. By adding proposed project trips to all other trips from a list of projects, this same table is used to determine if total cumulative impacts
are significant. If cumulative impacts are found to be significant, each project that contributes any trips must mitigate a share of the cumulative impacts.
3. The County may also determine impacts have occurred on roads even when a project’s traffic or cumulative impacts do not trigger an unacceptable level of service, when such traffic uses a significant amount of remaining road capacity.
SANTEC/ITE Guidelines Facilities that belong to other jurisdictions or Caltrans, should comply with the traffic study requirements identified in the SANTEC/ITE Guidelines, as summarized in Table 2.12.

Page 26 Lilac Hills Ranch TIS
TABLE 2.12 SANTEC/ITE MEASURE OF SIGNIFICANT PROJECT TRAFFIC IMPACTS
Level of Service (LOS) with Project
Allowable Change Due to Impact
E & F (or ramp meter delays
above 15 min.)
Freeways Roadway Segments Intersections Ramp Metering
V/C Speed (mph) V/C
Speed (mph) Delay (sec) Delay (min.)
0.01 1 0.02 1 2 2 Source: SANTEC/ITE Guidelines for TIS in the San Diego Region
The project study area included two (2) Caltrans facilities: Interstate 15 and State Route 76. However, based upon the SANTEC/ITE study criteria discussed at the beginning of this chapter as well as a review of the SANDAG “Select Zone” assignments, the proposed project would not add 50 or more peak hour trips in either direction of SR‐76. Therefore, SR‐76 was not analyzed in this study.

Page 27 Lilac Hills Ranch TIS
3.0 Existing Conditions
This section describes key roadway, two‐lane highway, and freeway segments, intersections, as well as existing daily roadway/highway/freeway and peak hour intersection traffic volumes. Level of service analysis results for all study area facilities under Existing conditions are presented.
3.1 Existing Transportation Network
Several regionally and locally significant roadways and freeways traverse the study area. Each of the key transportation facilities, as well as associated study intersections within the study area, is discussed below. Freeway and State Highway Facilities Two (2) Caltrans freeway/state highway facilities traverse the study area, as follows: I‐15 – I‐15 is a grade separated freeway and ranges from 8 to 10 general purpose lanes within the study area. The travel lanes are generally 12 feet wide and the shoulders are generally 10 to 12 feet wide. The 20‐mile I‐15 Express Lanes Project, funded in part by the TransNet, was completed in January 2012. The Project constructed four (4) managed lanes, between SR‐163 and SR‐78, with a moveable barrier for maximum flexibility; multiple access points to the general purpose highway lanes; and direct access ramps for high‐frequency Bus Rapid Transit (BRT) service. I‐15, between SR‐78 and Riverside County is planned to be widened with 4 toll lanes as per the 2050 RTP. However, this improvement is not assumed in the Horizon Year analysis since no secured funding sources were identified. Two interchanges (at Old Highway 395 and at Gopher Canyon Road) are located within the study area providing regional access for the proposed project. The posted speed limit is 70 mph along I‐15 in the vicinity of the project. SR‐76 – Within the study area, SR‐76 is a four‐lane divided highway between E. Vista Way and Olive Hill Road; a six‐lane divided highway between Olive Hill Road and S. Mission Road; transitioned to a 2‐lane undivided highway between S. Mission Road and Old Highway 395; and widened to 6 lanes between Old Highway 395 and just east of I‐15. It is important to note that SR‐76, between S. Mission Road and Old Highway 395 is planned to be widened to four lanes by 2015. Class II bike lanes are planned along SR‐76 within the study area. East-West Roadway Facilities Dulin Road – Dulin Road, east of Old Highway 395, is currently a two‐lane undivided roadway with a posted speed limit of 25 mph. On‐street parking is provided along both sides of the street in the residential area. The facility is classified as a 2.1E Community Collector in the County General Plan Mobility Element. W. Lilac Road – W. Lilac Road, between Camino Del Rey and Old Highway 395, is generally a two‐lane undivided roadway and is classified as a 2.2E Light Collector with Class II bike lanes in the

Page 28 Lilac Hills Ranch TIS
County General Plan Mobility Element. Between Old Highway 395 to Lilac Road, W. Lilac Road is also a two‐lane undivided roadway. W. Lilac Road, between Old Highway 395 and the planned Road 3, is classified as a 2.2C Light Collector with intermittent turn lanes in the County General Plan Mobility Element, while the segment between Road 3 and Lilac Road is classified as a 2.2F Light Collector with reduced shoulder. The project proposes to downgrade W. Lilac Road between Main Street and the planned Road 3 from the classified 2.2C to 2.2F. A posted speed limit is not provided along this facility. However, a recent travel time survey (as shown in Appendix C) conducted by Chen Ryan Associates indicates that the average travel speed along W. Lilac Road, between the I‐15 overpass and Lilac Walk, is approximately 40 mph. Camino Del Cielo – Camino Del Cielo is a two‐lane roadway with a wide median or a two‐way left‐turn lane between Camino Del Rey and Via Casitas and a two‐lane undivided roadway between Via Casitas and W. Lilac Road. This facility has a posted speed limit of 40 mph and is classified as a 2.2E Light Collector in the County General Plan Mobility Element. Camino Del Rey – Camino Del Rey is generally a two‐lane undivided roadway between SR‐76 and Old Highway 395, with the exception of the segment (approximately 2,400 feet) east of W. Lilac Road which has either a striped median or a two‐way left‐turn lane. The posted speed limit along with facility ranges from 45 to 50 mph. Camino Del Rey is classified in the County General Plan Mobility Element as a 4.2B Boulevard with intermittent turn lanes between SR‐76 and Camino Del Cielo, and a 2.2C Light Collector between Camino Del Cielo and Old Highway 395. Class II bikes lanes are planned along this facility, between Old River Road and Old Highway 395. Gopher Canyon Road – Gopher Canyon Road is a two‐lane undivided roadway between E. Vista Way and I‐15 SB Ramps and a four‐lane roadway with a striped median between the I‐15 SB Ramps and Old Highway 395. This facility has a posted speed limit of 50 mph and is classified as a 4.1B Major Road with intermittent turn lanes and a Class III bike route in the County General Plan Mobility Element. Circle R Drive – Circle R Drive is currently a two‐lane undivided roadway between Old Highway 395 and W. Lilac Road and is classified as a 2.2E Light Collector. A speed limit was not post along this facility. However, a recent travel speed survey (as shown in Appendix D) conducted by NDS indicates that the average and 85th percentile travel speeds along Circle R Drive, east of Mountain Ridge Road, is approximately 35 mph and 40‐45 mph, respectively. Circle R Drive provides a restricted access to the senior community (southern access) via Mountain Ridge Road. Old Castle Road – Old Castle Road, between Old Highway 395 and Lilac Road, is a two‐lane undivided roadway with a posted speed limit that varies from 45 mph to 55 mph. This facility is classified as a 2.2D Light Collector with improvement options in the County General Plan Mobility Element, and includes a Class III bike route. Covey Lane – Covey Lane is currently a two‐lane undivided private road for its entirety. A speed limit was not post along this facility. However, a recent travel speed survey (as shown in Appendix D) conducted by NDS indicates that the 85th percentile travel speeds along Covey Lane are approximately 30‐35 mph. It is proposed that this facility, approximately 600 feet west of W.

Page 29 Lilac Hills Ranch TIS
Lilac Road to the Lilac Hills Ranch project boundary, be designated as a public road due to the existing IOD for road improvements in this area. Covey Lane provides an unrestricted access to both the entire community north of Covey Lane and a restricted access to the senior community. Main Street ‐ The project proposes the construction of a 2‐lane private road, “Main Street”, including a one‐way couplet between east of Standel Lane and Lilac Walk (see Figure 1‐3 for alignment). This road creates two alternative routes to W. Lilac Road and provides primary access to and from the project site as it traverses the town center of the Lilac Hills Ranch project. The design speed along Main Street is proposed to be 30 mph. North-South Roadway Facilities E. Vista Way – E. Vista Way, between SR‐76 and Osborne Street, is generally a two‐lane roadway with a two‐way left‐turn lane and a posted speed limit of 50 mph. This facility is classified as a 4.1A Major Road with a raised median and Class II bike lanes in the County General Plan Mobility Element. Old River Road – Old River Road, between SR‐76 and Camino Del Rey is generally a two‐lane undivided roadway with the exception of the segment southwest of Golf Club Drive (approximately 1,800 feet), which has a wide raised median and on‐street parking along both sides. The post speed limit in this area is 25 mph. Old River Road is classified as a 2.2C Light Collector with intermittent turn lanes in the County General Plan Mobility Element. Old Highway 395 – Old Highway 395, between Pala Mesa Drive and Old Castle Road, is generally a two‐lane roadway that operates as a two‐lane highway with passing option and turn pocket/striped median at Pala Mesa Drive, Dulin Road (W), W. Lilac Road, I‐15 SB & NB Ramps, Palos Verdes Drive, Camino Del Rey, the RV camp grounds entrance/exit, Circle R Drive, Gopher Canyon Road, and Old Castle Road. Class II bike lanes are marked on both sides of this facility within the study area. A posted speed limit was not observed along this segment. Old Highway 395 is classified as a 4.2B Boulevard with intermittent turn lanes between Pala Mesa Drive and SR‐76, a 2.1D Community Collector with improvement options between SR‐76 and W. Lilac Road, a 4.2B Boulevard with intermittent turn lanes between W. Lilac Road and I‐15 NB Ramps, and a 4.1B Major Road with intermittent turn lanes between I‐15 NB Ramps and Old Castle Road in the County General Plan Mobility Element. Champagne Boulevard – Champagne Boulevard, between Old Castle Road and Lawrence Welk Drive is a two‐lane roadway with passing options and turn lanes. The posted speed limit is 55 mph. Class II bike lanes are marked on both sides of this facility. Champagne Boulevard is classified as a 4.1B Major Road with intermittent turn lanes within the study area in the County General Plan Mobility Element. Mountain Ridge Road – Mountain Ridge Road, north of Circle R Drive, is a two‐lane undivided private road. A speed limit was not post along this facility. However, a recent travel speed survey (as shown in Appendix D) was conducted by NDS and indicates that the average and 85th percentile travel speeds along Mountain Ridge Road are approximately 30 mph and 40 mph,

Page 30 Lilac Hills Ranch TIS
respectively. This road connects to Lilac Hills Ranch Road and serves as a restricted access on the southern edge of the project.
Lilac Road – Lilac Road is generally a two‐lane roadway with turn lanes at Lilac School driveway, Old Castle Road, Anthony Road, Betsworth Road, and Valley Center Road. The posted speed limit is 55 mph just west of Valley Center Road. Lilac Road is classified as a 2.2E Light Collector between Couser Canyon Road and Old Castle Road, a 2.1C Community Collector with intermittent turn lanes between Old Castle Road and Anthony Road, and a 4.2B Boulevard with intermittent turn lanes between Anthony Road and Valley Center Road in the County General Plan Mobility Element. A Class III bike route is also planned between Old Castle Road and Valley Center Road.
Valley Center Road – Valley Center Road, between Woods Valley Road and Cole Grade Road, is a four‐lane roadway with a raised median or a two‐way left‐turn lane, Class II bike lanes and a posted speed of 45 mph. East of Cole Grade Road, Valley Center Road is a two‐lane undivided roadway. Valley Center Road is classified as a 4.2A Boulevard with raised median between Woods Valley Road and Lilac Road, and between Miller Road and Vesper Road, and a 4.1A Major Road with raised median between Lilac Road and Miller Road in the County General Plan Mobility Element.
Miller Road – Miller Road, north of Valley Center Road, is a two‐lane undivided roadway and is classified as a 2.3B Minor Collector with intermittent turn lanes and a Class III bike route in the County General Plan Mobility Update. A posted speed limit was not observed along this segment.
Cole Grade Road – Cole Grade Road, between Fruitvale Road and Valley Center Road, is generally a two‐lane roadway with a two‐way left‐turn lane, Class II bike lanes and a posted speed limit of 45 mph. A 25 mph school zone is located just north of Valley Center Road. This facility is classified as a 4.2A Boulevard with raised median in the County General Plan Mobility Element.
Figure 3‐1A displays existing roadway geometrics for roadway facilities within the project study area. Study Intersections
The SANDAG Series 12 Transportation Model was utilized to perform three (3) “Select Zone” assignments which identified the number of project‐related peak hour trips distributed across the transportation network. The three “Select Zone” assignments included base year, Horizon Year with Road 3, and Horizon Year without Road 3. All intersections and County Mobility Element roadways where the proposed project added 25 or more peak hour trips to the existing traffic were included for analysis, as well as all freeway and state highway segments where the proposed project added 50 or more peak hour trips in either direction.

Figure 3-1ALilac Hills Ranch Traffic Impact StudyRoadway Geometrics - Existing Conditions
!
!
! !
!
!
!
!
!
!
!
!!!!!
! !!
!
!
! !
!!
Osbourne St
Shamrock Rd
Covey Ln
Couser Canyon Rd
Circle R Dr
Betsworth Rd
Lawrence Welk Dr
Woods Va ll ey Rd
Fruitvale Rd
Vesper Rd
Va ell y C enter Rd
Lilac Rd
Anth
ony R
d
Pala R
d
Rd
W. Lilac Rd
Pala Mesa Dr
2-Ln
4-Ln
2-ln w/ SM
4-Lnw/ RM
2-Ln w/ TWLTL4-
Ln w
/ TW
LTL/
RM
4-Ln
2-Ln
2-Ln
2-Ln
2-Ln
2-Ln
2-Ln
2-Ln
2-Ln
2-Ln
2-Ln
2-Ln
2-Ln
2-Ln
2-Ln
2-Ln
4-Ln
w/ R
M
2-Ln2-Ln
2-Ln
2-Ln
nL-2
2-Ln
2-Ln
2-Ln
2-Ln
2-Ln
2-Ln
2-Ln
2-Ln
2-Ln
2-Ln
2-Ln
2-Ln
2-Ln
2-Ln
4-Ln
2-Ln
2-Ln
2-Ln
2-Ln2-Ln2-Ln
2-Ln4
9
8
7
6
53
2
1
18
2524
23
22
21
2019
17
16151413
12
11
10
§̈¦15
·|}þ76
·|}þ76
W. Lilac Rd
W. Lilac Rd
W. Lilac Rd
E. Dulin Rd
Cam Del C ielo
Oliv e Hill Rd
Cam D el Rey
Old Castle Rd
E. Vista Wy
Old River Rd
Old Hwy 395
Old Hwy 3
95
C ri c el R V a ell y L n
Champagne Bl
Moun at ni R di ge R dLilac Rd
Valle
y Cen
ter R
dM
iller R
d
Col e
G ra d
e Rd
Misty O ak R d
!
!
!!
! !
2-Ln
2-Ln3130
29
28
27
26
10 0.5 Miles
Project Area Inset
See Gopher Canyon Rd Inset
Pankey Rd
Mission Av
Gopher Canyon
!
! ! !
!
2-Ln
4-Ln
2-Ln4-Ln
17
161514
13
Old Castle Rd
Cir elc R V al el y L n
Circle R Dr
Champagne Bl
Old Hwy 395
Gopher Canyon Rd
Gopher Canyon Rd Inset
§̈¦15
See Project Area Inset
0 800400 Feet
0 1,000500 Feet
ProjectArea
<
<
ProjectArea
NN
N·|}þ76
Mission Rd
Gird R
d
Monserate
Via
aliL c H slli Ranch R d
Lilac
Rd
Street "Z"
Main St
W. Lilac RdW. Lilac Rd
W. Lilac Rd
Stre et "F"
Lilac
Hills
Ranc
h Rd
Street "O" Street "C"
Legend
4-Lane Roadway4-Ln
Study Intersection!X
2-Lane Roadway2-LnRaised MedianRMStriped MedianSMTwo-Way Left Turn LaneTWLTL
Future Roadway
2-Ln
w/ T
WLT
L

Page 32 Lilac Hills Ranch TIS
A total of thirty‐one (31) key study area intersections, including 23 operated by the County of San Diego and 8 operated by Caltrans, were analyzed in this study, as shown below. Caltrans intersections are shown in italicized text.
1) E. Vista Way / Gopher Canyon Road 2) SR‐76 / Old River Road/E. Vista Way (Caltrans) 3) SR‐76 / Olive Hill Road/Camino Del Rey (Caltrans) 4) Old River Road / Camino Del Rey 5) W. Lilac Road / Camino Del Rey 6) Old Highway 395 / SR‐76 (Caltrans) 7) Pankey Road / SR‐76 (Caltrans) 8) Old Highway 395 / E. Dulin Road 9) Old Highway 395 / W. Lilac Road 10) I‐15 SB Ramps / Old Highway 395 (Caltrans) 11) I‐15 NB Ramps / Old Highway 395 (Caltrans) 12) Old Highway 395 / Camino Del Rey 13) Old Highway 395 / Circle R Drive 14) I‐15 SB Ramps / Gopher Canyon Road (Caltrans) 15) I‐15 NB Ramps / Gopher Canyon Road (Caltrans) 16) Old Highway 395 / Gopher Canyon Road 17) Old Highway 395 / Old Castle Road 18) W. Lilac Road / Covey Lane 19) Mountain Ridge Road / Circle R Drive 20) W. Lilac Road / Circle R Drive 21) Lilac Road / W. Lilac Road 22) Lilac Road / Old Castle Road 23) Valley Center Rd / Lilac Road 24) Miller Road / Valley Center Road 25) Cole Grade Road / Valley Center Road
Project Driveways 26) Street “O” / W. Lilac Road/Main Street 27) Main Street / Street “C” 28) Lilac Hills Ranch Road / Main Street North 29) Lilac Hills Ranch Road / Main Street South 30) Street “Z” / Main Street 31) W. Lilac Road/Street “F” / Main Street
Intersections 26 through 31 are project driveways, and are included in the “Plus Project” assessments only. Figure 3‐1B displays study area intersection lane geometrics under Existing conditions within the study area.

!
!
! !
!
!
!
!
!!
!
!
!
Osbourne St
Pala R
d
Old Hw
y 395
·|}þ76
·|}þ76
Ca m Del R ey
Go pher C anyon R d
Old Rive r Rd
W. L ila c Rd
E. Dulin Rd
Pankey Rd
§̈¦15
Olive Hill Rd
E. Vista WyCircle R Dr
ProjectArea
Mission Rd
Old Hwy 395
4
9
8
7
6
53
2
1
13
12
1110
! ! ! !
! ! ! !
! ! ! !
!
³ê
³ê ³ê ³ê
<<
<
Pankey Rd & SR-76Old Hwy 395 & SR-76
Old Hwy 395 & Circle R Dr
W. Lilac Rd & Cam Del Rey
Old Hwy 395 & W. Lilac Rd
Old Hwy 395 & E. Dulin Rd
Old River Rd & Cam Del Rey
Old Hwy 395 & Cam Del ReyI-15 SB Ramps & Old Hwy 395 I-15 NB Ramps & Old Hwy 395
E. Vista Wy & Gopher Canyon Rd SR-76 & Old River Rd / E. Vista Wy SR-76 & Olive Hill Rd / Cam Del Rey
9
8765
4321
13
121110
Figure 3-1B (Intersections 1-13)Lilac Hills Ranch Traffic Impact StudyIntersection Geometrics - Existing Conditions
Stop Sign
*Names of North-Southcross-streets alwayslisted rst
NNOT TO SCALE
#$
Legend
Yield SignÂ
Study Intersection
Signalized Intersection
Lane Geometry
!X
³ê

! !!
!
!
! !
!
Old Castle Rd
Woods Valley Rd
Old Hwy 3
95
Gop her Can yo n Rd
W. Lil ac R d
Circ le R Dr
ProjectArea
§̈¦15
Mountain Ridge Rd
W. Lilac Rd
W. Lilac Rd Lilac Rd
Lilac
R d
Valley Center Rd
Cole
Gra d
e Rd
Mille
r Rd
Lilac Rd
G opher Canyon Rd
Covey Ln18
2524
23
22
212019
! !!
!17
161514
§̈¦15
Gopher Canyon RdOld Castle Rd
Old Hwy 395
! ! ! !
! ! ! !
! ! ! !
<<
<<
³ê ³ê
³ê³ê
Lilac Rd & W. Lilac RdW. Lilac Rd & Covey Ln
Lilac Rd & Old Castle Rd
W. Lilac Rd & Circle R Dr
Valley Center Rd & Lilac Rd Miller Rd & Valley Center Rd
Old Hwy 395 & Old Castle Rd
Mountain Ridge Rd & Circle R Dr
Cole Grade Rd & Valley Center Rd
Old Hwy 395 & Gopher Canyon RdI-15 SB Ramps & Gopher Canyon Rd I-15 NB Ramps & Gopher Canyon Rd
25242322
21201918
17161514
Lilac Hills Ranch Traffic Impact Study Figure 3-1B (Intersections 14-25)Intersection Geometrics - Existing Conditions
Stop Sign
*Names of North-Southcross-streets alwayslisted �rst
NNOT TO SCALE
#$
Legend
Yield SignÂ
Study Intersection
Signalized Intersection
Lane Geometry
!X
³ê
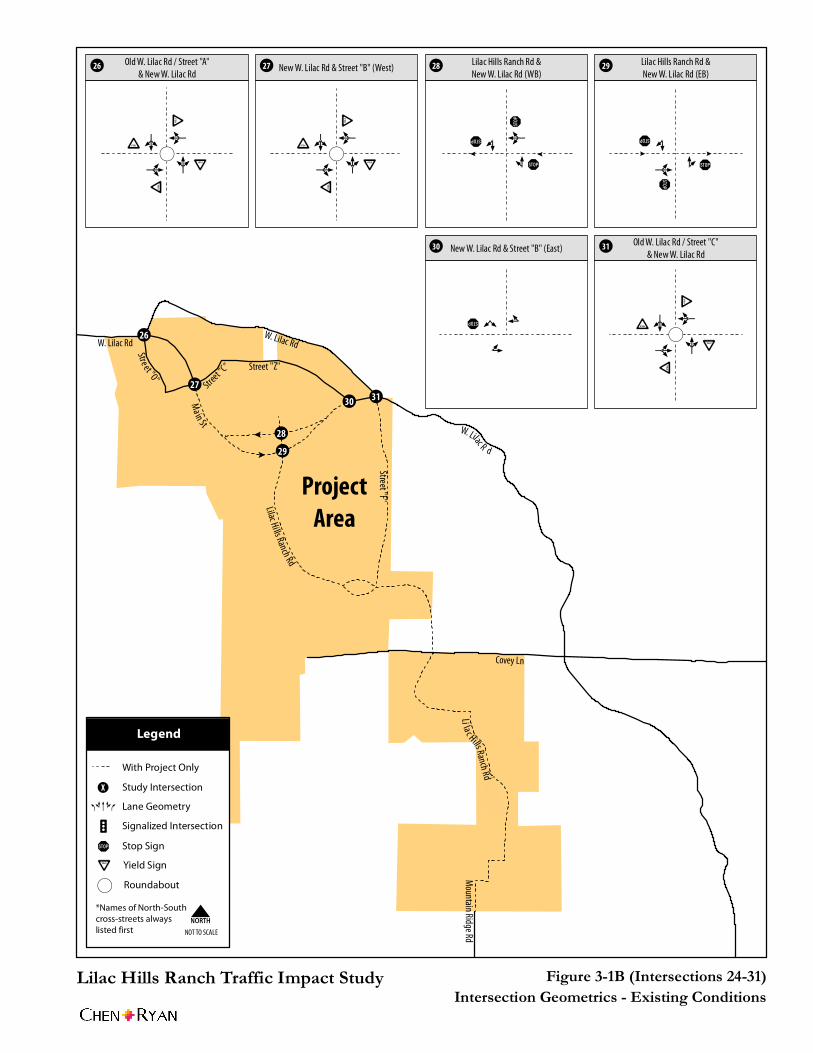
!
!
!!
! !
W. Lilac Rd
Street "C
"
Str e et "O"
Ma in St
<
<
Lilac Hi lls Ranch Rd
Street "F"
Mountain Ridge Rd
Li la c Hills Ranch Rd
W. Lilac Rd
Street "Z"
3130
29
28
27
26
ProjectArea
Covey Ln
W. Lilac R d
! ! ! !
! !
< <
< <
!( !(
!(
Â
ÂÂ
 Â
Â
Â
Â
Â
Â
Â
Â
#$
#$
#$
#$
#$
#$
#$
Lilac Hills Ranch Rd &New W. Lilac Rd (EB)
New W. Lilac Rd & Street "B" (West)
New W. Lilac Rd & Street "B" (East)Old W. Lilac Rd / Street "C"
& New W. Lilac Rd
Old W. Lilac Rd / Street "A"& New W. Lilac Rd
Lilac Hills Ranch Rd &New W. Lilac Rd (WB)
3130
29282726
Lilac Hills Ranch Traffic Impact Study Figure 3-1B (Intersections 24-31)Intersection Geometrics - Existing Conditions
Stop Sign
*Names of North-Southcross-streets alwayslisted first
NNOT TO SCALE
#$
Legend
Yield SignÂ
Study Intersection
Signalized Intersection
Lane Geometry
!X
³ê
With Project Only
Roundabout!(

Page 36 Lilac Hills Ranch TIS
3.2 Existing Intersection and Roadway Volumes
Figure 3‐2A displays Average Daily Traffic (ADT) volumes for study area roadway and freeway segments. Figure 3‐2B shows existing AM/PM peak hour traffic volumes for the key study area intersections. Roadway segment and study area intersection traffic count dates are referenced in the analysis tables in the following sections. The freeway segment counts were obtained from Caltrans. The traffic count data summary sheets are provided in Appendix E.
3.3 Existing Level of Service Analysis
Level of service analyses under Existing conditions were conducted using the methodologies described in Chapter 2.0. Roadway segment, intersection, two‐lane highway, freeway segment, and ramp intersection level of service results are discussed separately below. Roadway Segment Analysis Roadway segment analysis is based on the comparison of average daily traffic (ADTs) to the County of San Diego’s Roadway Segment Daily Capacity and Level of Service Standards. However, a number of the roadways within the study area are not fully built to County public road standards. Although not required by the County of San Diego’s Guidelines for Determining Significance and Report Format for Transportation and Traffic, a conservative approach was taken to reduce road capacities for purposes of this analysis. In order to determine the amount of capacity reduction to use in the analysis, several factors were considered. Most important, all of the roads considered for capacity reductions provide one lane in each direction and the number of lanes is the best indication of capacity. In terms of reduced shoulder width, since the shoulder is outside the traveled way, is rarely utilized by drivers, and the fact that the reduced shoulder width is present on only a small portion of the studied roadway, a large capacity reduction would not occur. In terms of minimum curve radii, since the curves are only present on a small portion of the studied roadway, a large capacity reduction would be inappropriate.