Embed Size (px)
Citation preview
Lightning Imaging with LOFAR
Olaf Scholten1,2,?, Stijn Buitink3, Roxana Dina1, Qader Dorosti Hasankiadeh1, Wilfred Frieswijk4,Freddie Hendriks1, Jeroen Muller1, Danny Sardjan1, Gia Trinh1, Antonio Bonardi5, ArthurCorstanje5, Ute Ebert6,7, Heino Falcke4,5, Jörg Hörandel5, Pragati Mitra3, Katharine Mulrey3,Anna Nelles8, Jörg Rachen5, Laura Rossetto5, Casper Rutjes6, Pim Schellart9, SatyendraThoudam10, Sander ter Veen4, and Tobias Winchen3
1University of Groningen, KVI Center for Advanced Radiation Technology, 9747 AA Groningen, The Nether-lands2Vrije Universiteit Brussel, Dienst ELEM, IIHE, Pleinlaan 2, 1050 Brussels, Belgium3Astrophysical Institute, Vrije Universiteit Brussel, Pleinlaan 2, 1050 Brussels, Belgium4Netherlands Institute for Radio Astronomy (ASTRON), 7990 AA Dwingeloo, The Netherlands5Department of Astrophysics/IMAPP, Radboud University, P.O. Box 9010, 6500 GL Nijmegen, The Nether-lands6CWI, Centrum Wiskunde & Informatica, Amsterdam, The Netherlands7TU/e, Eindhoven University of Technology, Eindhoven, The Netherlands8Physics and Astronomy, University of California, Irvine, CA 92697-4575,U.S.A9Department of Astrophysical Sciences, Princeton University, Princeton, NJ 08544, USA10Department of Physics and Electrical Engineering, Linnéuniversitetet, 35195 Växjö, Sweden
Abstract. We show that LOFAR can be used as a lightning mapping array with a resolu-tion that is orders of magnitude better than existing arrays. In addition the polarization ofthe radiation can be used to track the direction of the stepping discharges.
1 Introduction and summary
Lightning is a familiar phenomenon, but still far from being understood [1]. There are recent sugges-tions for the mechanism that initiates lightning discharges [2, 3] as well as some qualitative under-standing of how a lightning leader discharge propagates over distances of kilometers, but a quantitativetheory is lacking. In particular, it is known that leaders with an excess of negative charge (called neg-ative leaders) often proceed in a step-wise fashion, but the physical mechanism for this stepping is notunderstood. While stepping the leader emits strong radio pulses that can be used to locate its positionin the sky. These radio pulses are used by Lightning Mapping Arrays (LMAs) to map the progressof leader development [4]. This makes a LMA the ideal instrument to study the physics involved inLightning initiation and propagation.
Here we show that a new observation mode at LOFAR, a new generation radio telescope [5] buildmainly for astronomy observations, allows for LMA observations with a resolution that is orders ofmagnitude better than presently existing LMAs, thus allowing for lightning observations with un-precedented resolution. The polarization of the signal can be used to reconstruct the direction of the
?e-mail: [email protected]
DOI: 10.1051/, (2017) 7135epjconf/201135EPJ Web of ConferencesARENA 2016
0 03003 3003
© The Authors, published by EDP Sciences. This is an open access article distributed under the terms of the Creative Commons Attribution License 4.0 (http://creativecommons.org/licenses/by/4.0/).
discharge. Combining these we can construct a 4-D vector map of the discharge process with highprecision. To interpret the observations we have developed a model for calculating radio emissionfrom a stepped leader. In Ref. [6] it was reported that the radio pulses have a fine structure on theorder of 10 ns which we have confirmed in our preliminary measurements.
Recently we have developed a non-invasive method for determining the electric-field in thunder-clouds [7, 8] by measuring at the core of LOFAR the radio footprint from cosmic-ray air showers. Itis of much interest to combine this with the LOFAR-LMA observations.
2 State-of-the-art LMA
Nowadays there are several Lightning Mapping Arrays (LMA) [4] in operation. To determine theposition in the atmosphere of the source that emitted the radio signal one measures the time of arrival(ToA) in a network of antennas on the ground. To reach sufficient accuracy they are spread overdistances of typically 60 km [9]. Most arrays operate in an abandoned TV broadcasting frequencyband in the lower VHF band, 60-66 MHz where the signal is digitized at a frequency of 25 MHz.The data is analyzed in blocks of 80 µseconds, called "Windows", in which the arrival time of thestrongest peak is determined. The window size limits the maximum number of pulses to be analyzedto 12,500 per second. In each Window the arrival time is determined with a precision of 40 ns set bythe resolution of the digitization. The relative timing of individual antennas is set using GPS. This hasresulted in detailed maps of leader development that have contributed much to a better understandingof the physics of lightning, see [1].
3 LOFAR
The Low Frequency Array [5] (LOFAR) is a digital radio telescope that is primarily build for astron-omy observations, consisting of many thousands of antennas. The antennas are grouped in stations,where each core station has 96 Low Band Antennas (LBA) and 48 High Band Antennas (HBA). EachLBA consists of two inverted V-shaped dipoles labeled X and Y. The LBA are sensitive to the fre-quency range of 10 - 90 MHz and are used for the observations discussed in this work. The sensitivityrange of the HBA is 110 - 240 MHz. The signals are sampled at 200 MS/s leading to a sampling timeof 5 ns. The approximately 2 km diameter LOFAR core contains 24 such stations with the highestdensity offered by the six stations located in a 320 m diameter region called the ‘Superterp’ near Exlooin the north of The Netherlands. Remote stations may lie at a distance of 1000 km from the core.
All antennas of LOFAR are equipped with ring buffers, that store the raw voltage traces of eachindividual antenna in the array for up to 5 s. When a trigger is received, the ring buffers are frozenand their contents are copied over the network to a central storage location. In the observation modepertinent to this work the trigger is generated when there is lightning activity.
4 LOFAR as LMA
At each step of a lightning leader a sizable current flows in short time. By the nature of this process,strong linearly polarized radio-frequency pulses are emitted at meter wavelengths, making LOFAR anexquisitely suited instrument for measuring them with the LBA. This is corroborated by model cal-culations [10] showing the the angular distribution of the emitted radiation as well as the polarizationcan be used to determine rather accurately the direction of the discharge step. In addition it is possibleto extract from the shape of the measured pulse the time profile and the length scale over which thecurrent flows.
DOI: 10.1051/, (2017) 7135epjconf/201135EPJ Web of ConferencesARENA 2016
0 03003 3003
2
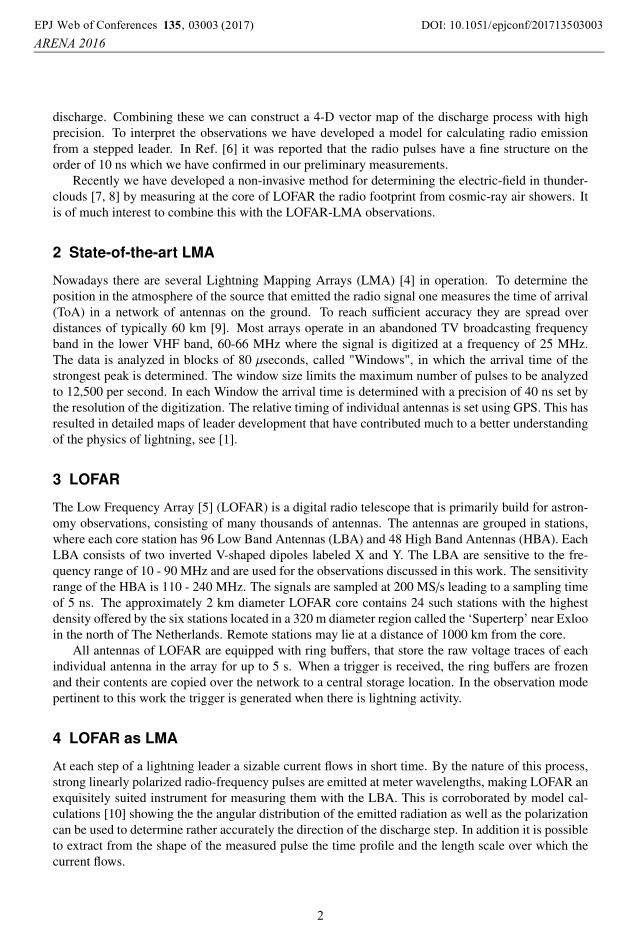
Data were taken with LOFAR-LBAs, in the 30-80 MHz band on June 19, 2013, while a thun-derstorm was active at a distance of some 50 km from the telescope. The time trace of the LOFARantennas on the Superterp as well as other stations up to distances of 30 km were analyzed.
100
200
300
400
500
600
700
800
900
1000
1100
0 48 96 144 192 240 288 336 384 432 480 528 576 624 672 720
antenna nr
103
tim
esa
mp
le
LMA-StationMap
Tue Nov 22 2016
22:31:32
Figure 1. Left side shows pulse timing (vertical axis), indicated by dots, for all antennas (antenna number onhorizontal axis) that were included in the present measurement. The traces of different stations (of 3 ms length,sampling time of 5 ns) have been time-shifted to align the strongest peak in the time-sequences. One trace couldnot be aligned. The pulses marked in red for three events are analyzed for their source location as shown onthe right overlayed on a map of the North-East corner of The Netherlands showing the borders of the provincesof Groningen and Drenthe. The orange dots indicate lightning observations by the Dutch weather service. Thepositions of the LOFAR stations that are involved in the measurements are indicated by blue crosses.
As the first step in the analysis of the data the pulse-patterns seen in the different stations areroughly lined-up as shown in Fig. 1 for the different stations. A pulse is labeled as such when, afterRadio-Frequency Interference (RFI) mitigation, the power exceeds a certain threshold. This lining-upis necessary as for these older data the precise timing off-sets of the stations were not available. As canbe seen this works very well for all 15 stations with the exception of one for which the off-set exceededthe trace-length and no matching could be made. Each station consists of 48 antennas spread over anarea with a diameter of about 30 m for which the relative timing is known accurately. For the threeevents marked in red in Fig. 1 the source location and emission time is found by fitting the arrival-times of the pulses for each separate antenna adjusting the station offsets, but keeping them the samefor all events. The fit reproduces the measurements with an accuracy of about 1 time sample. At theright panel of Fig. 1 the source locations (green circled dots) are overlayed with a map of North-EastNetherlands showing the provinces of Groningen and Drenthe. The orange and red points label thepositions of observed lightning discharges in an half-hour time slot around the LOFAR observations asdetermined by the Dutch weather service showing a good agreement with the found source locations.
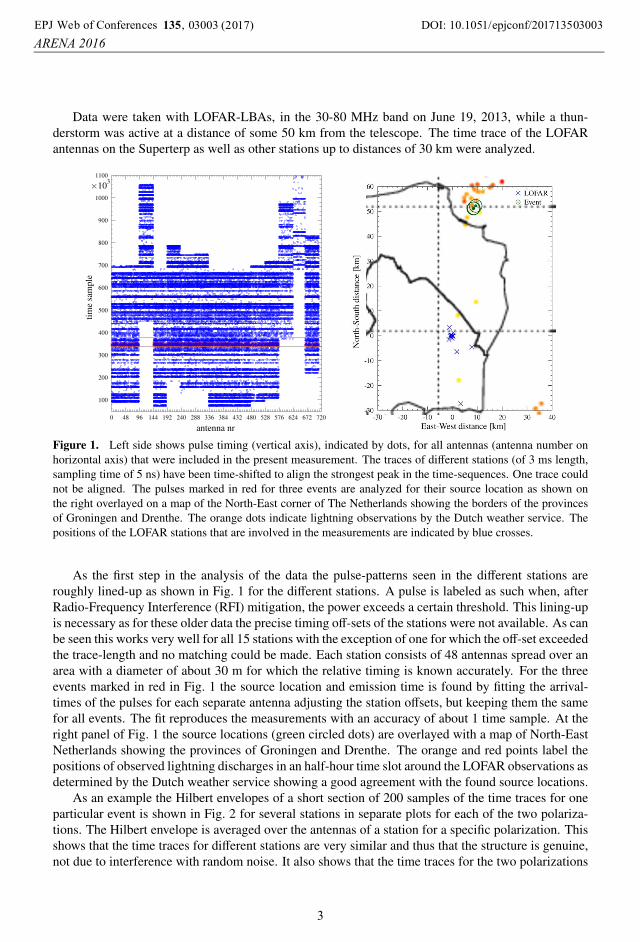
As an example the Hilbert envelopes of a short section of 200 samples of the time traces for oneparticular event is shown in Fig. 2 for several stations in separate plots for each of the two polariza-tions. The Hilbert envelope is averaged over the antennas of a station for a specific polarization. Thisshows that the time traces for different stations are very similar and thus that the structure is genuine,not due to interference with random noise. It also shows that the time traces for the two polarizations
DOI: 10.1051/, (2017) 7135epjconf/201135EPJ Web of ConferencesARENA 2016
0 03003 3003
3
0
10
20
30
40
0 100 200
time=0343900
0
10
20
30
40
0 100 200
time=0343900
sample [5ns]
LMA-StationMap
Tue Nov 22 2016
22:10:34
0
10
20
30
40
0 100 200
time=0343900
0
10
20
30
40
0 100 200
time=0343900
sample [5ns]
LMA-StationMap
Tue Nov 22 2016
22:10:34
Figure 2. The average pulse shapes (Hilbert envelope), i.e. the average of the signals measured by the antennasin each station normalised to the integral in the X axis, (a different color for each station) for the two polarizationdirections (left and right hand sides). The total trace length shown is 200 samples of 5 ns, i.e. 1 µs.
are clearly distinct with a clear polarization-dependent structure for the pulse. Because the pulse isweaker in one polarization it is over threshold in fewer antennas giving rise to a more noisy signal. Itshould be noted that for some other events a much more complicated pulse structure is observed.
Work is still ongoing to determine the relative accuracy of source positions. In addition for thisinitial analysis [11, 12] the pulse timings were determined in single-sample precision. In the next stepwe refine this using pulse interferometry with which we should easily be able to obtain nanosecondtiming accuracy.
References
[1] J.R. Dwyer and M.A. Uman, Phys. Rep. 534, 147 (2014).[2] A. Gurevich, A. Karashtin, Phys. Rev. Lett 110, 185005 (2013).[3] Anna Dubinova, et al., Phys. Rev. Lett 115, 015002 (2015).[4] Some links to Lightning Mapping Array, Oklahoma LMA; SPORT; New Mexico; Ebro Valley;
J.D. Hill, et al., J. of Geoph. Res.: Atm 118, 8460 (2013).[5] M. P. van Haarlem, et al., Å5562013A2; arXiv:1305.3550; LOFAR Wikipedia page.[6] N. Murray, P. Krider, J. Willett, Atmos. Res. 76, 455 (2005).[7] P. Schellart et al., Phys. Rev. Lett 114, 165001 (2015), arXiv:1504.05742.[8] G. Trinh, O. Scholten, et al., Phys. Rev. D 93, 023003 (2016), arXiv:1511.03045.[9] R.J. Thomas et al., J. Geophys. Res. 109, D14207 (2004).[10] Freddie Hendriks, Bachlor thesis, University of Groningen, 2016.[11] Roxana Dina, Master thesis, University of Groningen, 2014.[12] Danny Sardjan, Bachelor thesis, University of Groningen, 2016.
DOI: 10.1051/, (2017) 7135epjconf/201135EPJ Web of ConferencesARENA 2016
0 03003 3003
4