Embed Size (px)
Citation preview
L. West 1/15/19
1
Lightning Memo
Memo 1
Lightning Environments for EMP Analysts
abstract
Every EMP author, bar none, who writes about lightning is ‘driven’ to do it wrong, use data from any unofficial source they choose, and muddle the comparisons between EMP and lightning effects on systems. And, of course, they always use lightning amplitudes less than those required of the lightning community … always. However, they always use standard EMP environments. This memo is intended to summarize official lightning environments for the negative strokes that are considered necessary for analysis of electrical effects particularly of the power grid. Positive strokes are discussed but not with the same level of detail. 1. Lightning Environments used for Electrical Effects [1]
The environment and test waveforms defined in the Society of Automotive Engineers (SAE) Aerospace Recommended Practice (ARP) 5412 account for the best lightning data and analysis currently available. The quantified environment and levels represent the minimum currently required by certifying authorities, consistent with the approach applied in related lightning documents. University of Florida specialists (Uman & Rakov) take part in these standardization exercises.
Lightning, like any natural phenomenon, is probabilistic in nature. Levels and waveforms vary considerably from one flash to the next. The parameters of the standardized waveforms represent severe versions of each of the characteristics of natural lightning flashes and include all parameters of interest with respect to lightning protection. However, it should be noted that in every case more severe versions of each of the characteristics of the standardized waveforms have been recorded in natural lightning flashes as well as additional parameters such as electric field effects in non-conductive structures.
The environments that follow are those considered necessary for electrical effects. These and other environments are used elsewhere for direct mechanical effects of damage to system components. For clarification, we describe a single cloud-to-ground lightning event as a “flash”. Within each flash there are numerous “strokes” of varying amplitude, waveform, and repetition. We use stroke Waveforms A, D, and H for electrical effects.
IEC 62305, Mil-Std-464, and the Lightning Protection Institute use a max amplitude of 200kA. [2] [29] [28] The average positive ground flash has about the same average peak current as an average negative flash (20-30kA), but can produce peak currents up to 400kA. [1] An estimate of the upper limit of lightning currents has been given by Cooray and Rakov in 2012; they suggested that the largest negative first return stroke peak is about 300kA in temperate regions and about 450kA–500kA in the tropics. [3] The largest positive peak current of 340kA was measured directly in Japan as reported by Goto and Narita. [1995] [4] The record value for a negative flash measured directly and reported by Anderson and Eriksson, [1980] was 200kA. [5] The highest number of 69 strokes per flash was observed in Switzerland for an upward flash by Romero et al., [2013]. [5] The highest number of 26 strokes/flash for a downward flash was observed in the USA by Kitagawa et al., [1962]. [5] Both flashes were of negative polarity. [5] Early lightning field measurement apparatus didn’t have the bandwidth to capture fast rise times and/or were observed across lossy soil.
For those who are interested, lightning is a typical p-static discharge with current running one way with no return current nearby or elsewhere unlike the present system level lightning tests. This effects the design of system level tests, the inductance of conductors in the system, and the waveforms on the cables. [6]
L. West 1/15/19
2
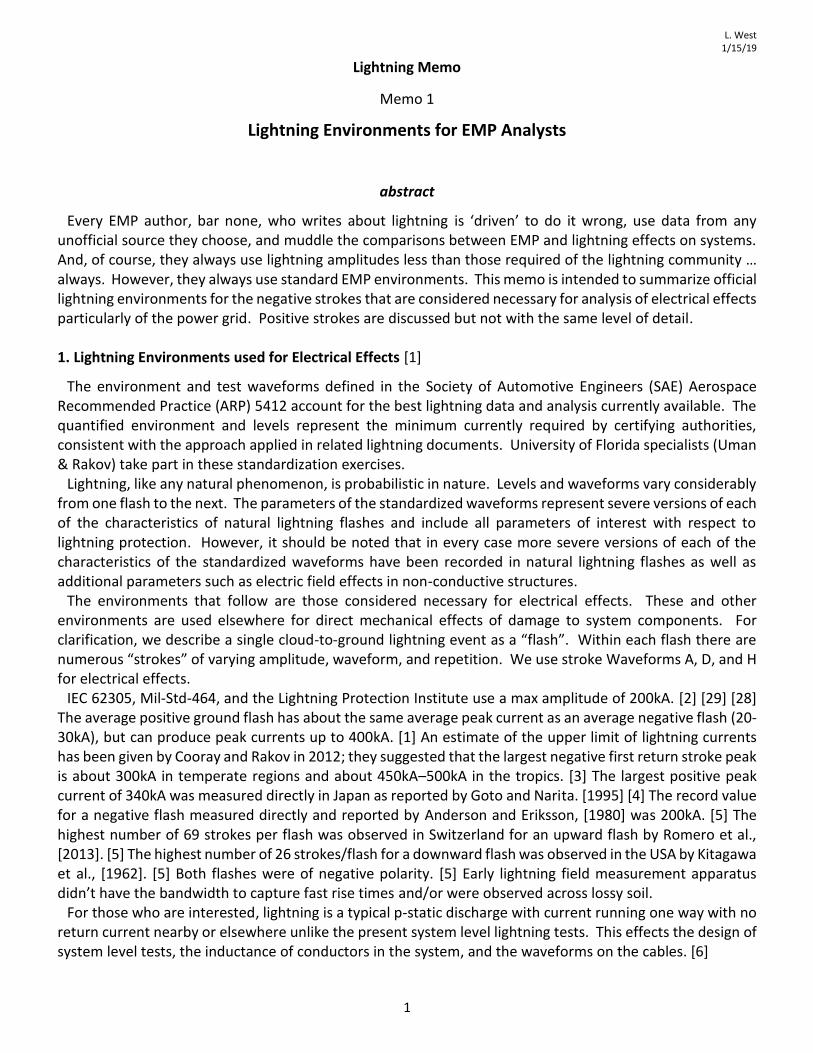
2. The First Return Stroke Waveform A (WFA) [1]
𝐼𝐴(𝑡) = 2018𝑘𝐴 ∙ (𝑒−𝑡 88𝜇𝑠⁄ − 𝑒−𝑡 1.5𝜇𝑠⁄ )
This occurs one time only at the beginning of each flash. A statistical spread of WFA amplitudes is in Figure 1, below. [7]
Figure 1. Distribution of Lightning Stroke Currents [7]
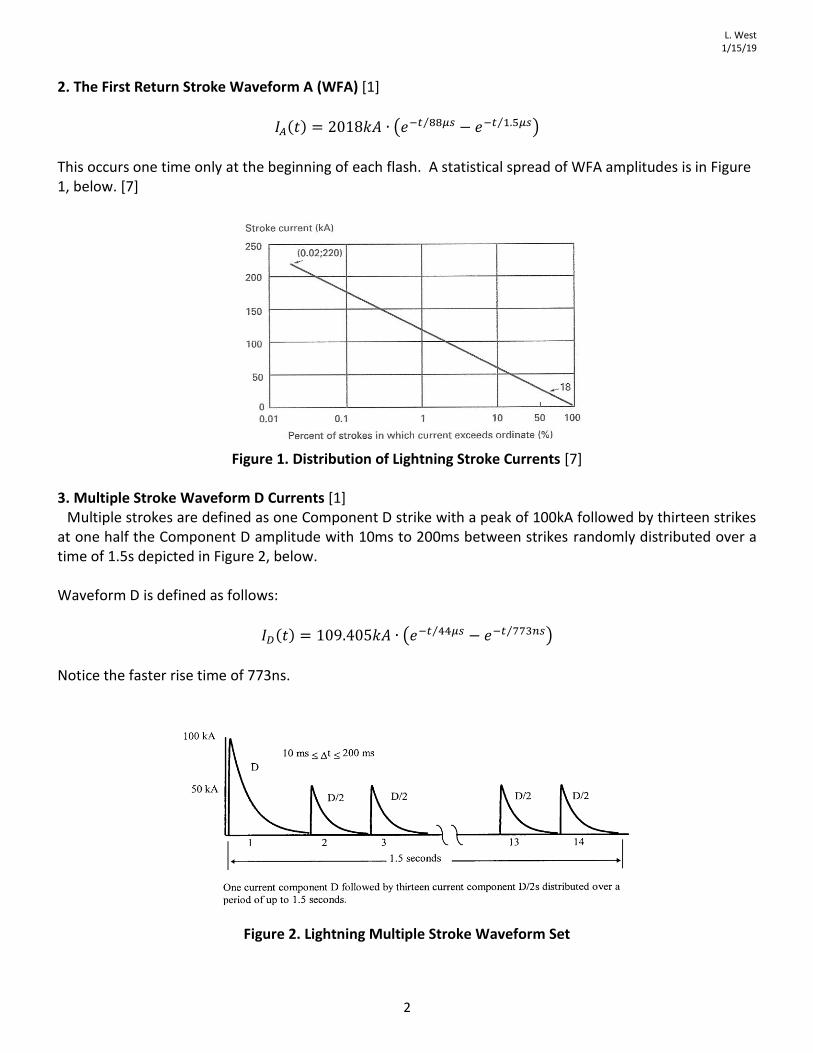
3. Multiple Stroke Waveform D Currents [1]
Multiple strokes are defined as one Component D strike with a peak of 100kA followed by thirteen strikes at one half the Component D amplitude with 10ms to 200ms between strikes randomly distributed over a time of 1.5s depicted in Figure 2, below. Waveform D is defined as follows:
𝐼𝐷(𝑡) = 109.405𝑘𝐴 ∙ (𝑒−𝑡 44𝜇𝑠⁄ − 𝑒−𝑡 773𝑛𝑠⁄ )
Notice the faster rise time of 773ns.
Figure 2. Lightning Multiple Stroke Waveform Set
L. West 1/15/19
3
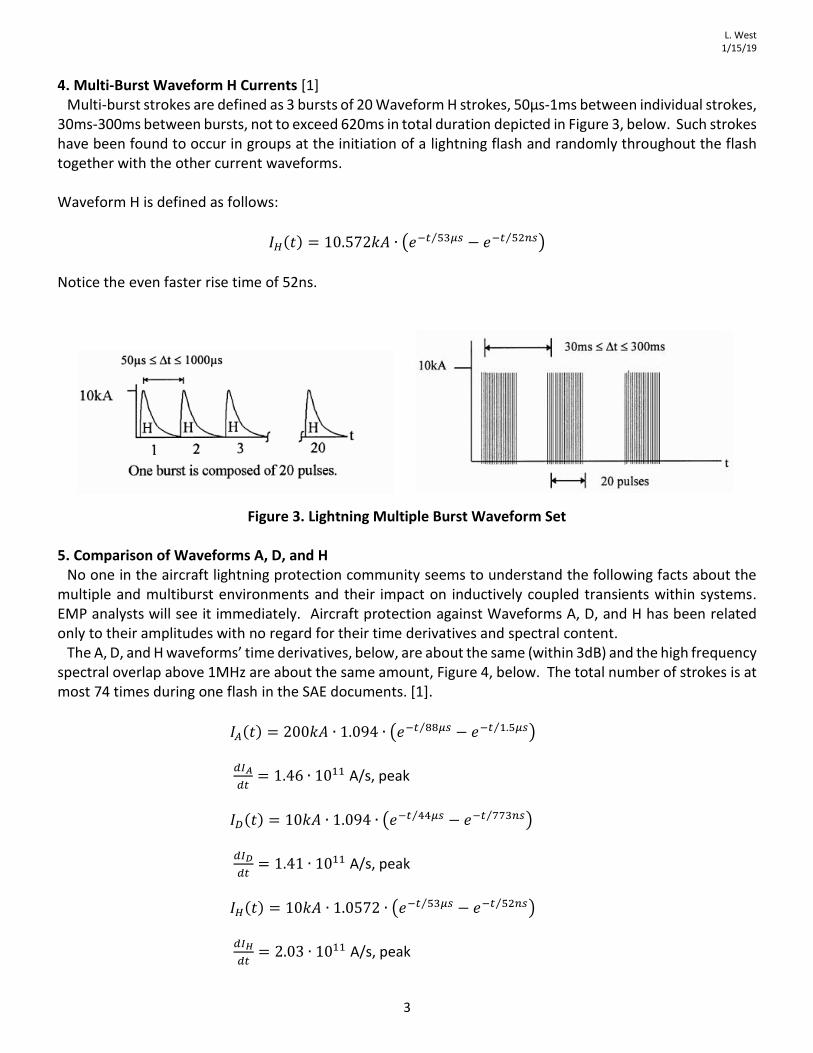
4. Multi-Burst Waveform H Currents [1] Multi-burst strokes are defined as 3 bursts of 20 Waveform H strokes, 50μs-1ms between individual strokes,
30ms-300ms between bursts, not to exceed 620ms in total duration depicted in Figure 3, below. Such strokes have been found to occur in groups at the initiation of a lightning flash and randomly throughout the flash together with the other current waveforms. Waveform H is defined as follows:
𝐼𝐻(𝑡) = 10.572𝑘𝐴 ∙ (𝑒−𝑡 53𝜇𝑠⁄ − 𝑒−𝑡 52𝑛𝑠⁄ )
Notice the even faster rise time of 52ns.
Figure 3. Lightning Multiple Burst Waveform Set 5. Comparison of Waveforms A, D, and H
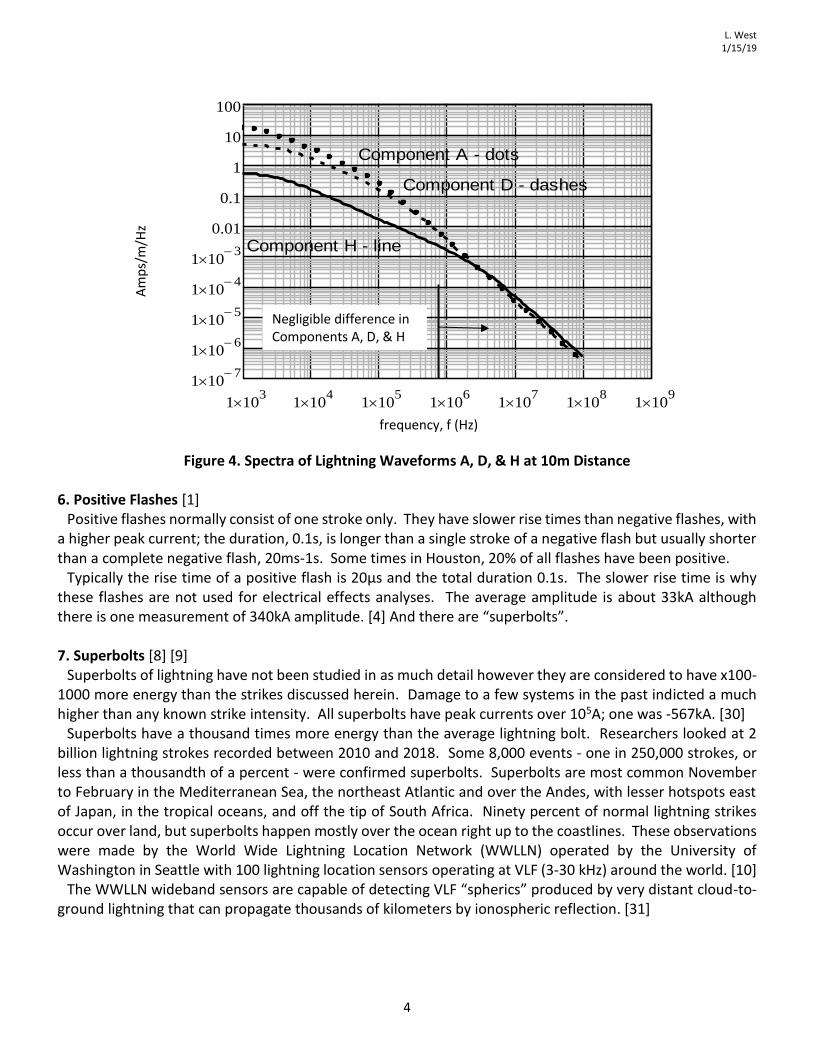
No one in the aircraft lightning protection community seems to understand the following facts about the multiple and multiburst environments and their impact on inductively coupled transients within systems. EMP analysts will see it immediately. Aircraft protection against Waveforms A, D, and H has been related only to their amplitudes with no regard for their time derivatives and spectral content.
The A, D, and H waveforms’ time derivatives, below, are about the same (within 3dB) and the high frequency spectral overlap above 1MHz are about the same amount, Figure 4, below. The total number of strokes is at most 74 times during one flash in the SAE documents. [1].
𝐼𝐴(𝑡) = 200𝑘𝐴 ∙ 1.094 ∙ (𝑒−𝑡 88𝜇𝑠⁄ − 𝑒−𝑡 1.5𝜇𝑠⁄ )
𝑑𝐼𝐴
𝑑𝑡= 1.46 ∙ 1011 A/s, peak
𝐼𝐷(𝑡) = 10𝑘𝐴 ∙ 1.094 ∙ (𝑒−𝑡 44𝜇𝑠⁄ − 𝑒−𝑡 773𝑛𝑠⁄ )
𝑑𝐼𝐷
𝑑𝑡= 1.41 ∙ 1011 A/s, peak
𝐼𝐻(𝑡) = 10𝑘𝐴 ∙ 1.0572 ∙ (𝑒−𝑡 53𝜇𝑠⁄ − 𝑒−𝑡 52𝑛𝑠⁄ )
𝑑𝐼𝐻
𝑑𝑡= 2.03 ∙ 1011 A/s, peak
L. West 1/15/19
4
1 103
1 104
1 105
1 106
1 107
1 108
1 109
1 107
1 106
1 105
1 104
1 103
0.01
0.1
1
10
100
Lightning Spectra A, D, & H
Sa m( )
SD m( )
SH m( )
f m( )
Component A - dots
Component D - dashes
Component H - line
Figure 4. Spectra of Lightning Waveforms A, D, & H at 10m Distance
6. Positive Flashes [1]
Positive flashes normally consist of one stroke only. They have slower rise times than negative flashes, with a higher peak current; the duration, 0.1s, is longer than a single stroke of a negative flash but usually shorter than a complete negative flash, 20ms-1s. Some times in Houston, 20% of all flashes have been positive.
Typically the rise time of a positive flash is 20µs and the total duration 0.1s. The slower rise time is why these flashes are not used for electrical effects analyses. The average amplitude is about 33kA although there is one measurement of 340kA amplitude. [4] And there are “superbolts”. 7. Superbolts [8] [9]
Superbolts of lightning have not been studied in as much detail however they are considered to have x100-1000 more energy than the strikes discussed herein. Damage to a few systems in the past indicted a much higher than any known strike intensity. All superbolts have peak currents over 105A; one was -567kA. [30]
Superbolts have a thousand times more energy than the average lightning bolt. Researchers looked at 2 billion lightning strokes recorded between 2010 and 2018. Some 8,000 events - one in 250,000 strokes, or less than a thousandth of a percent - were confirmed superbolts. Superbolts are most common November to February in the Mediterranean Sea, the northeast Atlantic and over the Andes, with lesser hotspots east of Japan, in the tropical oceans, and off the tip of South Africa. Ninety percent of normal lightning strikes occur over land, but superbolts happen mostly over the ocean right up to the coastlines. These observations were made by the World Wide Lightning Location Network (WWLLN) operated by the University of Washington in Seattle with 100 lightning location sensors operating at VLF (3-30 kHz) around the world. [10]
The WWLLN wideband sensors are capable of detecting VLF “spherics” produced by very distant cloud-to-ground lightning that can propagate thousands of kilometers by ionospheric reflection. [31]
Negligible difference in Components A, D, & H
frequency, f (Hz)
Am
ps/
m/H
z
L. West 1/15/19
5
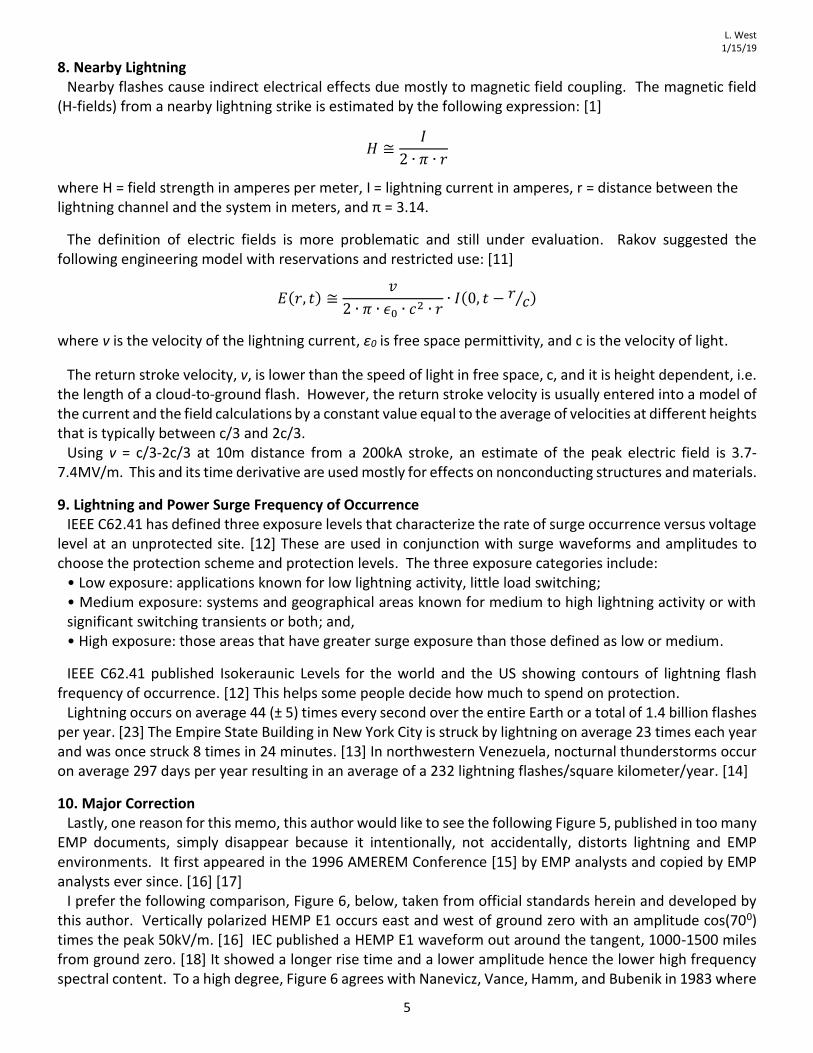
8. Nearby Lightning Nearby flashes cause indirect electrical effects due mostly to magnetic field coupling. The magnetic field
(H-fields) from a nearby lightning strike is estimated by the following expression: [1]
𝐻 ≅𝐼
2 ∙ 𝜋 ∙ 𝑟
where H = field strength in amperes per meter, I = lightning current in amperes, r = distance between the lightning channel and the system in meters, and π = 3.14.
The definition of electric fields is more problematic and still under evaluation. Rakov suggested the following engineering model with reservations and restricted use: [11]
𝐸(𝑟, 𝑡) ≅𝑣
2 ∙ 𝜋 ∙ 𝜖0 ∙ 𝑐2 ∙ 𝑟∙ 𝐼(0, 𝑡 − 𝑟
𝑐⁄ )
where v is the velocity of the lightning current, ε0 is free space permittivity, and c is the velocity of light.
The return stroke velocity, v, is lower than the speed of light in free space, c, and it is height dependent, i.e. the length of a cloud-to-ground flash. However, the return stroke velocity is usually entered into a model of the current and the field calculations by a constant value equal to the average of velocities at different heights that is typically between c/3 and 2c/3.
Using v = c/3-2c/3 at 10m distance from a 200kA stroke, an estimate of the peak electric field is 3.7-7.4MV/m. This and its time derivative are used mostly for effects on nonconducting structures and materials.
9. Lightning and Power Surge Frequency of Occurrence IEEE C62.41 has defined three exposure levels that characterize the rate of surge occurrence versus voltage
level at an unprotected site. [12] These are used in conjunction with surge waveforms and amplitudes to choose the protection scheme and protection levels. The three exposure categories include:
• Low exposure: applications known for low lightning activity, little load switching; • Medium exposure: systems and geographical areas known for medium to high lightning activity or with significant switching transients or both; and, • High exposure: those areas that have greater surge exposure than those defined as low or medium.
IEEE C62.41 published Isokeraunic Levels for the world and the US showing contours of lightning flash frequency of occurrence. [12] This helps some people decide how much to spend on protection.
Lightning occurs on average 44 (± 5) times every second over the entire Earth or a total of 1.4 billion flashes per year. [23] The Empire State Building in New York City is struck by lightning on average 23 times each year and was once struck 8 times in 24 minutes. [13] In northwestern Venezuela, nocturnal thunderstorms occur on average 297 days per year resulting in an average of a 232 lightning flashes/square kilometer/year. [14]
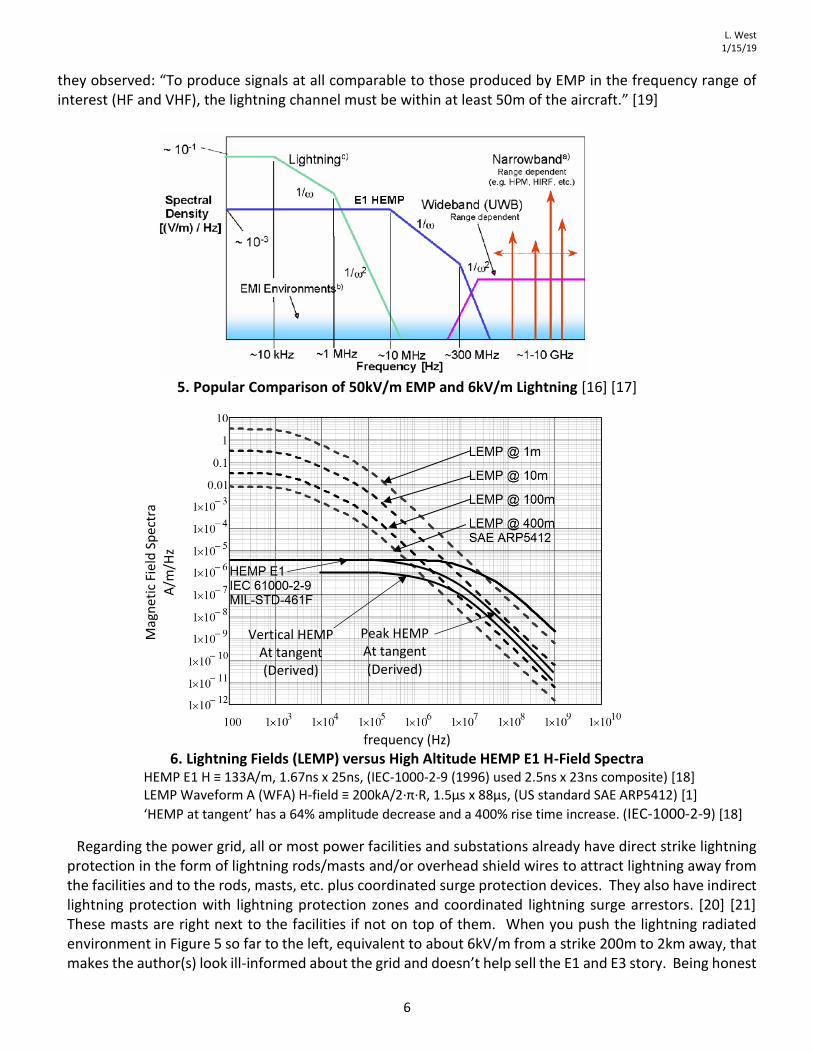
10. Major Correction Lastly, one reason for this memo, this author would like to see the following Figure 5, published in too many
EMP documents, simply disappear because it intentionally, not accidentally, distorts lightning and EMP environments. It first appeared in the 1996 AMEREM Conference [15] by EMP analysts and copied by EMP analysts ever since. [16] [17]
I prefer the following comparison, Figure 6, below, taken from official standards herein and developed by this author. Vertically polarized HEMP E1 occurs east and west of ground zero with an amplitude cos(700) times the peak 50kV/m. [16] IEC published a HEMP E1 waveform out around the tangent, 1000-1500 miles from ground zero. [18] It showed a longer rise time and a lower amplitude hence the lower high frequency spectral content. To a high degree, Figure 6 agrees with Nanevicz, Vance, Hamm, and Bubenik in 1983 where
L. West 1/15/19
6
they observed: “To produce signals at all comparable to those produced by EMP in the frequency range of interest (HF and VHF), the lightning channel must be within at least 50m of the aircraft.” [19]
5. Popular Comparison of 50kV/m EMP and 6kV/m Lightning [16] [17]
frequency (Hz) 6. Lightning Fields (LEMP) versus High Altitude HEMP E1 H-Field Spectra
HEMP E1 H ≡ 133A/m, 1.67ns x 25ns, (IEC-1000-2-9 (1996) used 2.5ns x 23ns composite) [18] LEMP Waveform A (WFA) H-field ≡ 200kA/2·π·R, 1.5μs x 88μs, (US standard SAE ARP5412) [1]
‘HEMP at tangent’ has a 64% amplitude decrease and a 400% rise time increase. (IEC-1000-2-9) [18]
Regarding the power grid, all or most power facilities and substations already have direct strike lightning protection in the form of lightning rods/masts and/or overhead shield wires to attract lightning away from the facilities and to the rods, masts, etc. plus coordinated surge protection devices. They also have indirect lightning protection with lightning protection zones and coordinated lightning surge arrestors. [20] [21] These masts are right next to the facilities if not on top of them. When you push the lightning radiated environment in Figure 5 so far to the left, equivalent to about 6kV/m from a strike 200m to 2km away, that makes the author(s) look ill-informed about the grid and doesn’t help sell the E1 and E3 story. Being honest
Mag
net
ic F
ield
Sp
ectr
a
A/m
/Hz
Peak HEMP At tangent (Derived)
Vertical HEMP At tangent (Derived)
L. West 1/15/19
7
about lightning to people who take it seriously is bound to help get the correct things done like HEMP assessment and protection.
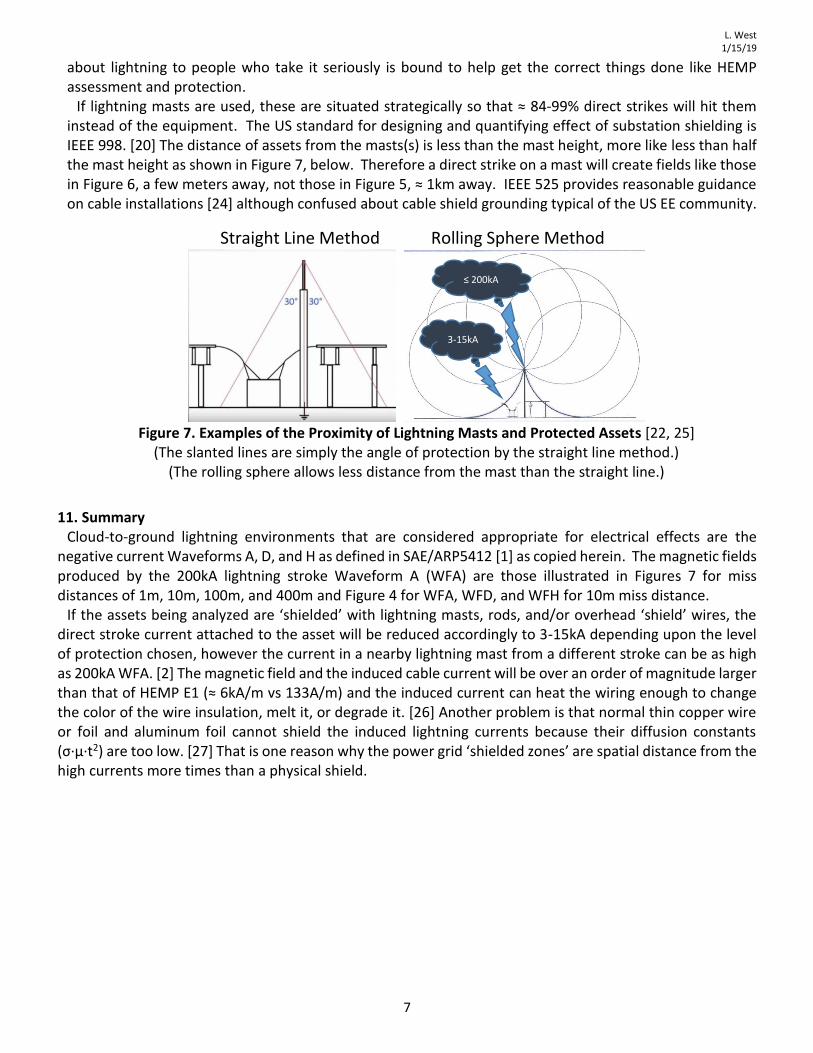
If lightning masts are used, these are situated strategically so that ≈ 84-99% direct strikes will hit them instead of the equipment. The US standard for designing and quantifying effect of substation shielding is IEEE 998. [20] The distance of assets from the masts(s) is less than the mast height, more like less than half the mast height as shown in Figure 7, below. Therefore a direct strike on a mast will create fields like those in Figure 6, a few meters away, not those in Figure 5, ≈ 1km away. IEEE 525 provides reasonable guidance on cable installations [24] although confused about cable shield grounding typical of the US EE community.
Straight Line Method Rolling Sphere Method
Figure 7. Examples of the Proximity of Lightning Masts and Protected Assets [22, 25]
(The slanted lines are simply the angle of protection by the straight line method.) (The rolling sphere allows less distance from the mast than the straight line.)
11. Summary Cloud-to-ground lightning environments that are considered appropriate for electrical effects are the
negative current Waveforms A, D, and H as defined in SAE/ARP5412 [1] as copied herein. The magnetic fields produced by the 200kA lightning stroke Waveform A (WFA) are those illustrated in Figures 7 for miss distances of 1m, 10m, 100m, and 400m and Figure 4 for WFA, WFD, and WFH for 10m miss distance.
If the assets being analyzed are ‘shielded’ with lightning masts, rods, and/or overhead ‘shield’ wires, the direct stroke current attached to the asset will be reduced accordingly to 3-15kA depending upon the level of protection chosen, however the current in a nearby lightning mast from a different stroke can be as high as 200kA WFA. [2] The magnetic field and the induced cable current will be over an order of magnitude larger than that of HEMP E1 (≈ 6kA/m vs 133A/m) and the induced current can heat the wiring enough to change the color of the wire insulation, melt it, or degrade it. [26] Another problem is that normal thin copper wire or foil and aluminum foil cannot shield the induced lightning currents because their diffusion constants (σ·μ·t2) are too low. [27] That is one reason why the power grid ‘shielded zones’ are spatial distance from the high currents more times than a physical shield.
3-15kA
≤ 200kA
L. West 1/15/19
8
References
1. SAE/ARP 5412B, “Aircraft Lightning Environment and Related Test Waveforms”, 2013-01-11
2. IEC 62305:2010, “Protection against lightning”
3. Cooray & Rakov, “On the upper and lower limits of peak current of first return strokes in negative lightning flashes”, Atmospheric Research, Volume 117, 1 November 2012, Pages 12-17
4. Y. Goto, and K. Narita, "Electrical characteristics of winter lightning" J. Atmos. Terr. Phys., vol. 57, 449-459, 1995
5. 25th International Lightning Detection Conference and 7th International Meteorology Conference, Ft. Lauderdale, FL, USA, March 12-15, 2018, “Extreme Values of Lightning Parameters”, A. Smorgonskii, M. Rubinstein, F. Rachidi
6. IN 114, April 2011, “In-Flight versus Ground-Test Lightning Interactions in Composite Airframes Effects of External vs. Internal inductance, An Errata to Everything Previously Published”, Larry West
7. IEEE Std. C62.42, 1992, IEEE Guide for the Application of Gas Tube and Air Gap Arrester Low-Voltage (Equal to or Less than 1000Vrms or 1200Vdc) Surge Protective Devices
8. “Lightning ‘superbolts’ form over oceans from November to February”, Hannah Hickey, UW News, September 9, 2019
9. 25th International Lightning Detection Conference and 7th International Meteorology Conference, Ft. Lauderdale, FL, USA, March 12-15, 2018, “Extreme Values of Lightning Parameters”, A. Smorgonskii, M. Rubinstein, F. Rachidi
10. WWLLN, World Wide Lightning Location Network, https://wwlln.net/new/
11. “Characterization of Lightning Electromagnetic Fields and their Modeling”, V.A. Rakov, University of Florida, Gainesville, FL, www.lightning.ece.ufl.edu/PDF/Zurich/1T01.pdf
12. IEEE C62.41.2-2002 – “IEEE Recommended Practice on Characterization of Surges in Low-Voltage (1000V and less) AC Power Circuits”
13. Live Science, “Video Captures Lightning Striking Empire State Building 3 Times”, by Brett Israel, April 13, 2011, https://www.livescience.com/13704-empire-state-building-lightning-strike.html
14. Geoscience News & Information, geology.com, “Earth's Lightning Hotspots”
15. Giri & Kaelin, 1996 AMEREM Conference, Albuquerque
16. Meta-R-320, “The Early-Time (E1) High-Altitude Electromagnetic Pulse (HEMP) and Its Impact on the U.S. Power Grid”, Edward Savage, James Gilbert, William Radasky, January 2010, https://www.ferc.gov/industries/electric/indus-act/reliability/cybersecurity/ferc_meta-r-320.pdf
17. “High-Power Electromagnetics (HPEM) From the 1960s into the 21st Century”, Dr. D. V. Giri, Presented at Plenary Session EUROEM 2012 Pierre Baudis Conference, Toulouse, France 4 July, 2012
18. IEC 1000-2-9 (1996), Electromagnetic compatibility (EMC) — Part 2: Environment — Section 9: “Description of HEMP environment”
L. West 1/15/19
9
19. DNA-TR-82-204, “Comparison of the Electromagnetic Properties of Lightning and EMP, Results of Recent Lightning Studies”, J.E. Nanevicz, E.F. Vance, J.M. Hamm, D.M. Bubenik, SRI International, 30 June 1983
20. IEEE Std. 998, “Guide for Direct Lightning Stroke Shielding of Substations”, 5 December 2012
21. “Design Guide for Rural Substations”, https://www.rd.usda.gov/files/UEP_Bulletin_1724E-300.pdf, 2001
22. https://peguru.com/2019/06/power-substation-design-calculations/ Home » Substation Physical Design, Power Substation Design Calculations – A Checklist of 18 Studies for Engineers to Consider, By Aleen, Last Updated on August 7, 2019
23. Geoscience News & Information, geology.com, “World Lightning Map”, Hobart M. King
24. IEEE Std 525™-2007, “IEEE Guide for the Design and Installation of Cable Systems in Substations” 25. VERDOLIN SOLUTIONS INC., HIGH VOLTAGE POWER ENGINEERING SERVICES, Rogerio Verdolin 26. https://www.electrical-forensics.com/LightningDamage/LightningDamage.html 27. IN115, Larry West, April 2011, “Lightning Induced Waveforms 4 and 5A in Composite Airframes, The Inability of Copper Braid to Shield It, And A New Layered Copper Braid and High-mu Foil Shield”, April 2011 28. Energy Facilities Contractor’s Group (EFCOG), Lightning Protection and Grounding Systems Best Practice Design, January 2013 29. Mil-Std-464C, 1 December 2010, Department of Defense Interface Standard, Electromagnetic Environmental Effects, Requirements for Systems 30. Holzworth, R. H., McCarthy, M. P., Brundell, J. B., Jacobson, A. R., & Rodger, C. J. (2019). “Global distribution of superbolts”. Journal of Geophysical Research: Atmospheres, 124, 9996–10,005. https://doi.org/10.1029/2019JD030975, 18 Sep 2019 31. Kenneth L. Cummins, Martin J. Murphy, Jeffrey V. Tuel, Global Atmospherics, Inc. Tucson Arizona, U.S.A.,
“Lightning Detection Methods and Meteorological Applications”, September 26-28, 2000, Malbork, Poland


![WELCOME []...Emp B = $2350 Emp C = $500 Emp C = $3500 Emp D = $1500 Lag Quarter Emp D = $500 Claim filed Emp D = $150 The claimant must have been paid sufficient …](https://img.pdfslide.us/doc/110x75/607bc797dd97122c8938e959/welcome-emp-b-2350-emp-c-500-emp-c-3500-emp-d-1500-lag-quarter.jpg)