Embed Size (px)
Citation preview

Lightning Activity in a Hail-Producing Storm Observed with Phased-Array Radar
C. EMERSIC*
Cooperative Institute for Mesoscale Convective Systems, University of Oklahoma, and NOAA/National
Severe Storms Laboratory, Norman, Oklahoma
P. L. HEINSELMAN AND D. R. MACGORMAN
NOAA/National Severe Storms Laboratory, Norman, Oklahoma
E. C. BRUNING
Cooperative Institute for Climate and Satellites, Earth System Science Interdisciplinary Center,
University of Maryland, College Park, College Park, Maryland
(Manuscript received 30 July 2010, in final form 9 October 2010)
ABSTRACT
This study examined lightning activity relative to the rapidly evolving kinematics of a hail-producing storm
on 15 August 2006. Data were provided by the National Weather Radar Testbed Phased-Array Radar, the
Oklahoma Lightning Mapping Array, and the National Lightning Detection Network.
This analysis is the first to compare the electrical characteristics of a hail-producing storm with the
reflectivity and radial velocity structure at temporal resolutions of less than 1 min. Total flash rates increased
to approximately 220 min21 as the storm’s updraft first intensified, leveled off during its first mature stage, and
then decreased for 2–3 min despite the simultaneous development of another updraft surge. This reduction in
flash rate occurred as wet hail formed in the new updraft and was likely related to the wet growth; wet growth
is not conducive to hydrometeor charging and probably contributed to the formation of a ‘‘lightning hole’’
without a mesocyclone. Total flash rates subsequently increased to approximately 450 min21 as storm volume
and inferred graupel volume increased, and then decreased as the storm dissipated.
The vertical charge structure in the storm initially formed a positive tripole (midlevel negative charge
between upper and lower positive charges). The charge structure in the second updraft surge consisted of
a negative charge above a deep midlevel positive charge, a reversal consistent with the effects of large liquid
water contents on hydrometeor charge polarity in laboratory experiments.
Prior to the second updraft surge, the storm produced two cloud-to-ground flashes, both lowering the usual
negative charge to ground. Shortly before hail likely reached ground, the storm produced four cloud-to-
ground flashes, all lowering the positive charge. Episodes of high singlet VHF sources were observed at
approximately 13–15 km during the initial formation and later intensification of the storm’s updraft.
1. Introduction
This study examines the evolution of lightning activity
in an Oklahoma summertime storm at 2220–2258 UTC
on 15 August 2006 that produced hail aloft but did not
have supercell characteristics. It was chosen for anal-
ysis because of the datasets available from the National
Weather Radar Testbed Phased-Array Radar (NWRT
PAR), which provided sector volume scans in 26 s, and
from the Oklahoma Lightning Mapping Array (LMA),
which mapped lightning inside the cloud in three spa-
tial dimensions with 80-ms temporal resolution and
40–50-m spatial resolution (Thomas et al. 2004). Data
from the National Lightning Detection Network (NLDN)
and National Weather Service soundings also were uti-
lized. This combined dataset allowed us to examine the
* Current affiliation: Centre for Atmospheric Science, Univer-
sity of Manchester, Manchester, United Kingdom.
Corresponding author address: Dr. Pamela Heinselman, National
Severe Storms Laboratory, 120 David L. Boren Blvd., Norman,
OK 73072.
E-mail: [email protected]
JUNE 2011 E M E R S I C E T A L . 1809
DOI: 10.1175/2010MWR3574.1
� 2011 American Meteorological Society

relationships of lightning to evolving storm kinematics
with much higher temporal resolution than has been
possible previously.
A previous study by Heinselman et al. (2008) exam-
ined the detailed evolution of kinematic features of the
storm revealed by NWRT PAR data and described the
environmental conditions that produced the storm; this
paper will focus on the lightning that the storm produced.
Of particular relevance to this paper is Heinselman
et al.’s observation of a strong three-body scatter spike
(TBSS; e.g., Zrnic 1987) and associated 65–75-dBZ re-
flectivity values, which indicated the presence of wet
hail within the storm. The eventual descent of these sig-
natures toward the ground suggests that this was a hail-
storm (see section 3b), even though no confirming reports
of hail reaching ground are available from the rural area
where the storm occurred. Hence, the storm is termed
a hail-producing storm. Even though polarimetric radar
data are unavailable for this storm, it is possible to ex-
amine lightning characteristics associated with the pres-
ence of hail inferred from the TBSS and high-reflectivity
signatures in the NWRT PAR data.
One might expect lightning behavior to be related
to the presence of moderate-to-large hail because the
electrification of storms is thought to be influenced
strongly by ice microphysics. Laboratory studies have
shown that, independent of the ambient electric field,
rebounding collisions between ice crystals and riming
graupel particles transfer enough charge between the
hydrometeors to account for the electric field magni-
tudes observed in thunderstorms (e.g., Takahashi 1978;
Jayaratne et al. 1983; Pereyra et al. 2000; Saunders et al.
2006). Many observational and simulation studies of
storms have also supported the hypothesis that graupel
and ice crystals are the species that play the most vital
role in the electrification of storms and the occurrence
of lightning (e.g., Dye et al. 1988; Ziegler et al. 1991;
Bringi et al. 1997; Black and Hallett 1999; Bruning et al.
2007). The microphysical process responsible for this
charge exchange is still somewhat uncertain, but labo-
ratory studies indicate that mass is transferred during
ice particle collisions, and the particle whose surface is
growing fastest from vapor diffusion at the instant of
collision charges positively on particle separation (the
relative diffusional growth rate mechanism) (Baker et al.
1987; Dash et al. 2001; Mitzeva et al. 2005; Emersic and
Saunders 2010).
Subsequent differential sedimentation of the graupel
and smaller ice particles separates the two charge polar-
ities to produce regions of increasing net charge, which
in turn produce electric fields that can increase to the
point of causing lightning [see the discussion in section
3.4 of MacGorman and Rust (1998)]. Such electric
breakdown is expected to originate between oppositely
charged regions [as discussed, e.g., by MacGorman et al.
(1981), Mansell et al. (2002); Coleman et al. (2003)], con-
sistent with the limited observations of lightning initia-
tions near the boundary between a region of graupel and
surrounding regions of smaller ice particles (e.g., Lund
et al. 2009).
In most thunderstorms, midlevel graupel at the 2158
to 2208C isotherm charges negatively, and ice crystals
positively. Because the lighter ice crystals tend to be
lofted to higher regions, thunderclouds usually contain
an upper positive charge region on small ice particles,
with a midlevel negative charge region sourced by the
heavier falling graupel. Frequently, a lower region of
positive charge is observed that is usually attributed
to graupel charging positively at higher temperatures
(Jayaratne and Saunders 1984). Occasionally, how-
ever, storms are observed with vertical charge structure
opposite to normal (Rust and MacGorman 2002; Yijun
et al. 2002). Although the cause of such a charge struc-
ture is still uncertain, it may be related to a storm’s
microphysics; the most recent published laboratory
studies have shown that the local environment in which
cloud and precipitation ice particles interact strongly
influences the resulting polarity of the graupel charge
(Saunders et al. 2004, 2006; Emersic and Saunders
2010).
Like many severe storms analyzed in the scientific
literature (e.g., Rust et al. 1981; MacGorman et al. 1989;
Carey and Rutledge 1998; Schultz et al. 2009), the hail-
producing storm on 15 August 2006 produced hundreds
of flashes per minute, and the largest, most rapid in-
crease in flash rates occurred near the time large hail
formed. In this paper we use the high temporal resolu-
tion data provided by the NWRT PAR to analyze, more
closely than has been possible with conventional radar
antennas, how flash rates and other lightning charac-
teristics relate to the evolution of storm structure and
hail growth. Our goal is to improve the current un-
derstanding of how storm processes influence lightning
production, in part to determine better which storm
characteristics can be diagnosed from lightning mapping
observations for use by forecasters.
2. Instrumentation
a. National Weather Radar TestbedPhased-Array Radar
The NWRT PAR is a 9.4-cm wavelength, electronically
steered radar located in Norman, Oklahoma (Zrnic et al.
2007). Because this instrument was originally developed
for military purposes, the beam is vertically polarized.
1810 M O N T H L Y W E A T H E R R E V I E W VOLUME 139

Given that a raindrop becomes flatter with increasing
diameter, the magnitude of the reflectivity can be some-
what diminished compared to the reflectivity observed
with a horizontally polarized beam.
This single-faced phased-array system scans a 908 sec-
tor while stationary; the particular 908 sector is selected
by mechanical steering. Stationary scanning eliminates
the beam smearing produced by mechanically scanning
radars. Unlike conventional radars, the beamwidth var-
ies azimuthally: perpendicular to the antenna face (i.e.,
along the bore site) the beamwidth is 1.58; away from the
bore site the beamwidth increases gradually to 2.18. The
range resolution is 240 m and the sensitivity is 5.9 dBZ
at 50 km.
The 15 August 2006 storm studied in this paper is one
of the first scanned by the NWRT PAR. Because data
quality algorithms had not yet been employed, the data
contained some ground clutter, second-trip echo, and
sidelobe contamination. Although these data quality is-
sues can be problematic, Heinselman et al. (2008) noted
that in this case they did not have a significant adverse
impact. Both reflectivity and radial velocity data were
analyzed by Heinselman et al. (2008); only reflectivity
data are shown in this paper.
The primary goal for data collection was to capture
the evolution of a hail-producing storm at higher spatial
and temporal resolutions than were available with the
Weather Surveillance Radar-1988 Doppler (WSR-88D).
Data were collected with a scanning strategy that con-
tained 31 elevation angles ranging from 0.58 to 418. The
volume scan time was decreased to 26 s by employing
a pulse repetition time (PRT) of 831 ms, with 12 pulses
per dwell at each elevation angle. Although reducing
the number of pulses per dwell diminished the accu-
racy of the radial velocity estimates compared to tra-
ditional WSR-88D scans (61 m s21), the errors were
within 62 m s21. The associated Nyquist velocity, ap-
proximately 29 m s21, also reduced the potential for ve-
locity aliasing.
b. Lightning Mapping Array
The design of the Lightning Mapping Array (LMA) is
described by Rison et al. (1999). At each of six or more
stations having 13–23-km baselines between them, the
Oklahoma LMA (OK-LMA) measures the arrival time
of impulsive VHF radiation produced in the channel
3 VHF television band (60–66 MHz) by lightning dis-
charge processes, to locate the sources of VHF radiation
in three spatial dimensions and time (Rison et al. 1999;
MacGorman et al. 2008).
The accuracy of the mapped source locations in the
region of the hail-producing storm we analyzed is expec-
ted to be within 10 m in the horizontal dimension, 30 m
in the vertical dimension, and 40 ns in time (Thomas
et al. 2004). VHF sources detected by fewer than seven
stations, or with a reduced x2 greater than 2, were not
used in this study because their locations were consid-
ered less reliable. The system mapped at most one VHF
source per 80-ms window, giving a maximum rate of ap-
proximately 12 000 s21. The LMA has been used in many
studies to examine the three-dimensional and temporal
structures of lightning during a storm’s lifetime (e.g.,
Krehbiel et al. 2000; Lang et al. 2004; MacGorman et al.
2005; Bruning et al. 2007; Riousset et al. 2007; Kuhlman
et al. 2009).
The polarity and extent of charge through which light-
ning propagated were inferred from the sequence and
density of points mapped by the LMA, as described by
Wiens et al. (2005), Rust et al. (2005), and MacGorman
et al. (2008). Briefly, breakdown processes at the nega-
tive end of the channel (which propagates mostly in re-
gions of positive storm charge) tend to produce stronger
signals in the VHF band than those produced by the
positive end (which propagates mostly in negative charge
regions) and so are almost always the first processes to
be detected in a flash. Because their signals tend to be
stronger, negative breakdown processes produce many
more mapped points. The initial direction of channel
development, the relative density of points, and the se-
quence of later channel development all are used to infer
the charge polarity through which each channel propa-
gates. Additional information about this process is given
by Shao and Krehbiel (1996), Rison et al. (1999), and
MacGorman et al. (2008), and comparisons of the charge
inferred from lightning with charge regions inferred from
electric field soundings are provided by Coleman et al.
(2003), Rust et al. (2005), and MacGorman et al. (2008).
An example of the storm charge inferred from a lightning
flash is shown in Fig. 1.
FIG. 1. An example of using VHF sources mapped by the LMA
to infer the storm charge structure involved in a flash. Negative
breakdown within a positive charge (red dots) leads to many more
VHF sources being detected relative to positive breakdown in
a negative charge (blue dots). The green dots indicate the initial
breakdown of a negative leader, in this case, propagating upward
into a positive charge.
JUNE 2011 E M E R S I C E T A L . 1811

c. Other datasets
NLDN data (Biagi et al. 2007) were used to identify
which flashes struck ground, along with the polarity of
charge lowered to the ground and their ground strike
locations. NLDN detections were compared to LMA
data to help discriminate between cloud and ground
flashes with low peak currents (roughly, less than 15 kA).
Smaller inferred peak currents tend to be associated with
cloud flashes, although some valid ground flashes do have
small peak currents. Thirty-six negative (lowering nega-
tive charge) and four positive flashes (lowering positive
charge) were detected in the data presented here. All
negative ground strikes after 2215 UTC were less than
15 kA and were treated as false detections except where
the LMA showed evidence of a negative leader propa-
gating toward ground at the correct time and location
during the overall flash duration.
This study also made use of the 0000 UTC atmospheric
sounding from the National Weather Service Forecast
Office in Norman, Oklahoma (OUN), on 16 August 2006.
This sounding was chosen because of its proximity in
space (,50 km) and time (1–2 h after) to the storm.
3. Evolution of lightning and inferred stormcharge structure
a. Period 1: First flash rate increase (2220–2234 UTC)
The lightning activity throughout most of the storm’s
lifetime is summarized in Fig. 2. Figure 3 shows a se-
quence of vertical cross sections of reflectivity spanning
most of what is defined here as period 1, which persists
from the storm’s initial radar echo through the first peak
in lightning flash rates. The storm’s initial reflectivity core
was first detected at 2220 UTC, approximately 1 km west
of an existing storm, as shown in the first panel of Fig. 3.
The relatively infrequent lightning flashes shown be-
tween 2210 and 2220 UTC in Figs. 2 and 4 were initiated
by previous storms, including the older storm shown in
Fig. 3. One valid negative ground flash (219.7 kA at
2214:36 UTC) was detected by the NLDN during this
time, with the other lightning flashes likely being cloud
flashes (i.e., flashes that did not reach ground).
The older storm shown in Fig. 3 [at radial distance
19–23 km in panels (a)–(e); 2220:41–2225:53 UTC]
reached its maximum vertical extent and maximum mid-
level reflectivity at 2220–2222 UTC; flash rates increased
between 2218 and 2222 UTC as this storm intensified.
The charge structure inferred from LMA data revealed
that this storm had a classic tripole charge structure, with
a midlevel negative charge sandwiched between upper and
lower positive charges (Fig. 5). The lower positive charge
was between 2 and 5 km MSL, the midlevel negative
charge was between 6 and 9 km MSL, and the upper
positive charge was above 10 km MSL. The environmental
freezing level determined by the 0000 UTC sounding on
16 August 2006 was at an altitude of approximately
4.5 km MSL, with the 2108 and 2208C isotherms lo-
cated at 6.5 and 8.3 km MSL, respectively.
After 2222 UTC, the older storm appeared to be dis-
sipating, as its reflectivity .35 dBZ began decreasing
in maximum height and descending to lower altitudes,
where it expanded horizontally. However, the new storm
to its west grew rapidly during this period and merged
with the dissipating storm. Heinselman et al. (2008) noted
radial divergence aloft and an increasing area and magni-
tude of convergence at low levels during this period, in-
dicative of a strong updraft. In the 8 min following the first
detection of reflectivity in this new storm at 2220 UTC, the
lightning flash rate increased to approximately 220 min21
FIG. 2. The altitude and time of VHF sources mapped by the
LMA. Individual black vertical line–like features denote individual
flashes; during active periods, many such lines merge into general
black regions. Symbols on the horizontal axis represent suspected
ground lightning strike times of a given polarity detected by
NLDN: blue triangles represent negative ground strikes; magenta
crosses represent positive ground strikes. The solid red vertical line
denotes the start of period 1 of the storm, the dashed line repre-
sents the start of period 2, and the dotted–dashed line represents
the start of period 3.
1812 M O N T H L Y W E A T H E R R E V I E W VOLUME 139

FIG. 3. First ;13 min of radar reflectivity data of the hail-producing storm on 15 Aug 2006 constituting period 1 of
the storm; for brevity, one or two volume scans were skipped between each panel shown. Each panel shows a vertical
cross section of reflectivity (dBZ) taken along a 40-km-long line along the azimuth through the storm’s early re-
flectivity core. Increasing horizontal axis values correspond to decreasing distance from the NWRT PAR (0 is ap-
proximately 50 km from the NWRT PAR).
JUNE 2011 E M E R S I C E T A L . 1813

(Fig. 4), as the storm’s reflectivity increased in magni-
tude, altitude, and vertical extent (Fig. 3). Of the flashes
occurring between 2220 and 2234 UTC (Fig. 2), none
were positive ground flashes, and two were negative
ground flashes with peak currents of 27.8 and 29.2 kA
indicated by the NLDN. The LMA data for both of
these ground flashes suggested negative leaders propa-
gating toward the surface, consistent with identifying the
flashes as ground flashes. Such propagation was absent
for 12 other NLDN detections, some of which had slightly
larger peak currents than the two ground strikes we con-
sidered to be valid.
Because of the new storm’s close proximity to the
older storm, it was difficult to tell when the new storm
began initiating lightning, but lightning began involving
the new storm at approximately the time that its 30-dBZ
reflectivity appeared, shortly after 2220 UTC. The 30-dBZ
reflectivity first appeared between 6 and 7 km MSL,
at roughly 2108C, well below the 2208C isotherm at
8.3 km MSL. Having lightning activity begin when a re-
gion of 30-dBZ reflectivity has reached only the 2108C
isotherm is a lesser threshold than has been observed
in many studies, although it is not unprecedented (sec-
tion 7.18 of MacGorman and Rust 1998). Furthermore,
lightning initiated elsewhere may propagate into a storm
before it is electrified enough to initiate lightning itself
(Lund et al. 2009). The location of the storm’s initial re-
flectivity echoes above the freezing level means that ice
was likely present, consistent with ice being important to
cloud charging.
Analysis of LMA data suggests that lightning flashes
that could be identified as beginning within the new storm
often traveled into charge that remained in the older
dissipating storm. The LMA analysis suggests further
that the new storm’s charge structure initially formed
a negative dipole, with a midlevel negative charge above
a lower positive charge. The lower positive charge was
present from the onset of lightning in the new storm
(Fig. 5), initially at an altitude of 3–6 km but increasing
to 4–8 km by 2224 UTC as radar echoes increased to
higher altitudes. Similarly, the height of the midlevel
negative charge was initially 6–8 km and increased to
8–10 km by 2224 UTC. The upper positive charge shown
in Fig. 5 at an altitude of 10–13 km did not become ap-
parent in LMA lightning data until after 2226 UTC, when
20-dBZ reflectivity began to extend above 10 km (Fig. 3).
Between 2226 and 2230 UTC, an upper band of un-
usual VHF radiation sources became visible in the LMA
data at a height of 13–15 km (Fig. 2). This band occurred
shortly after flash rates increased to more than 200 min21
(Fig. 4), after the altitude of the 35-dBZ reflectivity
grew rapidly to 10 km MSL (2223:17–2225:53 UTC in
Fig. 3), and while an adjoining bounded weak-echo re-
gion (BWER) was developing (2225:53–2228:54 UTC in
Fig. 3). Heinselman et al. (2008) reported development
of an area of low- to middle-altitude convergence in the
radial velocity below the BWER during this same pe-
riod. Together these observations indicate that the storm
updraft was intensifying and deepening. The upper band
of VHF radiation consisted of continual single radiation
sources occurring at a rate of several per second, rather
than consisting of the episodic flashes of 10 or more VHF
sources typically found at lower altitudes. The upper
band of VHF radiation existed for only 4 min, ending at
FIG. 4. Time series plot of flash rates determined from OK-LMA
data of the three storm life cycle periods analyzed for this study.
FIG. 5. Summary of the vertical charge structure of the de-
veloping storm inferred from OK-LMA data during each analyzed
period of its lifetime. Box width is not related to the relative spatial
extent of the charge regions; however, height is representative.
1814 M O N T H L Y W E A T H E R R E V I E W VOLUME 139
2230 UTC, when the tallest 35-dBZ turret had begun
dissipating. No radar reflectivities were clearly detected
in the altitude band of the upper VHF sources, but
20-dBZ reflectivities extended up to at least 12 km and it
is possible that still weaker storm reflectivities extended
higher but were obscured by the sidelobe contamination
(Doviak and Zrnic 1993) apparent above the storm dur-
ing this period. Because the upper discharges disappeared
as the tallest 35-dBZ turret began dissipating, it appears
that their disappearance was caused by the cessation of a
strong updraft pulse.
Flash rates stopped their rapid increase and leveled
off between 2226 and 2234 UTC (Figs. 2 and 4). As noted
above, a BWER formed (at radial distance 13–16 km in
Fig. 3) adjacent to the previous storm updraft during this
period, indicative of a new updraft surge (Foote and
Frank 1983). The region of .35-dBZ reflectivity above
the BWER grew rapidly upward, reaching an altitude
of 12 km by the end of the period at 2234 UTC. At
2229 UTC and an altitude of 6–7 km, reflectivity .60 dBZ
and the TBSS began appearing—a signature of wet hail
having formed (e.g., Zrnic 1987). The maximum value of
reflectivity and the depth both of highest reflectivity and
of the TBSS increased in a region slanting downward and
eastward from just above the BWER to the precipitation
core below the older updraft.
From studies relating increasing flash rates to in-
creasing updraft mass flux and to increasing graupel
mass (e.g., Carey and Rutledge 1998, 2000; Wiens et al.
2005; Kuhlman et al. 2006), one might expect that the
flash rate would increase rapidly from 2226 to 2234 UTC
during the development of the BWER and the observed
increase in the height of moderate to large reflectivities
associated with a second updraft pulse. We suggest two
possible reasons why there was only a small increase in
flash rates followed by a decrease to just under 200 min21
during 2234–2236 UTC (Fig. 4), when the storm was still
growing rapidly upward, as will be shown in section 3b.
The first possibility is that the development of a down-
draft in the vicinity of the first updraft surge coincided
with the development of the subsequent updraft surge.
The core of reflectivity .45 dBZ in the region of the first
surge reached ground at approximately 2226 UTC and
began spreading horizontally, until it extended below
the first tower of strong reflectivity and the height of
the tower began falling. As a result, the increase in flash
rate due to storm growth associated with the second
surge may have been offset by the decrease in flash rates
in the vicinity of the downdraft. The second possible
reason is related to the evidence for wet hail growth
during this period. The present paradigm for thunder-
storm electrification is that it primarily involves field-
independent charge exchange during rebounding collisions
of riming graupel and cloud ice in the mixed-phase region
(Saunders et al. 2004; Wiens et al. 2005; Saunders et al.
2006; MacGorman et al. 2008; Emersic and Saunders
2010). If graupel is collecting supercooled water droplets
fast enough to be in surface wet growth, cloud ice col-
liding with it will rarely, if ever, rebound. The implica-
tion is that those parts of the mixed-phase region having
a wet hail signature will produce little, if any, charge
exchange between graupel and cloud ice, as observed in
laboratory studies (Saunders and Brooks 1992; Pereyra
et al. 2000). An additional consequence of increased
collection efficiencies of colliding riming particles dur-
ing wet surface growth conditions, particularly in the
presence of large hail, is that the number of electrically
significant particles will decrease, to further diminish
collision-based charging processes. This interpretation
is bolstered by the relative lack of lightning, sometimes
called a lightning hole, above the BWER in the region
having a wet hail signature (Fig. 6) from 2232 to 2234 UTC.
In this case, the lightning hole is not associated with
a mesocyclone—contrary to all other examples of such
a phenomenon available in the literature to date—but is
associated with the wet hail signature. The scenario of
graupel wet growth is probably the main exception to
the tendency for flash rates to increase with increasing
growth of frozen precipitation in the mixed-phase region.
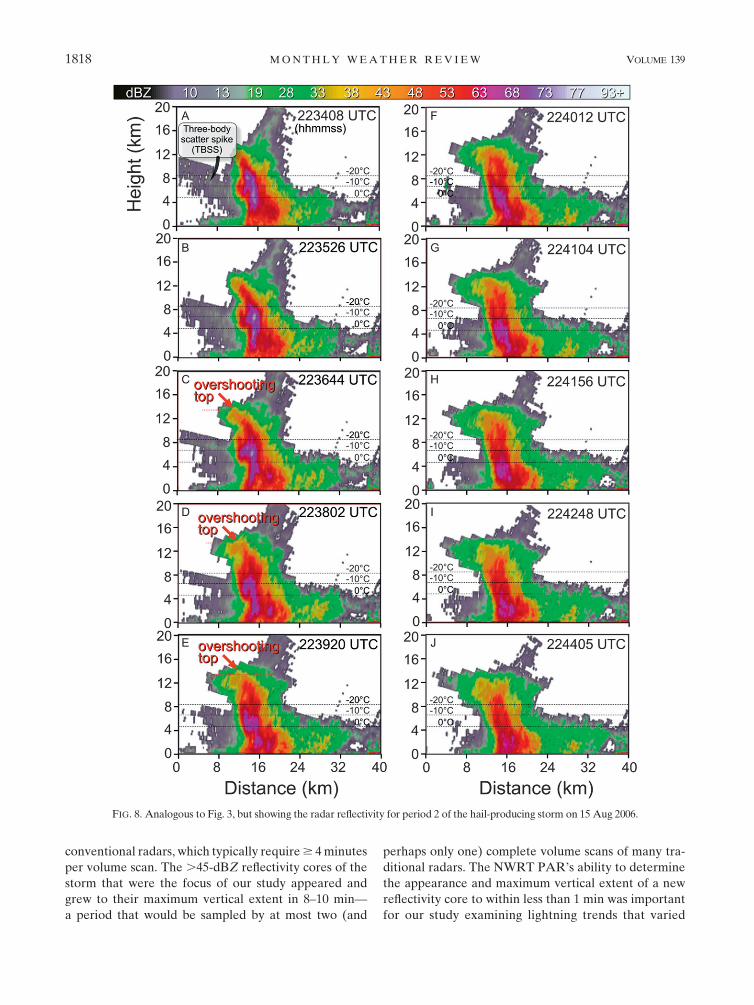
b. Period 2: Second flash rate increase(2234–2244 UTC)
During period 2 (2234:08–2244:05 UTC; Fig. 8) we can
see that the storm grew vertically to its highest altitude.
During 2236:44–2238:02 UTC, the 40-dBZ reflectivity
reached approximately 14 km and the 20-dBZ reflec-
tivity reached 15 km. After 2238:02 UTC, the 40-dBZ
turret subsided to 12 km, while the region of .20-dBZ
reflectivity began spreading horizontally to form an anvil
at 8–14 km, much of the growth being in the volume
having 30–40-dBZ reflectivity. The region of largest re-
flectivity (.65 dBZ) and the TBSS marking the pres-
ence of large, wet hail both descended throughout the
period; the TBSS reached ground and disappeared as
this period ended.
The last updraft surge discussed previously appeared
to change the charge structure of the storm substantially,
but initially only within the updraft region. Instead of
the original upper-level positive charge over a midlevel
negative charge, the new charge structure had an upper-
level negative charge (11–15 km) over a deep midlevel
positive charge (8–11 km) (Fig. 5). In the region elevated
by strong updraft, the lightning involved in this region
initially became vertically compressed at a higher alti-
tude (Fig. 2). The midlevel positive charge region ex-
tended to lower altitudes to the south and east, while
JUNE 2011 E M E R S I C E T A L . 1815

retaining the same maximum altitude (Fig. 5). In a nar-
row (;3 km wide) region east of the BWER, outside the
main updraft, the original positive tripole structure re-
mained. Combined, the charge regions in the new and
old updraft surges produced a horizontal double dipole,
with regions of opposite polarity charge horizontally dis-
placed from each other at the same altitude.
By approximately 2240 UTC, the lofted charge struc-
ture having a negative charge above a positive charge
became prevalent throughout the storm, overwhelming
most of the previous region of upper-level positive charge
over midlevel negative charge. The only remnants of the
previous midlevel negative charge over lower positive
charge were much shallower and lower in the storm, with
negative charge at 5–6 km and positive charge at 4–5 km.
All that was left of the previous upper positive charge
region were some pockets of positive charge embedded
within the new upper negative charge region, but south
and east of the new updraft region (Fig. 5). An analysis
of the lightning channels in the upper storm regions,
above the in-cloud structure of ground flashes, indi-
cated that the channels propagated mainly through nega-
tive storm charge, suggesting that the anvil that formed
around this time became predominantly negatively charged
(Fig. 5).
For most of period 2, from 2236 to 2244 UTC, flash
rates increased rapidly to their largest value of almost
450 min21 at 2242 UTC, more than doubling their pre-
vious value at 2234 UTC (Fig. 4). The large increase in
flash rates probably was related to the large growth ob-
served in the volume of the storm within 8–14 km MSL,
which would be caused, at least in part, by an increase in
the updraft mass flux from levels below 8 km. Similar
relationships among lightning flash rates with the volume
FIG. 6. Plan-view plot of accumulated VHF sources from lightning in 20-s intervals during a 2-min period of the maximum presence of
wet hail inferred from the highest radar reflectivity and a three-body scatter spike. An absence of lightning can be seen within the hail
region giving rise to a net lightning hole. This is the first instance of a lightning hole associated with an inferred wet hail presence instead of
the strong rotating updraft of a mesocyclone.
1816 M O N T H L Y W E A T H E R R E V I E W VOLUME 139
of graupel mass and updraft mass flux have been noted,
for example, by Wiens et al. (2005) and Kuhlman et al.
(2006).
This period produced all four of the storm’s positive
ground strikes and no negative strikes (Fig. 2). The in-
crease in ground flash rates was possibly related to the
increasing volume of precipitation at the middle levels
of the storm, as found by MacGorman et al. (1989, 2007).
The storm’s first positive ground strike was reported on
the northern side of the hail shaft at 2236:08 UTC. Its
low peak current of 115.3 kA and LMA structure more
similar to other negative dipole cloud flashes raise ques-
tions about the flash’s identification by the NLDN as
a cloud-to-ground flash. The remaining positive ground
flashes identified by the NLDN during this period ap-
pear to be correctly identified. Two positive strikes
(peak currents of 1133.9 and 1107.4 kA at 2240:20 and
2240:38 UTC, respectively) arose from positive leaders
propagating through part of the small low region of
negative charge extending southeast of the storm at
5–6 km MSL (Fig. 5). The final positive ground strike
at 2242:17 UTC (peak current 166.6 kA) occurred on the
northern side of the storm. A positive leader propagated
to the surface away from the flash origin at an altitude of
8 km; positive storm charge was generally inferred south
of the flash origin at 5–9 km. The ground strikes during
this time came to the ground at the side of the hail shaft
(Fig. 7), as observed by Changnon (1992). Lightning sim-
ilarly avoided a polarimetric signature of wet growth in
Bruning et al. (2007).
One final observation during this most electrically
active period of the storm’s lifetime was the reemer-
gence of an upper band of continual single VHF radia-
tion sources (Fig. 2). The occurrence of this upper band
of sources coincided well with the period when the storm
had a small overshooting top (Fig. 8). The upper radiation
sources occurred continuously for 4 min, until 2240 UTC,
and ended when the height of the 40-dBZ reflectivity
stopped increasing and began subsiding, and as the 15-dBZ
top began leveling out, with the region of the former
turret becoming almost indistinguishable from the anvil
in reflectivity.
c. Period 3: Flash rate decrease (2244–2258 UTC)
During this period, lightning flash rates diminished
from their peak value to the end of the lightning activity
(Fig. 4). The sequence of vertical cross sections in Fig. 9
shows that the maximum reflectivity and the maximum
height of most reflectivity values decreased steadily
during this dissipation period. The upper band of iso-
lated VHF sources had disappeared by the start of this
period, and the altitude of larger VHF source densities
also decreased (Fig. 2). From the start of this period until
the lightning ceased, analysis of LMA data indicated
that the negative dipole structure from the updraft surge
was prevalent, but that charge regions descended by ap-
proximately 1 km (Figs. 2 and 5). No confirmed ground
flashes occurred during this period.
4. Discussion and summary
This study examined lightning activity during 2218–
2258 UTC on 15 August 2006 in an Oklahoma storm that
produced hail aloft. Rapid scans of reflectivity and radial
velocity were acquired by the National Weather Radar
Testbed Phased-Array Radar (NWRT PAR) in Norman,
Oklahoma. Total lightning activity was mapped in three
dimensions by the Oklahoma Lightning Mapping Array
(LMA), and cloud-to-ground lightning strikes were lo-
cated by the National Lightning Detection Network
(NLDN) and checked by comparing with LMA data.
The 26-s volume scans provided by the NWRT PAR
revealed cycles of storm growth too rapid to be well
resolved in the volume scans of WSR-88D and other
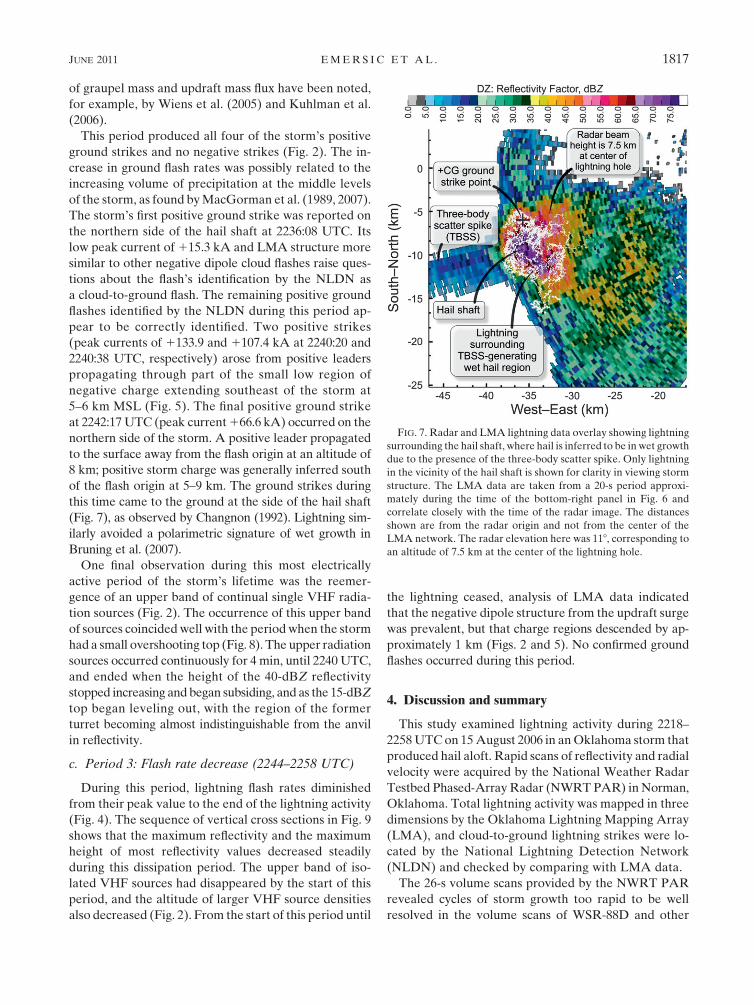
FIG. 7. Radar and LMA lightning data overlay showing lightning
surrounding the hail shaft, where hail is inferred to be in wet growth
due to the presence of the three-body scatter spike. Only lightning
in the vicinity of the hail shaft is shown for clarity in viewing storm
structure. The LMA data are taken from a 20-s period approxi-
mately during the time of the bottom-right panel in Fig. 6 and
correlate closely with the time of the radar image. The distances
shown are from the radar origin and not from the center of the
LMA network. The radar elevation here was 118, corresponding to
an altitude of 7.5 km at the center of the lightning hole.
JUNE 2011 E M E R S I C E T A L . 1817
conventional radars, which typically require $ 4 minutes
per volume scan. The .45-dBZ reflectivity cores of the
storm that were the focus of our study appeared and
grew to their maximum vertical extent in 8–10 min—
a period that would be sampled by at most two (and
perhaps only one) complete volume scans of many tra-
ditional radars. The NWRT PAR’s ability to determine
the appearance and maximum vertical extent of a new
reflectivity core to within less than 1 min was important
for our study examining lightning trends that varied
FIG. 8. Analogous to Fig. 3, but showing the radar reflectivity for period 2 of the hail-producing storm on 15 Aug 2006.
1818 M O N T H L Y W E A T H E R R E V I E W VOLUME 139

markedly over periods of 2–8 min relative to the growth
and dissipation of storms. Prominent observed light-
ning phenomena and their relationship to storm kine-
matics and microphysics are discussed in the following
subsections.
a. High-altitude bands of VHF radiation
One aspect of our study for which high temporal res-
olution NWRT PAR data were important was an anal-
ysis of a transient, upper band of VHF radiation consisting
FIG. 9. Analogous to Fig. 3, but showing the radar reflectivity for period 3 of the hail-producing storm on 15 Aug 2006.
JUNE 2011 E M E R S I C E T A L . 1819

of a fairly steady rate of mostly single isolated VHF
sources, which occurred during two episodes. The initial
occurrence of this band coincided with the initial strong,
vertical growth of the hail-producing storm. The first
upper band of isolated VHF radiation sources began
when the region of 40-dBZ reflectivity reached a maxi-
mum altitude of approximately 10 km, and it ceased as
the maximum height of the 40-dBZ reflectivity began
decreasing in the storm 3–4 min later. (There was no
upper band of VHF radiation for previous storms, which
were shallower.) This VHF radiation occurred at an al-
titude of approximately 13–15 km, above a vertically
growing reflectivity echo, and was 1–4 km above the
highest region of 30-dBZ reflectivity for the entire period
of its occurrence. It appears that the reflectivity at the
location of most upper sources was below the minimum
detectable level of the NWRT PAR, but it is possible that
radar sidelobe contamination obscured some features
near storm top in the vicinity of the upper VHF sources
for at least part of the period.
The second transient upper band of isolated VHF
sources began approximately 6 min later, when the
40-dBZ reflectivity echo of an updraft surge reached its
maximum altitude of approximately 13 km, and again
ended when the larger reflectivities began decreasing
in the upper part of the storm 4 min later. Like the first
band, these VHF sources were at an altitude of ap-
proximately 15 km, but unlike the first band, the 30-dBZ
reflectivity extended up almost to 15 km throughout
the period during which the band occurred. Also unlike
the first band, which appeared abruptly at 15 km, the
second band appeared to be the apex of a rising relative
maximum of lightning density [a feature Ushio et al.
(2003) called a lightning bubble], which had begun rising
2 min earlier from an altitude of approximately 11 km
(Fig. 2). There was also a coincident increase in the max-
imum height of the larger reflectivities. The high temporal
resolution of NWRT PAR allowed us to directly observe
this relationship between the high isolated VHF sources
and the increasing altitude of the storm.
It is not clear from our data what caused this upper
band of continual single radiation sources. The lower
threshold for electric field breakdown at upper altitudes
of the storm probably was a factor. Taylor et al. (1984),
who observed somewhat similar continual, scattered VHF
sources in the upper part of a severe storm, suggested
that the discharges occurred between the uppermost
charge inside the thunderstorm and a screening-layer
charge that formed on the cloud boundary [e.g., section
3.5.4 of MacGorman and Rust (1998)]. Regarding our
observation of lightning in the overshooting top, it is
possible that eddies along the cloud boundary may have
folded the screening-layer charge into the cloud interior
to interact with a charge rising in the updraft and thereby
to produce electric field magnitudes large enough to
cause lightning. Such a possibility is supported by the
observations of Blythe et al. (1988) and Stith (1992), who
used tracers to show that the upper cloud boundary is
entrained into the upper cloud. Polarimetric radar data
or in situ measurements may be needed to shed more
light on this phenomenon.
b. Cloud-to-ground lightning
Only 37 ground flashes were reported by the NLDN
in the storm analyzed here, and only 6 were confidently
verified as ground flashes by comparison with associated
LMA data. Of the six likely ground flashes, the first two
occurred during the first analyzed period of the storm
(see section 3a) and lowered the usual negative charge
to ground (negative ground flashes), with low peak cur-
rents of 27.8 and 29.2 kA (Fig. 2). All four of the ground
flashes that lowered a positive charge (positive ground
flashes, with peak currents of 115.3, 1133.9, 1107.4,
and 166.6 kA, respectively) occurred during the second
analyzed period (see section 3b), when the total flash
rate grew to be much greater than the maximum ob-
served during period 1. The first positive ground flash
occurred approximately 5 min before the main hail re-
gion was inferred from radar data to have reached
ground, with the rest occurring as the hail was reach-
ing ground, a pattern of behavior similar to that ob-
served by MacGorman and Burgess (1994). No further
ground flashes were detected during the rest of the storm’s
lifetime.
As in the cases observed by MacGorman et al. (1981,
1983) and Wiens et al. (2005), lightning channels within
the hail-producing storm analyzed here, including the
in-cloud channels of cloud-to-ground lightning, tended
to avoid a region of wet hail indicated by a TBSS and
radar reflectivity .60 dBZ. Bruning et al. (2007) made
a similar observation of lightning tending to avoid a re-
gion of likely surface wet growth of frozen hydrometeors
but observed this in a small, nonsevere thunderstorm.
Similarly, we observed that lightning tended to strike
ground to the side of the hail shaft, not within the hail
shaft. This finding is consistent with previous studies:
Carey and Rutledge (1998), for example, noted that
ground strike points in a severe Colorado hailstorm
avoided regions of active hail fall. In a study of Illinois
hailstorms, Changnon (1992) found that lightning struck
ground to the sides of hail streaks.
Negative ground flashes were initiated between a mid-
level region of negative charge and a lower region of
positive charge in period 1. Positive ground flashes were
initiated as the storm intensified between a new deep
midlevel region of positive charge and a transient lower
1820 M O N T H L Y W E A T H E R R E V I E W VOLUME 139

region of negative charge through which lightning leaders
propagated to the ground.
The source of the lower positive charge thought to be
necessary for producing most negative ground flashes
(e.g., Jacobson and Krider 1976; MacGorman et al. 2001;
Mansell et al. 2002) has been a matter of some debate.
Marshall and Winn (1982) suggested that the lower pos-
itive charge is deposited by lightning. However, an initial
lower positive charge was present from lightning onset
in the storm we analyzed, as in the storm analyzed by
Bruning et al. (2007) and modeled by Mansell et al. (2010).
It is known from laboratory experiments that graupel
tends to charge positively at higher temperatures (e.g.,
Takahashi 1978; Saunders and Peck 1998; Saunders et al.
2004; Emersic and Saunders 2010). Thus, the lower posi-
tive charge region observed in period 1 of the storm was
most likely caused by graupel that had interacted with
ice crystals in environments warmer than roughly 2108C.
The development of the upper region of positive charge
occurred later in period 1, after the lower two charge
regions had already formed, and is consistent with many
studies and observations suggesting that lighter ice crys-
tals rising in the updraft were the charge carriers for the
uppermost positive charge.
The lower negative charge thought similarly to be
necessary to initiate most positive ground flashes (e.g.,
MacGorman et al. 2001; Mansell et al. 2002) appeared in
this case to be the descending remnant of the previous
midlevel negative charge region as the storm produced
its first downdraft. The positive charge through which
positive ground flashes propagated was the deep mid-
level region of positive charge elevated in the updraft
surge during period 2 and had no low-level charge di-
rectly below it. The greater height of the lowest charge
in the updraft surge is consistent with the elevating ef-
fects of strong updrafts on charge height, as suggested by
MacGorman et al. (1989, 2005, 2007). Several studies
(e.g., Wiens et al. 2005; Williams et al. 2005; Carey and
Buffalo 2007) have suggested that strong broad updrafts
are more conducive to the formation of midlevel posi-
tive charge, because laboratory studies (e.g., Saunders
et al. 2004, 2006; Emersic and Saunders 2010) have
found that graupel tends to gain positive charge when
interacting with ice particles in regions of relatively large
liquid water content, across a broad range of envir-
onmental temperature. MacGorman et al. (2008) noted
that this process would produce a negative dipole charge
structure, but that the midlevel positive charge could
interact with a lower negative charge in adjoining storms
to produce positive ground flashes, as observed in this
case. The complex patterns of temporal and spatial
evolution of the charge regions throughout the storm’s
lifetime is consistent with suggestions that the charge
structure of a storm is not a product just of the charge
generated locally, but also is a result of the history and
transport of charge carriers in the cloud, as noted by
MacGorman et al. (2008), Bruning (2008), and Bruning
et al. (2010).
Many thousands of flashes occurred in this storm, but
less than 1% of the flashes were cloud-to-ground flashes.
Several other studies (e.g., Rust et al. 1981; MacGorman
et al. 1989; Carey and Rutledge 1998; Shafer et al. 2000)
have similarly noted that cloud-to-ground flashes com-
pose only a small percentage of all flashes in many se-
vere storms, particularly in storms whose vertical polarity
of charge structure is opposite to the usual polarity (i.e.,
negative charge is uppermost in the main tripole or di-
pole involved in lightning, instead of the usual positive
charge) or which produce ground flashes lowering a pos-
itive charge to the ground, instead of the usual negative
charge.
MacGorman et al. (1989, 2005, 2007) suggested in other
cases that the small fraction of flashes striking ground
was caused by a severe storm’s very strong updraft. The
strong updraft lifted the formation and growth of the
frozen hydrometeor charge carriers to higher altitudes
than is usual in storms, and caused the resulting charge
to remain relatively high for substantial periods. Be-
cause cloud-to-ground flashes require not only a degree
of electrification strong enough to initiate flashes, but a
configuration of cloud charge that would cause a channel
to propagate to ground, they argued that the higher al-
titude and close proximity of oppositely charged regions
resulting from strong updrafts in severe storms were more
favorable than usual for cloud flashes and less favorable
than usual for the formation of a cloud-to-ground channel.
MacGorman et al. (1989, 2005, 2007) also noted that cloud-
to-ground lightning production may be inhibited in se-
vere storms by the time required to form and transport
downward the precipitation carrying the low-level charge
region, which is needed to initiate lightning from the
oppositely charged midlevel charge region. These ar-
guments are consistent with our findings of substantial
cloud lightning during a time when an elevated and hor-
izontal dipole charge structure was present (Fig. 5), and
with the increased lightning ground flash occurrence
when transient lower charge regions were present as dis-
cussed above.
c. Total lightning relative to kinematicsand microphysics
Our observations at early analysis times indicate that
the extension of lightning to a new storm coincided
with the appearance of a new region of 20–30-dBZ ra-
dar reflectivity above the freezing level—a relationship
suggesting that ice presence was important to the storm’s
JUNE 2011 E M E R S I C E T A L . 1821
electrification processes. Our observations are consis-
tent in that respect with numerous recent observational
and laboratory studies, as discussed in the introduction.
Lightning activity began, however, when the height of
the 30-dBZ reflectivity was below the 2208C isotherm,
the threshold reported by several previous studies of win-
ter thunderstorms in Japan (Michimoto 1991; Kitagawa
1992; Maekawa et al. 1992; Michimoto 1993; Kitagawa
and Michimoto 1994). It also is below the altitude range
postulated by MacGorman et al. (1989) and Ziegler and
MacGorman (1994), who suggested that the interacting
ice hydrometeors needed to be located 7–9 km above
mean sea level (between 2258 and 2408C) before light-
ning would occur.
This discrepancy may not reflect a physical difference
among storms, however, because most of the above-
referenced studies examined the beginning of lightning
production by a storm, while our analysis examined the
initial time lightning involved an updraft pulse that
formed within a few kilometers of an older updraft pulse
that was already producing lightning. The timing we ob-
served suggests that electrification began by the time the
30-dBZ radar reflectivity reached the 2208C isotherm
of the ambient environment (likely corresponding to a
somewhat warmer level in the updraft region) but may
not yet have occurred at a large enough rate to initiate
lightning in an isolated storm when it first reached that
altitude. Lund et al. (2009) showed that a cell embedded
in a small squall line typically became involved in light-
ning at least 10 min before it started initiating lightning
and continued to be involved at least 10 min after it
ceased initiating flashes. This kind of interaction among
cells makes the flash rates and spatial distribution of
lightning appear more continuous than might be ex-
pected from the formation and dissipation of discrete
cells. Because many storms have multiple cells, such sce-
narios are likely common.
We observed two 6–10-min periods of rapid sub-
stantial increases in flash rates. Both would satisfy some
definitions for ‘‘lightning jumps,’’ which have been sug-
gested as flags of storm intensification leading to the in-
creased probability of severe weather (e.g., Williams et al.
1999; Schultz et al. 2009). The first and smaller of the two
increases in flash rates was not related to severe weather
production at all, although it was related to storm growth.
The second increase in flash rates began a few minutes
after the initial appearance of a signature of large, wet
hail formation aloft (a TBSS and reflectivity .60 dBZ)
and several minutes before the hail reached the ground.
However, the process driving the increase in flash rates
probably was not the growth of the large, wet hail itself,
and the coincidence between the peak flash rate and the
hail signature reaching the ground likely was accidental.
In fact, the appearance and initial growth of the region
of wet hail initially corresponded to a leveling off and
a decrease in flash rates, and lightning flashes tended to
avoid the region containing wet hail, probably because
the charge density was smaller there (MacGorman et al.
1981; MacGorman et al. 1983; Williams 1985).
This region of lightning avoidance produced a feature
like the lightning holes noted by earlier studies (Krehbiel
et al. 2000; MacGorman et al. 2005; MacGorman et al.
2008) of supercell storms, but unlike previously reported
cases of lightning holes, the storm analyzed here was not
a supercell storm having a mesocyclone. This is the first
published instance of a lightning hole involving a region
of wet hail instead of a strong rotating updraft.
The flash rate increases coincided with two updraft
pulses inferred from reflectivity and radial velocity ob-
servations, a relationship that is in full agreement with
the findings of several studies (e.g., MacGorman et al.
1989; Ziegler and MacGorman 1994; Williams et al. 1999;
Krehbiel et al. 2000; Goodman et al. 2005; Wiens et al.
2005). Both flash rate increases probably were related to
the observed rapid growth of storm volume and frozen
precipitation, as suggested by these studies. The second
updraft pulse led to a substantially higher flash rate than
the first. This higher flash rate can likely be attributed
to two factors: 1) the more rapid increase in the height
and volume of the storm, which increased the volume of
lightning activity indicated by the LMA data, and 2) the
rapid substantial growth of frozen precipitation (particu-
larly graupel) mass and volume (inferred from the growth
in the volume and magnitude of moderate-to-large re-
flectivities above the freezing level), which would be ex-
pected to increase electrification via field-independent
interactions between graupel and ice crystals. It is also
possible that the large updraft magnitudes inferred from
the rapid vertical storm growth brought what was nor-
mally a lower (midlevel) charge in close proximity to the
midlevel (upper) charge of opposite polarity beside the
updraft, and that the increase in electric field magnitude
from this closer proximity enhanced the lightning pro-
duction rate. Note, too, that all theories for lightning
initiation have a lower threshold of electric field mag-
nitude at higher altitudes, so all else being equal, less
charge is required to initiate lightning at higher altitudes.
Thus, similar charging rates could lead to larger flash
rates in taller storms.
The frequent volume scans provided by the NWRT
PAR demonstrated here that using a peak in flash rates
to identify the time of a relative maximum in storm in-
tensity can be misleading in some circumstances. It is
true that the initial rapid increase in flash rates was in-
dicative of storm intensification, but flash rates subse-
quently increased more slowly and then decreased as the
1822 M O N T H L Y W E A T H E R R E V I E W VOLUME 139

storm’s first downdraft developed and an updraft surge
began simultaneously. The offsetting growth and decay
within the storm probably contributed to the timing of
the peak in flash rates. Another factor was the initial
appearance and growth of a region in which a TBSS and
reflectivity .60 dBZ indicated the growth of wet hail
beginning in the second updraft surge. As discussed pre-
viously, graupel wet growth would not be expected to
contribute to electrification by charge exchange during
collisions with cloud ice, because the cloud ice rarely, if
ever, rebounds under such conditions. The existence of
a local suppression of electrification is supported by the
relatively short-lived lightning hole, which was collo-
cated with the region of wet hail in the mixed-phase
region (Fig. 7). It is also likely that the number of elec-
trically significant particles would be reduced due to
increased particle coalescence in wet growth, and this
would reduce the efficacy of charging processes and
contribute to the lightning hole. Thus, a significant por-
tion of mixed-phase precipitation growth probably did
not contribute to the storm’s electrification during the
period of wet hail growth, and this likely contributed to
the 2-min decrease in flash rates that followed the initial
peak and preceded the second, more rapid increase in
flash rates.
The above relationships suggest that lightning data
provide additional information about storm intensifica-
tion that could be useful to forecasters, with two cautions:
1) As an indication of sudden changes in the updraft
mass flux through the mixed-phase region, rapidly
increasing flash rates can be broadly useful in now-
casting increased potential for severe weather in the
0–20-min time frame; but in much the same way as
hook echoes and mesocyclones are not direct indi-
cators of tornadoes, lightning jumps should not be
confused as an indicator of a severe weather phenom-
enon itself, as noted previously by Williams (2001).
Schultz et al. (2009) show that a suitable algorithm for
detecting lightning jumps can reveal a positive corre-
lation with severe weather reports under at least some
scenarios, even though the electrical measurements
do not directly detect the severe phenomena of in-
terest.
2) One must be somewhat cautious when interpreting
peaks in flash rates. Although each updraft pulse in
a storm contributes additional electrification, the tim-
ing of major inflections, peaks, or minima in lightning
flash rates of the storm overall can depend on the
competing tendencies from coevolving updrafts and
downdrafts in different regions of the storm. Fur-
thermore, one exception to the tendency for increas-
ing electrification during precipitation growth in the
mixed-phase region appears to be the situation in
which the surface of frozen precipitation becomes wet.
Thus, while a large rapid increase in lightning flash
rates reliably indicates the growth of a storm through
and above the mixed-phase region, level or decreas-
ing storm flash rates do not necessarily imply that
updrafts or storms are in steady state or weakening.
Acknowledgments. Funding for this research was pro-
vided by NSF Grants ATM-0813767 and ATM-0233268.
Any opinions, findings, conclusions, or recommendations
expressed in this paper are those of the authors and do
not necessarily reflect the views of the National Science
Foundation. The authors wish to thank Drs. Ron Thomas,
Bill Rison, and Paul Krehbiel for their help with data
analysis, support with the required software and hard-
ware, and assistance in general.
REFERENCES
Baker, B., M. B. Baker, E. R. Jayaratne, J. Latham, and
C. P. R. Saunders, 1987: The influence of diffusional growth
rates on the charge transfer accompanying rebounding col-
lisions between ice crystals and soft hailstones. Quart. J. Roy.
Meteor. Soc., 113, 1193–1215.
Biagi, C. J., K. L. Cummins, K. E. Kehoe, and E. P. Krider, 2007:
National Lightning Detection Network (NLDN) performance
in southern Arizona, Texas, and Oklahoma in 2003–2004.
J. Geophys. Res., 112, D05208, doi:10.1029/2006JD007341.
Black, R. A., and J. Hallett, 1999: Electrification of the hurricane.
J. Atmos. Sci., 56, 2004–2028.
Blythe, A. M., W. A. Cooper, and J. B. Jensen, 1988: A study of the
source of entrained air in Montana cumuli. J. Atmos. Sci., 45,
3944–3964.
Bringi, V. N., K. Knupp, A. Detwiler, L. Liu, I. J. Caylor, and
R. A. Black, 1997: Evolution of a Florida thunderstorm
during the Convection and Precipitation/Electrification Ex-
periment: The case of 9 August 1991. Mon. Wea. Rev., 125,2131–2160.
Bruning, E. C., 2008: Charging regions, regions of charge, and
storm structure in a partially inverted polarity supercell
thunderstorm. Ph.D. dissertation, University of Oklahoma,
114 pp.
——, W. D. Rust, T. J. Schuur, D. R. MacGorman, P. R. Krehbiel,
and W. Rison, 2007: Electrical and polarimetric radar obser-
vations of a multicell storm in TELEX. Mon. Wea. Rev., 135,
2525–2544.
——, ——, D. R. MacGorman, M. I. Biggerstaff, and T. J. Schuur,
2010: Formation of charge structures in a supercell. Mon. Wea.
Rev., 138, 3740–3761.
Carey, L. D., and S. A. Rutledge, 1998: Electrical and multipa-
rameter radar observations of a severe hailstorm. J. Geophys.
Res., 103, 13 979–14 000.
——, and ——, 2000: Relationship between precipitation and
lightning in tropical island convection: A C-band polarimetric
radar study. Mon. Wea. Rev., 128, 2687–2710.
——, and K. M. Buffalo, 2007: Environmental control of cloud-to-
ground lightning polarity in severe storms. Mon. Wea. Rev.,
135, 1327–1353.
JUNE 2011 E M E R S I C E T A L . 1823

Changnon, S. A., 1992: Temporal and spatial relations between hail
and lightning. J. Appl. Meteor., 31, 587–604.
Coleman, L. M., T. C. Marshall, M. Stolzenburg, T. Hamlin,
P. R. Krehbiel, W. Rison, and R. J. Thomas, 2003: Effects of
charge and electrostatic potential on lightning propagation.
J. Geophys. Res., 108, 4298, doi:10.1029/2002JD002718.
Dash, J. G., B. L. Mason, and J. S. Wettlaufer, 2001: Theory of
charge and mass transfer in ice–ice collisions. J. Geophys. Res.,
106, 20 395–20 402.
Doviak, R. J., and D. S. Zrnic, 1993: Doppler Radar and Weather
Observations. Academic Press, 562 pp.
Dye, J. E., J. J. Jones, A. J. Weinheimer, and W. P. Winn, 1988:
Observations within two regions of charge during initial thun-
derstorm electrification. Quart. J. Roy. Meteor. Soc., 114, 1271–
1290.
Emersic, C., and C. P. R. Saunders, 2010: Further laboratory in-
vestigations into the relative diffusional growth rate theory
of thunderstorm electrification. Atmos. Res., 98, 327–340,
doi:10.1016/j.atmosres.2010.07.011.
Foote, G. B., and H. W. Frank, 1983: Case study of a hailstorm
in Colorado. Part III: Airflow from triple-Doppler measure-
ments. J. Atmos. Sci., 40, 686–707.
Goodman, S. J., and Coauthors, 2005: The North Alabama Light-
ning Mapping Array: Recent severe storm observations and
future prospects. Atmos. Res., 76, 423–437.
Heinselman, P. L., D. L. Priegnitz, K. L. Manross, T. M. Smith, and
R. W. Adams, 2008: Rapid sampling of severe storms by the
National Weather Radar Testbed Phased Array Radar. Wea.
Forecasting, 23, 808–824.
Jacobson, E. A., and E. P. Krider, 1976: Electrostatic field changes
produced by Florida lightning. J. Atmos. Sci., 33, 103–117.
Jayaratne, E. R., and C. P. R. Saunders, 1984: The ‘‘rain-gush’’,
lightning, and the lower positive charge center in thunder-
storms. J. Geophys. Res., 89, 11 816–11 818.
——, ——, and J. Hallett, 1983: Laboratory studies of the charging
of soft-hail during ice crystal interactions. Quart. J. Roy. Me-
teor. Soc., 109, 609–630.
Kitagawa, N., 1992: Charge distribution of winter thunderstorms.
Res. Lett. Atmos. Electr., 12, 143–153.
——, and K. Michimoto, 1994: Meteorological and electrical as-
pects of winter thunderclouds. J. Geophys. Res., 99, 10 713–
10 721.
Krehbiel, P. R., R. J. Thomas, W. Rison, T. Hamlin, J. Harlin, and
M. Davis, 2000: GPS-based mapping system reveals light-
ning inside storms. Eos, Trans. Amer. Geophys. Union, 81,
21–25.
Kuhlman, K. M., C. L. Ziegler, E. R. Mansell, D. R. MacGorman,
and J. M. Straka, 2006: Numerically simulated electrification
and lightning of the 29 June 2000 STEPS supercell storm.
Mon. Wea. Rev., 134, 2734–2757.
——, D. R. MacGorman, M. I. Biggerstaff, and P. R. Krehbiel,
2009: Lightning initiation in the anvil of supercell storms.
Geophys. Res. Lett., 36, L07802, doi:10.1029/2008GL036650.
Lang, T. J., and Coauthors, 2004: The Severe Thunderstorm
Electrification and Precipitation Study. Bull. Amer. Meteor.
Soc., 85, 1107–1125.
Lund, N., D. R. MacGorman, T. J. Schuur, M. I. Biggerstaff, and
W. D. Rust, 2009: Relationships between lightning location
and polarimetric radar signatures in a small mesoscale con-
vective system. Mon. Wea. Rev., 137, 4151–4170.
MacGorman, D. R., and D. W. Burgess, 1994: Positive cloud-to-
ground lightning in tornadic storms and hailstorms. Mon. Wea.
Rev., 122, 1671–1697.
——, and W. D. Rust, 1998: The Electrical Nature of Storms. Ox-
ford University Press, 442 pp.
——, A. A. Few, and T. L. Teer, 1981: Layered lighting activity.
J. Geophys. Res., 86, 9900–9910.
——, W. L. Taylor, and A. A. Few, 1983: Lightning location from
acoustic and VHF techniques relative to storm structure
from 10 cm radar. Proceedings in Atmospheric Electricity,
L. H. Ruhnke and J. Latham, Eds., A. Deepak Publishing,
377–380.
——, D. W. Burgess, V. Mazur, W. D. Rust, W. L. Taylor, and
B. C. Johnson, 1989: Lightning rates relative to tornadic storm
evolution on 22 May 1981. J. Atmos. Sci., 46, 221–250.
——, J. M. Straka, and C. L. Ziegler, 2001: A lightning parame-
terization for numerical cloud models. J. Appl. Meteor., 40,
459–478.
——, W. D. Rust, P. Krehbiel, W. Rison, E. Bruning, and K. Wiens,
2005: The electrical structure of two supercell storms during
STEPS. Mon. Wea. Rev., 133, 2583–2607.
——, T. Filiaggi, R. L. Holle, and R. A. Brown, 2007: Negative
cloud-to-ground lightning flash rates relative to VIL, maxi-
mum reflectivity, cell height, and cell isolation. J. Lightning
Res., 1, 132–147.
——, and Coauthors, 2008: TELEX: The Thunderstorm Electrifi-
cation and Lightning Experiment. Bull. Amer. Meteor. Soc.,
89, 997–1013.
Maekawa, Y., S. Fukao, Y. Sonoi, and F. Yoshino, 1992: Dual
polarization radar observations of anomalous wintertime thun-
derclouds in Japan. IEEE Trans. Geosci. Remote Sens., 30,
838–844.
Mansell, E. R., D. R. MacGorman, J. M. Straka, and C. L. Ziegler,
2002: Simulated three-dimensional branched lightning in a
numerical thunderstorm model. J. Geophys. Res., 107, 4075,
doi:10.1029/2000JD000244.
——, C. L. Ziegler, and E. C. Bruning, 2010: Simulated electrifi-
cation of a small thunderstorm with two-moment bulk mi-
crophysics. J. Atmos. Sci., 67, 171–194.
Marshall, T. C., and W. P. Winn, 1982: Measurements of charged
precipitation in a New Mexico thunderstorm: Lower positive
charge centers. J. Geophys. Res., 87, 7141–7157.
Michimoto, K., 1991: A study of radar echoes and their relation to
lightning discharge of thunderclouds in the Hokuriku district.
Part I: Observation and analysis of thunderclouds in summer
and winter. J. Meteor. Soc. Japan, 69, 327–335.
——, 1993: A study of radar echoes and their relation to lightning
discharge of thunderclouds in the Hokuriku district. Part II:
Observation and analysis of ‘‘single-flash’’ thunderclouds in
midwinter. J. Meteor. Soc. Japan, 71, 195–204.
Mitzeva, R. P., C. P. R. Saunders, and B. Tsenova, 2005: A mod-
elling study of the effect of cloud saturation and particle growth
rates on charge transfer in thunderstorm electrification. Atmos.
Res., 76, 206–221.
Pereyra, R. G., E. E. Avila, N. E. Castellano, and C. P. R. Saunders,
2000: A laboratory study of graupel charging. J. Geophys. Res.,
105, 20 803–20 812.
Riousset, J. A., V. P. Pasko, P. R. Krehbiel, R. J. Thomas, and
W. Rison, 2007: Three-dimensional fractal modeling of in-
tracloud lightning discharge in a New Mexico thunderstorm
and comparison with lightning mapping observations. J. Geo-
phys. Res., 112, D15203, doi:10.11029/12006JD007621.
Rison, W., R. J. Thomas, P. R. Krehbiel, T. Hamlin, and J. Harlin,
1999: A GPS-based three-dimensional lightning mapping
system: Initial observations in central New Mexico. Geophys.
Res. Lett., 26, 3573–3576.
1824 M O N T H L Y W E A T H E R R E V I E W VOLUME 139

Rust, W. D., and D. R. MacGorman, 2002: Possibly inverted-
polarity electrical structures in thunderstorms during STEPS.
Geophys. Res. Lett., 29, 1571, doi:10.1029/2001GL014303.
——, W. L. Taylor, D. R. MacGorman, and R. T. Arnold, 1981:
Research on electrical properties of severe thunderstorms in
the Great Plains. Bull. Amer. Meteor. Soc., 62, 1286–1293.
——, and Coauthors, 2005: Inverted-polarity electrical structures
in thunderstorms in the Severe Thunderstorm Electrification
and Precipitation Study (STEPS). Atmos. Res., 76, 247–271.
Saunders, C. P. R., and I. M. Brooks, 1992: The effects of high
liquid water content on thunderstorm charging. J. Geophys.
Res., 97, 14 671–14 676.
——, and S. L. Peck, 1998: Laboratory studies of the influence of
the rime accretion rate on charge transfer during crystal/
graupel collisions. J. Geophys. Res., 103, 13 949–13 956.
——, H. Bax-Norman, E. E. Avila, and N. E. Castellano, 2004: A
laboratory study of the influence of ice crystal growth condi-
tions on subsequent charge transfer in thunderstorm electri-
fication. Quart. J. Roy. Meteor. Soc., 130, 1395–1406.
——, ——, C. Emersic, E. E. Avila, and N. E. Castellano, 2006:
Laboratory studies of the effect of cloud conditions on graupel/
crystal charge transfer in thunderstorm electrification. Quart.
J. Roy. Meteor. Soc., 132, 2653–2673.
Schultz, C. J., W. A. Petersen, and L. D. Carey, 2009: Preliminary
development and evaluation of lightning jump algorithms for
the real-time detection of severe weather. J. Appl. Meteor.
Climatol., 48, 2543–2563.
Shafer, M. A., D. R. MacGorman, and F. H. Carr, 2000: Cloud-to-
ground lightning throughout the lifetime of a severe storm
system in Oklahoma. Mon. Wea. Rev., 128, 1798–1716.
Shao, X. M., and P. R. Krehbiel, 1996: The spatial and temporal
development of intracloud lightning. J. Geophys. Res., 101,
26 641–26 668.
Stith, J. L., 1992: Observations of cloud-top entrainment in cumuli.
J. Atmos. Sci., 49, 1334–1347.
Takahashi, T., 1978: Riming electrification as a charge generation
mechanism in thunderstorms. J. Atmos. Sci., 35, 1536–1548.
Taylor, W. L., E. A. Brandes, W. D. Rust, and D. R. MacGorman,
1984: Lightning activity and severe storm structure. Geophys.
Res. Lett., 11, 545–548.
Thomas, R. J., P. R. Krehbiel, W. Rison, S. J. Hunyady, W. P. Winn,
T. Hamlin, and J. Harlin, 2004: Accuracy of the Lightning
Mapping Array. J. Geophys. Res., 109, D14207, doi:10.1029/
2004JD004549.
Ushio, T., S. J. Heckman, H. J. Christian, and Z. I. Kawasaki, 2003:
Vertical development of lightning activity observed by the
LDAR system: Lightning bubbles. J. Appl. Meteor., 42, 165–174.
Wiens, K. C., S. A. Rutledge, and S. A. Tessendorf, 2005: The 29
June 2000 supercell observed during STEPS. Part II: Lightning
and charge structure. J. Atmos. Sci., 62, 4151–4177.
Williams, E. R., 1985: Electrical discharge propagation in and
around space charge clouds. J. Geophys. Res., 90, 6059–6070.
——, 2001: The electrification of severe storms. Severe Convective
Storms, Meteor. Monogr., No. 50, 527–561.
——, and Coauthors, 1999: The behavior of total lightning activity
in severe Florida thunderstorms. Atmos. Res., 51, 245–265.
——, V. Mushtak, D. Rosenfeld, S. Goodman, and D. Boccippio,
2005: Thermodynamic conditions favorable to superlative
thunderstorm updraft, mixed phase microphysics and light-
ning flash rate. Atmos. Res., 76, 288–306.
Yijun, Z., P. R. Krehbiel, and L. Xinsheng, 2002: Polarity inverted
intracloud discharges and electric charge structure of thun-
derstorm. Chin. Sci. Bull., 47, 1725–1729.
Ziegler, C. L., and D. R. MacGorman, 1994: Observed lightning
morphology relative to modeled space charge and electric field
distributions in a tornadic storm. J. Atmos. Sci., 51, 833–851.
——, ——, P. S. Ray, and J. E. Dye, 1991: A model evaluation of
non-inductive graupel–ice charging in the early electrification
of a mountain thunderstorm. J. Geophys. Res., 96, 12 833–
12 855.
Zrnic, D. S., 1987: Three-body scattering produces precipitation
signature of special diagnostic-value. Radio Sci., 22, 76–86.
——, and Coauthors, 2007: Agile-beam phased array radar for
weather observations. Bull. Amer. Meteor. Soc., 88, 1753–1766.
JUNE 2011 E M E R S I C E T A L . 1825