Embed Size (px)
Citation preview
LIGHT UP THE WORLD
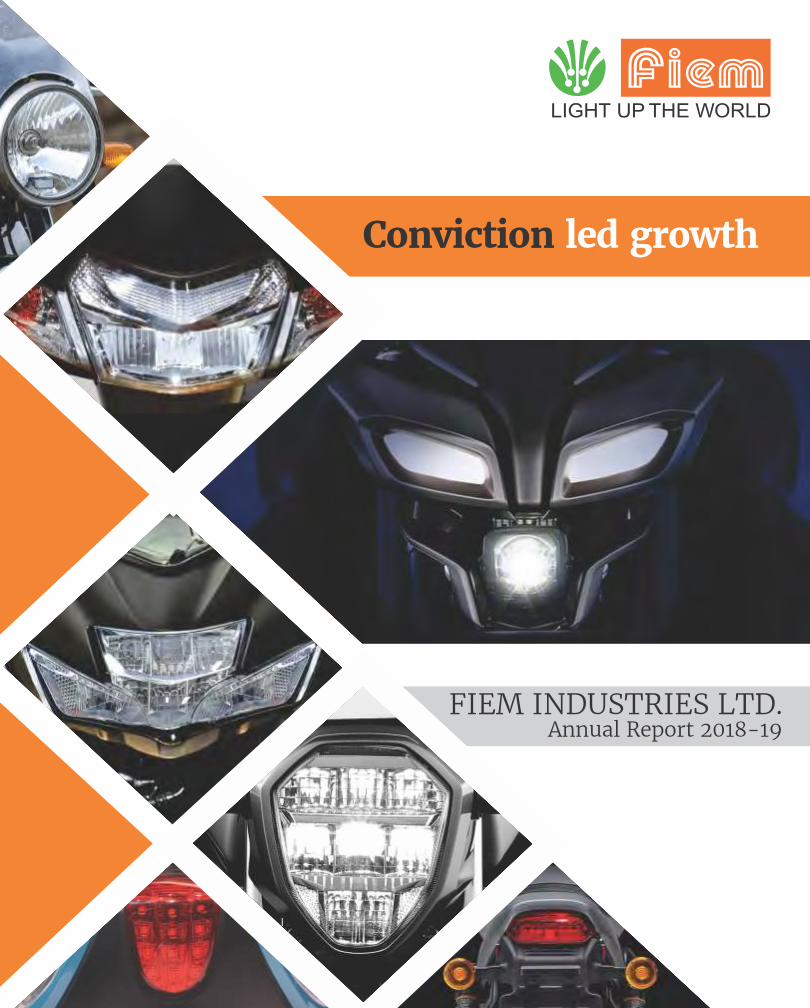
Conviction led growth
FIEM INDUSTRIES LTD.Annual Report 2018-19
LIGHT UP THE WORLD
Fiem Industries limitedCIN: L36999DL1989PLC034928
Registered Office:
D-34, DSIDC Packaging Complex,
Kirti Nagar, New Delhi - 110015, India
Email: [email protected]
Tel. : +91-11-25927820, 25927919 | Fax : +91-11-25927740
Unit - VII & Corporate Office:
Plot No. 1915, Rai Industrial Estate,
Phase-V, Sonepat - 131029 (Haryana) India
Tel. : +91-130-2367905/906/907/909/910
Delhi Head Office:
Unit No. 1A & 1C, 1st Floor, Commercial Towers,
JW Marriott Hotel, Aerocity, New Delhi-110037
Tel. : 9821795327/28/29/30
Website: www.fiemindustries.com
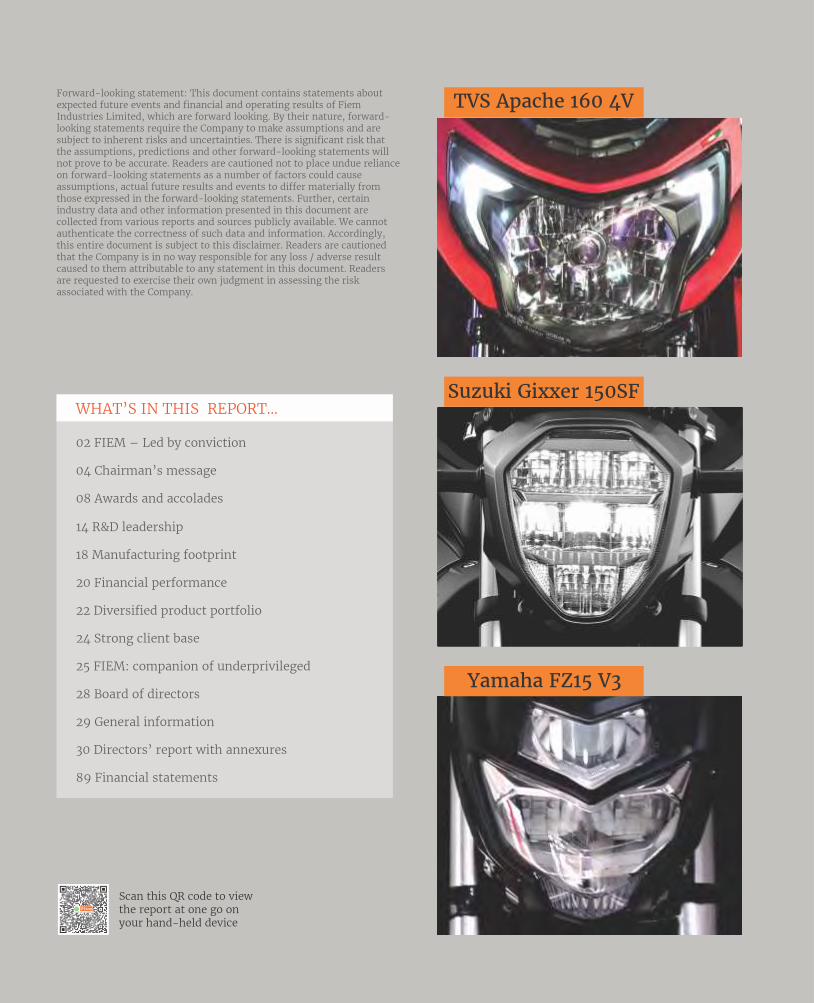
TVS Apache 160 4V
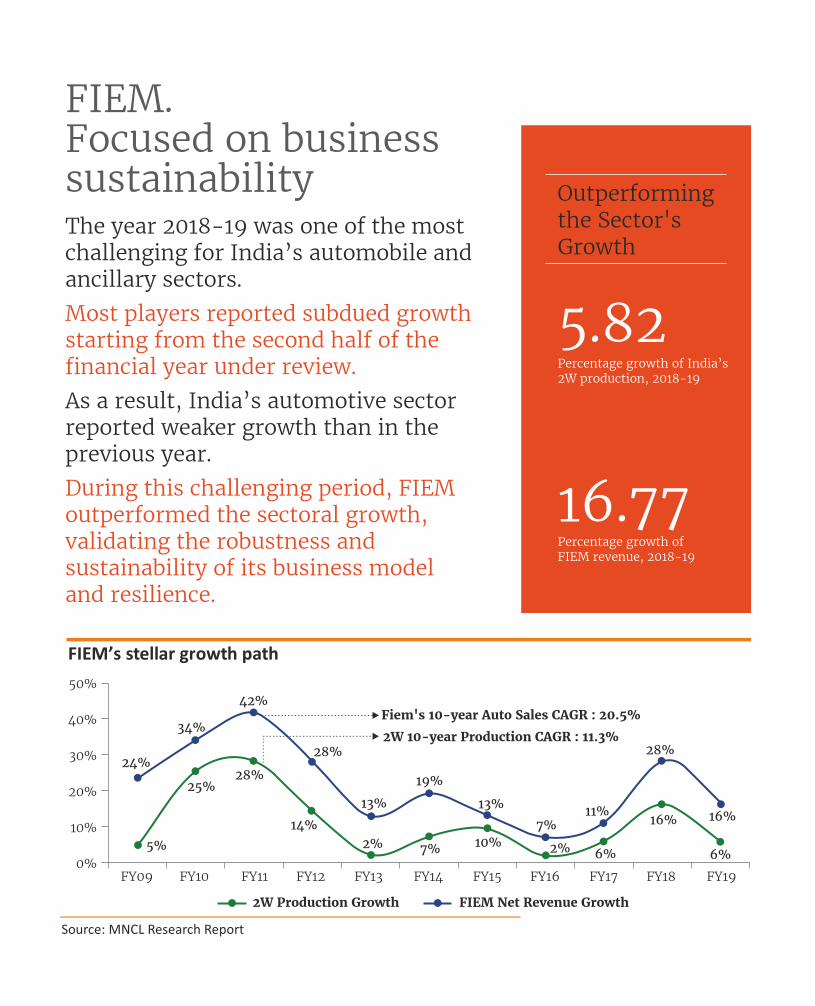
Suzuki Gixxer 150SF
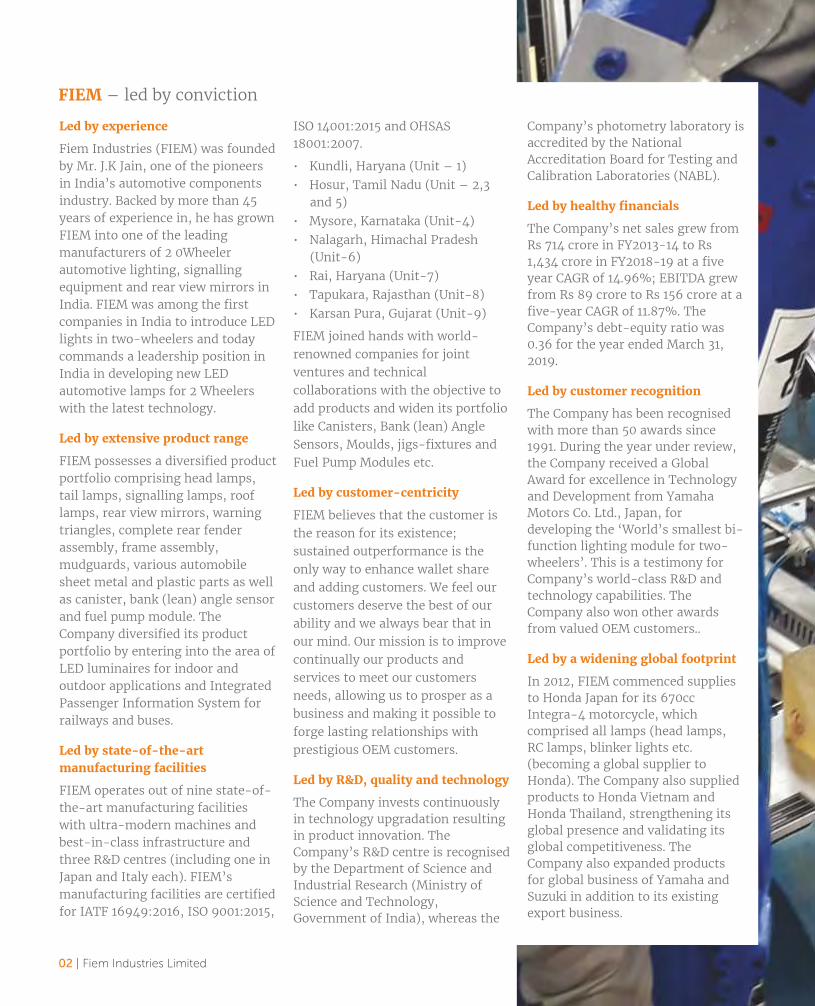
Yamaha FZ15 V3
Forward-looking statement: This document contains statements about
expected future events and financial and operating results of Fiem
Industries Limited, which are forward looking. By their nature, forward-
looking statements require the Company to make assumptions and are
subject to inherent risks and uncertainties. There is significant risk that
the assumptions, predictions and other forward-looking statements will
not prove to be accurate. Readers are cautioned not to place undue reliance
on forward-looking statements as a number of factors could cause
assumptions, actual future results and events to differ materially from
those expressed in the forward-looking statements. Further, certain
industry data and other information presented in this document are
collected from various reports and sources publicly available. We cannot
authenticate the correctness of such data and information. Accordingly,
this entire document is subject to this disclaimer. Readers are cautioned
that the Company is in no way responsible for any loss / adverse result
caused to them attributable to any statement in this document. Readers
are requested to exercise their own judgment in assessing the risk
associated with the Company.
Scan this QR code to view the report at one go on your hand-held device
WHAT’S IN THIS REPORT...
02 FIEM – Led by conviction
04 Chairman’s message
08 Awards and accolades
LIGHT UP THE WORLD
14 R&D leadership
18 Manufacturing footprint
20 Financial performance
22 Diversified product portfolio
24 Strong client base
25 FIEM: companion of underprivileged
28 Board of directors
29 General information
30 Directors’ report with annexures
89 Financial statements
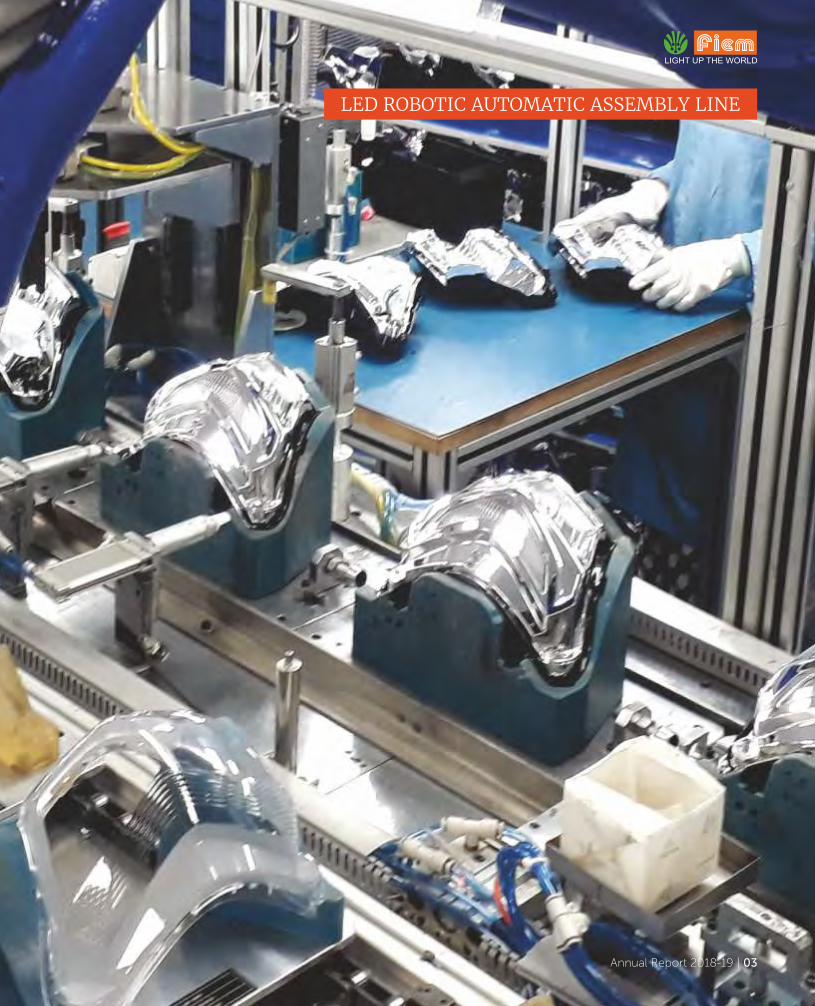
FIEM. Focused on business sustainabilityThe year 2018-19 was one of the most
challenging for India’s automobile and ancillary sectors.
Most players reported subdued growth starting from the second half of the financial year under review.
As a result, India’s automotive sector reported weaker growth than in the previous year.
During this challenging period, FIEM outperformed the sectoral growth, validating the robustness and sustainability of its business model and resilience.
50%
40%
30%
20%
10%
0%FY09 FY10 FY11 FY12 FY13 FY14 FY15 FY16 FY17 FY18 FY19
24%
34%
42%
28%
13%
19%
13%
7% 11%
28%
16%
5%
25% 28%
14%
2% 7% 10% 2% 6%
16%
6%
Fiem's 10-year Auto Sales CAGR : 20.5%
2W 10-year Production CAGR : 11.3%
2W Production Growth FIEM Net Revenue Growth
FIEM’s stellar growth path
Source: MNCL Research Report
Outperforming
the Sector's
Growth
5.82Percentage growth of India’s
2W production, 2018-19
16.77Percentage growth of
FIEM revenue, 2018-19
Led by experience
Fiem Industries (FIEM) was founded
by Mr. J.K Jain, one of the pioneers
in India’s automotive components
industry. Backed by more than 45
years of experience in, he has grown
FIEM into one of the leading
manufacturers of 2 0Wheeler
automotive lighting, signalling
equipment and rear view mirrors in
India. FIEM was among the first
companies in India to introduce LED
lights in two-wheelers and today
commands a leadership position in
India in developing new LED
automotive lamps for 2 Wheelers
with the latest technology.
Led by extensive product range
FIEM possesses a diversified product
portfolio comprising head lamps,
tail lamps, signalling lamps, roof
lamps, rear view mirrors, warning
triangles, complete rear fender
assembly, frame assembly,
mudguards, various automobile
sheet metal and plastic parts as well
as canister, bank (lean) angle sensor
and fuel pump module. The
Company diversified its product
portfolio by entering into the area of
LED luminaires for indoor and
outdoor applications and Integrated
Passenger Information System for
railways and buses.
Led by state-of-the-art
manufacturing facilities
FIEM operates out of nine state-of-
the-art manufacturing facilities
with ultra-modern machines and
best-in-class infrastructure and
three R&D centres (including one in
Japan and Italy each). FIEM’s
manufacturing facilities are certified
for IATF 16949:2016, ISO 9001:2015,
ISO 14001:2015 and OHSAS
18001:2007.
• Kundli, Haryana (Unit – 1)
• Hosur, Tamil Nadu (Unit – 2,3
and 5)
• Mysore, Karnataka (Unit-4)
• Nalagarh, Himachal Pradesh
(Unit-6)
• Rai, Haryana (Unit-7)
• Tapukara, Rajasthan (Unit-8)
• Karsan Pura, Gujarat (Unit-9)
FIEM joined hands with world-
renowned companies for joint
ventures and technical
collaborations with the objective to
add products and widen its portfolio
like Canisters, Bank (lean) Angle
Sensors, Moulds, jigs-fixtures and
Fuel Pump Modules etc.
Led by customer-centricity
FIEM believes that the customer is
the reason for its existence;
sustained outperformance is the
only way to enhance wallet share
and adding customers. We feel our
customers deserve the best of our
ability and we always bear that in
our mind. Our mission is to improve
continually our products and
services to meet our customers
needs, allowing us to prosper as a
business and making it possible to
forge lasting relationships with
prestigious OEM customers.
Led by R&D, quality and technology
The Company invests continuously
in technology upgradation resulting
in product innovation. The
Company’s R&D centre is recognised
by the Department of Science and
Industrial Research (Ministry of
Science and Technology,
Government of India), whereas the
Company’s photometry laboratory is
accredited by the National
Accreditation Board for Testing and
Calibration Laboratories (NABL).
Led by healthy financials
The Company’s net sales grew from
Rs 714 crore in FY2013-14 to Rs
1,434 crore in FY2018-19 at a five
year CAGR of 14.96%; EBITDA grew
from Rs 89 crore to Rs 156 crore at a
five-year CAGR of 11.87%. The
Company’s debt-equity ratio was
0.36 for the year ended March 31,
2019.
Led by customer recognition
The Company has been recognised
with more than 50 awards since
1991. During the year under review,
the Company received a Global
Award for excellence in Technology
and Development from Yamaha
Motors Co. Ltd., Japan, for
developing the ‘World’s smallest bi-
function lighting module for two-
wheelers’. This is a testimony for
Company’s world-class R&D and
technology capabilities. The
Company also won other awards
from valued OEM customers..
Led by a widening global footprint
In 2012, FIEM commenced supplies
to Honda Japan for its 670cc
Integra-4 motorcycle, which
comprised all lamps (head lamps,
RC lamps, blinker lights etc.
(becoming a global supplier to
Honda). The Company also supplied
products to Honda Vietnam and
Honda Thailand, strengthening its
global presence and validating its
global competitiveness. The
Company also expanded products
for global business of Yamaha and
Suzuki in addition to its existing
export business.
FIEM – led by conviction
02 | Fiem Industries Limited
Annual Report 2018-19 | 03
LED ROBOTIC AUTOMATIC ASSEMBLY LINE

CHAIRMAN’S MESSAGE
04 | Fiem Industries Limited

Company’s leadership position.
Going forward, your Company will
focus on the core two-wheeler
business based on long-term
optimism.
During the year under review,
India’s two-wheeler industry was
marked by challenges and
constraints. These comprised a five
year mandatory insurance, ABS, CBS
and impending BS-VI norms. These
regulatory norms have increased the
cost of two-wheelers; a further
impact is yet to materialize
following the implementation of BS-
VI norms. Besides, the default of a
non-banking financial institution in
2018-19 staggered the financing of
Consolidated PAT was Rs. 55.64 Cr
during FY2018-19 as against Rs
52.56 Cr in FY2017-18. The company
declared a dividend of 120% or Rs12
per share for the year under review,
which represented a payout of 34%
of profits.
The company’s outperformance
during the year under review was
driven by the launch of a new LED
auto model and increased wallet
share across existing customers. The
company’s principal accounts
continued to grow; revenues from
Yamaha and Suzuki grew 82% and
67% respectively while modest
growth was maintained with Honda
and TVS.
Your Company is pleased to report
that it continued to be a preferred
supplier to OEMs during the year
under review. Your Company
supplied products to more than 35
domestic and global OEMs including
leading market share with key
OEMs. Your Company continued to
account for leading market share
with some of the most prominent
customers validating your
After reasonably strong
growth in the first half of the
year, economic growth
slowed visibly in the second half.
The result was a liquidity paralysis,
which translated into a weaker
consumer sentiment that affected
the offtake of a variety of products
and services. The growth within the
Indian economy declined quarter on
quarter, touching the slowest in the
fourth quarter of 2018-19 at 5.8%,
the weakest in years. As a result, the
overall growth of the Indian
economy was 6.8% during 2018-19,
40 bps lower than the previous year.
The impact of the slowdown was
perceptible on the country’s
automobile sector. The two-wheeler
industry was not spared, reporting a
growth of 6.29% during the year
under review against 15.44% in
FY2017-18 while domestic offtake
growth of two-wheelers was even
slower at 4.86%.
Despite a challenging environment,
your company reported 16.77%
growth in revenues, 10.83% growth
in EBIDTA and 7.6% growth in PAT.
The year 2018-19 proved to be a challenging year for the Indian economy.
5.82Percentage growth of
India’s 2W production,
2018-19
Annual Report 2018-19 | 05
received the Global Award from
Yamaha Motor Company, Japan, for
Excellence in Technology and
Development. We developed the
world’s smallest bi-functional LED
lighting module for two-wheelers.
Validating the Company’s
credentials in partnering some of
the most respected global companies
in cutting-edge research.
I would like to share that we added
another prestigious customer –
India Kawasaki Motor for the
development and supply of
headlamps, tail lamps and rear view
mirrors for their upcoming model.
The automotive lighting equipment
is a safety and styling product for
the vehicle and significantly
enhances the aesthetics of a vehicle,
any change in the vehicle design
warrant a change in lighting style.
This flexibility and creativity
encouraged us to remain innovative
in offering new technology products
to OEM customers.
India’s automotive sector could face
challenges till the implementation
of BS-6 norms and up to few
months there after, hence we
remain cautious for some time and
hope for a better growth momentum
in medium to long term.
I am thankful to all our stakeholders
for staying with us and trusting our
business model. We expect to
enhance value in a significant way
across the coming years.
Regards,
J. K. Jain,
Chairman & Managing Director
two-wheelers, impacting sales. In a
country where almost 75 per cent of
all two-wheeler sales are financed
by external agencies, the decline in
financing arrangements affected
sales.
Beside there is a confusion over BS6
norms with customers hoping for
increased discounts (like what
happened in BS3 and BS4 transition)
in end of FY20 and fear of ban on
the internal combustion engine in
two wheelers for electric vehicles.
Increased documentation and risk a
version by financiers are the after
effect of a slowdown, resulting in a
lower mobilization of funds.
Despite this aberration, we see the
long-term outlook of the company
with optimism. The slowdown in
India’s automotive sector is
expected to be temporary as the
two-wheeler remains the most
affordable commuting mode for a
large part of India’s population -
virtually a necessity rather than a
luxury.
Our focus has been on the
development of in-house Design
and Testing capabilities and going
ahead with the new technology
products like the Bank Angle Sensor,
Fuel Pump Module and Canister etc.,
by forging partnerships with the
world renowned manufacturers.
During the year, we also formed a
wholly owned subsidiary in Italy -
Fiem Research and Technology S.r.l.
and set up a Design Center, which
we believe will significantly
strengthen our designing
capabilities.
Our leadership in Technology and
R&D was further reinforced as we
06 | Fiem Industries Limited
We see the long-term
outlook of the company
with optimism. The
slowdown in India’s
automotive sector is
expected to be
temporary as the two-
wheeler remains the
most affordable
commuting mode for a
large part of India’s
population.

VISION
To be a dominant player in…
Automotive Lamps, Mirrors, LED Products,
Safety & Electronic Parts
for Indian & Global
OEMs.
MISSION
We are committed to give
our Customers, Total Satisfaction
in terms of Quality, Cost and On time delivery.
We shall pursue Continual
Improvement in Product Quality
by upgrading the Technology and
Training to employees.
We aim to be the market leader in all our products through Global
Competitiveness.
We aim to continuously
enhancing the value of stake
holders.
VALUES
Customer Focused
Approach
Strive for Quality, Technology &
Innovation
Continuous Improvement
Respect for Individual and
Company Ethics
Annual Report 2018-19 | 07

What we are
Making it possible to proactively invest in R&D, future
Technology, People, Plants, Processes and Capacities.
Result...the Company developed ‘World’s smallest
LED bi-function lighting module for two-wheelers’
and received Global Award for excellence in Technology
and Development from Yamaha Motors Co. Ltd., Japan.
The module is already filed for patent, jointly by Yamaha
and Fiem.
Validating Fiem’s Global Competitiveness as leading
two-wheeler automotive lighting Company.
At FIEM, we are driven more by ‘what can be’ over ‘what has been’.
08 | Fiem Industries Limited
Annual Report 2018-19 | 09
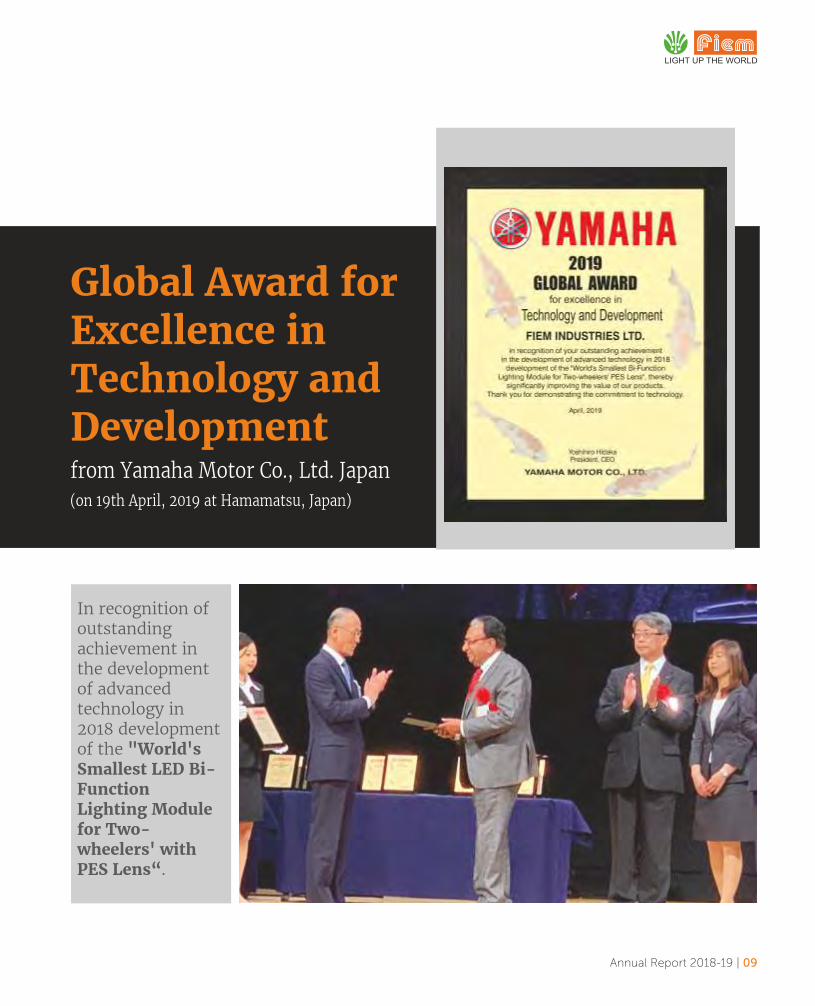
In recognition of
outstanding
achievement in
the development
of advanced
technology in
2018 development
of the "World's
Smallest LED Bi-
Function
Lighting Module
for Two-
wheelers' with
PES Lens“.
Global Award for
Excellence in
Technology and
Developmentfrom Yamaha Motor Co., Ltd. Japan
(on 19th April, 2019 at Hamamatsu, Japan)

Award for Delivery Management 2018-19
from Honda Motorcycle and
Scooter India Ltd.-2019
Appreciation Award for Development
and Shipping Control 2018
from India Yamaha Motor Pvt. Ltd.-2019
the Achievements contd...
Performance Award (Cost Reduction)
from Suzuki Motorcycle India Pvt. Ltd., 2019
10 | Fiem Industries Limited

...some of the awards we have won over the years
Grand Award from Honda
Motorcycle and Scooter India
Ltd (2009)
Supplier Recognition Award
from Harley-Davidson India
for its new motorcycle model
(Harley-Davidson Street)
(2014)
Achievement Award for
Honda Global Support 2012-
13 from Honda Motorcycle
and Scooter India Ltd., 2013
Performance Award (VA-
VE) for 2016-17 from Suzuki
Motor Cycle India Private
Limited (2016)
Appreciation Award, 2019
from Hyundai Motor India
Ltd. (2019)
Award for Q.D. Performance
from Honda Motorcycle and
Scooter India Ltd. (2011)
ESQR’S Quality Achievement
Award 2013 in the Gold
Category for extraordinary
achievement in quality
management (2013)
Grand Award for QCDDM
2013-14 from Honda
Motorcycle and Scooter India
Ltd. (2014)
Outstanding Contribution
to the Growth of Lighting &
Auto Electronics Industry
award for Excellence in
Electronics for 2016-17
Annual Report 2018-19 | 11

16 | Fiem Industries Limited
At Fiem, we believe thatour in-house R&D andTechnology capabilitiesare the long-term driversof our competitiveadvantage
In a technologically-driven space,
it is essential for players to upgrade
and benchmark their technology
platform with the latest global
standards.
Tail light with light pipe
LED Projector
(single function per side)
12 | Fiem Industries Limited
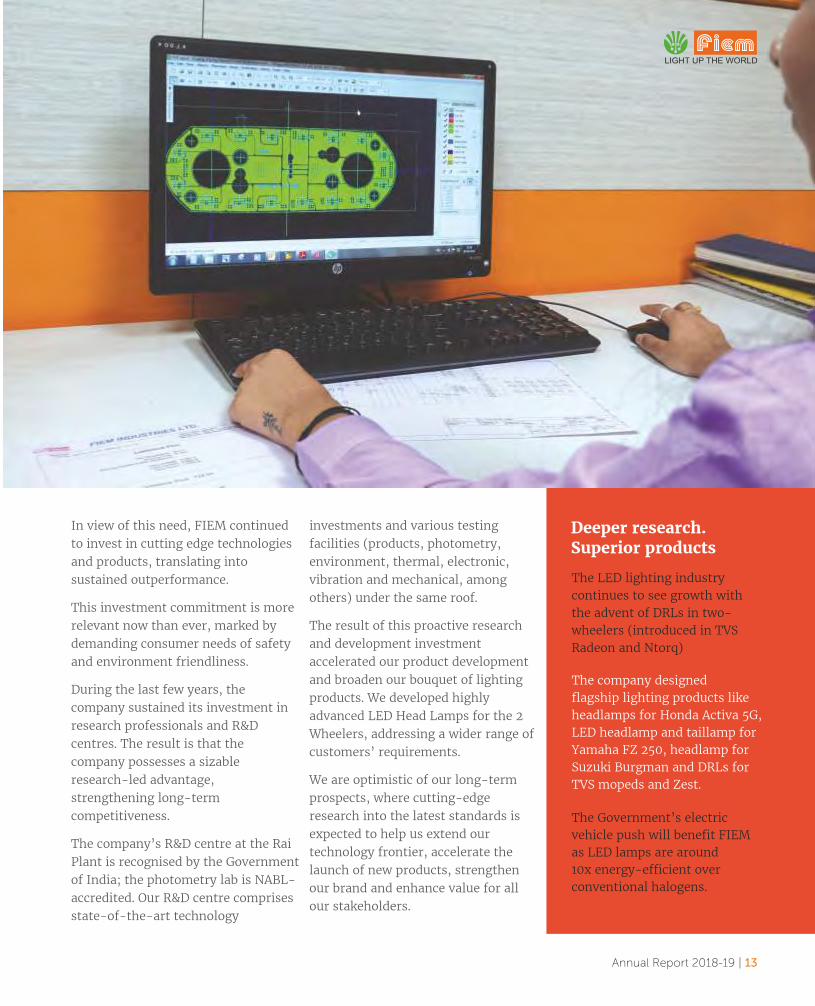
In view of this need, FIEM continued
to invest in cutting edge technologies
and products, translating into
sustained outperformance.
This investment commitment is more
relevant now than ever, marked by
demanding consumer needs of safety
and environment friendliness.
During the last few years, the
company sustained its investment in
research professionals and R&D
centres. The result is that the
company possesses a sizable
research-led advantage,
strengthening long-term
competitiveness.
The company’s R&D centre at the Rai
Plant is recognised by the Government
of India; the photometry lab is NABL-
accredited. Our R&D centre comprises
state-of-the-art technology
investments and various testing
facilities (products, photometry,
environment, thermal, electronic,
vibration and mechanical, among
others) under the same roof.
The result of this proactive research
and development investment
accelerated our product development
and broaden our bouquet of lighting
products. We developed highly
advanced LED Head Lamps for the 2
Wheelers, addressing a wider range of
customers’ requirements.
We are optimistic of our long-term
prospects, where cutting-edge
research into the latest standards is
expected to help us extend our
technology frontier, accelerate the
launch of new products, strengthen
our brand and enhance value for all
our stakeholders.
Deeper research.
Superior products
The LED lighting industry
continues to see growth with
the advent of DRLs in two-
wheelers (introduced in TVS
Radeon and Ntorq)
The company designed
flagship lighting products like
headlamps for Honda Activa 5G,
LED headlamp and taillamp for
Yamaha FZ 250, headlamp for
Suzuki Burgman and DRLs for
TVS mopeds and Zest.
The Government’s electric
vehicle push will benefit FIEM
as LED lamps are around
10x energy-efficient over
conventional halogens.
Annual Report 2018-19 | 13

Our conviction is visible in our ability to undertake
and accomplish the diffcult tasks
A world-class R&D platform, Design Team and state-of-art facilities widened the range of new-gen LED
technology products. The company's NABL accredited testing photometry laboratory and three world-class
R&D/Design Centres employ more than 120 personnel in design, optical simulation and guest engineering facilities.
R&D leadership
The Company received an
opportunity to design and develop
world’s smallest bi-functional LED
projector head lamp in partnership
with Yamaha.
The joint objective was to develop a
small, light weight and high
performance lighting module for
the global markets, covering
America, Europe and Australia. The
development addressed an unmet
need through a complement of
proprietary R&D capabilities and the
Yamaha engineering team.
After painstaking engagement, the
Company invested in alternative
design elements like lens profile,
focal merging system, advanced
material, machines and process
technologies.
The Company optimized component
dimensions and involved
manufacturing and assembly
department in the early project
stage (design stage).
FIEM fixed the method and wire
routing to maximize space for
optical elements; it optimised the
heat sink dimension and weight
through CAE thermal analysis.
The Company combined the
technology of convex lens, reflector
and collimator for high and low
beam, resulting in outstanding
miniature size projector
performance.
It leveraged modular optical
elements for different headlight
class (C and D) and patented optical
solution. It homogenized the lamp
for major markets, used in various
bike models.
The result: FIEM developed ‘world’s
smallest LED bi-function lighting
module’ for two-wheelers for its
valued customer, Yamaha Japan.
Design and Development of world’s smallest Bi-functional LED Projector Head Lamp
14 | Fiem Industries Limited
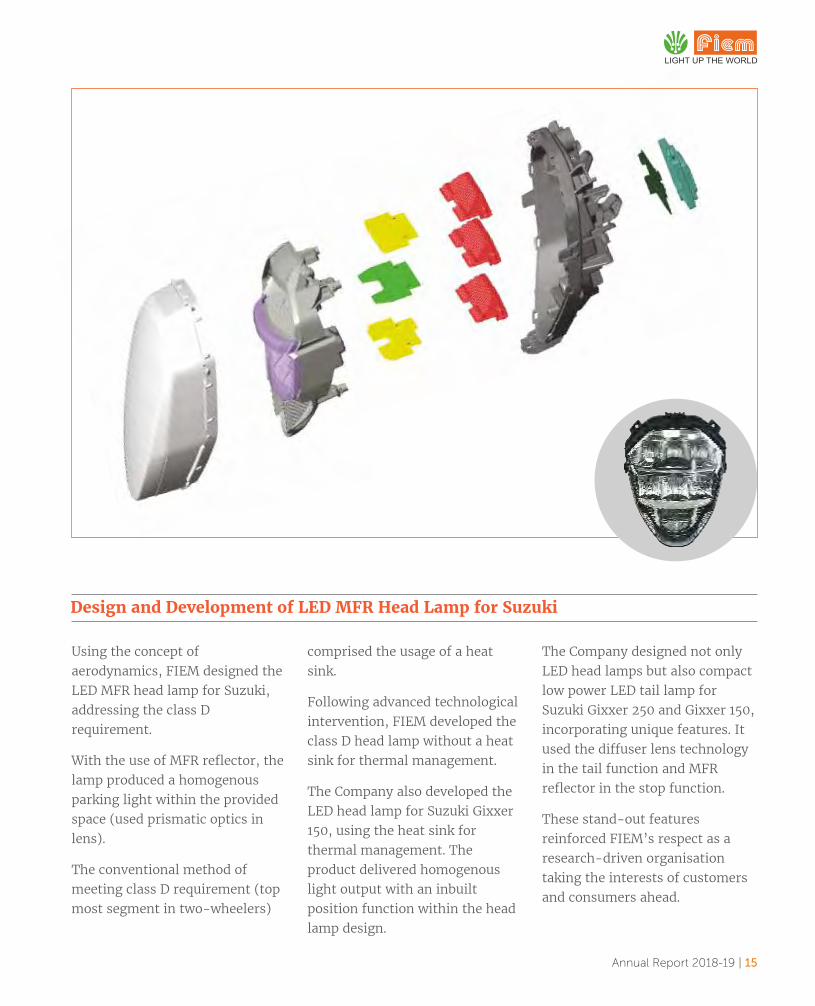
Using the concept of
aerodynamics, FIEM designed the
LED MFR head lamp for Suzuki,
addressing the class D
requirement.
With the use of MFR reflector, the
lamp produced a homogenous
parking light within the provided
space (used prismatic optics in
lens).
The conventional method of
meeting class D requirement (top
most segment in two-wheelers)
comprised the usage of a heat
sink.
Following advanced technological
intervention, FIEM developed the
class D head lamp without a heat
sink for thermal management.
The Company also developed the
LED head lamp for Suzuki Gixxer
150, using the heat sink for
thermal management. The
product delivered homogenous
light output with an inbuilt
position function within the head
lamp design.
The Company designed not only
LED head lamps but also compact
low power LED tail lamp for
Suzuki Gixxer 250 and Gixxer 150,
incorporating unique features. It
used the diffuser lens technology
in the tail function and MFR
reflector in the stop function.
These stand-out features
reinforced FIEM’s respect as a
research-driven organisation
taking the interests of customers
and consumers ahead.
Design and Development of LED MFR Head Lamp for Suzuki
Annual Report 2018-19 | 15

BANK (LEAN) ANGLE SENSOR
FEATURESOil less type, non-contact detection
type with Hall IC.
CONCEPTSmall size, lightweight and high mount ability
overturn detection sensor for motorcycles.
At FIEM, our alliances with industry-leading companies reinforced our capability to provide superior products
At FIEM, our long-term competitiveness and
sectoral outperformance have been derived from
future-facing alliances with leaders.
These alliances have helped the
company access cutting-edge
technologies, strengthening the
company’s technology orientation,
accelerating products development
and strengthening business
sustainability.
In 2018, FIEM entered into a
26:69:5 JV with Aisan Industry Co.
Ltd and Toyota Tsusho India Pvt Ltd
to manufacture Fuel Pump Modules
and IC connector assembly
(mandatory for BS VI vehicles to
moderate pollution). The supply of
fuel pumps could commence during
the current year with a full ramp-up
by FY2020-21.
Fiem had also entered into a 50:50
joint venture to create Fiem Kyowa
(HK) Mould Company Limited (in
Hong Kong), a 50:50 JV with
KYOWA Co, Japan, to manufacture
superior moulds/tools for
automotive and other applications.
Besides, the company entered into a
Technical collaboration with
Toyodenso Co. Ltd., Japan for Bank
(lean) Angle Sensors, supplies of
which are expected to commence by
end of financial year to Honda 2Ws.
FIEM also entered into a Technical
License and Assistance Agreement
with Aisan Industry Co. Ltd., Japan,
and Toyota Tsusho Corp, Japan for
the development of Canisters. These
alliances helped enhance product
diversification, organizational
expansion, product development,
technology absorption capability
and revenue visibility,
strengthening business
sustainability.
TECHNICAL ASSISTANCE AGREEMENT WITH JAPAN
16 | Fiem Industries Limited

CANISTER
Evaporated fuel vapor is absorbed in Canister during parking.
The vapor absorbed to canister is vacuumed into engine (Purging) and burned
when motorcycle is driving.
FUEL PUMP MODULE AND IC CONNECTOR
TECHNICAL ASSISTANCE AGREEMENT WITH JAPAN
JOINT VENTURE WITH JAPAN
By either name, the module controls the voltage delivered to a vehicle's fuel pump. By controlling the voltage, the fuel-pump
driver module maintains the optimum fuel pressure and fuel delivery to the engine throughout its full operating range.
FUNCTION
Annual Report 2018-19 | 17
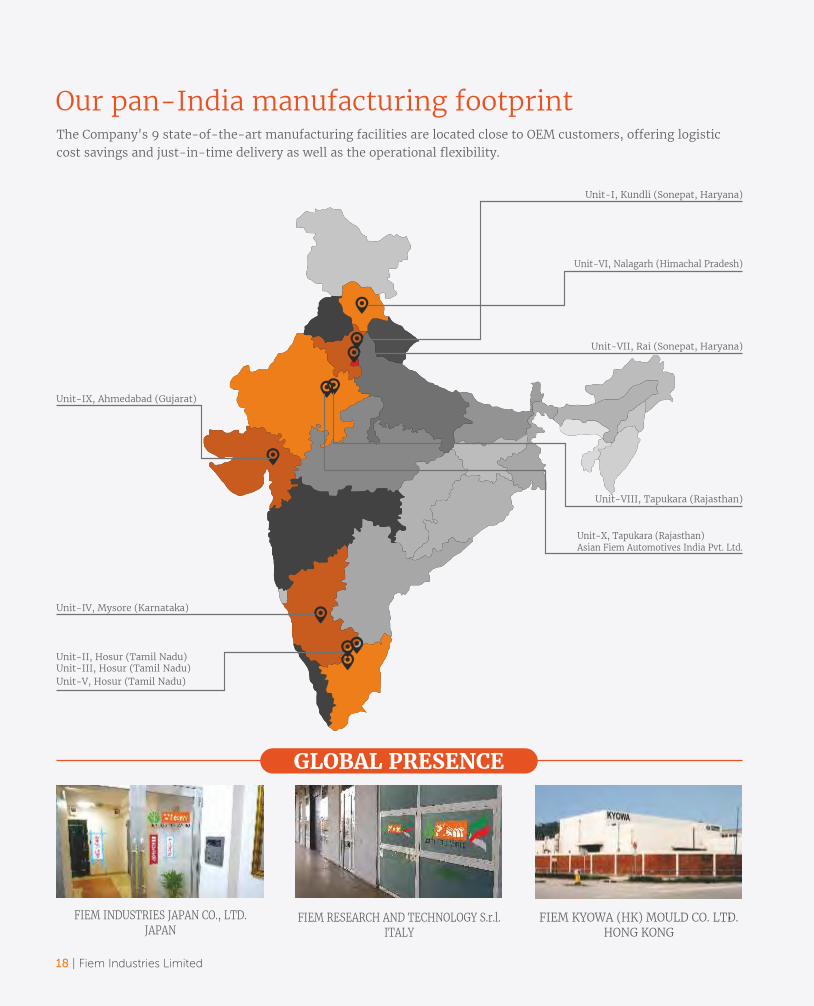
GLOBAL PRESENCE
The Company's 9 state-of-the-art manufacturing facilities are located close to OEM customers, offering logistic
cost savings and just-in-time delivery as well as the operational flexibility.
FIEM KYOWA (HK) MOULD CO. LTD.
HONG KONG
FIEM RESEARCH AND TECHNOLOGY S.r.l.
ITALY
Our pan-India manufacturing footprint
FIEM INDUSTRIES JAPAN CO., LTD.
JAPAN
18 | Fiem Industries Limited
Unit-VI, Nalagarh (Himachal Pradesh)
Unit-II, Hosur (Tamil Nadu)
Unit-V, Hosur (Tamil Nadu)
Unit-VIII, Tapukara (Rajasthan)
Unit-IX, Ahmedabad (Gujarat)
Unit-I, Kundli (Sonepat, Haryana)
Unit-III, Hosur (Tamil Nadu)
Unit-X, Tapukara (Rajasthan)
Asian Fiem Automotives India Pvt. Ltd.
Unit-IV, Mysore (Karnataka)
Unit-VII, Rai (Sonepat, Haryana)
Corporate Office & Unit-VII, Rai (Haryana)
Unit-I, Kundli (Sonepat, Haryana)
Unit-IV, Mysore (Karnataka)
Unit-VIII, Tapukara (Rajasthan) Unit-IX, Ahmedabad (Gujarat) Tapukara (Rajasthan)
Asian Fiem Automotives India Pvt. Ltd.
Unit-V, Hosur (Tamil Nadu) Unit-VI, Nalagarh (Himachal Pradesh)
Unit-II, Hosur (Tamil Nadu) Unit-III, Hosur (Tamil Nadu)
S.No Location Area in Sq. Mtrs
LAND BUILDING (Apprpx.)
Kundli (Unit –I)
Hosur (Unit – II)
Hosur (Unit- III)
Mysore (Unit- IV)
Hosur (Unit – V)
Nalagarh (Unit – VI)
Rai (Unit – VII)Tapukara, Rajasthan (Unit- VIII)
Ahmedabad, Gujarat (Unit-IX)JV Company: AFI, Tapukara, Rajasthan
1658812505
19110
4014
1346719191
28357
146277237
5270
1027
44646
820030000
42863 11135
32500 960015500 7000
1
2
3
4
5
6
78
910
Annual Report 2018-19 | 19
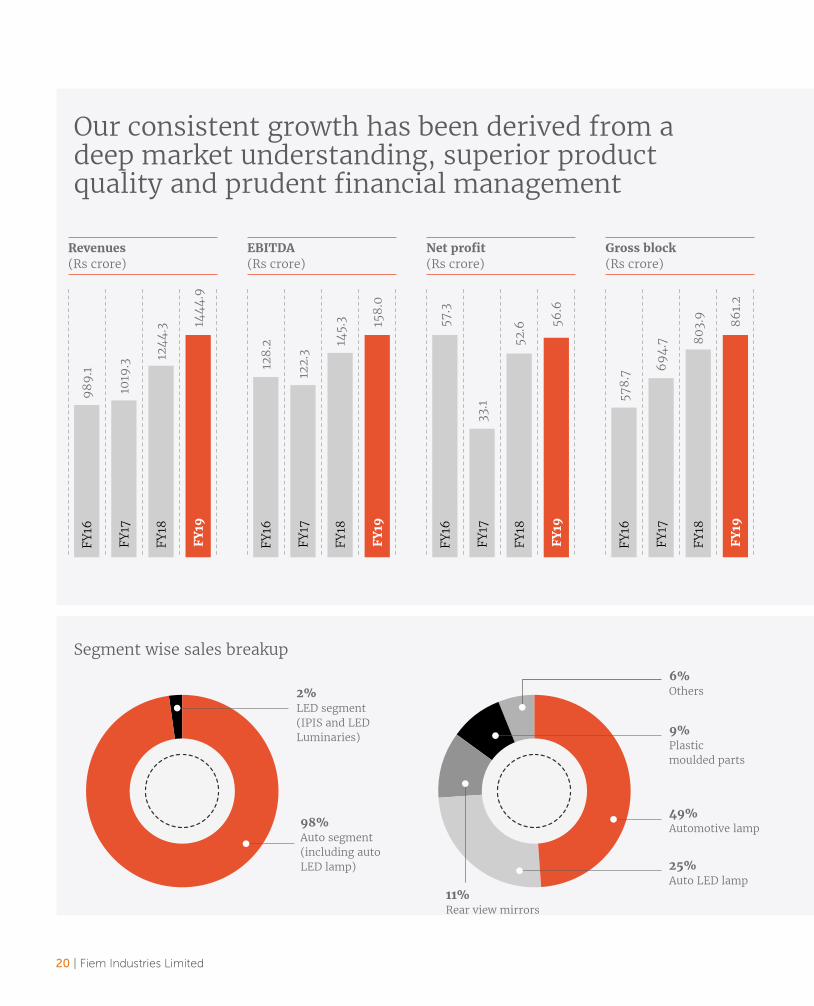
Our consistent growth has been derived from a deep market understanding, superior product quality and prudent financial management
Segment wise sales breakup
20 | Fiem Industries Limited
Revenues
(Rs crore)
FY
16
FY
17
FY
18
FY
19
98
9.1
1019
.3
124
4.3 14
44
.9
EBITDA
(Rs crore)F
Y16
FY
17
FY
18
FY
19
128
.2
122
.3
145
.3 158
.0
Net profit
(Rs crore)
FY
16
FY
17
FY
18
FY
19
57
.3
33.1
52
.6 56
.6
Gross block
(Rs crore)
FY
16
FY
17
FY
18
FY
19
57
8.7
69
4.7 8
03.9 86
1.2
2%LED segment
(IPIS and LED
Luminaries)
98%Auto segment
(including auto
LED
49%Automotive
lamp)
6%Others
9%Plastic
lamp
moulded parts
25%Auto LED lamp
11%Rear view mirrors
Auto segment product mix
Annual Report 2018-19 | 21
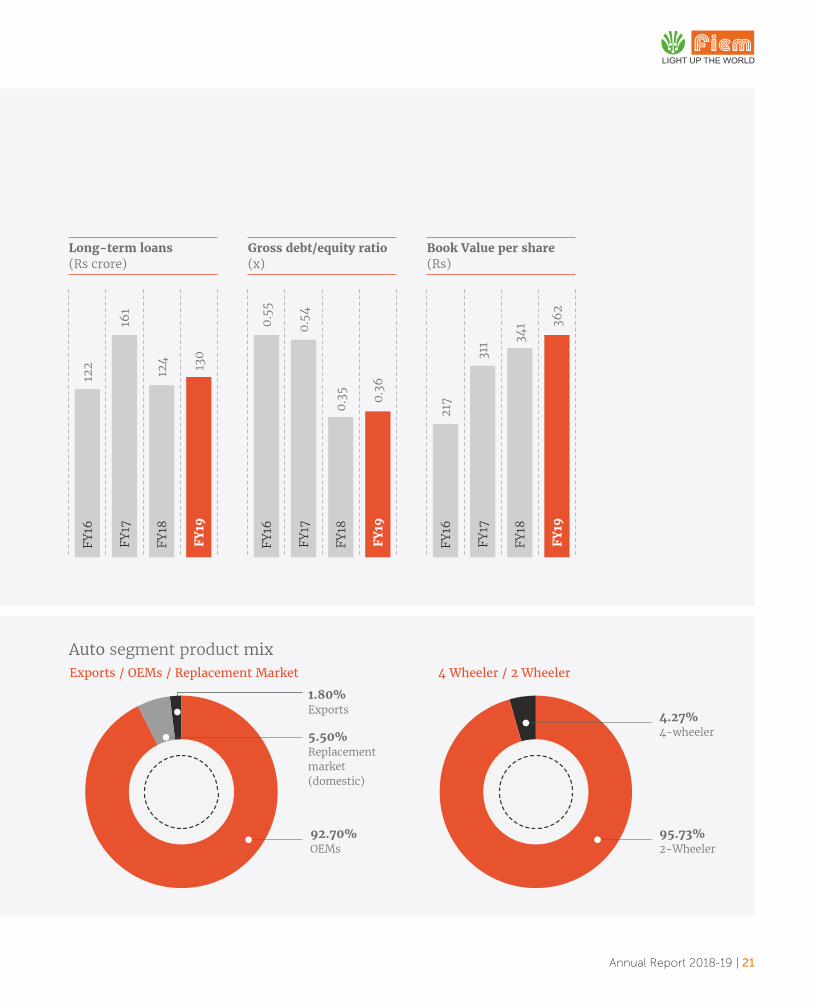
Long-term loans
(Rs crore)
FY
16
FY
17
FY
18
FY
19
122
161
124 130
Gross debt/equity ratio
(x)F
Y16
FY
17
FY
18
FY
19
0.5
5
0.5
4
0.3
5
0.3
6
Book Value per share
(Rs)
FY
16
FY
17
FY
18
FY
19
217
311
34
1 36
2
5.50%Replacement
92.70%OEMs
market
1.80%Exports
(domestic)
Exports / OEMs / Replacement Market 4 Wheeler / 2 Wheeler
4.27%4-wheeler
95.73%2-Wheeler
LED AUTOMOTIVE LAMPS
AUTOMOTIVE LAMPS
REAR VIEW MIRRORS
PLASTIC PARTS
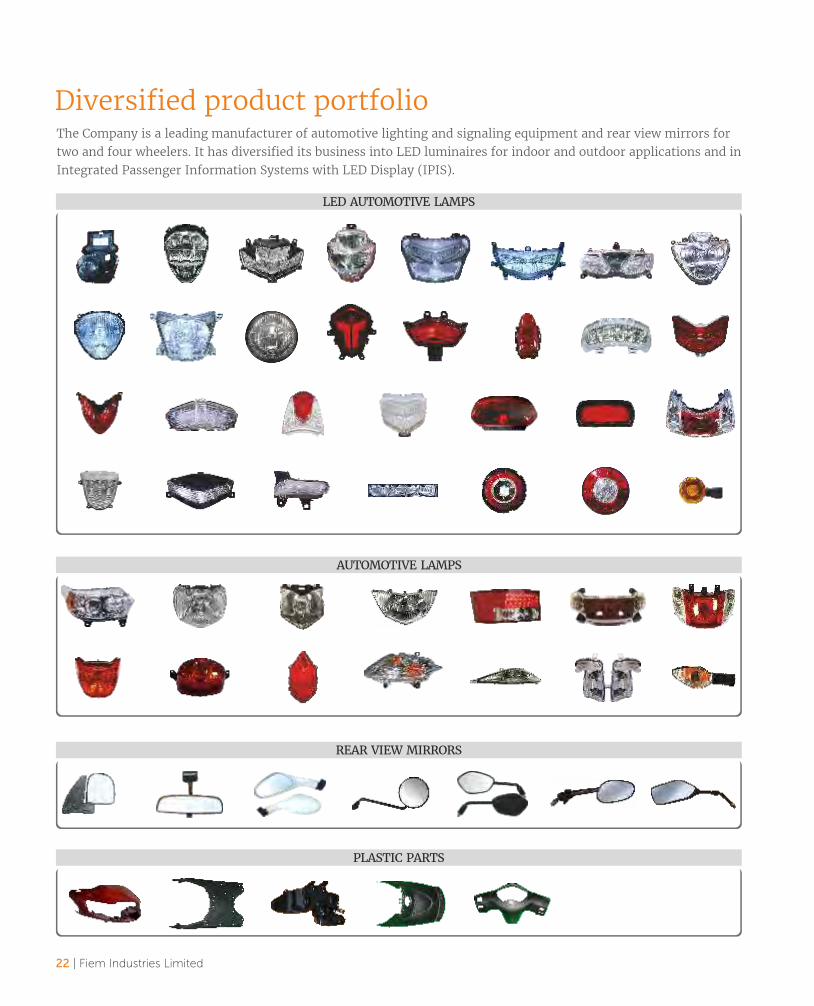
Diversified product portfolioThe Company is a leading manufacturer of automotive lighting and signaling equipment and rear view mirrors for
two and four wheelers. It has diversified its business into LED luminaires for indoor and outdoor applications and in
Integrated Passenger Information Systems with LED Display (IPIS).
22 | Fiem Industries Limited

LED LUMINAIRES
IPIS
Annual Report 2018-19 | 23

Strong client baseThe Company is among leading manufacturers of automotive lighting, signaling equipment, rear view mirrors,
sheet metal and plastic parts in India. The Company's client base comprises more than 35 OEMs, supplying to some
of them since their inception.
24 | Fiem Industries Limited
PT. SUZUKI INDOMOBIL MOTOR
TWO-WHEELER SEGMENT (GLOBAL CUSTOMERS)
FOUR-WHEELER SEGMENT (DOMESTIC CUSTOMERS)
FOUR-WHEELER SEGMENT (GLOBAL CUSTOMERS)
TWO-WHEELER SEGMENT (DOMESTIC CUSTOMERS)

FIEM:
Our definition of a successful company is a little different than others. We believe a
company’s success cannot be measured by revenues or financial indicators alone, but
by the ability to change lives. Since its inception, FIEM has placed immense focus on
the overall development of society. Under the aegis of ‘FIEM Foundation’, the
Company carries out various CSR initiatives in helping the poor and needy patients for
their treatment, women empowerment and arranging for the mass marriages of
underprivileged girls. Providing financial assistance to NGOs involved in helping the
poor and underprivileged.
Companion of the underprivileged
Annual Report 2018-19 | 25

Health care for the poor
The Company provides financial support to NGO ‘Kutch Vikas Trust to facilitate eye
and dental operations of poor patients.
Mass marriages
Fiem foundation conducts mass marriages for underprivileged girls in order to ensure
their upliftment in society. Couples from across religions Hindu, Sikh, Muslim and
Christian participated in the mass marriage programmes.
26 | Fiem Industries Limited

Aprajita
12 years from Bihar
` 1,00,000/-
Monika
10 years from U.P.
` 1,00,000/-
Neetesh
12 years from U.P.
` 1,00,000/-
Kiran Negi
29 years from Uttrakhand
` 1,00,000/-
Bharat Shah
27 years from Bihar
` 1,00,000/-
Md. Javed
20 years from Bihar
` 1,00,000/-
Financial Aid to poor & needy patients
In collaboration with ‘Social Welfare Unit of AIIMS, Delhi' we
provide financial aid to poor patients suffering from cancer and other
life-threatening diseases. Till now more than 240 such patients have
been extended financial aid totaling around Rs. 3 crore. We are doing
this work through our CSR Trust 'Fiem Foundation'.
Kanhaiya
30 years from U.P.
` 1,00,000/-
Rajlaxmi
22 years from New Delhi
` 1,00,000/-
Anu Pal
24 years from New Delhi
` 1,00,000/-
Md. Zaid
6 years from Delhi
` 1,00,000/-
Amrit Matho
40 years from Bihar
` 1,00,000/-
Adil
15 years from U.P.
` 1,00,000/-
Master Pritam
8 years from Bihar
` 1,00,000/-
Divya
29 years from Uttrakhand
` 1,00,000/-
Bashra Ali
7 years from Delhi
` 1,00,000/-
Kundan Kr. Soni
30 years from Bihar
` 1,00,000/-
Amit
8 years from U.P.
` 2,00,000/-
Pramila Kumar
23 years from BIhar
` 1,00,000/-
Dinesh
37 years from West Delhi
` 1,00,000/-
Kusum Lata
22 years from U.P.
` 1,00,000/-
Kismat
7 years from Bihar
` 1,00,000/-
Kalpana
29 years from Auriyah
`` 2,00,000/-
Vishal
13 years from Haryana
` 49,955/-
Vikas Prasad
25 years from Delhi
` 2,00,000/-
Simrat Kaur
27 years from New Delhi
` 1,15,000/-
Nihal Dubey
2 years from U.P.
` 1,00,000/-
Raviya
18 years from U.P.
` 1,00,000/-
Sonu Kumar
15 years from Bihar
` 1,88,550/-
Ashok
23 years
` 2,00,000/-
Tanish
8 years
` 2,00,000/-
Annual Report 2018-19 | 27
UNDO AF TIM OE NIF

Board of Directors
Ms. Aanchal Jain
Whole-time Director
Mr. S.K. Jain
Independent Director
Mr. J.K. Jain
Chairman & Managing
Director
Mr. J.S.S. Rao
Whole-time Director
Mr. Iqbal Singh
Independent Director
Mrs. Seema Jain
Whole-time Director
Mr. Kashi Ram Yadav
Whole-time Director
Mr. V.K. Malhotra
Independent Director
Mr. Rahul Jain
Whole-time Director
Mr. Mohan Bir Singh
Independent Director
Mr. Ashok Kumar Sharma
Independent Director
Mr. Jawahar Thakur
Independent Director
28 | Fiem Industries Limited
Annual Report 2018-19 | 29
Board of Directors Mr. J.K. Jain – Chairman & Managing Director
Mrs. Seema Jain – Whole–time Director
Mr. Rahul Jain – Whole–time Director
Ms. Aanchal Jain – Whole–time Director
Mr. J.S.S. Rao – Whole–time Director
Mr. Kashi Ram Yadav – Whole–time Director
Mr. Mohan Bir Sahni – Independent Director
Mr. S.K. Jain – Independent Director
Mr. Iqbal Singh – Independent Director
Mr. V. K. Malhotra – Independent Director
Mr. Ashok Kumar Sharma – Independent Director
Mr. Jawahar Thakur – Independent Director
Chief Financial Officer Mr. O.P. Gupta
Company Secretary and Compliance Officer Mr. Arvind K. Chauhan
Audit Committee Mr. S. K. Jain Chairman
Mr. V. K. Malhotra Member
Mr. Iqbal Singh Member
Nomination & Remuneration Committee Mr. S. K. Jain Chairman
Mr. Iqbal Singh Member
Mr. V. K. Malhotra Member
Stakeholders Relationship Committee Mr. V. K. Malhotra Chairman
Mr. Rahul Jain Member
Mr. Kashi Ram Yadav Member
Corporate Social Responsibility (CSR) Committee Mr. Rahul Jain Chairman
Mr. Kashi Ram Yadav Member
Mr. V.K. Malhotra Member
Statutory Auditors M/s V. Sachdeva & Associates, Chartered Accountants
Registered OfficeD–34, DSIDC Packaging Complex, Kirti Nagar
New Delhi–110015 (INDIA)
Tel: +91–11–25927820, 25927919, Fax: +91–11–25927740
CIN: L36999DL1989PLC034928
Corporate Office & Unit VIIPlot No. 1915, Rai Industrial Estate, Phase – V
Distt. Sonepat, Haryana –131029
Tel: +91-130-2367905-910,
Fax: +91-130-2367903
Email: [email protected]
Website: www.fiemindustries.com
Registrar and Share Transfer AgentLink Intime India Pvt. Ltd.
Noble Heights, 1st Floor, Plot No. 2
C-1 Block ISC, Near Savitri Market
Janakpuri, New Delhi – 110058
Ph: 011–41410592/93/94
Fax No: 011–41410591
General information

30 | Fiem Industries Limited
Directors’ Report
The Directors of your Company have the pleasure in presenting the 30th Annual Report of Fiem Industries Limited (the Company or FIEM) on the business and operations of the Company having both standalone and consolidated audited financial statements for the financial year ended March 31, 2019.
The financial statements have been prepared as a going concern in accordance with Indian Accounting Standards (Ind AS) notified under the Section 133 of the Companies Act, 2013 (“the Act) read with the Companies (Indian Accounting Standards) Rules, 2015 and other relevant provisions of the Act.
Financial ResultsThe Directors’ Report is prepared on the basis of Standalone Financial Statements of the Company pursuant to Rule 8(1) of the Companies (Accounts) Rules, 2014. However, this report also contains highlights of performance of subsidiaries and joint venture companies and their contribution to the overall performance of the Company during the period under review. Financials of following Wholly-owned Subsidiaries (WOS), and Joint Venture Companies (JVs) are consolidated in Consolidated Financial Statements.
S.N. Name of Entities Country of Incorporation WOS/JV1. Aisan Fiem Automotives India Private Limited (AFI) India 69:26:5 JV2. Fiem Kyowa (HK) Mould Company Limited. Hong Kong 50:50 JV3. Centro Richerche Fiem Horustech S.r.l Italy 50:50 JV4. Fiem Industries Japan Co., Ltd. Japan WOS5. Fiem Research and Technology S.r.l (FRT) Italy WOS6. Fiem (Thai) Design and Technology Co., Ltd. Thailand WOS
During the year under review Company’s performance has remained good in comparison to industry growth and a summary of the same along with previous year’s figures are as under:
(Rs In Lacs)Sr Particulars Standalone Consolidated
FY 2018-19 FY 2017-18 FY 2018-19 FY 2017-181 Income from Operations
a) Net Sales (FY 2017-18 include Rs. 3,477.99 lacs Excise duty) 1,43,396.13 1,26,323.93 1,43,900.43 1,26,477.46b) Other Operating Income 1,003.67 989.40 1,001.83 972.77Total Income from operations (Net) 1,44,399.80 1,27,313.33 1,44,902.26 1,27,450.24
2 Total Expenses (excluding dep and finance cost) 1,28,873.48 1,13,246.45 1,29,185.93 1,13,376.833 Profit from operations before other income, finance costs,
depreciation and exceptional items (1-2)15,526.32 14,066.88 15,716.33 14,073.41
4 Add Other income 86.21 454.40 86.14 454.405 Profit from ordinary activities before finance costs,
depreciation and exceptional items (3+4)15,612.53 14,521.28 15,802.47 14,527.81
6 Less :- Finance costs 2,209.79 2,272.41 2,209.79 2,272.41Less :-Depreciation 4,891.61 4,432.47 4,892.67 4,432.59
7 Profit from ordinary activities after finance costs, depreciation but before exceptional items (5-6)
8,511.13 7,816.40 8,700.01 7,822.81
8 Exceptional Items - (340.58) - (340.58)9 Profit/(Loss) from Ordinary Activities Before Tax (7-8) 8,511.13 8,156.98 8,700.01 8,163.3910 Tax expense 2,962.38 2,901.97 3,035.98 2,903.1311 Net Profit/(Loss) from Ordinary Activities After Tax (9-10) 5,548.75 5,255.01 5,664.03 5,260.26

Annual Report 2018-19 | 31
(Rs In Lacs)Sr Particulars Standalone Consolidated
FY 2018-19 FY 2017-18 FY 2018-19 FY 2017-1812. Share of profit/(loss) of associates - - (99.11) (4.19)13. Profit after tax for the year after share of profit/loss of associate 5,548.75 5,255.01 5,564.92 5,256.0714. Other comprehensive income/(loss) (net of tax) -84.68 -71.38 -84.68 -71.3815. Total other comprehensive income (net of tax) 5,464.07 5,183.63 5,480.24 5,184.6916 Weighted Earnings Per Share (EPS) 42.16 39.93 42.29 39.94
State of the Company’s affairs / Business ReviewFY 2018-19 has remained a difficult year for the two-wheeler industry. As per the data available from SIAM, two-wheeler industry has shown a growth of 6.29% during the FY2018-19 as against the growth of 15.44% during FY2017-18. Domestic sales of the two-wheeler has grown by even lower number of 4.86%. In this background, your Company registered a growth of 16.77% in the top line during FY 2018-19.
We have been able to grow at much higher than the industry rate. This is driven by the new model LED auto sales and increase in share with other customers. Our growth with Yamaha and Suzuki has been 82% and 67% respectively while maintaining modest growth with Honda and TVS. We continue to be one of the most preferred suppliers to the OEMs and supplying product to more than 35 domestic and global OEMs.
As mentioned earlier, sales growth in FY2018-19 is 16.77% equivalent to Rs. 1434 Cr. It is important to highlight that during the same period, industry has grown by only 6.29% while HMSI, our key OEM has degrown by 4.41%. We have managed to grow our business with a few OEMs like Yamaha and Suzuki significantly, thus achieving overall growth figure of 16.77%. Further, EBITDA for FY2018-19 stands at 10.83% as against 11.45% during the FY2017-18. This decline is due to increase in raw material cost during the year. Profit before tax stands at Rs. 85.11 Cr. Last year, other income included Rs. 3.5 Cr of income coming from balances held in mutual funds. This amount got majorly utilized during the year for expansion of business. Thus, there is very small corresponding income from this source in the current year. During the year, the Company has invested a sum of Rs. 62 crores in additional fixed assets.
For FY2018-19, finance cost of the Company stands at Rs. 22.1 Cr. This has largely remained the same over previous year. We continue to follow prudent capital structure and our leverage remained very comfortable with a debt-to-equity ratio of 0.35:1. PAT of the Company after taking into account all the associates of the JV companies stood at Rs. 55.64 Cr during the FY2018-19 as against Rs. 52.56 Cr during the FY2017-18. EPS of the Company stands at Rs. 42.29 per share for FY2018-19 as against Rs. 39.94 per share for FY2017-18.
Incorporation of JV Company: Aisan Fiem Automotives India Pvt. Ltd. (AFI):On March 30, 2018, Company had signed a “Joint Venture Agreement” with Aisan Industry Co., Ltd., Japan and Toyota Tsusho India for manufacture of Fuel Injection System (Fuel Pump Module) and IC connector for two-wheelers and three-wheelers for Indian market.
Fuel Injection System will become mandatory for two-wheelers and three-wheelers w.e.f. April, 2020 under Bharat Stage VI (BS VI) regime. This is an advanced Emission Control System Product, which will have huge market in India under BS VI norms and will replace carburetor.
In terms of above Joint Venture Agreement, a Joint Venture Company incorporated on 7th June, 2018, namely Aisan Fiem Automotives India Pvt. Ltd. (AFI). Total equity investment in the JV Company is Rs. 100 Crore, wherein Fiem Industries hold 26%, Aisan hold 69% and Toyota Tsusho hold 5%. The JV Company has established factory in ELCINA Electronic Manufacturing Cluster in Tapukara.
Technical Assistance Agreement for Bank (Lean) Angle SensorDuring July, 2018, Company has signed a “Technical Assistance Agreement” with TOYODENSO Co., Ltd., Japan and Toyota Tsusho Corporation, Japan for manufacturing of Bank Angle Sensor for motorcycles for Indian market. Bank Angle Sensor is a safety sensor, which is being increasingly applied by OEMs in motorcycles and will have an increasing market in India. Bank Angle Sensor has the functionality of stopping the engine of motorcycle at the time of accidents and avoid prolonged skidding. The preparation for production of Bank Angle Sensor at Tapukara factory is at full swing and Company plan to commence the mass production during current year.
Design Centre in Italy: Fiem Research and Technology S.r.l (FRT)Company’s focus has been on development of in-house design and testing capability and going ahead with the new technology product like bank angle sensor, fuel pump module, etc., by forging partnerships with the world renowned manufacturers.

32 | Fiem Industries Limited
During the year, Company formed a wholly-owned subsidiary in Italy namely Fiem Research and Technology S.r.l and set-up a Design Center which will significantly strengthen our designing capabilities.
Prestigious Global Award from Yamaha Motor Company, Japan, for excellence in Technology and DevelopmentThe leadership of the Company in the technology development has been further reinforced as Company has received the Global Award from Yamaha Motor Company, Japan, for Excellence in Technology and Development. Company has developed the world’s smallest bifunctional LED lighting module for two-wheelers. This is a big global award showcasing Company’s capability.
Addition of New Customer: India Kawasaki MotorCompany has added another prestigious customer India Kawasaki Motor for development and supply of headlamp, tail lamp, and rearview mirror for one of their upcoming model.
The automotive lighting equipment is a safety and styling product for the vehicle which largely contributes in the improving aesthetics of the vehicle. The change in model invariably results in change in lighting style, hence new business for us. These factors encourage us to remain innovative and enable us to offer new technology products to our OEM customers. Thus, we remain optimistic about the future.
Update on Fire at one portion of Unit-V at Hosur, TamilnaduDuring the financial year 2017-18, a major fire occurred on January 25, 2018 at one portion of Unit-V in Hosur, Tamilnadu. The assets of the Company are adequately covered under insurance. The Company had filed insurance claim with its insurers and also received part claim, however final claim is yet to be received. The other necessary information are provided in the financial statements. The Company had successfully and quickly recovered the supplies to its customers with in few days and no major impact or interruption was felt to supplies to esteemed OEM customers.
SAP ImplementationTo make the Company future ready with the increasing volume of operations and geographic expansion as well as with the objective of better control, Company is in the process of implementation of SAP system across its all units and offices - SAP S/4HANA Enterprise Management.
DividendYour Company has been declaring dividend every year which have steadily increased. The Board in its meeting held on March 13, 2019, had declared an Interim Dividend at the rate of 80% i.e. Rs. 8/- per equity share of Rs. 10/- each. Further, the Board, in its meeting held on May 14, 2019, has recommended a Final Dividend at the rate of 40% i.e. Rs. 4 /- per equity share for the financial year ended on March 31, 2019. Interim dividend was paid to the shareholders as per their shareholding in the Company as on March 27, 2019 (Record Date). Consequently, the total dividend for the financial year ended on March 31, 2019 including the interim dividend paid during the year, amounts to 120% i.e. Rs. 12 /- per equity share of Rs. 10/- each.
The Final Dividend payout is subject to approval of members at the ensuing Annual General Meeting of the Company. The final dividend on equity shares at the rate of Rs. 4/- per share, if approved by the members would involve a cash outflow of Rs. 634.62 lacs including dividend tax. The total dividend at the rate of Rs. 12/- per equity shares including dividend tax for the Financial Year 2018-19 would aggregate Rs. 1903.81 lacs including dividend tax.
Statutory disclosures as per provisions of Section 134 of the Companies Act, 2013 (the “Act”)
1. Extract of Annual Return
Pursuant to Section 134(3)(a) and Section 92(3) of the Act, read with Rule 12 of the Companies (Management and Administration) Rules, 2014 as amended, an extract of Annual Return in Form MGT-9 as on March 31, 2019, has been prepared and enclosed as Annexure I, which forms an integral part of this report. The extract of Annual Return in Form MGT-9, is also available on the website of the Company http://fiemindustries.com/investors/.
2. Number of meetings of the Board
Meetings of the Board are held on regular intervals to discuss and decide on various business policies, strategies, operational, financial and other matters. Due to business exigencies, the Board also approve some proposals through resolution passed by circulation from time to time.
During the financial year 2018-19, Six (6) Board Meetings were held. One separate meeting of Independent Directors of the Company was also held during the Financial Year 2018-19.
Detailed information on the meetings of the Board is included in the report on Corporate Governance, which forms an integral part of this Annual Report.
Annual Report 2018-19 | 33
3. Directors’ Responsibility Statement
In terms of Section 134(3)(c) of the Companies Act, 2013, Your Directors state that:
a) in the preparation of the Annual Accounts for the year ended March 31, 2019, the applicable accounting standards (IndAs) have been followed along with proper explanation relating to material departures, if any.
b) the Directors have selected such accounting policies and applied them consistently and made judgments and estimates that are reasonable and prudent so as to give a true and fair view of the state of affairs of the Company as at end of Financial Year ended March 31, 2019 and of the Profit and Loss of the Company for that period.
c) the Directors have taken proper and sufficient care for the maintenance of adequate accounting records in accordance with the provisions of this Act for safeguarding the assets of the Company and for preventing and detecting fraud and other irregularities.
d) the Directors have prepared the Annual Financial Statements on a ‘going concern’ basis.
e) the Directors have laid down internal financial controls to be followed by the Company and that such internal financial controls are adequate and are operating efficiently, and
f) the Directors have devised proper systems to ensure compliance with the provisions of all applicable laws and such systems are adequate and operating effectively.
Based on the framework of internal financial controls and compliance systems established and maintained by the Company, work performed by the internal, statutory and secretarial auditors, including review of internal financial controls over financial reporting by the statutory auditors, and the reviews performed by management and the relevant board committees, including the audit committee, the board is of the opinion that the Company’s internal financial controls were adequate and effective during financial year 2018-19.
4. Independent Directors’ Declaration
The Company has received necessary declaration from each of Independent Director of the Company under Section 149(7) of the Companies Act, 2013 and SEBI (Listing Obligations and Disclosure Requirements) Regulations, 2015 (‘Listing Regulations’), as amended, that they meet the criteria of independence as laid down under Section 149(6) of the Companies Act, 2013 and Regulation 16(1)(b) of the Listing Regulations.
The Board took on record the declaration and confirmation submitted by the Independent Directors regarding their meeting the prescribed criteria of independence, after undertaking due assessment of the veracity of the same as required under Regulation 25 of the Listing Regulations.
5. Directors’ Appointment Criteria and Remuneration Policy etc.
The Nomination & Remuneration Committee has formulated criteria for determining qualifications, positive attributes and independence of the Directors as well as Remuneration Policy for the Company as mandated under Section 178(3)/(4) of the Act and Regulation 19 read with Part D of Schedule II of the Listing Regulations.
The above referred Policy is enclosed as Annexure II, which forms part of this Report.
6. Auditors & Auditor’s Reports
(a) Statutory Auditors
Pursuant to Section 139 of the Companies Act, 2013, M/s. V. Sachdeva & Associates, Chartered Accountants (Firm Registration No-004417N) were appointed as Statutory Auditors of the Company at 28th AGM of the Company held on August 21, 2017, for a term of 5 (five) years, starting from the conclusion of 28th Annual General Meeting till the conclusion of 33rd Annual General Meeting of the Company to be held in the year 2022, subject to ratification by the shareholders at every Annual General Meeting. However, Ministry of Corporate Affairs, vide its Notification No. S.O. 1833(E) dated May 7, 2018, dispensed with the requirement of ratification of appointment of Statutory Auditors at every Annual General Meeting.
Accordingly, no shareholders resolution required for ratification of appointment of M/s. V. Sachdeva & Associates, Chartered Accountants, as the Statutory Auditors of the Company. Hence, no such resolution is moved at the ensuing Annual General Meeting.
(b) Statutory Auditor’s Reports
The Auditor’s Reports given by M/s. V. Sachdeva & Associates, Statutory Auditors on the financial statements of the Company, both standalone and consolidated, for the financial year 2018-19 is part of the Annual Report. There has been no qualification, reservation or adverse remark or disclaimer in their Reports.
Further, during the year under review, the Auditors had not reported any matter of offence of fraud under Section 143 (12) of the Act, therefore no detail is required to be disclosed under Section 134 (3)(ca) of the Act.

34 | Fiem Industries Limited
(c) Secretarial Auditor
In terms of Section 204 of the Companies Act, 2013 the Audit Committee recommended and the Board of Directors in their meeting held on May 14, 2019 has appointed M/s Ranjana Gupta & Associates, a firm of Company Secretaries in Practice (C.P. No. 9920) as the Secretarial Auditors of the Company to conduct the secretarial audit for the financial year 2019-20. The Company has received their consent for appointment.
(d) Secretarial Audit Report
The Secretarial Audit under section 204 of Companies Act, 2013 read with Rule 9 of the Companies (Appointment and Remuneration of Managerial Personnel) Rules, 2014 as well as in compliance of Regulation 24A of the Listing Regulations was conducted by M/s Ranjana Gupta & Associates, Company Secretaries (C.P. No. 9920) for the financial year 2018-19 . The Report in Form No, MR-3 given by the Secretarial Auditors is annexed as Annexure III and forms integral part of this Report. There has been no qualification, reservation or adverse remark or disclaimer in their Report; hence no explanation by Directors is warranted.
In addition to above, ‘Annual Secretarial Compliance Report’ in compliance with Regulation 24A of Listing Regulations and as per format prescribed under SEBI Circular No. CIR/CFD/CMD1/27/2019 dated February 8, 2019 was also obtained from M/s Ranjana Gupta & Associates, Company Secretaries (C.P. No. 9920) and submitted to stock exchanges i.e. BSE and NSE with in stipulated period of 60 days from end of the financial year.
During the year under review, the Secretarial Auditors had not reported any matter of offence of fraud under Section 143 (12) of the Act, therefore no detail is required to be disclosed under Section 134 (3)(ca) of the Act.
(e) Cost Auditor
As per Section 148 of the Act read with Companies (Cost Records and Audit) Rules, 2014, on the recommendation of the Audit Committee, the Board of Directors appointed Mr. Krishan Singh Berk, Cost Accountants (Membership No. 2724) as Cost Auditor of the Company for the financial year 2019-20. The Company has received their consent that the appointment is in accordance with the applicable provisions of the Act and rules framed thereunder and they are not disqualified to be appointed as Cost Auditors. The remuneration of Cost Auditors has been approved by the Board of Directors on the recommendation of Audit Committee and in terms of the Companies Act, 2013 and Rules thereunder. The Notice of the ensuing Annual
General Meeting of the Company will have a requisite resolution for ratification of remuneration of Cost Auditors by the members of the Company.
The Cost Audit Report for Financial Year 2017-18 was filed to Registrar of Companies on September 20, 2018. Further, the Cost Audit Report for Financial Year 2018-19 will be filed with the Registrar of Companies in due course.
7. Particulars of Loans, Guarantees or Investments under Section 186
Details of the loans given, guarantees or securities provided (if any) and investments made by the Company along with their purposes, have been disclosed in the financial statements. Please refer to Note No.48 in the standalone financial statement.
8. Contracts and Arrangements with Related Parties
All contracts/ arrangement/ transactions entered with Related Parties during the year under review were on arm’s length basis and in the ordinary course of business. Due approvals from Board and/or Audit Committee were taken under the provisions of Section 188 and 177 of the Companies Act, 2013 and the Rules made thereunder read with applicable SEBI (LODR) Regulations. Further, no approval from shareholder required for any related party transaction during the year under review. There were no ‘material’ related party transactions during the year under review with the Promoters, Directors, Key Managerial Personnel or any other related entity as defined under Regulation 23 of the SEBI (LODR) Regulations read with ‘Related Party Transactions Policy’ of the Company. Therefore, disclosure in form AOC-2 in terms of Section 134(3)(h) of the Companies Act, 2013 are not required.
Members may refer to Note No.48 to the financial statements which sets out related party disclosures pursuant to Ind AS.
Your Company has formulated a policy on related party transactions. In line with the provisions of the SEBI (LODR) (Amendment) Regulation, 2018, policy on related party transactions is revised by the Board at its meeting held on February 9, 2019. The amended policy is also available on Company’s website at https://www.fiemindustries.com. This policy provides the governing framework for review and approval of related party transactions.
The web-link of the same has been provided in the Corporate Governance Report.
9. Transfer to Reserves
Your Company has transferred Rs. 560 lacs to the General Reserve from the profits of the Company.
Annual Report 2018-19 | 35
10. Material changes and commitment affecting financial position of the Company / Change in the Nature of the Business
There are no material changes and commitments, affecting the financial position of the Company which has occurred after the close of financial year till the date of this Report.
11. Conservation of Energy, Technology Absorption and Foreign Exchange Earnings and Outgo
Details of Energy Conservation, Technology Absorption, Research and Development and Foreign Exchange Earnings and outgo as required under Section 134(3)(m) of the Act read with Rule 8(3) of Companies (Accounts) Rules, 2014 are given in Annexure IV to this Report.
12. Risk Management
Risk management has become an important function of the management as the Company is growing with fast pace and operation are expanding at different locations. Company’s approach to address business risks is comprehensive and includes periodic review of such risks and a framework for mitigating, controls and reporting mechanism of such risks. As per Listing Regulations, the Board of Directors of the Company are responsible for framing, implementing and monitoring the Risk Management plans of the Company. The Company has defined a “Risk Management Policy” and the same has been approved by the Board of Directors of the Company. Audit Committee plays a vital role in overseeing risk management.
A brief about the risk management of the Company is also given in the Management Discussion and Analysis Report.
13. Corporate Social Responsibility (CSR)
The Company has set up a dedicated trust, namely ‘Fiem Foundation’ as CSR Vehicle for undertaking Company’s CSR programmes as per Schedule VII read with Companies (Corporate Social Responsibility Policy) Rules, 2014. Company whole-heartedly supported the CSR provisions and remained compliant with the statutory requirements. Underprivileged section and supporting them for better life has remained the focus of CSR activities. Extending the financial support to the poor and needy patients for their treatment, has remained the major activity under CSR.
Company has also collaborated with ‘The Earth Saviours Foundation’ which takes care the abandoned citizens and run old age home. Your Company always seeks ways to make a positive impact on the underprivileged strata of the society at large through various CSR activities. In our pursuit of Corporate Social Responsibility as per the Companies Act, 2013, we have selected ‘health cure’ and ‘supporting the poor for better life’ as one of area of intervention and way of serving the humanity.
To help the poor and needy patents, we have collaborated with ‘Social Welfare Unit of AIIMS’, Delhi and disburse the financial assistance amount as and when they recommend to help the poor and needy patients suffering from cancer and other life-threatening diseases for getting their treatment done in AIIMS. We are doing this work through our CSR Vehicle ‘Fiem Foundation’.
Apart from AIIMS, Company also provide financial assistance of Rs. 80,000/- per month to ‘The Earth Saviours Foundation’, a recognized NGO which is running ‘Old Age Home & Rescue Centre’ to provide the facilities completely free of charge such as accommodation, medical and every day needs for caring the people who are abandoned senior citizens, deprived, mentally disabled, bedridden, HIV Infected, patients on death bed, people dying with hunger on roads and patients suffering with incurable disease.
Company / Fiem Foundation support various other NGOs as well as extend direct financial support to the needy patients in exceptional cases and also conduct other social welfare programme like arranging mass marriages for poor girls, free eye operation and other activities to help underprivileged. Company also providing financial support to ‘Kutch Vikas Trust’ which organizing eye and dental operation camps for poor patients.
The brief outline of the Corporate Social Responsibility (CSR) Policy of the Company and the initiatives undertaken by the Company on CSR activities during the year are set out in Annexure V of this report in the format prescribed in the Companies (Corporate Social Responsibility Policy) Rules, 2014. For details regarding the CSR Committee, please refer the Corporate Governance Report, which forms part of Annual Report. The CSR Policy is available on the website of the Company (www.fiemindustries.com/investors).
14. Annual Evaluation of the Performance of the Board, Committees and Directors
Performance Evaluation for Board is aimed to use constructively as a mechanism to improve Board’s effectiveness, maximize strengths and tackle weaknesses. It involves questionnaires to be filled by every Director about his own performance (self-assessment), performance of Board as whole, performance of Chairman and performance of respective Committee(s) where he is a Member.
Initially, Nomination & Remuneration Committee carry out the primary evaluation of every Director’s performance which is subject to next level of evaluation by the Board and Independent Directors. As per Section 178(2) of the Act, the Committee conduct the performance evaluation of every Individual Director. As per Performance Evaluation framework of the Company, the evaluation process consists of evaluation

36 | Fiem Industries Limited
on the basis of filled questionaries’ received from all directors and opinions, inputs from all Committee members and any other information as may be required by the Committee.
The outcome of Committee in respect of Independent Directors is subject to final evaluation by the Board. Outcome of Committee in respect of Non-Independent Directors is subject to final evaluation by the Independent Directors. Performance evaluation of Board as a whole as well as Chairman of the Board is also conducted by the Independent Directors.
15. Highlights of performance of subsidiaries, associates and joint venture companies and their contribution to the overall performance of the Company during the period under review.
At present, there are 3 JV Companies (JVC) and 3 Wholly-owned subsidiaries (WOS) as listed in initial paragraph of this report.
a) Aisan Fiem Automotives India Pvt. Ltd. (AFI):
This JV Company was incorporated on 7th June, 2018, in India. Total equity investment in the JV Company is Rs. 100 Crore, wherein Fiem Industries hold 26%, Aisan hold 69% and Toyota Tsusho hold 5%. The JV Company has established its factory in ELCINA Electronic Manufacturing Cluster in Tapukara, Rajasthan for production of Fuel Pump Module. The Company yet to start mass production supply to its customer. This being the first year of its operation, hence it has incurred a loss due to initial expenses, accordingly profits of the Fiem Industries impacted.
The Financial highlights of AFI is as under:
(Amount Rs In lacs)Particulars FY 2018-19 FY 2017-18% of shareholding 26% -Revenue 10.56 -Expenses 217.92 -Profit or loss from continuing operations
(105.05) -
Total comprehensive income (105.05) -
b) Fiem Kyowa (HK) Mould Company Limited:
This JV Company was formed in Hong Kong as 50:50 joint venture company with Kyowa Co., Ltd. of Japan. The purpose of setting-up of JV was to engage in the business of high class moulds / tools for Automotive and other applications. The Company has started its operations during FY 2018-19. There is no major investment in this company and this company is providing support for mould
development for OEMs. The contribution / or impact on performance of Fiem Industries is negligible.
The Financial highlights of Fiem Kyowa (HK) Mould Company is as under:
(Amount Rs In lacs)Particulars FY 2018-19 FY 2017-18% of shareholding 50% 50%Revenue 68.55 -Expenses 60.50 0.32Profit or loss from continuing operations
8.05 (0.32)
Total comprehensive income 8.05 (0.32)
c) Centro Ricerche Fiem HorustecH S.r.l. (CRFH) (Joint Venture in Italy):
The Company was set-up in Italy as a 50:50 JV with Horustech Lighting of Italy, which is a Designing Company. The purpose of setting-up of JV was to strengthen R&D and Designing capabilities of the Company. However, due to some financial problems in Horustech group companies, the management of both companies i.e. Horustech Lighting and Fiem Industries Limited has mutually decided to move ahead to liquidate the CRFH. There is no major investment in this company and this company was providing Design Services to Fiem Industries. The contribution or impact on performance of Fiem Industries is negligible.
The Financial highlights of CRFH is as under:
(Amount Rs In lacs)Particulars FY 2018-19 FY 2017-18% of shareholding 50% 50%Revenue 99.12 104.42 Expenses 101.23 108.28 Profit or loss from containing operations
(2.11) (3.86)
Total comprehensive income (2.11) (3.86)
d) Fiem Industries Japan Co., Ltd. (Wholly-owned Subsidiary):
This WOS was set-up in Japan as an extended arm of the Company for liaison with Japanese customers like Honda, Suzuki and Yamaha etc., support in Designing, R&D and new business development. While the parent Company (Fiem) is getting full support in above areas, the financials of the subsidiary are at very small scale. There is no major financial contribution or impact on performance of Fiem Industries.

Annual Report 2018-19 | 37
Financial Highlights of Fiem Industries Japan Co. Ltd. (Japan)
(Amount Rs In lacs)FY 2018-19 FY 2017-18
% of shareholding 100% 100%Revenue 559.28 199.78Total Income 559.34 199.78Total expenses 371.35 196.04Profit/(Loss) before taxation 187.99 3.74Provision for taxation 73.26 1.17Profit/ (Loss) after taxation 114.73 2.57
e) Fiem Research and Technology S.r.l. (Wholly-owned Subsidiary in Italy):
During the financial year, this Wholly-owned Subsidiary was incorporated in Italy, on December 17, 2018 and a Design Centre set-up under this Company in Turin, Italy. Company is getting Design Services from this WOS on regular basis on Automotive LED Lamps for esteemed OEM customers. This is a wholly-owned subsidiary and providing Design Services to Fiem Industries only, so working like an extended arm of Fiem Industries for Design Services.
Financial Highlights of Fiem Research and Technology S.r.l (Italy)
(Amount Rs In lacs)FY 2018-19
% of shareholding 100%Revenue 55.94Total expenses 54.70Profit/(Loss) before taxation 1.24Provision for taxation 0.32Profit/ (Loss) after taxation 0.92
f) Fiem (Thai) Design & Technology Co. Ltd.:
This Wholly-owned Subsidiary company was formed in Bangkok, Thailand on June 15, 2017 for the purpose of setting up a Design Centre for Designing, Development and R&D support to Fiem Industries Limited. This company has not started its operations during FY 2017-18 and 2018-19. Meantime, Fiem Industries has established Design Centre in Italy and Management of Fiem is of the view that in changing scenario, decision of setting-up Design Centre in Bangkok does not hold good and now this company would be closed by completing the formalities as per Thai laws.
The financial position of the subsidiaries and Joint Venture Companies is also given in AOC-1 in the financial statements.
16. Other statutory disclosures as required under Rule 8(5) of the Companies (Accounts) Rules, 2014
i) Financial summary/ highlights of the Company are already mentioned in the beginning of the report.
ii) There is no change in the nature of business of the Company.
iii) Change in Directors and Key Managerial Personnel:
• Pursuant to provisions of Section 152 of the Companies Act, 2013 and in accordance with provisions of Articles of Association of the Company, Mr. Joga Shyam Sunder Rao and Mr. Kashi Ram Yadav, Whole-time Directors of the Company liable to retire by rotation and being eligible have offered themselves for re-appointment and they are not disqualified under Section 164(2) of the Companies Act, 2013.
• The current tenure of 5 Independent Directors, namely, Mr. S.K. Jain, Mr. Iqbal Singh, Mr. V.K. Malhotra, Mr. Jawahar Thakur and Mr. Ashok Kumar Sharma is completing on ensuing Annual General meeting and all these are eligible for re-appointment for one more term of 5 years. Current tenure of Mr. Mohan Bir Sahni is completing on August 08, 2019 and he is also eligible for one more term of 5 years. All these Independent Directors will be proposed for re-appointment in ensuing Annual General Meeting.
• The details of Directors being proposed for appointment/ re-appointment as required under the Listing Regulations will be in the Notice convening the ensuing Annual General Meeting of the Company.
• Mr. J.K. Jain, Chairman & Managing Director; Mr. O. P. Gupta, Chief Financial Officer and Mr. Arvind K. Chauhan, Company Secretary are the Key Managerial Personnel of the Company within the meaning of Section 203 of the Act.
• None of the Key Managerial Personnel has resigned or appointed during the year under review.
iv) During the financial year, one Wholly-owned Subsidiary Fiem Research and Technology S.r.l. formed in Italy and one Joint Venture Company Aisan Fiem Automotives India Pvt. Ltd. incorporated in India as Joint Venture Company. The details of these companies already provided in the preceding paragraphs.
v) Details relating to Deposits:
The Company has not accepted any Deposit from public within the meaning of the Companies (Acceptance of Deposit) Rules, 1975 or Chapter V of the Companies Act, 2013 and as such there was no outstanding as on the date
38 | Fiem Industries Limited
of the balance sheet on account of principal or interest on deposits from public.
vi) No significant and material orders were passed by any Regulator or court or tribunal impacting the going concern status and Company’s operations in future.
vii) Details in respect of adequacy of internal financial controls with reference to the Financial Statement:
The Company has in place adequate internal financial controls, which are commensurate to size and operations of the Company. During the year, no area of concern, continuing failure or major weakness was observed.
viii) It is confirmed that maintenance of cost records as specified by the Central Government under sub-section (1) of section 148 of the Companies Act, 2013, is required by the Company and accordingly such accounts and records are made and maintained.
ix) It is confirmed that that the Company has complied with provisions relating to the constitution of Internal Complaints Committee (s) under the Sexual Harassment of Women at Workplace (Prevention, Prohibition and Redressal) Act, 2013.
x) Other disclosures required under provisions of the Companies Act, 2013 and the Listing Regulations, as may be applicable:
• As per provisions of Section 177(8) of the Act, composition of the Audit Committee has been disclosed under Corporate Governance Report. The Board, during the year under review, had accepted all the recommendation made to it by the Audit Committee.
• Establishment of vigil mechanism as per provision of Section 177(10) of the Act: Company has already at place a vigil mechanism namely, ‘Whistle Blower Policy’. The details of the same are reported under Corporate Governance Report.
• The details about the ratio of remuneration of each director to the median remuneration of the employees of the Company pursuant to Section 197(12) of the Act read with Rule 5(1) of the Companies (Appointment and Remuneration of Managerial Personnel) Rules, 2014, as amended, is provided in Annexure VI, forming part of this report.
• The statement containing names and other details of top 10 employees, in terms of remuneration drawn and the particulars of employees as required under Section 197(12) of the Act read with Rule 5(2)&(3) of
the Companies (Appointment and Remuneration of Managerial Personnel) Rules, 2014, as amended, is provided in Annexure VII forming part of this report.
• Disclosure as required under Section 62(1)(b) of the Act read with Sub-rule 9 of Rule 12 of the Companies (Share and Capital Debentures) Rules, 2014, are not applicable, as during the year no shares were issued under ESOS / ESOP or under sweat equity scheme.
• Disclosure as required under Section 43(a)(ii) of the Act read with Sub-rule 4 of Rule 4 of the Companies (Share and Capital Debentures) Rules, 2014, are not applicable as during the year no equity shares with differential rights as to dividend, voting or otherwise were issued.
Corporate Governance Report and Management Discussion & Analysis ReportPursuant to Listing Regulations, Management Discussion & Analysis Report, Report on Corporate Governance, Certificate on Corporate Governance, issued by Practicing Company Secretary and the declaration by the Chairman & Managing Director regarding affirmation for compliance with the Company’s Code of Conduct forms part of the Annual Report.
Consolidated Financial StatementsIn accordance with the Companies Act, 2013 (“the Act”) read with Ind AS, the audited consolidated financial statements are provided in the Annual Report. The accounts of Wholly-owned Subsidiary companies and JV Companies are consolidated with the accounts of the Company.
AcknowledgementThe Board of Directors sincerely acknowledge the patronage of valued OEM customers and would like to place on record appreciation for employees of the Company for their sincere working during all times. The Directors are also thankful to the shareholders of the Company for the trust reposed in the Company. Directors would also like to thank all other stakeholders, banks, dealers and vendors for their co-operation and support to the Company.
For and on behalf of the Board of Fiem Industries Limited
Sd/- J.K. JainPlace : Rai, Sonepat (HR.) Chairman & Managing DirectorDate : May 14, 2019 (DIN: 00013356)
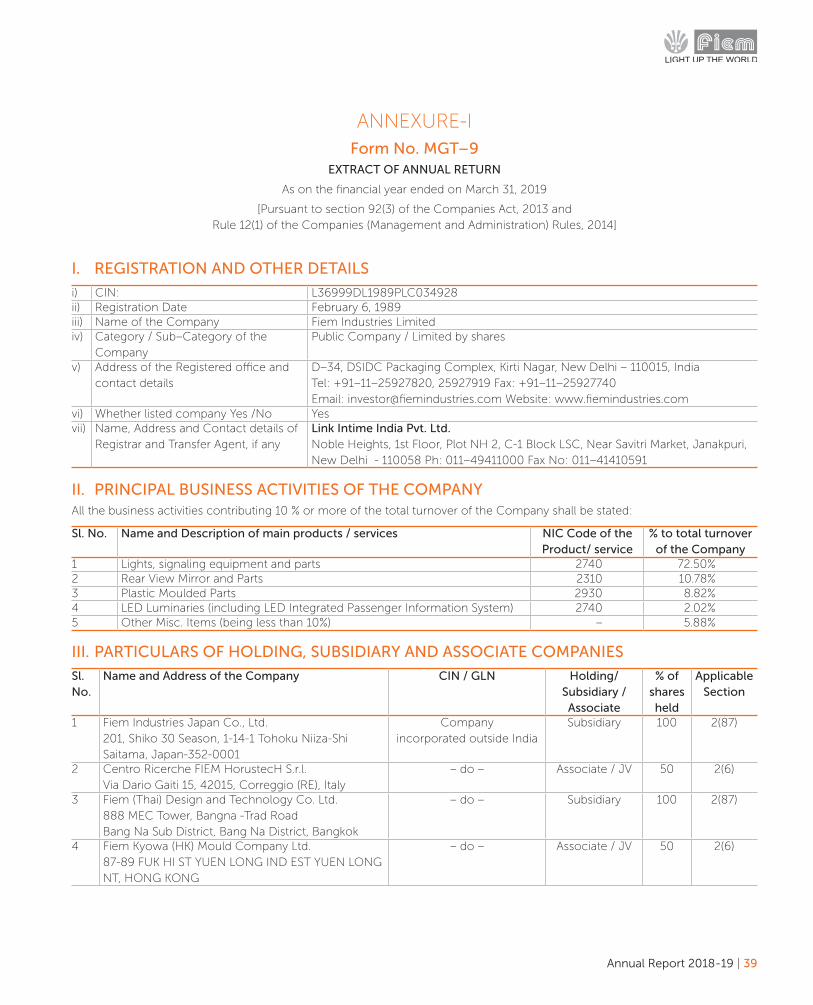
Annual Report 2018-19 | 39
ANNEXURE-IForm No. MGT–9
EXTRACT OF ANNUAL RETURN
As on the financial year ended on March 31, 2019
[Pursuant to section 92(3) of the Companies Act, 2013 and Rule 12(1) of the Companies (Management and Administration) Rules, 2014]
I. REGISTRATION AND OTHER DETAILS
i) CIN: L36999DL1989PLC034928ii) Registration Date February 6, 1989iii) Name of the Company Fiem Industries Limitediv) Category / Sub–Category of the
CompanyPublic Company / Limited by shares
v) Address of the Registered office and contact details
D–34, DSIDC Packaging Complex, Kirti Nagar, New Delhi – 110015, IndiaTel: +91–11–25927820, 25927919 Fax: +91–11–25927740Email: [email protected] Website: www.fiemindustries.com
vi) Whether listed company Yes /No Yesvii) Name, Address and Contact details of
Registrar and Transfer Agent, if anyLink Intime India Pvt. Ltd.Noble Heights, 1st Floor, Plot NH 2, C-1 Block LSC, Near Savitri Market, Janakpuri, New Delhi - 110058 Ph: 011–49411000 Fax No: 011–41410591
II. PRINCIPAL BUSINESS ACTIVITIES OF THE COMPANYAll the business activities contributing 10 % or more of the total turnover of the Company shall be stated:
Sl. No. Name and Description of main products / services NIC Code of the Product/ service
% to total turnover of the Company
1 Lights, signaling equipment and parts 2740 72.50%2 Rear View Mirror and Parts 2310 10.78%3 Plastic Moulded Parts 2930 8.82%4 LED Luminaries (including LED Integrated Passenger Information System) 2740 2.02%5 Other Misc. Items (being less than 10%) – 5.88%
III. PARTICULARS OF HOLDING, SUBSIDIARY AND ASSOCIATE COMPANIES
Sl. No.
Name and Address of the Company CIN / GLN Holding/ Subsidiary / Associate
% of shares held
Applicable Section
1 Fiem Industries Japan Co., Ltd. 201, Shiko 30 Season, 1-14-1 Tohoku Niiza-Shi Saitama, Japan-352-0001
Company incorporated outside India
Subsidiary 100 2(87)
2 Centro Ricerche FIEM HorustecH S.r.l.Via Dario Gaiti 15, 42015, Correggio (RE), Italy
– do – Associate / JV 50 2(6)
3 Fiem (Thai) Design and Technology Co. Ltd.888 MEC Tower, Bangna -Trad RoadBang Na Sub District, Bang Na District, Bangkok
– do – Subsidiary 100 2(87)
4 Fiem Kyowa (HK) Mould Company Ltd.87-89 FUK HI ST YUEN LONG IND EST YUEN LONG NT, HONG KONG
– do – Associate / JV 50 2(6)
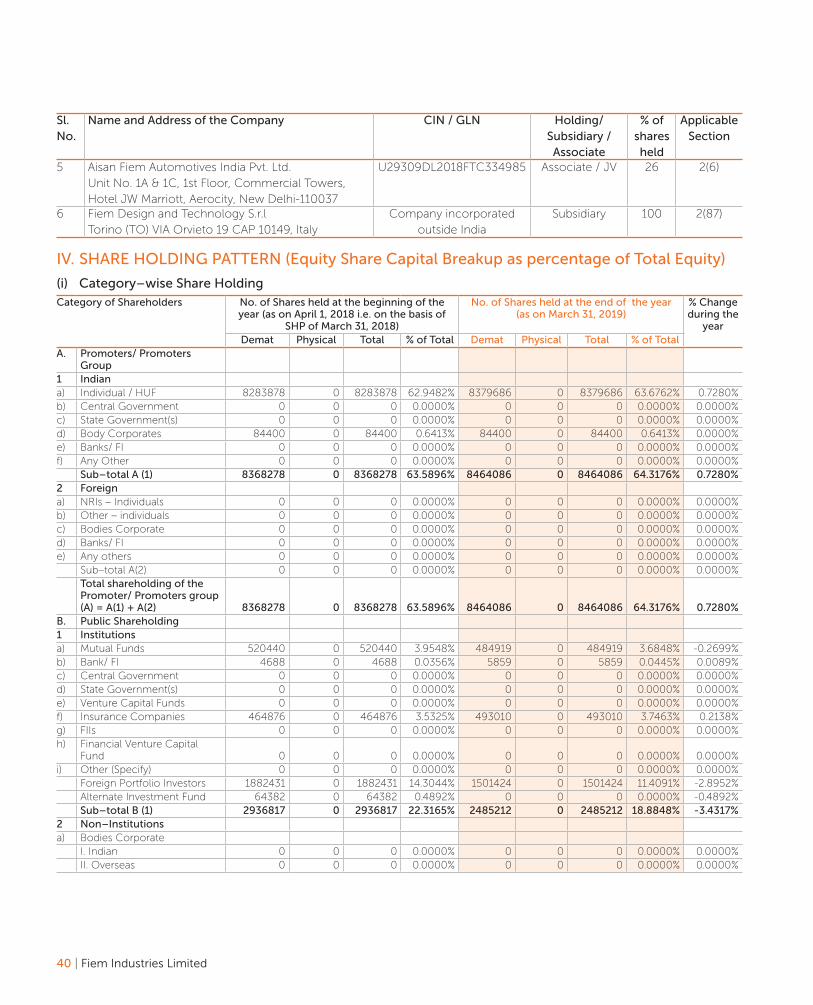
40 | Fiem Industries Limited
Sl. No.
Name and Address of the Company CIN / GLN Holding/ Subsidiary / Associate
% of shares held
Applicable Section
5 Aisan Fiem Automotives India Pvt. Ltd.Unit No. 1A & 1C, 1st Floor, Commercial Towers, Hotel JW Marriott, Aerocity, New Delhi-110037
U29309DL2018FTC334985 Associate / JV 26 2(6)
6 Fiem Design and Technology S.r.lTorino (TO) VIA Orvieto 19 CAP 10149, Italy
Company incorporated outside India
Subsidiary 100 2(87)
IV. SHARE HOLDING PATTERN (Equity Share Capital Breakup as percentage of Total Equity)
(i) Category–wise Share HoldingCategory of Shareholders
No. of Shares held at the beginning of the year (as on April 1, 2018 i.e. on the basis of
SHP of March 31, 2018)
No. of Shares held at the end of the year (as on March 31, 2019)
% Change during the
yearDemat Physical Total % of Total Demat Physical Total % of Total
A. Promoters/ Promoters Group
1 Indian a) Individual / HUF 8283878 0 8283878 62.9482% 8379686 0 8379686 63.6762% 0.7280%b) Central Government 0 0 0 0.0000% 0 0 0 0.0000% 0.0000%c) State Government(s) 0 0 0 0.0000% 0 0 0 0.0000% 0.0000%d) Body Corporates 84400 0 84400 0.6413% 84400 0 84400 0.6413% 0.0000%e) Banks/ FI 0 0 0 0.0000% 0 0 0 0.0000% 0.0000%f) Any Other 0 0 0 0.0000% 0 0 0 0.0000% 0.0000% Sub–total A (1) 8368278 0 8368278 63.5896% 8464086 0 8464086 64.3176% 0.7280%2 Foreign a) NRIs – Individuals 0 0 0 0.0000% 0 0 0 0.0000% 0.0000%b) Other – individuals 0 0 0 0.0000% 0 0 0 0.0000% 0.0000%c) Bodies Corporate 0 0 0 0.0000% 0 0 0 0.0000% 0.0000%d) Banks/ FI 0 0 0 0.0000% 0 0 0 0.0000% 0.0000%e) Any others 0 0 0 0.0000% 0 0 0 0.0000% 0.0000% Sub–total A(2) 0 0 0 0.0000% 0 0 0 0.0000% 0.0000% Total shareholding of the
Promoter/ Promoters group (A) = A(1) + A(2) 8368278 0 8368278 63.5896% 8464086 0 8464086 64.3176% 0.7280%
B. Public Shareholding 1 Institutions a) Mutual Funds 520440 0 520440 3.9548% 484919 0 484919 3.6848% -0.2699%b) Bank/ FI 4688 0 4688 0.0356% 5859 0 5859 0.0445% 0.0089%c) Central Government 0 0 0 0.0000% 0 0 0 0.0000% 0.0000%d) State Government(s) 0 0 0 0.0000% 0 0 0 0.0000% 0.0000%e) Venture Capital Funds 0 0 0 0.0000% 0 0 0 0.0000% 0.0000%f) Insurance Companies 464876 0 464876 3.5325% 493010 0 493010 3.7463% 0.2138%g) FIIs 0 0 0 0.0000% 0 0 0 0.0000% 0.0000%h) Financial Venture Capital
Fund 0 0 0 0.0000% 0 0 0 0.0000% 0.0000%i) Other (Specify) 0 0 0 0.0000% 0 0 0 0.0000% 0.0000% Foreign Portfolio Investors 1882431 0 1882431 14.3044% 1501424 0 1501424 11.4091% -2.8952% Alternate Investment Fund 64382 0 64382 0.4892% 0 0 0 0.0000% -0.4892% Sub–total B (1) 2936817 0 2936817 22.3165% 2485212 0 2485212 18.8848% -3.4317%2 Non–Institutions a) Bodies Corporate I. Indian 0 0 0 0.0000% 0 0 0 0.0000% 0.0000% II. Overseas 0 0 0 0.0000% 0 0 0 0.0000% 0.0000%
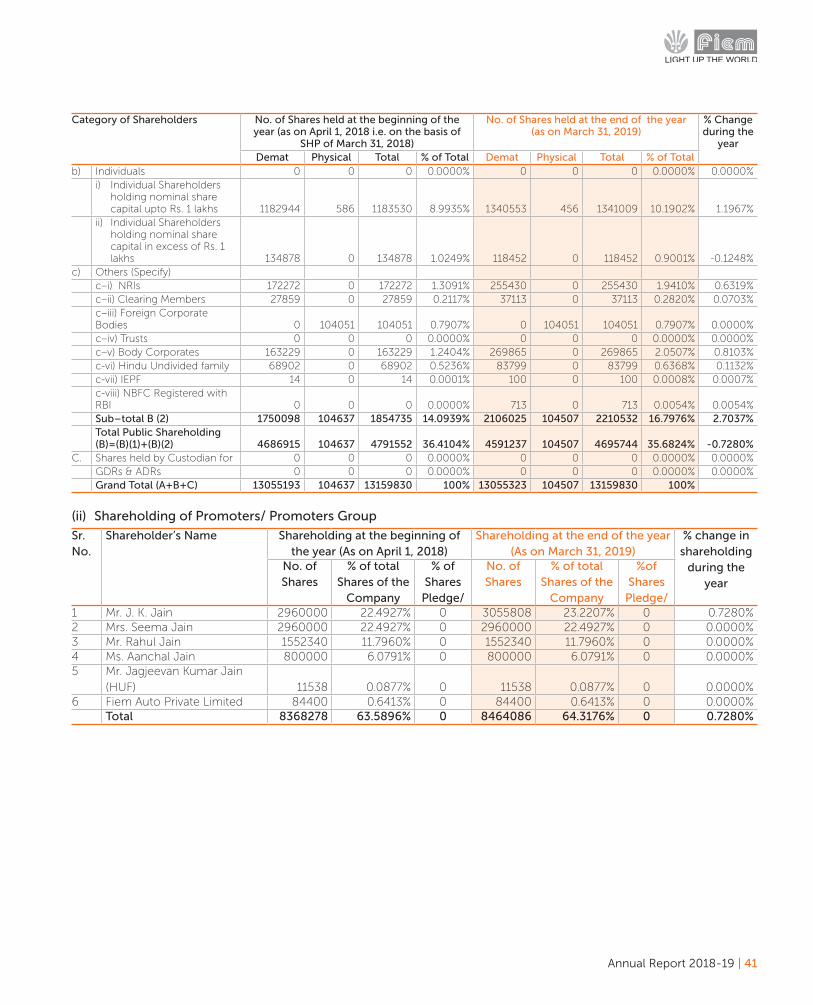
Annual Report 2018-19 | 41
Category of Shareholders
No. of Shares held at the beginning of the year (as on April 1, 2018 i.e. on the basis of
SHP of March 31, 2018)
No. of Shares held at the end of the year (as on March 31, 2019)
% Change during the
yearDemat Physical Total % of Total Demat Physical Total % of Total
b) Individuals 0 0 0 0.0000% 0 0 0 0.0000% 0.0000% i) Individual Shareholders
holding nominal share capital upto Rs. 1 lakhs 1182944 586 1183530 8.9935% 1340553 456 1341009 10.1902% 1.1967%
ii) Individual Shareholders holding nominal share capital in excess of Rs. 1 lakhs 134878 0 134878 1.0249% 118452 0 118452 0.9001% -0.1248%
c) Others (Specify) c–i) NRIs 172272 0 172272 1.3091% 255430 0 255430 1.9410% 0.6319% c–ii) Clearing Members 27859 0 27859 0.2117% 37113 0 37113 0.2820% 0.0703% c–iii) Foreign Corporate
Bodies 0 104051 104051 0.7907% 0 104051 104051 0.7907% 0.0000% c–iv) Trusts 0 0 0 0.0000% 0 0 0 0.0000% 0.0000% c–v) Body Corporates 163229 0 163229 1.2404% 269865 0 269865 2.0507% 0.8103% c-vi) Hindu Undivided family 68902 0 68902 0.5236% 83799 0 83799 0.6368% 0.1132% c-vii) IEPF 14 0 14 0.0001% 100 0 100 0.0008% 0.0007% c-viii) NBFC Registered with
RBI 0 0 0 0.0000% 713 0 713 0.0054% 0.0054% Sub–total B (2) 1750098 104637 1854735 14.0939% 2106025 104507 2210532 16.7976% 2.7037% Total Public Shareholding
(B)=(B)(1)+(B)(2) 4686915 104637 4791552 36.4104% 4591237 104507 4695744 35.6824% -0.7280%C. Shares held by Custodian for 0 0 0 0.0000% 0 0 0 0.0000% 0.0000% GDRs & ADRs 0 0 0 0.0000% 0 0 0 0.0000% 0.0000% Grand Total (A+B+C) 13055193 104637 13159830 100% 13055323 104507 13159830 100%
(ii) Shareholding of Promoters/ Promoters Group
Sr. No.
Shareholder’s Name Shareholding at the beginning of the year (As on April 1, 2018)
Shareholding at the end of the year (As on March 31, 2019)
% change in shareholding
during the year
No. of Shares
% of total Shares of the
Company
% of Shares
Pledge/
No. of Shares
% of total Shares of the
Company
%of Shares
Pledge/1 Mr. J. K. Jain 2960000 22.4927% 0 3055808 23.2207% 0 0.7280%2 Mrs. Seema Jain 2960000 22.4927% 0 2960000 22.4927% 0 0.0000%3 Mr. Rahul Jain 1552340 11.7960% 0 1552340 11.7960% 0 0.0000%4 Ms. Aanchal Jain 800000 6.0791% 0 800000 6.0791% 0 0.0000%5 Mr. Jagjeevan Kumar Jain
(HUF) 11538 0.0877% 0 11538 0.0877% 0 0.0000%6 Fiem Auto Private Limited 84400 0.6413% 0 84400 0.6413% 0 0.0000% Total 8368278 63.5896% 0 8464086 64.3176% 0 0.7280%
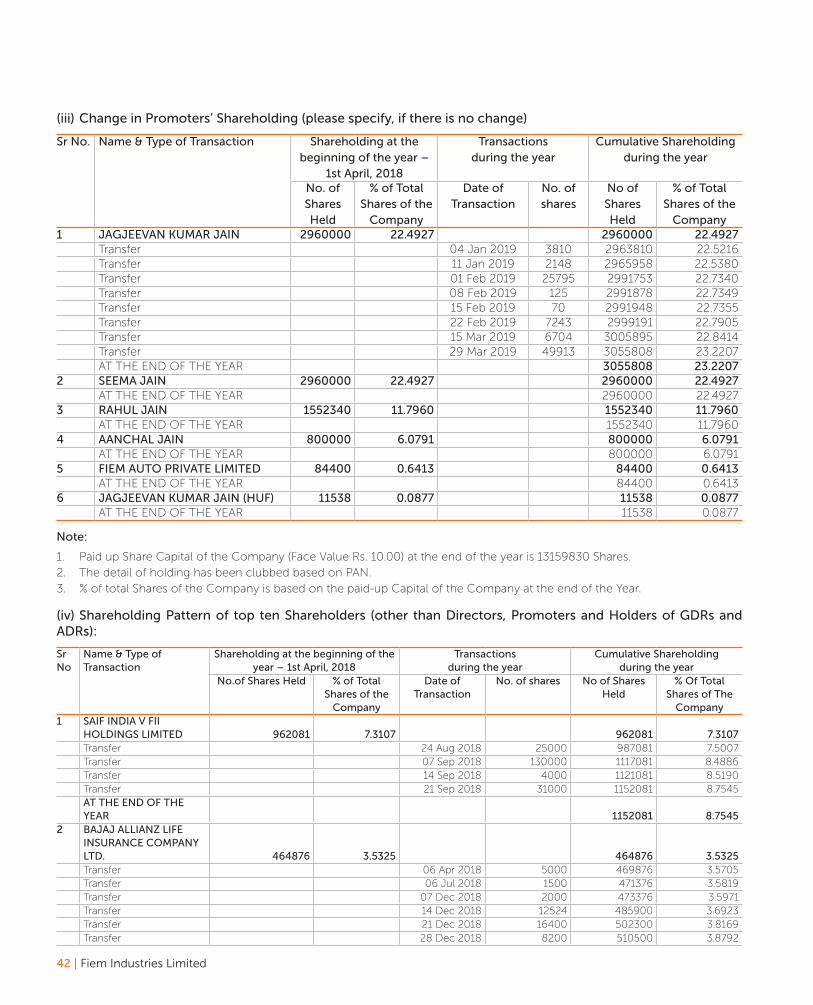
42 | Fiem Industries Limited
(iii) Change in Promoters’ Shareholding (please specify, if there is no change)
Sr No. Name & Type of Transaction Shareholding at the beginning of the year –
1st April, 2018
Transactions during the year
Cumulative Shareholding during the year
No. of Shares Held
% of Total Shares of the
Company
Date of Transaction
No. of shares
No of Shares Held
% of Total Shares of the
Company1 JAGJEEVAN KUMAR JAIN 2960000 22.4927 2960000 22.4927 Transfer 04 Jan 2019 3810 2963810 22.5216 Transfer 11 Jan 2019 2148 2965958 22.5380 Transfer 01 Feb 2019 25795 2991753 22.7340 Transfer 08 Feb 2019 125 2991878 22.7349 Transfer 15 Feb 2019 70 2991948 22.7355 Transfer 22 Feb 2019 7243 2999191 22.7905 Transfer 15 Mar 2019 6704 3005895 22.8414 Transfer 29 Mar 2019 49913 3055808 23.2207 AT THE END OF THE YEAR 3055808 23.22072 SEEMA JAIN 2960000 22.4927 2960000 22.4927 AT THE END OF THE YEAR 2960000 22.49273 RAHUL JAIN 1552340 11.7960 1552340 11.7960 AT THE END OF THE YEAR 1552340 11.79604 AANCHAL JAIN 800000 6.0791 800000 6.0791 AT THE END OF THE YEAR 800000 6.07915 FIEM AUTO PRIVATE LIMITED 84400 0.6413 84400 0.6413 AT THE END OF THE YEAR 84400 0.64136 JAGJEEVAN KUMAR JAIN (HUF) 11538 0.0877 11538 0.0877 AT THE END OF THE YEAR 11538 0.0877
Note:
1. Paid up Share Capital of the Company (Face Value Rs. 10.00) at the end of the year is 13159830 Shares.2. The detail of holding has been clubbed based on PAN.3. % of total Shares of the Company is based on the paid-up Capital of the Company at the end of the Year.
(iv) Shareholding Pattern of top ten Shareholders (other than Directors, Promoters and Holders of GDRs and ADRs):
Sr No
Name & Type of Transaction
Shareholding at the beginning of the year – 1st April, 2018
Transactionsduring the year
Cumulative Shareholdingduring the year
No.of Shares Held % of Total Shares of the
Company
Date of Transaction
No. of shares No of Shares Held
% Of Total Shares of The
Company1 SAIF INDIA V FII
HOLDINGS LIMITED 962081 7.3107 962081 7.3107Transfer 24 Aug 2018 25000 987081 7.5007Transfer 07 Sep 2018 130000 1117081 8.4886Transfer 14 Sep 2018 4000 1121081 8.5190Transfer 21 Sep 2018 31000 1152081 8.7545AT THE END OF THE YEAR 1152081 8.7545
2 BAJAJ ALLIANZ LIFE INSURANCE COMPANY LTD. 464876 3.5325 464876 3.5325Transfer 06 Apr 2018 5000 469876 3.5705Transfer 06 Jul 2018 1500 471376 3.5819Transfer 07 Dec 2018 2000 473376 3.5971Transfer 14 Dec 2018 12524 485900 3.6923Transfer 21 Dec 2018 16400 502300 3.8169Transfer 28 Dec 2018 8200 510500 3.8792
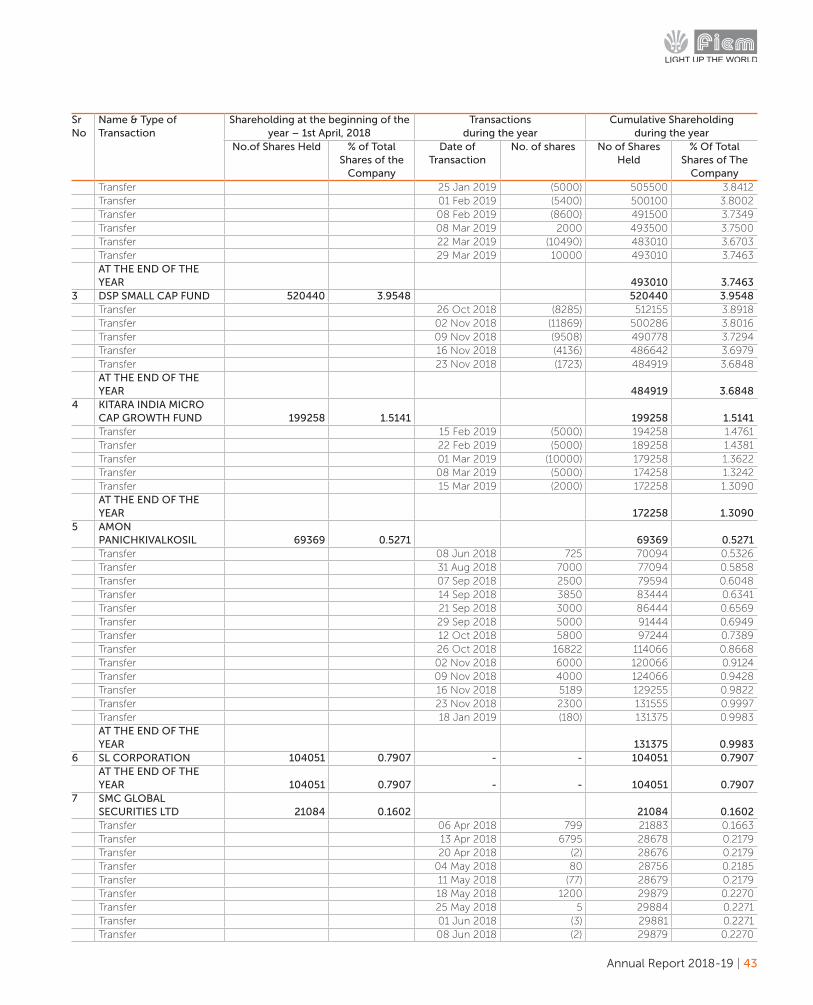
Annual Report 2018-19 | 43
Sr No
Name & Type of Transaction
Shareholding at the beginning of the year – 1st April, 2018
Transactionsduring the year
Cumulative Shareholdingduring the year
No.of Shares Held % of Total Shares of the
Company
Date of Transaction
No. of shares No of Shares Held
% Of Total Shares of The
CompanyTransfer 25 Jan 2019 (5000) 505500 3.8412Transfer 01 Feb 2019 (5400) 500100 3.8002Transfer 08 Feb 2019 (8600) 491500 3.7349Transfer 08 Mar 2019 2000 493500 3.7500Transfer 22 Mar 2019 (10490) 483010 3.6703Transfer 29 Mar 2019 10000 493010 3.7463AT THE END OF THE YEAR 493010 3.7463
3 DSP SMALL CAP FUND 520440 3.9548 520440 3.9548Transfer 26 Oct 2018 (8285) 512155 3.8918Transfer 02 Nov 2018 (11869) 500286 3.8016Transfer 09 Nov 2018 (9508) 490778 3.7294Transfer 16 Nov 2018 (4136) 486642 3.6979Transfer 23 Nov 2018 (1723) 484919 3.6848AT THE END OF THE YEAR 484919 3.6848
4 KITARA INDIA MICRO CAP GROWTH FUND 199258 1.5141 199258 1.5141Transfer 15 Feb 2019 (5000) 194258 1.4761Transfer 22 Feb 2019 (5000) 189258 1.4381Transfer 01 Mar 2019 (10000) 179258 1.3622Transfer 08 Mar 2019 (5000) 174258 1.3242Transfer 15 Mar 2019 (2000) 172258 1.3090AT THE END OF THE YEAR 172258 1.3090
5 AMON PANICHKIVALKOSIL 69369 0.5271 69369 0.5271Transfer 08 Jun 2018 725 70094 0.5326Transfer 31 Aug 2018 7000 77094 0.5858Transfer 07 Sep 2018 2500 79594 0.6048Transfer 14 Sep 2018 3850 83444 0.6341Transfer 21 Sep 2018 3000 86444 0.6569Transfer 29 Sep 2018 5000 91444 0.6949Transfer 12 Oct 2018 5800 97244 0.7389Transfer 26 Oct 2018 16822 114066 0.8668Transfer 02 Nov 2018 6000 120066 0.9124Transfer 09 Nov 2018 4000 124066 0.9428Transfer 16 Nov 2018 5189 129255 0.9822Transfer 23 Nov 2018 2300 131555 0.9997Transfer 18 Jan 2019 (180) 131375 0.9983AT THE END OF THE YEAR 131375 0.9983
6 SL CORPORATION 104051 0.7907 - - 104051 0.7907AT THE END OF THE YEAR 104051 0.7907 - - 104051 0.7907
7 SMC GLOBAL SECURITIES LTD 21084 0.1602 21084 0.1602Transfer 06 Apr 2018 799 21883 0.1663Transfer 13 Apr 2018 6795 28678 0.2179Transfer 20 Apr 2018 (2) 28676 0.2179Transfer 04 May 2018 80 28756 0.2185Transfer 11 May 2018 (77) 28679 0.2179Transfer 18 May 2018 1200 29879 0.2270Transfer 25 May 2018 5 29884 0.2271Transfer 01 Jun 2018 (3) 29881 0.2271Transfer 08 Jun 2018 (2) 29879 0.2270
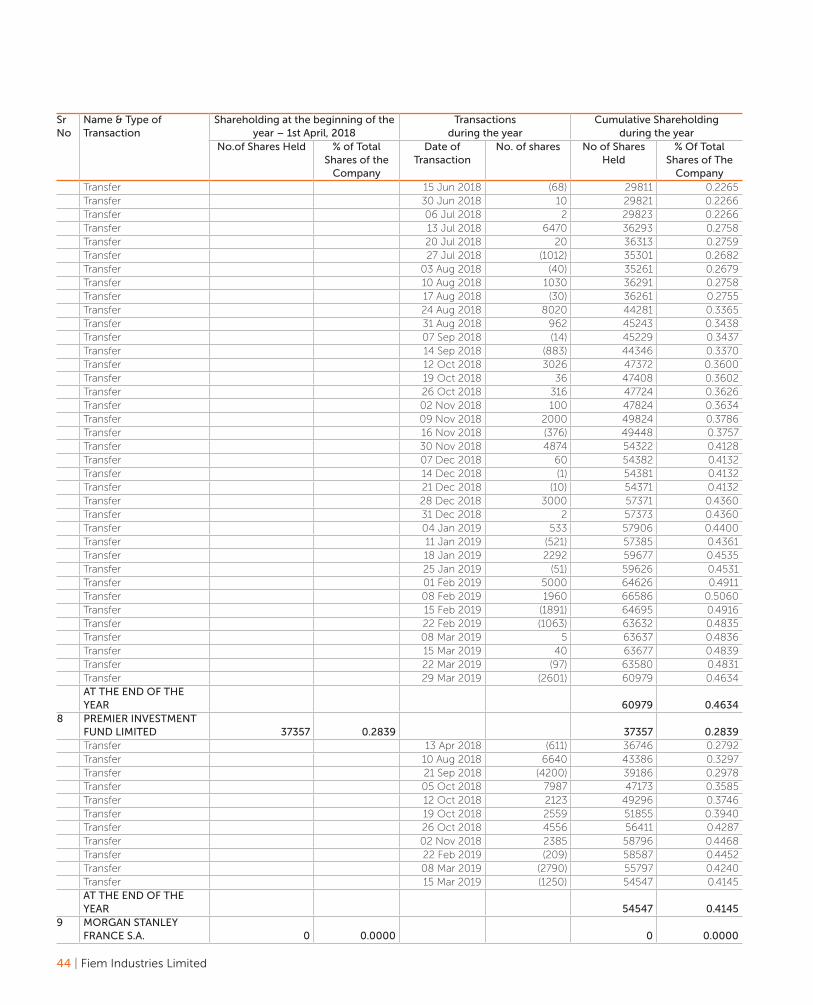
44 | Fiem Industries Limited
Sr No
Name & Type of Transaction
Shareholding at the beginning of the year – 1st April, 2018
Transactionsduring the year
Cumulative Shareholdingduring the year
No.of Shares Held % of Total Shares of the
Company
Date of Transaction
No. of shares No of Shares Held
% Of Total Shares of The
CompanyTransfer 15 Jun 2018 (68) 29811 0.2265Transfer 30 Jun 2018 10 29821 0.2266Transfer 06 Jul 2018 2 29823 0.2266Transfer 13 Jul 2018 6470 36293 0.2758Transfer 20 Jul 2018 20 36313 0.2759Transfer 27 Jul 2018 (1012) 35301 0.2682Transfer 03 Aug 2018 (40) 35261 0.2679Transfer 10 Aug 2018 1030 36291 0.2758Transfer 17 Aug 2018 (30) 36261 0.2755Transfer 24 Aug 2018 8020 44281 0.3365Transfer 31 Aug 2018 962 45243 0.3438Transfer 07 Sep 2018 (14) 45229 0.3437Transfer 14 Sep 2018 (883) 44346 0.3370Transfer 12 Oct 2018 3026 47372 0.3600Transfer 19 Oct 2018 36 47408 0.3602Transfer 26 Oct 2018 316 47724 0.3626Transfer 02 Nov 2018 100 47824 0.3634Transfer 09 Nov 2018 2000 49824 0.3786Transfer 16 Nov 2018 (376) 49448 0.3757Transfer 30 Nov 2018 4874 54322 0.4128Transfer 07 Dec 2018 60 54382 0.4132Transfer 14 Dec 2018 (1) 54381 0.4132Transfer 21 Dec 2018 (10) 54371 0.4132Transfer 28 Dec 2018 3000 57371 0.4360Transfer 31 Dec 2018 2 57373 0.4360Transfer 04 Jan 2019 533 57906 0.4400Transfer 11 Jan 2019 (521) 57385 0.4361Transfer 18 Jan 2019 2292 59677 0.4535Transfer 25 Jan 2019 (51) 59626 0.4531Transfer 01 Feb 2019 5000 64626 0.4911Transfer 08 Feb 2019 1960 66586 0.5060Transfer 15 Feb 2019 (1891) 64695 0.4916Transfer 22 Feb 2019 (1063) 63632 0.4835Transfer 08 Mar 2019 5 63637 0.4836Transfer 15 Mar 2019 40 63677 0.4839Transfer 22 Mar 2019 (97) 63580 0.4831Transfer 29 Mar 2019 (2601) 60979 0.4634AT THE END OF THE YEAR 60979 0.4634
8 PREMIER INVESTMENT FUND LIMITED 37357 0.2839 37357 0.2839Transfer 13 Apr 2018 (611) 36746 0.2792Transfer 10 Aug 2018 6640 43386 0.3297Transfer 21 Sep 2018 (4200) 39186 0.2978Transfer 05 Oct 2018 7987 47173 0.3585Transfer 12 Oct 2018 2123 49296 0.3746Transfer 19 Oct 2018 2559 51855 0.3940Transfer 26 Oct 2018 4556 56411 0.4287Transfer 02 Nov 2018 2385 58796 0.4468Transfer 22 Feb 2019 (209) 58587 0.4452Transfer 08 Mar 2019 (2790) 55797 0.4240Transfer 15 Mar 2019 (1250) 54547 0.4145AT THE END OF THE YEAR 54547 0.4145
9 MORGAN STANLEY FRANCE S.A. 0 0.0000 0 0.0000
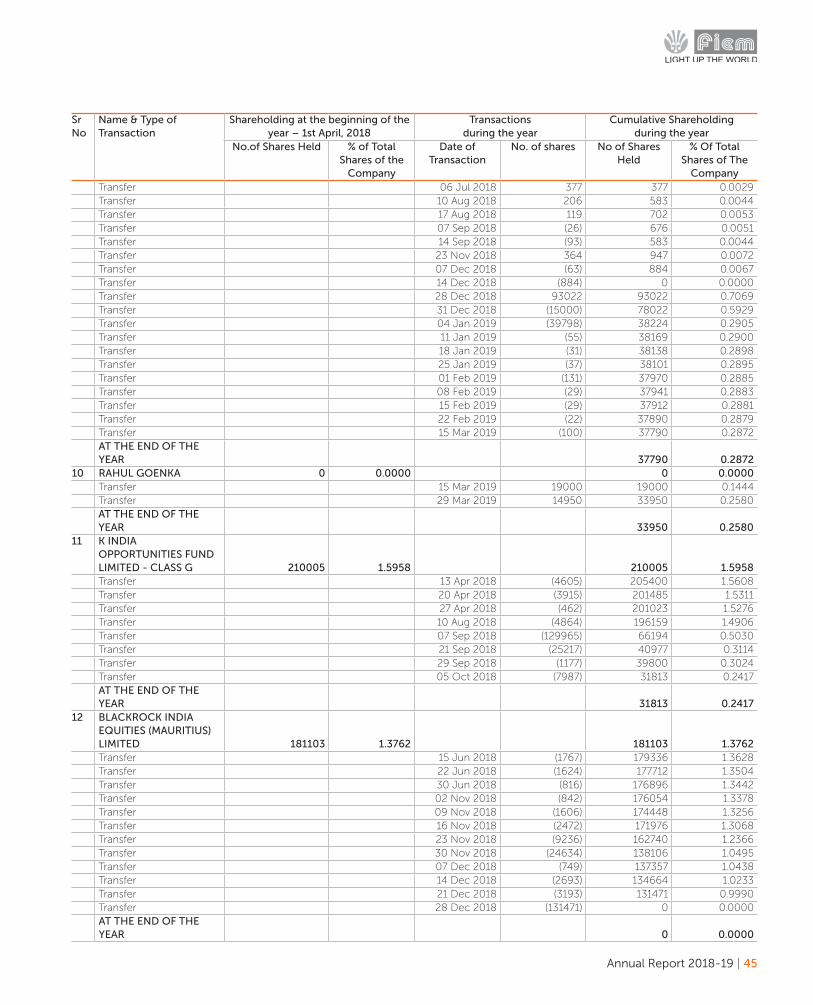
Annual Report 2018-19 | 45
Sr No
Name & Type of Transaction
Shareholding at the beginning of the year – 1st April, 2018
Transactionsduring the year
Cumulative Shareholdingduring the year
No.of Shares Held % of Total Shares of the
Company
Date of Transaction
No. of shares No of Shares Held
% Of Total Shares of The
CompanyTransfer 06 Jul 2018 377 377 0.0029Transfer 10 Aug 2018 206 583 0.0044Transfer 17 Aug 2018 119 702 0.0053Transfer 07 Sep 2018 (26) 676 0.0051Transfer 14 Sep 2018 (93) 583 0.0044Transfer 23 Nov 2018 364 947 0.0072Transfer 07 Dec 2018 (63) 884 0.0067Transfer 14 Dec 2018 (884) 0 0.0000Transfer 28 Dec 2018 93022 93022 0.7069Transfer 31 Dec 2018 (15000) 78022 0.5929Transfer 04 Jan 2019 (39798) 38224 0.2905Transfer 11 Jan 2019 (55) 38169 0.2900Transfer 18 Jan 2019 (31) 38138 0.2898Transfer 25 Jan 2019 (37) 38101 0.2895Transfer 01 Feb 2019 (131) 37970 0.2885Transfer 08 Feb 2019 (29) 37941 0.2883Transfer 15 Feb 2019 (29) 37912 0.2881Transfer 22 Feb 2019 (22) 37890 0.2879Transfer 15 Mar 2019 (100) 37790 0.2872AT THE END OF THE YEAR 37790 0.2872
10 RAHUL GOENKA 0 0.0000 0 0.0000Transfer 15 Mar 2019 19000 19000 0.1444Transfer 29 Mar 2019 14950 33950 0.2580AT THE END OF THE YEAR 33950 0.2580
11 K INDIA OPPORTUNITIES FUND LIMITED - CLASS G 210005 1.5958 210005 1.5958Transfer 13 Apr 2018 (4605) 205400 1.5608Transfer 20 Apr 2018 (3915) 201485 1.5311Transfer 27 Apr 2018 (462) 201023 1.5276Transfer 10 Aug 2018 (4864) 196159 1.4906Transfer 07 Sep 2018 (129965) 66194 0.5030Transfer 21 Sep 2018 (25217) 40977 0.3114Transfer 29 Sep 2018 (1177) 39800 0.3024Transfer 05 Oct 2018 (7987) 31813 0.2417AT THE END OF THE YEAR 31813 0.2417
12 BLACKROCK INDIA EQUITIES (MAURITIUS) LIMITED 181103 1.3762 181103 1.3762Transfer 15 Jun 2018 (1767) 179336 1.3628Transfer 22 Jun 2018 (1624) 177712 1.3504Transfer 30 Jun 2018 (816) 176896 1.3442Transfer 02 Nov 2018 (842) 176054 1.3378Transfer 09 Nov 2018 (1606) 174448 1.3256Transfer 16 Nov 2018 (2472) 171976 1.3068Transfer 23 Nov 2018 (9236) 162740 1.2366Transfer 30 Nov 2018 (24634) 138106 1.0495Transfer 07 Dec 2018 (749) 137357 1.0438Transfer 14 Dec 2018 (2693) 134664 1.0233Transfer 21 Dec 2018 (3193) 131471 0.9990Transfer 28 Dec 2018 (131471) 0 0.0000AT THE END OF THE YEAR 0 0.0000

46 | Fiem Industries Limited
Sr No
Name & Type of Transaction
Shareholding at the beginning of the year – 1st April, 2018
Transactionsduring the year
Cumulative Shareholdingduring the year
No.of Shares Held % of Total Shares of the
Company
Date of Transaction
No. of shares No of Shares Held
% Of Total Shares of The
Company13 KUWAIT INVESTMENT
AUTHORITY FUND 224 125439 0.9532 125439 0.9532Transfer 01 Feb 2019 (112) 125327 0.9523Transfer 08 Feb 2019 (2781) 122546 0.9312Transfer 15 Feb 2019 (2228) 120318 0.9143Transfer 22 Feb 2019 (7204) 113114 0.8595Transfer 01 Mar 2019 (3631) 109483 0.8319Transfer 08 Mar 2019 (21394) 88089 0.6694Transfer 15 Mar 2019 (32678) 55411 0.4211Transfer 22 Mar 2019 (14781) 40630 0.3087Transfer 29 Mar 2019 (40630) 0 0.0000AT THE END OF THE YEAR 0 0.0000
14 THE MASTER TRUST BANK OF JAPAN, LTD. AS TRUSTEE OF BLACKROCK INDIA EQUITY FUND 56660 0.4306 56660 0.4306Transfer 13 Apr 2018 (1072) 55588 0.4224Transfer 15 Jun 2018 (544) 55044 0.4183Transfer 22 Jun 2018 (513) 54531 0.4144Transfer 30 Jun 2018 (247) 54284 0.4125Transfer 02 Nov 2018 (258) 54026 0.4105Transfer 09 Nov 2018 (492) 53534 0.4068Transfer 16 Nov 2018 (759) 52775 0.4010Transfer 23 Nov 2018 (2834) 49941 0.3795Transfer 30 Nov 2018 (7559) 42382 0.3221Transfer 07 Dec 2018 (230) 42152 0.3203Transfer 14 Dec 2018 (825) 41327 0.3140Transfer 21 Dec 2018 (981) 40346 0.3066Transfer 28 Dec 2018 (40346) 0 0.0000AT THE END OF THE YEAR 0 0.0000
Notes:
1. Paid up Share Capital of the Company (Face Value Rs. 10.00) at the end of the year is 13159830 Shares.2. The details of holding has been clubbed based on PAN.3. % of total Shares of the Company is based on the paid-up Capital of the Company at the end of the Year.
(v) Shareholding of Directors and Key Managerial Personnel:
Sr No.
Name & Type of Transaction Shareholding at the beginning of the year –
1st April, 2018
Transactions during the year
Cumulative Shareholding during the year
No. of Shares Held
% of Total Shares of the
Company
Date of Transaction
No. of shares
No of Shares Held
% of Total Shares of the
Company1 JAGJEEVAN KUMAR JAIN 2960000 22.4927 2960000 22.4927 Transfer 04 Jan 2019 3810 2963810 22.5216 Transfer 11 Jan 2019 2148 2965958 22.5380 Transfer 01 Feb 2019 25795 2991753 22.7340 Transfer 08 Feb 2019 125 2991878 22.7349 Transfer 15 Feb 2019 70 2991948 22.7355 Transfer 22 Feb 2019 7243 2999191 22.7905
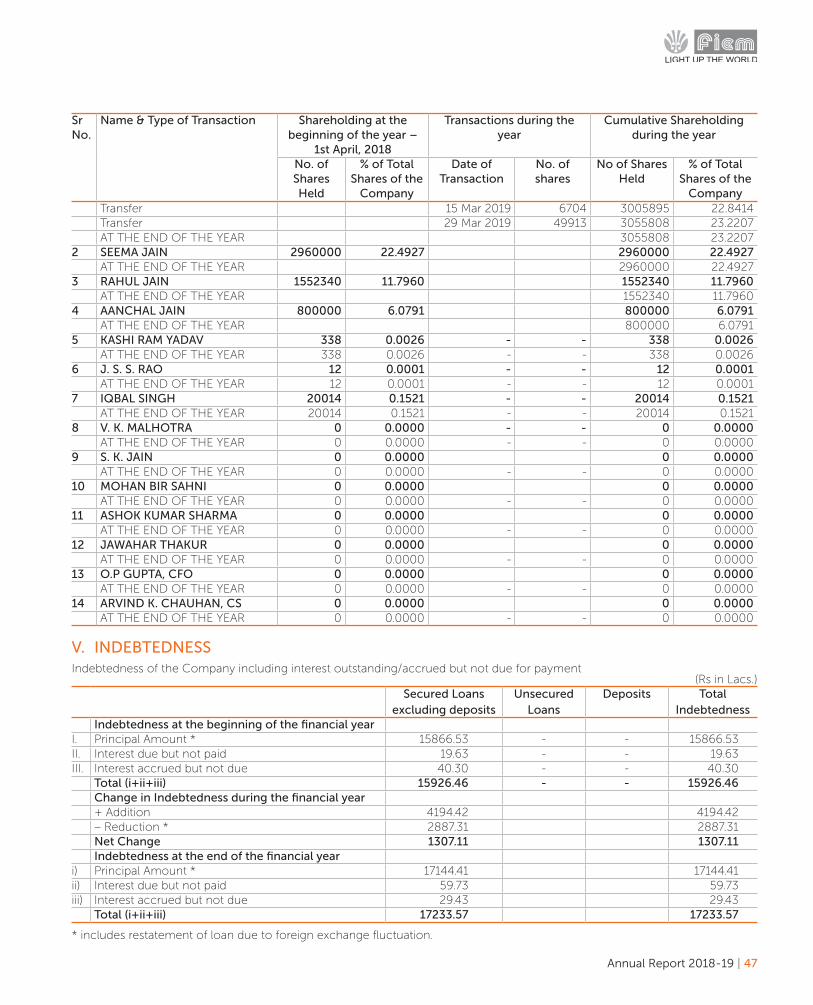
Annual Report 2018-19 | 47
Sr No.
Name & Type of Transaction Shareholding at the beginning of the year –
1st April, 2018
Transactions during the year
Cumulative Shareholding during the year
No. of Shares Held
% of Total Shares of the
Company
Date of Transaction
No. of shares
No of Shares Held
% of Total Shares of the
Company Transfer 15 Mar 2019 6704 3005895 22.8414 Transfer 29 Mar 2019 49913 3055808 23.2207 AT THE END OF THE YEAR 3055808 23.22072 SEEMA JAIN 2960000 22.4927 2960000 22.4927 AT THE END OF THE YEAR 2960000 22.49273 RAHUL JAIN 1552340 11.7960 1552340 11.7960 AT THE END OF THE YEAR 1552340 11.79604 AANCHAL JAIN 800000 6.0791 800000 6.0791 AT THE END OF THE YEAR 800000 6.07915 KASHI RAM YADAV 338 0.0026 - - 338 0.0026
AT THE END OF THE YEAR 338 0.0026 - - 338 0.00266 J. S. S. RAO 12 0.0001 - - 12 0.0001
AT THE END OF THE YEAR 12 0.0001 - - 12 0.00017 IQBAL SINGH 20014 0.1521 - - 20014 0.1521
AT THE END OF THE YEAR 20014 0.1521 - - 20014 0.15218 V. K. MALHOTRA 0 0.0000 - - 0 0.0000
AT THE END OF THE YEAR 0 0.0000 - - 0 0.00009 S. K. JAIN 0 0.0000 0 0.0000
AT THE END OF THE YEAR 0 0.0000 - - 0 0.000010 MOHAN BIR SAHNI 0 0.0000 0 0.0000
AT THE END OF THE YEAR 0 0.0000 - - 0 0.000011 ASHOK KUMAR SHARMA 0 0.0000 0 0.0000
AT THE END OF THE YEAR 0 0.0000 - - 0 0.000012 JAWAHAR THAKUR 0 0.0000 0 0.0000
AT THE END OF THE YEAR 0 0.0000 - - 0 0.000013 O.P GUPTA, CFO 0 0.0000 0 0.0000
AT THE END OF THE YEAR 0 0.0000 - - 0 0.000014 ARVIND K. CHAUHAN, CS 0 0.0000 0 0.0000
AT THE END OF THE YEAR 0 0.0000 - - 0 0.0000
V. INDEBTEDNESS Indebtedness of the Company including interest outstanding/accrued but not due for payment
(Rs in Lacs.)Secured Loans
excluding depositsUnsecured
LoansDeposits Total
IndebtednessIndebtedness at the beginning of the financial year
I. Principal Amount * 15866.53 - - 15866.53II. Interest due but not paid 19.63 - - 19.63III. Interest accrued but not due 40.30 - - 40.30
Total (i+ii+iii) 15926.46 - - 15926.46Change in Indebtedness during the financial year+ Addition 4194.42 4194.42– Reduction * 2887.31 2887.31Net Change 1307.11 1307.11Indebtedness at the end of the financial year
i) Principal Amount * 17144.41 17144.41ii) Interest due but not paid 59.73 59.73iii) Interest accrued but not due 29.43 29.43
Total (i+ii+iii) 17233.57 17233.57
* includes restatement of loan due to foreign exchange fluctuation.

48 | Fiem Industries Limited
VI. REMUNERATION OF DIRECTORS AND KEY MANAGERIAL PERSONNEL
A. Remuneration of Chairman & Managing Director and Whole–time Directors:(Rs. in Lacs)
Sr. No.
Particulars of Remuneration Name of CMD / WTDMr. J. K. Jain
Mrs. Seema
Jain
Mr. J.S.S. Rao
Mr. K. R.
Yadav
Ms. Aanchal
Jain
Mr. Rahul Jain
Total Amount
(CMD) (WTD) (WTD) (WTD) (WTD) (WTD)1 Gross Salary
a. Salary as per provisions contained in section 17(1) of the Income Tax Act, 1961
123.00 60.00 102.00 96.00 48.00 60.00 489.00
b. Value of perquisites u/s 17(2) of Income tax Act, 1961
1.80 0.00 0.00 0.00 0.00 0.00 1.80
c. Profit in lieu of Salary u/s 17(3) of Income Tax Act, 1961
0.00 0.00 0.00 0.00 0.00 0.00 0.00
2 Stock Option 0.00 0.00 0.00 0.00 0.00 0.00 0.003 Sweat Equity 0.00 0.00 0.00 0.00 0.00 0.00 0.004 Commission 0.00 0.00 0.00 0.00 0.00 0.00 0.00
• As % of profit 0.00 0.00 0.00 0.00 0.00 0.00 0.00• Other, specify 0.00 0.00 0.00 0.00 0.00 0.00 0.00
5 Others (Company Contribution towards PF, Medical Reimbursement)
0.00 0.00 0.00 1.45 0.00 0.00 1.45
Total 124.80 60.00 102.00 97.45 48.00 60.00 492.25Celling as per the Act*
Note: In terms of the provisions of section 197 of the Companies Act, 2013 (the Act), the remuneration to a single Whole-time Director or CMD will not exceed 5% of net profits and the total managerial remuneration payable to all Whole-time Directors including CMD shall not exceeded 10% of the net profits of the Company calculated as per section 198 of the Act. The above remuneration is within the limits prescribed under the Act. In case remuneration exceed above limits, Schedule V and/or approval of Shareholders, as the case may be would apply.
B. Remuneration to other Directors:(Rs. in Lacs)
Sr. No.
Particulars of RemunerationIndependent Director
Name of DirectorsMr.
Iqbal Singh
Mr. Vinod K. Malhotra
Mr. Subodh Kumar Jain
Mr. Mohan Bir
Sahni
Mr. A.K. Sharma
Mr. Jawahar Thakur
Total Amount
1 Independent DirectorsFee for attending Board/ Committee meetings
4.30 4.80 3.60 2.50 2.50 3.50 21.20
Stock Option 0.00 0.00 0.00 0.00 0.00 0.00 0.00Sweat Equity 0.00 0.00 0.00 0.00 0.00 0.00 0.00Commission 0.00 0.00 0.00 0.00 0.00 0.00 0.00• As % of profit 0.00 0.00 0.00 0.00 0.00 0.00 0.00• Other, specify 0.00 0.00 0.00 0.00 0.00 0.00 0.00Others 0.00 0.00 0.00 0.00 0.00 0.00 0.00Total (1) 4.30 4.80 3.60 2.50 2.50 3.50 21.20
2 Other Non-Executive DirectorsFee for attending Board/ Committee meetings
0.00 0.00 0.00 0.00 0.00 0.00 0.00
Stock Option 0.00 0.00 0.00 0.00 0.00 0.00 0.00Sweat Equity 0.00 0.00 0.00 0.00 0.00 0.00 0.00Commission 0.00 0.00 0.00 0.00 0.00 0.00 0.00• As % of profit 0.00 0.00 0.00 0.00 0.00 0.00 0.00• Other, specify 0.00 0.00 0.00 0.00 0.00 0.00 0.00Others 0.00 0.00 0.00 0.00 0.00 0.00 0.00
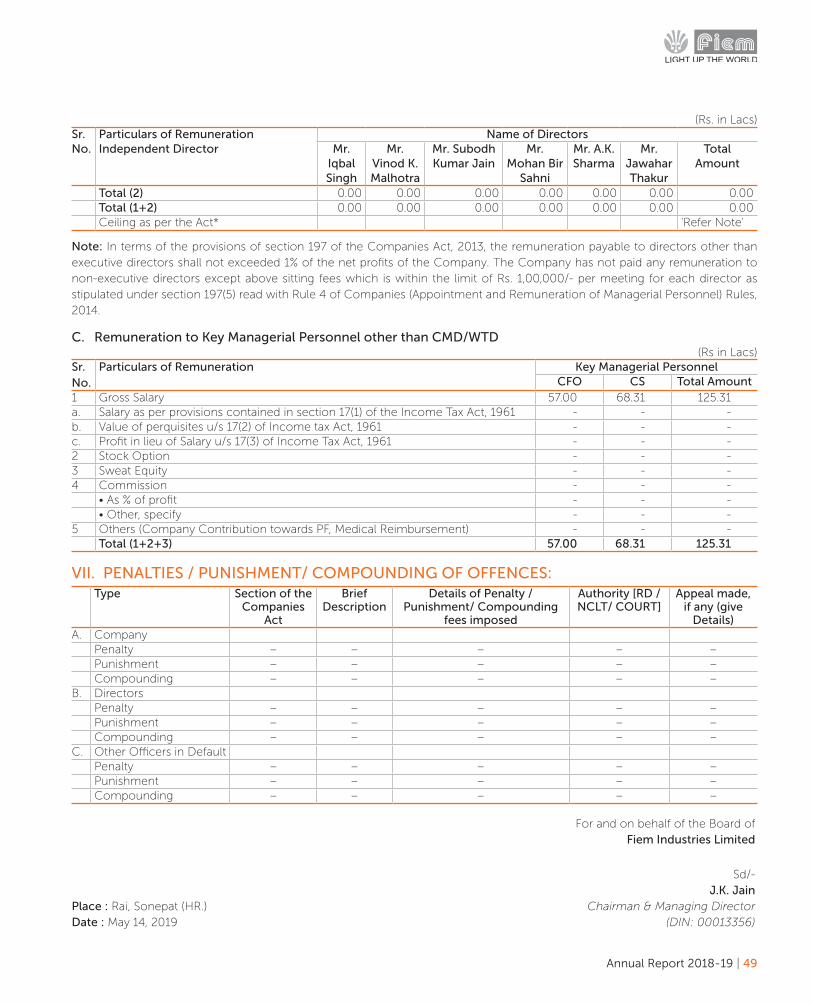
Annual Report 2018-19 | 49
(Rs. in Lacs)Sr. No.
Particulars of RemunerationIndependent Director
Name of DirectorsMr.
Iqbal Singh
Mr. Vinod K. Malhotra
Mr. Subodh Kumar Jain
Mr. Mohan Bir
Sahni
Mr. A.K. Sharma
Mr. Jawahar Thakur
Total Amount
Total (2) 0.00 0.00 0.00 0.00 0.00 0.00 0.00Total (1+2) 0.00 0.00 0.00 0.00 0.00 0.00 0.00Ceiling as per the Act* 'Refer Note'
Note: In terms of the provisions of section 197 of the Companies Act, 2013, the remuneration payable to directors other than executive directors shall not exceeded 1% of the net profits of the Company. The Company has not paid any remuneration to non-executive directors except above sitting fees which is within the limit of Rs. 1,00,000/- per meeting for each director as stipulated under section 197(5) read with Rule 4 of Companies (Appointment and Remuneration of Managerial Personnel) Rules, 2014.
C. Remuneration to Key Managerial Personnel other than CMD/WTD(Rs in Lacs)
Sr. No.
Particulars of Remuneration Key Managerial PersonnelCFO CS Total Amount
1 Gross Salary 57.00 68.31 125.31a. Salary as per provisions contained in section 17(1) of the Income Tax Act, 1961 - - -b. Value of perquisites u/s 17(2) of Income tax Act, 1961 - - -c. Profit in lieu of Salary u/s 17(3) of Income Tax Act, 1961 - - -2 Stock Option - - -3 Sweat Equity - - -4 Commission - - -
• As % of profit - - -• Other, specify - - -
5 Others (Company Contribution towards PF, Medical Reimbursement) - - -Total (1+2+3) 57.00 68.31 125.31
VII. PENALTIES / PUNISHMENT/ COMPOUNDING OF OFFENCES:Type Section of the
Companies Act
Brief Description
Details of Penalty / Punishment/ Compounding
fees imposed
Authority [RD / NCLT/ COURT]
Appeal made, if any (give
Details)A. Company
Penalty – – – – –Punishment – – – – –Compounding – – – – –
B. DirectorsPenalty – – – – –Punishment – – – – –Compounding – – – – –
C. Other Officers in DefaultPenalty – – – – –Punishment – – – – –Compounding – – – – –
For and on behalf of the Board of Fiem Industries Limited
Sd/- J.K. JainPlace : Rai, Sonepat (HR.) Chairman & Managing DirectorDate : May 14, 2019 (DIN: 00013356)

50 | Fiem Industries Limited
ANNEXURE–IIREMUNERATION POLICY
1. Background1.1 The Remuneration Policy was originally formulated
pursuant to section 178 of the Companies Act, 2013 (effective from April 1, 2014) read with revised Clause 49 of the Listing Agreement (effective from October 1, 2014).
1.2 The present revision is carried to incorporate suitable changes because of substitution of Listing Agreement with SEBI (Listing Obligations and Disclosure Requirements), Regulations 2015 (“Listing Regulations”) w.e.f. December 1, 2015.
1.3 Regulation 19 of Listing Regulations read with Part D of Schedule II, inter-alia, provides that the role of Nomination and Remuneration Committee shall include ‘formulation of the criteria for determining qualifications, positive attributes and independence of a director and recommend to the board of directors a policy relating to, the remuneration of the directors, key managerial personnel and other employees’. This provision of Listing Regulations is similar to corresponding provision of erstwhile Clause 49 of the Listing Agreement.
1.4 Therefore, the present revision is mainly carried out to incorporate the reference of relevant Listing Regulation and remove the reference of erstwhile Listing Agreement.
2. Legal Framework2.1. Section 178 of the Companies Act, 2013, inter-alia
provides for constitution of Nomination & Remuneration Committee and mandates the listed Companies to have Remuneration Policy for its directors, key managerial personnel and other employees. Sub section (3) and (4) of section 178 provides as under:
(i) The Nomination & Remuneration Committee shall formulate the criteria for determining qualifications, positive attributes and independence of a director and recommend to the Board a policy, relating to the remuneration for the directors, key managerial personnel and other employees.
(ii) The Nomination and Remuneration Committee shall, while formulating the policy under sub-section (3) ensure that -
(a) the level and composition of remuneration is reasonable and sufficient to attract, retain and motivate directors of the quality required to run the Company successfully;
(b) relationship of remuneration to performance is clear and meets appropriate performance benchmarks; and
(c) remuneration to directors, key managerial personnel and senior management involves a balance between fixed and incentive pay reflecting short and long-term performance objectives appropriate to the working of the Company and its goals:
Provided that such policy shall be disclosed in the Board’s report.
2.2. In line with the Companies Act, 2013, Regulation 19 read with Part D of Schedule II of the Listing Regulations provides about the Nomination & Remuneration Committee and Remuneration Policy as under:
The role of the committee shall, inter-alia, include the following:
‘formulation of the criteria for determining qualifications, positive attributes and independence of a director and recommend to the board of directors a policy relating to, the remuneration of the directors, key managerial personnel and other employees.’
2.3. On above background, the captioned policy is framed.
3. Objectives & Scope3.1. Criteria to determine qualifications, positive attributes and
independence of a director.
3.2. Policy to provide guiding principles for remuneration of the directors, key managerial personnel and other employees.
4. Definitions4.1. “Nomination & Remuneration Committee (NRC) means
such Committee constituted by the Board of Directors of the Company under provisions of section 178 of Companies Act, 2013 and Regulation 19 of the Listing Regulations.
4.2. “Board” means the Board of Directors of the Company.
4.3. “Company” means the “Fiem Industries Limited” / “FIEM”.
4.4. Companies Act, 2013 (‘Act’) includes Rules framed thereunder.

Annual Report 2018-19 | 51
4.5. All other words, terms and phrases referred and not defined herein, shall have the same meaning as defined under Companies Act, 2013 and Listing Regulations.
5. Criteria to determine Qualifications, Positive Attributes and Independence of a Director
5.1. The independence of an Independent Director will be decided as per parameters provided under section 149(6) of the Act read with Regulation 16(1)(b) of the Listing Regulations. Professional qualification of an Independent Director will be an advantage, but that will not be sole criteria and positive attributes like experience in industry, exposure as entrepreneur, specialised area expertise will be more effective attributes. However, these will be guiding principles and Nomination & Remuneration Committee will have liberty to consider other merits as well, while recommending an Independent Director for appointment.
6. Governing framework of Remuneration of Directors, KMPs and other Employees
6.1. The remuneration to Managing Director and Whole-time Directors will be as per the Companies Act, 2013 and will be recommended by NRC and approved by the Board and Shareholders.
6.2. The Independent Directors and Non-executive Directors will be paid sitting fees for attending the meeting of Board and Committees. They will also be provided travelling and boarding facilities / expenses whenever applicable.
6.3. The remuneration of KMPs and other employees of the Company will be governed by the Human Resources practices of the Company.
7. Guiding principles of Remuneration of Directors, KMPs and other Employees
7.1. The remuneration will be decided considering the long-term growth objective of the Company and by maintaining balance among various factors like complexity, criticality and scarcity of the skill sets of the candidates.
7.2. Long term objective, growth and suitability for the business of the Company will remain supreme driving principles.
7.3. The level and composition of remuneration is reasonable and sufficient to attract, retain and motivate employees at all levels for successfully running the Company.
7.4. Performance of individual and criticality of specialised skill sets required for the growth of the Company will be given due weightage while remunerating such employees.
7.5. Adequate facilities like company provided vehicles and other perquisites will be given to the Directors and eligible employees to retain and nurture best talent.
7.6. Variable remuneration will not be mandatory and periodic increments etc. will be decided considering various relevant factors like Company’s performance, employee’s willingness to devote sufficient time and energy in carrying out duties and responsibilities effectively, retaining and nurturing talent by the Company, industry practices, availability of talented manpower, motivate the manpower and to develop a sense of belongingness as well as need of the Company. The remuneration level can be reviewed and reset annually / periodically based on comparison with the relevant peer group and industry trends.
8. Policy ReviewThis Policy may be reviewed as and when any changes are to be incorporated in the Policy due to change in laws or as may be felt appropriate by the Company. Any changes or modification on the Policy would be approved by the Committee or Board of the Company.
For and on behalf of the Board of Fiem Industries Limited
Sd/- J.K. JainPlace : Rai, Sonepat (HR.) Chairman & Managing DirectorDate : May 14, 2019 (DIN: 00013356)
52 | Fiem Industries Limited
ANNEXURE–IIISECRETARIAL AUDIT REPORT
FOR THE FINANCIAL YEAR ENDED ON MARCH 31, 2019
[Pursuant to section 204 (1) of the Companies Act, 2013 and Rule 9 of the Companies (Appointment and Remuneration of Managerial Personnel) Rules, 2014]
To,The Members,Fiem Industries Limited(CIN: L36999DL1989PLC034928)D-34, DSIDC Packaging Complex,Kirti Nagar, New Delhi-110015
We have conducted the secretarial audit of the compliance of applicable statutory provisions and the adherence to good corporate practices by Fiem Industries Limited (hereinafter called the Company). Secretarial Audit was conducted in the manner that provided us a reasonable basis for evaluating the corporate conducts/statutory compliances and expressing our opinion thereon.
We report that:a) Maintenance of secretarial records is the responsibility of
the management of the Company. Our responsibility is to express an opinion on the secretarial records based on our audit.
b) We have followed the audit practices and processes as were appropriate to obtain reasonable assurance about the correctness of the contents of the secretarial records. The verification was done on test basis to ensure that correct facts are reflected in secretarial records. We believe that the process and practices, we followed, provide a reasonable basis for our opinion.
c) We have not verified the correctness and appropriateness of the Financial Statements of the Company.
d) Wherever required, we have obtained the Management Representation about the compliances of laws, rules and regulations and happening of events etc.
e) The compliance of the provisions of the Corporate and other applicable laws, rules, regulations, standards is the responsibility of the management. Our examination was limited to the verification of procedures on test basis.
f) The Secretarial Audit Report is neither an assurance as to the future viability of the Company nor of the effectiveness with which the Management has conducted the affairs of the Company.
Based on our verification of the Company’s books, documents, minute books, forms, and returns filed and other records maintained by the Company and also the information provided by the Company, its officers , agents, and authorized representatives during the conduct of secretarial audit, the explanations and clarifications given to us and the representations made by the Management, we hereby report that in our opinion, the Company has, during the audit period covering the financial year ended on March 31, 2019 (Audit Period), complied with the statutory provisions listed hereunder and also that the Company has proper Board-processes and compliance- mechanism in place to the extent, in the manner and subject to the reporting made hereinafter.
1. We have examined the books, papers, minute books, forms, and returns filed and other records maintained by the Company for the financial year ended on March 31, 2019 according to the provisions of:
(i) The Companies Act, 2013 (the Act) and the rules made thereunder;
(ii) The Securities Contracts (Regulation) Act, 1956 (‘SCRA’) and the rules made thereunder;
(iii) The Depositories Act, 1996 and the Regulations and Bye–laws framed thereunder;
(iv) Foreign Exchange Management Act, 1999 and the rules and regulations made thereunder to the
Annual Report 2018-19 | 53
extent applicable for Foreign Direct Investment, Overseas Direct Investment and External Commercial Borrowings;
(v) The following Regulations and Guidelines prescribed under the Securities and Exchange Board of India Act, 1992 (‘SEBI Act’):
(a) The Securities and Exchange Board of India (Substantial Acquisition of Shares and Takeovers) Regulations, 2011;
(b) The Securities and Exchange Board of India (Prohibition of Insider Trading) Regulations, 2015;
(c) The Securities and Exchange Board of India (Registrars to an Issue and Share Transfer Agents) Regulations, 1993 regarding the Companies Act and dealing with client;
(d) The Securities and Exchange Board of India (Listing Obligations and Disclosure Requirements) Regulations, 2015.
2. We further report that, during the Audit Period there were no events/ actions in pursuance of:
(a) The Securities and Exchange Board of India (Employee Stock Option Scheme and Employee Stock Purchase Scheme) Guidelines, 1999;
(b) The Securities and Exchange Board of India (Issue and Listing of Debt Securities) Regulations, 2008;
(c) The Securities and Exchange Board of India (Delisting of Equity Shares) Regulations, 2009;
(d) The Securities and Exchange Board of India (Buy Back of Securities) Regulations, 1998 and The Securities and Exchange Board of India (Buy Back of Securities) Regulations, 2018;
(e) The Securities and Exchange Board of India (Issue of Capital and Disclosure Requirements) Regulations, 2009 and The Securities and Exchange Board of India (Issue of Capital and Disclosure Requirements) Regulations, 2018.
3. We have also examined compliance with the applicable clauses of the Secretarial Standards issued by the Institute of Company Secretaries of India.
4. During the period under review, the Company has complied with the provisions of the Act, Rules, Regulations, Guidelines and Standards, to the extent applicable as mentioned above.
We further report that-5. The Company is engaged in manufacturing of Automotive
Lighting and Signaling Equipment, Rear View Mirror, Plastic Moulded Parts and other Auto Components. Company also manufactures LED Luminaries/ LED Products for general lighting applications and LED Integrated Passenger Information System for buses and railways etc. Company has manufacturing facilities, depots and offices in different States of the Country. During the course of Business operations, various Labour, Industrial, Environmental, Local/ State Laws as well as Laws specific to the Industry (such as Indian Motor Vehicle Act, 1988 and Rules made thereunder) applies to the Company. We have examined the compliance management system of the Company for ensuring the compliances of these laws. In our opinion and to the best of our information and explanations given to us, the Compliance Management System is adequate to ensure compliance of above referred applicable laws.
6. The compliance by the Company of applicable financial laws like direct and indirect tax laws and maintenance of financial records and books of accounts has not been reviewed in this Audit since the same have been subject to review by statutory financial audit and other designated professionals.
7. The Board of Directors of the Company is duly constituted with proper balance of Executive Directors, Independent Directors and Women Director. There is no change in the composition of the Board of Directors during the period under review.
8. Adequate notice is given to all the Directors for Board and Committee Meetings. Notice, Agenda and detailed notes on agenda were sent atleast 7 days in advance and a system exists for seeking and obtaining further information and clarifications on the agenda items before the meeting and for meaningful participation at the meeting.
9. Decisions by the Board and Committees are carried out unanimously and therefore, no dissenting views were required to be captured and recorded as part of the minutes.
54 | Fiem Industries Limited
10. There are adequate systems and processes in the Company commensurate with the size and the operations of the Company to monitor and ensure compliance with applicable laws, rules, regulations and guidelines.
11. During the Audit Period, the Company has :
i) formed a Joint Venture (JV) Company, namely, Aisan Fiem Automotives India Pvt. Ltd. pursuant to JV Agreement signed on 30th March, 2018.
ii) entered into a Technical Assistance Agreement with Toyodenso Co., Ltd., Japan and Toyota Tsusho Corporation, Japan for manufacturing of Bank Angle Sensor for motorcycles for Indian market.
iii) formed a Wholly Owned Subsidiary, namely, Fiem Research and Technology s.r.l in Italy for setting up Design Centre.
Further, there were no instances of :
i) Public/ Right/ Preferential issue of shares/ debentures/ sweat equity, etc.
ii) Redemption/ buy- back of securities
iii) Any resolution by the Members in pursuance to section 180 of the Companies Act, 2013.
iv) Merger/ Amalgamation/ Reconstruction, etc.
For Ranjana Gupta & Associates Company Secretaries
Sd/- Ranjana Gupta Proprietor Date : 14th May , 2019 FCS No.: 8613Place : New Delhi CP No.: 9920
ANNEXURE–IV
CONSERVATION OF ENERGY, TECHNOLOGY ABSORPTION AND FOREIGN EXCHANGE EARNINGS AND OUTGO PURSUANT TO PROVISIONS OF SECTION 134 OF THE COMPANIES ACT , 2013 READ WITH RULE 8 OF THE COMPANIES (ACCOUNTS) RULES, 2014.
(A) CONSERVATION OF ENERGYThe energy conservation, in every possible way and form is paramount for sustainability for human kind. This is a natural resource and for a country like India, which is already power deficit nation, energy conservation become more important subject. There are many different ways to reduce energy usage, ranging from simple behavioral awareness to extensive improvements and adopting newer technologies. Power is among major cost constituent in our product cost. Therefore, it is not only a matter of conservation of energy but also a matter of cost reduction or improvement in profits. We believe that energy conservation initiatives should go beyond cost savings and it is a national resource, which required to be conserved for more productive usage and for generations to come.
(i) Steps Taken or Impact on Conservation of Energy:
a) Most important step is the behaviour awareness, which have the highest potential for energy savings, simple good habits turns out to be in big numbers of energy saving over a long period of time, whether, in office, general open area or at shop floor.
b) In mirror plant oven vacuum pump position changed at nearest point of work place and 5hp pump replaced with 1hp pump, resulting in energy saving.
c) In mirror plant flow coaster backing oven, old heater changed with high efficiency tube type heater and quantity also reduced, resulting energy saving on continuous basis.
d) Day light sensor installed for lighting in moulding area, which turn-on and off lights automatically as per lux value set.
e) All AHU water pump disconnected during winter season, avoiding any idle / wastage of electricity.
Annual Report 2018-19 | 55
f) At all required places, old conventional lights replaced with LED Lights of lesser wattage, resulting in energy saving.
g) Constant focus on increasing awareness level amongst the work force for various energy conservation measures throughout operations, this initiative keep aware the employees about their duty to save energy;
h) Using energy efficient pumps for many application and air cooled pump with Variable Frequency Drive (VFD) compatible motor, steadily in all plants;
i) During Supplier’s audit, suppliers encouraged to follow green practices as an important pre-requisite to the Company purchasing strategy;
The impact of above measures in reduction of energy consumption and consequent impact on the cost of production of goods is difficult to quantify. However, as power constitutes a major cost factor in production and overall operations of the Company, hence all these measure of energy conservation results in the cost reduction.
(ii) Steps taken by the Company for Utilizing Alternate Sources of Energy:
One roof-top Solar Power Plant of 750kWp has been installed at Rai Plant with opex model. On successful running of this plant, the Company will go ahead for more such plants to maximize the utilization of alternate source of energy. Further, at small area like canteen, solar water heaters are being provided for warm water supply and at many places LED Street Lights are installed with solar power option. Largely, traditional source of power is being utilized by the Company.
(iii) The Capital Investment on Energy Conservation Equipment:
Most of the energy conservation measures are in the form of improvement / change in the existing practices and big capital investment was not on these measures, except in some cases. During the year under review capital investment made on energy saving equipment was not significant.
(B) TECHNOLOGY ABSORPTION
(i) Efforts made towards Technology Absorption:
We, as a policy, always continue major upgradation in manufacturing processes and materials, especially in LED Automotive facilities of the Company to provide world-class LED Lamps and other products to OEMs. LED automotive lighting occupies a sizable place in our
industry, hence it remains area of more focus and major technology absorption revolves around the same but with emphasis on cost effectiveness. Main focus is as ever given on alternate materials and up-gradaion of the manufacturing facilities with newest technology as under:
a) LED head lights demand higher accuracy with best aesthetics to make them attractive. To achieve this feat, we have introduced high end moulding machines to produce gates cutting parts by Laser gate cutting technology.
b) For Higher thickness optical elements, stress relieving machines and equipment have been introduced with full automation.
c) In-house world-class die-casting manufacturing facilities have been implemented to cater all advanced LED projector lightings alongwith fully computerised finishing process for LED headlight modules manufacturing.
d) High thermal conductivity aluminium compound casting material has been introduced to produce miniaturized, high compact lamps, heat sink material.
e) Using new compounding materials enable us achieve LED lamps long life, and optical elements painting.
f) Film based lighting equipment are used for the internal stress identification introduced.
g) LEDs production lines are very sensitive for dust and humidity, therefore, to produce world class LED lamps product quality, humidity, temperature and dust controlled environment had been provided across the plant.
h) Light glare testing method on wall inspection has been introduced for obtaining consistent optical performance.
(ii) Benefits that are the aftermath of the above efforts, namely product improvement, cost reduction, product development, import substitution etc. are:
a) Laser cut technology enhances and provides face lift giving appealing look to high end bike lamps augmenting product quality an important ingredient for customer satisfaction. Laser cutting on optical elements reduces the stress and enhances the product longevity.
b) Stress on the thick optical lens causes non homogeneous light on road, therefore, introducing stress reliving machines improves the light performance.

56 | Fiem Industries Limited
c) Computerised finishing methodologies of die cast parts, which are critical for optical focus, provide consistent performance and help elimination and variation resulting into cost saving.
d) High thermal conductivity aluminium alloys reduce the product size to minimum making it fit well within the motorbike layout also increase light glowing life of the product to ultimate satisfaction of end customer.
e) LED optical parts demand highest aesthetics appearance, hence newly invented compound material bond with optical elements help increase the aesthetic appeal and life of the product.
f) Enhanced technological competence is integral part and major strength for business development.
g) Over all improved product quality enhances customer satisfaction resulting into growth of the industry.
(iii) The following is the information on Imported technology during the last 3 years reckoned from beginning of the financial year 2018-19,:
a) the details of technology imported:
b) the year of import:
c) Whether the technology been fully absorbed:
d) If not fully absorbed, area where absorption has not taken place, and the reasons thereof:
In general, the Company keeps on importing latest machines from other countries to keep abreast with the latest manufacturing and technology development worldwide in order to keep developing in-house technology. Company has imported LED SMT machines and automatic assembly lines with latest technology from time to time and also keeps on importing robots and machines with latest technology for various processes. The technology self-absorbs itself during production as well as improvement being a continuous process.
Further, Company had signed a ‘Technology License & Assistance Agreement’ with Aisan Industry Co., Ltd. Japan in Sept, 2016 for Canister. The technology is being imported and absorbed.
Company has also signed a ‘Technology License & Assistance Agreement’ with Toyo Denso Co., Ltd., Japan in July, 2018 for Bank Angle Sensors. The technology is being imported and absorbed.
(iv) RESEARCH & DEVELOPMENT (R&D)
LEDs, like previous year, remain the most important subject for Research & Development as it is still evolving
and lot of innovative things are being done by Company thus has remained frontrunner in development of new LED Automotive Lamps. The project on bi-function LED projector lamps is one the most prestigious among various R&D Projects of the Company. This projector lamp is world’s smallest head lamp which earned a coveted Global Award for the Company conferred by Yamaha Japan. R&D efforts have contributed in new product development, new technology development and improvement in product quality and technology. Company has robust R&D capabilities which keep on strengthened year-by-year and are amply acknowledged and rewarded by its valued OEM customers. The Company had set-up its in-house R&D Unit at Rai Plant, recognized by the Govt. of India, Ministry of Science and Technology, Department of Science and Industrial Research, with the following objectives:
Objective of in-house R&D.
1. To carryout research for developing state-of-the-art technology and products for automotive lighting namely LED head light , LED projector lights, Day light running lamps, LED signaling lamps and rear view mirrors and other automotive components in compliance with latest international standards to fulfil the requirement of Indian and Global OEMs.
2. To enhance and improve our R&D capabilities for designing and development of new and innovative products in:
(i) LED Automotive Lamps, rear view mirrors and other automotive components;
(ii) LED Luminaires for indoor and outdoor applications;
(iii) LED Integrated Passenger Information and Display Systems for Indian Railways and other transport vehicles.
3. To develop new and innovative LED general lighting and automotive lighting products and technology with low carbon emission, low power consumption and high efficiency, with an endeavor to contribute towards solution of lighting and energy requirements of future India.
4. To disseminate knowledge acquired from R&D activities to train the manpower in our industry.
5. To develop futuristic ultra-compact lamps using LED by adopting advanced technology on lens and reflector designs.
Annual Report 2018-19 | 57
A brief on the R&D activities of the Company is as follows:
a) Specific Areas in which R&D carried out by the Company:
(i) In house designed and developed LED head light Class C regulation, integrated with signature looking position lamp using low power led and diffuser lens technology. The position lamp will deliver complete character of the bike during illumination. Low and high beam functions illuminated using 5 mid power LEDs, without heat sink.
(ii) Designed and developed Class D – aggressive looking LED headlight for high end bikes using LED without heatsink. The product has high challenge in thermal management. first time introduced 2 channel DMU (Driver module unit) to optimize thermal management within the lamp volume.
(iii) In house designed and developed LED – Direction indicator lamp, using very low lumen single LED light source for first time introduced Indian and Europe regulation applicable markets.
(iv) In house designed – High compact DRL lamp using alternate material has been introduced to enhance the performance and provide value addition to the product resulting in cost saving.
(v) Designed and developed compact LED headlight, in which LDM unit is partially exposed for thermal management first time, thus meeting Class D regulation for sporty motor cycle market.
(vi) Design and development of DRL (Day Time Running lamp) using advanced polymer material – (OPAL / diffuser) twin parking lamp, by using low power LED in high end bikes for export market
(vii) Design and development of head lamp integrated with LED DRL (Day Time Running lamp) to meet AHO regulations first time in India. LED DRL lamp designed with 6 low power LEDs achieve photometric parameters by prismatic inner lens and MFR reflector.
(viii) Design and development of LED head lamp integrated with signature shape looking parking lamp, in which bike character is communicated via LEDs. Introduced new Opel material for parking function. LED head lamp will meet class C requirements.
(ix) Design and development of head lamp integrated detachable DRL lamp with position lamp function. Same LEDs are used for DRL and position function as well by diming circuit. Dual function modular lamps save material cost resulting into cost saving.
(x) Introduced DRL and Position lamps using Tuff high impact PC material for light guides and light pipes.
(xi) Collaborative research between Fiem Industries Ltd and CSIR- National Physical Laboratory, New Delhi:
High Power Laser Driven YAG:Ce Phosphor incorporated Sapphire Disc For Outstanding White Light Conversion Efficiency
A facile synthesis method has been adopted for development of Y3-xAl5O12:Cex (x = 0.03 to 0.24) yellow phosphor via auto-combustion method and fabrication of phosphor incorporated sapphire disc (PISD) of various dimensions. Several experimental techniques have been employed for material characterization and spectroscopy of the as-synthesized yellow phosphor. Using an excitation wavelength of 445 nm from a high power blue laser, the photoluminescence (PL) intensity for the optimized concentration of Ce3+ doped YAG phosphor was recorded at 550 nm. The developed phosphor incorporated sapphire disc (PISD a technology, developed in this collaborative project for preventing the damage of phosphor surface by absorbing the heat produced by laser diodeusing the sapphire disc)) exhibits higher stability and PL intensity. The blue laser diode is a promising candidate to revolutionize the luminous intensity of the white light by several orders of magnitude as compared to existing blue light emitting LEDs. The emerging technology has extremely bright future with endless uses as the tunability of the power of the laser that in turn controls the intensity of the emitted white light. Hence, this new approach provides a paradigm shift to produce highly-efficient white light beam based on PISD integrated with blue diode laser rather than the conventional technology. Moreover, such configurations would allow more styling and packaging flexibility reducing the overall size of the unit to be produced for various lighting applicationsespecially in automotive lighting.
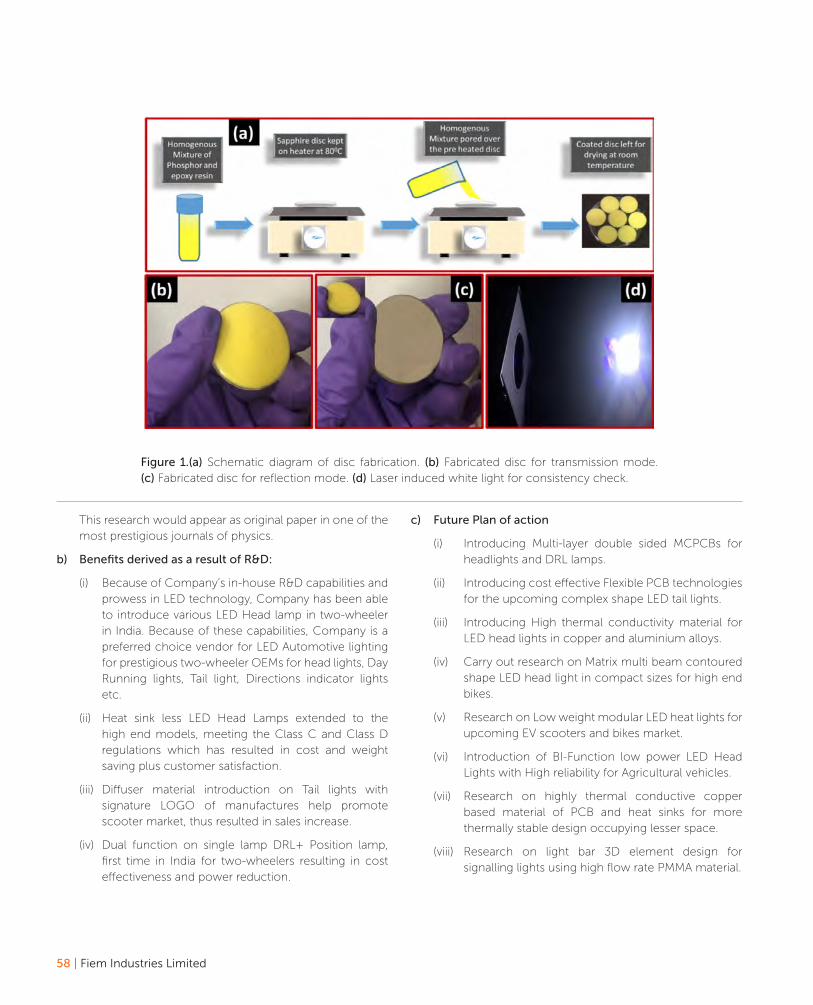
58 | Fiem Industries Limited
Figure 1.(a) Schematic diagram of disc fabrication. (b) Fabricated disc for transmission mode. (c) Fabricated disc for reflection mode. (d) Laser induced white light for consistency check.
This research would appear as original paper in one of the most prestigious journals of physics.
b) Benefits derived as a result of R&D:
(i) Because of Company’s in-house R&D capabilities and prowess in LED technology, Company has been able to introduce various LED Head lamp in two-wheeler in India. Because of these capabilities, Company is a preferred choice vendor for LED Automotive lighting for prestigious two-wheeler OEMs for head lights, Day Running lights, Tail light, Directions indicator lights etc.
(ii) Heat sink less LED Head Lamps extended to the high end models, meeting the Class C and Class D regulations which has resulted in cost and weight saving plus customer satisfaction.
(iii) Diffuser material introduction on Tail lights with signature LOGO of manufactures help promote scooter market, thus resulted in sales increase.
(iv) Dual function on single lamp DRL+ Position lamp, first time in India for two-wheelers resulting in cost effectiveness and power reduction.
c) Future Plan of action
(i) Introducing Multi-layer double sided MCPCBs for headlights and DRL lamps.
(ii) Introducing cost effective Flexible PCB technologies for the upcoming complex shape LED tail lights.
(iii) Introducing High thermal conductivity material for LED head lights in copper and aluminium alloys.
(iv) Carry out research on Matrix multi beam contoured shape LED head light in compact sizes for high end bikes.
(v) Research on Low weight modular LED heat lights for upcoming EV scooters and bikes market.
(vi) Introduction of BI-Function low power LED Head Lights with High reliability for Agricultural vehicles.
(vii) Research on highly thermal conductive copper based material of PCB and heat sinks for more thermally stable design occupying lesser space.
(viii) Research on light bar 3D element design for signalling lights using high flow rate PMMA material.

Annual Report 2018-19 | 59
(ix) Introduction of miniature heat sinks using advance air craft Aluminium materials for Ultra speed heat dissipation.
(x) Further strengthening and improving the existing R&D infrastructure and facilities for complete designing of the products from conceptualization to production covering product design, laboratory testing, optical simulation etc.
(xi) Development to be carried out on more cost-effective LED Head lights without heat sinks for low end two-wheeler segments.
(xii) Carry out research on contoured shape LED head light in compact sizes for high end bikes.
(xiii) Research on using the Extruded Aspherical lens for LED head lights.
(xiv) Introduction of High efficiency LED Driving module with low cost.
(xv) Introduction of low cost flexible PCB solutions to reduce interconnection wires and electrical losses.
(xvi) Continuous research on achieving the LED placement accuracy to provide stable optical performance.
(xvii) Introduction of sequence Direction Indicators lamps and dimming function on various kind of lamps.
(xviii) Research on 3D optical design lamps for signalling devices.
(d) Expenditure on R&D:
The R&D capabilities of the Company are built over for a long time and highly competent human capital. Further, expenditure also incurred on software and equipment etc. The following expenses have been incurred by the Company on its in-house Research & Development Unit:
Amount in Rs. lacs Particulars 2018-19 2017-18Capital Expenditure:Capital Expenditure 34.73 70.78Total (A) 34.73 70.78Recurring/Revenue Expenditure:Raw Material Consumed 9.11 22.71Employees Benefits 696.97 672.79Design Charges 55.95 -Other Expenses 75.76 46.68Finance Cost 0.00 0.02Depreciation & Amortization 74.74 65.29Total (B) 912.53 807.50Grand Total (A+B) 947.26 878.28
In addition to above, the Company has also incurred expenses on its overseas Design Centers and development activities within and outside India.
(C) FOREIGN EXCHANGE EARNINGS AND OUTGOThe Foreign Exchange earned in terms of actual inflows during the year was Rs. 2477.86 lacs and the Foreign Exchange outgo during the year in terms of actual outflows was Rs. 12965.06 lacs.
For and on behalf of the Board of Fiem Industries Limited
Sd/- J.K. JainPlace : Rai, Sonepat (HR.) Chairman & Managing DirectorDate : May 14, 2019 (DIN: 00013356)
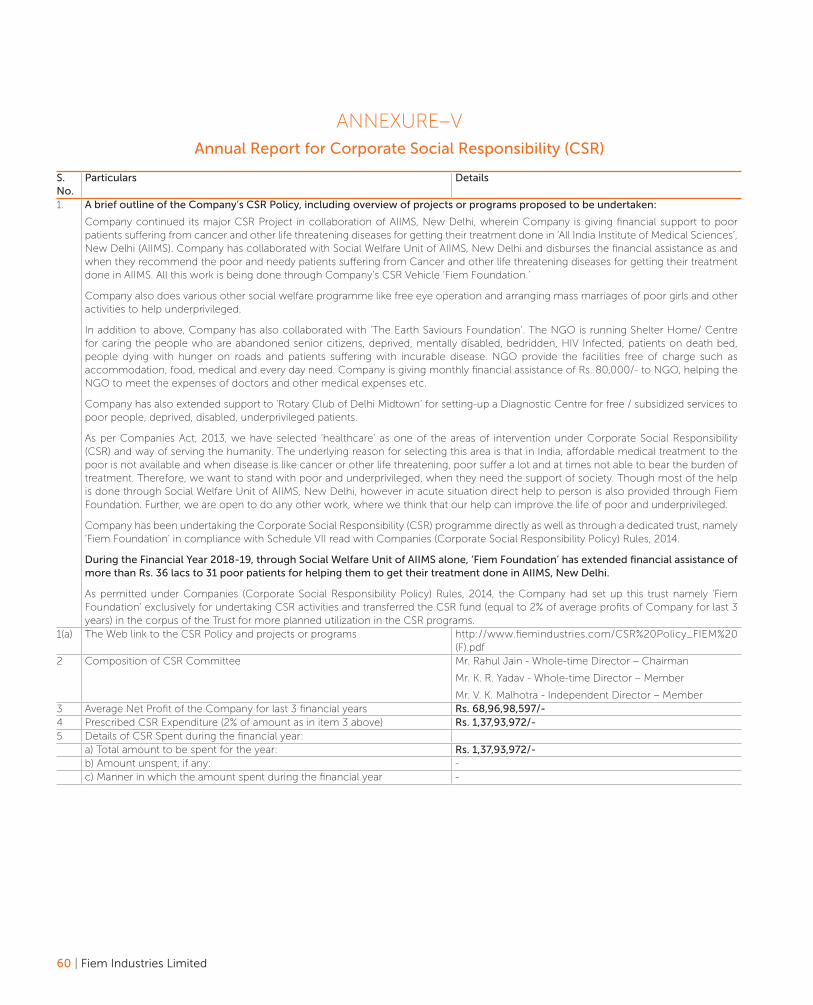
60 | Fiem Industries Limited
ANNEXURE–VAnnual Report for Corporate Social Responsibility (CSR)
S. No.
Particulars Details
1. A brief outline of the Company’s CSR Policy, including overview of projects or programs proposed to be undertaken:
Company continued its major CSR Project in collaboration of AIIMS, New Delhi, wherein Company is giving financial support to poor patients suffering from cancer and other life threatening diseases for getting their treatment done in ‘All India Institute of Medical Sciences’, New Delhi (AIIMS). Company has collaborated with Social Welfare Unit of AIIMS, New Delhi and disburses the financial assistance as and when they recommend the poor and needy patients suffering from Cancer and other life threatening diseases for getting their treatment done in AIIMS. All this work is being done through Company’s CSR Vehicle ‘Fiem Foundation.’
Company also does various other social welfare programme like free eye operation and arranging mass marriages of poor girls and other activities to help underprivileged.
In addition to above, Company has also collaborated with ‘The Earth Saviours Foundation’. The NGO is running Shelter Home/ Centre for caring the people who are abandoned senior citizens, deprived, mentally disabled, bedridden, HIV Infected, patients on death bed, people dying with hunger on roads and patients suffering with incurable disease. NGO provide the facilities free of charge such as accommodation, food, medical and every day need. Company is giving monthly financial assistance of Rs. 80,000/- to NGO, helping the NGO to meet the expenses of doctors and other medical expenses etc.
Company has also extended support to ‘Rotary Club of Delhi Midtown’ for setting-up a Diagnostic Centre for free / subsidized services to poor people, deprived, disabled, underprivileged patients.
As per Companies Act, 2013, we have selected ‘healthcare’ as one of the areas of intervention under Corporate Social Responsibility (CSR) and way of serving the humanity. The underlying reason for selecting this area is that in India, affordable medical treatment to the poor is not available and when disease is like cancer or other life threatening, poor suffer a lot and at times not able to bear the burden of treatment. Therefore, we want to stand with poor and underprivileged, when they need the support of society. Though most of the help is done through Social Welfare Unit of AIIMS, New Delhi, however in acute situation direct help to person is also provided through Fiem Foundation. Further, we are open to do any other work, where we think that our help can improve the life of poor and underprivileged.
Company has been undertaking the Corporate Social Responsibility (CSR) programme directly as well as through a dedicated trust, namely ‘Fiem Foundation’ in compliance with Schedule VII read with Companies (Corporate Social Responsibility Policy) Rules, 2014.
During the Financial Year 2018-19, through Social Welfare Unit of AIIMS alone, ‘Fiem Foundation’ has extended financial assistance of more than Rs. 36 lacs to 31 poor patients for helping them to get their treatment done in AIIMS, New Delhi.
As permitted under Companies (Corporate Social Responsibility Policy) Rules, 2014, the Company had set up this trust namely ‘Fiem Foundation’ exclusively for undertaking CSR activities and transferred the CSR fund (equal to 2% of average profits of Company for last 3 years) in the corpus of the Trust for more planned utilization in the CSR programs.
1(a) The Web link to the CSR Policy and projects or programs http://www.fiemindustries.com/CSR%20Policy_FIEM%20(F).pdf
2 Composition of CSR Committee Mr. Rahul Jain - Whole-time Director – Chairman
Mr. K. R. Yadav - Whole-time Director – Member
Mr. V. K. Malhotra - Independent Director – Member3 Average Net Profit of the Company for last 3 financial years Rs. 68,96,98,597/-4 Prescribed CSR Expenditure (2% of amount as in item 3 above) Rs. 1,37,93,972/-5 Details of CSR Spent during the financial year:
a) Total amount to be spent for the year: Rs. 1,37,93,972/-b) Amount unspent, if any: -c) Manner in which the amount spent during the financial year -
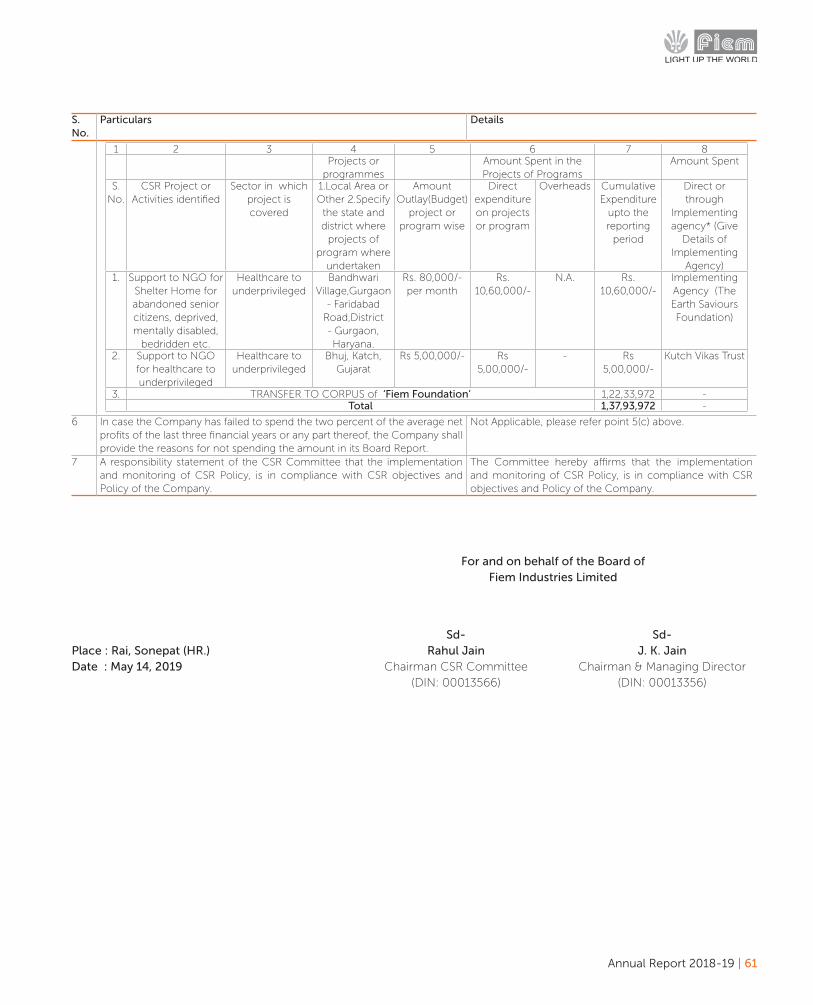
Annual Report 2018-19 | 61
S. No.
Particulars Details
1 2 3 4 5 6 7 8Projects or
programmesAmount Spent in the Projects of Programs
Amount Spent
S. No.
CSR Project or Activities identified
Sector in which project is covered
1.Local Area or Other 2.Specify the state and district where
projects of program where
undertaken
Amount Outlay(Budget)
project or program wise
Direct expenditure on projects or program
Overheads Cumulative Expenditure
upto the reporting
period
Direct or through
Implementing agency* (Give
Details of Implementing
Agency)1. Support to NGO for
Shelter Home for abandoned senior citizens, deprived, mentally disabled,
bedridden etc.
Healthcare to underprivileged
Bandhwari Village,Gurgaon
- Faridabad Road,District - Gurgaon, Haryana.
Rs. 80,000/- per month
Rs. 10,60,000/-
N.A. Rs. 10,60,000/-
Implementing Agency (The Earth Saviours Foundation)
2. Support to NGO for healthcare to underprivileged
Healthcare to underprivileged
Bhuj, Katch, Gujarat
Rs 5,00,000/- Rs 5,00,000/-
- Rs 5,00,000/-
Kutch Vikas Trust
3. TRANSFER TO CORPUS of ‘Fiem Foundation’ 1,22,33,972 -Total 1,37,93,972 -
6 In case the Company has failed to spend the two percent of the average net profits of the last three financial years or any part thereof, the Company shall provide the reasons for not spending the amount in its Board Report.
Not Applicable, please refer point 5(c) above.
7 A responsibility statement of the CSR Committee that the implementation and monitoring of CSR Policy, is in compliance with CSR objectives and Policy of the Company.
The Committee hereby affirms that the implementation and monitoring of CSR Policy, is in compliance with CSR objectives and Policy of the Company.
For and on behalf of the Board of Fiem Industries Limited
Sd- Sd-Place : Rai, Sonepat (HR.) Rahul Jain J. K. JainDate : May 14, 2019 Chairman CSR Committee Chairman & Managing Director (DIN: 00013566) (DIN: 00013356)
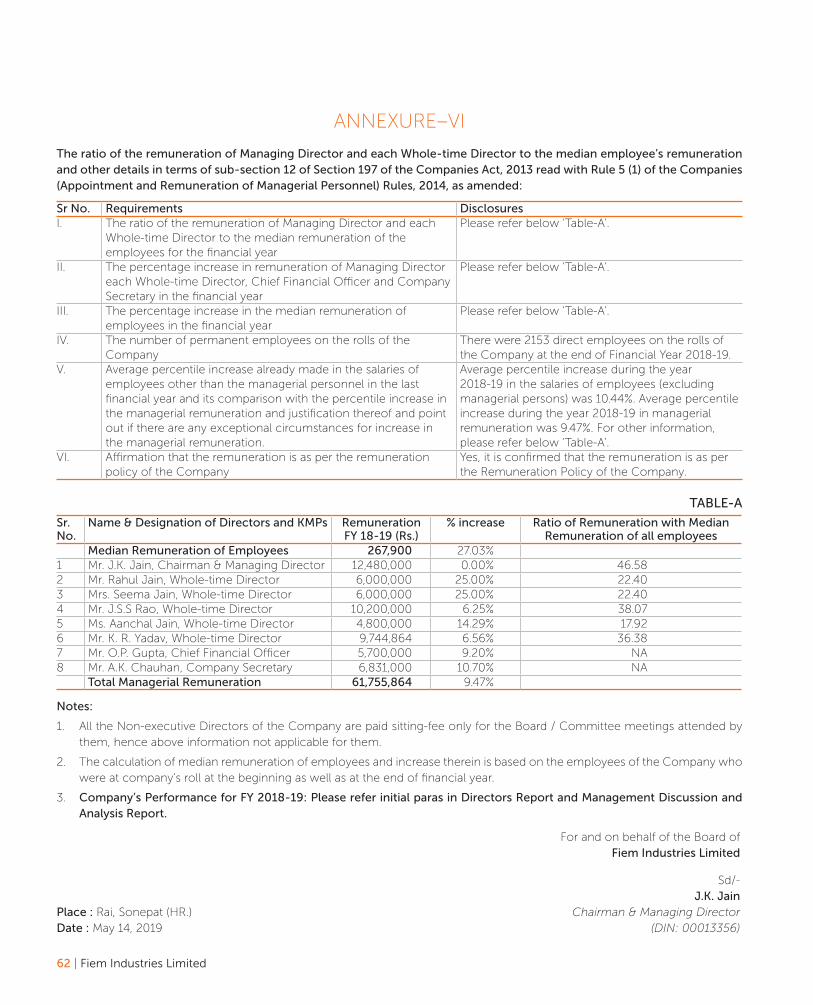
62 | Fiem Industries Limited
ANNEXURE–VI
The ratio of the remuneration of Managing Director and each Whole-time Director to the median employee’s remuneration and other details in terms of sub-section 12 of Section 197 of the Companies Act, 2013 read with Rule 5 (1) of the Companies (Appointment and Remuneration of Managerial Personnel) Rules, 2014, as amended:
Sr No. Requirements DisclosuresI. The ratio of the remuneration of Managing Director and each
Whole-time Director to the median remuneration of the employees for the financial year
Please refer below ‘Table-A’.
II. The percentage increase in remuneration of Managing Director each Whole-time Director, Chief Financial Officer and Company Secretary in the financial year
Please refer below ‘Table-A’.
III. The percentage increase in the median remuneration of employees in the financial year
Please refer below ‘Table-A’.
IV. The number of permanent employees on the rolls of the Company
There were 2153 direct employees on the rolls of the Company at the end of Financial Year 2018-19.
V. Average percentile increase already made in the salaries of employees other than the managerial personnel in the last financial year and its comparison with the percentile increase in the managerial remuneration and justification thereof and point out if there are any exceptional circumstances for increase in the managerial remuneration.
Average percentile increase during the year 2018-19 in the salaries of employees (excluding managerial persons) was 10.44%. Average percentile increase during the year 2018-19 in managerial remuneration was 9.47%. For other information, please refer below ‘Table-A’.
VI. Affirmation that the remuneration is as per the remuneration policy of the Company
Yes, it is confirmed that the remuneration is as per the Remuneration Policy of the Company.
TABLE-A
Sr. No.
Name & Designation of Directors and KMPs Remuneration FY 18-19 (Rs.)
% increase Ratio of Remuneration with Median Remuneration of all employees
Median Remuneration of Employees 267,900 27.03%1 Mr. J.K. Jain, Chairman & Managing Director 12,480,000 0.00% 46.582 Mr. Rahul Jain, Whole-time Director 6,000,000 25.00% 22.403 Mrs. Seema Jain, Whole-time Director 6,000,000 25.00% 22.404 Mr. J.S.S Rao, Whole-time Director 10,200,000 6.25% 38.075 Ms. Aanchal Jain, Whole-time Director 4,800,000 14.29% 17.926 Mr. K. R. Yadav, Whole-time Director 9,744,864 6.56% 36.387 Mr. O.P. Gupta, Chief Financial Officer 5,700,000 9.20% NA8 Mr. A.K. Chauhan, Company Secretary 6,831,000 10.70% NA
Total Managerial Remuneration 61,755,864 9.47%
Notes:
1. All the Non-executive Directors of the Company are paid sitting-fee only for the Board / Committee meetings attended by them, hence above information not applicable for them.
2. The calculation of median remuneration of employees and increase therein is based on the employees of the Company who were at company’s roll at the beginning as well as at the end of financial year.
3. Company’s Performance for FY 2018-19: Please refer initial paras in Directors Report and Management Discussion and Analysis Report.
For and on behalf of the Board of Fiem Industries Limited
Sd/- J.K. JainPlace : Rai, Sonepat (HR.) Chairman & Managing DirectorDate : May 14, 2019 (DIN: 00013356)

Annual Report 2018-19 | 63
ANNEXURE–VII
a) Statement showing names and other details of top 10 employees in terms of remuneration drawn under Rule 5(2)/(3)of the Companies (Appointment and Remuneration of Managerial Personnel) Rules, 2014, as amended:
Amount in Rs. lacsSr. Name Designation Remuneration
Received (Rs. In Lacs)
Qualification Experience in years
Date of Commencement of employment
Age in
years
Last Employment held before joining the Company
%age / No. of Equity Shares
held with spouse and dependent
children1 J.K. Jain Chairman &
Managing Director
124.80 Graduate 47 06-02-1989 67 See Notes 23.22% (See Notes)
2 Seema Jain Whole-time Director
60.00 Graduate 35 06-02-1989 64 See Notes 22.49% (See Notes)
3 Rahul Jain Whole-time Director
60.00 Management Graduate
10 14-11-2004 32 See Notes 11.80% (See Notes)
4 J.S.S Rao Whole-time Director
102.00 Post Graduate
40 01-05-2003 62 Toshi Auto Industries Pvt. Ltd.
12 (Nos.)
5 K. R. Yadav Whole-time Director
97.45 Matriculation 44 01-11-1997 63 B.P. Plastic Industries
338 (Nos.)
6 Rajesh Sharma
E. D. (Marketing) 117.00 Science Graduate
35 01-09-2003 56 Toshi Auto Industries Pvt. Ltd.
NIL
7 O.P. Gupta Chief Financial Officer
57.00 CA,CS, ICWA 32 24-05-2006 60 C.L. Gupta Exports Ltd.
NIL
8 V.K. Goel Corporate Head (Purchase)
66.66 MBA 40 06-02-2003 62 Haryana Steel & Alloys Ltd.
10 (Nos.)
9 Shanmuga sundaram D.
Head (R&D) 68.85 MS 23 04-04-2012 43 TVS Motor Company Ltd.
NIL
10 Arvind Kumar Chauhan
Company Secretary
68.31 CS,LLB 18 07-03-2006 44 Self- employed as Practicing
Company Secretary
NIL
Nature of Employment, whether Contractual or Otherwise (for all above employees):
Mr. J.K Jain, Mrs. Seema Jain. Mr. Rahul Jain, Mr. J.S.S. Rao and Mr. K.R. Yadav are Board members and appointed / re-appointed by the Board and shareholders at the recommendation of Nomination & Remuneration Committee, as per terms and tenure contained in the respective resolution(s).
- All other employees are in regular employment of the Company.
Notes:
1. Mr. J.K. Jain and Mrs. Seema Jain are founder promoters of the Company. Since incorporation they are on the Board of the Company. Before this Company, Mr. J.K. Jain and Mrs. Seema Jain were engaged in automotive lighting business in B.P. Plastic Industries and other family concerns. Mr. Rahul Jain also started his carrier with the Company and he was appointed on the Board on 14.11.2004.
2. Above shareholding as on March 31, 2019, is in individual name of Mr. J.K Jain, Mrs. Seema Jain and Mr. Rahul Jain. All promoters along with related concerns (promoter group) hold 64.32 % of the total share capital of the Company.
3. The above remuneration does not include leave encashment, gratuity and perquisites.
4. Whether any such employee is a relative of any director or manager of the Company, with name of such Director:
Mr. Rahul Jain, Whole-time Director, Ms. Aanchal Jain, Whole-time Director are son and daughter of Mr. J.K. Jain, Chairman & Managing Director and Mrs. Seema Jain, Whole-time Director. Hence, all four are related to each other. Futher, all of these are promoters of the Company with 64.32% shareholding as on March 31, 2019. None of the other employees in above list is relative of any Director.

64 | Fiem Industries Limited
b) Statement showing names and other details of employees, who, if employed throughout the Financial Year, was in receipt of remuneration for that year which, in the aggregate, was not less than Rs.1,02,00,000/-: The above table cover all such employees.
c) Statement showing names and other details of employees, who, if employed for a part of the Financial Year, was in receipt of remuneration for any part of the year, at a rate which, in the aggregate, was not less than Rs. 8,50,000/- per month: There is no such employee during the year.
d) Statement showing names and other details of employees, who, if employed throughout the Financial Year or part thereof, was in receipt of remuneration for that year which, in the aggregate, or as the case may be, at a rate which, in the aggregate, is in excess of that drawn by the managing director, whole-time director or manager and also holds by himself or along with his spouse and dependent children, not less than 2% of the equity shares of the Company: There is no such employee during the year.
e) Particulars of employees, posted and working in a country outside India, not being directors or their relatives, drawing more than Rupees 60 lakh per financial year or Rupees 5 lakh per month, as the case may be: There is no such employee during the year.
For and on behalf of the Board of Fiem Industries Limited
Sd/- J.K. JainPlace : Rai, Sonepat (HR.) Chairman & Managing DirectorDate : May 14, 2019 (DIN: 00013356)
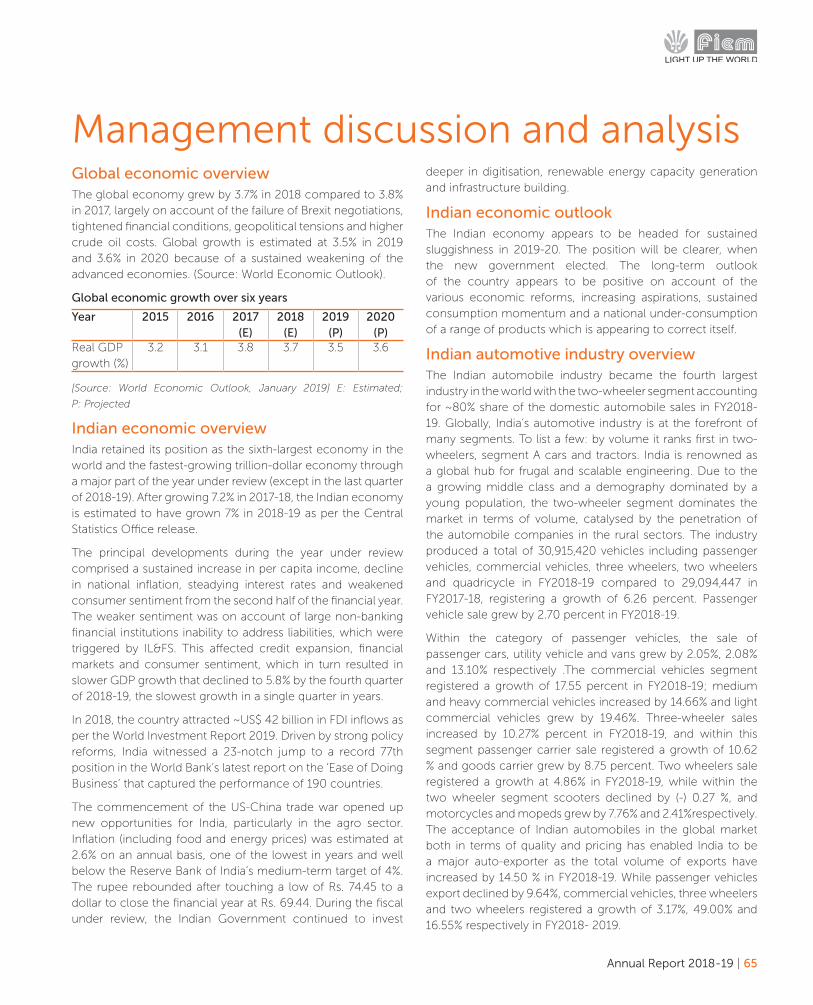
Annual Report 2018-19 | 65
Management discussion and analysisGlobal economic overview The global economy grew by 3.7% in 2018 compared to 3.8% in 2017, largely on account of the failure of Brexit negotiations, tightened financial conditions, geopolitical tensions and higher crude oil costs. Global growth is estimated at 3.5% in 2019 and 3.6% in 2020 because of a sustained weakening of the advanced economies. (Source: World Economic Outlook).
Global economic growth over six years
Year 2015 2016 2017 (E)
2018 (E)
2019 (P)
2020 (P)
Real GDP growth (%)
3.2 3.1 3.8 3.7 3.5 3.6
[Source: World Economic Outlook, January 2019] E: Estimated;
P: Projected
Indian economic overviewIndia retained its position as the sixth-largest economy in the world and the fastest-growing trillion-dollar economy through a major part of the year under review (except in the last quarter of 2018-19). After growing 7.2% in 2017-18, the Indian economy is estimated to have grown 7% in 2018-19 as per the Central Statistics Office release.
The principal developments during the year under review comprised a sustained increase in per capita income, decline in national inflation, steadying interest rates and weakened consumer sentiment from the second half of the financial year. The weaker sentiment was on account of large non-banking financial institutions inability to address liabilities, which were triggered by IL&FS. This affected credit expansion, financial markets and consumer sentiment, which in turn resulted in slower GDP growth that declined to 5.8% by the fourth quarter of 2018-19, the slowest growth in a single quarter in years.
In 2018, the country attracted ~US$ 42 billion in FDI inflows as per the World Investment Report 2019. Driven by strong policy reforms, India witnessed a 23-notch jump to a record 77th position in the World Bank’s latest report on the ‘Ease of Doing Business’ that captured the performance of 190 countries.
The commencement of the US-China trade war opened up new opportunities for India, particularly in the agro sector. Inflation (including food and energy prices) was estimated at 2.6% on an annual basis, one of the lowest in years and well below the Reserve Bank of India’s medium-term target of 4%. The rupee rebounded after touching a low of Rs. 74.45 to a dollar to close the financial year at Rs. 69.44. During the fiscal under review, the Indian Government continued to invest
deeper in digitisation, renewable energy capacity generation and infrastructure building.
Indian economic outlookThe Indian economy appears to be headed for sustained sluggishness in 2019-20. The position will be clearer, when the new government elected. The long-term outlook of the country appears to be positive on account of the various economic reforms, increasing aspirations, sustained consumption momentum and a national under-consumption of a range of products which is appearing to correct itself.
Indian automotive industry overviewThe Indian automobile industry became the fourth largest industry in the world with the two-wheeler segment accounting for ~80% share of the domestic automobile sales in FY2018-19. Globally, India’s automotive industry is at the forefront of many segments. To list a few: by volume it ranks first in two-wheelers, segment A cars and tractors. India is renowned as a global hub for frugal and scalable engineering. Due to the a growing middle class and a demography dominated by a young population, the two-wheeler segment dominates the market in terms of volume, catalysed by the penetration of the automobile companies in the rural sectors. The industry produced a total of 30,915,420 vehicles including passenger vehicles, commercial vehicles, three wheelers, two wheelers and quadricycle in FY2018-19 compared to 29,094,447 in FY2017-18, registering a growth of 6.26 percent. Passenger vehicle sale grew by 2.70 percent in FY2018-19.
Within the category of passenger vehicles, the sale of passenger cars, utility vehicle and vans grew by 2.05%, 2.08% and 13.10% respectively .The commercial vehicles segment registered a growth of 17.55 percent in FY2018-19; medium and heavy commercial vehicles increased by 14.66% and light commercial vehicles grew by 19.46%. Three-wheeler sales increased by 10.27% percent in FY2018-19, and within this segment passenger carrier sale registered a growth of 10.62 % and goods carrier grew by 8.75 percent. Two wheelers sale registered a growth at 4.86% in FY2018-19, while within the two wheeler segment scooters declined by (-) 0.27 %, and motorcycles and mopeds grew by 7.76% and 2.41%respectively. The acceptance of Indian automobiles in the global market both in terms of quality and pricing has enabled India to be a major auto-exporter as the total volume of exports have increased by 14.50 % in FY2018-19. While passenger vehicles export declined by 9.64%, commercial vehicles, three wheelers and two wheelers registered a growth of 3.17%, 49.00% and 16.55% respectively in FY2018- 2019.
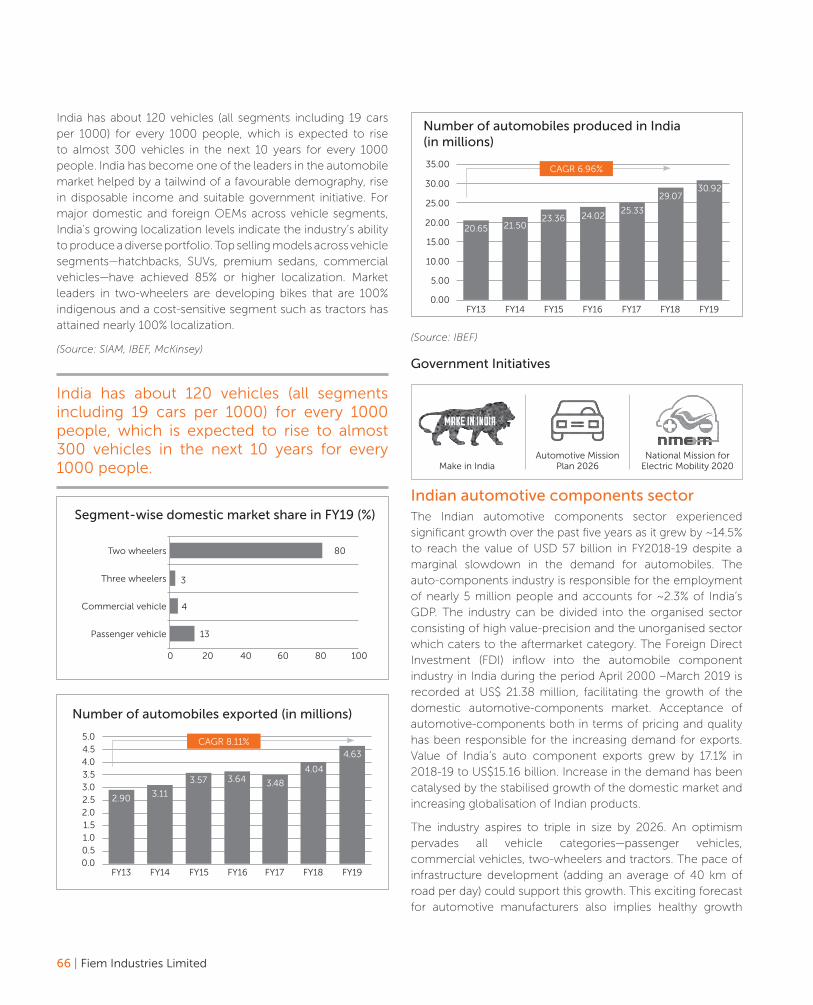
66 | Fiem Industries Limited
India has about 120 vehicles (all segments including 19 cars per 1000) for every 1000 people, which is expected to rise to almost 300 vehicles in the next 10 years for every 1000 people. India has become one of the leaders in the automobile market helped by a tailwind of a favourable demography, rise in disposable income and suitable government initiative. For major domestic and foreign OEMs across vehicle segments, India’s growing localization levels indicate the industry’s ability to produce a diverse portfolio. Top selling models across vehicle segments—hatchbacks, SUVs, premium sedans, commercial vehicles—have achieved 85% or higher localization. Market leaders in two-wheelers are developing bikes that are 100% indigenous and a cost-sensitive segment such as tractors has attained nearly 100% localization.
(Source: SIAM, IBEF, McKinsey)
India has about 120 vehicles (all segments including 19 cars per 1000) for every 1000 people, which is expected to rise to almost 300 vehicles in the next 10 years for every 1000 people.
Segment-wise domestic market share in FY19 (%)
Two wheelers 80
3
4
13
0 20 40 60 80 100
Three wheelers
Commercial vehicle
Passenger vehicle
Number of automobiles exported (in millions)
5.0
4.0
3.0
2.0
1.0
4.5
3.5
2.5
1.5
0.50.0
FY13 FY15 FY17FY14 FY16 FY18 FY19
2.90 3.11
3.57 3.64 3.48
4.04
4.63CAGR 8.11%
Number of automobiles produced in India (in millions)
35.00
30.00
25.00
20.00
15.00
10.00
5.00
0.00FY13 FY15 FY17FY14 FY16 FY18 FY19
20.65 21.5023.36 24.02
25.33
29.0730.92
CAGR 6.96%
(Source: IBEF)
Government Initiatives
Automotive Mission Plan 2026
National Mission for Electric Mobility 2020Make in India
Indian automotive components sectorThe Indian automotive components sector experienced significant growth over the past five years as it grew by ~14.5% to reach the value of USD 57 billion in FY2018-19 despite a marginal slowdown in the demand for automobiles. The auto-components industry is responsible for the employment of nearly 5 million people and accounts for ~2.3% of India’s GDP. The industry can be divided into the organised sector consisting of high value-precision and the unorganised sector which caters to the aftermarket category. The Foreign Direct Investment (FDI) inflow into the automobile component industry in India during the period April 2000 –March 2019 is recorded at US$ 21.38 million, facilitating the growth of the domestic automotive-components market. Acceptance of automotive-components both in terms of pricing and quality has been responsible for the increasing demand for exports. Value of India’s auto component exports grew by 17.1% in 2018-19 to US$15.16 billion. Increase in the demand has been catalysed by the stabilised growth of the domestic market and increasing globalisation of Indian products.
The industry aspires to triple in size by 2026. An optimism pervades all vehicle categories—passenger vehicles, commercial vehicles, two-wheelers and tractors. The pace of infrastructure development (adding an average of 40 km of road per day) could support this growth. This exciting forecast for automotive manufacturers also implies healthy growth
Annual Report 2018-19 | 67
for auto component manufacturers. The auto component industry’s turnover increased from INR 1.1 lakh cr (USD 24 bn) in FY 2009 to INR 3.5 lakh cr (USD 51.2 bn) in FY 2018. The industry now aspires to double its contribution to manufacturing GDP with a four-fold growth in size and a six-fold growth in export by 2026. However, the implementation of BS-VI from April 2020 and govt’s revised thrust for early adoption of E-vehicle, may not be in sync with each other as investment made by the industry players for BS-VI may not got the full opportunity to get return on the investment, because of government push for early and fast adoption of E-Vehicle.
(Source: IBEF, ICRA, Business Standard, McKinsey)
Outlook, opportunities and threatsThe Indian auto-components industry is projected to become the third largest in the world by 2025 and is expected to account for as much as 5% to 7% of India’s GDP by 2026. Globalisation coupled with favourable government initiatives and significant FDI inflow from major global players will facilitate the growth of the Indian auto-components sector. However, all these perceptions are subject to new things happening in theindustry that may change the landscape of the industry in the medium to long term.
Technological changes and disruptionsDue to technological advancements and consequent disruptions, it would be difficult to predict the industry’s performance in very precise terms. These trends could change the industry matrix at every level, whether OEMs or Components manufacturer, trigger new competitions and generate a totally different market order.
ACES gathering momentum but a bit slowlyAutonomous vehicles, Connected vehicles, Electrification and Shared Mobility (ACES) are evolving. These disruptive and technology-driven trends could change the face of the mobility industry. India already has more than 50 start-ups working on innovative ACES technologies across cars, two-wheelers and commercial vehicles. These technologies are gaining ground due to increasing customer acceptance, stricter emission regulations, lower battery costs and more thrust on charging infrastructure.
It is largely expected that by 2030 the share of EVs in the global market could be upwards of 30 percent of all new vehicle sales, edging into the market share of traditional vehicles. By that time, shared mobility and connected vehicles could contribute USD 1,575 bn to automotive revenues, a critical chunk of overall revenues of USD 6,600 bn. A leading shared mobility company took more than eight years to complete its first 5 bn rides, and then in just over one year, doubled the number of rides. In India, shared mobility providers saw a four-fold rise in ride volumes between 2015 and 2016. With
EVs likely to make these services cheaper, the figures are only expected to increase. Every component will feel the effect of these trends differently, and to varying degrees. For example, electrification could over time slow down the demand for internal combustion engine components, while fueling the rise of electric motors, battery cells and battery systems.
Evolving regulatory and trade environmentThe world beyond the industry also contributes an element of dynamism, with changing macro realities due to regulatory and policy shifts that are beyond the control of any one company or industry. Evolving and increasingly stringent regulations could change the expectations of auto component manufacturers, who might need to rethink their component production to comply with regulatory and other guidelines, such as:
- Emissions: Enforcement of BS-VI norms by 2020, push towards EV, discussions on methanol, CNG and potentially even fuel cells
- Safety: Mandatory ABS on cars, buses and two-wheelers, cabin safety, and roll over protection systems
- Scrappage: Policy mandating the scrappage of old trucks impacting lead use and reverse value chain
All these trends together are shaping a set of opportunities for auto component manufacturers.
(Source: The auto component industry in India: Preparing for the
future- McKinsey/ACMA)
Automotive lightingAutomotive lighting is one of the most important components of an automobile vehicle from the perspective of safety, functionality as well as aesthetic. The innovation in Automotive Lighting is an ever evolving process and is currently witnessing a fast adoption of LED. In comparison to conventional lamps, LED lamps offer unlimited possibilities for designing and development from safety, functionality as well as aesthetic perspective. The next technological advancement waiting in the wings is OLED and laser. LED could be most suitable for e-vehicles as it will consume less power and present more options for functional as well as designing requirements. The Company is well ahead of the curve, based on its in-house R&D, technological expertise, design and development strengths and world-class manufacturing facilities to capitalise on these new growth opportunities and provide the vehicles, especially the 2–wheelers, with the best-in-class lighting solutions that the latest technology can provide.
Financial and operational performance reviewA summary of the Company’s financial performance on a standalone basis is provided below:
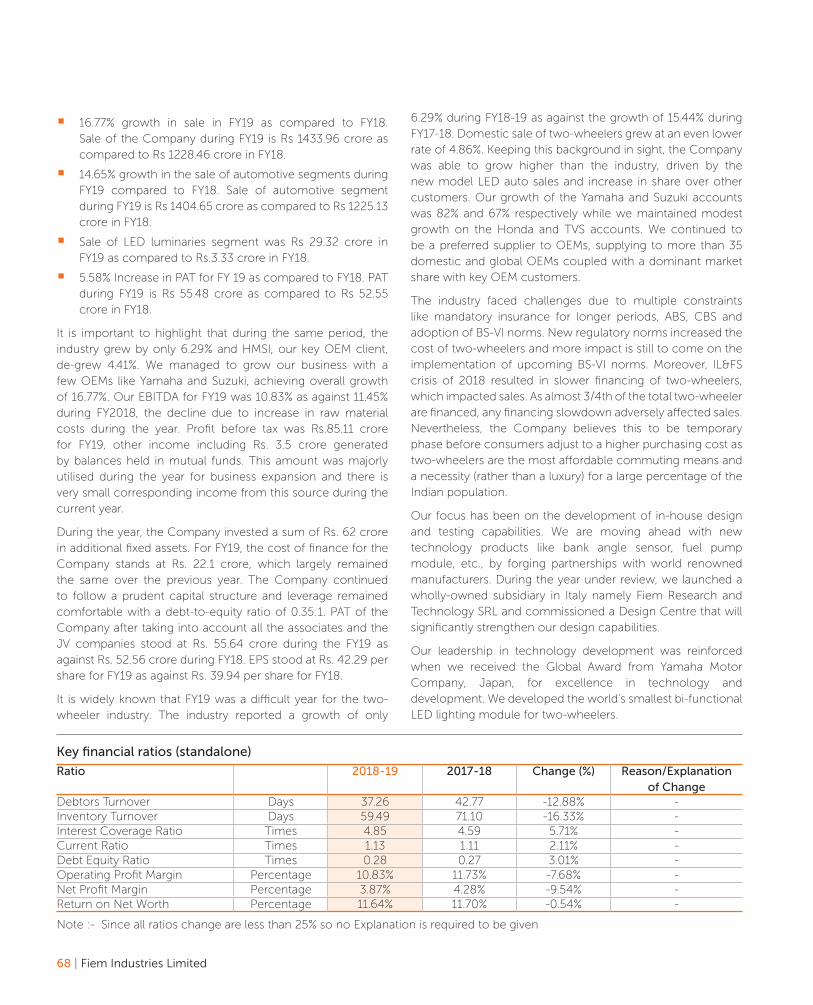
68 | Fiem Industries Limited
■ 16.77% growth in sale in FY19 as compared to FY18. Sale of the Company during FY19 is Rs 1433.96 crore as compared to Rs 1228.46 crore in FY18.
■ 14.65% growth in the sale of automotive segments during FY19 compared to FY18. Sale of automotive segment during FY19 is Rs 1404.65 crore as compared to Rs 1225.13 crore in FY18.
■ Sale of LED luminaries segment was Rs 29.32 crore in FY19 as compared to Rs.3.33 crore in FY18.
■ 5.58% Increase in PAT for FY 19 as compared to FY18. PAT during FY19 is Rs 55.48 crore as compared to Rs 52.55 crore in FY18.
It is important to highlight that during the same period, the industry grew by only 6.29% and HMSI, our key OEM client, de-grew 4.41%. We managed to grow our business with a few OEMs like Yamaha and Suzuki, achieving overall growth of 16.77%. Our EBITDA for FY19 was 10.83% as against 11.45% during FY2018, the decline due to increase in raw material costs during the year. Profit before tax was Rs.85.11 crore for FY19, other income including Rs. 3.5 crore generated by balances held in mutual funds. This amount was majorly utilised during the year for business expansion and there is very small corresponding income from this source during the current year.
During the year, the Company invested a sum of Rs. 62 crore in additional fixed assets. For FY19, the cost of finance for the Company stands at Rs. 22.1 crore, which largely remained the same over the previous year. The Company continued to follow a prudent capital structure and leverage remained comfortable with a debt-to-equity ratio of 0.35:1. PAT of the Company after taking into account all the associates and the JV companies stood at Rs. 55.64 crore during the FY19 as against Rs. 52.56 crore during FY18. EPS stood at Rs. 42.29 per share for FY19 as against Rs. 39.94 per share for FY18.
It is widely known that FY19 was a difficult year for the two-wheeler industry. The industry reported a growth of only
6.29% during FY18-19 as against the growth of 15.44% during FY17-18. Domestic sale of two-wheelers grew at an even lower rate of 4.86%. Keeping this background in sight, the Company was able to grow higher than the industry, driven by the new model LED auto sales and increase in share over other customers. Our growth of the Yamaha and Suzuki accounts was 82% and 67% respectively while we maintained modest growth on the Honda and TVS accounts. We continued to be a preferred supplier to OEMs, supplying to more than 35 domestic and global OEMs coupled with a dominant market share with key OEM customers.
The industry faced challenges due to multiple constraints like mandatory insurance for longer periods, ABS, CBS and adoption of BS-VI norms. New regulatory norms increased the cost of two-wheelers and more impact is still to come on the implementation of upcoming BS-VI norms. Moreover, IL&FS crisis of 2018 resulted in slower financing of two-wheelers, which impacted sales. As almost 3/4th of the total two-wheeler are financed, any financing slowdown adversely affected sales. Nevertheless, the Company believes this to be temporary phase before consumers adjust to a higher purchasing cost as two-wheelers are the most affordable commuting means and a necessity (rather than a luxury) for a large percentage of the Indian population.
Our focus has been on the development of in-house design and testing capabilities. We are moving ahead with new technology products like bank angle sensor, fuel pump module, etc., by forging partnerships with world renowned manufacturers. During the year under review, we launched a wholly-owned subsidiary in Italy namely Fiem Research and Technology SRL and commissioned a Design Centre that will significantly strengthen our design capabilities.
Our leadership in technology development was reinforced when we received the Global Award from Yamaha Motor Company, Japan, for excellence in technology and development. We developed the world’s smallest bi-functional LED lighting module for two-wheelers.
Key financial ratios (standalone)
Ratio 2018-19 2017-18 Change (%) Reason/Explanation of Change
Debtors Turnover Days 37.26 42.77 -12.88% -Inventory Turnover Days 59.49 71.10 -16.33% -Interest Coverage Ratio Times 4.85 4.59 5.71% -Current Ratio Times 1.13 1.11 2.11% -Debt Equity Ratio Times 0.28 0.27 3.01% -Operating Profit Margin Percentage 10.83% 11.73% -7.68% -Net Profit Margin Percentage 3.87% 4.28% -9.54% -Return on Net Worth Percentage 11.64% 11.70% -0.54% -
Note :- Since all ratios change are less than 25% so no Explanation is required to be given
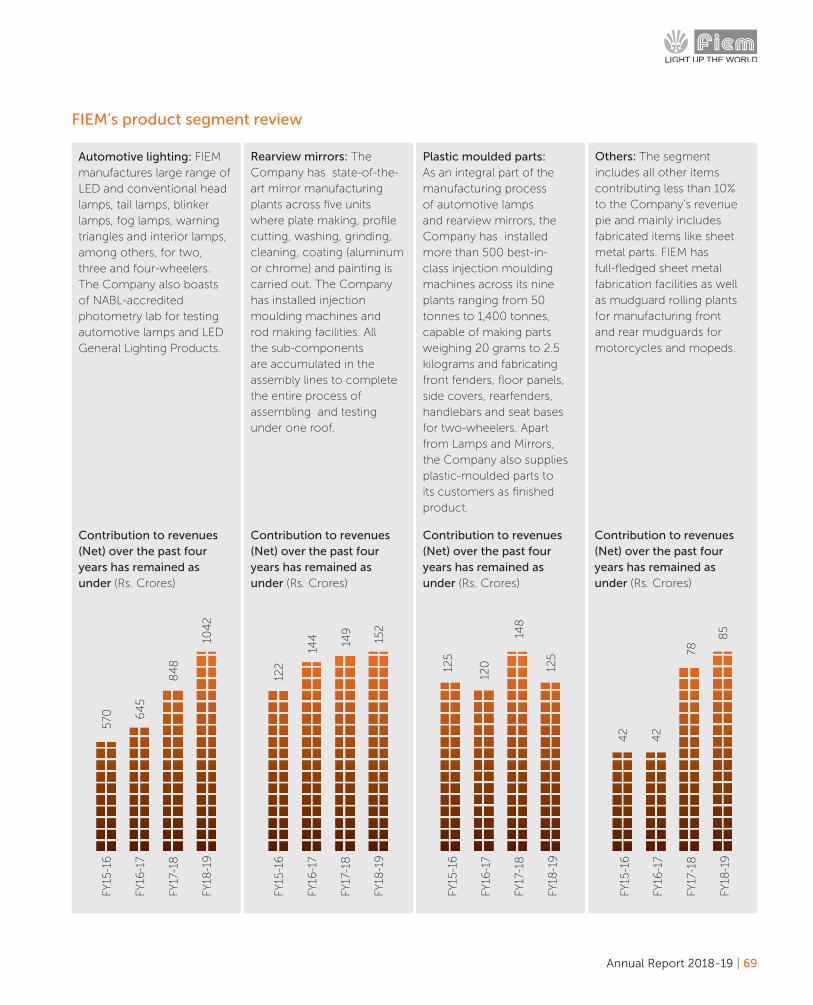
Annual Report 2018-19 | 69
FIEM’s product segment review
Automotive lighting: FIEM manufactures large range of LED and conventional head lamps, tail lamps, blinker lamps, fog lamps, warning triangles and interior lamps, among others, for two, three and four-wheelers. The Company also boasts of NABL-accredited photometry lab for testing automotive lamps and LED General Lighting Products.
Contribution to revenues (Net) over the past four years has remained as under (Rs. Crores)
Contribution to revenues (Net) over the past four years has remained as under (Rs. Crores)
Contribution to revenues (Net) over the past four years has remained as under (Rs. Crores)
Contribution to revenues (Net) over the past four years has remained as under (Rs. Crores)
Plastic moulded parts: As an integral part of the manufacturing process of automotive lamps and rearview mirrors, the Company has installed more than 500 best-in-class injection moulding machines across its nine plants ranging from 50 tonnes to 1,400 tonnes, capable of making parts weighing 20 grams to 2.5 kilograms and fabricating front fenders, floor panels, side covers, rearfenders, handlebars and seat bases for two-wheelers. Apart from Lamps and Mirrors, the Company also supplies plastic-moulded parts to its customers as finished product.
Rearview mirrors: The Company has state-of-the-art mirror manufacturing plants across five units where plate making, profile cutting, washing, grinding, cleaning, coating (aluminum or chrome) and painting is carried out. The Company has installed injection moulding machines and rod making facilities. All the sub-components are accumulated in the assembly lines to complete the entire process of assembling and testing under one roof.
Others: The segment includes all other items contributing less than 10% to the Company’s revenue pie and mainly includes fabricated items like sheet metal parts. FIEM has full-fledged sheet metal fabrication facilities as well as mudguard rolling plants for manufacturing front and rear mudguards for motorcycles and mopeds.
FY15
-16
570
FY17
-18
84
8
FY16
-17
64
5
FY18
-19
104
2
FY15
-16
FY17
-18
FY16
-17
125
120
148
125
FY18
-19
FY15
-16
FY17
-18
FY16
-17
122
144 149
152
FY18
-19
FY15
-16
FY17
-18
FY16
-17
42
42
78
85
FY18
-19
70 | Fiem Industries Limited
FIEM’s LED segmentFIEM’s LED segment sales products under two major categories: LED luminaires for indoor and outdoor applications and integrated passenger information systems with LED displays for trains and buses.During FY 19, the Net revenue form this segment was Rs. 29.32 Crores as compared to Rs.3.33 Crores in FY18.
Risks and ConcernsThe two-wheeler segment of the automobile industry is our major source of revenue. Of late, the automobile industry as a whole has witnessed slow sale for a range of reasons. The two-wheeler segment has also been subjected to regulatory changes leading to an increase in the cost of the vehicles. Should this slowdown continue for a longer period and our customers reduce their production, our growth will very likely be affected. Over and above this, our growth may also be adversely affected by a slower rate of purchase of vehicles on account of increased interest rates and low availability of finances. The automobile industry is going through a lot of disruption on account of technological changes, customer preferences and new experiments like Autonomous vehicles, Connected vehicles, E-vehicles and Shared Mobility all of which may end up changing the existing industry landscape. However we, at our Company, see disruption as opportunities and believe that we can capitalise on these opportunities with an agile and a startup mindset.
Human resourcesThe Company has a favourable work environment that motivates performance, encourage customer oriented focus and innovation while adhering to the highest degree of quality. As a part of human capital development with an aim to
enhance operational efficiency, employees of the Company have been regularly provided training and skill upgradation. The Company is committed to nurturing, enhancing and retaining talent through superior learning and organisational development programme. To enhance the engagement, retention and work life balance of the employees, the Company has introduced progressive policies and programs like diverse reward and recognition program and employee interaction programs. During the year under review industrial relations remained cordial through all plants of the Company.
At the close of the financial year under review , there were 2153 employees on the payroll of the Company.
Internal control system and their adequacyThe Company has an adequate system of internal controls to ensure that transactions are properly authorised, recorded, and reported, apart from safeguarding its assets.An internal financial control system forms the backbone of risk management and governance. The Company has put in place a well-defined and adequate internal controls system commensurate with the size of the Company and the complexity of its operation. These have been operating effectively throughout the year. These controls were routinely tested and certified by external as well as internal auditors covering all offices, factories and key business areas. Cross functional teams in all the factories also play a significant role in the internal control system of production operations. System certification further strengthens these systems.
Further, Company is in the process of implementation of SAP system across its all units and offices - SAP S/4HANA Enterprise Management, to make the Company future ready as well with the objective of better control.
Annual Report 2018-19 | 71
Corporate Governance Report(The Report on Corporate Governance forms part of the Directors’ Report for the financial year ended March 31, 2019)
The Board of Directors of the Company present the Company’s Report on Corporate Governance pursuant to the statutory compliances as per requirements of the Companies Act, 2013 and SEBI (Listing Obligations and Disclosure Requirements) Regulations, 2015 (Listing Regulations”), as amended.
1. COMPANY PHILOSOPHY ON CORPORATE GOVERNANCEOur governance philosophy is based on our core values of integrity, performance, accountability, passion and transparency. Focus on our core values gives us strength and motivates us for our future growth and caring for all stakeholders. Company relentlessly strives to align its vision and strategy for benefit of all stakeholders with long-term sustainability. The Board, as the top governing body, guide the Company based on above philosophy. We believe that Corporate Governance must translate into commitment to maximize long-term stakeholder value and growth of the business of the Company. Hence, customers are the nucleus of everything we do and we act responsibly towards our customers, business partners, associates, stakeholders, environment and society at large.
2. BOARD OF DIRECTORSThe Board of the Directors is the prime governing body and the composition of Board of Directors of the Company is governed by the Companies Act, 2013 and rules made thereunder, Securities and Exchange Board of India (Listing Obligations and Disclosure Requirements) Regulations, 2015 (‘Listing Regulations’), the Articles of Association of the Company and in accordance with the best practices in Corporate Governance.
Currently, the Board of the Company consists of 12 Directors, all the Directors have diverse experience and background fulfilling the statutory as well as business requirements.
Independent Directors: The Companies Act, 2013 and the Listing Regulations define an ‘Independent Director’. All our Independent Directors fulfill the conditions of independence specified under Section 149 of the Companies Act, 2013 and Regulation 16(1)(b) of the Listing Regulations. A formal letter of appointment to Independent Directors as provided in Companies Act, 2013 has been issued and disclosed on website of the Company viz. www.fiemindustries.com.
a. As at March 31, 2019 the Company’s Board comprises twelve (12) Directors, out of which six (6) are Independent Non-Executive Directors, which constitute 50% of the Board, in compliance with the Listing Regulations. Mr. J.K. Jain is Chairman & Managing Director and other 5 directors are Whole-time Directors including two (2) woman directors. None of the Independent Director of the Company serve as an Independent Director in more than seven (7) listed companies.
b. Various Committees forms the next level of governing bodies and complement the governing system of Company. Committees constituted to oversee specific areas. Overall direction and strategy, policy formulation, setting up of objectives, evaluation of performance and control functions vest with the Board. The Committees have specific area assigned to them by the Board through terms of reference. The notice and detailed agenda along with the relevant notes and other material information are sent in advance to each Director and in exceptional cases tabled at the Meeting with the approval of the Board. In urgent cases, approval of the Board sought through resolution by circulation. This ensures timely and informed decisions by the Board.
c. The Board Committees play an important role in the overall management and governance of the Company. The Board Committees meet at regular intervals and take necessary steps to perform duties as entrusted by the Board through terms of reference. The Minutes of the Committee Meetings are placed before the Board for noting.
The Board has established Four (4) Committees to discharge its responsibilities, namely–
• Audit Committee,
• Nomination & Remuneration Committee,
• Stakeholders’ Relationship Committee and
• Corporate Social Responsibility (CSR) Committee.
The Board is authorized to constitute additional functional committee, depending on business needs. Company Secretary of the Company act as the Secretary to all the Committees of the Board

72 | Fiem Industries Limited
constituted and operated under the Companies Act, 2013 and the Listing Regulations. The Management works under direction of the Board. Overall operations and functioning of the Company are managed by Chairman & Managing Director with five (5) Whole–time Directors and a core group of senior level executives.
d. The names and categories of the Directors on the Board, their attendance at Board Meetings held during the financial year under review and at last Annual General Meeting, the number of Directorships and Committee Chairmanships / Memberships held by them in other public companies as on March 31, 2019 are given herein below:
Sr. No.
Name of the Director
Designation Category Attendance at board meetings
during the year 2018-
19
Whether attended last AGM held on
September 17, 2018
Number of directorship in other Boards/
Committees
Directorship in other Listed entities’ Board
Shareholding in Fiem
Industries Limited (No. of
Shares as on 31.03.2019)
Number of other Boards
in which Director is a Member
or Chairman*
Number of other Public Company’s
Board Committees
in which Director is a Member or Chairman**
Name of other Listed
entities in which Director
have Directorship
Category of Directorship
1. Mr. J. K. Jain
Chairman & Managing Director
PED 6/6 Yes NIL NIL NIL NA 3055808
2. Mrs. Seema Jain
Whole–time Director
PED 6/6 Yes NIL NIL NIL NA 2960000
3. Mr. J.S.S. Rao
Whole–time Director
NPED 6/6 No NIL NIL NIL NA 12
4. Mr. K. R. Yadav
Whole–time Director
NPED 6/6 Yes NIL NIL NIL NA 338
5. Ms. Aanchal Jain
Whole–time Director
PED 6/6 No NIL NIL NIL NA 800000
6. Mr. Rahul Jain
Whole–time Director
PED 6/6 No NIL NIL NIL NA 1552340
7. Mr. Iqbal Singh
Independent Director
ID 6/6 Yes NIL NIL NIL NA 20014
8. Mr. Vinod K. Malhotra
Independent Director
ID 6/6 Yes NIL NIL NIL NA NIL
9. Mr. Subodh Kumar Jain
Independent Director
ID 5/6 Yes NIL NIL NIL NA NIL
10. Mr. Mohan Bir Sahni
Independent Director
ID 5/6 No 1^ NIL NIL NA NIL
11. Mr. Ashok Kumar Sharma
Independent Director
ID 4/6 Yes NIL NIL NIL NA NIL
12. Mr. Jawahar Thakur
Independent Director
ID 6/6 No NIL NIL NIL NA NIL
PED (Promoter Executive Director), NPED (Non Promoter Executive Director), ID (Independent Director)
* Excludes directorship held in Private Companies, Section 8 Companies and Foreign Companies.
** As required under Regulation 26(1) of the Listing Regulations, the disclosure includes membership / chairpersonship of the audit committee and stakeholders’ relationship committee in Indian public companies (listed and unlisted).
^ Mr. M.B. Sahni is the Board Member of Elofic Industries Limited.

Annual Report 2018-19 | 73
e. None of the Directors on the Board hold directorships in more than ten (10) public companies. Further, none of them is a member of more than ten (10) committees or chairman of more than five (5) committees across all the public companies in which he is a Director.
f. Independent Directors are Non–Executive directors as defined under Regulation 16(1)(b) of the Listing Regulations read with Section 149(6) of the Companies Act, 2013 (“the Act”). The maximum tenure of independent directors is in compliance with the Act. All the Independent Directors have confirmed that they meet the criteria as mentioned under Regulation 16(1)(b) of the Listing Regulations read with Section 149(6) of the Act.
g. The members of the Board have made the required disclosures to the Board regarding their direct or indirect concerns or interests in any contract or transaction with the Company.
h. Six (6) Board Meetings were held during the financial year under review and the gap between two consecutive meetings did not exceed one hundred and twenty days. The dates on which the said meetings were held are as follows:
April 16, 2018, May 30, 2018, August 13, 2018, November 14, 2018, February 09, 2019 and March 18, 2019.
The necessary quorum was present at all the meetings. All material information was circulated to the directors before the meeting or placed at the meeting, including minimum information required to be made available to the Board as prescribed under Part A of Schedule II of Sub-Regulation 7 of Regulation 17 of the Listing Regulations.
The important decisions taken at the Board/Board Committee Meetings are communicated to the concerned department/division. The Company Secretary attends the Board Meetings and assist and advises the Board on compliances with applicable laws and governance.
The Company has proper systems to enable the Board to review on a quarterly basis compliance reports of all laws applicable to the Company, as prepared by the Company as well as to assess the steps taken by the Company to rectify instances of non-compliances, if any.
i. During the financial year under review one separate meeting of Independent Directors was also held on February 09, 2019 without the attendance of Non-Independent Directors and members of the Management. All Independent Directors, except Mr. Mohan Bir Sahni attended the said meeting. The Independent Directors,
inter–alia, reviewed the performance of Non–Independent Directors, Chairman of the Company and the Board as a whole.
j. Inter–se relation among Directors: Mr. J.K. Jain, Chairman & Managing Director is husband of Mrs. Seema Jain and father of Mr. Rahul Jain and Ms. Aanchal Jain, Whole–time Directors of the Company. Hence all four are related to each other. Further, these all are promoters of the Company. Except these, none of other directors are related to each other.
k. The Company has not issued any convertible instruments.
l. The details of the familiarization programme of the Independent Directors are available on the website of the Company (www.fiemindustries.com). At the time of appointing an Independent Director, a formal letter of appointment is given to him, which inter-alia explains the role, function, duties and responsibilities expected from him as a Director of the Company. The Director is also briefed about his duties and compliance, disclosure requirement as well as Codes of Conduct he has to observe under the Companies Act, 2013, Listing Regulations, PIT Regulations and other various statutes. The Chairman & Managing Director also meet one-to-one with the newly appointed Director to familiarize him with the Company’s operations. Periodic plant visits also facilitated to give them fist hand experience of manufacturing. Further, on an ongoing basis as a part of Agenda of Board / Committee Meetings, presentations are regularly made to the Independent Directors on various matters inter-alia covering the Company’s and its subsidiaries/associates businesses and operations, industry and regulatory updates, strategy, finance, risk management framework, role, rights, responsibilities of the Independent Directors under various statutes and other relevant matters.
m. Matrix of Core Skills/Experience/ Competencies of the Board
The Board of Directors has identified following matrix of core Skills/Experience/ Competencies for itself, as required in the context of business of the Company and automotive sector, to function affectively:
(i) Strategic, Futuristic and Growth oriented approach.
(ii) Domain Knowledge of Automotive Components business, especially Automotive lighting.
(iii) Indian and global economy and Automobile Business matrix, especially OEMs.
(iv) Operational, Finance and Marketing competencies.
74 | Fiem Industries Limited
Current Board of the Company is competent enough and possesses above core Skills/Experience/ Competencies to function effectively and running the Company successfully with growth oriented approach.
n. It is hereby confirmed that in the opinion of the Board, the Independent Directors fulfil the conditions specified in the SEBI (Listing Obligations and Disclosure Requirements) Regulations, 2015, as amended, and they are independent of the management.
o. As no Independent Director has resigned from the Company during the year, hence requirement of giving detailed reasons for the resignation of an independent director along with a confirmation by such director that there are no other material reasons other than those provided, does not apply.
p. The Company has received a certificate from Mrs. Ranjana Gupta, Practicing Company Secretary to the effect that none of the directors on the Board of the Company has been debarred or disqualified from being appointed or continuing as directors of the Company by the Ministry of Corporate Affairs or any other statutory authority. The same forms part of this report.
3. AUDIT COMMITTEEThe role, powers and terms of reference of the Audit Committee covers the areas as contemplated under Section 177 of the Companies Act, 2013 and Regulation 18 of the Listing Regulations, as applicable, besides other terms as referred by the Board of Directors. The Board reviews the working of the Committee from time to time to bring about greater effectiveness in order to comply with the various requirements under the Companies Act, 2013 and the SEBI Listing Regulations.
3.1 Brief Description of Terms of Reference
During 2018-19, in line with the provisions of the SEBI (LODR) (Amendment) Regulation, 2018, the terms of reference of the Committee were revised by the Board at its meeting held on February 9, 2019. The revised terms of reference are in compliance with the Companies Act, 2013 and the SEBI Listing Regulations, as amended. Further risk management is also under the scope of the Committee. The brief terms of reference of the Committee are as under:
a) Oversight of the listed entity’s financial reporting process and the disclosure of its financial information to ensure that the financial statements are correct, sufficient and credible;
b) recommendation for appointment, remuneration and terms of appointment of auditors of the listed entity;
c) approval of payment to statutory auditors for any other services rendered by the statutory auditors;
d) reviewing, with the management, the annual financial statements and auditor’s report thereon before submission to the board for approval,
e) reviewing, with the management, the quarterly financial statements before submission to the board for approval;
f) reviewing and monitoring the auditor’s independence and performance, and effectiveness of audit process;
g) approval or any subsequent modification of transactions of the listed entity with related parties;
h) scrutiny of inter–corporate loans and investments;
i) To discuss guidelines and policies to govern risk assessment and risk management;
j) evaluation of internal financial controls and risk management systems;
k) To discuss the Company’s major risk exposures and the steps Company’s management has taken to monitor and control such exposures;
l) reviewing, with the management, performance of statutory and internal auditors, adequacy of the internal control systems;
m) reviewing the adequacy of internal audit function, if any, including the structure of the internal audit department, staffing and seniority of the official heading the department, reporting structure coverage and frequency of internal audit;
n) discussion with internal auditors of any significant findings and follow up there on;
o) reviewing the findings of any internal investigations by the internal auditors into matters where there is suspected fraud or irregularity or a failure of internal control systems of a material nature and reporting the matter to the board;
p) discussion with statutory auditors before the audit commences, about the nature and scope of audit as well as post–audit discussion to ascertain any area of concern;
q) to look into the reasons for substantial defaults in the payment to shareholders (in case of non–payment of declared dividends) and creditors;
r) to review the functioning of the whistle blower mechanism;
Annual Report 2018-19 | 75
s) Review the management discussion and analysis of financial condition and results of operations;
t) Review the statement of significant related party transactions (as defined by the audit committee), submitted by management;
u) Review the management letters / letters of internal control weaknesses issued by the statutory auditors;
v) Review the internal audit reports relating to internal control weaknesses;
w) valuation of undertakings or assets of the Company, wherever it is necessary;
x) Statement of funds utilized for purposes other than those stated in the offer document/prospectus/notice in terms of Listing Regulation 32(7).
y) reviewing the utilization of loans and/ or advances by the holding company to the subsidiaries and investment by the holding company in subsidiaries, exceeding rupees 100 crore or 10% of the asset size of the subsidiary, whichever is lower including loans / advances / investments existing on the effective date of SEBI (LODR) (Amendment) Regulation, 2018 (amendment effective from 1st April, 2019).
3.2 Composition of Committee
The Audit Committee comprises of Three (3) members. All of them are Independent Directors. Mr. S.K. Jain is the Member Chairman and Mr. V.K. Malhotra and Mr. Iqbal Singh are the Members of the Committee.
The Company Secretary acts as the Secretary to the Committee. The Chief Finance Officer is permanent invitee to the Meetings of the Audit Committee. The Internal Auditor, the concerned partner/ representatives of Statutory Auditors and Cost Auditors are also invited to the meetings of the Audit Committee.
3.3 Meetings and Attendance
During the year, the Audit Committee met six (6) times on April 16, 2018, May 30, 2018, August 13, 2018, November 14, 2018, February 09, 2019 and March 18, 2019 and all members of the Committee attended the aforesaid meetings. The maximum gap between any two consecutive meetings was less than one hundred and twenty days.
The Chairman of the Audit Committee attended the last Annual General Meeting held on September 17, 2018, to answer the queries of shareholders at Annual General Meeting.
The status of attendance of Members in the Committee meeting held during the financial year are as follows:
S.N. Name of Members
Position in Committee
Attendance at Committee meetings during the financial
year 2018-191 Mr. S.K. Jain Chairman 5/62 Mr. V.K. Malhotra Member 6/63 Mr. Iqbal Singh Member 6/6
4. NOMINATION & REMUNERATION COMMITTEEThe powers, role and terms of reference of the Nomination & Remuneration Committee covers the areas as contemplated under Section 178 of the Companies Act, 2013 and Regulation 19 of the Listing Regulations, besides other terms as referred by the Board of Directors. During 2018-19, in line with the provisions of the SEBI (LODR) (Amendment) Regulations, 2018, the terms of reference of the Committee were revised by the Board at its meeting held on February 9, 2019. The revised terms of reference are in accordance with the Companies Act, 2013 and the SEBI Listing Regulations, as amended.
4.1 Brief Description of Terms of Reference
a) formulation of the criteria for determining qualifications, positive attributes and independence of a director and recommend to the board of directors a policy relating to the remuneration of the directors, key managerial personnel and other employees;
b) formulation of criteria for evaluation of performance of independent directors and the board of directors;
c) devising a policy on diversity of board of directors;
d) identifying persons who are qualified to become directors and who may be appointed in senior management in accordance with the criteria laid down, and recommend to the board of directors their appointment and removal.
e) Whether to extend or continue the term of appointment of the independent director, on the basis of the report of performance evaluation of independent directors.
f) recommend to the board, all remuneration, in whatever form, payable to senior management.
4.2 Composition of Committee
The Nomination & Remuneration Committee comprises of Three (3) members. All of them are Independent Directors. Mr. S.K. Jain is the Member Chairman and Mr. V.K. Malhotra and Mr. Iqbal Singh are the Members of the Committee. The Company Secretary is the Secretary of the Committee.
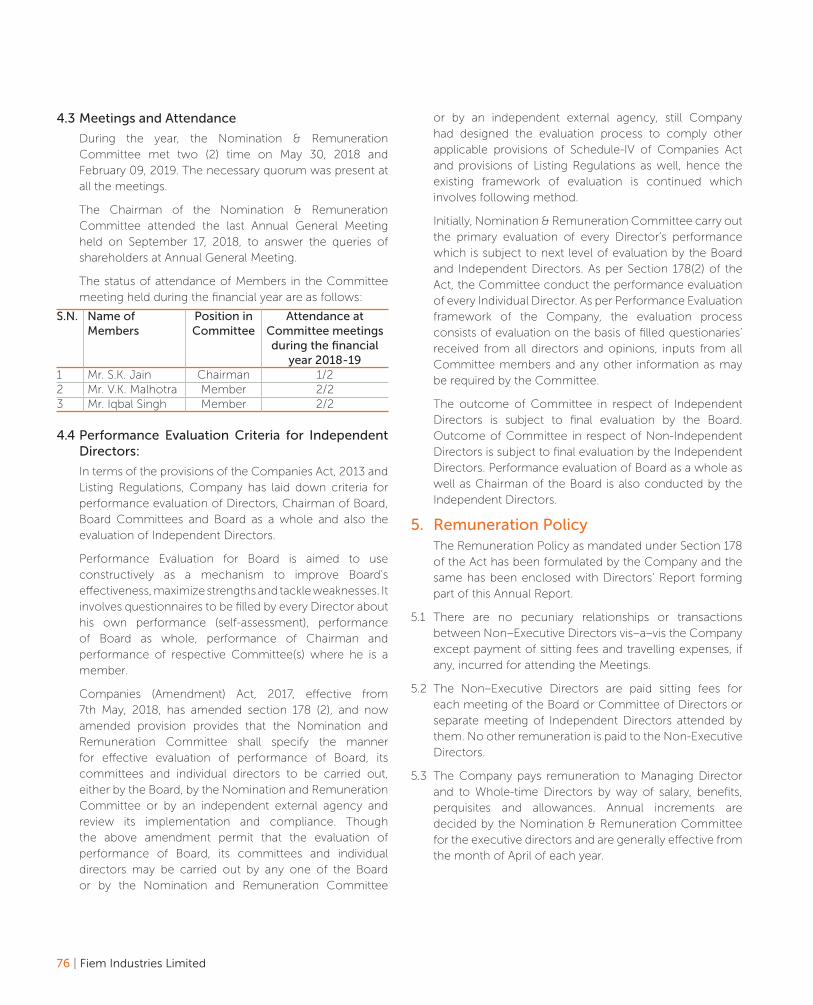
76 | Fiem Industries Limited
4.3 Meetings and Attendance
During the year, the Nomination & Remuneration Committee met two (2) time on May 30, 2018 and February 09, 2019. The necessary quorum was present at all the meetings.
The Chairman of the Nomination & Remuneration Committee attended the last Annual General Meeting held on September 17, 2018, to answer the queries of shareholders at Annual General Meeting.
The status of attendance of Members in the Committee meeting held during the financial year are as follows:
S.N. Name of Members
Position in Committee
Attendance at Committee meetings during the financial
year 2018-191 Mr. S.K. Jain Chairman 1/22 Mr. V.K. Malhotra Member 2/23 Mr. Iqbal Singh Member 2/2
4.4 Performance Evaluation Criteria for Independent Directors:
In terms of the provisions of the Companies Act, 2013 and Listing Regulations, Company has laid down criteria for performance evaluation of Directors, Chairman of Board, Board Committees and Board as a whole and also the evaluation of Independent Directors.
Performance Evaluation for Board is aimed to use constructively as a mechanism to improve Board’s effectiveness, maximize strengths and tackle weaknesses. It involves questionnaires to be filled by every Director about his own performance (self-assessment), performance of Board as whole, performance of Chairman and performance of respective Committee(s) where he is a member.
Companies (Amendment) Act, 2017, effective from 7th May, 2018, has amended section 178 (2), and now amended provision provides that the Nomination and Remuneration Committee shall specify the manner for effective evaluation of performance of Board, its committees and individual directors to be carried out, either by the Board, by the Nomination and Remuneration Committee or by an independent external agency and review its implementation and compliance. Though the above amendment permit that the evaluation of performance of Board, its committees and individual directors may be carried out by any one of the Board or by the Nomination and Remuneration Committee
or by an independent external agency, still Company had designed the evaluation process to comply other applicable provisions of Schedule-IV of Companies Act and provisions of Listing Regulations as well, hence the existing framework of evaluation is continued which involves following method.
Initially, Nomination & Remuneration Committee carry out the primary evaluation of every Director’s performance which is subject to next level of evaluation by the Board and Independent Directors. As per Section 178(2) of the Act, the Committee conduct the performance evaluation of every Individual Director. As per Performance Evaluation framework of the Company, the evaluation process consists of evaluation on the basis of filled questionaries’ received from all directors and opinions, inputs from all Committee members and any other information as may be required by the Committee.
The outcome of Committee in respect of Independent Directors is subject to final evaluation by the Board. Outcome of Committee in respect of Non-Independent Directors is subject to final evaluation by the Independent Directors. Performance evaluation of Board as a whole as well as Chairman of the Board is also conducted by the Independent Directors.
5. Remuneration PolicyThe Remuneration Policy as mandated under Section 178 of the Act has been formulated by the Company and the same has been enclosed with Directors’ Report forming part of this Annual Report.
5.1 There are no pecuniary relationships or transactions between Non–Executive Directors vis–a–vis the Company except payment of sitting fees and travelling expenses, if any, incurred for attending the Meetings.
5.2 The Non–Executive Directors are paid sitting fees for each meeting of the Board or Committee of Directors or separate meeting of Independent Directors attended by them. No other remuneration is paid to the Non-Executive Directors.
5.3 The Company pays remuneration to Managing Director and to Whole-time Directors by way of salary, benefits, perquisites and allowances. Annual increments are decided by the Nomination & Remuneration Committee for the executive directors and are generally effective from the month of April of each year.

Annual Report 2018-19 | 77
Details of Remuneration to all Directors
(a) Remuneration of Chairman & Managing Director and Whole–time Directors:(Rs. in lacs)
Sr. No.
Particulars of Remuneration Name of CMD / WTDMr. J. K.
JainMrs.
Seema Jain
Mr. J.S.S. Rao
Mr. K. R. Yadav
Ms. Aanchal
Jain
Mr. Rahul Jain
Total Amount
(CMD) (WTD) (WTD) (WTD) (WTD) (WTD)1 Gross Salary
a. Salary as per provisions contained in section 17(1) of the Income Tax Act, 1961
123.00 60.00 102.00 96.00 48.00 60.00 489.00
b. Value of perquisites u/s 17(2) of Income tax Act, 1961
1.80 0.00 0.00 0.00 0.00 0.00 1.80
c. Profit in lieu of Salary u/s 17(3) of Income Tax Act, 1961
0.00 0.00 0.00 0.00 0.00 0.00 0.00
2 Commission 0.00 0.00 0.00 0.00 0.00 0.00 0.00• As % of profit 0.00 0.00 0.00 0.00 0.00 0.00 0.00• Other, specify 0.00 0.00 0.00 0.00 0.00 0.00 0.00
3 Others (Company Contribution towards PF, Medical Reimbursement)
0.00 0.00 0.00 1.45 0.00 0.00 1.45
Total (1+2+3) 124.80 60.00 102.00 97.45 48.00 60.00 492.25
(b) Remuneration to other Directors (all Non–Executive Directors are Independent Directors):
(Rs. in lacs)Sr. No.
Particulars of Remuneration Independent Director
Name of DirectorsMr. Iqbal
SinghMr.
Vinod K. Malhotra
Mr. Subodh Kumar
Jain
Mr. Mohan Bir Sahni
Mr. A.K. Sharma
Mr. Jawahar Thakur
Total Amount
1 Independent DirectorsFee for attending Board/ Committee meetings 4.30 4.80 3.60 2.50 2.50 3.50 21.20Stock Option 0.00 0.00 0.00 0.00 0.00 0.00 0.00Sweat Equity 0.00 0.00 0.00 0.00 0.00 0.00 0.00Commission 0.00 0.00 0.00 0.00 0.00 0.00 0.00• As % of profit 0.00 0.00 0.00 0.00 0.00 0.00 0.00• Other, specify 0.00 0.00 0.00 0.00 0.00 0.00 0.00Others 0.00 0.00 0.00 0.00 0.00 0.00 0.00Total (1) 4.30 4.80 3.60 2.50 2.50 3.50 21.20
Notes:
a) The Company does not have any Stock Option Scheme or performance–linked incentives for the Directors.
b) The Nomination & Remuneration Committee considers and recommends the remuneration on appointment/re–appointment of Directors or
any change in remuneration during the currency of tenure as per Remuneration Policy of the Company. The appointment and remuneration
of all the Whole–time Directors and Managing Director are approved at the Board Meeting subject to approval of Members in the General
Meeting and Central Government, wherever required. There are no provisions for notice period, service contract and severance fees for the
Directors.
c) Mr. Kashi Ram Yadav was elevated to the Board w.e.f. October 25, 2008. Prior to that he was working with the Company as regular employee
of the Company. The above remuneration of Rs. 97.45 lacs for Financial Year 2018-19 includes Rs 13,824 as Bonus and Rs 1,31,040 as
employer’s contribution towards Provident Fund. Except Mr. Kashi Ram Yadav, none of the other Directors are receiving these benefits.
d) The above remuneration of Whole-time Directors does not include provisions for leave encashment and gratuity as the same is provided on
actuarial basis for the Company as a whole. The amount pertaining to directors is not separately ascertainable and therefore not included
above.
e) The Company did not pay any amount to Directors by way of Commission as a percentage of profits.
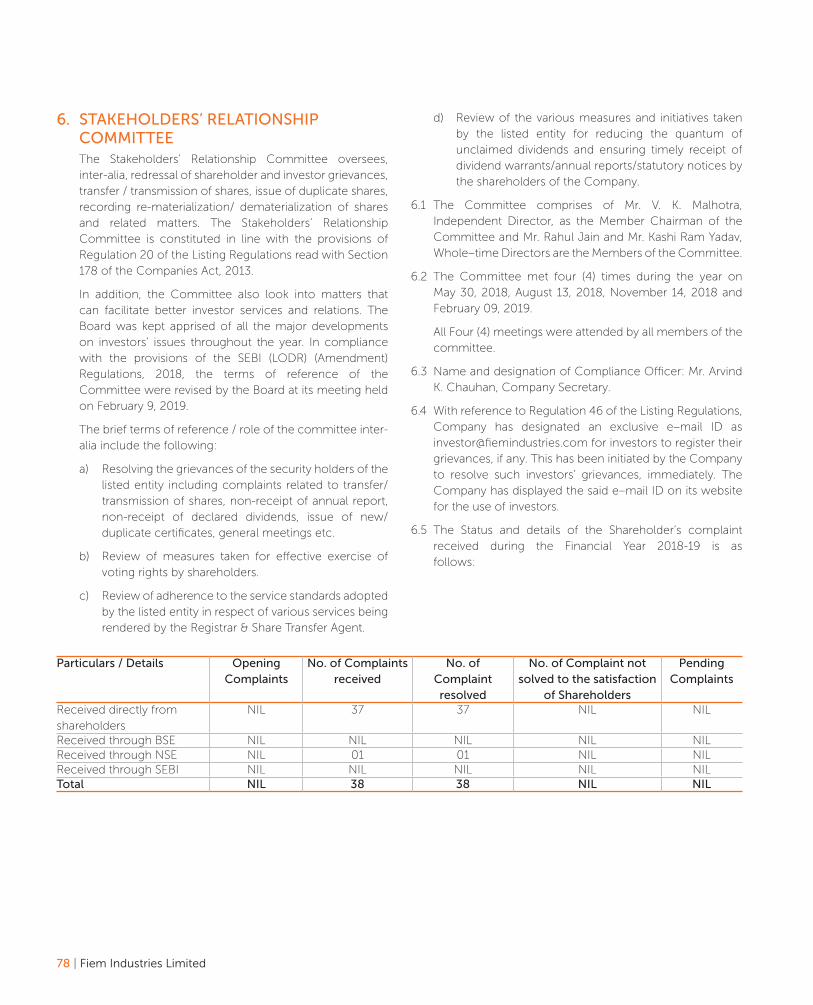
78 | Fiem Industries Limited
6. STAKEHOLDERS’ RELATIONSHIP COMMITTEEThe Stakeholders’ Relationship Committee oversees, inter-alia, redressal of shareholder and investor grievances, transfer / transmission of shares, issue of duplicate shares, recording re-materialization/ dematerialization of shares and related matters. The Stakeholders’ Relationship Committee is constituted in line with the provisions of Regulation 20 of the Listing Regulations read with Section 178 of the Companies Act, 2013.
In addition, the Committee also look into matters that can facilitate better investor services and relations. The Board was kept apprised of all the major developments on investors’ issues throughout the year. In compliance with the provisions of the SEBI (LODR) (Amendment) Regulations, 2018, the terms of reference of the Committee were revised by the Board at its meeting held on February 9, 2019.
The brief terms of reference / role of the committee inter-alia include the following:
a) Resolving the grievances of the security holders of the listed entity including complaints related to transfer/transmission of shares, non-receipt of annual report, non-receipt of declared dividends, issue of new/duplicate certificates, general meetings etc.
b) Review of measures taken for effective exercise of voting rights by shareholders.
c) Review of adherence to the service standards adopted by the listed entity in respect of various services being rendered by the Registrar & Share Transfer Agent.
d) Review of the various measures and initiatives taken by the listed entity for reducing the quantum of unclaimed dividends and ensuring timely receipt of dividend warrants/annual reports/statutory notices by the shareholders of the Company.
6.1 The Committee comprises of Mr. V. K. Malhotra, Independent Director, as the Member Chairman of the Committee and Mr. Rahul Jain and Mr. Kashi Ram Yadav, Whole–time Directors are the Members of the Committee.
6.2 The Committee met four (4) times during the year on May 30, 2018, August 13, 2018, November 14, 2018 and February 09, 2019.
All Four (4) meetings were attended by all members of the committee.
6.3 Name and designation of Compliance Officer: Mr. Arvind K. Chauhan, Company Secretary.
6.4 With reference to Regulation 46 of the Listing Regulations, Company has designated an exclusive e–mail ID as [email protected] for investors to register their grievances, if any. This has been initiated by the Company to resolve such investors’ grievances, immediately. The Company has displayed the said e–mail ID on its website for the use of investors.
6.5 The Status and details of the Shareholder’s complaint received during the Financial Year 2018-19 is as follows:
Particulars / Details Opening Complaints
No. of Complaints received
No. of Complaint resolved
No. of Complaint not solved to the satisfaction
of Shareholders
Pending Complaints
Received directly from shareholders
NIL 37 37 NIL NIL
Received through BSE NIL NIL NIL NIL NILReceived through NSE NIL 01 01 NIL NILReceived through SEBI NIL NIL NIL NIL NILTotal NIL 38 38 NIL NIL
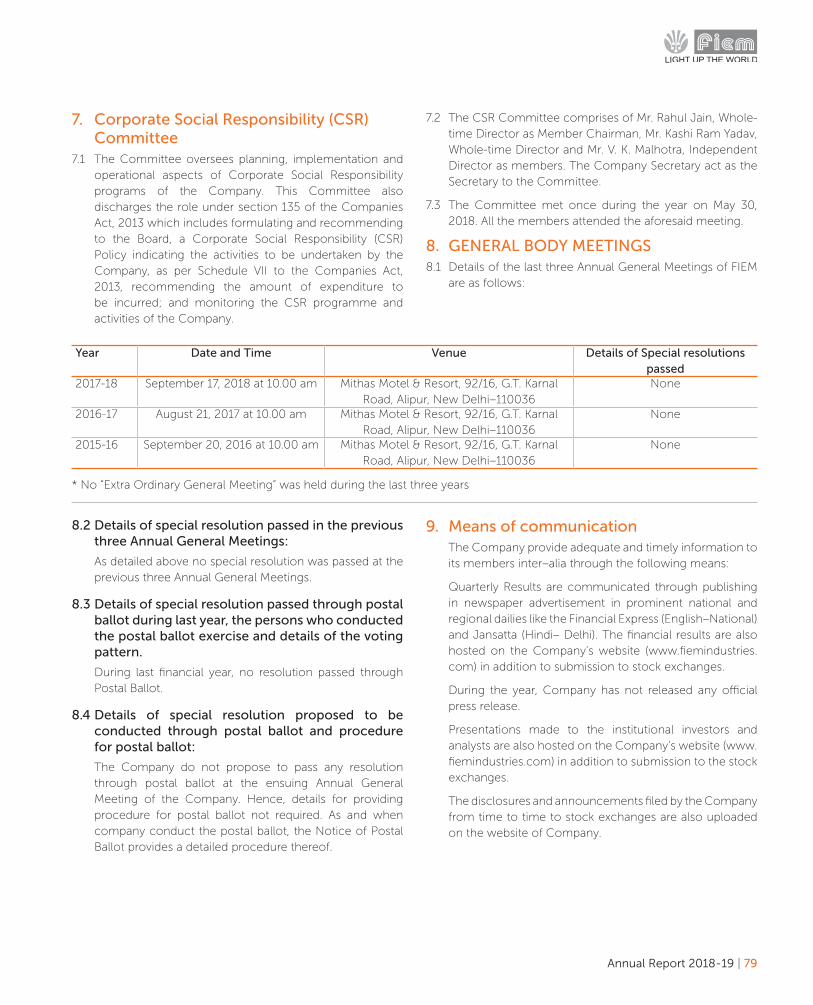
Annual Report 2018-19 | 79
7. Corporate Social Responsibility (CSR) Committee
7.1 The Committee oversees planning, implementation and operational aspects of Corporate Social Responsibility programs of the Company. This Committee also discharges the role under section 135 of the Companies Act, 2013 which includes formulating and recommending to the Board, a Corporate Social Responsibility (CSR) Policy indicating the activities to be undertaken by the Company, as per Schedule VII to the Companies Act, 2013, recommending the amount of expenditure to be incurred; and monitoring the CSR programme and activities of the Company.
7.2 The CSR Committee comprises of Mr. Rahul Jain, Whole-time Director as Member Chairman, Mr. Kashi Ram Yadav, Whole-time Director and Mr. V. K. Malhotra, Independent Director as members. The Company Secretary act as the Secretary to the Committee.
7.3 The Committee met once during the year on May 30, 2018. All the members attended the aforesaid meeting.
8. GENERAL BODY MEETINGS8.1 Details of the last three Annual General Meetings of FIEM
are as follows:
Year Date and Time Venue Details of Special resolutions passed
2017-18 September 17, 2018 at 10.00 am Mithas Motel & Resort, 92/16, G.T. Karnal Road, Alipur, New Delhi–110036
None
2016-17 August 21, 2017 at 10.00 am Mithas Motel & Resort, 92/16, G.T. Karnal Road, Alipur, New Delhi–110036
None
2015-16 September 20, 2016 at 10.00 am Mithas Motel & Resort, 92/16, G.T. Karnal Road, Alipur, New Delhi–110036
None
* No “Extra Ordinary General Meeting” was held during the last three years
8.2 Details of special resolution passed in the previous three Annual General Meetings:
As detailed above no special resolution was passed at the previous three Annual General Meetings.
8.3 Details of special resolution passed through postal ballot during last year, the persons who conducted the postal ballot exercise and details of the voting pattern.
During last financial year, no resolution passed through Postal Ballot.
8.4 Details of special resolution proposed to be conducted through postal ballot and procedure for postal ballot:
The Company do not propose to pass any resolution through postal ballot at the ensuing Annual General Meeting of the Company. Hence, details for providing procedure for postal ballot not required. As and when company conduct the postal ballot, the Notice of Postal Ballot provides a detailed procedure thereof.
9. Means of communicationThe Company provide adequate and timely information to its members inter–alia through the following means:
Quarterly Results are communicated through publishing in newspaper advertisement in prominent national and regional dailies like the Financial Express (English–National) and Jansatta (Hindi– Delhi). The financial results are also hosted on the Company’s website (www.fiemindustries.com) in addition to submission to stock exchanges.
During the year, Company has not released any official press release.
Presentations made to the institutional investors and analysts are also hosted on the Company’s website (www.fiemindustries.com) in addition to submission to the stock exchanges.
The disclosures and announcements filed by the Company from time to time to stock exchanges are also uploaded on the website of Company.

80 | Fiem Industries Limited
10. General Shareholder Information
a) Annual General Meeting for financial year 2018-19
Saturday, September 21, 2019Time: 10.00 AMVenue: Mithas Motel & Resort, 92/16, G.T. Karnal Road, Alipur, New Delhi– 110036
b) Financial Year April to Marchc) Date of Book Closure September 15, 2019 to September 21, 2019 (Both days inclusive)d) Dividend Payment Date The dividend, if declared, shall be paid/ credited on or before October 15, 2019.e) Listing on Stock B S E Ltd.
National Stock Exchange of India Ltd.f) Stock Codes The Stock Codes are 532768 (BSE) and FIEMIND (NSE)
Listing Fees as applicable for financial year 2018-19 have been paid.g) Market Price Data High, Low in comparison to Sensex during each month in the financial year 2018-19 on NSE
and BSE
Month NSE BSE SensexHigh Price Low Price High Price Low Price Closing
April 2018 953.10 885.00 969.00 881.10 35160.36May 2018 938.00 824.65 936.95 830.00 35322.38June 2018 890.00 777.70 899.00 780.00 35423.48July 2018 807.45 742.00 810.00 737.00 37606.58August 2018 807.90 729.00 796.00 730.00 38645.07September 2018 740.95 560.00 748.25 569.00 36227.14October 2018 661.45 476.00 660.10 471.10 34442.05November 2018 633.80 570.00 630.35 562.00 36194.3December 2018 593.00 483.00 592.90 484.20 36068.33January 2019 530.25 474.55 539.45 478.00 36256.69February 2019 492.00 422.40 500.00 419.00 35867.44March 2019 560.00 433.10 561.45 434.30 38672.91
h) Performance of the share price of the Company in comparison to the BSE Sensex:
44000
1200
800
400
1000
600
200
0
36000
40000
Sen
sex
FIE
M B
SE H
IGH
32000
42000
34000
38000
30000Apr-18
Sensex FIEM BSE High
May-18 Jul-18 Sep-18 Nov-18 Jan-19Jun-18 Aug-18 Oct-18 Dec-18 Feb-19 Mar-19

Annual Report 2018-19 | 81
i) The securities of the Company are never suspended for trading.
j) Share Transfer Agent M/s. Link Intime India Pvt. Ltd.
Noble Heights, 1st Floor, Plot NH 2,C-1 Block LSC, Near Savitri Market,Janakpuri, New Delhi-110058Ph: 011–41410592/93/94Fax No: 011–41410591
k) Share Transfer System
Application for Transfer of Shares held in Physical form is received at the office of RTA. All valid transfers are processed within 15 days from the date of lodgment. The Company Secretary, under the authority of the Board approves transfers which are noted at subsequent Stakeholders’ Relationship Committee and Board Meetings.
l) Distribution of shareholding as on March 31, 2019:
Category code
Category of shareholder Number of share holders
Total number of shares
As a % of Total Capital
(I) (II) (III) (IV) (V)(A) Shareholding of Promoter Group 6 8464086 64.3176(B) Public Shareholding 1 Institutions
(a) Mutual Funds 1 484919 3.6848(b) Foreign Portfolio Investors 11 1501424 11.4091(c) Financial Institutions / Banks 2 5859 0.0445(d) Alternate Investment Fund 0 0 0.0000Insurance Companies 1 493010 3.7463Central/State Government(s) 0 0 0.0000
2 Non–Institutions (a) Individuals 13931 1459461 11.0903(b) NBFCs registered with RBI 3 713 0.0054(c) Any Other (specify)– i. Hindu Undivided Family 436 83799 0.6368ii. Foreign Corporate Bodies 1 104051 0.7907iii. Non-Resident Indians 492 255430 1.9410iv. Clearing Members 80 37113 0.2820v. Bodies Corporate 156 269865 2.0507vi. IEPF 1 100 0.0008Total Public Shareholding TOTAL (A)+(B) 15121 13159830 100

82 | Fiem Industries Limited
m) Distribution by Size:
DISTRIBUTION OF SHAREHOLDING BASED ON SHARES HELDReport Type : All(NSDL+CDSL+PHYSICAL)
SR. NO.
SHARES RANGE NUMBER OF SHAREHOLDERS
% OF TOTAL SHAREHOLDERS
TOTAL SHARES FOR THE RANGE
% OF ISSUED CAPITAL
1 1 to 500 15118 96.7242 938213 7.12942 501 to 1000 275 1.7594 210146 1.59693 1001 to 2000 120 0.7678 177716 1.35044 2001 to 3000 34 0.2175 85359 0.64865 3001 to 4000 14 0.0896 49489 0.37616 4001 to 5000 11 0.0704 49005 0.37247 5001 to 10000 26 0.1663 173109 1.31548 10001 and above 32 0.2047 11476793 87.2108Total (Not consolidated on PAN basis) 15630 100 13159830 100
n) Dematerialization of shares and Liquidity status as on March 31, 2019
Sr. No. Demat / Physical No. of Shares Free to Trade / lock-in %age of Total shares1 NSDL 3955601 Free to trade 30.062 CDSL 9099722 Free to trade 69.153 Physical 104507 Free to trade 0.79
Total 13159830 100
o) Outstanding GDRs/ADRs/ Warrants or any Convertible Instruments, conversion date and likely impact on equity:
The Company has not issued any GDRs/ADRs/ Warrants or any Convertible Instruments till date.
p) Address for Correspondence:
Registered Office Address:D-34, DSIDC Packaging Complex, Kirti Nagar, New Delhi - 110015, IndiaTel: +91-11-25927820, 25927919Fax: +91-11-25927740Email: [email protected]: www.fiemindustries.comCIN: L36999DL1989PLC034928
q) Address of Compliance Officer & Corporate Office:
Company SecretaryPlot No. 1915, Rai Industrial Estate,Phase-V, Distt. Sonepat, Haryana, 131029, IndiaTel: +91-130-2367905 to 10Fax: +91-130-2367903Email: [email protected]: www.fiemindustries.com
r) The Company has not obtained any credit rating for any debt instrument or fixed deposit scheme.
11. OTHER DISCLOSURES:11.1 Disclosure on materially significant related party
transactions that may have potential conflict with the interest of the Company at large:
There were no material significant related party transactions during the financial year 2018-19 which may have conflict with the interest of the Company. Suitable disclosures have been made in notes to financial statements.
11.2 Details of non–compliance by the Company, penalties, and strictures imposed on the Company by Stock Exchange or SEBI or any statutory authority, on any matter related to capital markets, during the last three years.
There was no instance of non–compliance by the Company for any matter related to capital markets during the last three years.
11.3 Whistle Blower Policy and affirmation that no personnel have been denied access to the Audit Committee.
The Company has implemented the Whistle Blower Policy and established the necessary vigil mechanism as defined under Regulation 22 of the Listing Regulations pursuant to which Whistle Blowers can raise concerns relating to Reportable Matters (defined in the Policy). This includes the mechanism adopted by the Company to encourage the Whistle Blower to report genuine concerns or grievances and provides for adequate safeguard against

Annual Report 2018-19 | 83
victimization and also provides for access to the Chairman of the Audit Committee.
It is affirmed that no person has been denied access to Audit Committee.
The details of Whistle Blower Policy are available on the website of the Company (www.fiemindustries.com).
11.4 Details of compliance with mandatory requirements and adoption of the non–mandatory requirements.
The Company has complied with all applicable mandatory requirements prescribed under the Listing Regulations.
11.5 Web link where policy on for determining ‘material’ subsidiary & dealing with related party transactions is disclosed:
The Web link is: http://www.fiemindustries.com/Subsi%20&%20RPT%20Policy%20-%20LODR_web.pdf
11.6 Disclosure of commodity price risk, foreign exchange risk and hedging activities, commodity hedging activities:
The major turnover of the Company come from Auto components supply to Original Equipment Manufacturers (OEMs) in India for which Company has suitable arrangements with OEMs for commodity price variations. For other sales, Company suitably adjust the prices as per commodity prices movement and most of the payments are advance or spot in case of imported material. Company doesn’t have much foreign exchange exposure in comparison to the size of its operations and turnover on account of imports and exports. Company takes external commercial borrowings, or foreign currency loans which are fully hedged against risk of foreign exchange rate movement.
The Company does not have any exposure hedged through commodity derivatives. Therefore, details in
prescribed format as per SEBI Circular No. SEBI/HO/CFD/CMD1/CIR/P/2018/0000000141 dated November 15, 2018 in compliance of Regulation 34(3) read with clause 9(n) of Part C of Schedule V of Listing Regulations, are not applicable.
11.7 Details of utilization of funds raised through preferential allotment or qualified institutions placement as specified under Regulation 32 (7A).
During the month of September, 2016, Company had raised Rs. 120 Crore through Qualified Institutions Placement (QIP) and that funds are being utilized since then in terms of Placement Document dated September 16, 2016. Out of gross proceeds of Rs. 11999.99 lacs, Rs. 10265.19 lacs were utilized up to 31.03.2018. During the financial year 2018-19, the Company utilized the balance amount of Rs. 1734.80 lacs, in terms of Placement Document dated September 16, 2016. There is no balance left unutilized at the end of financial year 2018-19.
11.8 Recommendation of Committee(s) of the Board.
The Board has accepted all the applicable mandatory recommendations of the Committee(s).
11.9 The details of total fees for all services paid by the listed entity (Company) and its subsidiaries, on a consolidated basis, to the statutory auditor and all entities in the network firm/network entity of which the statutory auditor is a part, is as under:
Company’s Auditors are M/s. V. Sachdeva & Associates, Chartered Accountants. He is a standalone firm and not a part of any network firm/network entity. Further, he has not taken any fee from any subsidiary of the Company. Details of total to for all services paid to Company’s Auditors by the listed entity / Company is provided in notes to the financial statements.
11.10 The disclosure in relation to Sexual Harassment of Women at Workplace (Prevention, Prohibition and Redressal) Act, 2013 are as under:
Sr. Particulars Nos.a) number of complaints filed during the financial year Nilb) number of complaints disposed of during the financial year Nilc) number of complaints pending as on end of the financial year NIl

84 | Fiem Industries Limited
12. The Company has complied with all requirements of corporate governance report of sub–para (2) to (10) of Schedule V read with Regulation 34(3) of the Listing Regulations.
13. The Company has duly adopted the following discretionary requirements as prescribed in Part E of Schedule II of the SEBI Listing Regulations:a. Unmodified opinion(s) in audit report: Company
endeavored to move towards a regime of financial statements with unmodified audit opinion.
b. Reporting of Internal Auditors: The Internal Auditor also reports to the Audit Committee while submitting internal audit report.
14. Company has adhered to all the mandatory requirements of Corporate Governance norms as prescribed by Regulations 17 to 27 and clause (b) to (i) of sub–regulation (2) of Regulation 46 of the Listing Regulations to the extent as applicable.
15. The members of the senior management have made disclosure to the Board relating to all material financial and other transactions, if any, stating that they did not have personal interest that could result in a conflict with the interest of the Company at large.
16. The Company has adopted the Indian Accounting Standards (Ind AS)
17. The Chairman & Managing Director and Chief Financial Officer of the Company have certified about financial statements, internal control and accounting policies etc. for Financial Year 2018-19 to the Board under Regulation 17(8) read with Part B of Schedule II of the Listing Regulations.
18. The Management Discussion & Analysis Report form part of Annual Report.
19. Code of Conduct
The Declaration/Confirmation from the Chairman & Managing Director regarding compliance with the Code by all the Directors and Senior Management Personnel for F.Y. 2018-19, forms part of this Report. The Code of Conduct is available on the website of the Company (www.fiemindustries.com).
20. Code of Conduct for Prevention of Insider Trading
Pursuant to SEBI (Prohibition of Insider Trading) Regulations, 2015, as amended, following Codes has been approved and adopted by the Company:
1. Code of Conduct to Regulate, Monitor and Report Trading by Insiders in compliance with the said Regulations.
2. Code of Practices and Procedures for Fair Disclosure of Unpublished Price Sensitive Information in compliance with the said Regulations.
21. Brief profile of the Directors retiring by rotation and eligible for re–appointment is attached to the notice convening Annual General Meeting.
22. Disclosure about unpaid dividend transferred to Investor Education and Protection Fund
Section 124 of the Companies Act, 2013 read with Investor Education and Protection Fund Authority (Accounting, Audit, Transfer and Refund) Rules, 2016 (‘the Rules’) mandates that companies transfer dividend that has remained unclaimed for a period of seven years from the unpaid dividend account to the Investor Education and Protection Fund (IEPF). Further, the Rules mandate the transfer of shares with respect to the dividend, which has not been paid or claimed for seven consecutive years or more to IEPF. Accordingly, the dividend for the year mentioned as follows will be transferred to IEPF on respective dates, if the dividend remains unclaimed for seven years, and the corresponding shares will also be transferred to IEPF if dividend is unclaimed for seven consecutive years:
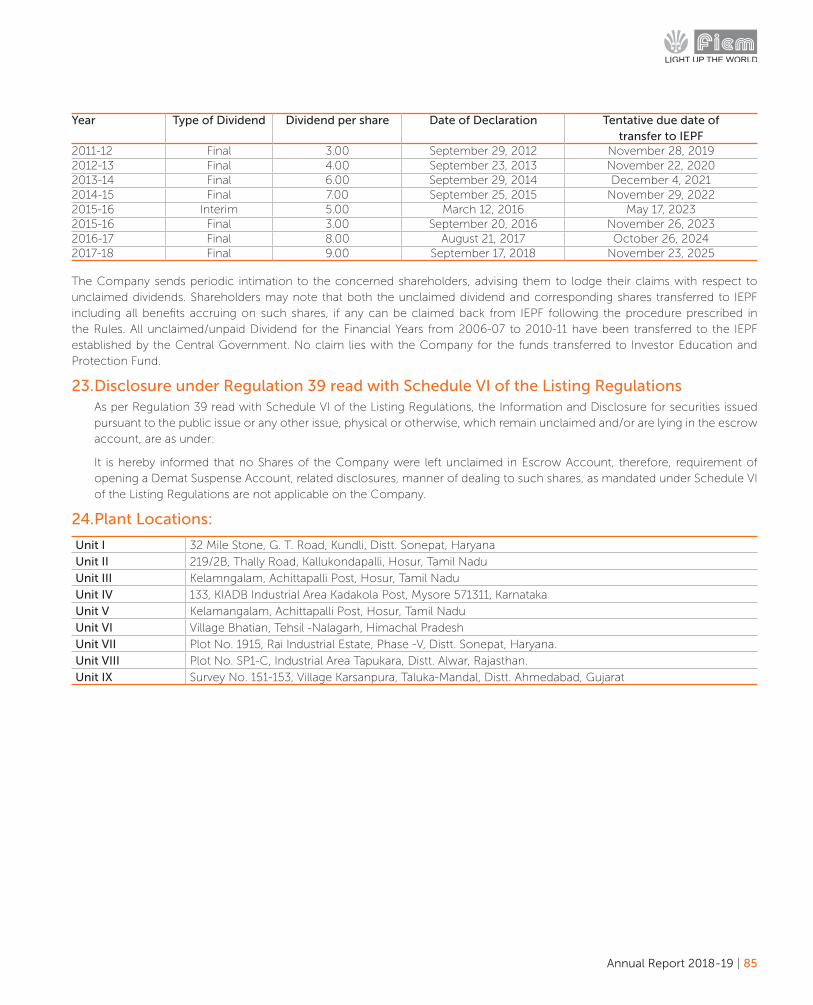
Annual Report 2018-19 | 85
Year Type of Dividend Dividend per share Date of Declaration Tentative due date of transfer to IEPF
2011-12 Final 3.00 September 29, 2012 November 28, 20192012-13 Final 4.00 September 23, 2013 November 22, 20202013-14 Final 6.00 September 29, 2014 December 4, 20212014-15 Final 7.00 September 25, 2015 November 29, 20222015-16 Interim 5.00 March 12, 2016 May 17, 20232015-16 Final 3.00 September 20, 2016 November 26, 20232016-17 Final 8.00 August 21, 2017 October 26, 20242017-18 Final 9.00 September 17, 2018 November 23, 2025
The Company sends periodic intimation to the concerned shareholders, advising them to lodge their claims with respect to unclaimed dividends. Shareholders may note that both the unclaimed dividend and corresponding shares transferred to IEPF including all benefits accruing on such shares, if any can be claimed back from IEPF following the procedure prescribed in the Rules. All unclaimed/unpaid Dividend for the Financial Years from 2006-07 to 2010-11 have been transferred to the IEPF established by the Central Government. No claim lies with the Company for the funds transferred to Investor Education and Protection Fund.
23. Disclosure under Regulation 39 read with Schedule VI of the Listing Regulations As per Regulation 39 read with Schedule VI of the Listing Regulations, the Information and Disclosure for securities issued
pursuant to the public issue or any other issue, physical or otherwise, which remain unclaimed and/or are lying in the escrow account, are as under:
It is hereby informed that no Shares of the Company were left unclaimed in Escrow Account, therefore, requirement of opening a Demat Suspense Account, related disclosures, manner of dealing to such shares, as mandated under Schedule VI of the Listing Regulations are not applicable on the Company.
24. Plant Locations:
Unit I 32 Mile Stone, G. T. Road, Kundli, Distt. Sonepat, Haryana
Unit II 219/2B, Thally Road, Kallukondapalli, Hosur, Tamil Nadu
Unit III Kelamngalam, Achittapalli Post, Hosur, Tamil Nadu
Unit IV 133, KIADB Industrial Area Kadakola Post, Mysore 571311, Karnataka
Unit V Kelamangalam, Achittapalli Post, Hosur, Tamil Nadu
Unit VI Village Bhatian, Tehsil -Nalagarh, Himachal Pradesh
Unit VII Plot No. 1915, Rai Industrial Estate, Phase -V, Distt. Sonepat, Haryana.
Unit VIII Plot No. SP1-C, Industrial Area Tapukara, Distt. Alwar, Rajasthan.
Unit IX Survey No. 151-153, Village Karsanpura, Taluka-Mandal, Distt. Ahmedabad, Gujarat
86 | Fiem Industries Limited
Certificate of Compliance of Conditions of Corporate Governance[Pursuant to Regulation 34(3) read with Para E of Schedule V of the
SEBI (Listing Obligations and Disclosure Requirements) Regulations, 2015]
To,The MembersFiem Industries Limited(CIN: L36999DL1989PLC034928)D-34 DSIDC Packaging Complex,Kirti Nagar, New Delhi-110015
We have examined the compliance of conditions of Corporate Governance by Fiem Industries Limited (‘the Company’) for the year ended on March 31, 2019, as prescribed under Regulations 17 to 27, clauses (b) to (i) of sub-regulation (2) of Regulation 46 and Paras C, D and E of Schedule V of Securities and Exchange Board of India (Listing Obligations and Disclosure Requirements) Regulations, 2015 (‘Listing Regulations’), as amended.
The compliance of conditions of Corporate Governance is the responsibility of the management. Our examination was limited to procedures and implementation thereof, adopted by the Company for ensuring the compliance of the conditions of Corporate Governance. It is neither an audit nor an expression of opinion on the financial statements of the Company.
In our opinion and to the best of our information and according to the explanations given to us, we certify that the Company has complied with the conditions of Corporate Governance as stipulated in the aforesaid provisions of the Listing Regulations.
We further state that such compliance is neither an assurance as to the future viability of the Company, nor the efficiency or effectiveness with which the management has conducted the affairs of the Company.
For Ranjana Gupta & Associates Company Secretaries
Sd/- Ranjana Gupta Prop.Date : 14th May, 2019 FCS No.: 8613Place : New Delhi CP No.: 9920
Annual Report 2018-19 | 87
Certificate of Non-Disqualification of Directors[Pursuant to Regulation 34(3) and Schedule V Para C clause (10)(i) of the
SEBI (Listing Obligations and Disclosure Requirements) Regulations, 2015]
To,The MembersFiem Industries Limited(CIN: L36999DL1989PLC034928)D-34 DSIDC Packaging Complex,Kirti Nagar, New Delhi-110015
We have examined the relevant registers, records, forms and returns of Fiem Industries Limited (“the Company”) and declarations provided by the Directors to the Company, as produced before us for the purpose of issuing this Certificate, in accordance with Regulation 34(3) read with Schedule V Para - C Sub clause 10(i) of the Securities Exchange Board of India (Listing Obligations and Disclosure Requirements) Regulations, 2015.
On the basis of such examination and verification of Director Identification Number (DIN) status at online portal of Ministry of Corporate Affairs and to the best of information available to us, we certify that none of the directors have been debarred or disqualified as on March 31, 2019 from being appointed or continuing as director of the Company by the Securities and Exchange Board of India, Ministry of Corporate Affairs or any other statutory authority.
We further state that this certificate is neither an assurance as to the future viability of the Company, nor the efficiency or effectiveness with which the management has conducted the affairs of the Company.
For Ranjana Gupta & Associates Company Secretaries
Sd/- Ranjana Gupta Prop.Date : 14th May, 2019 FCS No.: 8613Place : New Delhi CP No.: 9920
88 | Fiem Industries Limited
Compliance with Code of Conduct(Pursuant to Regulation 26(3) read with Part D of Schedule V of the Listing Regulations)
I, J.K. Jain, Chairman & Managing Director of the Company hereby certify that as required under Regulation 26(3) read with Part D of Schedule V of the SEBI (Listing Obligations and Disclosure Requirements) Regulations, 2015 (Listing Regulations), all the Directors and the Senior Management Personnel of the Company have affirmed compliance of the Code of Conduct of the Company for the financial year ended March 31, 2019. Sd/-Place : Rai, Sonepat (HR) J.K. JainDate : May 14, 2019 Chairman & Managing Director (DIN: 00013356)
Certification by Managing Director and CFO for Financial Year 2018-19
(Pursuant to Regulation 17(8) read with Part B of Schedule II of the Listing Regulations)
ToThe Board of DirectorsFiem Industries Limited
We, the undersigned, in our respective capacities as Managing Director and Chief Financial Officer of Fiem Industries Limited (“the Company”) to the best of our knowledge and belief certify that:
A. We have reviewed Financial Statements and the Cash Flow Statement for the year ended March 31, 2019 and that to the best of our knowledge and belief:
i. these Statements do not contain any materially untrue statement or omit any material fact or contain statements that might be misleading;
ii. these Statements together present a true and fair view of the Company’s affairs and are in compliance with Indian Accounting Standards (Ind AS), applicable laws and regulations.
B. There are, to the best of our knowledge and belief, no transactions entered into by the Company during the financial year which are fraudulent, illegal or violative of the Company’s Code of Conduct.
C. We accept responsibility for establishing and maintaining internal controls for financial reporting and that we have evaluated the effectiveness of internal control systems of the Company pertaining to financial reporting and we have disclosed to the Auditors and the Audit Committee, deficiencies in the design or operation of such internal controls, if any, of which we are aware and the steps we have taken or propose to take to rectify these deficiencies.
D. We have indicated to the Auditors and the Audit Committee
i. significant changes in internal control over financial reporting during the year;
ii. significant changes in accounting policies during the financial year and that the same have been disclosed in the Notes to the Financial Statements; and
iii. instances of significant fraud, if any, of which we have become aware and the involvement therein, if any, of the management or an employee having a significant role in the Company’s internal control system over financial reporting.
Sd/- Sd/-Place : Rai, Sonepat (HR) O.P. Gupta J.K. JainDate : May 14, 2019 Chief Financial Officer Chairman & Managing Director (DIN: 00013356)

Annual Report 2018-19 | 89
To The Members of
Fiem Industries Limited
Report on the Audit of the Standalone Financial Statements
Opinion
We have audited the accompanying standalone financial
statements of Fiem Industries Limited (“the Company”),
which comprise the balance sheet as at 31st March 2019, the
Statement of Profit and Loss (including Other Comprehensive
Income), statement of changes in equity and statement of
cash flows for the year then ended, and notes to the financial
statements, including a summary of significant accounting
policies and other explanatory information. (hereinafter
referred to as “the standalone financial statements”)
In our opinion and to the best of /our information and
according to the explanations given to us, the aforesaid
standalone financial statements give the information required
by the Companies Act, 2013 (“the Act”) in the manner
so required and give a true and fair view in conformity with
the Indian Accounting Standards prescribed under section
133 of the Act read with the Companies (Indian Accounting
Standards) Rules, 2015, as amended, (“Ind AS”) and other
accounting principles generally accepted in India, of the state
of affairs of the Company as at March 31, 2019, the profit and
total comprehensive income, changes in equity and its cash
flows for the year ended on that date.
Basis for Opinion
We conducted our audit in accordance with the Standards on
Auditing (SAs) specified under section 143(10) of the Companies
Act, 2013. Our responsibilities under those Standards are
further described in the Auditor’s Responsibilities for the Audit
of the Financial Statements section of our report. We are
independent of the Company in accordance with the Code
of Ethics issued by the Institute of Chartered Accountants of
India together with the ethical requirements that are relevant
to our audit of the financial statements under the provisions of
the Companies Act, 2013 and the Rules thereunder, and we
have fulfilled our other ethical responsibilities in accordance
with these requirements and the ICAI’s Code of Ethics. We
believe that the audit evidence we have obtained is sufficient
and appropriate to provide a basis for our opinion.
Key Audit Matters
Key audit matters are those matters that, in our professional
judgment, were of most significance in our audit of the financial
statements of the current period. These matters were addressed
in the context of our audit of the financial statements as a whole,
and in forming our opinion thereon, and we do not provide a
separate opinion on these matters. We have determined the
matters described below to be the key audit maters to be
communicated in our report.
Independent Auditor’s Report
S. No. Key Audit Matter Auditor’s response
1 Accuracy of recognition, measurement,
presentation and disclosures of revenues
and other related balances in view of
adoption of Ind AS 115 “Revenue from
Contracts with Customers” (new revenue
accounting standard)
Principal Audit Procedures
We assessed the Company’s process to identify the impact of adoption of
the new revenue accounting standard.
Our audit approach consisted testing of the design and operating
effectiveness of the internal controls and substantive testing as follows
• Evaluated the design of internal controls relating to implementation of
the new revenue accounting standard.
• Selected a sample of continuing and new contracts, and tested the
operating effectiveness of the internal control, relating to identification
of the distinct performance obligations and determination of transaction
price.
In Our opinion, the application of Ind AS 115 does not have material impact
on the financial statement of the company.

90 | Fiem Industries Limited
Information Other than the Financial Statements and Auditor’s
Report thereon. (“Other information”)
The Company’s Board of Directors is responsible for the other
information. The other information comprises the information
included in the “the management report and chairman’s
statement report, but does not include the financial statements
and our auditor’s report thereon.
Our opinion on the financial statements does not cover the
other information and we do not express any form of assurance
conclusion thereon.
In connection with our audit of the financial statements, our
responsibility is to read the other information and, in doing so,
consider whether the other information is materially inconsistent
with the financial statements or our knowledge obtained in the
audit or otherwise appears to be materially misstated.
If, based on the work we have performed, we conclude that
there is a material misstatement of this other information, we
are required to report that fact. We have nothing to report in this
regard.
Management’s Responsibility for the Standalone Financial
Statements
The Company’s Board of Directors is responsible for the matters
stated in section 134(5) of the Companies Act, 2013 (“the Act”)
with respect to the preparation of these standalone financial
statements that give a true and fair view of the financial position,
financial performance, changes in equity and cash flows of the
Company in accordance with the accounting principles generally
accepted in India, including the accounting Standards specified
under section 133 of the Act. This responsibility also includes
maintenance of adequate accounting records in accordance
with the provisions of the Act for safeguarding of the assets of
the Company and for preventing and detecting frauds and other
irregularities; selection and application of appropriate accounting
policies; making judgments and estimates that are reasonable
and prudent; and design, implementation and maintenance
of adequate internal financial controls, that were operating
effectively for ensuring the accuracy and completeness of the
accounting records, relevant to the preparation and presentation
of the financial statement that give a true and fair view and are
free from material misstatement, whether due to fraud or error.
In preparing the financial statements, management is
responsible for assessing the Company’s ability to continue as
a going concern, disclosing, as applicable, matters related to
going concern and using the going concern basis of accounting
unless management either intends to liquidate the Company or
to cease operations, or has no realistic alternative but to do so.
The Board of Directors are also responsible for overseeing the
Company’s financial reporting process.
Auditor’s Responsibilities for the Audit of the Financial
Statements
Our objectives are to obtain reasonable assurance about
whether the financial statements as a whole are free from
material misstatement, whether due to fraud or error, and to
issue an auditor’s report that includes our opinion. Reasonable
assurance is a high level of assurance, but is not a guarantee that
an audit conducted in accordance with SAs will always detect
a material misstatement when it exists. Misstatements can arise
from fraud or error and are considered material if, individually
or in the aggregate, they could reasonably be expected to
influence the economic decisions of users taken on the basis of
these financial statements.
As part of an audit in accordance with SAs, we exercise
professional judgment and maintain professional skepticism
throughout the audit. We also:
• Identify and assess the risks of material misstatement of the
standalone financial statements, whether due to fraud or
error, design and perform audit procedures responsive to
those risks, and obtain audit evidence that is sufficient and
S. No. Key Audit Matter Auditor’s response
2 Evaluation of uncertain tax positions
The Company has uncertain tax positions
matters under dispute which involves
significant judgment to determine the
possible outcome of these disputes.
Refer Notes 35 to the Standalone Financial
Statements
Principal Audit Procedures
Obtained details of completed tax assessments upto the year ended March
31, 2019 from management. We considered, the management’s underlying
assumptions in estimating the tax provision and the possible outcome
of the disputes. We also considered legal precedence and other rulings
in evaluating management’s position on these uncertain tax positions.
Additionally, we considered the effect of new information in respect of
uncertain tax positions as at April 1, 2018 to evaluate whether any change
was required to management’s position on these uncertainties
Annual Report 2018-19 | 91
appropriate to provide a basis for our opinion. The risk of
not detecting a material misstatement resulting from fraud is
higher than for one resulting from error, as fraud may involve
collusion, forgery, intentional omissions, misrepresentations,
or the override of internal control.
• Obtain an understanding of internal financial control relevant
to the audit in order to design audit procedures that are
appropriate in the circumstances. Under section 143(3)(i) of
the Act, we are also responsible for expressing our opinion
on whether the company has adequate internal financial
controls system in place and the operating effectiveness of
such controls.
• Evaluate the appropriateness of accounting policies used
and the reasonableness of accounting estimates and related
disclosures made by the management.
• Conclude on the appropriateness of management’s use of
the going concern basis of accounting and, based on the
audit evidence obtained, whether a material uncertainty exists
related to events or conditions that may cast significant doubt
on the Company’s ability to continue as a going concern. If we
conclude that a material uncertainty exists, we are required to
draw attention in our auditor’s report to the related disclosures
in the standalone financial statements or, if such disclosures
are inadequate, to modify our opinion. Our conclusions are
based on the audit evidence obtained up to the date of our
auditor’s report. However, future events or conditions may
cause the Company to cease to continue as a going concern.
• Evaluate the overall presentation, structure and content of the
standalone financial statements, including the disclosures, and
whether the standalone financial statements represent the
underlying transactions and events in a manner that achieves
fair presentation.
Materiality is the magnitude of misstatements in the standalone
financial statements that, individually or in aggregate, makes
it probable that the economic decisions of a reasonably
knowledgeable user of the standalone financial statements
may be influenced. We consider quantitative materiality and
qualitative factors in (i) planning the scope of our audit work
and in evaluating the results of our work; and (ii) to evaluate the
effect of any identified misstatements in the standalone financial
statements.
We communicate with those charged with governance
regarding, among other matters, the planned scope and timing
of the audit and significant audit findings, including any significant
deficiencies in internal control that we identify during our audit.
We also provide those charged with governance with a statement
that we have complied with relevant ethical requirements
regarding independence, and to communicate with them all
relationships and other matters that may reasonably be thought
to bear on our independence, and where applicable, related
safeguards.
From the matters communicated with those charged with
governance, we determine those matters that were of most
significance in the audit of the standalone financial statements
of the current period and are therefore the key audit matters.
We describe these matters in our auditor’s report unless law or
regulation precludes public disclosure about the matter or when,
in extremely rare circumstances, we determine that a matter
should not be communicated in our report because the adverse
consequences of doing so would reasonably be expected to
outweigh the public interest benefits of such communication..
Report on Other Legal and Regulatory Requirements
1. As required by the Companies (Auditor’s Report) Order, 2016
(“the Order”) issued by the Central Government of India in
terms of sub-section (11) of section 143 of the Act, we give
in the “Annexure- A”, a statement on the matters specified in
the paragraph 3 and 4 of the Order, to the extent applicable.
2. As required by Section 143(3) of the Act, we report that:
a. we have sought and obtained all the information and
explanations which to the best of our knowledge and
belief were necessary for the purposes of our audit.
b. in our opinion proper books of account as required by
law have been kept by the Company so far as appears
from our examination of those books.
c. the Balance Sheet, the Statement of Profit and Loss
including Other Comprehensive Income, Statement of
Changes in Equity and Cash Flow Statement and dealt
with by this Report are in agreement with the books of
account.
d. In our opinion, the aforesaid standalone Ind AS financial
statements comply with the Accounting Standards
specified under Section 133 of the Act
e. On the basis of written representations received from the
directors as on 31 March, 2019, taken on record by the
Board of Directors, none of the directors is disqualified as
on 31 March, 2019, from being appointed as a director in
terms of Section 164(2) of the Act.
f. With respect to the adequacy of the internal financial
controls over financial reporting of the Company and

92 | Fiem Industries Limited
Annexure-A to the Independent Auditors’ ReportThe Annexure referred to in our Independent Auditors’ Report to the members of the Company on the
standalone Ind AS financial statements for the year ended on 31.03.19, we report that:
1. a) The Company has maintained proper records showing
full particulars including quantitative details and situation
of fixed assets.
b) As explained to us, the company has a planned
programme for physically verifying all fixed assets once
in three years which in our opinion, is reasonable having
regard to the size and nature of assets. During the
year, the fixed assets have been physically verified by
the management in accordance with the programme
and no material discrepancies were identified on such
verification.
c) According to the information and explanations given
to us and on the basis of our examination of the
records of the company, the title deeds of immovable
properties are held in the name of the company except
for freehold land situated in Ahmedabad, Gujarat,
acquired during the Fy 16-17 for Rs 18.23 Lakhs, wherein
final registration is pending as disclosed in Note 2 on
“Property Plant and equipment “to the standalone Ind
AS financial statements.
2. The inventories have been physically verified by the
management at regular intervals during the year. In our
opinion, the frequency of verification is reasonable and
there were no material discrepancies noticed on physical
verification of the inventory as compared to the book of
accounts.
3. According the information and explanations given to us,
the Company has granted unsecured loans to one of its
wholly owned foreign subsidiary -M/s Fiem Research and
Technology S.r.l., covered in the register maintained under
section 189 of the Companies Act, 2013, in respect of
which:
(a) The terms and conditions of the grant of such loans
are, in our opinion, prima facie, not prejudicial to the
Company’s interest.
(b) The schedule of repayment of principal and payment
of interest has been stipulated and repayments or
receipts of principal amounts and interest have been
regular as per stipulations.
(c) There is no overdue amount remaining outstanding as
at the year-end.
4. In our Opinion and as per information and explanation given
to us, the company has complied the provisions of section
185, section 186 of the companies act 2013.
the operating effectiveness of such controls, refer to our
separate Report in “Annexure B” and
g. With respect to the other matters to be included in the
Auditor’s Report in accordance with the requirements
of section 197(16) of the Act, as amended:
In our opinion and to the best of our information
and according to the explanations given to us, the
remuneration paid by the Company to its directors
during the year is in accordance with the provisions of
section 197 of the Act.
h. With respect to the other matters included in the Auditor’s
Report in accordance with Rule 11 of the Companies
(Audit and Auditors) Rules, 2014, in our opinion and
to the best of our information and according to the
explanations given to us :
i. The Company has disclosed the impact of pending
litigations on its financial position in its financial
statements – Refer Note 35(A) to the standalone Ind
AS financial statements;
ii. The Company has made provision, as required
under the applicable law or accounting standards,
for material foreseeable losses, if any, on long-term
contracts including derivative contracts;
iii. There has been no delay in transferring amounts,
required to be transferred, to the Investor Education
and Protection Fund by the Company.
for V. Sachdeva & Associates
Chartered Accountants
Firm Registration Number -004417N
Sd/-
(V. Sachdev)
Place: Rai, Sonepat (HR.) Proprietor
Dated: 14/05/2019 Membership No.:-083435
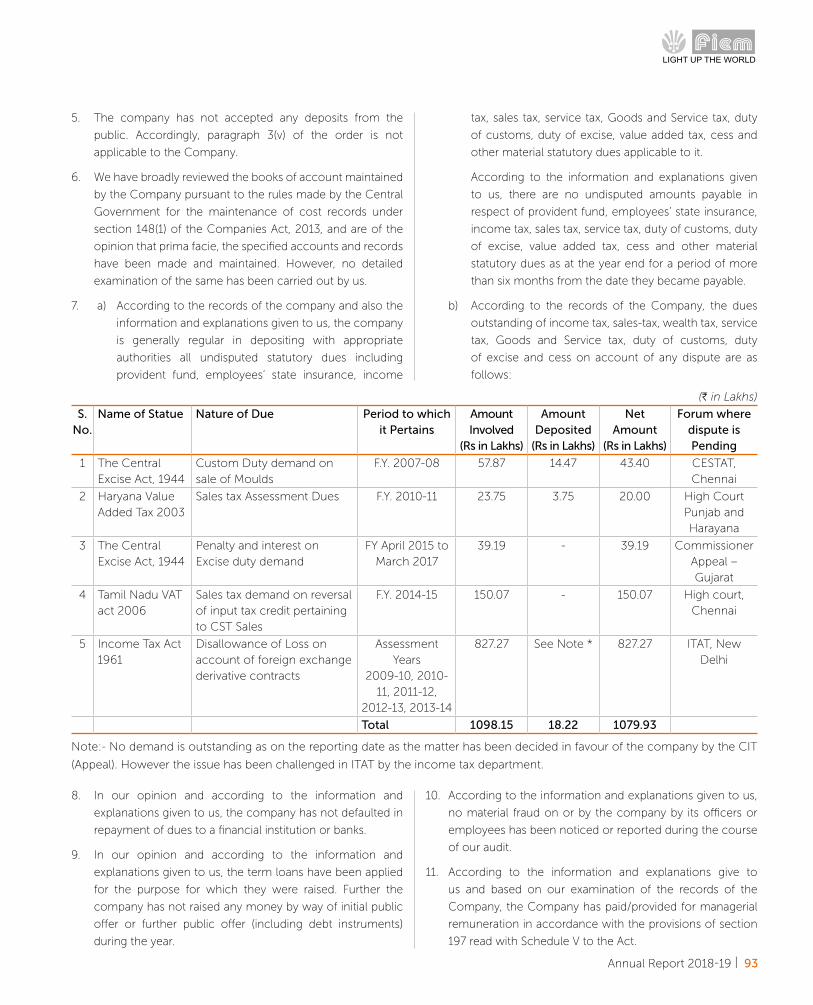
Annual Report 2018-19 | 93
(H in Lakhs)
S.No.
Name of Statue Nature of Due Period to which it Pertains
Amount Involved
(Rs in Lakhs)
Amount Deposited
(Rs in Lakhs)
Net Amount
(Rs in Lakhs)
Forum where dispute is Pending
1 The Central Excise Act, 1944
Custom Duty demand on sale of Moulds
F.Y. 2007-08 57.87 14.47 43.40 CESTAT, Chennai
2 Haryana Value Added Tax 2003
Sales tax Assessment Dues F.Y. 2010-11 23.75 3.75 20.00 High Court Punjab and Harayana
3 The Central Excise Act, 1944
Penalty and interest on Excise duty demand
FY April 2015 to March 2017
39.19 - 39.19 Commissioner Appeal –Gujarat
4 Tamil Nadu VAT act 2006
Sales tax demand on reversal of input tax credit pertaining to CST Sales
F.Y. 2014-15 150.07 - 150.07 High court, Chennai
5 Income Tax Act 1961
Disallowance of Loss on account of foreign exchange derivative contracts
Assessment Years
2009-10, 2010-11, 2011-12,
2012-13, 2013-14
827.27 See Note * 827.27 ITAT, New Delhi
Total 1098.15 18.22 1079.93
Note:- No demand is outstanding as on the reporting date as the matter has been decided in favour of the company by the CIT
(Appeal). However the issue has been challenged in ITAT by the income tax department.
8. In our opinion and according to the information and
explanations given to us, the company has not defaulted in
repayment of dues to a financial institution or banks.
9. In our opinion and according to the information and
explanations given to us, the term loans have been applied
for the purpose for which they were raised. Further the
company has not raised any money by way of initial public
offer or further public offer (including debt instruments)
during the year.
10. According to the information and explanations given to us,
no material fraud on or by the company by its officers or
employees has been noticed or reported during the course
of our audit.
11. According to the information and explanations give to
us and based on our examination of the records of the
Company, the Company has paid/provided for managerial
remuneration in accordance with the provisions of section
197 read with Schedule V to the Act.
5. The company has not accepted any deposits from the
public. Accordingly, paragraph 3(v) of the order is not
applicable to the Company.
6. We have broadly reviewed the books of account maintained
by the Company pursuant to the rules made by the Central
Government for the maintenance of cost records under
section 148(1) of the Companies Act, 2013, and are of the
opinion that prima facie, the specified accounts and records
have been made and maintained. However, no detailed
examination of the same has been carried out by us.
7. a) According to the records of the company and also the
information and explanations given to us, the company
is generally regular in depositing with appropriate
authorities all undisputed statutory dues including
provident fund, employees’ state insurance, income
tax, sales tax, service tax, Goods and Service tax, duty
of customs, duty of excise, value added tax, cess and
other material statutory dues applicable to it.
According to the information and explanations given
to us, there are no undisputed amounts payable in
respect of provident fund, employees’ state insurance,
income tax, sales tax, service tax, duty of customs, duty
of excise, value added tax, cess and other material
statutory dues as at the year end for a period of more
than six months from the date they became payable.
b) According to the records of the Company, the dues
outstanding of income tax, sales-tax, wealth tax, service
tax, Goods and Service tax, duty of customs, duty
of excise and cess on account of any dispute are as
follows:
94 | Fiem Industries Limited
Annexure-B to the Independent Auditors’ ReportANNEXURE “B” TO THE INDEPENDENT AUDITOR’S REPORT OF EVEN DATE ON THE STANDALONE IND
AS FINANCIAL STATEMENTS OF FIEM INDUSTRIES LIMITED
Report on the Internal Financial Controls under Clause (i) of
Sub-section 3 of Section 143 of the Companies Act, 2013 (“the
Act”)
1. We have audited the internal financial controls over financial
reporting of FIEM INDUSTRIES LIMITED (“the Company”)
as of March 31, 2019 in conjunction with our audit of the
standalone Ind AS financial statements of the Company for
the year ended on that date.
Management’s Responsibility for Internal Financial Controls
2. The Company’s management is responsible for establishing
and maintaining internal financial controls based on the
internal control over financial reporting criteria established
by the Company considering the essential components of
internal control stated in the Guidance Note on Audit of
Internal Financial Controls over Financial Reporting issued
by the Institute of Chartered Accountants of India (ICAI).
These responsibilities include the design, implementation
and maintenance of adequate internal financial controls
that were operating effectively for ensuring the orderly
and efficient conduct of its business, including adherence
to company’s policies, the safeguarding of its assets, the
prevention and detection of frauds and errors, the accuracy
and completeness of the accounting records, and the timely
preparation of reliable financial information, as required
under the Companies Act, 2013.
Auditors’ Responsibility
3. Our responsibility is to express an opinion on the Company's
internal financial controls over financial reporting based on
our audit. We conducted our audit in accordance with the
Guidance Note on Audit of Internal Financial Controls Over
Financial Reporting (the “Guidance Note”) and the Standards
on Auditing, to the extent applicable to an audit of internal
financial controls, both issued by the Institute of Chartered
Accountants of India. Those Standards and the Guidance
Note require that we comply with ethical requirements and
plan and perform the audit to obtain reasonable assurance
12. In our opinion and according to the information and
explanations given to us, the Company is not a nidhi
company. Accordingly, paragraph 3(xii) of the Order is not
applicable.
13. According to the information and explanations given to
us and based on our examination of the records of the
Company, transactions with the related parties are in
compliance with sections 177 and 188 of the Act wherever
applicable and details of such transactions have been
disclosed in the standalone Ind AS financial statements as
required by the applicable accounting standards.
14. According to the information and explanations give to
us and based on our examination of the records of the
Company, the Company has not made any preferential
allotment or private placement of shares or fully or partly
convertible debentures during the year.
15. According to the information and explanations given to
us and based on our examination of the records of the
Company, the Company has not entered into any non-cash
transactions with directors or persons connected with him.
Accordingly, paragraph 3(xv) of the Order is not applicable
to the Company.
16. The company is not required to be registered under section
45-IA of the Reserve Bank of India Act 1934. Accordingly,
paragraph 3(xvi) of the Order is not applicable to the
company.
for V. Sachdeva & Associates
Chartered Accountants
Firm Registration Number -004417N
Sd/-
(V. Sachdev)
Place: Rai, Sonepat (HR.) Proprietor
Dated: 14/05/2019 Membership No.:-083435
Annual Report 2018-19 | 95
about whether adequate internal financial controls over
financial reporting was established and maintained and if
such controls operated effectively in all material respects.
4. Our audit involves performing procedures to obtain audit
evidence about the adequacy of the internal financial
controls system over financial reporting and their operating
effectiveness. Our audit of internal financial controls over
financial reporting included obtaining an understanding of
internal financial controls over financial reporting, assessing
the risk that a material weakness exists, and testing and
evaluating the design and operating effectiveness of
internal control based on the assessed risk. The procedures
selected depend on the auditor’s judgement, including the
assessment of the risks of material misstatement of the Ind
AS financial statements, whether due to fraud or error.
5. We believe that the audit evidence we have obtained is
sufficient and appropriate to provide a basis for our opinion
on the Company’s internal financial controls system over
financial reporting.
Meaning of Internal Financial Controls Over Financial
Reporting
6. A company's internal financial control over financial
reporting is a process designed to provide reasonable
assurance regarding the reliability of financial reporting
and the preparation of Ind AS financial statements for
external purposes in accordance with generally accepted
accounting principles. A company's internal financial
control over financial reporting includes those policies and
procedures that (1) pertain to the maintenance of records
that, in reasonable detail, accurately and fairly reflect the
transactions and dispositions of the assets of the company;
(2) provide reasonable assurance that transactions are
recorded as necessary to permit preparation of Ind AS
financial statements in accordance with generally accepted
accounting principles, and that receipts and expenditures
of the company are being made only in accordance
with authorisations of management and directors of the
company; and (3) provide reasonable assurance regarding
prevention or timely detection of unauthorised acquisition,
use, or disposition of the company's assets that could have
a material effect on the Ind AS financial statements.
Inherent Limitations of Internal Financial Controls Over
Financial Reporting
7. Because of the inherent limitations of internal financial
controls over financial reporting, including the possibility
of collusion or improper management override of controls,
material misstatements due to error or fraud may occur and
not be detected. Also, projections of any evaluation of the
internal financial controls over financial reporting to future
periods are subject to the risk that the internal financial
control over financial reporting may become inadequate
because of changes in conditions, or that the degree of
compliance with the policies or procedures may deteriorate.
Opinion
8. In our opinion, the Company has, in all material respects,
an adequate internal financial controls system over financial
reporting and such internal financial controls over financial
reporting were operating effectively as at March 31, 2019,
based on the internal control over financial reporting criteria
established by the Company considering the essential
components of internal control stated in the Guidance
Note on Audit of Internal Financial Controls Over Financial
Reporting issued by the Institute of Chartered Accountants
of India.
for V. Sachdeva & Associates
Chartered Accountants
Firm Registration Number -004417N
Sd/-
(V. Sachdev)
Place: Rai, Sonepat (HR.) Proprietor
Dated: 14/05/2019 Membership No.:-083435

96 | Fiem Industries Limited
Balance Sheet as at 31.03.2019
(Amount H in Lakhs) Particulars Note No. As at 31.03.2019 As at 31.03.2018ASSETS1 NON CURRENT ASSETS
(a) Property, Plant and Equipment 2 56,315.58 55,259.71 (b) Capital work-in-progress 2 790.95 560.98 (c) Intangible assets 3 96.04 118.69 (d) Intangible assets under development 3 358.31 130.81 (e) Financial Assets
(i) Investments 4 2,774.10 93.72 (ii) Trade receivables 5 124.90 124.90 (iii) Loans 6 890.44 779.09 (iv) Other Financial Assets 7 201.87 4.53
(f) Income tax assets (net) 8 449.13 449.13 (g) Other non-current assets 9 831.39 1,143.29 Total Non Current Assets 62,832.71 58,664.85
2 CURRENT ASSETS(a) Inventories 10 14,724.21 14,027.11 (b) Financial Assets
(i) Investments 11 - 1,909.56 (ii) Trade receivables 5 14,637.58 14,395.05 (iii) Cash and cash equivalents 12 119.17 110.36 (iv) Bank balances other than (iii) above 13 25.87 42.95 (v) Loans 6 50.27 57.71 (vi) Other Financial Assets 7 1,690.23 2,784.92
(c) Current Tax Assets (Net) - - (d) Other current assets 9 2,091.92 1,516.62 Total Current Assets 33,339.25 34,844.28
TOTAL ASSETS 96,171.96 93,509.13 EQUITY AND LIABILITIES 1 EQUITY
(a) Equity Share capital 14 1,315.98 1,315.98 (b) Other Equity 15 46,348.79 43,583.05 Total Equity 47,664.77 44,899.03
2 LIABILITIES NON CURRENT LIABILITIES (a) Financial Liabilities
(i) Borrowings 16 9,296.24 8,650.34 (ii) Trade payables - - (iii) Other financial liabilities 17 - 186.81
(b) Provisions 18 674.17 384.96 (c) Deferred tax liabilities (Net) 41 5,191.87 4,384.71 (d) Other non-current liabilities - - Total Non Current Liabilities 15,162.28 13,606.82 CURRENT LIABILITIES (a) Financial Liabilities
(i) Borrowings 19 3,846.66 3,706.82 (ii) Trade payables 20 -Total outstanding dues of micro and small enterprises 122.62 159.11 -Total outstanding dues of creditors other than micro and small enterprises 18,755.43 21,813.67
18,878.05 21,972.78 (iii) Other financial liabilities 21 6,350.93 7,407.22
(b) Other current liabilities 22 3,808.25 1,556.02 (c) Provisions 18 189.62 251.38 (d) Current Tax Liabilities (Net) 23 271.40 109.06 Total Current Liabilities 33,344.91 35,003.28
TOTAL LIABILITIES 48,507.18 48,610.10 TOTAL EQUITY AND LIABILITIES 96,171.96 93,509.13 Significant Accounting Policies and Notes to financial Statements. 1 to 60
The accompanying notes are an integral part of the financial statements.
For and on behalf of the Board of Directors As per our report of even date For V. Sachdeva & Associates Chartered Accountants Firm Registration Number: 004417N
Sd/- Sd/- Sd/- Sd/- Sd/-J. K. Jain Rahul Jain O.P. Gupta Arvind K. Chauhan (V. Sachdev)Managing Director Director Chief Financial Officer Company Secretary Prop. (Membership No. 083435)
Place : Rai, Sonepat (HR.)Date : 14/05/2019

Annual Report 2018-19 | 97
Statement of Profit and Loss for the year ended 31.03.2019
(Amount H in Lakhs)
Particulars Note No. Current Year 2018-19 Previous Year 2017-18
INCOME
Revenue From Operations
a) Gross Sales 24 1,43,396.13 1,26,323.93
b) Other Operating Income 25 1,003.67 989.40
I. Revenue from Operations (a+b) 1,44,399.80 1,27,313.33
II. Other Income 26 86.21 454.40
III. TOTAL INCOME (I+II) 1,44,486.01 1,27,767.73
IV. EXPENSES
a) Cost of Raw Materials and Components Consumed 27 89,559.92 75,720.43
b) Purchase of Stock-in-Trade 28 741.55 467.46
c) Changes in Inventories of Finished Goods, Work in progress and Stock in trade
29 (492.11) (2,287.45)
d) Excise duty on sales - 3,477.99
e) Employees benefits expenses 30 19,570.33 17,669.78
f) Finance costs 31 2,209.79 2,272.41
g) Depreciation and amortization expense 32 4,891.61 4,432.47
h) Other expenses 33 19,493.78 18,198.25
TOTAL EXPENSES 1,35,974.88 1,19,951.33
V. PROFIT BEFORE EXCEPTIONAL ITEM AND TAX (III-IV) 8,511.13 7,816.40
Exceptional Item 34 - (340.58)
VI. PROFIT BEFORE TAX 8,511.13 8,156.98
VII. TAX EXPENSES
Current Tax
a) Current Tax Expense 2,541.48 2,092.58
b) (Excess)/Short Tax provision for earlier years 14.79 (18.81)
c) Deferred Tax Liability/ (Assets) 406.11 828.20
2,962.38 2,901.96
VIII. PROFIT AFTER TAX FOR THE YEAR (VI-VII) 5,548.75 5,255.01
IX. OTHER COMPREHENSIVE INCOME/(LOSS)
A) Items that will not be reclassified subsequently to the statement of profit and loss
(i) Remeasurement of Defined Benefit Plans (130.16) (110.93)
(ii) Income tax on items Items that will not be reclassified subsequently to the statement of profit and loss
45.48 39.55
(84.68) (71.38)
B) Items that will be reclassified subsequently to the statement of profit and loss
- -
TOTAL OTHER COMPREHENSIVE INCOME (NET OF TAX) (84.68) (71.38)
X. TOTAL COMPREHENSIVE INCOME (NET OF TAX) (VIII+IX) 5,464.07 5,183.63
Basic and Diluted Weighted Earning per Equity Share (Nominal value H 10 per share)
45 42.16 39.93
Significant Accounting Policies and Notes to financial Statements. 1 to 60
The accompanying notes are an integral part of the financial statements.
For and on behalf of the Board of Directors As per our report of even date
For V. Sachdeva & Associates
Chartered Accountants
Firm Registration Number: 004417N
Sd/- Sd/- Sd/- Sd/- Sd/-
J. K. Jain Rahul Jain O.P. Gupta Arvind K. Chauhan (V. Sachdev)
Managing Director Director Chief Financial Officer Company Secretary Prop. (Membership No. 083435)
Place : Rai, Sonepat (HR.)
Date : 14/05/2019
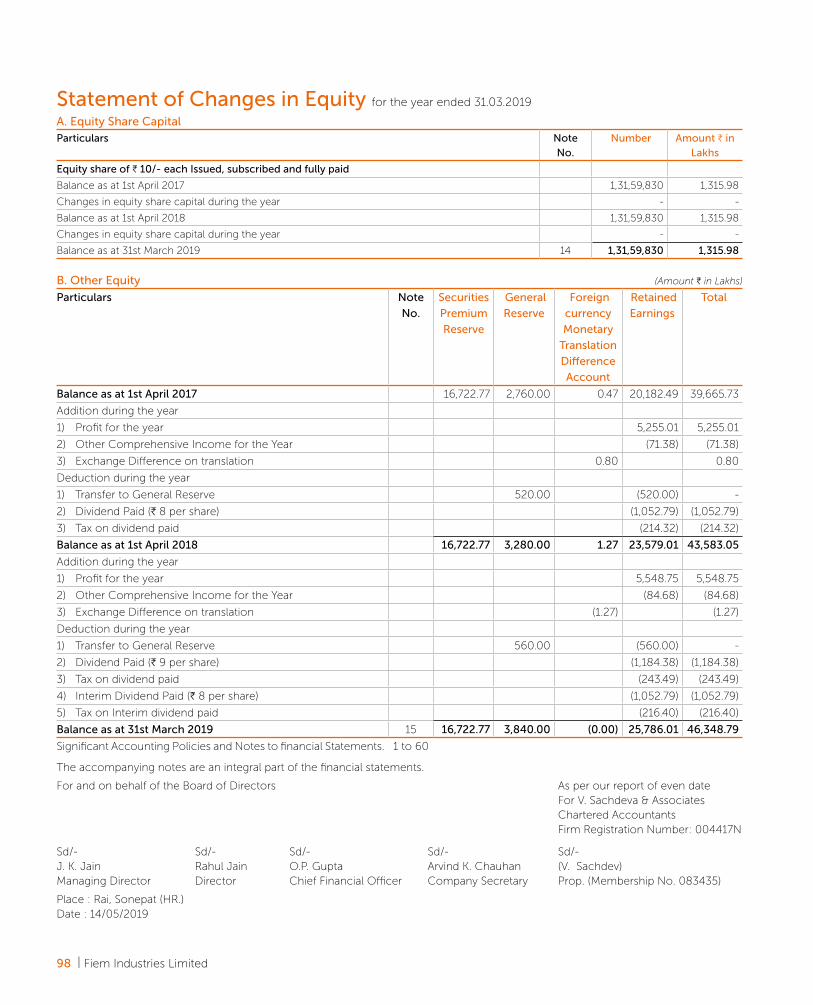
98 | Fiem Industries Limited
Statement of Changes in Equity for the year ended 31.03.2019
A. Equity Share Capital Particulars Note
No. Number Amount H in
Lakhs
Equity share of H 10/- each Issued, subscribed and fully paid
Balance as at 1st April 2017 1,31,59,830 1,315.98
Changes in equity share capital during the year - -
Balance as at 1st April 2018 1,31,59,830 1,315.98
Changes in equity share capital during the year - -
Balance as at 31st March 2019 14 1,31,59,830 1,315.98
B. Other Equity (Amount H in Lakhs)
Particulars Note
No.
Securities
Premium
Reserve
General
Reserve
Foreign
currency
Monetary
Translation
Difference
Account
Retained
Earnings
Total
Balance as at 1st April 2017 16,722.77 2,760.00 0.47 20,182.49 39,665.73
Addition during the year
1) Profit for the year 5,255.01 5,255.01
2) Other Comprehensive Income for the Year (71.38) (71.38)
3) Exchange Difference on translation 0.80 0.80
Deduction during the year
1) Transfer to General Reserve 520.00 (520.00) -
2) Dividend Paid (H 8 per share) (1,052.79) (1,052.79)
3) Tax on dividend paid (214.32) (214.32)
Balance as at 1st April 2018 16,722.77 3,280.00 1.27 23,579.01 43,583.05
Addition during the year
1) Profit for the year 5,548.75 5,548.75
2) Other Comprehensive Income for the Year (84.68) (84.68)
3) Exchange Difference on translation (1.27) (1.27)
Deduction during the year
1) Transfer to General Reserve 560.00 (560.00) -
2) Dividend Paid (H 9 per share) (1,184.38) (1,184.38)
3) Tax on dividend paid (243.49) (243.49)
4) Interim Dividend Paid (H 8 per share) (1,052.79) (1,052.79)
5) Tax on Interim dividend paid (216.40) (216.40)
Balance as at 31st March 2019 15 16,722.77 3,840.00 (0.00) 25,786.01 46,348.79
Significant Accounting Policies and Notes to financial Statements. 1 to 60
The accompanying notes are an integral part of the financial statements.
For and on behalf of the Board of Directors As per our report of even date For V. Sachdeva & Associates Chartered Accountants Firm Registration Number: 004417N
Sd/- Sd/- Sd/- Sd/- Sd/-J. K. Jain Rahul Jain O.P. Gupta Arvind K. Chauhan (V. Sachdev)Managing Director Director Chief Financial Officer Company Secretary Prop. (Membership No. 083435)
Place : Rai, Sonepat (HR.)Date : 14/05/2019
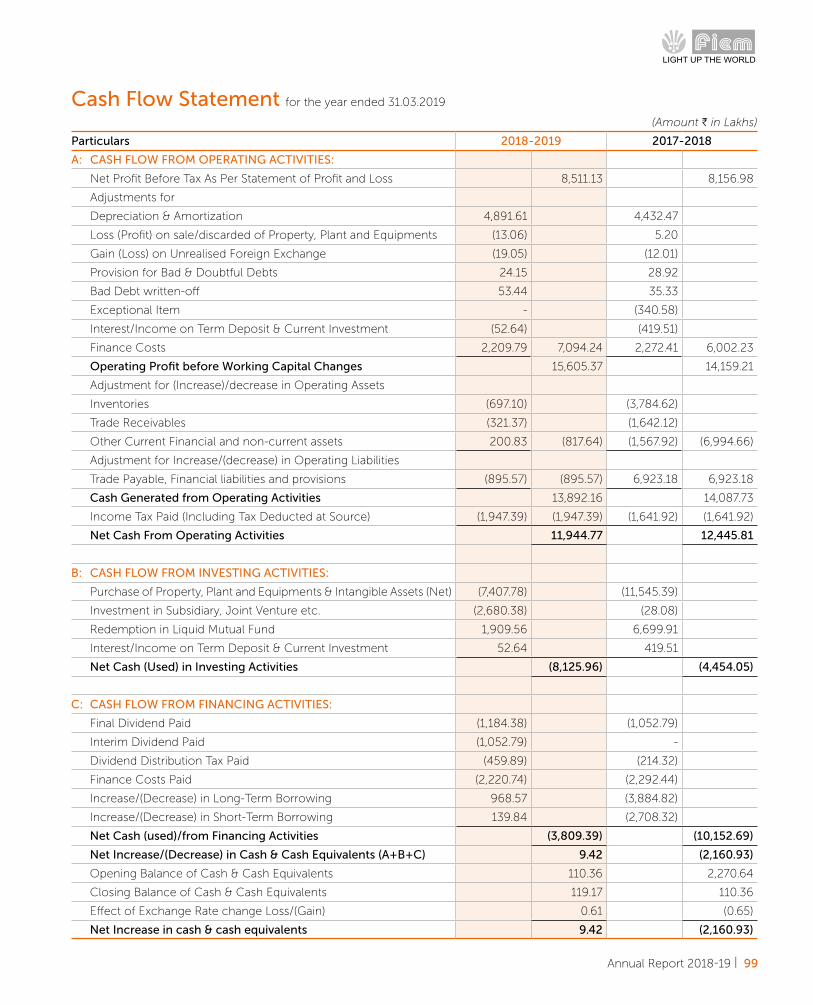
Annual Report 2018-19 | 99
Cash Flow Statement for the year ended 31.03.2019
(Amount H in Lakhs)
Particulars 2018-2019 2017-2018
A: CASH FLOW FROM OPERATING ACTIVITIES:
Net Profit Before Tax As Per Statement of Profit and Loss 8,511.13 8,156.98
Adjustments for
Depreciation & Amortization 4,891.61 4,432.47
Loss (Profit) on sale/discarded of Property, Plant and Equipments (13.06) 5.20
Gain (Loss) on Unrealised Foreign Exchange (19.05) (12.01)
Provision for Bad & Doubtful Debts 24.15 28.92
Bad Debt written-off 53.44 35.33
Exceptional Item - (340.58)
Interest/Income on Term Deposit & Current Investment (52.64) (419.51)
Finance Costs 2,209.79 7,094.24 2,272.41 6,002.23
Operating Profit before Working Capital Changes 15,605.37 14,159.21
Adjustment for (Increase)/decrease in Operating Assets
Inventories (697.10) (3,784.62)
Trade Receivables (321.37) (1,642.12)
Other Current Financial and non-current assets 200.83 (817.64) (1,567.92) (6,994.66)
Adjustment for Increase/(decrease) in Operating Liabilities
Trade Payable, Financial liabilities and provisions (895.57) (895.57) 6,923.18 6,923.18
Cash Generated from Operating Activities 13,892.16 14,087.73
Income Tax Paid (Including Tax Deducted at Source) (1,947.39) (1,947.39) (1,641.92) (1,641.92)
Net Cash From Operating Activities 11,944.77 12,445.81
B: CASH FLOW FROM INVESTING ACTIVITIES:
Purchase of Property, Plant and Equipments & Intangible Assets (Net) (7,407.78) (11,545.39)
Investment in Subsidiary, Joint Venture etc. (2,680.38) (28.08)
Redemption in Liquid Mutual Fund 1,909.56 6,699.91
Interest/Income on Term Deposit & Current Investment 52.64 419.51
Net Cash (Used) in Investing Activities (8,125.96) (4,454.05)
C: CASH FLOW FROM FINANCING ACTIVITIES:
Final Dividend Paid (1,184.38) (1,052.79)
Interim Dividend Paid (1,052.79) -
Dividend Distribution Tax Paid (459.89) (214.32)
Finance Costs Paid (2,220.74) (2,292.44)
Increase/(Decrease) in Long-Term Borrowing 968.57 (3,884.82)
Increase/(Decrease) in Short-Term Borrowing 139.84 (2,708.32)
Net Cash (used)/from Financing Activities (3,809.39) (10,152.69)
Net Increase/(Decrease) in Cash & Cash Equivalents (A+B+C) 9.42 (2,160.93)
Opening Balance of Cash & Cash Equivalents 110.36 2,270.64
Closing Balance of Cash & Cash Equivalents 119.17 110.36
Effect of Exchange Rate change Loss/(Gain) 0.61 (0.65)
Net Increase in cash & cash equivalents 9.42 (2,160.93)

100 | Fiem Industries Limited
Cash Flow Statement for the year ended 31.03.2019Note:- Previous Year's figures have been regrouped/reclassified wherever necessary to correspond with the current year's
classification/disclosure (Amount H in Lakhs)
Movement in Financial Liabilities Non-
Current
Borrowings
Current
Borrowings
Interest
Payable
Total
As on 01/04/2018 12,198.05 3,706.82 59.93 15,964.80
Cash Flow 968.57 139.84 - 1,108.41
Interest Expenses - - 2,209.79 2,209.79
Interest Paid - - (2,220.74) (2,220.74)
Interest Capitalized - - 40.18 40.18
As on 31/03/2019 13,166.62 3,846.66 89.16 17,102.44
For and on behalf of the Board of Directors As per our report of even date
For V. Sachdeva & Associates
Chartered Accountants
Firm Registration Number: 004417N
Sd/- Sd/- Sd/- Sd/- Sd/-
J. K. Jain Rahul Jain O.P. Gupta Arvind K. Chauhan (V. Sachdev)
Managing Director Director Chief Financial Officer Company Secretary Prop. (Membership No. 083435)
Place : Rai, Sonepat (HR.)
Date : 14/05/2019
Annual Report 2018-19 | 101
Notes to the Financial Statements for the year ended 31.03.2019
1. GENERAL INFORMATION
Fiem Industries Limited ("The Company") is a public limited company domiciled in India and incorporated under the
provisions of the Companies Act, 1956. The address of its registered office is D-34, DSIDC Packaging Complex, Kirti Nagar,
New Delhi-110015. Its shares are listed on National Stock Exchange and Bombay Stock Exchange in India. The Company is in
the business of manufacturing and supply of auto components comprising of automotive lighting & signalling equipments,
rear-view mirror, prismatic mirror, plastic moulded parts and sheet metal components for motorised vehicles, and LED
luminaries comprising of indoor and outdoor lighting, display panels and integrated passengers information system.
Significant Accounting Policies
(A) Statement of Compliance
The financial statement has been prepared as a going concern in accordance with Indian Accounting Standards (Ind
AS) notified under the Section 133 of the Companies Act, 2013 ("the Act) read with the Companies (Indian Accounting
Standards) Rules, 2015 and other relevant provision of the Act.
These standalone financial statements are approved by the Company’s Board of Directors on 14 May 2019.
(B) Accounting Convention
The financial statements have been prepared on the historical cost convention on accrual basis except for certain
financial instruments which are measured at fair value at end of each reporting period, as explained in the accounting
polices mentioned below. The accounting policies have been applied consistently over all the periods presented in these
financial statements.
(C) Use of Estimates and Judgements
The preparation of financial statements in conformity with Ind AS requires management to make judgements, estimates,
and assumptions that affect the application of accounting policies and reported amount of assets, liabilities, income,
expenses and disclosures of contingent assets and liabilities at the date of these financial statements and the reported
amount of revenues and expenses for the years presented. Actual results may differ from the estimates.
Estimates and underlying assumptions are reviewed at each balance sheet date. Revision to accounting estimates are
recognised in the period in which the estimates are revised and in which future periods are also affected.
Assumptions and estimation uncertainties and judgements
Information about judgements, assumptions and estimation uncertainties that have significant risk of resulting in a
material adjustment in the year ending 31 March 2019 and judgements made in applying accounting policies that have
the most significant effects on the amounts recognised in the standalone financial statements is included in the following
notes:
(i) Recognition of deferred tax assets - note 41 - The Company has recognized deferred tax assets and concluded that
the deferred tax assets will be recoverable using the estimated future taxable income based on the experience and
future projections. The Company is expected to generate adequate taxable income for liquidating these assets in
due course of time.
(ii) Provision for employee benefits - note 49 - The measurement of obligations and assets related to defined benefit
plans makes it necessary to use several statistical and other factors that attempt to anticipate future events. These
factors include assumptions about the discount rate, the rate of future compensation increases, withdrawal, mortality
rates etc. The management has used the past trends and future expectations in determining the assumptions which
are used in measurements of obligations.
(iii) Provision for warranty - note 18 - The provision is based on historical warranty data and weighing of all possible

102 | Fiem Industries Limited
outcomes by their associated probabilities. Provisions for warranties are adjusted regularly to take account of new
circumstances and the impact of any changes recognised in the income statement.
(iv) Classification between property, plant & equipment and investment property - The Company has certain vacant
land. The management has currently classified such property as property, plant & equipment since the management
believes that the property is held for future use as an “owner occupied property”.
(v) Tools, mould and dies - Revenue from sale of tools, mould and dies is recognised on a completed contract method
considering that substantial activity for preparation of mould is outsourced to sub-contractors. Further, development
of such tools, moulds and dies does not take the substantial time period, unless due to procedural delays from the
customer’s end.
New standards and interpretations not yet adopted
Appendix C to Ind AS 12, Uncertainty over Income Tax Treatments: On March 30, 2019, Ministry of Corporate Affairs
("MCA") has notified the Companies (Indian Accounting Standards) Amendment Rules, 2019 containing Appendix C to
Ind AS 12, Uncertainty over Income Tax Treatments which clarifies the application and measurement requirements in
Ind AS 12 when there is uncertainty over income tax treatments. The current and deferred tax asset or liability shall be
recognized and measured by applying the requirements in Ind AS 12 based on the taxable profit (tax loss), tax bases,
unused tax losses, unused tax credits and tax rates determined by applying this appendix. The amendment is effective for
annual periods beginning on or after April 1, 2019.
Ind AS 116 'Leases': On March 30, 2019, the Ministry of Corporate Affairs notified the Companies (Indian Accounting
Standards) Amendment Rules, 2019 containing Ind AS 116 – Leases and related amendments to other Ind AS. Ind AS
116 replaces Ind AS 17 'Leases' and related interpretation and guidance. The standard sets out principles for recognition,
measurement, presentation and disclosure of leases for both parties to a contract i.e., the lessee and the lessor. Ind AS
116 introduces a single lessee accounting model and requires a lessee to recognise assets and liabilities for all leases
with a term of more than 12 months, unless the underlying asset is of low value. Currently, operating lease expenses are
charged to the statement of profit and loss. The Standard also contains enhanced disclosure requirements for lessees.
Ind AS 116 substantially carries forward the lessor accounting requirements as per Ind AS 17. Ind AS 116 is effective for
annual periods beginning on or after April 1, 2019.
Amendment to Ind AS 19 'Employee Benefits': On March 30, 2019, the Ministry of Corporate Affairs has notified limited
amendments to Ind AS 19 'Employee Benefits' in connection with accounting for plan amendments, curtailments and
settlements. The amendments require an entity to use updated assumptions to determine current service cost and net
interest for the remainder of the period after a plan amendment, curtailment or settlement and to recognise in profit or
loss as part of past service cost, or a gain or loss on settlement, any reduction in a surplus, even if that surplus was not
previously recognised because of the impact of the asset ceiling. The amendment will come into force for accounting
periods beginning on or after April 1, 2019, though early application is permitted.
Amendment to Ind AS 12 'Income Taxes': On March 30, 2019, the Ministry of Corporate Affairs has notified limited
amendments to Ind AS 12 'Income Taxes'. The amendments require an entity to recognise the income tax consequences
of dividends as defined in Ind AS 109 when it recognises a liability to pay a dividend. The income tax consequences of
dividends are linked more directly to past transactions or events that generated distributable profits than to distributions
to owners. Therefore, an entity shall recognize the income tax consequences of dividends in profit or loss, other
comprehensive income or equity according to where the entity originally recognised those past transactions or events.
The amendment will come into force for accounting periods beginning on or after April 1, 2019. The Company is
evaluating the effect of the above on its standalone financial statements.
Notes to the Financial Statements for the year ended 31.03.2019
Annual Report 2018-19 | 103
The Company is evaluating the effect of the above on its standalone financial statements
(D) Current-Non Current Classification
All assets and liabilities are classified into current and non-current.
Assets
An asset is classified as current when it satisfies any of the following criteria:
(a) it is expected to be realised in, or is intended for sale or consumption in, the Company's normal operating cycle;
(b) it is held primarily for the purpose of being traded;
(c) it is expected to be realised within 12 months after the reporting date; or;
(d) it is cash or cash equivalent unless it is restricted from being exchanged or used to settle a liability for a least 12
months after the reporting date
Liabilities
A liability is classified as current when it satisfies any of the following criteria:
(a) it is expected to be settled in the Company's normal operating cycle;
(b) it is held primarily for the purpose of being traded;
(c) it is due to be settled within 12 months after the reporting date; or;
(d) the company does not have an unconditional right to defer settlement of the liability for at least 12 months after the
reporting date. Terms of a liability that could, at the option of the counterparty, result in its settlement by the issue of
equity instruments do not affect its classification.
Operating Cycle
Based on the nature of products/activities of the Company and the normal time between the acquisition of assets for
processing and their realisation in cash or cash equivalents, the Company has determined its operating cycle as 12
months for the purpose of current and non current classification of assets and liabilities
(E) Property, Plant and Equipment
Property, plant and equipment held for use in the production or supply of goods or services, or for administrative
purposes, are stated in the balance sheet at cost less accumulated depreciation and accumulated impairment losses.
Cost of acquisition is inclusive of freight, duties, taxes, and other incidental expenses. Freehold land is not depreciated.
Properties in the course of construction for production, supply or administrative purposes are carried at cost, less any
recognised impairment loss. Cost includes items directly attributable to the construction or acquisition of the items of
property, plant and equipment. For qualifying assets borrowing costs are capitalised in accorance with the Company's
accounting policy. Such properties are classified to the appropriate categories of property, plant and equipment when
completed and ready for intended use. Depreciation of these assets is provided on the same basis as-other property
assets & commences when the assets are ready for their intended use.
Subsequent costs are included in the assets's carrying amount only when it is probable that future economic benefits
associated with the items will flow to the Company and the cost of the item can be measured reliably. The cost for day-
to-day servicing of property, plant and equipment are recognized in Statement of Profit and Loss as and when incuured.
The estimated useful lives, residual values and depreciation method are reviewed at the end of each reporting period,
with the effect of any changes in estimate accounted for on a prospective basis.
Depreciation is calculated using the straight-line method on a pro-rata basis from the date in which each asset is put to
Notes to the Financial Statements for the year ended 31.03.2019
104 | Fiem Industries Limited
use to allocate their cost, net of their residual values, over their useful life generally in accordance with that provided in
the Schedule II to the Act. Moulds and dies & tools are depreciated over a period of 6 years.
Leasehold land is amortised over the primary period of lease
An item of property, plant and equipment is derecognised upon disposal or when no future economic benefits are
expected to arise from the continued use of the asset. Any gain or loss arising on the disposal or retirement of an item of
property, plant and equipment is determined as the difference between the sales proceeds and the carrying amount of
the asset and is recognised in statement of profit and loss.
Capital Work-in-Progress
Capital work-in-progress comprises the cost of property, plant and equipment that are not yet ready for their intended
use at the balance sheet date & expenditure during construction period pending allocation and fixed assets in transit
that are not yet received for their intended use at the balance sheet date. Depreciation is not charged on capital work in
progress until construction and installation are complete and asset ready for its intended use.
Capital Advances
Advances given towards acquisition of fixed assets outstanding at each Balance Sheet date are disclosed as Other Non-
Current Assets.
(F) Intangible Assets
Intangible assets acquired sepretary
Intangible assets with finite useful lives that are acquired separately are carried at cost less accumulated amortisation and
accumulated impairment losses. Amortization is recognised on a straight-line basis over their estimated useful lives. The
estimated useful life and amortization are reviewed at the end of each reporting period, with the effect of any changes
in estimate being accounted for on a prospective basis. Intangible assets with indefinite useful lives that are aquired
separately are carried at cost less accumulated impairment losses.
Intangible Assets Under Development
Intangible Assets Under Development comprises the cost of intangible assets that are not yet ready for their intended use
at the balance sheet date. Amortization is not charged on intangible assets under development.
(G) Financial Instruments
Financial assets and financial liabilities are recognised when the Company becomes a party to the contractual provisions
of the instrument. Financial assets and liabilities are initially measured at fair value. Transaction costs that are directly
attributable to the acquisition or issue of financial assets and financial liabilities (other than financial assets and financial
liabilities at fair value through profit or loss) are added to or deducted from the fair value measured on initial recognition
of financial asset or financial liability.
Cash and cash equivalents
The Company considers all highly liquid financial instruments, which are readily convertible into known amounts of cash
that are subject to an insignificant risk of change in value and having original maturities of three months or less from the
date of purchase, to be cash equivalents. Cash and cash equivalents includes balances with banks which are unrestricted
for withdrawal and usage.
Financial assets at amortised cost
Financial assets are subsequently measured at amortised cost if these financial assets are held within a business whose
objective is to hold these assets in order to collect contractual cash flows and the contractual terms of the financial
asset give rise on specified dates to cash flows that are solely payments of principal and interest on the principal amount
outstanding.
Notes to the Financial Statements for the year ended 31.03.2019

Annual Report 2018-19 | 105
Financial assets at fair value through other comprehensive income
Financial assets are measured at fair value through other comprehensive income if these financial assets are held within
a business whose objective is achieved by both collecting contractual cash flows and selling financial assets and the
contractual terms of the financial asset give rise on specified dates to cash flows that are solely payments of principal and
interest on the principal amount outstanding.
Financial assets at fair value through profit or loss
Financial assets are measured at fair value through profit or loss unless it is measured at amortised cost or at fair value
through other comprehensive income on initial recognition. The transaction costs directly attributable to the acquisition
of assets and liabilities at fair value through profit and loss are immediately recognised in the statement of profit and loss.
Investment in subsidiaries and Joint Ventures
Investment in subsidiaries and joint ventures are measured at cost.
Financial liabilities
Financial liabilities are measured at amortised cost using the effective interest method.
Equity instruments
An equity instrument is a contract that evidences residual interest in the assets of the company after deducting all of its
liabilities. Company recognises equity instruments at proceeds received net off direct issue cost.
Reclassification of Financial Assets
The Company determines classification of financial assets and liabilities on initial recognition. After initial recognition, no
reclassification is made for financial assets which are equity instruments and financial liabilities. For financial assets which
are debt instruments, a reclassification is made only if there is a change in the business model for managing those assets.
Changes to the business model are expected to be infrequent. The Company’s senior management determines change
in the business model as a result of external or internal changes which are significant to the company’s operations.
Such changes are evident to external parties. A change in the business model occurs when a company either begins
or ceases to perform an activity that is significant to its operations. If the Company reclassifies financial assets, it applies
the reclassification prospectively from the reclassification date which is the first day of the immediately next reporting
period following the change in business model. The Company does not restate any previously recognized gains, losses
(including impairment gains and losses) or interest.
Offsetting of financial instruments
Financial assets and financial liabilities are offset and the net amount is reported in the Balance Sheet if there is currently
enforceable legal right to offset the recognized amounts and there is an intention to settle on a net basis, to realize the
assets and settle the liabilities simultaneously.
(H) Inventory
(i) Raw materials, components, stores and spares are valued at lower of cost or net realizable value. However, raw
materials and other supplies held for use in the production of finished products are not written down below cost if
the finished products in which they will be incorporated are expected to be sold at or above cost. In determining the
cost, First in First Out method (FIFO) is used.
(ii) Semi-finished goods and finished goods are valued lower of cost or net realizable value. Cost includes direct materials
and direct labour and a proportion of manufacturing overheads based on normal operating capacity.
(iii) Moulds, block & dies are valued at lower of cost or net realizable value. Manufactured moulds, block & dies include
direct material, direct labour and a proportion of manufacturing overhead based on normal operating capacity. Cost
is determined on a First in First Out basis (FIFO).
Notes to the Financial Statements for the year ended 31.03.2019
106 | Fiem Industries Limited
(iv) Inventories of non-reusable waste say scrap for which facilities for reprocessing do not exist have been valued at net
realizable value.
(iv) Cost of inventories comprises all cost of purchase, cost of conversion and other costs incurred in bringing the
inventories to their present location and condition.
(v) Net realisable value is the estimated selling price in the ordinary course of business, less the estimated costs of
completion and the estimated costs necessary to make the sale.
(vi) Goods in transit are stated as a component of inventories if the significant risk and rewards of ownership have passed
to the company and valued at actual cost incurred up to the date of Balance Sheet.
(vii) Excise duty in respect of inventories of finished goods manufactured in pre-GST i.e up to 30.06.2017 has been shown
separately as a item of expense.
(I) Revenue Recognition
Revenue is measured at the fair value of the consideration received or receivable. Revenue is reduced for any trade
discounts, volume rebates & others similar allowances.
The Company has adopted Ind AS 115 'Revenue from Contracts with Customers' with the date of initial application being
April 1, 2018. Ind AS 115 establishes a comprehensive framework on revenue recognition. Ind AS 115 replaces Ind AS
18 'Revenue' and Ind AS 11 'Construction Contracts'. The application of Ind AS 115 did not have material impact on the
financial statements. As a result, the comparative information has not been restated.
Sale of Goods
The sale of goods in the course of ordinary activities is recognised when all significant risk & rewards of ownership of the
goods have transferred to the customer and no significant uncertainty exists regarding the amount of the consideration
that will be derived from the sale of goods and regarding its collection.
Revenue from operation up to in previous year 30.06.2017 includes excise duty but excludes value added taxes.
Rendering of Services
Service income is recognised as per the terms of contracts/arrangements when related services are performed.
Insurance Claim
Insurance claims lodged with insurance companies are accounted for on the basis of claim admitted/expected to be
admitted and to the extent that there is no uncertainty in receiving the claims.
Dividend and Interest Income
Dividend income from investments is recognized when the right to receive the dividend is established at the Balance
Sheet date.
Interest income from a financial asset is recognised when it is probable that the economic benefits will flow to the
Company and the amount of income can be measured reliably. Interest income is accrued on, time basis, by reference
to the principal outstanding and at the effective interest rate applicable, which is the rate that exactly discounts estimated
future cash receipts through the expected life of the financial asset to that asset's net carrying amount on initial recognition.
(J) Government Grants, Subsidies and Export Incentives
(i) Government grants and subsidies are recognised in the statement of profit and loss in accordance with related
schemes and when there is reasonable assurance that the Company will comply with the conditions attached to
them and the grants/subsidy will be received.
(ii) Duty drawback is recognised in the statement of profit and loss at the time of exports subject to the right to
entitlement has been established.
Notes to the Financial Statements for the year ended 31.03.2019
Annual Report 2018-19 | 107
(K) Foreign Currency Transactions
Functional and Presentation Currency
The functional currency of the Company is Indian rupee.
Transactions and balances
Transactions in foreign currencies are recorded at the exchange rates prevailing on the date of transaction
Foreign currency monetary assets and liabilities such as cash, receivables, payables, etc., are translated at year end
exchange rates.
Non-monetary items denominated in foreign currency such as investments, fixed assets, inventories etc., are valued at
the exchange rate prevailing on the date of transaction.
Exchange differences arising on settlement of transactions and translation of monetary items are recognised as income
or expense in the year in which they arise.
Effective April 1, 2018 the company has adopted Appendix B to Ind AS 21- Foreign Currency Transactions and Advance
Consideration which clarifies the date of transaction for the purpose of determining the exchange rate to use on initial
recognition of the related asset, expense or income when an entity has received or paid advance consideration in a
foreign currency. The effect on account of adoption of this amendment was insignificant.
(L) Research and Development
Revenue expenditure pertaining to reserch is charged to Statement of Profit and Loss. Development costs of products
expenses are capitalized when the Company is certain to recover the development cost from future economic benefits.
Property, plant and equipment utilized for research and development are capitalized and depreciated/amortised in
accordance with the policies stated for property, plant and equipment & intangible assets.
(M) Employee Benefits
Short Term Employee Benefits:
All employee benefits payable wholly within twelve months of rendering the service are classified as short term employee
benefits and they are recognized in the period in which the employee renders the related service. These benefits include
salaries and wages, bonus etc. The Company recognizes the undiscounted amount of short term employee benefits
expected to be paid in exchange for services rendered as a liability (accrued expense) after deducting any amount already
paid.
Post Employment Benefits:
Provident Fund & Employee State Insurance
Retirement Benefits in the form of Provident Fund and ESI schemes are a defined contribution plans as the Company
does not carry any further obligations, apart from the contributions made on a monthly basis and the contributions are
charged to Statement of Profit & Loss of the year when the contributions to the respective funds are due.
Earned Leave
Leave encashment is applicable to all permanent and full time employees of the company and is provided for on the
basis of actuarial valuation made at the end of each financial year using Projected Unit Credit Method. The present value
of the defined benefit obligation is determined by discounting the estimated future cash outflows using interest rates of
government bonds. Actuarial gains and losses arising from experience adjustments and changes in actuarial assumptions
are recognised in the statement of profit or loss in the period in which they arise. Past-service costs are recognised
immediately in statement of profit or loss.
Notes to the Financial Statements for the year ended 31.03.2019

108 | Fiem Industries Limited
Gratuity
The Company provides for gratuity, a defined benefit plan (the “Gratuity Plan”) covering eligible employees in accordance
with the Payment of Gratuity Act, 1972. The Gratuity Plan provides a lump sum payment to vested employees at retirement,
death, incapacitation or termination of employment, of an amount based on the respective employee’s salary and the
tenure of employment. The gratuity plan in Company is funded through annual contributions to Exide Life Insurance
Company under its Company’s Gratuity Scheme.
The liability or asset recognised in the balance sheet in respect of defined benefit gratuity plans is the present value of the
defined benefit obligation at the end of the reporting period less the fair value of plan assets. The Company’s liability is
actuarially determined (using the Projected Unit Credit method) at the end of each year. The present value of the defined
benefit obligation is determined by discounting the estimated future cash outflows using interest rates of government
bonds. Remeasurement gains and losses arising from experience adjustments and changes in actuarial assumptions
are charged or credited to equity in other comprehensive income in the period in which they arise. They are included
in retained earnings in the statement of changes in equity and in the balance sheet. Past-service costs are recognised
immediately in statement of profit or loss.
(N) Provisions and Contingent Liabilities
Provision
A provision is recognized when the Company has a present obligation as a result of past event, and it is probable that
an outflow of resources will be required to settle the obligation, in respect of which reliable estimate can be made. The
estimated liability for product warranties is recorded when products are sold based on technical evaluation.
Provisions are measured at the present value of management's best estimate of the expenditure required to settle the
present obligation at the end of the reporting period. The discount rate used to determine the present value is a pre-tax
rate the reflects current market assessment of the time value of money and the risk specific to the liability. The increase
in the provision due to the passage of time is recognised as interest expenses.
Contingent Liabilities
Wherever there is a possible obligation that arises from past events and whose existence will be confirmed only by the
occurrence or non-occurrence of one or more uncertain future events not wholly within the control of the entity or
a present obligation that arises from past events but is not recognised because (a) it is not probable that an outflow of
resources embodying economic benefits will be required to settle the obligation; or (b) the amount of the obligation
cannot be measured with sufficient reliability. Show cause notices are not considered as Contingent Liabilities unless
converted into demand.
(O) Taxation
Income Tax expense represent the sum of the tax currently payable and deferred tax
Current Income Tax
The tax currently payable is based on taxable profit for the year. Taxable profit differs from profit before tax as reported
in the statement of profit and loss because of income or expense that are taxable or deductible in other years and items
that are never taxable or deductible. The Company's current tax is calculated using tax rates that have been enacted
or substantively enacted by the end of the reporting period. Advance taxes and provisions for current income taxes
are presented in the balance sheet after off-setting advance tax paid and income tax provision arising in the same tax
jurisdiction and where the relevant tax paying unit intends to settle the asset and liability on a net basis.
Deferred Income Tax
Deferred income tax is recognised using the balance sheet approach. Deferred Tax is recognised on temporary differences
Notes to the Financial Statements for the year ended 31.03.2019

Annual Report 2018-19 | 109
between the carrying amounts of assets and liabilities in the financial statements and the corrosponding tax base used
in the computation of taxable profit. Deferred tax liabilities are generally recognised for all taxable temporary differences.
Deferred tax assets are generally recognised for all deductible temporary differences to the extent it is probable that
taxable profits will be available against which those deductible temporary differences can be utilised.
The carrying amount of deferred tax assets is reviewed at the end of each reporting period and reduced to the extent that
it is no longer probable that sufficient taxable profits will be available to allow all or part of the asset to be recovered.
Deferred tax liabilities and assets are measured at the tax rates that are expected to apply in the period in which the
liability is settled or the asset relised, based on tax rates (and tax laws) that have been enacted or substantively enacted
by the end of the reporting period.
The mesurement of deferred tax liabilities and assets reflects the tax consequences that would follow from the manner
in which the Company expects, at the end of the reporting period, to recover or settle the carrying amount of its assets
and liabilities.
Deferred tax liabilities and assets are offset when they relate to income taxes levied by the same taxation authority and
the relevant entilty intends and has ability to settle its current tax assets and liabilities on a net basis.
Deferred tax assets include Minimum Alternate Tax (MAT) paid in accordance with the tax laws in India, which is likely to
give future econmic benefits in the form of availability of set off against future income tax liability. Accordingly, MAT is
recognised as deferred tax asset in the balance sheet when the asset can be measured reliably and it is probable that the
future economic benefit associated with the asset will be realised.
Current and Deferred Tax For The Year
Current and deferred tax are recognised in profit or loss, except when they relate to item that are recognised in other
comprehensive income or directly in equity, in which case, the current and deferred tax are also recognised in other
comprehensive income or directly in equity repectively.
(P) Borrowing Cost
Borrowing costs are interest and other costs that incurs in connection with the borrowing of funds and include interest
expense calculated using the effective interest method as described in Ind AS 39 Financial Instruments: Recognition
and Measurement, exchange differences arising from foreign currency borrowings to the extent they are regarded as an
adjustment to the interest cost.
Borrowing costs in connection with the borrowing of funds to the extent not directly related to the acquisition of
qualifying assets are charged to the Statement of Profit and Loss.
Borrowing costs, allocated to and utilised for qualifying assets, pertaining to the period from commencement of activities
relating to construction / development of the qualifying asset up to the date of capitalisation of such asset is added to the
cost of the assets.
For general borrowing used for the purpose of obtaining a qualifying asset, the amount of borrowing costs eligible for
capitalization is determined by applying a capitalization rate to the expenditures on that asset. The capitalization rate is
the weighted average of the borrowing costs applicable to the borrowings of the Company that are outstanding during
the period, other than borrowings made specifically for the purpose of obtaining a qualifying asset. The amount of
borrowing costs capitalized during a period does not exceed the amount of borrowing cost incurred during that period.
Capitalisation of borrowing costs is suspended and charged to the Statement of Profit and Loss during extended periods
when active development activity on the qualifying assets is interrupted.
Notes to the Financial Statements for the year ended 31.03.2019
110 | Fiem Industries Limited
(Q) Impairment
Assets are tested for impairment whenever events or changes in circumstances indicate that the carrying amount may
not be recoverable. An impairment loss is recognised for the amount by which the assets's carrying amount exceeds
its recoverable amount. The recoverable amount is the higher of an assets's fair value less costs of disposal and value
in use. For the purpose of assesssing impairment, assets are grouped at the lowest levels for which there are separately
identifiable cash inflows which are largely independent of cash inflows from other assets or groups of assets (cash
generating units). Non-financial assets other than goodwill that suffuered an impairment are reviewed for possible
reversal of the impairment at the end of each reporting period.
(R) Cash Flow Statement
The Cash Flow Statement is prepared by the indirect method set out in Ind AS-7 on Cash Flow Statements and presents
cash flows by operating, investing and financing activities of the Company.
(S) Derivatives Instruments and Hedge Accounting
The Company enters into derivatives contracts in the nature of foreign currency swaps, currency options, forward
contracts etc. to hedge its exposure to movements in foreign exchange rates. The use of these contracts reduces the
risk or cost to the Company and the Company does not use those for trading or speculative purposes.
(T) Segment Reporting
Operating segments are reported in a manner consistent with the internal reporting provided to the Core Management
Committee which includes the Managing Director who is the Chief Operating Decision Maker. The Core Management
Committee examines performance both from product and a geographical perspective. The Company has identified two
reportable business segments viz. Automotive and LED Luminaries Segment on the basis of the nature of products, the
risk and return profile of individual business and the internal business reporting systems.
(U) Lease
Leases other than finance lease, are operating leases, and the such assets are not recognized on the Company’s balance
sheet. Payments under operating leases are recognized in statement of operations on a straight-line-basis over the term
of the lease.
(V) Dividend on Equity Share
Final dividends on equity shares are recorded on the date of approval by the shareholders of the Company.
(W) Earnings Per Share
The Basic and Diulated Earnings Per Share ("EPS") is computed by dividing the profit after tax (loss) for the year by
weighted average number of equity shares outstanding during the year. For the purpose of calculating diluted earning
per share, the net profit (loss) for the year attributable to equity shareholder and the weighted average number of share
outstanding during the year are adjusted for the effect of all dilutive potential equity shares. The weighted average
number of shares outstanding during the year are adjusted for events of bonus issue and share split, if any.
Notes to the Financial Statements for the year ended 31.03.2019
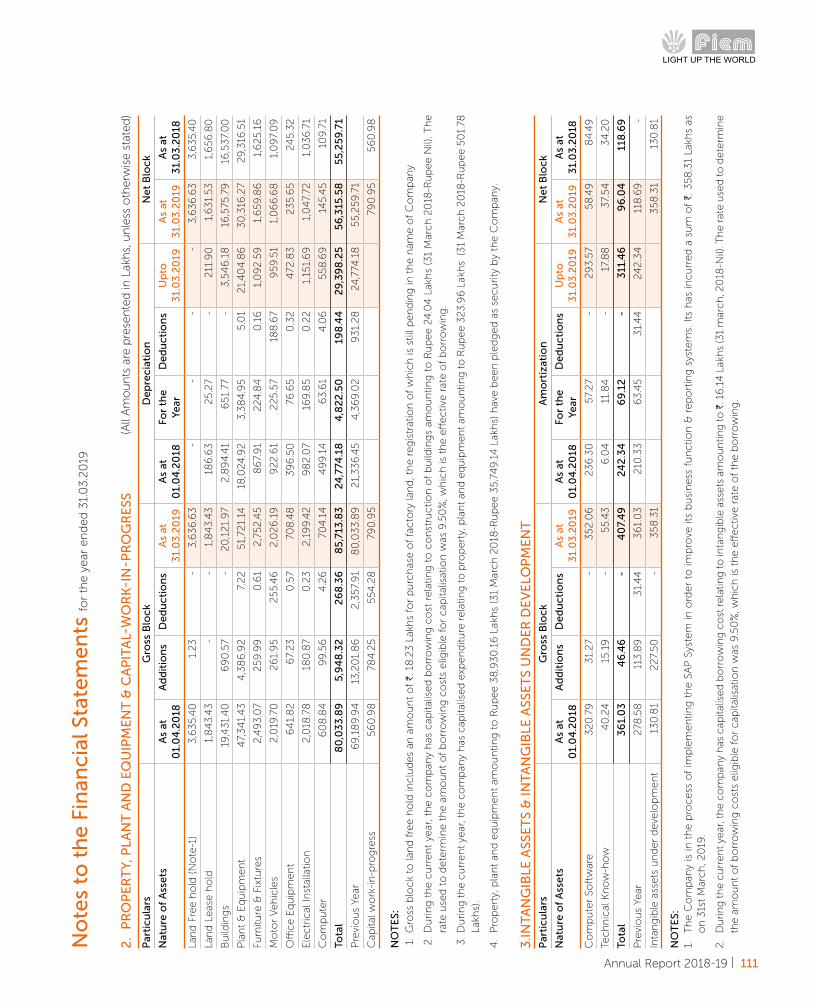
Annual Report 2018-19 | 111
No
tes
to t
he
Fin
anci
al S
tate
me
nts
for
the y
ear
en
ded
31.
03.
20
19
2.
PR
OP
ER
TY,
PLA
NT
AN
D E
QU
IPM
EN
T &
CA
PIT
AL-
WO
RK
-IN
-PR
OG
RE
SS(A
ll A
mo
un
ts a
re p
rese
nte
d in
Lak
hs,
un
less
oth
erw
ise s
tate
d)
Par
ticu
lars
Gro
ss B
lock
De
pre
ciat
ion
Ne
t B
lock
Nat
ure
of
Ass
ets
As
at
01.
04
.20
18A
dd
itio
ns
De
du
ctio
ns
As
at
31.
03
.20
19A
s at
0
1.0
4.2
018
For
the
Ye
arD
ed
uct
ion
sU
pto
3
1.0
3.2
019
As
at
31.
03
.20
19A
s at
3
1.0
3.2
018
Lan
d F
ree h
old
(N
ote
-1)
3,6
35.
40
1
.23
-
3
,63
6.6
3
-
-
-
-
3,6
36
.63
3
,63
5.4
0
Lan
d L
eas
e h
old
1,8
43.
43
-
-
1
,84
3.4
3
18
6.6
3
25.
27
-
211
.90
1,6
31.
53
1
,65
6.8
0
Bu
ildin
gs
19,4
31.
40
6
90
.57
-
20
,12
1.9
7 2
,89
4.4
1 6
51.
77
-
3,5
46
.18
16
,575
.79
1
6,5
37.
00
Pla
nt
& E
qu
ipm
en
t 4
7,3
41.
43
4
,38
6.9
2
7.2
2
51,
721.
14
18
,024
.92
3
,38
4.9
5
5.0
1 2
1,4
04
.86
30
,316
.27
29,3
16.5
1
Furn
iture
& F
ixtu
res
2,4
93.
07
25
9.9
9
0.6
1 2
,75
2.4
5
86
7.9
1 2
24.8
4
0.1
6
1,0
92
.59
1
,65
9.8
6
1,6
25.
16
Mo
tor
Veh
icle
s 2
,019
.70
2
61.
95
2
55.
46
2
,02
6.1
9
92
2.6
1 2
25.
57
18
8.6
7 9
59.5
1 1
,06
6.6
8
1,0
97.
09
Offi
ce E
qu
ipm
en
t 6
41.
82
6
7.2
3
0.5
7 7
08
.48
3
96
.50
7
6.6
5
0.3
2
472
.83
2
35.
65
2
45.
32
Ele
ctr
ical
Inst
alla
tion
2,0
18.7
8
18
0.8
7 0
.23
2
,19
9.4
2
98
2.0
7 1
69.8
5
0.2
2
1,1
51.
69
1
,04
7.72
1
,03
6.7
1
Co
mp
ute
r 6
08
.84
9
9.5
6
4.2
6
70
4.1
4
49
9.1
4
63.
61
4.0
65
58
.69
14
5.4
5
10
9.7
1
Tota
l 8
0,0
33
.89
5
,94
8.3
2
26
8.3
6
85
,713
.83
2
4,7
74.1
8
4,8
22
.50
19
8.4
4 2
9,3
98
.25
5
6,3
15.5
8
55
,25
9.7
1
Pre
vio
us
Year
6
9,1
89.9
4
13,
20
1.8
6
2,3
57.
91
80
,03
3.8
9
21,
33
6.4
5
4,3
69.0
2
93
1.2
8
24
,774
.18
5
5,2
59.7
1
Cap
ital w
ork
-in
-pro
gre
ss
56
0.9
8
78
4.2
5
55
4.2
8
79
0.9
5
79
0.9
5
56
0.9
8
NO
TE
S:
1.
Gro
ss b
lock
to la
nd
fre
e h
old
inclu
des
an a
mo
un
t o
f H. 1
8.2
3 L
akh
s fo
r p
urc
has
e o
f fa
cto
ry la
nd
, th
e r
eg
istr
atio
n o
f w
hic
h is
stil
l pen
din
g in
th
e n
ame o
f C
om
pan
y
2.
Du
rin
g t
he c
urr
en
t ye
ar, t
he c
om
pan
y h
as c
apita
lised
bo
rro
win
g c
ost
rela
ting
to
co
nst
ructio
n o
f b
uild
ing
s am
ou
ntin
g t
o R
up
ee 2
4.0
4 L
akh
s (3
1 M
arch
20
18-R
up
ee N
il). T
he
rate
use
d t
o d
ete
rmin
e t
he a
mo
un
t o
f b
orr
ow
ing
co
sts
elig
ible
fo
r cap
italis
atio
n w
as 9
.50
%, w
hic
h is
th
e e
ffectiv
e r
ate o
f b
orr
ow
ing
.
3.
Du
rin
g t
he c
urr
en
t ye
ar, t
he c
om
pan
y h
as c
apita
lised
exp
en
ditu
re r
ela
ting
to
pro
pert
y, p
lan
t an
d e
qu
ipm
en
t am
ou
ntin
g t
o R
up
ee 3
23.
96
Lak
hs
(31
Mar
ch
20
18-R
up
ee 5
01.
78
Lakh
s).
4.
Pro
pert
y, p
lan
t an
d e
qu
ipm
en
t am
ou
ntin
g t
o R
up
ee 3
8,9
30
.16
Lak
hs
(31
Mar
ch
20
18-R
up
ee 3
5,74
9.1
4 L
akh
s) h
ave b
een
ple
dg
ed
as
secu
rity
by
the C
om
pan
y.
3.IN
TAN
GIB
LE A
SSE
TS
& IN
TAN
GIB
LE A
SSE
TS
UN
DE
R D
EV
ELO
PM
EN
TP
arti
cula
rsG
ross
Blo
ckA
mo
rtiz
atio
nN
et
Blo
ck
Nat
ure
of
Ass
ets
As
at
01.
04
.20
18A
dd
itio
ns
De
du
ctio
ns
As
at
31.
03
.20
19A
s at
0
1.0
4.2
018
For
the
Ye
arD
ed
uct
ion
sU
pto
3
1.0
3.2
019
As
at
31.
03
.20
19A
s at
3
1.0
3.2
018
Co
mp
ute
r So
ftw
are
32
0.7
9
31.
27
-
35
2.0
6
23
6.3
0
57.
27
-
29
3.5
7 5
8.4
9
84
.49
Tech
nic
al K
no
w-h
ow
40
.24
1
5.19
-
5
5.4
3
6.0
4
11.
84
-
1
7.8
8
37.
54
3
4.2
0
Tota
l 3
61.
03
4
6.4
6
-
40
7.4
9
24
2.3
4
69
.12
-
3
11.4
6
96
.04
1
18.6
9
Pre
vio
us
Year
2
78.5
8
113
.89
3
1.4
4
36
1.0
3
210
.33
6
3.4
5
31.
44
2
42
.34
1
18.6
9
-
Inta
ng
ible
ass
ets
un
der
deve
lop
men
t 1
30
.81
22
7.5
0
-
35
8.3
1 3
58
.31
13
0.8
1
NO
TE
S:
1.
Th
e C
om
pan
y is
in t
he p
r ocess
of
imp
lem
en
ting
th
e S
AP
Sys
tem
in o
rder
to im
pro
ve it
s b
usi
ness
fu
nctio
n &
rep
ort
ing
sys
tem
s. I
ts h
as in
cu
rred
a s
um
of
H. 3
58
.31
Lakh
s as
o
n 3
1st
Mar
ch
, 20
19.
2.
Du
rin
g th
e c
urr
en
t ye
ar, t
he c
om
pan
y h
as c
apita
lised
bo
rro
win
g c
ost
rela
ting
to
inta
ng
ible
ass
ets
am
ou
ntin
g to
H. 1
6.1
4 L
akh
s (3
1 m
arch
, 20
18-N
il). T
he r
ate u
sed
to
dete
rmin
e
the a
mo
un
t o
f b
orr
ow
ing
co
sts
elig
ible
fo
r cap
italis
atio
n w
as 9
.50
%, w
hic
h is
th
e e
ffectiv
e r
ate o
f th
e b
orr
ow
ing
.
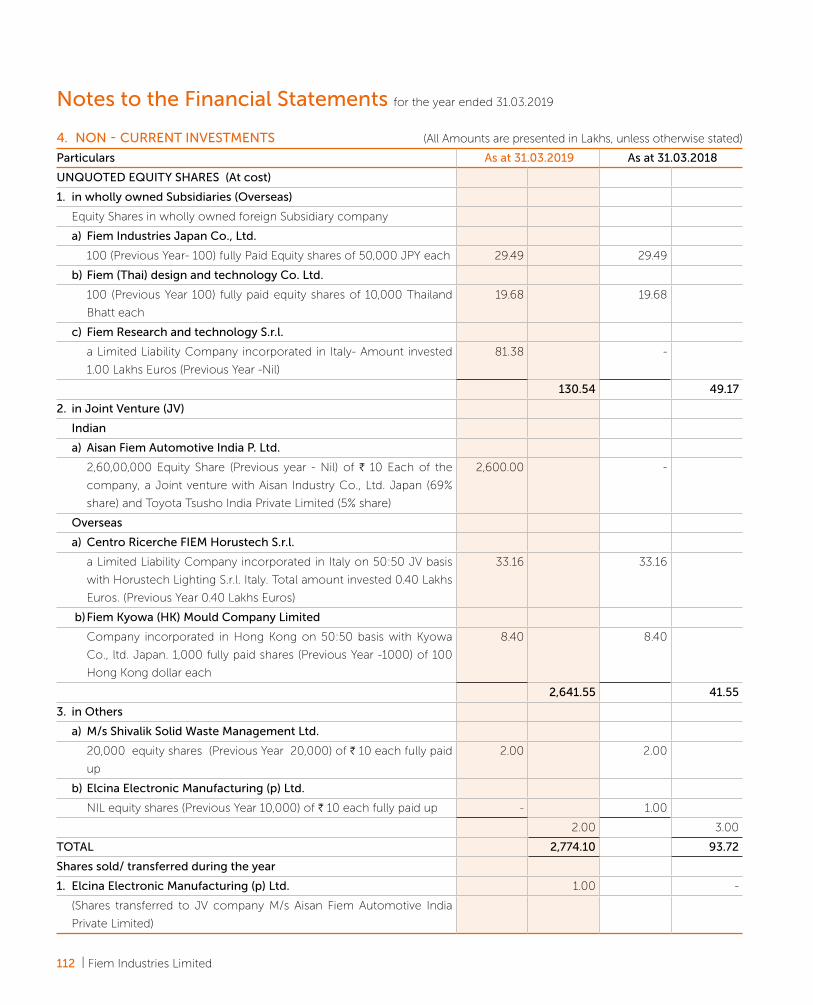
112 | Fiem Industries Limited
Notes to the Financial Statements for the year ended 31.03.2019
4. NON - CURRENT INVESTMENTS
Particulars As at 31.03.2019 As at 31.03.2018
UNQUOTED EQUITY SHARES (At cost)
1. in wholly owned Subsidiaries (Overseas)
Equity Shares in wholly owned foreign Subsidiary company
a) Fiem Industries Japan Co., Ltd.
100 (Previous Year- 100) fully Paid Equity shares of 50,000 JPY each 29.49 29.49
b) Fiem (Thai) design and technology Co. Ltd.
100 (Previous Year 100) fully paid equity shares of 10,000 Thailand
Bhatt each
19.68 19.68
c) Fiem Research and technology S.r.l.
a Limited Liability Company incorporated in Italy- Amount invested
1.00 Lakhs Euros (Previous Year -Nil)
81.38 -
130.54 49.17
2. in Joint Venture (JV)
Indian
a) Aisan Fiem Automotive India P. Ltd.
2,60,00,000 Equity Share (Previous year - Nil) of H 10 Each of the
company, a Joint venture with Aisan Industry Co., Ltd. Japan (69%
share) and Toyota Tsusho India Private Limited (5% share)
2,600.00 -
Overseas
a) Centro Ricerche FIEM Horustech S.r.l.
a Limited Liability Company incorporated in Italy on 50:50 JV basis
with Horustech Lighting S.r.l. Italy. Total amount invested 0.40 Lakhs
Euros. (Previous Year 0.40 Lakhs Euros)
33.16 33.16
b) Fiem Kyowa (HK) Mould Company Limited
Company incorporated in Hong Kong on 50:50 basis with Kyowa
Co., ltd. Japan. 1,000 fully paid shares (Previous Year -1000) of 100
Hong Kong dollar each
8.40 8.40
2,641.55 41.55
3. in Others
a) M/s Shivalik Solid Waste Management Ltd.
20,000 equity shares (Previous Year 20,000) of H 10 each fully paid
up
2.00 2.00
b) Elcina Electronic Manufacturing (p) Ltd.
NIL equity shares (Previous Year 10,000) of H 10 each fully paid up - 1.00
2.00 3.00
TOTAL 2,774.10 93.72
Shares sold/ transferred during the year
1. Elcina Electronic Manufacturing (p) Ltd. 1.00 -
(Shares transferred to JV company M/s Aisan Fiem Automotive India
Private Limited)
(All Amounts are presented in Lakhs, unless otherwise stated)
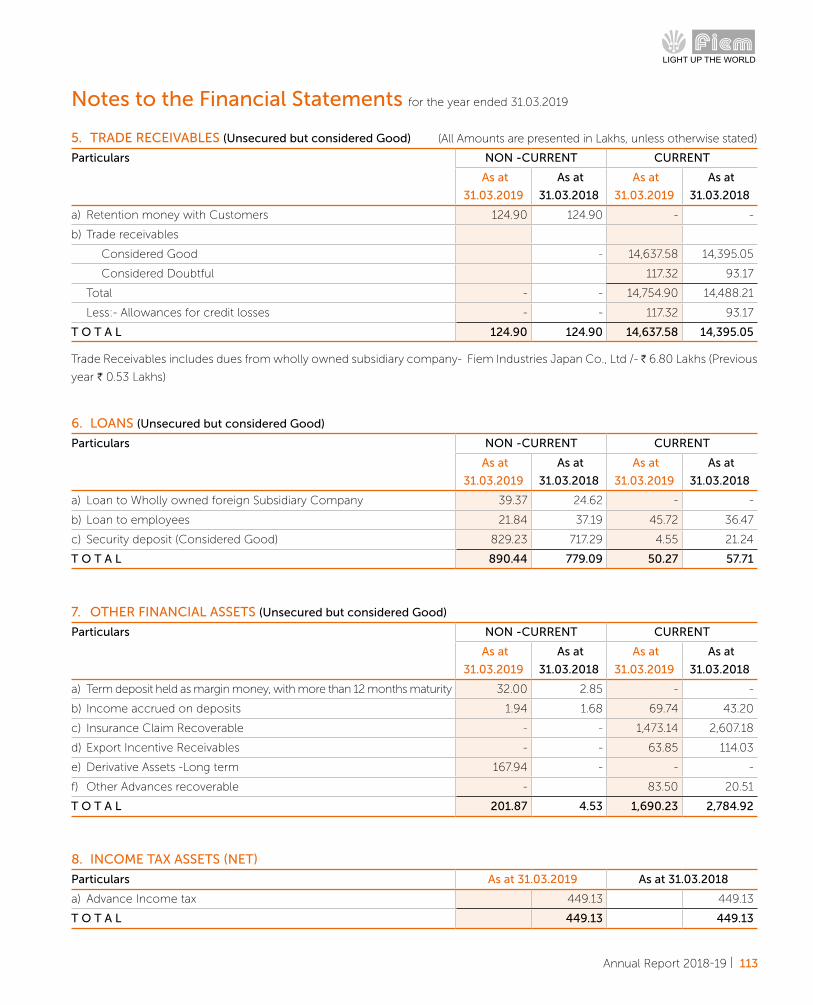
Annual Report 2018-19 | 113
Notes to the Financial Statements for the year ended 31.03.2019
5. TRADE RECEIVABLES (Unsecured but considered Good)
Particulars NON -CURRENT CURRENT
As at
31.03.2019
As at
31.03.2018
As at
31.03.2019
As at
31.03.2018
a) Retention money with Customers 124.90 124.90 - -
b) Trade receivables
Considered Good - 14,637.58 14,395.05
Considered Doubtful 117.32 93.17
Total - - 14,754.90 14,488.21
Less:- Allowances for credit losses - - 117.32 93.17
T O T A L 124.90 124.90 14,637.58 14,395.05
Trade Receivables includes dues from wholly owned subsidiary company- Fiem Industries Japan Co., Ltd /- H 6.80 Lakhs (Previous
year H 0.53 Lakhs)
6. LOANS (Unsecured but considered Good)
Particulars NON -CURRENT CURRENT
As at
31.03.2019
As at
31.03.2018
As at
31.03.2019
As at
31.03.2018
a) Loan to Wholly owned foreign Subsidiary Company 39.37 24.62 - -
b) Loan to employees 21.84 37.19 45.72 36.47
c) Security deposit (Considered Good) 829.23 717.29 4.55 21.24
T O T A L 890.44 779.09 50.27 57.71
8. INCOME TAX ASSETS (NET)
Particulars As at 31.03.2019 As at 31.03.2018
a) Advance Income tax 449.13 449.13
T O T A L 449.13 449.13
7. OTHER FINANCIAL ASSETS (Unsecured but considered Good)
Particulars NON -CURRENT CURRENT
As at
31.03.2019
As at
31.03.2018
As at
31.03.2019
As at
31.03.2018
a) Term deposit held as margin money, with more than 12 months maturity 32.00 2.85 - -
b) Income accrued on deposits 1.94 1.68 69.74 43.20
c) Insurance Claim Recoverable - - 1,473.14 2,607.18
d) Export Incentive Receivables - - 63.85 114.03
e) Derivative Assets -Long term 167.94 - - -
f) Other Advances recoverable - 83.50 20.51
T O T A L 201.87 4.53 1,690.23 2,784.92
(All Amounts are presented in Lakhs, unless otherwise stated)

114 | Fiem Industries Limited
Notes to the Financial Statements for the year ended 31.03.2019
9. OTHER ASSETS (Unsecured but considered Good)
Particulars NON -CURRENT CURRENT
As at
31.03.2019
As at
31.03.2018
As at
31.03.2019
As at
31.03.2018
a) Capital Advances 821.39 1,138.74 - -
b) Advances other than capital advances
i) Advances to Suppliers - - 1,659.41 811.83
ii) Balance with Customs, Excise or GST departments - - 237.80 537.89
iii) Prepaid Expenses 9.99 4.56 194.72 138.88
iv) Other Advances/claims recoverable in cash or in kind - - - 28.02
T O T A L 831.39 1,143.29 2,091.92 1,516.62
10. INVENTORIES (As per Inventory taken valued & certified by the management and valued at lower of cost or net realisable value)
Particulars As at 31.03.2019 As at 31.03.2018
a) Raw Materials and Components 6,878.32 6,663.76
b) Raw Materials and Components in transit - 53.01
c) Work in Progress 3,555.53 3,882.22
d) Finished Goods 3,953.54 3,134.68
e) Stock in trade (Others) 0.08 0.14
f) Stores and Spares (including Packing Material) 336.74 293.11
g) Stores and Spares (including Packing Material) in transit - 0.18
14,724.21 14,027.11
T O T A L 14,724.21 14,027.11
11. CURRENT INVESTMENTS
Particulars As at 31.03.2019 As at 31.03.2018
INVESTMENT IN LIQUID MUTUAL FUNDS (QUOTED)
1. KOTAK INCOME OPPORTUNITIES-REGULAR PLAN (GROWTH) - 1,909.56
(NIL UNIT AS ON 31.03.19 (Previous year 99,84,448.177 Unit as on
31.03.18, face Value of H 10 each)
- 1,909.56
Aggregate value of unquoted investments - -
Aggregate value of quoted investments - 1,909.56
Market value of quoted investments - 1,909.56
Aggregate value of diminution other than temporary in value of
investments
- -
(All Amounts are presented in Lakhs, unless otherwise stated)
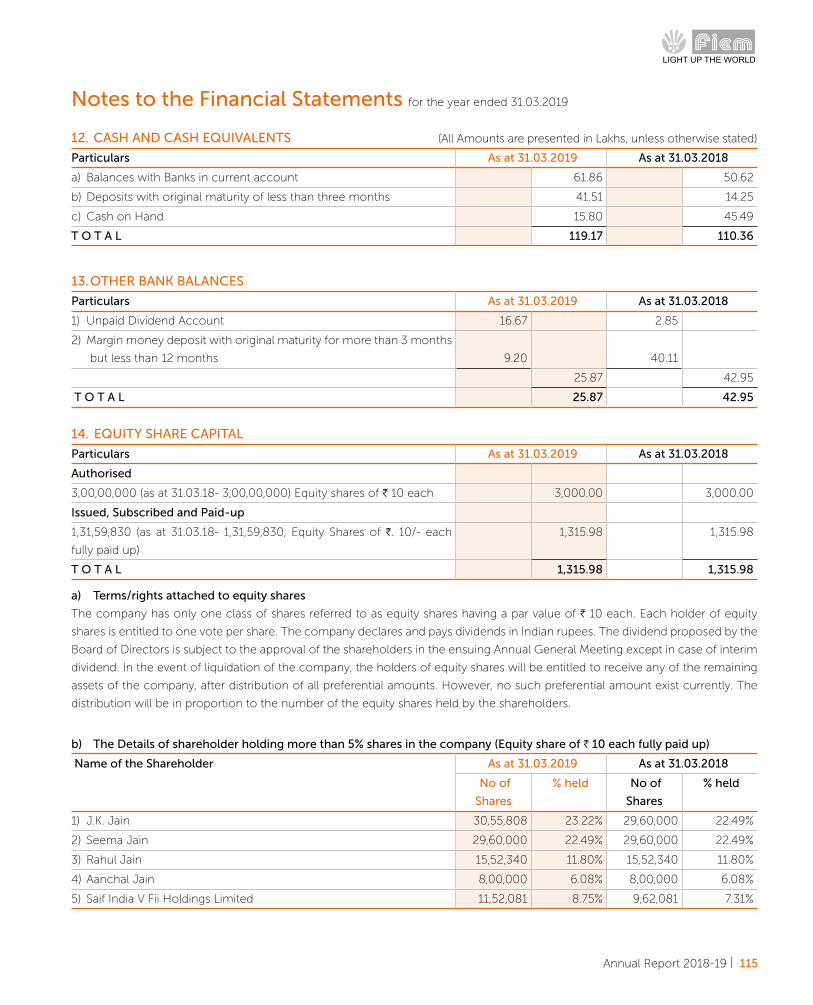
Annual Report 2018-19 | 115
Notes to the Financial Statements for the year ended 31.03.2019
a) Terms/rights attached to equity shares
The company has only one class of shares referred to as equity shares having a par value of H 10 each. Each holder of equity
shares is entitled to one vote per share. The company declares and pays dividends in Indian rupees. The dividend proposed by the
Board of Directors is subject to the approval of the shareholders in the ensuing Annual General Meeting except in case of interim
dividend. In the event of liquidation of the company, the holders of equity shares will be entitled to receive any of the remaining
assets of the company, after distribution of all preferential amounts. However, no such preferential amount exist currently. The
distribution will be in proportion to the number of the equity shares held by the shareholders.
12. CASH AND CASH EQUIVALENTS
Particulars As at 31.03.2019 As at 31.03.2018
a) Balances with Banks in current account 61.86 50.62
b) Deposits with original maturity of less than three months 41.51 14.25
c) Cash on Hand 15.80 45.49
T O T A L 119.17 110.36
14. EQUITY SHARE CAPITAL
Particulars As at 31.03.2019 As at 31.03.2018
Authorised
3,00,00,000 (as at 31.03.18- 3,00,00,000) Equity shares of H 10 each 3,000.00 3,000.00
Issued, Subscribed and Paid-up
1,31,59,830 (as at 31.03.18- 1,31,59,830, Equity Shares of H. 10/- each
fully paid up)
1,315.98 1,315.98
T O T A L 1,315.98 1,315.98
13. OTHER BANK BALANCES
Particulars As at 31.03.2019 As at 31.03.2018
1) Unpaid Dividend Account 16.67 2.85
2) Margin money deposit with original maturity for more than 3 months
but less than 12 months 9.20 40.11
25.87 42.95
T O T A L 25.87 42.95
b) The Details of shareholder holding more than 5% shares in the company (Equity share of H 10 each fully paid up)
Name of the Shareholder As at 31.03.2019 As at 31.03.2018
No of
Shares
% held No of
Shares
% held
1) J.K. Jain 30,55,808 23.22% 29,60,000 22.49%
2) Seema Jain 29,60,000 22.49% 29,60,000 22.49%
3) Rahul Jain 15,52,340 11.80% 15,52,340 11.80%
4) Aanchal Jain 8,00,000 6.08% 8,00,000 6.08%
5) Saif India V Fii Holdings Limited 11,52,081 8.75% 9,62,081 7.31%
(All Amounts are presented in Lakhs, unless otherwise stated)
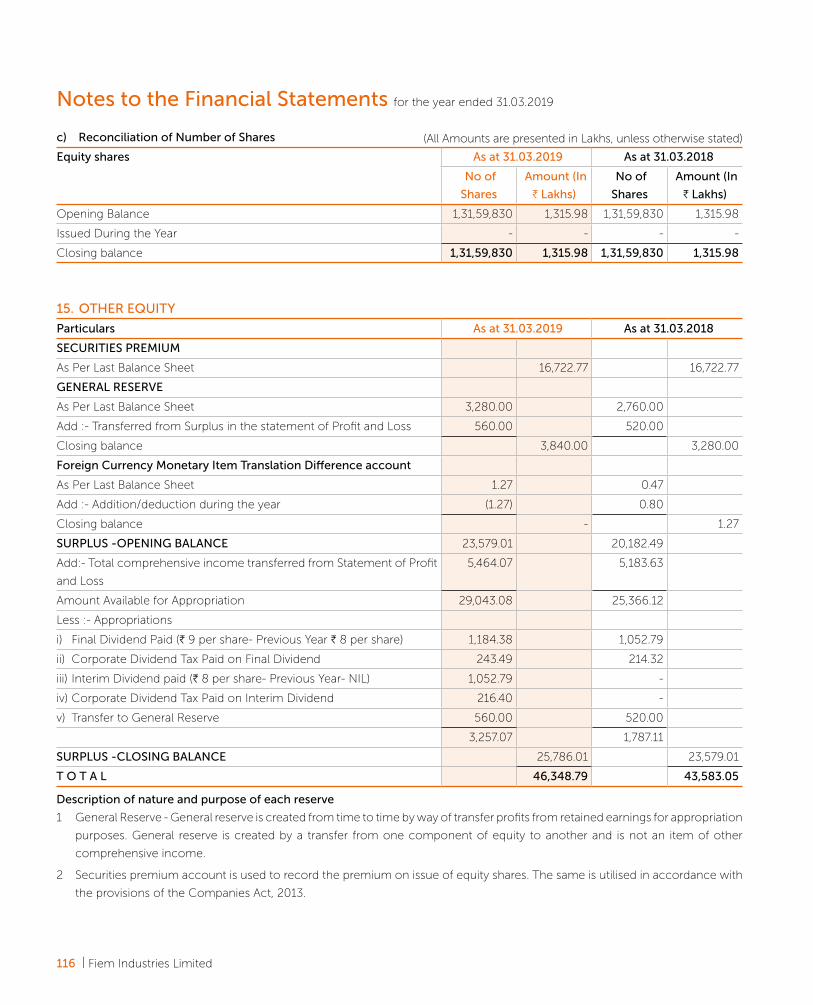
116 | Fiem Industries Limited
c) Reconciliation of Number of Shares
Equity shares As at 31.03.2019 As at 31.03.2018
No of
Shares
Amount (In
H Lakhs)
No of
Shares
Amount (In
H Lakhs)
Opening Balance 1,31,59,830 1,315.98 1,31,59,830 1,315.98
Issued During the Year - - - -
Closing balance 1,31,59,830 1,315.98 1,31,59,830 1,315.98
15. OTHER EQUITY
Particulars As at 31.03.2019 As at 31.03.2018
SECURITIES PREMIUM
As Per Last Balance Sheet 16,722.77 16,722.77
GENERAL RESERVE
As Per Last Balance Sheet 3,280.00 2,760.00
Add :- Transferred from Surplus in the statement of Profit and Loss 560.00 520.00
Closing balance 3,840.00 3,280.00
Foreign Currency Monetary Item Translation Difference account
As Per Last Balance Sheet 1.27 0.47
Add :- Addition/deduction during the year (1.27) 0.80
Closing balance - 1.27
SURPLUS -OPENING BALANCE 23,579.01 20,182.49
Add:- Total comprehensive income transferred from Statement of Profit
and Loss
5,464.07 5,183.63
Amount Available for Appropriation 29,043.08 25,366.12
Less :- Appropriations
i) Final Dividend Paid (H 9 per share- Previous Year H 8 per share) 1,184.38 1,052.79
ii) Corporate Dividend Tax Paid on Final Dividend 243.49 214.32
iii) Interim Dividend paid (H 8 per share- Previous Year- NIL) 1,052.79 -
iv) Corporate Dividend Tax Paid on Interim Dividend 216.40 -
v) Transfer to General Reserve 560.00 520.00
3,257.07 1,787.11
SURPLUS -CLOSING BALANCE 25,786.01 23,579.01
T O T A L 46,348.79 43,583.05
Description of nature and purpose of each reserve
1 General Reserve - General reserve is created from time to time by way of transfer profits from retained earnings for appropriation
purposes. General reserve is created by a transfer from one component of equity to another and is not an item of other
comprehensive income.
2 Securities premium account is used to record the premium on issue of equity shares. The same is utilised in accordance with
the provisions of the Companies Act, 2013.
Notes to the Financial Statements for the year ended 31.03.2019
(All Amounts are presented in Lakhs, unless otherwise stated)
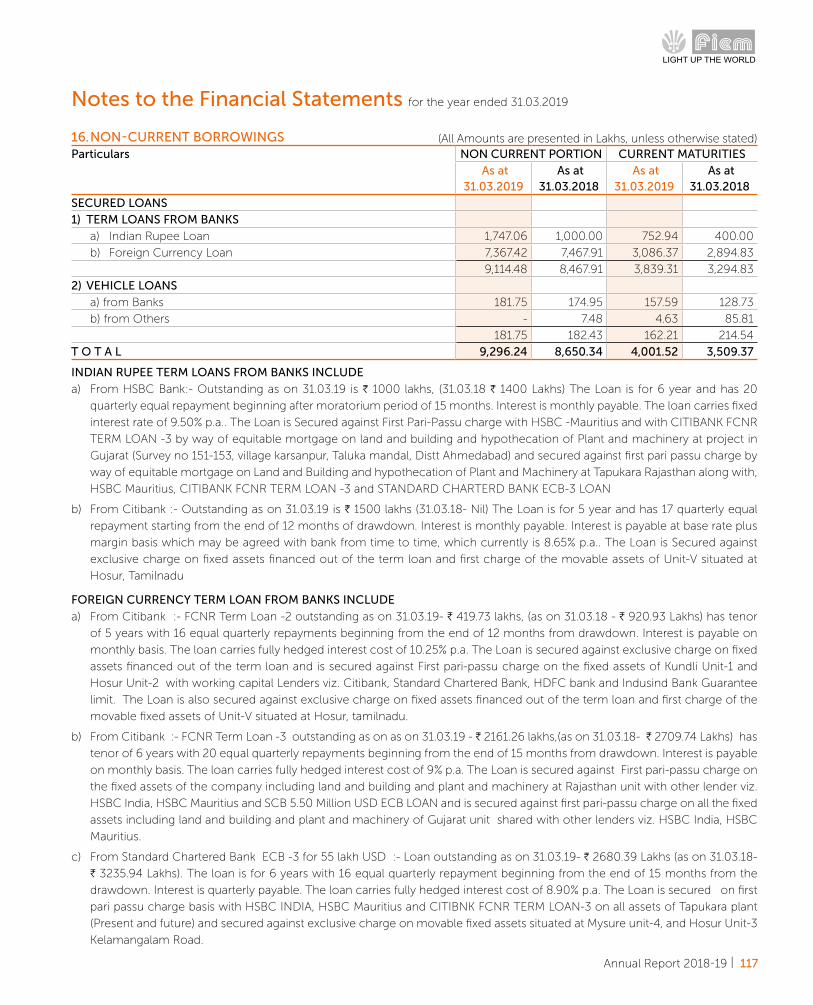
Annual Report 2018-19 | 117
16. NON-CURRENT BORROWINGS Particulars NON CURRENT PORTION CURRENT MATURITIES
As at 31.03.2019
As at 31.03.2018
As at 31.03.2019
As at 31.03.2018
SECURED LOANS
1) TERM LOANS FROM BANKS
a) Indian Rupee Loan 1,747.06 1,000.00 752.94 400.00
b) Foreign Currency Loan 7,367.42 7,467.91 3,086.37 2,894.83
9,114.48 8,467.91 3,839.31 3,294.83
2) VEHICLE LOANS
a) from Banks 181.75 174.95 157.59 128.73
b) from Others - 7.48 4.63 85.81
181.75 182.43 162.21 214.54
T O T A L 9,296.24 8,650.34 4,001.52 3,509.37
Notes to the Financial Statements for the year ended 31.03.2019
INDIAN RUPEE TERM LOANS FROM BANKS INCLUDE
a) From HSBC Bank:- Outstanding as on 31.03.19 is H 1000 lakhs, (31.03.18 H 1400 Lakhs) The Loan is for 6 year and has 20
quarterly equal repayment beginning after moratorium period of 15 months. Interest is monthly payable. The loan carries fixed
interest rate of 9.50% p.a.. The Loan is Secured against First Pari-Passu charge with HSBC -Mauritius and with CITIBANK FCNR
TERM LOAN -3 by way of equitable mortgage on land and building and hypothecation of Plant and machinery at project in
Gujarat (Survey no 151-153, village karsanpur, Taluka mandal, Distt Ahmedabad) and secured against first pari passu charge by
way of equitable mortgage on Land and Building and hypothecation of Plant and Machinery at Tapukara Rajasthan along with,
HSBC Mauritius, CITIBANK FCNR TERM LOAN -3 and STANDARD CHARTERD BANK ECB-3 LOAN
b) From Citibank :- Outstanding as on 31.03.19 is H 1500 lakhs (31.03.18- Nil) The Loan is for 5 year and has 17 quarterly equal
repayment starting from the end of 12 months of drawdown. Interest is monthly payable. Interest is payable at base rate plus
margin basis which may be agreed with bank from time to time, which currently is 8.65% p.a.. The Loan is Secured against
exclusive charge on fixed assets financed out of the term loan and first charge of the movable assets of Unit-V situated at
Hosur, Tamilnadu
FOREIGN CURRENCY TERM LOAN FROM BANKS INCLUDE
a) From Citibank :- FCNR Term Loan -2 outstanding as on 31.03.19- H 419.73 lakhs, (as on 31.03.18 - H 920.93 Lakhs) has tenor
of 5 years with 16 equal quarterly repayments beginning from the end of 12 months from drawdown. Interest is payable on
monthly basis. The loan carries fully hedged interest cost of 10.25% p.a. The Loan is secured against exclusive charge on fixed
assets financed out of the term loan and is secured against First pari-passu charge on the fixed assets of Kundli Unit-1 and
Hosur Unit-2 with working capital Lenders viz. Citibank, Standard Chartered Bank, HDFC bank and Indusind Bank Guarantee
limit. The Loan is also secured against exclusive charge on fixed assets financed out of the term loan and first charge of the
movable fixed assets of Unit-V situated at Hosur, tamilnadu.
b) From Citibank :- FCNR Term Loan -3 outstanding as on as on 31.03.19 - H 2161.26 lakhs,(as on 31.03.18- H 2709.74 Lakhs) has
tenor of 6 years with 20 equal quarterly repayments beginning from the end of 15 months from drawdown. Interest is payable
on monthly basis. The loan carries fully hedged interest cost of 9% p.a. The Loan is secured against First pari-passu charge on
the fixed assets of the company including land and building and plant and machinery at Rajasthan unit with other lender viz.
HSBC India, HSBC Mauritius and SCB 5.50 Million USD ECB LOAN and is secured against first pari-passu charge on all the fixed
assets including land and building and plant and machinery of Gujarat unit shared with other lenders viz. HSBC India, HSBC
Mauritius.
c) From Standard Chartered Bank ECB -3 for 55 lakh USD :- Loan outstanding as on 31.03.19- H 2680.39 Lakhs (as on 31.03.18-
H 3235.94 Lakhs). The loan is for 6 years with 16 equal quarterly repayment beginning from the end of 15 months from the
drawdown. Interest is quarterly payable. The loan carries fully hedged interest cost of 8.90% p.a. The Loan is secured on first
pari passu charge basis with HSBC INDIA, HSBC Mauritius and CITIBNK FCNR TERM LOAN-3 on all assets of Tapukara plant
(Present and future) and secured against exclusive charge on movable fixed assets situated at Mysure unit-4, and Hosur Unit-3
Kelamangalam Road.
(All Amounts are presented in Lakhs, unless otherwise stated)
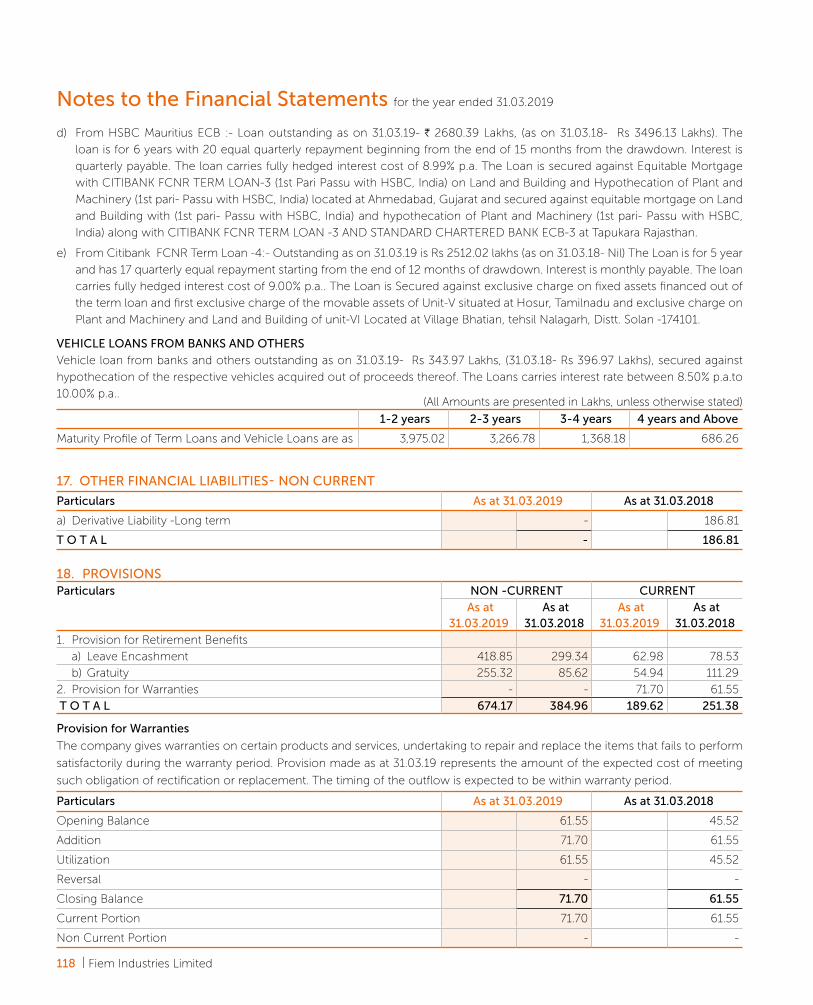
118 | Fiem Industries Limited
d) From HSBC Mauritius ECB :- Loan outstanding as on 31.03.19- H 2680.39 Lakhs, (as on 31.03.18- Rs 3496.13 Lakhs). The
loan is for 6 years with 20 equal quarterly repayment beginning from the end of 15 months from the drawdown. Interest is
quarterly payable. The loan carries fully hedged interest cost of 8.99% p.a. The Loan is secured against Equitable Mortgage
with CITIBANK FCNR TERM LOAN-3 (1st Pari Passu with HSBC, India) on Land and Building and Hypothecation of Plant and
Machinery (1st pari- Passu with HSBC, India) located at Ahmedabad, Gujarat and secured against equitable mortgage on Land
and Building with (1st pari- Passu with HSBC, India) and hypothecation of Plant and Machinery (1st pari- Passu with HSBC,
India) along with CITIBANK FCNR TERM LOAN -3 AND STANDARD CHARTERED BANK ECB-3 at Tapukara Rajasthan.
e) From Citibank FCNR Term Loan -4:- Outstanding as on 31.03.19 is Rs 2512.02 lakhs (as on 31.03.18- Nil) The Loan is for 5 year
and has 17 quarterly equal repayment starting from the end of 12 months of drawdown. Interest is monthly payable. The loan
carries fully hedged interest cost of 9.00% p.a.. The Loan is Secured against exclusive charge on fixed assets financed out of
the term loan and first exclusive charge of the movable assets of Unit-V situated at Hosur, Tamilnadu and exclusive charge on
Plant and Machinery and Land and Building of unit-VI Located at Village Bhatian, tehsil Nalagarh, Distt. Solan -174101.
VEHICLE LOANS FROM BANKS AND OTHERS
Vehicle loan from banks and others outstanding as on 31.03.19- Rs 343.97 Lakhs, (31.03.18- Rs 396.97 Lakhs), secured against
hypothecation of the respective vehicles acquired out of proceeds thereof. The Loans carries interest rate between 8.50% p.a.to
10.00% p.a..
Provision for Warranties
The company gives warranties on certain products and services, undertaking to repair and replace the items that fails to perform
satisfactorily during the warranty period. Provision made as at 31.03.19 represents the amount of the expected cost of meeting
such obligation of rectification or replacement. The timing of the outflow is expected to be within warranty period.
1-2 years 2-3 years 3-4 years 4 years and Above
Maturity Profile of Term Loans and Vehicle Loans are as 3,975.02 3,266.78 1,368.18 686.26
17. OTHER FINANCIAL LIABILITIES- NON CURRENT
Particulars As at 31.03.2019 As at 31.03.2018
a) Derivative Liability -Long term - 186.81
T O T A L - 186.81
Particulars As at 31.03.2019 As at 31.03.2018
Opening Balance 61.55 45.52
Addition 71.70 61.55
Utilization 61.55 45.52
Reversal - -
Closing Balance 71.70 61.55
Current Portion 71.70 61.55
Non Current Portion - -
Notes to the Financial Statements for the year ended 31.03.2019
18. PROVISIONS Particulars NON -CURRENT CURRENT
As at 31.03.2019
As at 31.03.2018
As at 31.03.2019
As at 31.03.2018
1. Provision for Retirement Benefits
a) Leave Encashment 418.85 299.34 62.98 78.53
b) Gratuity 255.32 85.62 54.94 111.29
2. Provision for Warranties - - 71.70 61.55
T O T A L 674.17 384.96 189.62 251.38
(All Amounts are presented in Lakhs, unless otherwise stated)
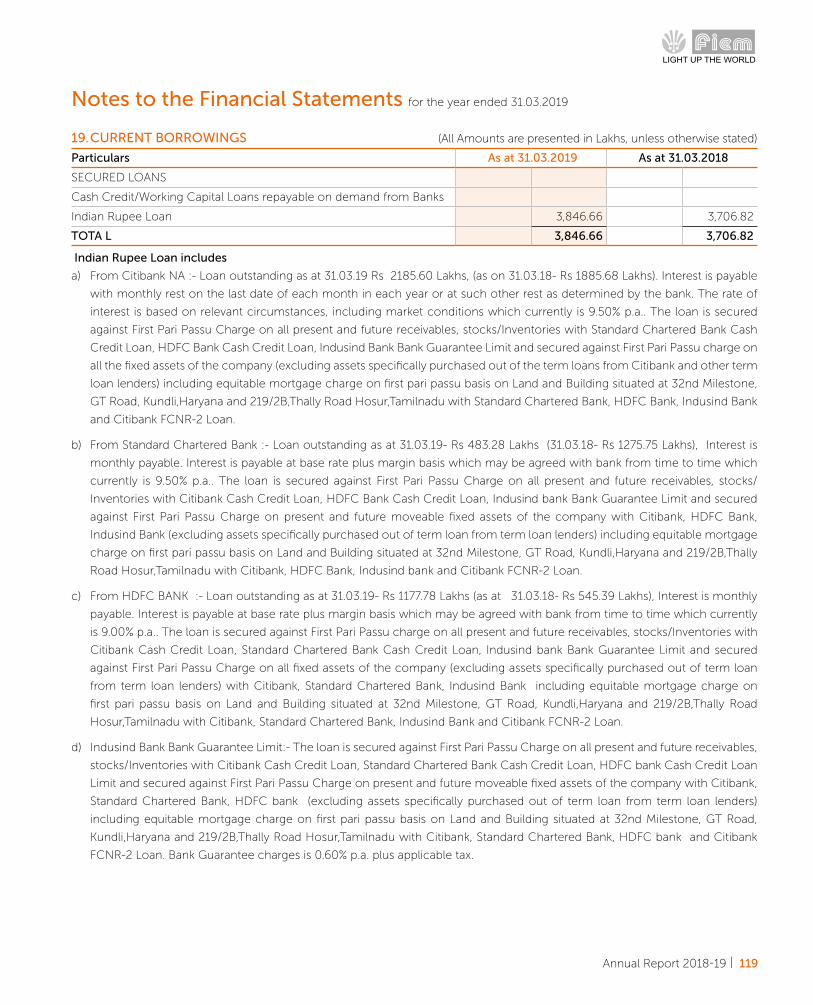
Annual Report 2018-19 | 119
Indian Rupee Loan includes
a) From Citibank NA :- Loan outstanding as at 31.03.19 Rs 2185.60 Lakhs, (as on 31.03.18- Rs 1885.68 Lakhs). Interest is payable
with monthly rest on the last date of each month in each year or at such other rest as determined by the bank. The rate of
interest is based on relevant circumstances, including market conditions which currently is 9.50% p.a.. The loan is secured
against First Pari Passu Charge on all present and future receivables, stocks/Inventories with Standard Chartered Bank Cash
Credit Loan, HDFC Bank Cash Credit Loan, Indusind Bank Bank Guarantee Limit and secured against First Pari Passu charge on
all the fixed assets of the company (excluding assets specifically purchased out of the term loans from Citibank and other term
loan lenders) including equitable mortgage charge on first pari passu basis on Land and Building situated at 32nd Milestone,
GT Road, Kundli,Haryana and 219/2B,Thally Road Hosur,Tamilnadu with Standard Chartered Bank, HDFC Bank, Indusind Bank
and Citibank FCNR-2 Loan.
b) From Standard Chartered Bank :- Loan outstanding as at 31.03.19- Rs 483.28 Lakhs (31.03.18- Rs 1275.75 Lakhs), Interest is
monthly payable. Interest is payable at base rate plus margin basis which may be agreed with bank from time to time which
currently is 9.50% p.a.. The loan is secured against First Pari Passu Charge on all present and future receivables, stocks/
Inventories with Citibank Cash Credit Loan, HDFC Bank Cash Credit Loan, Indusind bank Bank Guarantee Limit and secured
against First Pari Passu Charge on present and future moveable fixed assets of the company with Citibank, HDFC Bank,
Indusind Bank (excluding assets specifically purchased out of term loan from term loan lenders) including equitable mortgage
charge on first pari passu basis on Land and Building situated at 32nd Milestone, GT Road, Kundli,Haryana and 219/2B,Thally
Road Hosur,Tamilnadu with Citibank, HDFC Bank, Indusind bank and Citibank FCNR-2 Loan.
c) From HDFC BANK :- Loan outstanding as at 31.03.19- Rs 1177.78 Lakhs (as at 31.03.18- Rs 545.39 Lakhs), Interest is monthly
payable. Interest is payable at base rate plus margin basis which may be agreed with bank from time to time which currently
is 9.00% p.a.. The loan is secured against First Pari Passu charge on all present and future receivables, stocks/Inventories with
Citibank Cash Credit Loan, Standard Chartered Bank Cash Credit Loan, Indusind bank Bank Guarantee Limit and secured
against First Pari Passu Charge on all fixed assets of the company (excluding assets specifically purchased out of term loan
from term loan lenders) with Citibank, Standard Chartered Bank, Indusind Bank including equitable mortgage charge on
first pari passu basis on Land and Building situated at 32nd Milestone, GT Road, Kundli,Haryana and 219/2B,Thally Road
Hosur,Tamilnadu with Citibank, Standard Chartered Bank, Indusind Bank and Citibank FCNR-2 Loan.
d) Indusind Bank Bank Guarantee Limit:- The loan is secured against First Pari Passu Charge on all present and future receivables,
stocks/Inventories with Citibank Cash Credit Loan, Standard Chartered Bank Cash Credit Loan, HDFC bank Cash Credit Loan
Limit and secured against First Pari Passu Charge on present and future moveable fixed assets of the company with Citibank,
Standard Chartered Bank, HDFC bank (excluding assets specifically purchased out of term loan from term loan lenders)
including equitable mortgage charge on first pari passu basis on Land and Building situated at 32nd Milestone, GT Road,
Kundli,Haryana and 219/2B,Thally Road Hosur,Tamilnadu with Citibank, Standard Chartered Bank, HDFC bank and Citibank
FCNR-2 Loan. Bank Guarantee charges is 0.60% p.a. plus applicable tax.
19. CURRENT BORROWINGS
Particulars As at 31.03.2019 As at 31.03.2018
SECURED LOANS
Cash Credit/Working Capital Loans repayable on demand from Banks
Indian Rupee Loan 3,846.66 3,706.82
TOTA L 3,846.66 3,706.82
Notes to the Financial Statements for the year ended 31.03.2019
(All Amounts are presented in Lakhs, unless otherwise stated)

120 | Fiem Industries Limited
20. CURRENT TRADE PAYABLES
Particulars As at 31.03.2019 As at 31.03.2018
- Micro and Small enterprises 122.62 159.11
- Other than Micro and Small enterprises 18,755.43 21,813.67
18,878.05 21,972.78
T O T A L 18,878.05 21,972.78
Considering the company has been extended credit period upto 45 days by its vendors and payments being released on a timely
basis, there is no liability towards interest on delayed payments under “The Micro, Small and Medium Enterprises Development
Act 2006” during the year.
There is also no amount of outstanding interest in this regard, brought forward from previous years. The above information is on
basis of intimations received, from the vendors who have communicated their status with regards to vendors registration under
the said Act on requests made by the company,
21. OTHER FINANCIAL LIABILITIES- CURRENT
Particulars As at 31.03.2019 As at 31.03.2018
a) Trade Security Deposits 304.37 246.54
b) Current Maturity of Long- term debt 4,001.52 3,509.37
Add/(Less) Derivative liability Short Term (131.14) 38.34
3,870.38 3,547.71
c) Interest accrued 89.16 59.93
d) Liabilities for Expenses 1,393.76 1,477.59
e) Unpaid Dividend - (Investor Education and Protection Fund will be
credited by this amount (as and when due))
16.67 2.85
f) Creditors for Capital Expenditure 676.58 2,072.61
T O T A L 6,350.93 7,407.22
22. OTHER CURRENT LIABILITIES
Particulars As at 31.03.2019 As at 31.03.2018
a) Advances received from Customers 2,413.12 627.28
b) Statutory Dues payable 1,395.13 928.74
T O T A L 3,808.25 1,556.02
23. CURRENT TAX LIABILITIES (NET)
Particulars As at 31.03.2019 As at 31.03.2018
Provision for Income tax (Net of advance tax and Tds) 271.40 109.06
T O T A L 271.40 109.06
Notes to the Financial Statements for the year ended 31.03.2019
(All Amounts are presented in Lakhs, unless otherwise stated)

Annual Report 2018-19 | 121
26. OTHER INCOME
Particulars CURRENT YEAR
FY 2018-19
PREVIOUS YEAR
F.Y. 2017-18
1) Interest income on Fixed Deposits and others Deposits 41.97 69.04
2) Income from Mutual fund 10.67 350.47
3) Sundry Creditors written back 22.88 32.50
4) Rental Income received 9.02 1.65
5) Other Non Operating Income 1.67 0.74
T O T A L 86.21 454.40
25. OTHER OPERATING INCOME
Particulars CURRENT YEAR
FY 2018-19
PREVIOUS YEAR
F.Y. 2017-18
1) Scrap sales 524.84 452.86
2) Testing, Design and Development charges received 110.53 170.62
3) Technical support fee received (Aisan Fiem Automotives India Pvt Ltd) 211.56 -
4) Government subsidy received - 49.80
5) Duty Drawback Received 45.26 30.95
6) Merchandise export Incentive received 60.02 115.06
7) Rebate and Discount Received 0.96 14.47
8) Difference in foreign exchange 19.09 34.29
9) Segregation, Packing and Forwarding charges Received 28.85 26.07
10) Insurance claim 2.56 95.29
T O T A L 1,003.67 989.40
24. GROSS SALES
Particulars CURRENT YEAR
FY 2018-19
PREVIOUS YEAR
F.Y. 2017-18
a) Sales of Products (inclusive of excise duty upto 30.06.17 in
previous year 2017-18)
- Sales of Finished Goods
Automotive Segment 1,39,601.01 1,25,425.24
LED Luminaries Segment 2,876.42 322.58
1,42,477.43 1,25,747.83
- Sales of Raw material/Traded goods
Automotive Segment 863.38 552.73
LED Luminaries Segment 25.79 11.57
889.17 564.31
b) Sales of Services (Job work charges received) 1,43,366.60 1,26,312.13
Automotive Segment - -
LED Luminaries Segment 29.53 11.79
29.53 11.79
T O T A L 1,43,396.13 1,26,323.93
Notes to the Financial Statements for the year ended 31.03.2019
(All Amounts are presented in Lakhs, unless otherwise stated)
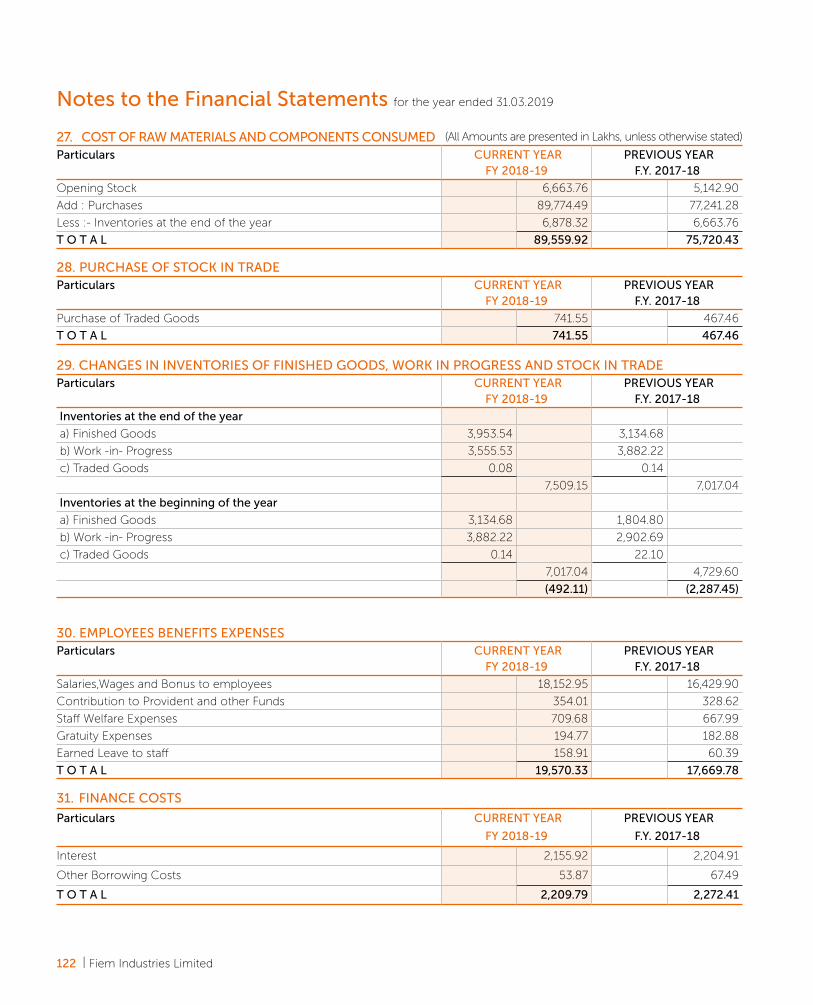
122 | Fiem Industries Limited
27. COST OF RAW MATERIALS AND COMPONENTS CONSUMED (All Amounts are presented in Lakhs, unless otherwise stated)
Particulars CURRENT YEAR FY 2018-19
PREVIOUS YEAR F.Y. 2017-18
Opening Stock 6,663.76 5,142.90
Add : Purchases 89,774.49 77,241.28
Less :- Inventories at the end of the year 6,878.32 6,663.76
T O T A L 89,559.92 75,720.43
30. EMPLOYEES BENEFITS EXPENSES Particulars CURRENT YEAR
FY 2018-19 PREVIOUS YEAR
F.Y. 2017-18
Salaries,Wages and Bonus to employees 18,152.95 16,429.90
Contribution to Provident and other Funds 354.01 328.62
Staff Welfare Expenses 709.68 667.99
Gratuity Expenses 194.77 182.88
Earned Leave to staff 158.91 60.39
T O T A L 19,570.33 17,669.78
31. FINANCE COSTS
Particulars CURRENT YEAR
FY 2018-19
PREVIOUS YEAR
F.Y. 2017-18
Interest 2,155.92 2,204.91
Other Borrowing Costs 53.87 67.49
T O T A L 2,209.79 2,272.41
29. CHANGES IN INVENTORIES OF FINISHED GOODS, WORK IN PROGRESS AND STOCK IN TRADEParticulars CURRENT YEAR
FY 2018-19 PREVIOUS YEAR
F.Y. 2017-18
Inventories at the end of the year
a) Finished Goods 3,953.54 3,134.68
b) Work -in- Progress 3,555.53 3,882.22
c) Traded Goods 0.08 0.14
7,509.15 7,017.04
Inventories at the beginning of the year
a) Finished Goods 3,134.68 1,804.80
b) Work -in- Progress 3,882.22 2,902.69
c) Traded Goods 0.14 22.10
7,017.04 4,729.60
(492.11) (2,287.45)
28. PURCHASE OF STOCK IN TRADE Particulars CURRENT YEAR
FY 2018-19 PREVIOUS YEAR
F.Y. 2017-18
Purchase of Traded Goods 741.55 467.46
T O T A L 741.55 467.46
Notes to the Financial Statements for the year ended 31.03.2019

Annual Report 2018-19 | 123
33. OTHER EXPENSES
Particulars CURRENT YEAR
FY 2018-19
PREVIOUS YEAR
F.Y. 2017-18
Manufacturing Expenses
1) Job Charges 308.23 251.38
2) Machinery running and Maintenance
a) Machinery Repair and Service Charges 108.31 101.40
b) Machinery Spares 953.90 1,045.38
3) Consumption of Stores and Spare parts 2,070.98 2,081.06
4) Packing Expenses 2,688.99 2,801.63
5) Power and Fuel 5,313.35 4,732.52
6) Variation in Excise duty of FG - (201.98)
7) Repair - Dies 150.18 195.75
8) Factory / Godown Rent 49.86 51.77
9) Freight, Cartage & Octroi 766.42 883.52
10) Testing and Design Fees 404.68 217.34
11) Segregation Charges Paid 14.11 7.09
12,829.02 12,166.87
Administrative and Selling Expenses
1) Advertisement, Sub & Membership Exp. 79.79 110.53
2) Payment to Auditors 81.65 81.57
3) Donation 30.63 16.84
4) Rates and taxes 172.29 209.63
5) Insurance 91.75 53.86
6) Bad debt written off 53.44 35.33
7) Provision for Bad and Doubtful Debt 24.15 28.92
8) Rent 263.84 249.07
9) Repair & Maintenance- Building 64.06 122.41
10) Repair & Maintenance- Other 254.25 261.93
11) Royalty 50.00 50.00
12)(Profit)/Loss on sale of Property, Plant and Equipment (13.06) 5.20
13) Selling & Distribution Expenses 2,632.59 2,370.91
14) Travelling and Conveyance Expenses 557.25 499.75
15) Contribution toward CSR (Note-53) 137.94 123.88
16) Other Office Expenses 2,184.18 1,811.55
6,664.76 6,031.38
T O T A L 19,493.78 18,198.25
32. DEPRECIATION AND AMORTIZATION EXPENSES
Particulars CURRENT YEAR
FY 2018-19
PREVIOUS YEAR
F.Y. 2017-18
Depreciation on Property, Plant and Equipment (See Note-2) 4,822.50 4,369.02
Amortization of Intangible assets (See Note-3) 69.12 63.45
4,891.61 4,432.47
Notes to the Financial Statements for the year ended 31.03.2019
(All Amounts are presented in Lakhs, unless otherwise stated)

124 | Fiem Industries Limited
34. EXCEPTIONAL ITEM
Particulars CURRENT YEAR
FY 2018-19
PREVIOUS YEAR
F.Y. 2017-18
Net Gain (Insurance claim) on Capital Assets - (575.86)
Less:- Loss on Inventory - 38.63
- (537.24)
Less -Exceptional expenses incurred on restoration of supply to customer - 196.66
- (340.58)
T O T A L - (340.58)
Note :- Exceptional item in Previous Year 17-18 is related to fire incident happened in one block of Unit-5, situated at Kelamanglam
Road, Achettipalli Post, Hosur 635110, Tamilnadu.
35. CONTINGENT LIABILITIES
Particulars As at March
31, 2019
As at March
31, 2018
(A) Claims against the Company/disputed liabilities not acknowledged as debts (See Note-1)
(i) Income Tax
(a) Case decided in the Company’s favour by First Appellate Authorities and for which the
department has filed further appeals
827.27 827.27
(ii) Custom Duty
(a) Import Duty Demand towards imported capital goods which were sold to the customer
in relation to nil import duty being paid at the time of import of said capital goods as a
100% EOU unit for which the company has filed an appeal with Commissioner of Central
Excise, Chennai (Net of deposit)
43.40 43.40
(iii) Excise Duty
Excise Duty Demand towards interest & penalty on short payment/reversal of Cenvat
Credit on clearance of capital goods for the period April, 2015 to March, 2017 for which
company has filed appeal with The commissioner, CGST & C.Ex., Ahmadabad-North
39.19 -
(iv) Sales Tax
(a) Sales Tax Demand for F.Y. 2014-15 on Central Sales Tax Reversal under Section 19(2)(v) of
the TNVAT Act, 2006 for which company has filed appeal with High Court, Chennai
150.07 150.07
(b) Sales Tax Demand for A.Y. 2010-11 for which company has filed appeal with High Court of
Punjab & Haryana (net of deposit)
20.00 20.00
1,079.93 1,040.74
(B) Other Money for which the Company is contingently liable
(a) Liability in respect of bill of exchange discounted from bank 4,786.14 4,257.39
Note:-1- Based on the advice taken by the company, the company believes that it has good case in respect of all the items under
(i) to (iv) above and hence no provision is considered necessary against the same.
Notes to the Financial Statements for the year ended 31.03.2019
(All Amounts are presented in Lakhs, unless otherwise stated)
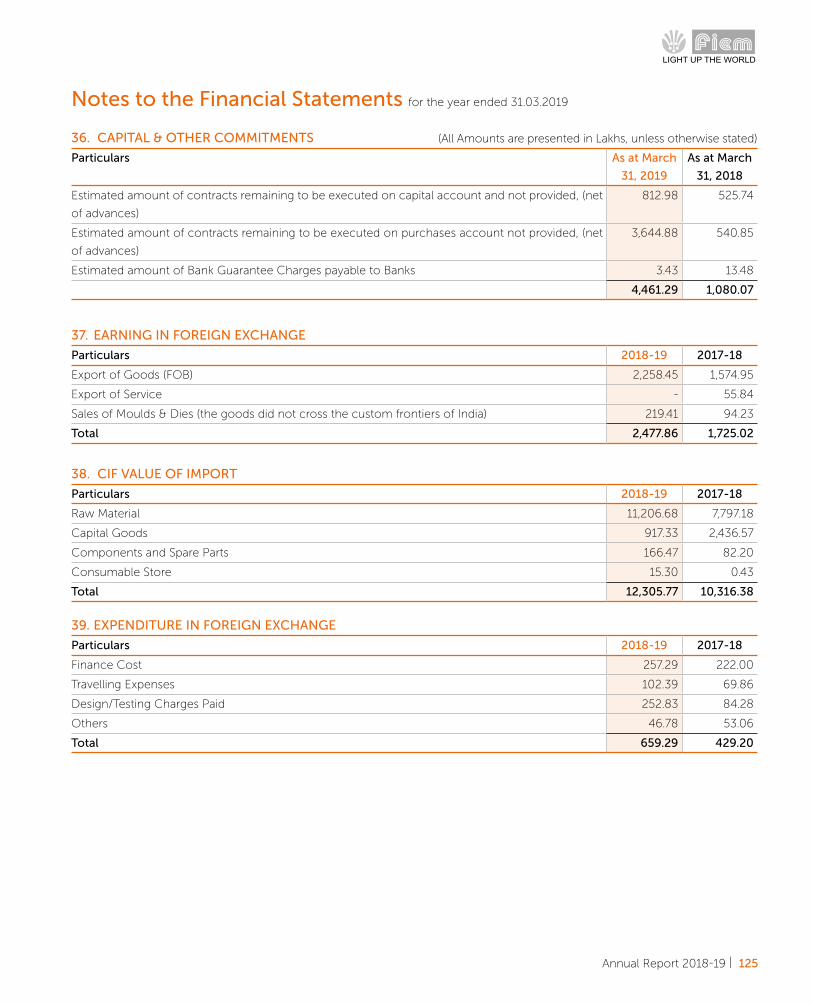
Annual Report 2018-19 | 125
36. CAPITAL & OTHER COMMITMENTS
Particulars As at March
31, 2019
As at March
31, 2018
Estimated amount of contracts remaining to be executed on capital account and not provided, (net
of advances)
812.98 525.74
Estimated amount of contracts remaining to be executed on purchases account not provided, (net
of advances)
3,644.88 540.85
Estimated amount of Bank Guarantee Charges payable to Banks 3.43 13.48
4,461.29 1,080.07
37. EARNING IN FOREIGN EXCHANGE
Particulars 2018-19 2017-18
Export of Goods (FOB) 2,258.45 1,574.95
Export of Service - 55.84
Sales of Moulds & Dies (the goods did not cross the custom frontiers of India) 219.41 94.23
Total 2,477.86 1,725.02
38. CIF VALUE OF IMPORT
Particulars 2018-19 2017-18
Raw Material 11,206.68 7,797.18
Capital Goods 917.33 2,436.57
Components and Spare Parts 166.47 82.20
Consumable Store 15.30 0.43
Total 12,305.77 10,316.38
39. EXPENDITURE IN FOREIGN EXCHANGE
Particulars 2018-19 2017-18
Finance Cost 257.29 222.00
Travelling Expenses 102.39 69.86
Design/Testing Charges Paid 252.83 84.28
Others 46.78 53.06
Total 659.29 429.20
Notes to the Financial Statements for the year ended 31.03.2019
(All Amounts are presented in Lakhs, unless otherwise stated)
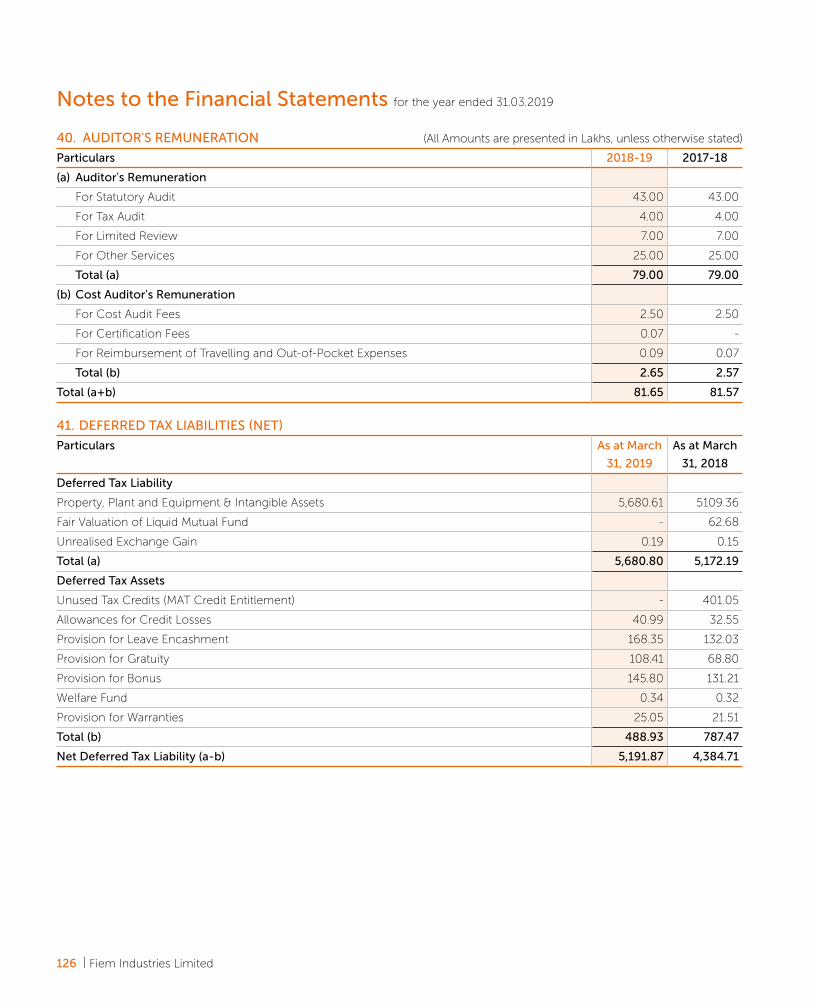
126 | Fiem Industries Limited
40. AUDITOR'S REMUNERATION
Particulars 2018-19 2017-18
(a) Auditor's Remuneration
For Statutory Audit 43.00 43.00
For Tax Audit 4.00 4.00
For Limited Review 7.00 7.00
For Other Services 25.00 25.00
Total (a) 79.00 79.00
(b) Cost Auditor's Remuneration
For Cost Audit Fees 2.50 2.50
For Certification Fees 0.07 -
For Reimbursement of Travelling and Out-of-Pocket Expenses 0.09 0.07
Total (b) 2.65 2.57
Total (a+b) 81.65 81.57
41. DEFERRED TAX LIABILITIES (NET)
Particulars As at March
31, 2019
As at March
31, 2018
Deferred Tax Liability
Property, Plant and Equipment & Intangible Assets 5,680.61 5109.36
Fair Valuation of Liquid Mutual Fund - 62.68
Unrealised Exchange Gain 0.19 0.15
Total (a) 5,680.80 5,172.19
Deferred Tax Assets
Unused Tax Credits (MAT Credit Entitlement) - 401.05
Allowances for Credit Losses 40.99 32.55
Provision for Leave Encashment 168.35 132.03
Provision for Gratuity 108.41 68.80
Provision for Bonus 145.80 131.21
Welfare Fund 0.34 0.32
Provision for Warranties 25.05 21.51
Total (b) 488.93 787.47
Net Deferred Tax Liability (a-b) 5,191.87 4,384.71
Notes to the Financial Statements for the year ended 31.03.2019
(All Amounts are presented in Lakhs, unless otherwise stated)
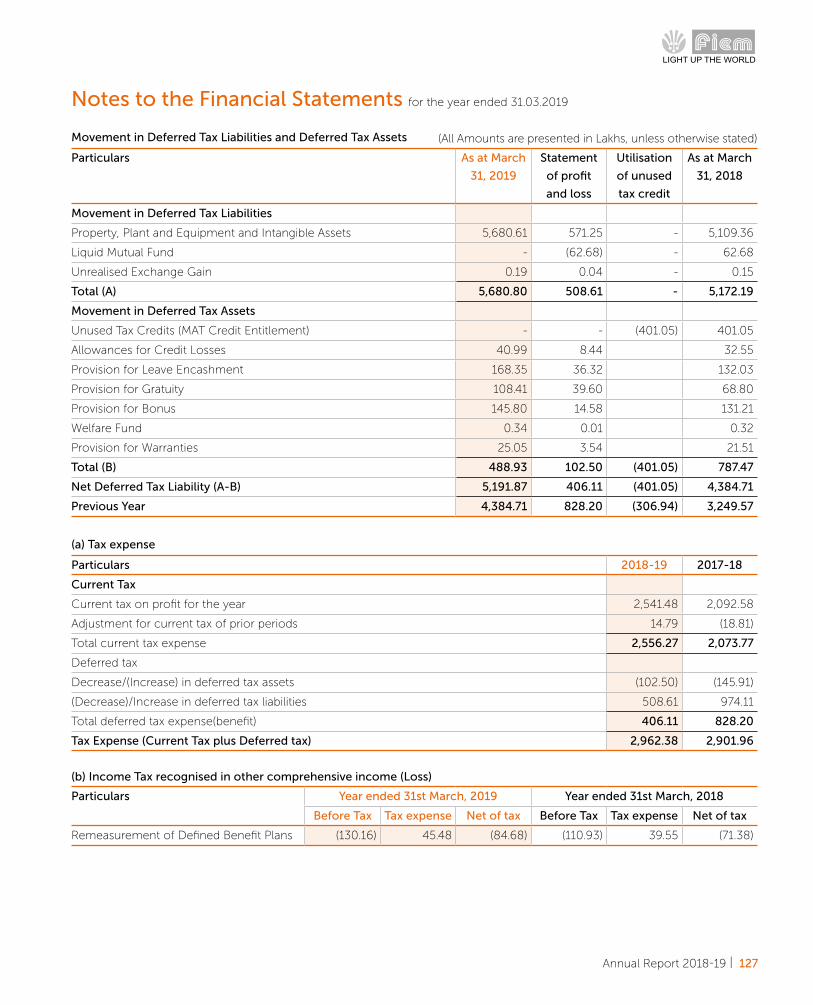
Annual Report 2018-19 | 127
Movement in Deferred Tax Liabilities and Deferred Tax Assets
Particulars As at March
31, 2019
Statement
of profit
and loss
Utilisation
of unused
tax credit
As at March
31, 2018
Movement in Deferred Tax Liabilities
Property, Plant and Equipment and Intangible Assets 5,680.61 571.25 - 5,109.36
Liquid Mutual Fund - (62.68) - 62.68
Unrealised Exchange Gain 0.19 0.04 - 0.15
Total (A) 5,680.80 508.61 - 5,172.19
Movement in Deferred Tax Assets
Unused Tax Credits (MAT Credit Entitlement) - - (401.05) 401.05
Allowances for Credit Losses 40.99 8.44 32.55
Provision for Leave Encashment 168.35 36.32 132.03
Provision for Gratuity 108.41 39.60 68.80
Provision for Bonus 145.80 14.58 131.21
Welfare Fund 0.34 0.01 0.32
Provision for Warranties 25.05 3.54 21.51
Total (B) 488.93 102.50 (401.05) 787.47
Net Deferred Tax Liability (A-B) 5,191.87 406.11 (401.05) 4,384.71
Previous Year 4,384.71 828.20 (306.94) 3,249.57
(a) Tax expense
Particulars 2018-19 2017-18
Current Tax
Current tax on profit for the year 2,541.48 2,092.58
Adjustment for current tax of prior periods 14.79 (18.81)
Total current tax expense 2,556.27 2,073.77
Deferred tax
Decrease/(Increase) in deferred tax assets (102.50) (145.91)
(Decrease)/Increase in deferred tax liabilities 508.61 974.11
Total deferred tax expense(benefit) 406.11 828.20
Tax Expense (Current Tax plus Deferred tax) 2,962.38 2,901.96
(b) Income Tax recognised in other comprehensive income (Loss)
Particulars Year ended 31st March, 2019 Year ended 31st March, 2018
Before Tax Tax expense Net of tax Before Tax Tax expense Net of tax
Remeasurement of Defined Benefit Plans (130.16) 45.48 (84.68) (110.93) 39.55 (71.38)
Notes to the Financial Statements for the year ended 31.03.2019
(All Amounts are presented in Lakhs, unless otherwise stated)

128 | Fiem Industries Limited
(c) Reconciliation of Effective Tax Rate
Particulars As at March 31, 2019
As at March 31, 2018
(a) Profit before tax 8,511.13 8,156.98
(b) Enacted tax rate in India 34.94% 34.61%
(c) Expected tax expenses 2,974.13 2,822.97
(d) Other than temporary difference
R&D expenses (Section 352AB) 153.83 (162.13)
CSR Expenditure 46.52 42.87
Others (594.71) (787.94)
Deferred Tax Liability (net) 406.11 828.20
(e) Net adjustment 11.75 (79.00)
Income Tax Expenses (c+e) 2,962.38 2,901.96
(b) Deductible Temporary Differences
Particulars As at March
31, 2019
As at March
31, 2018
Aisan Fiem Automotive India Pvt Limited 105.05 -
105.05 -
Notes to the Financial Statements for the year ended 31.03.2019
Amount on which deferred tax assets has not been created and related expiry period
Deferred tax assets has not been recognised in respect of deductible temporary differences arising from investment in subsidiaries
and interests in joint arrangements and unused tax losses arising from capital loss carried forward under Income Tax Act, 1961 on
sale of property, transfer of land allotment rights and unquoted equity share because it is not probable that future taxable profit
will be available against which the Company can use the benefit therefrom.
(c) Deferred Tax Assets on Lease-hold Land
Under IND AS deferred tax has been recognised on the adjustments made on transition to IND AS. Leasehold land is a non-
depreciable asset, Management is expecting that its carrying value will not be recovered through sale and indexation benefit at
the time of disposal will not be available, accordingly deferred tax asset on the difference between carrying value and indexed
value has not been created.
(a) Unused Tax Losses
Assessment Year Nature of Loss As at March
31, 2019
As at March
31, 2018
Available up
to A.Y.
2014-15 Long-term capital loss 644.98 644.98 2022-23
2019-20 Long-term capital loss 185.03 - 2027-28
2019-20 Long-term capital loss 0.10 - 2027-28
830.12 644.98
Aggregate amount of temporary differences associated with investment in subsidiaries and joint venture for which deferred
tax liability has not been recognised
Name of Company Nature of Entity As at March
31, 2019
As at March
31, 2018
Fiem Industries Japan Co., Ltd Subsidiary 158.98 42.51
Fiem Kyowa (HK) Mould Company Ltd Joint Venture 8.21 -
Centro Ricerche Fiem Horustech Srl Joint Venture 9.03 9.06
Fiem Research and Technology S.R.L Subsidiary 0.98 -
Total 177.20 51.57
(All Amounts are presented in Lakhs, unless otherwise stated)
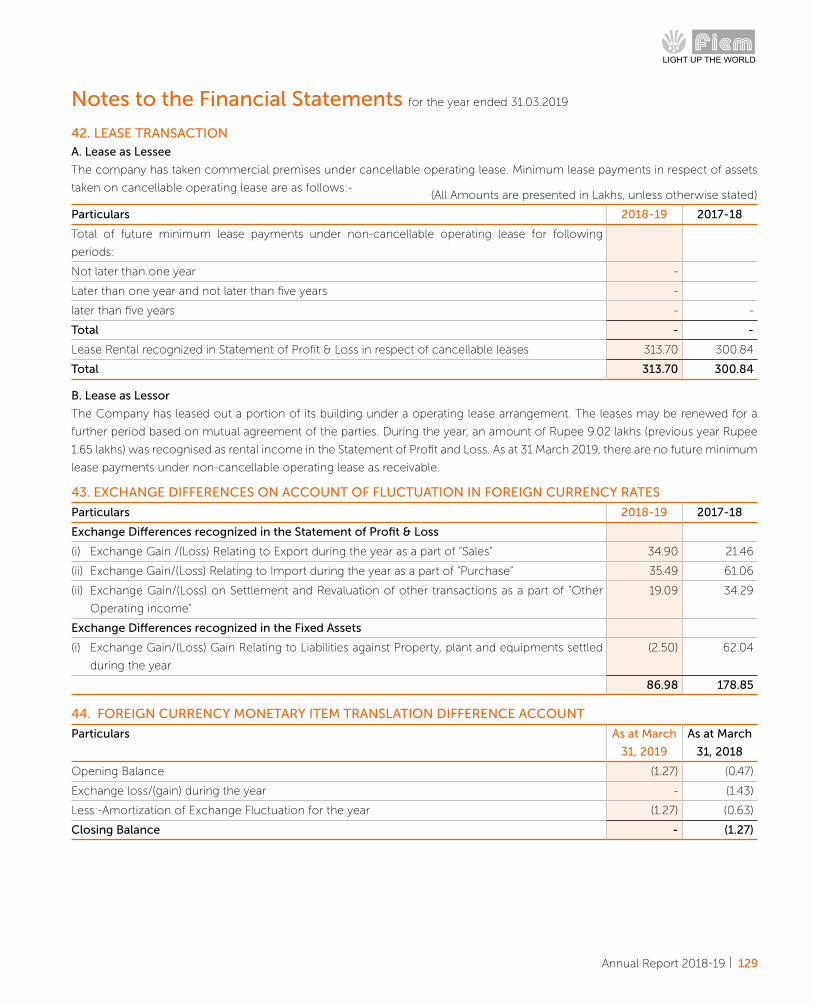
Annual Report 2018-19 | 129
42. LEASE TRANSACTION A. Lease as Lessee
The company has taken commercial premises under cancellable operating lease. Minimum lease payments in respect of assets
taken on cancellable operating lease are as follows:-
B. Lease as Lessor
The Company has leased out a portion of its building under a operating lease arrangement. The leases may be renewed for a
further period based on mutual agreement of the parties. During the year, an amount of Rupee 9.02 lakhs (previous year Rupee
1.65 lakhs) was recognised as rental income in the Statement of Profit and Loss. As at 31 March 2019, there are no future minimum
lease payments under non-cancellable operating lease as receivable.
Notes to the Financial Statements for the year ended 31.03.2019
Particulars 2018-19 2017-18
Total of future minimum lease payments under non-cancellable operating lease for following
periods:
Not later than one year -
Later than one year and not later than five years -
later than five years - -
Total - -
Lease Rental recognized in Statement of Profit & Loss in respect of cancellable leases 313.70 300.84
Total 313.70 300.84
(All Amounts are presented in Lakhs, unless otherwise stated)
43. EXCHANGE DIFFERENCES ON ACCOUNT OF FLUCTUATION IN FOREIGN CURRENCY RATES
Particulars 2018-19 2017-18
Exchange Differences recognized in the Statement of Profit & Loss
(i) Exchange Gain /(Loss) Relating to Export during the year as a part of "Sales" 34.90 21.46
(ii) Exchange Gain/(Loss) Relating to Import during the year as a part of "Purchase" 35.49 61.06
(ii) Exchange Gain/(Loss) on Settlement and Revaluation of other transactions as a part of "Other
Operating income"
19.09 34.29
Exchange Differences recognized in the Fixed Assets
(i) Exchange Gain/(Loss) Gain Relating to Liabilities against Property, plant and equipments settled
during the year
(2.50) 62.04
86.98 178.85
44. FOREIGN CURRENCY MONETARY ITEM TRANSLATION DIFFERENCE ACCOUNT
Particulars As at March
31, 2019
As at March
31, 2018
Opening Balance (1.27) (0.47)
Exchange loss/(gain) during the year - (1.43)
Less:-Amortization of Exchange Fluctuation for the year (1.27) (0.63)
Closing Balance - (1.27)

130 | Fiem Industries Limited
45. EARNING PER SHARE
Particulars 2018-19 2017-18
Net Profit after tax attributable to equity shareholders 5,548.75 5,255.01
Weighted average number of equity shares outstanding during the year (Nos in lakhs) 131.60 131.60
Basic/diluted earning per share* (In Rs.) 42.16 39.93
Face value per equity share (In Rs.) 10 10
*There are no dilutive instruments issued by the Company.
46. GOVERNMENT GRANT
Particulars 2018-19 2017-18
Duty Drawback on Export 45.26 30.95
Investment Subsidy Under Investment Promotion Scheme - 49.80
Merchandise Export Incentive on Export 60.02 115.06
Refund of Electricity Duty - 99.68
Waiver of Electricity Duty (Notional) 65.40 65.40 38.64 138.32
Total 170.68 334.13
47. SEGMENT REPORTING (a) Identification of Segments:
Primary-Business Segments
The Company has identified two reportable business segments viz. Automotive and LED Luminaries Segment on the basis
of the nature of products, the risk and return profile of individual business and the internal business reporting systems. The
products included in each of the reported business segments are as follows:-
(i) Automotive comprising of automotive lighting & signalling equipment, rear view mirror, prismatic mirror, plastic moulded
parts, and sheet metal components for motorised vehicles and others parts for automotive.
(ii) LED Luminaries Segment comprising of led luminaries viz. indoor and outdoor lighting, display panel, LED integrated
passenger information system etc.
(b) Revenue and expenses have been identified to a segment on the basis of relationship to operating activities of the segment.
Revenue and expenses which relates to enterprise as a whole and not allocable to a segment on reasonable basis have been
disclosed as "unallocated"
(c) Segment assets and segment liabilities represent assets and liabilities in respective segments. Income tax related assets/
liabilities, borrowings, investment in mutual funds, deferred tax liabilities (Net) and other assets and liabilities that can not be
allocated to a segment on reasonable basis have been disclosed as "Unallocated".
Notes to the Financial Statements for the year ended 31.03.2019
(All Amounts are presented in Lakhs, unless otherwise stated)
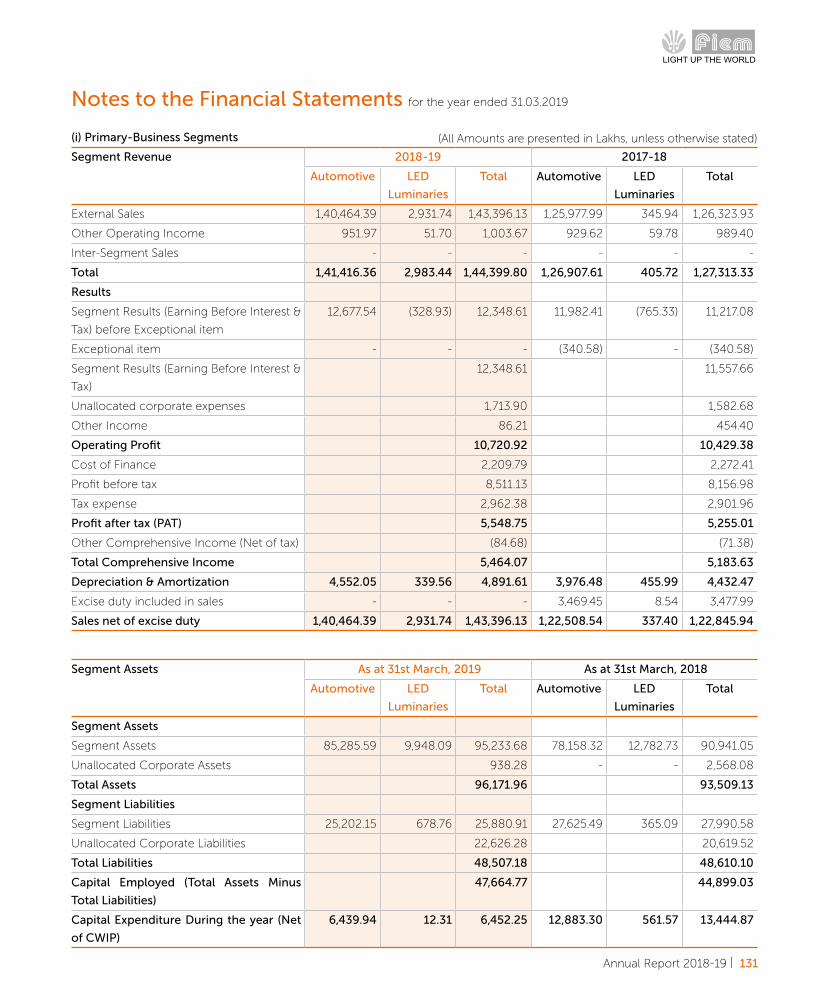
Annual Report 2018-19 | 131
(i) Primary-Business Segments
Segment Revenue 2018-19 2017-18
Automotive LED
Luminaries
Total Automotive LED
Luminaries
Total
External Sales 1,40,464.39 2,931.74 1,43,396.13 1,25,977.99 345.94 1,26,323.93
Other Operating Income 951.97 51.70 1,003.67 929.62 59.78 989.40
Inter-Segment Sales - - - - - -
Total 1,41,416.36 2,983.44 1,44,399.80 1,26,907.61 405.72 1,27,313.33
Results
Segment Results (Earning Before Interest &
Tax) before Exceptional item
12,677.54 (328.93) 12,348.61 11,982.41 (765.33) 11,217.08
Exceptional item - - - (340.58) - (340.58)
Segment Results (Earning Before Interest &
Tax)
12,348.61 11,557.66
Unallocated corporate expenses 1,713.90 1,582.68
Other Income 86.21 454.40
Operating Profit 10,720.92 10,429.38
Cost of Finance 2,209.79 2,272.41
Profit before tax 8,511.13 8,156.98
Tax expense 2,962.38 2,901.96
Profit after tax (PAT) 5,548.75 5,255.01
Other Comprehensive Income (Net of tax) (84.68) (71.38)
Total Comprehensive Income 5,464.07 5,183.63
Depreciation & Amortization 4,552.05 339.56 4,891.61 3,976.48 455.99 4,432.47
Excise duty included in sales - - - 3,469.45 8.54 3,477.99
Sales net of excise duty 1,40,464.39 2,931.74 1,43,396.13 1,22,508.54 337.40 1,22,845.94
Segment Assets As at 31st March, 2019 As at 31st March, 2018
Automotive LED
Luminaries
Total Automotive LED
Luminaries
Total
Segment Assets
Segment Assets 85,285.59 9,948.09 95,233.68 78,158.32 12,782.73 90,941.05
Unallocated Corporate Assets 938.28 - - 2,568.08
Total Assets 96,171.96 93,509.13
Segment Liabilities
Segment Liabilities 25,202.15 678.76 25,880.91 27,625.49 365.09 27,990.58
Unallocated Corporate Liabilities 22,626.28 20,619.52
Total Liabilities 48,507.18 48,610.10
Capital Employed (Total Assets Minus
Total Liabilities)
47,664.77 44,899.03
Capital Expenditure During the year (Net
of CWIP)
6,439.94 12.31 6,452.25 12,883.30 561.57 13,444.87
Notes to the Financial Statements for the year ended 31.03.2019
(All Amounts are presented in Lakhs, unless otherwise stated)

132 | Fiem Industries Limited
(ii) Secondary-Geographical Segments:-
The analysis of geographical segments is based on geographical location of the customers
The following is the distribution of Company's revenue by geographical market, regardless of where the goods were produced
(b) Segment Trade Receivables
Particulars As at March
31, 2019
As at March
31, 2018
India 14,555.16 14,418.45
Outside India 207.32 101.50
Total 14,762.48 14,519.95
1. The Company has common assets for producing goods for domestic market and overseas market. Hence, separate figures for
fixed assets have not be furnished.
(c) Major Customers
Details of customers which accounts for more than 10% of Company's total revenue are as follows
Particulars Segment 2018-19 2017-18
Honda Motorcycle and Scooter India Private Limited Automotive 53,831.57 52,362.88
TVS Motors Company Limited Automotive 40,216.75 33,788.13
48. RELATED PARTY DISCLOSURES UNDER IND AS 24 Name of Related Parties, Transactions and Balances at Reporting date are as follows
Name of Related Party
(i) Key Management Personnel
Mr. Jagjeevan Kumar Jain Chairman and Managing Director
Mrs. Seema Jain Whole Time Director
Ms. Aanchal Jain Whole Time Director
Mr. Rahul Jain Whole Time Director
Mr. JSS Rao Whole Time Director
Mr. Kashi Ram Yadav Whole Time Director
Mr. Ashok Kumar Sharma Independent Director
Mr. Iqbal Singh Independent Director
Mr. Jawahar Thakur Independent Director
Mr. Mohan Bir Sahni Independent Director
Mr. Subodh Kumar Jain Independent Director
Mr. Vinod Kumar Malhotra Independent Director
Mr. OP Gupta Chief Financial Officer
Mr. Arvind Kumar Chauhan Company Secretary
Notes to the Financial Statements for the year ended 31.03.2019
(a) Revenue from External Customers
Particulars 2018-19 2017-18
India 1,41,862.86 1,25,488.61
Outside India 2,536.94 1,824.72
Total 1,44,399.80 1,27,313.33
(All Amounts are presented in Lakhs, unless otherwise stated)

Annual Report 2018-19 | 133
Balance as at year end
Particulars As at March
31, 2019
As at March
31, 2018
Short-term Benefits 36.23 29.86
Deposit Receivables against premises taken on rent 82.21 82.21
Total 118.44 112.07
(ii) Relative of Key Management Personnel with whom transactions have taken place
Mrs. Pallavi Jain Vice President (w.e.f. 01/06/2018)
(Spouse of Mr. Rahul Jain, Whole Time Director)
(iii) Related Parties Controlled by Key Management personnel and/or their Relatives
Fiem Auto Private Limited Entity Controlled by Mr. Jagjeevan Kumar Jain
Jagjeevan Kumar Jain (HUF) Entity Controlled by Mr. Jagjeevan Kumar Jain
Fiem Auto & Electrical Industries Entity Controlled by Mr. Jagjeevan Kumar Jain
Fiem Foundation Entity Controlled by Key Management Personnel
(iv) Subsidiaries Company
Fiem Industries Japan Co., Limited 100% Subsidiary Company incorporated in Japan
Fiem (Thai) Design & Technology Co., Ltd 100% Subsidiary Company incorporated in Thailand
Fiem Research and Technology S.R.L 100% Subsidiary Company incorporated in Italy
(v) Joint Ventures
Aisan Fiem Automotive India Pvt Limited JV incorporated in India, 26% ownership interest held by the company
Centro Ricerche Fiem Horustech S.R.L JV incorporated in Italy, 50% ownership interest held by the company
Fiem Kyowa (HK) Mould Company Ltd JV incorporated in Hong Kong, 50% ownership interest held by the company
(vi) Other Related Party
Fiem Industries Limited Group Gratuity Trust Post-employment benefit plan of Fiem Industries Limited
Notes to the Financial Statements for the year ended 31.03.2019
(i) Transaction with Key Management Personnel (KMP)
Particulars 2018-19 2017-18
Transaction during the year
Short-term Benefits 616.25 562.85
Post Employment Benefits* 1.31 1.31
Sitting Fees 21.20 17.30
Final Dividend on Equity Shares 746.34 663.42
Interim Dividend on Equity Shares 670.89 -
Rent paid on premises taken 187.05 164.67
Total 2,243.04 1,409.54
*Does not include provisions for incremental gratuity and leave encashment liabilities, since the provisions are based on actuarial
valuations for the Company as a whole.
(All Amounts are presented in Lakhs, unless otherwise stated)

134 | Fiem Industries Limited
(a) Compensation Paid during the year
Particulars 2018-19 2017-18
Mr. Jagjeevan Kumar Jain 124.80 124.80
Mrs. Seema Jain 60.00 48.00
Mr. Rahul Jain 60.00 48.00
Ms. Aanchal Jain 48.00 42.00
Mr. JSS Rao 102.00 96.00
Mr. Kashi Ram Yadav 97.45 91.45
Mr. OP Gupta 57.00 52.20
Mr. Arvind Kumar Chauhan 68.31 61.71
Total Compensation 617.56 564.16
(b) Sitting Fee Paid to Independent Directors
Particulars 2018-19 2017-18
Mr. Ashok Kumar Sharma 2.50 2.50
Mr. Iqbal Singh 4.30 3.10
Mr. Jawahar Thakur 3.50 2.50
Mr. Mohan Bir Sahni 2.50 2.50
Mr. Subodh Kumar Jain 3.60 3.10
Mr. Vinod Kumar Malhotra 4.80 3.60
Total Sitting fees 21.20 17.30
(d) Rent Paid for Premises Taken on Rent
Particulars 2018-19 2017-18
Ms. Aanchal Jain 123.02 109.35
Mr. Rahul Jain 59.23 52.65
Mr. Jagjeevan Kumar Jain 4.80 2.67
187.05 164.67
(c) Dividend Paid on Equity Share
Final Dividend Interim Dividend
2018-19 2017-18 2018-19 2017-18
Mr. Jagjeevan Kumar Jain 266.40 236.80 244.27 -
Mrs. Seema Jain 266.40 236.80 236.80 -
Ms. Aanchal Jain 72.00 64.00 64.00 -
Mr. Rahul Jain 139.71 124.19 124.19 -
Mr. JSS Rao 0.00 0.00 0.00 -
Mr. Kashi Ram Yadav 0.03 0.03 0.03 -
Mr. Iqbal Singh 1.80 1.60 1.60 -
Total 746.34 663.42 670.89 -
Notes to the Financial Statements for the year ended 31.03.2019
(All Amounts are presented in Lakhs, unless otherwise stated)

Annual Report 2018-19 | 135
(ii) Relative of Key Management Personnel with whom transaction have taken place
Particulars 2018-19 2017-18
Salary Paid during the year
Mrs. Pallavi Jain 25.00 -
(iii) Related Parties Controlled by Key Management personnel
(a) Fiem Foundation
Particulars 2018-19 2017-18
Transaction during the year
Contribution in Corporate Social Responsibility Activities 122.34 123.08
(b) Fiem Auto & Electrical Industries
Particulars 2018-19 2017-18
Transaction during the year
Brand Royalty Paid 50.00 50.00
Particulars As at March
31, 2019
As at March
31, 2018
Salary Payable as at year end
Mrs. Pallavi Jain 3.94 -
(b) Deposit Receivables Against Premises Taken on Rent as at year end
Particulars As at March
31, 2019
As at March
31, 2018
Ms. Aanchal Jain 54.68 54.68
Mr. Rahul Jain 26.33 26.33
Mr. Jagjeevan Kumar Jain 1.20 1.20
82.21 82.21
(a) Short Term Benefits payable as at year end
Particulars As at March
31, 2019
As at March
31, 2018
Mr. Jagjeevan Kumar Jain 7.85 5.76
Mrs. Seema Jain 3.61 2.73
Mr. Rahul Jain 3.05 1.33
Ms. Aanchal Jain 3.15 3.57
Mr. JSS Rao 5.50 4.95
Mr. Kashi Ram Yadav 5.56 5.25
Mr. OP Gupta 3.45 3.17
Mr. Arvind Kumar Chauhan 4.06 3.10
Total 36.23 29.86
Notes to the Financial Statements for the year ended 31.03.2019
(All Amounts are presented in Lakhs, unless otherwise stated)
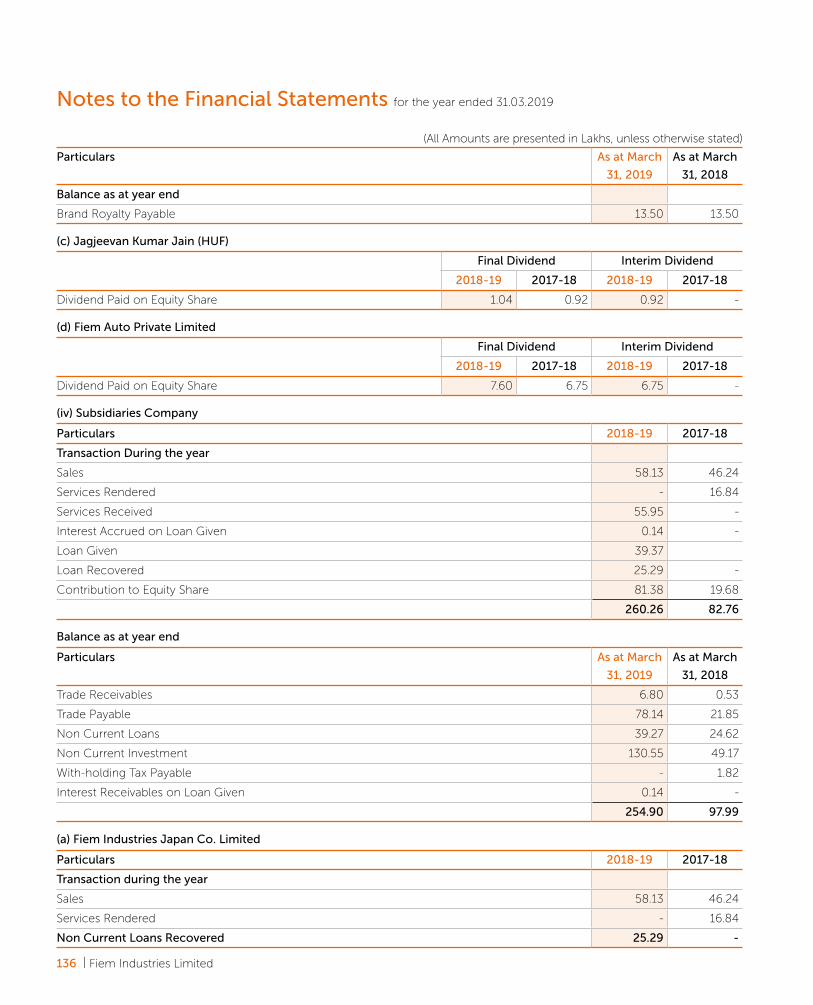
136 | Fiem Industries Limited
(c) Jagjeevan Kumar Jain (HUF)
Final Dividend Interim Dividend
2018-19 2017-18 2018-19 2017-18
Dividend Paid on Equity Share 1.04 0.92 0.92 -
(d) Fiem Auto Private Limited
Final Dividend Interim Dividend
2018-19 2017-18 2018-19 2017-18
Dividend Paid on Equity Share 7.60 6.75 6.75 -
Particulars As at March
31, 2019
As at March
31, 2018
Balance as at year end
Brand Royalty Payable 13.50 13.50
(iv) Subsidiaries Company
Particulars 2018-19 2017-18
Transaction During the year
Sales 58.13 46.24
Services Rendered - 16.84
Services Received 55.95 -
Interest Accrued on Loan Given 0.14 -
Loan Given 39.37
Loan Recovered 25.29 -
Contribution to Equity Share 81.38 19.68
260.26 82.76
(a) Fiem Industries Japan Co. Limited
Particulars 2018-19 2017-18
Transaction during the year
Sales 58.13 46.24
Services Rendered - 16.84
Non Current Loans Recovered 25.29 -
Balance as at year end
Particulars As at March
31, 2019
As at March
31, 2018
Trade Receivables 6.80 0.53
Trade Payable 78.14 21.85
Non Current Loans 39.27 24.62
Non Current Investment 130.55 49.17
With-holding Tax Payable - 1.82
Interest Receivables on Loan Given 0.14 -
254.90 97.99
Notes to the Financial Statements for the year ended 31.03.2019
(All Amounts are presented in Lakhs, unless otherwise stated)
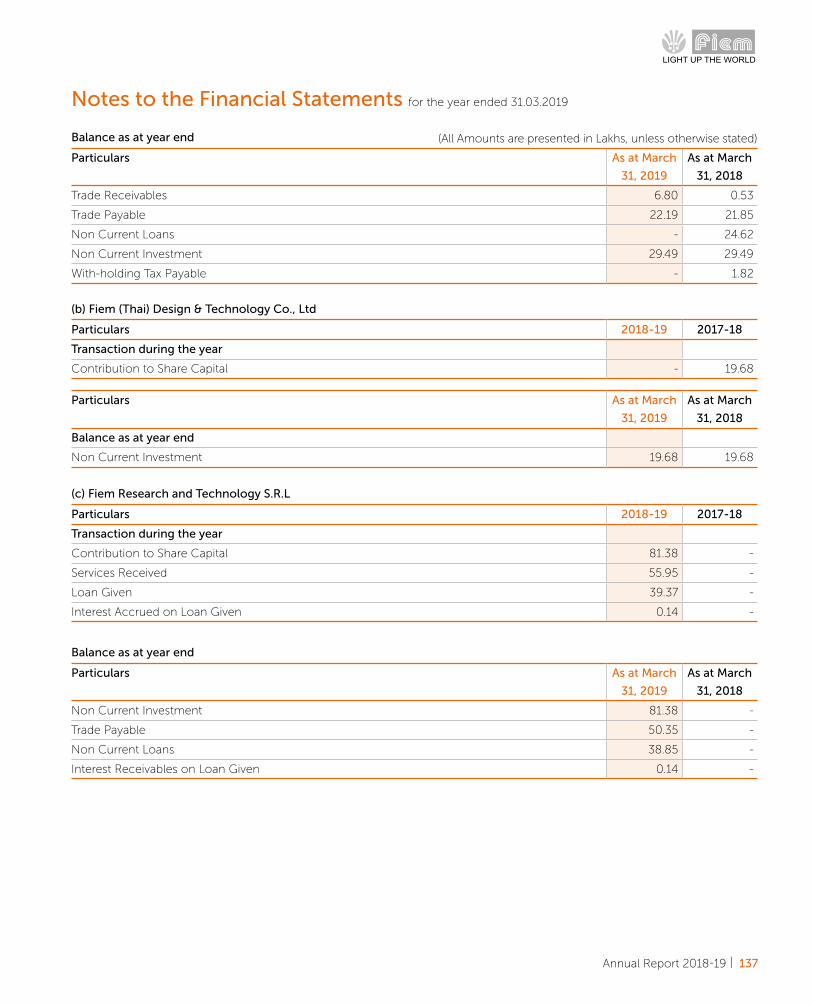
Annual Report 2018-19 | 137
Particulars As at March
31, 2019
As at March
31, 2018
Balance as at year end
Non Current Investment 19.68 19.68
Balance as at year end
Particulars As at March
31, 2019
As at March
31, 2018
Trade Receivables 6.80 0.53
Trade Payable 22.19 21.85
Non Current Loans - 24.62
Non Current Investment 29.49 29.49
With-holding Tax Payable - 1.82
Balance as at year end
Particulars As at March
31, 2019
As at March
31, 2018
Non Current Investment 81.38 -
Trade Payable 50.35 -
Non Current Loans 38.85 -
Interest Receivables on Loan Given 0.14 -
(c) Fiem Research and Technology S.R.L
Particulars 2018-19 2017-18
Transaction during the year
Contribution to Share Capital 81.38 -
Services Received 55.95 -
Loan Given 39.37 -
Interest Accrued on Loan Given 0.14 -
(b) Fiem (Thai) Design & Technology Co., Ltd
Particulars 2018-19 2017-18
Transaction during the year
Contribution to Share Capital - 19.68
Notes to the Financial Statements for the year ended 31.03.2019
(All Amounts are presented in Lakhs, unless otherwise stated)

138 | Fiem Industries Limited
(v) Joint Ventures Company
Particulars 2018-19 2017-18
Transaction during the year
Sales 34.48 -
Purchase 68.11 0.84
Services Rendered 211.56 -
Services Received 184.95 75.58
Contribution to Equity Shares 2,600.00 8.40
Sale of Right of Plot 900.35 -
Sale of Vehicle 15.00 -
Sale of Investment in Equity Share 1.00 -
Expenses Recovered 112.07 -
4,127.52 84.82
Balance as at year end
Non Current Investment 2,641.56 41.56
Trade Payable 32.82 -
Trade Receivables 11.15 -
Advance given agst Purchase of Goods/Services 264.81 5.10
2,950.34 46.66
(a) Aisan Fiem Automotive India Pvt Limited
Particulars 2018-19 2017-18
Transaction during the year
Sales 15.00 -
Services Rendered 211.56 -
Contribution to Equity Shares 2,600.00 -
Sale of Right of Plot 900.35 -
Sale of Vehicle 15.00 -
Sale of Investment in Equity Share 1.00 -
Expenses Recovered 112.07 -
Balance as at year end
Particulars As at March
31, 2019
As at March
31, 2018
Non Current Investment 2,600.00 -
(b) Centro Ricerche Fiem Horustech S.R.L 2018-19 2017-18
Transaction during the year
Sales 19.48 -
Services Received 184.95 75.58
Purchase - 0.84
Notes to the Financial Statements for the year ended 31.03.2019
(All Amounts are presented in Lakhs, unless otherwise stated)
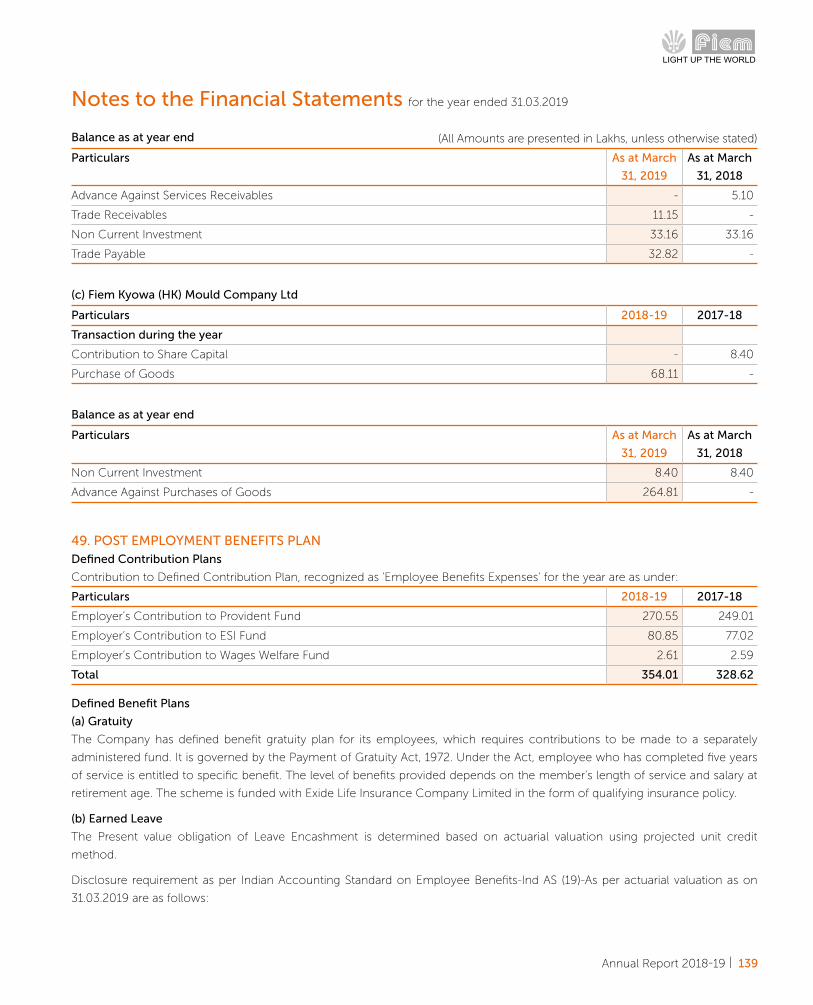
Annual Report 2018-19 | 139
49. POST EMPLOYMENT BENEFITS PLAN Defined Contribution Plans
Contribution to Defined Contribution Plan, recognized as 'Employee Benefits Expenses' for the year are as under:
Particulars 2018-19 2017-18
Employer’s Contribution to Provident Fund 270.55 249.01
Employer’s Contribution to ESI Fund 80.85 77.02
Employer’s Contribution to Wages Welfare Fund 2.61 2.59
Total 354.01 328.62
(c) Fiem Kyowa (HK) Mould Company Ltd
Particulars 2018-19 2017-18
Transaction during the year
Contribution to Share Capital - 8.40
Purchase of Goods 68.11 -
Balance as at year end
Particulars As at March
31, 2019
As at March
31, 2018
Advance Against Services Receivables - 5.10
Trade Receivables 11.15 -
Non Current Investment 33.16 33.16
Trade Payable 32.82 -
Balance as at year end
Particulars As at March
31, 2019
As at March
31, 2018
Non Current Investment 8.40 8.40
Advance Against Purchases of Goods 264.81 -
Defined Benefit Plans
(a) Gratuity
The Company has defined benefit gratuity plan for its employees, which requires contributions to be made to a separately
administered fund. It is governed by the Payment of Gratuity Act, 1972. Under the Act, employee who has completed five years
of service is entitled to specific benefit. The level of benefits provided depends on the member's length of service and salary at
retirement age. The scheme is funded with Exide Life Insurance Company Limited in the form of qualifying insurance policy.
(b) Earned Leave
The Present value obligation of Leave Encashment is determined based on actuarial valuation using projected unit credit
method.
Disclosure requirement as per Indian Accounting Standard on Employee Benefits-Ind AS (19)-As per actuarial valuation as on
31.03.2019 are as follows:
Notes to the Financial Statements for the year ended 31.03.2019
(All Amounts are presented in Lakhs, unless otherwise stated)

140 | Fiem Industries Limited
Amount to be recognised in the Balance Sheet
Particulars For the year
ended 31st
March, 2019
For the year
ended 31st
March, 2018
For the year
ended 31st
March, 2019
For the year
ended 31st
March, 2018
Liability at the end of the year 1,234.32 974.62 481.84 377.87
Fair value of plan assets at the end of the year 924.06 777.71 - -
Amount to be recognised in Balance Sheet 310.26 196.92 481.84 377.87
Current 54.94 111.29 62.98 78.53
Non-Current 255.33 85.62 418.85 299.34
Reconciliation of fair value of plan assets:
Particulars For the year
ended 31st
March, 2019
For the year
ended 31st
March, 2018
For the year
ended 31st
March, 2019
For the year
ended 31st
March, 2018
Fair value of plan assets at the beginning of the year 777.71 643.00 - -
Interest income 63.77 50.89 - -
Employers Contribution 211.59 155.40 54.95 22.48
Benefits paid (129.75) (52.96) (54.95) (22.48)
Return on plan assets-gain /(loss) 0.74 (18.62) - -
Fair value of plan assets at the end of the year 924.06 777.71 - -
Actual return on plan assets 64.51 32.27 - -
Reconciliation of benefit obligation
Particulars For the year
ended 31st
March, 2019
For the year
ended 31st
March, 2018
For the year
ended 31st
March, 2019
For the year
ended 31st
March, 2018
Liability at the beginning of the year 196.92 58.51 377.87 339.97
Interest cost - - 27.30 24.10
Recognised in Accumulated Other Comprehensive Income (111.35) (0.42) - -
Current service cost 194.77 182.88 91.12 71.33
Employers Contribution (211.59) (155.40) (54.95) (22.48)
Remeasurement (gain) / loss 241.52 111.35 40.49 (35.04)
Liability at the end of the year 310.26 196.92 481.84 377.87
Notes to the Financial Statements for the year ended 31.03.2019
(i) Expenses recognised in the Statement of Profit and Loss under the head employee benefits expense
Gratuity Leave Encashment
2018-19 2017-18 2018-19 2017-18
Current service cost 187.67 184.29 91.12 71.33
Interest cost 7.10 (1.41) 27.30 24.10
Actuarial (Gain)/Loss - - 40.49 (35.04)
Expenses recognized in Statement of Profit and Loss 194.77 182.88 158.91 60.39
(All Amounts are presented in Lakhs, unless otherwise stated)

Annual Report 2018-19 | 141
Expected benefit payments (discounted value for the year and present value)
Year ending Gratuity Leave Encashment
For the year
ended 31st
March, 2019
For the year
ended 31st
March, 2018
For the year
ended 31st
March, 2019
For the year
ended 31st
March, 2018
31st March, 2020 45.60 74.41 12.39 26.48
31st March, 2021 63.50 33.68 33.50 9.99
31st March, 2022 32.69 48.74 9.76 22.89
31st March, 2023 82.98 21.39 31.90 6.78
31st March, 2024 43.96 58.80 13.52 23.35
31st March, 2025-2029 223.27 153.11 66.01 42.41
Principal actuarial assumptions
Particulars 2018-19 2017-18 2018-19 2017-18
Discount rate 7.79% 7.33% 7.79% 7.33%
Salary escalation 8.00% 8.00% 8.00% 8.00%
Expected return on assets 7.79% 7.33% 7.79% 7.33%
Attrition rate 2.00% 2.00% 2.00% 2.00%
Retirement age 58 58 58 58
(a) The discount rate is based on the prevailing market yields of Indian Government securities as at the balance sheet date for the estimated terms of the obligations.
(b) Salary escalation rate: The estimates of future salary increases considered taking into the account the inflation, seniority, promotion and other relevant factors.
(c) Expected return on assets is expected return on plan assets over the accounting period, based on an assumed rete of return
(d) Attrition rate is employee turnover rate based on the Company’s past and expected employee turnover.
(e) Disclosure related to indication of effect of the defined benefit plan on the entity’s future cash flows:
(f) Weighted Average duration of defined benefit obligation for gratuity and earned leave: 18.97 years (Previous year 19.59 years)
(g) Sensitivity analysis: Sensitivity analysis indicates the influence of a reasonable change in principal assumptions, while keeping other things
constant, on the outcome of the present value of Defined Benefit Obligation. In reality, the plan is subject to multiple external experience items which may move the Defined Benefit Obligation in similar or opposite directions, while the Plan’s sensitivity to such changes can vary over time.
Notes to the Financial Statements for the year ended 31.03.2019
Amount recognised in statement of other comprehensive income (OCI)
Particulars For the year ended 31st
March, 2019
For the year ended 31st
March, 2018
For the year ended 31st
March, 2019
For the year ended 31st
March, 2018
Opening amount recognised in OCI 111.35 0.42 - -
Remeasurement for the year - Obligation (gain)/ loss 130.91 92.31 40.49 35.04
Remeasurement for the year - plan assets (gain)/ loss (0.75) 18.62 (40.49) (35.04)
Net Increasing in OCI 241.51 111.35 - -
Total remeasurements cost / (credit) for the year recognised in OCI 241.51 111.35 - -
Closing amount recognised in OCI 241.51 111.35 - -
(All Amounts are presented in Lakhs, unless otherwise stated)
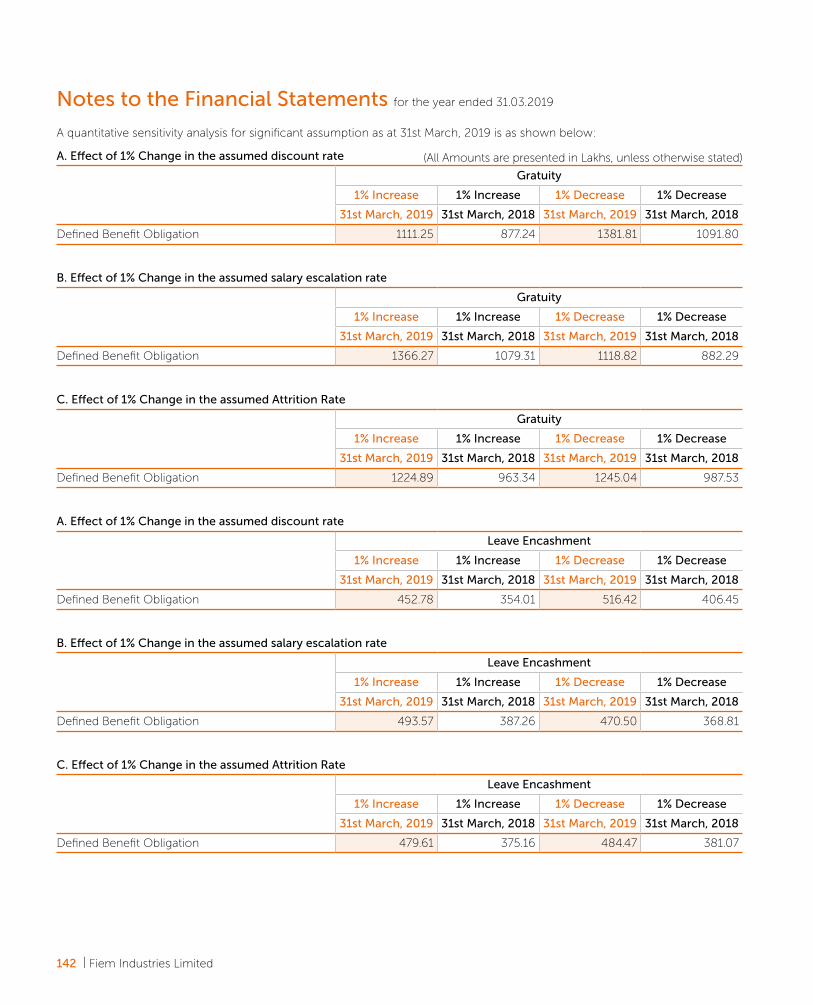
142 | Fiem Industries Limited
A quantitative sensitivity analysis for significant assumption as at 31st March, 2019 is as shown below:
B. Effect of 1% Change in the assumed salary escalation rate
Gratuity
1% Increase 1% Increase 1% Decrease 1% Decrease
31st March, 2019 31st March, 2018 31st March, 2019 31st March, 2018
Defined Benefit Obligation 1366.27 1079.31 1118.82 882.29
C. Effect of 1% Change in the assumed Attrition Rate
Gratuity
1% Increase 1% Increase 1% Decrease 1% Decrease
31st March, 2019 31st March, 2018 31st March, 2019 31st March, 2018
Defined Benefit Obligation 1224.89 963.34 1245.04 987.53
A. Effect of 1% Change in the assumed discount rate
Leave Encashment
1% Increase 1% Increase 1% Decrease 1% Decrease
31st March, 2019 31st March, 2018 31st March, 2019 31st March, 2018
Defined Benefit Obligation 452.78 354.01 516.42 406.45
B. Effect of 1% Change in the assumed salary escalation rate
Leave Encashment
1% Increase 1% Increase 1% Decrease 1% Decrease
31st March, 2019 31st March, 2018 31st March, 2019 31st March, 2018
Defined Benefit Obligation 493.57 387.26 470.50 368.81
C. Effect of 1% Change in the assumed Attrition Rate
Leave Encashment
1% Increase 1% Increase 1% Decrease 1% Decrease
31st March, 2019 31st March, 2018 31st March, 2019 31st March, 2018
Defined Benefit Obligation 479.61 375.16 484.47 381.07
Notes to the Financial Statements for the year ended 31.03.2019
A. Effect of 1% Change in the assumed discount rate
Gratuity
1% Increase 1% Increase 1% Decrease 1% Decrease
31st March, 2019 31st March, 2018 31st March, 2019 31st March, 2018
Defined Benefit Obligation 1111.25 877.24 1381.81 1091.80
(All Amounts are presented in Lakhs, unless otherwise stated)

Annual Report 2018-19 | 143
The management assessed that the fair values of short term financial assets and liabilities significantly approximate their carrying
amounts largely due to the short - term maturities of these instruments. The fair value of the financial assets and liabilities is
included at the amount at which the instrument could be exchanged in a current transaction among willing parties, other than in
a forced or liquidation sale.
Notes to the Financial Statements for the year ended 31.03.2019
50. FAIR VALUE MEASUREMENTSSet out below is the comparison by class of the carrying amounts and fair value of the Company’s financial instruments
Particulars Carrying Amount Fair Value
For the year ended 31st
March, 2019
For the year ended 31st
March, 2018
For the year ended 31st
March, 2019
For the year ended 31st
March, 2018
FINANCIAL ASSETS
Financial assets measured at amortised cost
Security Deposits 833.78 738.53 833.78 738.53
Loan to Employees 67.56 73.66 67.56 73.66
Loan to Wholly owned foreign Subsidiary Company 39.37 24.62 39.37 24.62
Trade receivables 14,762.48 14,519.95 14,762.48 14,519.95
Term Deposit held as margin money, with more than 12 month maturity
32.00 2.85 32.00 2.85
Income accrued on deposits 71.68 44.88 71.68 44.88
Insurance Claim recoverable 1,473.14 2,607.18 1,473.14 2,607.18
Export Incentive receivables 63.85 114.03 63.85 114.03
Other Advance Recoverable 83.50 20.51 83.50 20.51
Cash & Cash Equivalents 119.17 110.36 119.17 110.36
Other Bank Balances 25.87 42.95 25.87 42.95
17,572.40 18,299.52 17,572.40 18,299.52
Financial assets measured at fair value through Statement of Profit & Loss (FVTPL)
Investment in unquoted equity shares 2,774.10 93.72 - -
Investment in quoted mutual Fund - 1,730.18 - 1,909.56
2,774.10 1,823.90 - 1,909.56
FINANCIAL LIABILITIES
Financial liabilities measured at amortised cost
Non Current Borrowings 9,296.24 8,650.34 9,296.24 8,650.34
Current maturities of long-term debt 4,001.52 3,509.37 4,001.52 3,509.37
Current Borrowings 3,846.66 3,706.82 3,846.66 3,706.82
Trade Security deposits 304.37 246.54 304.37 246.54
Interest accrued on borrowings 89.16 59.93 89.16 59.93
Creditors for capital expenditures 676.58 2,072.61 676.58 2,072.61
Trade Payables 18,878.05 21,972.78 18,878.05 21,972.78
Unpaid Dividend 16.67 2.85 16.67 2.85
Liabilities for expenses 1,393.76 1,477.59 1,393.76 1,477.59
38,503.01 41,698.83 38,503.01 41,698.83
(All Amounts are presented in Lakhs, unless otherwise stated)

144 | Fiem Industries Limited
The Company maintains policies and procedures to value financial assets or financial liabilities using the best and most relevant data
available. In addition, the Company internally reviews valuation, including independent price validation for certain instruments.
Fair value of financial assets and liabilities is the amount that would be received to sell an asset or paid to transfer a liability in an
orderly transaction between market participants at the measurement date, regardless of whether that price is directly observable
or estimated using another valuation technique.
The following methods and assumptions were used to estimate fair value:
(a) Fair value of short term financial assets and liabilities significantly approximate their carrying amounts largely due to the short
term maturities of these instruments.
(b) Fair value of quoted mutual funds is based on the net assets value at the reporting date.
51. FINANCIAL INSTRUMENTS AND RISK REVIEW Financial Risk Management Framework
The Company’s financial liabilities comprise mainly of borrowings, trade payables and other payables. The Company’s financial
assets comprise mainly of investments, cash and cash equivalents, other balances with banks, loans, trade receivables and other
receivables.
The Company is exposed to Market risk, Credit risk and Liquidity risk. The Board of Directors (‘Board’) oversee the management
of these financial risks through its Risk Management Committee. The Risk Management Policy of the Company formulated by
the Risk Management Committee and approved by the Board, states the Company’s approach to address uncertainties in its
endeavor to achieve its stated and implicit objectives. It prescribes the roles and responsibilities of the Company’s management,
the structure for managing risks and the framework for risk management. The framework seeks to identify, assess and mitigate
financial risks in order to minimize potential adverse effects on the Company’s financial performance.
i) Capital Management
The Company’s capital management objectives are:
The Board policy is to maintain a strong capital base so as to maintain investor, creditor and market confidence and to sustain
future development of the business. The Board of Directors monitors the return on capital employed.
The Company manages capital risk by maintaining sound/optimal capital structure through monitoring of financial ratios, such as
debt-to-equity ratio and net borrowings-to-equity ratio on a monthly basis and implements capital structure improvement plan
when necessary.
The Company uses debt ratio as a capital management index and calculates the ratio as Net debt divided by total equity. Net debt
and total equity are based on the amounts stated in the financial statements.
Debt-to-equity ratio is as follows: (All Amounts are presented in Lakhs, unless otherwise stated)
Particulars As at 31st
March, 2019
As at 31st
March, 2018
Non Current Borrowing 9,296.24 8,650.34
Current Maturities of Non-Current Borrowing 4,001.52 3,509.37
Derivative Liability (Assets) on Non-Current Borrowings and Current Borrowings (299.08) 225.15
Current Borrowing 3,846.66 3,706.82
Interest Accrued on Borrowing 89.16 59.93
Cash and Cash Equivalents (119.17) (110.36)
Net Debt (A) 16,815.33 16,041.25
Equity (B) 47,664.77 44,899.03
Debt Ratio (A / B) 0.35 : 1 0.36 : 1
Notes to the Financial Statements for the year ended 31.03.2019

Annual Report 2018-19 | 145
ii) Credit Risk
Credit risk refers to risk that a counterparty will default on its contractual obligations resulting in financial loss to the Company.
Credit risk arises primarily from financial assets such as trade receivables, investment in mutual funds, other balances with banks,
loans and other receivables.
The Company’s exposure and credit ratings of its counterparties are continuously monitored and the aggregate value of
transactions is reasonably spread amongst the counterparties.
Exposure to credit risk
The carrying amount of financial assets represents the maximum credit exposure. The maximum exposure to credit risk was Rs.
14,762.48 Lakhs (Previous Year Rs. 14519.95 Lakhs) respectively, being the total of the carrying amount of balances with trade
receivables.
Ind AS requires expected credit losses to be measured through a loss allowance. The Company assesses at each date of financial
statement whether a financial asset or a group of financial assets is impaired. The Company recognises lifetime expected losses
for all contract assets and / or all trade receivables that do not constitute a financing transaction. For all other financial assets,
expected credit losses are measured at an amount equal to the 12 months expected credit losses or at an amount equal to the
life time expected credit losses if the credit risk on the financial asset has increased significantly since initial recognition.
The Company’s primary customers are major automobile manufacturers (OEMs) with good credit ratings. Company’s exposure
to customers is diversified and some customers contribute more than 10% of outstanding accounts receivable which forms
61% of total receivables as of 31st March, 2019 (57% as at 31st March, 2018), however there was no default on account of those
customers in the past.
The Company performs credit assessment for customers on an annual basis and recognizes credit risk, on the basis lifetime
expected losses and where receivables are due for more than six months.
iii) Liquidity Risk
a) Liquidity risk management
Liquidity risk refers to the risk that the Company cannot meet its financial obligations. The objective of liquidity risk management
is to maintain sufficient liquidity and ensure that funds are available for use as per requirements. The Company manages liquidity
risk by maintaining adequate reserves, banking facilities and reserve borrowing facilities, by continuously monitoring forecast and
actual cash flows, and by matching the maturity profiles of financial assets and liabilities.
b) Maturities of financial liabilities
The following tables detail the Company’s remaining contractual maturity for its financial liabilities with agreed repayment periods.
The amount disclosed in the tables have been drawn up based on the undiscounted cash flows of financial liabilities based on the
earliest date on which the Company can be required to pay. The tables include both interest and principal cash flows.
Movement in the expected credit loss allowance: (All Amounts are presented in Lakhs, unless otherwise stated)
Particulars As at 31st
March, 2019
As at 31st
March, 2018
Balance at the beginning of the year 93.17 64.25
Movement in the expected credit loss allowance on trade receivables calculated at lifetime
expected credit losses
24.15 28.92
Balance at the end of the year 117.32 93.17
Notes to the Financial Statements for the year ended 31.03.2019

146 | Fiem Industries Limited
Particulars 31st March, 2019 31st March, 2018
Less than 1
Year
1-5 Years Less than 1
Year
1-5 Years
Non-derivative Financial assets
Trade receivables 14,637.58 124.90 14,395.05 124.90
Other Financial Assets 1,885.54 3,866.41 4,905.50 877.34
16,523.12 3,991.31 19,300.55 1,002.24
c) Maturities of financial assets
The following table details the Company’s expected maturity for financial assets. The table has been drawn up based on the
undiscounted contractual maturities of the financial assets including interest that will be earned on such assets.
iv) Market Risk
Market risk is the risk that the fair value or future cash flows of a financial instrument will fluctuate because of changes in market
prices. Such changes in the values of financial instruments may result from changes in the foreign currency exchange rates,
interest rates, credit, liquidity and other market changes. The Company’s exposure to market risk is primarily on account of foreign
currency exchange rate risk.
a) Foreign Currency exchange rate risk
The fluctuation in foreign currency exchange rates may have potential impact on the statement of profit or loss and other
comprehensive income and equity, where any transaction references more than one currency or where assets / liabilities are
denominated in a currency other than the functional currency of the respective entities. Considering the countries and economic
environment in which the Company operates, its operations are subject to risks arising from fluctuations in exchange rates in
those countries. The risks primarily relate to fluctuations in US Dollar, Euro, Great Britain Pound and Japanese Yen against the
respective functional currencies of the Company. The Company The Company, as per its risk management policy, uses derivative
instruments primarily to hedge foreign exchange.
The Company evaluates the impact of foreign exchange rate fluctuations by assessing its exposure to exchange rate risks. It
hedges a part of these risks by using derivative financial instruments in line with its risk management policies. The information on
derivative instruments is as follows.
Notes to the Financial Statements for the year ended 31.03.2019
Particulars 31st March, 2019 31st March, 2018
Less than 1
Year
1-5 Years Less than 1
Year
1-5 Years
Financial liabilities
Trade payables 18,878.05 - 21,972.78 -
Other Financial Liabilities 2,391.39 - 3,799.59 186.81
Working capital demand loans 3,846.66 - 3,706.82 -
Term loans 4,001.52 9,296.24 3,509.37 8,650.34
Interest Accrued 89.16 - 59.93 -
29,206.78 9,296.24 33,048.49 8,837.15
(All Amounts are presented in Lakhs, unless otherwise stated)
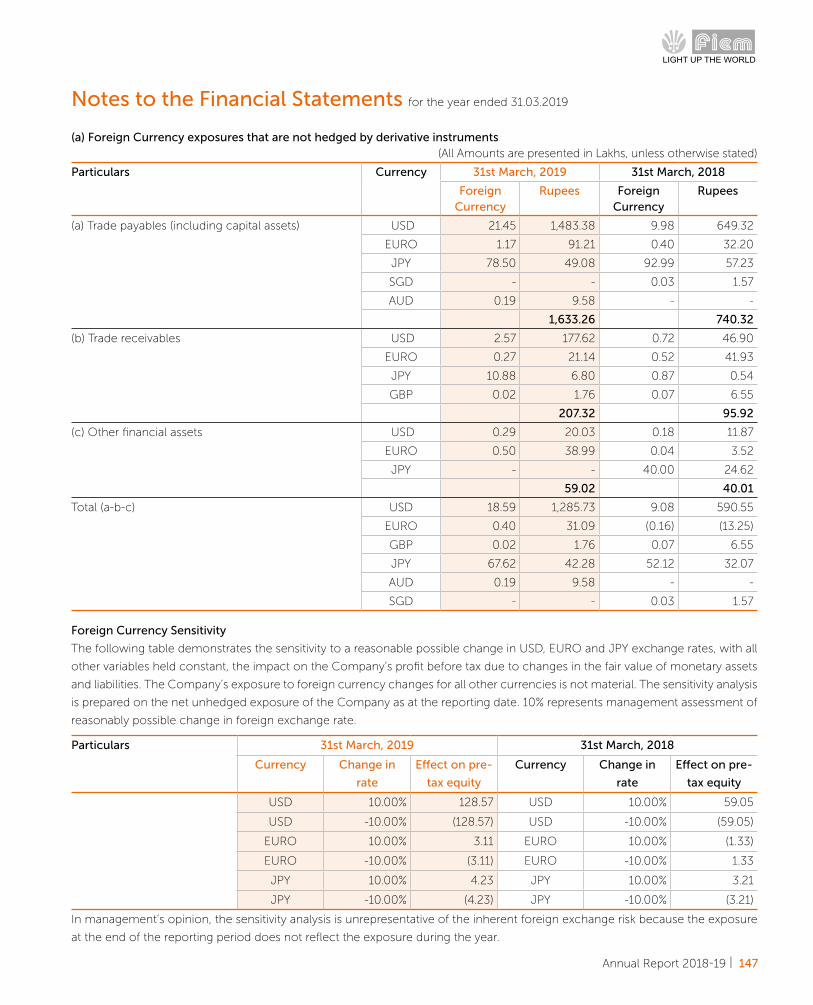
Annual Report 2018-19 | 147
Particulars 31st March, 2019 31st March, 2018
Currency Change in
rate
Effect on pre-
tax equity
Currency Change in
rate
Effect on pre-
tax equity
USD 10.00% 128.57 USD 10.00% 59.05
USD -10.00% (128.57) USD -10.00% (59.05)
EURO 10.00% 3.11 EURO 10.00% (1.33)
EURO -10.00% (3.11) EURO -10.00% 1.33
JPY 10.00% 4.23 JPY 10.00% 3.21
JPY -10.00% (4.23) JPY -10.00% (3.21)
In management’s opinion, the sensitivity analysis is unrepresentative of the inherent foreign exchange risk because the exposure
at the end of the reporting period does not reflect the exposure during the year.
(a) Foreign Currency exposures that are not hedged by derivative instruments(All Amounts are presented in Lakhs, unless otherwise stated)
Particulars Currency 31st March, 2019 31st March, 2018
Foreign Currency
Rupees Foreign Currency
Rupees
(a) Trade payables (including capital assets) USD 21.45 1,483.38 9.98 649.32
EURO 1.17 91.21 0.40 32.20
JPY 78.50 49.08 92.99 57.23
SGD - - 0.03 1.57
AUD 0.19 9.58 - -
1,633.26 740.32
(b) Trade receivables USD 2.57 177.62 0.72 46.90
EURO 0.27 21.14 0.52 41.93
JPY 10.88 6.80 0.87 0.54
GBP 0.02 1.76 0.07 6.55
207.32 95.92
(c) Other financial assets USD 0.29 20.03 0.18 11.87
EURO 0.50 38.99 0.04 3.52
JPY - - 40.00 24.62
59.02 40.01
Total (a-b-c) USD 18.59 1,285.73 9.08 590.55
EURO 0.40 31.09 (0.16) (13.25)
GBP 0.02 1.76 0.07 6.55
JPY 67.62 42.28 52.12 32.07
AUD 0.19 9.58 - -
SGD - - 0.03 1.57
Foreign Currency Sensitivity
The following table demonstrates the sensitivity to a reasonable possible change in USD, EURO and JPY exchange rates, with all
other variables held constant, the impact on the Company’s profit before tax due to changes in the fair value of monetary assets
and liabilities. The Company’s exposure to foreign currency changes for all other currencies is not material. The sensitivity analysis
is prepared on the net unhedged exposure of the Company as at the reporting date. 10% represents management assessment of
reasonably possible change in foreign exchange rate.
Notes to the Financial Statements for the year ended 31.03.2019
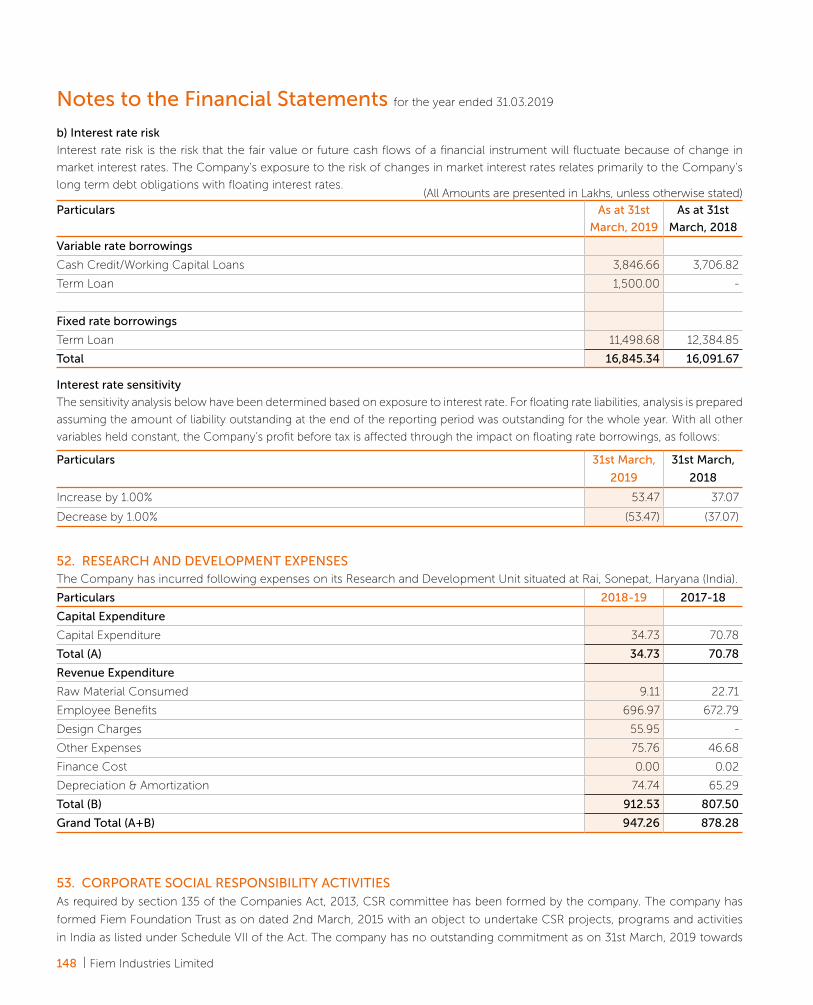
148 | Fiem Industries Limited
b) Interest rate risk
Interest rate risk is the risk that the fair value or future cash flows of a financial instrument will fluctuate because of change in
market interest rates. The Company’s exposure to the risk of changes in market interest rates relates primarily to the Company’s
long term debt obligations with floating interest rates.
53. CORPORATE SOCIAL RESPONSIBILITY ACTIVITIES As required by section 135 of the Companies Act, 2013, CSR committee has been formed by the company. The company has
formed Fiem Foundation Trust as on dated 2nd March, 2015 with an object to undertake CSR projects, programs and activities
in India as listed under Schedule VII of the Act. The company has no outstanding commitment as on 31st March, 2019 towards
Interest rate sensitivity
The sensitivity analysis below have been determined based on exposure to interest rate. For floating rate liabilities, analysis is prepared
assuming the amount of liability outstanding at the end of the reporting period was outstanding for the whole year. With all other
variables held constant, the Company’s profit before tax is affected through the impact on floating rate borrowings, as follows:
Particulars 31st March,
2019
31st March,
2018
Increase by 1.00% 53.47 37.07
Decrease by 1.00% (53.47) (37.07)
52. RESEARCH AND DEVELOPMENT EXPENSESThe Company has incurred following expenses on its Research and Development Unit situated at Rai, Sonepat, Haryana (India).
Particulars 2018-19 2017-18
Capital Expenditure
Capital Expenditure 34.73 70.78
Total (A) 34.73 70.78
Revenue Expenditure
Raw Material Consumed 9.11 22.71
Employee Benefits 696.97 672.79
Design Charges 55.95 -
Other Expenses 75.76 46.68
Finance Cost 0.00 0.02
Depreciation & Amortization 74.74 65.29
Total (B) 912.53 807.50
Grand Total (A+B) 947.26 878.28
Notes to the Financial Statements for the year ended 31.03.2019
Particulars As at 31st
March, 2019
As at 31st
March, 2018
Variable rate borrowings
Cash Credit/Working Capital Loans 3,846.66 3,706.82
Term Loan 1,500.00 -
Fixed rate borrowings
Term Loan 11,498.68 12,384.85
Total 16,845.34 16,091.67
(All Amounts are presented in Lakhs, unless otherwise stated)

Annual Report 2018-19 | 149
54. JOINT VENTURE COMPANY 1. Centro Ricerche Fiem Horustech SRL
Description of Interest Joint Venture
Country of Incorporation Italy
Proportion of Ownership Interest as at March 31, 2019 50%
2. Fiem Kyowa (HK) Mould Company Ltd
Description of Interest Joint Venture
Country of Incorporation Hong Kong
Proportion of Ownership Interest as at March 31, 2019 50%
3. Aisan Fiem Automotive India Pvt Ltd
Description of Interest Joint Venture
Country of Incorporation India
Proportion of Ownership Interest as at March 31, 2019 26%
In respect of jointly control entity, the company's share of assets, liabilities, incomes and expenses are as follows-
Particulars Centro Ricerche Fiem
Horustech SRL
Fiem Kyowa (HK) Mould
Company Ltd
Aisan Fiem Automotive
India Pvt Ltd
Year ended
31.03.2019
Year ended
31.03.2018
Year ended
31.03.2019
Year ended
31.03.2018
Year ended
31.03.2019
Year ended
31.03.2018
Non Current Assets 37.25 24.18 - - 2,186.27 -
Current Assets 63.88 65.01 177.98 8.08 962.21 -
Non Current Liabilities 37.03 13.42 - - 3.28 -
Current Liabilities 41.86 51.17 161.85 - 650.25 -
Revenue 99.12 104.42 68.55 - 76.68 -
Expenses 101.24 108.28 60.50 0.32 217.92 -
Profit or loss from containing
operations
(2.11) (3.86) 8.05 (0.32) (105.05) -
Post-tax profit or loss from
discontinued operations
- - - - - -
Other comprehensive income - - - - - -
Total comprehensive income (2.11) (3.86) 8.05 (0.32) (105.05) -
Dividend Received - - - - - -
corporate social responsibility projects. The break-up of expenditure/contribution towards under corporate social responsibility
as under:-
Notes to the Financial Statements for the year ended 31.03.2019
Particulars 2018-19 2017-18
Gross amount required to be spent during the year 137.94 123.88
Amount spent during the year :-
Contribution to the Fiem Foundation 122.34 123.08
Amount spent by the company 15.60 0.80
Grand Total 137.94 123.88
(All Amounts are presented in Lakhs, unless otherwise stated)

150 | Fiem Industries Limited
55. DISCLOSURE UNDER SEBI REGULATION (All Amounts are presented in Lakhs, unless otherwise stated)
Particulars Loan Outstanding At year end
Maximum Amount Outstanding in the year
Year ended 31.03.2019
Year ended 31.03.2018
2018-19 2017-18
Subsidiary Company
Fiem Research and Technology SRL 39.37 - 39.37 -
Fiem Industries Japan Co., Limited - 24.62 24.62 24.62
56. DUES TO MICRO, SMALL AND MEDIUM ENTERPRISES
The Ministry of Micro, Small and Medium Enterprises has issued an office memorandum dated August 26, 2008 which recommends
that the Micro and Small Enterprises should mention in their correspondence with its customers the Entrepreneurs Memorandum
Number as allocated after filing of the Memorandum in accordance with the ‘Micro, Small and Medium Enterprises Development
Act, 2006’ (‘the Act’). Accordingly, the disclosure in respect of the amounts payable to such enterprises as at March 31, 2019 and
March 31, 2018 has been made in the financial statements based on information received and available with the Company. The
Company has not received any claim for interest from any supplier as at the balance sheet date.
Particulars Year ended
31.03.2019
Year ended
31.03.2018
The principal amount remaining unpaid to any supplier at the end of each accounting year; 122.62 159.11
The interest due thereon remaining unpaid to any supplier at the end of each accounting year; - -
The amount of interest paid by the buyer in terms of section 16 of the Micro, Small and Medium
Enterprises Development Act, 2006 (27 of 2006), along with the amount of the payment made to
the supplier beyond the appointed day during each accounting year;
- -
The amount of interest due and payable for the period of delay in making payment (which has
been paid but beyond the appointed day during the year) but without adding the interest specified
under the Micro, Small and Medium Enterprises Development Act, 2006
- -
The amount of interest accrued and remaining unpaid at the end of each accounting year; and - -
The amount of further interest remaining due and payable even in the succeeding years, until
such date when the interest dues above are actually paid to the small enterprise, for the purpose
of disallowance of a deductible expenditure under section 23 of the Micro, Small and Medium
Enterprises Development Act, 2006
- -
57. UTILIZATION OF QIP PROCEEDS During the financial year 2016-17, on dated 20th September, 2016, the Company has issued and allotted 11,97,604 equity shares
of Rs. 10 each at a premium of Rs. 992 per equity share by way of Qualified Institution Placement (QIP).
The utilization of QIP proceeds as on 31.03.2019 are as follows:-
Particulars Year ended
31.03.2019
Year ended
31.03.2018
Gross Proceeds of QIP Issue 11,999.99 11,999.99
Less: Amount utilized for the purpose Received 11,999.99 10,265.19
Balance Amount - 1,734.80
Temporarily invested in Mutual Funds - 1,730.18
Temporarily invested in Fixed Deposits/Current Account with Banks - 4.62
Notes to the Financial Statements for the year ended 31.03.2019
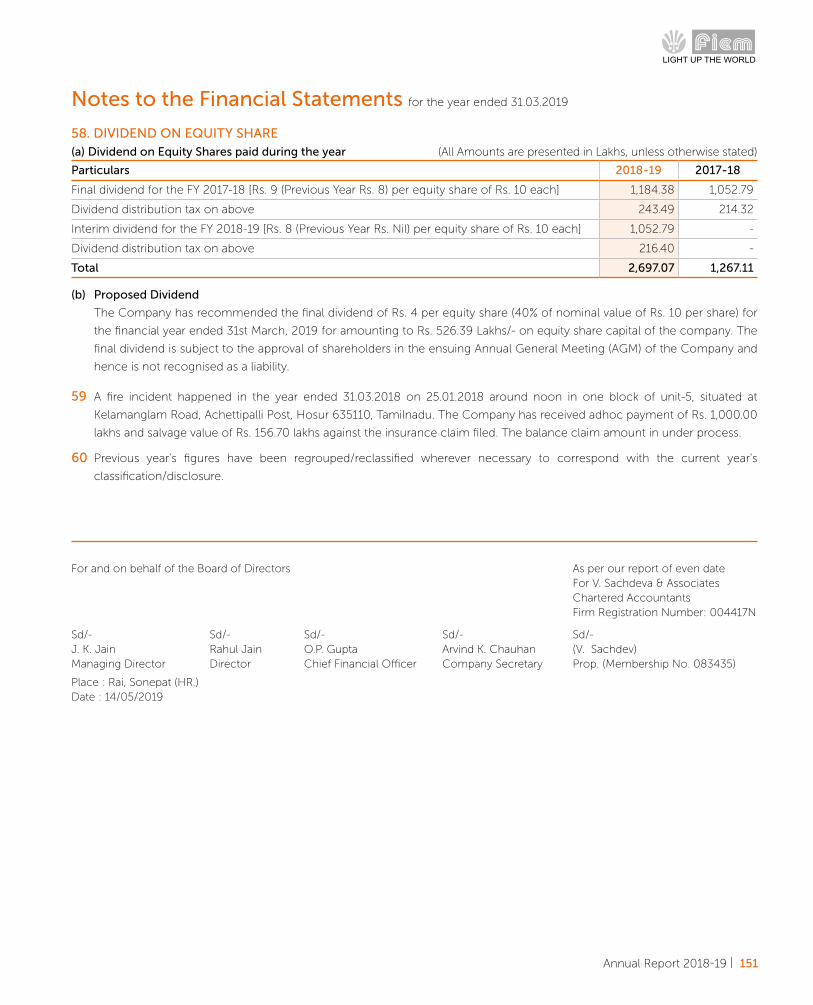
Annual Report 2018-19 | 151
58. DIVIDEND ON EQUITY SHARE (a) Dividend on Equity Shares paid during the year (All Amounts are presented in Lakhs, unless otherwise stated)
(b) Proposed Dividend
The Company has recommended the final dividend of Rs. 4 per equity share (40% of nominal value of Rs. 10 per share) for
the financial year ended 31st March, 2019 for amounting to Rs. 526.39 Lakhs/- on equity share capital of the company. The
final dividend is subject to the approval of shareholders in the ensuing Annual General Meeting (AGM) of the Company and
hence is not recognised as a liability.
59 A fire incident happened in the year ended 31.03.2018 on 25.01.2018 around noon in one block of unit-5, situated at
Kelamanglam Road, Achettipalli Post, Hosur 635110, Tamilnadu. The Company has received adhoc payment of Rs. 1,000.00
lakhs and salvage value of Rs. 156.70 lakhs against the insurance claim filed. The balance claim amount in under process.
60 Previous year's figures have been regrouped/reclassified wherever necessary to correspond with the current year's
classification/disclosure.
Particulars 2018-19 2017-18
Final dividend for the FY 2017-18 [Rs. 9 (Previous Year Rs. 8) per equity share of Rs. 10 each] 1,184.38 1,052.79
Dividend distribution tax on above 243.49 214.32
Interim dividend for the FY 2018-19 [Rs. 8 (Previous Year Rs. Nil) per equity share of Rs. 10 each] 1,052.79 -
Dividend distribution tax on above 216.40 -
Total 2,697.07 1,267.11
Notes to the Financial Statements for the year ended 31.03.2019
For and on behalf of the Board of Directors As per our report of even date For V. Sachdeva & Associates Chartered Accountants Firm Registration Number: 004417N
Sd/- Sd/- Sd/- Sd/- Sd/-J. K. Jain Rahul Jain O.P. Gupta Arvind K. Chauhan (V. Sachdev)Managing Director Director Chief Financial Officer Company Secretary Prop. (Membership No. 083435)
Place : Rai, Sonepat (HR.)Date : 14/05/2019

152 | Fiem Industries Limited
CONSOLIDATED FINANCIAL STATEMENTS

Annual Report 2018-19 | 153
To The Members of
FIEM INDUSTRIES LIMITED
Report on the Audit of the Consolidated Financial Statements
Opinion
We have audited the accompanying consolidated financial
statements of Fiem Industries Limited (hereinafter referred to
as the ‘Holding Company”) its subsidiaries (Holding Company
and its subsidiaries together referred to as “the Group”), its
associates and jointly controlled entities, which comprise the
consolidated Balance Sheet as at March 31, 2019, and the
consolidated statement of Profit and Loss (including Other
Comprehensive Income), the consolidated statement of
changes in equity and the consolidated cash flows Statement
for the year then ended, and notes to the consolidated financial
statements, including a summary of significant accounting
policies (hereinafter referred to as “the consolidated financial
statements”).
In our opinion and to the best of our information and according
to the explanations given to us, the aforesaid Consolidated
financial statements give the information required by the
Companies Act, 2013 (“the Act”) in the manner so required
and give a true and fair view in conformity with the Indian
Accounting Standards prescribed under section 133 of the
Act read with the Companies (Indian Accounting Standards)
Rules, 2015, as amended, (“Ind AS”) and other the accounting
principles generally accepted in India, of their consolidated
state of affairs of the Company as at March 31, 2019, of
consolidated profits and Consolidated total comprehensive
income, consolidated changes in equity and its consolidated
cash flows for the year then ended.
Basis for Opinion
We conducted our audit in accordance with the Standards on
Auditing (SAs) specified under section 143(10) of the Companies
Act, 2013. Our responsibilities under those Standards are
further described in the Auditor’s Responsibilities for the
Audit of the Consolidated Financial Statements section of our
report. We are independent of the Company in accordance
with the Code of Ethics issued by the Institute of Chartered
Accountants of India together with the ethical requirements
that are relevant to our audit of the Consolidated financial
statements under the provisions of the Companies Act, 2013
and the Rules thereunder, and we have fulfilled our other ethical
responsibilities in accordance with these requirements and the
ICAI’s Code of Ethics. We believe that the audit evidence we
have obtained is sufficient and appropriate to provide a basis
for our opinion.
Key Audit Matters
Key audit matters are those matters that, in our professional
judgment, were of most significance in our audit of the
Consolidated financial statements of the current period. These
matters were addressed in the context of our audit of the
Consolidated financial statements as a whole, and in forming
our opinion thereon, and we do not provide a separate opinion
on these matters. We have determined the matters described
below to be the key audit maters to be communicated in our
report.
Independent Auditor’s Report
S. No. Key Audit Matter Auditor’s response
1 Accuracy of recognition, measurement, presentation and disclosures of revenues and other related balances in view of adoption of Ind AS 115 “Revenue from Contracts with Customers” (new revenue accounting standard)
Principal Audit Procedures We assessed the Company’s process to identify the impact of adoption of the new revenue accounting standard.
Our audit approach consisted testing of the design and operating effectiveness of the internal controls and substantive testing as follows
• Evaluated the design of internal controls relating to implementation of the new revenue accounting standard.
• Selected a sample of continuing and new contracts, and tested the operating effectiveness of the internal control, relating to identification of the distinct performance obligations and determination of transaction price.
In Our opinion, the application of Ind AS 115 does not have material impact on the financial statement of the company.
154 | Fiem Industries Limited
Information Other than the Consolidated Financial Statements and Auditor’s Report thereon. (“Other information”)The Company’s Board of Directors is responsible for the other information. The other information comprises the information included in the “the management report and chairman’s statement report, but does not include the Consolidated financial statements and our auditor’s report thereon.
Our opinion on the consolidated financial statements does not cover the other information and we do not express any form of assurance conclusion thereon.
In connection with our audit of the consolidated financial statements, our responsibility is to read the other information and, in doing so, consider whether the other information is materially inconsistent with the consolidated financial statements or our knowledge obtained in the audit or otherwise appears to be materially misstated.
If, based on the work we have performed, we conclude that there is a material misstatement of this other information, we are required to report that fact. We have nothing to report in this regard
Responsibilities of Management and Those Charged with Governance for the Consolidated Financial Statements The Holding Company’s Board of Directors is responsible for the preparation and presentation of these consolidated financial statements in term of the requirements of the Companies Act, 2013 that give a true and fair view of the consolidated financial position, consolidated financial performance and consolidated cash flows of the Group including its Associates and Jointly controlled entities in accordance with the accounting principles generally accepted in India, including the Accounting Standards specified under section 133 of the Act. The respective Board of Directors of the companies included in the Group and of its associates and jointly controlled entities are responsible for maintenance of adequate accounting records in accordance with the provisions of the Act for safeguarding the assets of the Group and for preventing and detecting frauds and other irregularities; the selection and application of appropriate accounting policies; making judgments and estimates that are reasonable and prudent; and the design, implementation and maintenance of adequate internal financial controls, that were operating effectively for ensuring accuracy and completeness of the accounting records, relevant to the preparation and
presentation of the Consolidated financial statements that give a true and fair view and are free from material misstatement, whether due to fraud or error, which have been used for the purpose of preparation of the consolidated financial statements by the Directors of the Holding Company, as aforesaid.
In preparing the consolidated financial statements, the respective Board of Directors of the companies included in the Group and of its associates and jointly controlled entities are responsible for assessing the ability of the Group and of its associates and jointly controlled entities to continue as a going concern, disclosing, as applicable, matters related to going concern and using the going concern basis of accounting unless management either intends to liquidate the Group or to cease operations, or has no realistic alternative but to do so.
The respective Board of Directors of the companies included in the Group and of its associates and jointly controlled entities are responsible for overseeing the financial reporting process of the Group and of its associates and jointly controlled entities.
Auditor’s Responsibilities for the Audit of the Consolidated Financial Statements Our objectives are to obtain reasonable assurance about whether the consolidated financial statements as a whole are free from material misstatement, whether due to fraud or error, and to issue an auditor’s report that includes our opinion. Reasonable assurance is a high level of assurance, but is not a guarantee that an audit conducted in accordance with SAs will always detect a material misstatement when it exists. Misstatements can arise from fraud or error and are considered material if, individually or in the aggregate, they could reasonably be expected to influence the economic decisions of users taken on the basis of these consolidated financial statements.
As part of an audit in accordance with SAs, we exercise professional judgment and maintain professional skepticism throughout the audit. We also:
• Identify and assess the risks of material misstatement of the standalone financial statements, whether due to fraud or error, design and perform audit procedures responsive to those risks, and obtain audit evidence that is sufficient and appropriate to provide a basis for our opinion. The risk of not detecting a material misstatement resulting from fraud is
S. No. Key Audit Matter Auditor’s response
2 Evaluation of uncertain tax positionsThe Company has uncertain tax positions matters under dispute which involves significant judgment to determine the possible outcome of these disputes.
Refer Notes 35 to the Consolidated Financial Statements
Principal Audit ProceduresObtained details of completed tax assessments upto the year ended March 31, 2019 from management. We considered, the management’s underlying assumptions in estimating the tax provision and the possible outcome of the disputes. We also considered legal precedence and other rulings in evaluating management’s position on these uncertain tax positions. Additionally, we considered the effect of new information in respect of uncertain tax positions as at April 1, 2018 to evaluate whether any change was required to management’s position on these uncertainties.
Annual Report 2018-19 | 155
higher than for one resulting from error, as fraud may involve collusion, forgery, intentional omissions, misrepresentations, or the override of internal control.
• Obtain an understanding of internal financial control relevant to the audit in order to design audit procedures that are appropriate in the circumstances. Under section 143(3)(i) of the Act, we are also responsible for expressing our opinion on whether the company has adequate internal financial controls system in place and the operating effectiveness of such controls.
• Evaluate the appropriateness of accounting policies used and the reasonableness of accounting estimates and related disclosures made by the management.
• Conclude on the appropriateness of management’s use of the going concern basis of accounting and, based on the audit evidence obtained, whether a material uncertainty exists related to events or conditions that may cast significant doubt on the Company’s ability to continue as a going concern. If we conclude that a material uncertainty exists, we are required to draw attention in our auditor’s report to the related disclosures in the standalone financial statements or, if such disclosures are inadequate, to modify our opinion. Our conclusions are based on the audit evidence obtained up to the date of our auditor’s report. However, future events or conditions may cause the Company to cease to continue as a going concern.
• Evaluate the overall presentation, structure and content of the standalone financial statements, including the disclosures, and whether the standalone financial statements represent the underlying transactions and events in a manner that achieves fair presentation.
Materiality is the magnitude of misstatements in the standalone financial statements that, individually or in aggregate, makes it probable that the economic decisions of a reasonably knowledgeable user of the standalone financial statements may be influenced. We consider quantitative materiality and qualitative factors in (i) planning the scope of our audit work and in evaluating the results of our work; and (ii) to evaluate the effect of any identified misstatements in the standalone financial statements.
We communicate with those charged with governance regarding, among other matters, the planned scope and timing of the audit and significant audit findings, including any significant deficiencies in internal control that we identify during our audit.
We also provide those charged with governance with a statement that we have complied with relevant ethical requirements regarding independence, and to communicate with them all relationships and other matters that may reasonably be thought to bear on our independence, and where applicable, related safeguards.
From the matters communicated with those charged with governance, we determine those matters that were of most significance in the audit of the standalone financial statements of the current period and are therefore the key audit matters. We describe these matters in our auditor’s report unless law or regulation precludes public disclosure about the matter or when, in extremely rare circumstances, we determine that a matter should not be communicated in our report because the adverse consequences of doing so would reasonably be expected to outweigh the public interest benefits of such communication..
Other Matters a) We did not audit the financial statements of an associate M/s
Aisan Fiem Automotives India Private Ltd. The consolidated financial statements include the Company’s share of net loss/total comprehensive loss of Rs 105.05 lakhs for the year ended 31 March 2019, as considered in the consolidated inancial statements, in respect of the aforesaid which has not been audited by us. These financial statements have been audited by other auditor whose report have been furnished to us by the Management and our opinion on the consolidated financial statements, in so far as it relates to the amounts and disclosures included in respect of the associate, and our report in terms of sub-sections (3) and (11) of Section 143 of the Act, insofar as it relates to the aforesaid associate, is based solely on the report of the other auditor.
Our opinion on the Statement is not modified in respect of the above matters with respect to our reliance on the work done and the report of the other auditor.
b) We did not audit the financial statement of two overseas 50:50 Joint Venture, Centro Ricerche Fiem Horustech Srl (CRFH) and Fiem Kyowa (HK) Mould Company Limited, whose net loss of Rs 2.11 lakhs and Net profit of Rs 8.05 lakhs respectively are included in the accompanying consolidated financial statements, Such financial information have not been audited and have been approved by the Board of directors of the respective Companies. The management of the company has converted these financial statements as per Ind As and other accounting principle generally accepted in India, and certified these financial statements for the purpose of preparation of consolidated financial statement. Our report, in so far as it relates to these jointly controlled entities, is based solely on such unaudited financial statements. In our opinion and according to the information and explanations given to us by the management, these financial statements are not material to the Group
Our opinion on the Consolidated financial statements above, and our report on Other Legal and Regulatory Requirements below, is not modified in respect of the above matters with respect to our reliance on the work done and the reports of the other auditor and the financial statements /financial information certified by the Management
156 | Fiem Industries Limited
Annexure-A to the Independent Auditors’ ReportANNEXURE “A” TO THE INDEPENDENT AUDITOR’S REPORT OF EVEN DATE ON THE CONSOLIDATED IND AS FINANCIAL STATEMENTS OF FIEM INDUSTRIES LIMITED
Report on the Internal Financial Controls under Clause (i) of
Sub-section 3 of Section 143 of the Companies Act, 2013 (“the
Act”)
1. In conjunction with our audit of the consolidated Ind AS
financial statements of the Company as of and for the year
ended March 31, 2019, We have audited the internal financial
controls over financial reporting of FIEM INDUSTRIES
LIMITED (hereinafter referred to as “the Holding Company”)
and its one associate company, which are the companies
incorporated in India, as of that date
Management’s Responsibility for Internal Financial Controls
2. The Board of Directors of the of the Holding company and
its associate company which are incorporated in India, are
responsible for establishing and maintaining internal financial
controls based on the internal control over financial reporting
criteria established by the Company considering the essential
components of internal control stated in the Guidance Note
on Audit of Internal Financial Controls Over Financial Reporting
issued by the Institute of Chartered Accountants of India (ICAI)”.
These responsibilities include the design, implementation and
Report on Other Legal and Regulatory Requirements As required by Section 143(3) of the Act, we report, to the extent applicable, that:
a) We have sought and obtained all the information and explanations which to the best of our knowledge and belief were necessary for the purposes of our audit of the aforesaid consolidated financial statements.
b) In our opinion, proper books of account as required by law relating to preparation of the aforesaid consolidated financial statements have been kept so far as it appears from our examination of those books and the reports of the other auditors.
c) The Consolidated Balance Sheet, the Consolidated Statement of Profit and Loss, and the Consolidated Cash Flow Statement dealt with by this Report are in agreement with the relevant books of account maintained for the purpose of preparation of the consolidated financial statements
d) In our opinion, the aforesaid consolidated financial statements comply with the Accounting Standards specified under Section 133 of the Act.
e) On the basis of the written representations received from the directors of the Company as on 31st March, 2019 taken on record by the Board of Directors of the Company and the reports of the statutory auditors of its associate companies incorporated in India, none of the directors of the Group companies, its associate companies incorporated in India is disqualified as on 31st March, 2019 from being appointed as a director in terms of Section 164 (2) of the Act.
f) With respect to the adequacy of internal financial controls over financial reporting of the Group and the operating effectiveness of such controls, refer to our separate report in Annexure B and
g) With respect to the other matters to be included in the
Auditor’s Report in accordance with the requirements of section 197(16) of the Act, as amended:
In our opinion and to the best of our information and according to the explanations given to us, the remuneration paid by the Company to its directors during the year is in accordance with the provisions of section 197 of the Act.
h) With respect to the other matters to be included in the Auditor’s Report in accordance with Rule 11 of the Companies (Audit and Auditor’s) Rules, 2014, in our opinion and to the best of our information and according to the explanations given to us:
i. The consolidated financial statements disclose the impact of pending litigations on the consolidated financial position of the Group, its associates and subsidiary companies – Refer Note 35 to the consolidated financial statements.
ii. Provision has been made in the consolidated financial statements, as required under the applicable law or accounting standards, for material foreseeable losses, if any, on long-term contracts including derivative contracts
iii. There has been no delay in transferring amounts, required to be transferred, to the Investor Education and Protection Fund by the Holding Company and associate company incorporated in India.
for V. Sachdeva & Associates Chartered Accountants Firm Registration Number -004417N
Sd/- (V. Sachdev)Place: Rai, Sonepat (HR.) ProprietorDated: 14/05/2019 Membership No.:-083435
Annual Report 2018-19 | 157
maintenance of adequate internal financial controls that were
operating effectively for ensuring the orderly and efficient
conduct of its business, including adherence to the respective
company’s policies, the safeguarding of its assets, the
prevention and detection of frauds and errors, the accuracy
and completeness of the accounting records, and the timely
preparation of reliable financial information, as required under
the Companies Act, 2013.
Auditor’s Responsibility3. Our responsibility is to express an opinion on the Company's
internal financial controls over financial reporting based on
our audit. We conducted our audit in accordance with the
Guidance Note on Audit of Internal Financial Controls Over
Financial Reporting (the “Guidance Note”) issued by the ICAI
and the Standards on Auditing, issued by ICAI and deemed
to be prescribed under section 143(10) of the Companies
Act, 2013, to the extent applicable to an audit of internal
financial controls, both issued by the Institute of Chartered
Accountants of India. Those Standards and the Guidance
Note require that we comply with ethical requirements and
plan and perform the audit to obtain reasonable assurance
about whether adequate internal financial controls over
financial reporting was established and maintained and if
such controls operated effectively in all material respects.
4. Our audit involves performing procedures to obtain audit
evidence about the adequacy of the internal financial
controls system over financial reporting and their operating
effectiveness. Our audit of internal financial controls over
financial reporting included obtaining an understanding of
internal financial controls over financial reporting, assessing
the risk that a material weakness exists, and testing and
evaluating the design and operating effectiveness of
internal control based on the assessed risk. The procedures
selected depend on the auditor’s judgement, including the
assessment of the risks of material misstatement of the
financial statements, whether due to fraud or error.
5. We believe that the audit evidence we have obtained is
sufficient and appropriate to provide a basis for our audit
opinion on the Company’s internal financial controls system
over financial reporting.
Meaning of Internal Financial Controls Over Financial Reporting6. A company's internal financial control over financial reporting
is a process designed to provide reasonable assurance
regarding the reliability of financial reporting and the
preparation of financial statements for external purposes in
accordance with generally accepted accounting principles.
A company's internal financial control over financial
reporting includes those policies and procedures that (1)
pertain to the maintenance of records that, in reasonable
detail, accurately and fairly reflect the transactions and dispositions of the assets of the company; (2) provide reasonable assurance that transactions are recorded as necessary to permit preparation of financial statements in accordance with generally accepted accounting principles, and that receipts and expenditures of the company are being made only in accordance with authorisations of management and directors of the company; and (3) provide reasonable assurance regarding prevention or timely detection of unauthorised acquisition, use, or disposition of the company's assets that could have a material effect on the financial statements.
Inherent Limitations of Internal Financial Controls Over Financial Reporting7. Because of the inherent limitations of internal financial
controls over financial reporting, including the possibility of collusion or improper management override of controls, material misstatements due to error or fraud may occur and not be detected. Also, projections of any evaluation of the internal financial controls over financial reporting to future periods are subject to the risk that the internal financial control over financial reporting may become inadequate because of changes in conditions, or that the degree of compliance with the policies or procedures may deteriorate.
Opinion8. In our opinion, the Holding Company and its associate
company, in all material respects, an adequate internal financial controls system over financial reporting and such internal financial controls over financial reporting were operating effectively as at March 31, 2019, based on the internal control over financial reporting criteria established by the Company considering the essential components of internal control stated in the Guidance Note on Audit of Internal Financial Controls Over Financial Reporting issued by the Institute of Chartered Accountants of India
Other Matters 9. Our report under Section 143(3)(i) of the Act on the adequacy
and operating effectiveness of the internal financial controls over financial reporting of the Holding Company, insofar as it relates to the one associate Company, which is the Company incorporated in India, is based on the corresponding report of the auditors of such associate Company incorporated in India.
for V. Sachdeva & Associates Chartered Accountants Firm Registration Number -004417N
Sd/- (V. Sachdev)Place: Rai, Sonepat (HR.) ProprietorDated: 14/05/2019 Membership No.:-083435
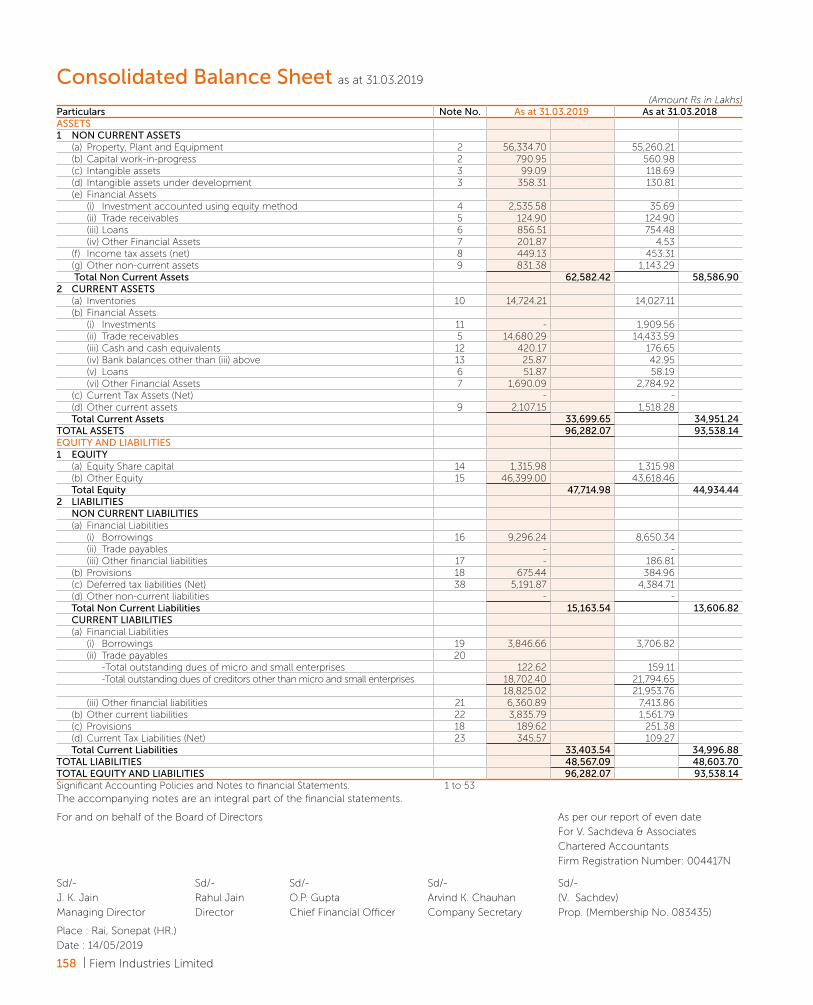
158 | Fiem Industries Limited
Consolidated Balance Sheet as at 31.03.2019
(Amount Rs in Lakhs) Particulars Note No. As at 31.03.2019 As at 31.03.2018ASSETS1 NON CURRENT ASSETS
(a) Property, Plant and Equipment 2 56,334.70 55,260.21 (b) Capital work-in-progress 2 790.95 560.98 (c) Intangible assets 3 99.09 118.69 (d) Intangible assets under development 3 358.31 130.81 (e) Financial Assets
(i) Investment accounted using equity method 4 2,535.58 35.69 (ii) Trade receivables 5 124.90 124.90 (iii) Loans 6 856.51 754.48 (iv) Other Financial Assets 7 201.87 4.53
(f) Income tax assets (net) 8 449.13 453.31 (g) Other non-current assets 9 831.38 1,143.29 Total Non Current Assets 62,582.42 58,586.90
2 CURRENT ASSETS(a) Inventories 10 14,724.21 14,027.11 (b) Financial Assets
(i) Investments 11 - 1,909.56 (ii) Trade receivables 5 14,680.29 14,433.59 (iii) Cash and cash equivalents 12 420.17 176.65 (iv) Bank balances other than (iii) above 13 25.87 42.95 (v) Loans 6 51.87 58.19 (vi) Other Financial Assets 7 1,690.09 2,784.92
(c) Current Tax Assets (Net) - - (d) Other current assets 9 2,107.15 1,518.28 Total Current Assets 33,699.65 34,951.24
TOTAL ASSETS 96,282.07 93,538.14 EQUITY AND LIABILITIES 1 EQUITY
(a) Equity Share capital 14 1,315.98 1,315.98 (b) Other Equity 15 46,399.00 43,618.46 Total Equity 47,714.98 44,934.44
2 LIABILITIES NON CURRENT LIABILITIES (a) Financial Liabilities
(i) Borrowings 16 9,296.24 8,650.34 (ii) Trade payables - - (iii) Other financial liabilities 17 - 186.81
(b) Provisions 18 675.44 384.96 (c) Deferred tax liabilities (Net) 38 5,191.87 4,384.71 (d) Other non-current liabilities - - Total Non Current Liabilities 15,163.54 13,606.82 CURRENT LIABILITIES (a) Financial Liabilities
(i) Borrowings 19 3,846.66 3,706.82 (ii) Trade payables 20 -Total outstanding dues of micro and small enterprises 122.62 159.11 -Total outstanding dues of creditors other than micro and small enterprises 18,702.40 21,794.65
18,825.02 21,953.76 (iii) Other financial liabilities 21 6,360.89 7,413.86
(b) Other current liabilities 22 3,835.79 1,561.79 (c) Provisions 18 189.62 251.38 (d) Current Tax Liabilities (Net) 23 345.57 109.27 Total Current Liabilities 33,403.54 34,996.88
TOTAL LIABILITIES 48,567.09 48,603.70 TOTAL EQUITY AND LIABILITIES 96,282.07 93,538.14 Significant Accounting Policies and Notes to financial Statements. 1 to 53The accompanying notes are an integral part of the financial statements.
For and on behalf of the Board of Directors As per our report of even date
For V. Sachdeva & Associates
Chartered Accountants
Firm Registration Number: 004417N
Sd/- Sd/- Sd/- Sd/- Sd/-
J. K. Jain Rahul Jain O.P. Gupta Arvind K. Chauhan (V. Sachdev)
Managing Director Director Chief Financial Officer Company Secretary Prop. (Membership No. 083435)
Place : Rai, Sonepat (HR.)
Date : 14/05/2019
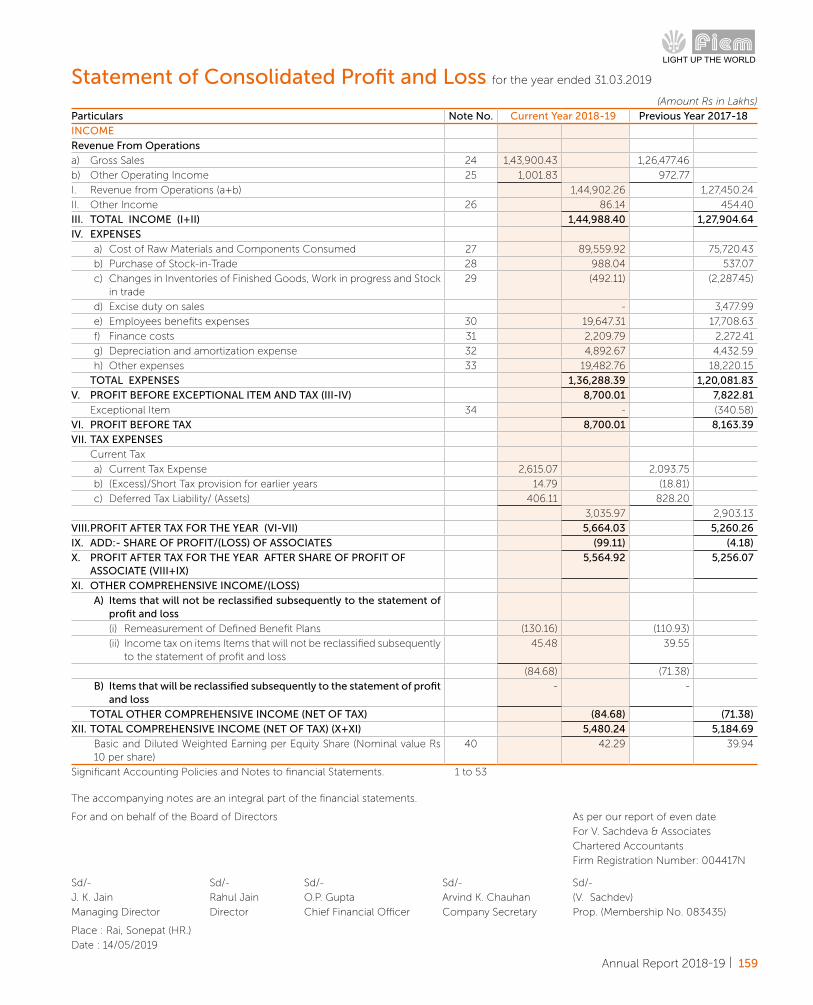
Annual Report 2018-19 | 159
Statement of Consolidated Profit and Loss for the year ended 31.03.2019
(Amount Rs in Lakhs)
Particulars Note No. Current Year 2018-19 Previous Year 2017-18
INCOME
Revenue From Operations
a) Gross Sales 24 1,43,900.43 1,26,477.46
b) Other Operating Income 25 1,001.83 972.77
I. Revenue from Operations (a+b) 1,44,902.26 1,27,450.24
II. Other Income 26 86.14 454.40
III. TOTAL INCOME (I+II) 1,44,988.40 1,27,904.64
IV. EXPENSES
a) Cost of Raw Materials and Components Consumed 27 89,559.92 75,720.43
b) Purchase of Stock-in-Trade 28 988.04 537.07
c) Changes in Inventories of Finished Goods, Work in progress and Stock in trade
29 (492.11) (2,287.45)
d) Excise duty on sales - 3,477.99
e) Employees benefits expenses 30 19,647.31 17,708.63
f) Finance costs 31 2,209.79 2,272.41
g) Depreciation and amortization expense 32 4,892.67 4,432.59
h) Other expenses 33 19,482.76 18,220.15
TOTAL EXPENSES 1,36,288.39 1,20,081.83
V. PROFIT BEFORE EXCEPTIONAL ITEM AND TAX (III-IV) 8,700.01 7,822.81
Exceptional Item 34 - (340.58)
VI. PROFIT BEFORE TAX 8,700.01 8,163.39
VII. TAX EXPENSES
Current Tax
a) Current Tax Expense 2,615.07 2,093.75
b) (Excess)/Short Tax provision for earlier years 14.79 (18.81)
c) Deferred Tax Liability/ (Assets) 406.11 828.20
3,035.97 2,903.13
VIII. PROFIT AFTER TAX FOR THE YEAR (VI-VII) 5,664.03 5,260.26
IX. ADD:- SHARE OF PROFIT/(LOSS) OF ASSOCIATES (99.11) (4.18)
X. PROFIT AFTER TAX FOR THE YEAR AFTER SHARE OF PROFIT OF ASSOCIATE (VIII+IX)
5,564.92 5,256.07
XI. OTHER COMPREHENSIVE INCOME/(LOSS)
A) Items that will not be reclassified subsequently to the statement of profit and loss
(i) Remeasurement of Defined Benefit Plans (130.16) (110.93)
(ii) Income tax on items Items that will not be reclassified subsequently to the statement of profit and loss
45.48 39.55
(84.68) (71.38)
B) Items that will be reclassified subsequently to the statement of profit and loss
- -
TOTAL OTHER COMPREHENSIVE INCOME (NET OF TAX) (84.68) (71.38)
XII. TOTAL COMPREHENSIVE INCOME (NET OF TAX) (X+XI) 5,480.24 5,184.69
Basic and Diluted Weighted Earning per Equity Share (Nominal value Rs 10 per share)
40 42.29 39.94
Significant Accounting Policies and Notes to financial Statements. 1 to 53
The accompanying notes are an integral part of the financial statements.
For and on behalf of the Board of Directors As per our report of even date
For V. Sachdeva & Associates
Chartered Accountants
Firm Registration Number: 004417N
Sd/- Sd/- Sd/- Sd/- Sd/-
J. K. Jain Rahul Jain O.P. Gupta Arvind K. Chauhan (V. Sachdev)
Managing Director Director Chief Financial Officer Company Secretary Prop. (Membership No. 083435)
Place : Rai, Sonepat (HR.)
Date : 14/05/2019

160 | Fiem Industries Limited
Consolidated Statement of Changes in Equity for the year ended 31.03.2019
A. Equity Share Capital Particulars Note No. Number Amount Rs in
Lakhs
Equity share of Rs 10/- each Issued, subscribed and fully paid
Balance as at 1st April 2017 1,31,59,830 1,315.98
Changes in equity share capital during the year - -
Balance as at 1st April 2018 1,31,59,830 1,315.98
Changes in equity share capital during the year - -
Balance as at 31st March 2019 14 1,31,59,830 1,315.98
B. Other Equity (Amount Rs in Lakhs)
Particulars Note
No.
Securities
Premium
Reserve
General
Reserve
Translation
reserve
Retained
Earnings
Total
Balance as at 1st April 2017 16,722.77 2760.00 (1.15) 20,214.19 39,695.81
Addition during the year
1) Profit for the year 5,256.07 5,256.07
2) Other Comprehensive Income for the Year (71.38) (71.38)
3) Exchange Difference on translation 5.07 5.07
Deduction during the year
1) Transfer to General Reserve 520.00 (520.00) -
2) Dividend Paid (Rs 8 per share) (1,052.79) (1,052.79)
3) Tax on dividend paid (214.32) (214.32)
Balance as at 1st April 2018 16,722.77 3,280.00 3.92 23,611.77 43,618.46
Addition during the year
1) Profit for the year 5,564.92 5,564.92
2) Other Comprehensive Income for the Year (84.68) (84.68)
3) Exchange Difference on translation (2.64) (2.64)
Deduction during the year
1) Transfer to General Reserve 560.00 (560.00) -
2) Dividend Paid (Rs 9 per share) (1,184.38) (1,184.38)
3) Tax on dividend paid (243.49) (243.49)
4) Interim Dividend Paid (Rs 8 per share) (1,052.79) (1,052.79)
5) Tax on Interim dividend paid (216.40) (216.40)
Balance as at 31st March 2019 15 16,722.77 3,840.00 1.28 25,834.95 46,399.00
Significant Accounting Policies and Notes to financial Statements. 1 to 53
The accompanying notes are an integral part of the financial statements.
For and on behalf of the Board of Directors As per our report of even date
For V. Sachdeva & Associates
Chartered Accountants
Firm Registration Number: 004417N
Sd/- Sd/- Sd/- Sd/- Sd/-
J. K. Jain Rahul Jain O.P. Gupta Arvind K. Chauhan (V. Sachdev)
Managing Director Director Chief Financial Officer Company Secretary Prop. (Membership No. 083435)
Place : Rai, Sonepat (HR.)
Date : 14/05/2019
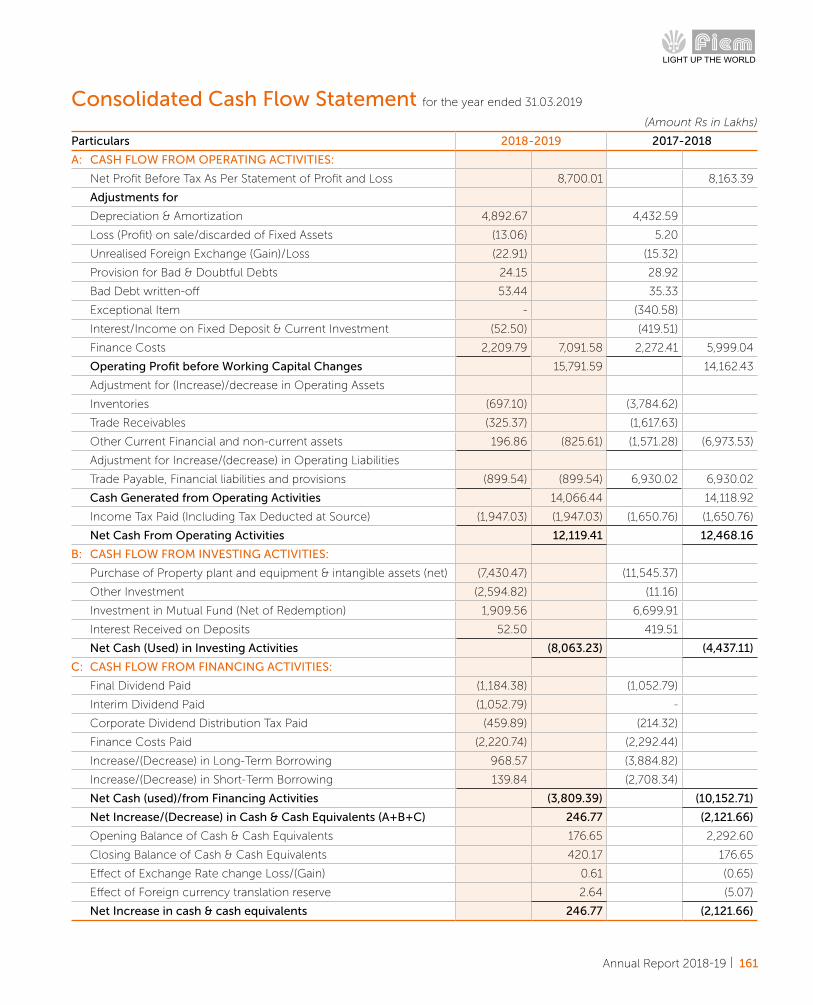
Annual Report 2018-19 | 161
Consolidated Cash Flow Statement for the year ended 31.03.2019
(Amount Rs in Lakhs)
Particulars 2018-2019 2017-2018
A: CASH FLOW FROM OPERATING ACTIVITIES:
Net Profit Before Tax As Per Statement of Profit and Loss 8,700.01 8,163.39
Adjustments for
Depreciation & Amortization 4,892.67 4,432.59
Loss (Profit) on sale/discarded of Fixed Assets (13.06) 5.20
Unrealised Foreign Exchange (Gain)/Loss (22.91) (15.32)
Provision for Bad & Doubtful Debts 24.15 28.92
Bad Debt written-off 53.44 35.33
Exceptional Item - (340.58)
Interest/Income on Fixed Deposit & Current Investment (52.50) (419.51)
Finance Costs 2,209.79 7,091.58 2,272.41 5,999.04
Operating Profit before Working Capital Changes 15,791.59 14,162.43
Adjustment for (Increase)/decrease in Operating Assets
Inventories (697.10) (3,784.62)
Trade Receivables (325.37) (1,617.63)
Other Current Financial and non-current assets 196.86 (825.61) (1,571.28) (6,973.53)
Adjustment for Increase/(decrease) in Operating Liabilities
Trade Payable, Financial liabilities and provisions (899.54) (899.54) 6,930.02 6,930.02
Cash Generated from Operating Activities 14,066.44 14,118.92
Income Tax Paid (Including Tax Deducted at Source) (1,947.03) (1,947.03) (1,650.76) (1,650.76)
Net Cash From Operating Activities 12,119.41 12,468.16
B: CASH FLOW FROM INVESTING ACTIVITIES:
Purchase of Property plant and equipment & intangible assets (net) (7,430.47) (11,545.37)
Other Investment (2,594.82) (11.16)
Investment in Mutual Fund (Net of Redemption) 1,909.56 6,699.91
Interest Received on Deposits 52.50 419.51
Net Cash (Used) in Investing Activities (8,063.23) (4,437.11)
C: CASH FLOW FROM FINANCING ACTIVITIES:
Final Dividend Paid (1,184.38) (1,052.79)
Interim Dividend Paid (1,052.79) -
Corporate Dividend Distribution Tax Paid (459.89) (214.32)
Finance Costs Paid (2,220.74) (2,292.44)
Increase/(Decrease) in Long-Term Borrowing 968.57 (3,884.82)
Increase/(Decrease) in Short-Term Borrowing 139.84 (2,708.34)
Net Cash (used)/from Financing Activities (3,809.39) (10,152.71)
Net Increase/(Decrease) in Cash & Cash Equivalents (A+B+C) 246.77 (2,121.66)
Opening Balance of Cash & Cash Equivalents 176.65 2,292.60
Closing Balance of Cash & Cash Equivalents 420.17 176.65
Effect of Exchange Rate change Loss/(Gain) 0.61 (0.65)
Effect of Foreign currency translation reserve 2.64 (5.07)
Net Increase in cash & cash equivalents 246.77 (2,121.66)
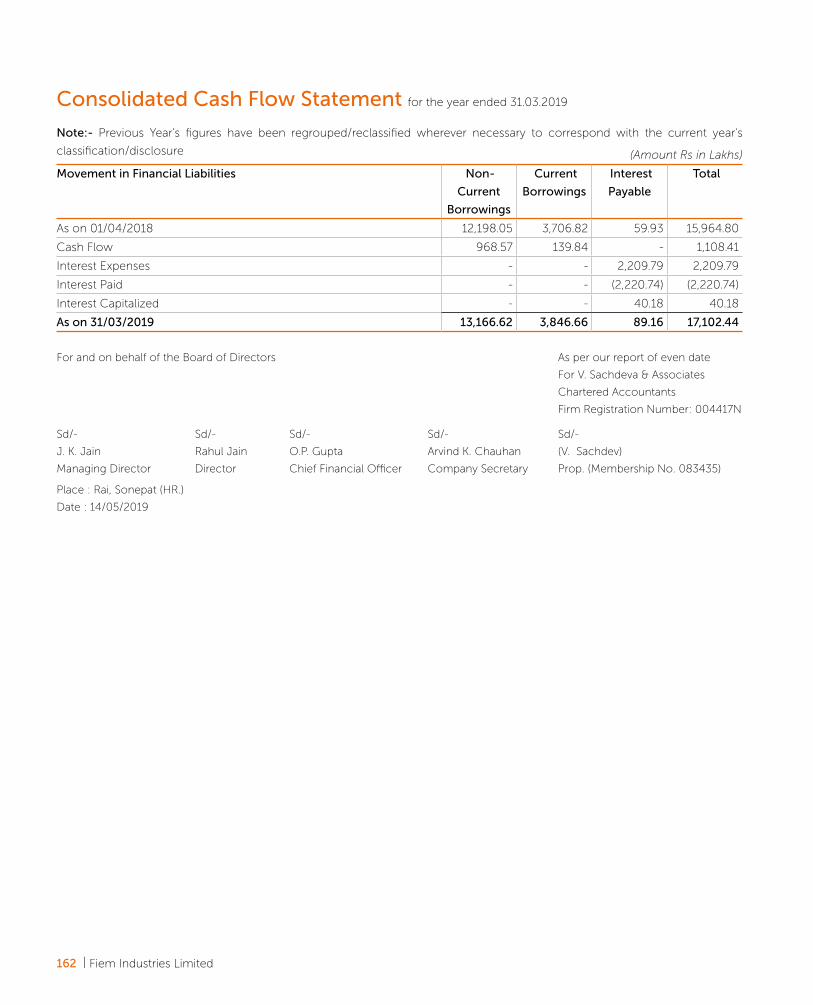
162 | Fiem Industries Limited
Consolidated Cash Flow Statement for the year ended 31.03.2019
Note:- Previous Year's figures have been regrouped/reclassified wherever necessary to correspond with the current year's
classification/disclosure (Amount Rs in Lakhs)
Movement in Financial Liabilities Non-
Current
Borrowings
Current
Borrowings
Interest
Payable
Total
As on 01/04/2018 12,198.05 3,706.82 59.93 15,964.80
Cash Flow 968.57 139.84 - 1,108.41
Interest Expenses - - 2,209.79 2,209.79
Interest Paid - - (2,220.74) (2,220.74)
Interest Capitalized - - 40.18 40.18
As on 31/03/2019 13,166.62 3,846.66 89.16 17,102.44
For and on behalf of the Board of Directors As per our report of even date
For V. Sachdeva & Associates
Chartered Accountants
Firm Registration Number: 004417N
Sd/- Sd/- Sd/- Sd/- Sd/-
J. K. Jain Rahul Jain O.P. Gupta Arvind K. Chauhan (V. Sachdev)
Managing Director Director Chief Financial Officer Company Secretary Prop. (Membership No. 083435)
Place : Rai, Sonepat (HR.)
Date : 14/05/2019
Annual Report 2018-19 | 163
Notes to the Consolidated Financial Statements for the year ended 31.03.2019
1. GENERAL INFORMATION
Fiem Industries Limited ("The Company") is a public limited company domiciled in India and incorporated under the
provisions of the Companies Act, 1956. The address of its registered office is D-34, DSIDC Packaging Complex, Kirti Nagar,
New Delhi-110015. Its shares are listed on National Stock Exchange and Bombay Stock Exchange in India. The Company is in
the business of manufacturing and supply of auto components comprising of automotive lighting & signalling equipments,
rear-view mirror, prismatic mirror, plastic moulded parts and sheet metal components for motorised vehicles, and LED
luminaries comprising of indoor and outdoor lighting, display panels and integrated passengers information system.
Significant Accounting Policies
(A) Statement of Compliance
The financial statement has been prepared as a going concern in accordance with Indian Accounting Standards (Ind
AS) notified under the Section 133 of the Companies Act, 2013 ("the Act) read with the Companies (Indian Accounting
Standards) Rules, 2015 and other relevant provision of the Act.
These standalone financial statements are approved by the Company’s Board of Directors on 14 May 2019.
(AA) Accounting policies applicable in consolidated financial statements
(i) The Company combines the financial statements of the parent and its subsidiaries line by line adding together like
items of assets, liabilities, equity, income and expenses. Inter-company transactions, balances and unrealised gains
on transactions between group companies are eliminated.
(ii) Interests in joint ventures are accounted for using the equity method (see (iv) below), after initially being recognised
at cost in the consolidated balance sheet.
(iii) The results and financial position of foreign operations that have a functional currency different from the presentation
currency are translated into the presentation currency as follows:
– assets and liabilities are translated at the closing rate at the date of that Balance Sheet
– income and expenses are translated at average exchange rates
– All resulting exchange differences are recognised in statement of profit & loss
(iv) Deferred tax liabilities are not recognised for temporary differences between the carrying amount and tax bases
of investments in subsidiaries where the Company is able to control the timing of the reversal of the temporary
differences and it is probable that the differences will not reverse in the foreseeable future."
(v) In case of foreign subsidiaries being non-integral foreign operations, any exchange difference arising on consolidation
is recognised in the Translation reserve.
(vi) The company has three wholly owned foreign subsidiary i.e. Fiem Industries Japan Co. Ltd. incorporated in Japan,
Fiem (Thai) Design & Technology Co. Ltd incorporated in Thailand and Fiem Research & Technology SRL incorporated
in Italy and three joint venture i.e. Centro Ricerche Fiem Horustech SRL, Fiem Kyowa (HK) Mould Company Limited
and Aisan Fiem Automotive India Pvt Ltd which have been considered for consolidation.
(B) Accounting Convention
The financial statements have been prepared on the historical cost convention on accrual basis except for certain
financial instruments which are measured at fair value at end of each reporting period, as explained in the accounting
polices mentioned below. The accounting policies have been applied consistently over all the periods presented in these
financial statements.
(C) Use of Estimates and Judgements
The preparation of financial statements in conformity with Ind AS requires management to make judgements, estimates,

164 | Fiem Industries Limited
and assumptions that affect the application of accounting policies and reported amount of assets, liabilities, income,
expenses and disclosures of contingent assets and liabilities at the date of these financial statements and the reported
amount of revenues and expenses for the years presented. Actual results may differ from the estimates.
Estimates and underlying assumptions are reviewed at each balance sheet date. Revision to accounting estimates are
recognised in the period in which the estimates are revised and in which future periods are also affected.
Assumptions and estimation uncertainties and judgements
Information about judgements, assumptions and estimation uncertainties that have significant risk of resulting in a
material adjustment in the year ending 31 March 2019 and judgements made in applying accounting policies that have
the most significant effects on the amounts recognised in the standalone financial statements is included in the following
notes:
(i) Recognition of deferred tax assets - note 38 - The Company has recognized deferred tax assets and concluded that
the deferred tax assets will be recoverable using the estimated future taxable income based on the experience and
future projections. The Company is expected to generate adequate taxable income for liquidating these assets in
due course of time.
(ii) Provision for employee benefits - note 44 - The measurement of obligations and assets related to defined benefit
plans makes it necessary to use several statistical and other factors that attempt to anticipate future events. These
factors include assumptions about the discount rate, the rate of future compensation increases, withdrawal, mortality
rates etc. The management has used the past trends and future expectations in determining the assumptions which
are used in measurements of obligations.
(iii) Provision for warranty - note 18 - The provision is based on historical warranty data and weighing of all possible
outcomes by their associated probabilities. Provisions for warranties are adjusted regularly to take account of new
circumstances and the impact of any changes recognised in the income statement.
(iv) Classification between property, plant & equipment and investment property - The Company has certain vacant
land. The management has currently classified such property as property, plant & equipment since the management
believes that the property is held for future use as an “owner occupied property”.
(v) Tools, mould and dies - Revenue from sale of tools, mould and dies is recognised on a completed contract method
considering that substantial activity for preparation of mould is outsourced to sub-contractors. Further, development
of such tools, moulds and dies does not take the substantial time period, unless due to procedural delays from the
customer’s end.
New standards and interpretations not yet adopted
Appendix C to Ind AS 12, Uncertainty over Income Tax Treatments: On March 30, 2019, Ministry of Corporate Affairs
("MCA") has notified the Companies (Indian Accounting Standards) Amendment Rules, 2019 containing Appendix C to
Ind AS 12, Uncertainty over Income Tax Treatments which clarifies the application and measurement requirements in
Ind AS 12 when there is uncertainty over income tax treatments. The current and deferred tax asset or liability shall be
recognized and measured by applying the requirements in Ind AS 12 based on the taxable profit (tax loss), tax bases,
unused tax losses, unused tax credits and tax rates determined by applying this appendix. The amendment is effective for
annual periods beginning on or after April 1, 2019.
Ind AS 116 'Leases': On March 30, 2019, the Ministry of Corporate Affairs notified the Companies (Indian Accounting
Standards) Amendment Rules, 2019 containing Ind AS 116 – Leases and related amendments to other Ind AS. Ind AS
116 replaces Ind AS 17 'Leases' and related interpretation and guidance. The standard sets out principles for recognition,
measurement, presentation and disclosure of leases for both parties to a contract i.e., the lessee and the lessor. Ind AS
116 introduces a single lessee accounting model and requires a lessee to recognise assets and liabilities for all leases
Notes to the Consolidated Financial Statements for the year ended 31.03.2019
Annual Report 2018-19 | 165
with a term of more than 12 months, unless the underlying asset is of low value. Currently, operating lease expenses are
charged to the statement of profit and loss. The Standard also contains enhanced disclosure requirements for lessees.
Ind AS 116 substantially carries forward the lessor accounting requirements as per Ind AS 17. Ind AS 116 is effective for
annual periods beginning on or after April 1, 2019.
Amendment to Ind AS 19 'Employee Benefits': On March 30, 2019, the Ministry of Corporate Affairs has notified limited
amendments to Ind AS 19 'Employee Benefits' in connection with accounting for plan amendments, curtailments and
settlements. The amendments require an entity to use updated assumptions to determine current service cost and net
interest for the remainder of the period after a plan amendment, curtailment or settlement and to recognise in profit or
loss as part of past service cost, or a gain or loss on settlement, any reduction in a surplus, even if that surplus was not
previously recognised because of the impact of the asset ceiling. The amendment will come into force for accounting
periods beginning on or after April 1, 2019, though early application is permitted.
Amendment to Ind AS 12 'Income Taxes': On March 30, 2019, the Ministry of Corporate Affairs has notified limited
amendments to Ind AS 12 'Income Taxes'. The amendments require an entity to recognise the income tax consequences
of dividends as defined in Ind AS 109 when it recognises a liability to pay a dividend. The income tax consequences of
dividends are linked more directly to past transactions or events that generated distributable profits than to distributions
to owners. Therefore, an entity shall recognize the income tax consequences of dividends in profit or loss, other
comprehensive income or equity according to where the entity originally recognised those past transactions or events.
The amendment will come into force for accounting periods beginning on or after April 1, 2019. The Company is
evaluating the effect of the above on its financial statements.
The Company is evaluating the effect of the above on its financial statements
(D) Current-Non Current Classification
All assets and liabilities are classified into current and non-current.
Assets
An asset is classified as current when it satisfies any of the following criteria:
(a) it is expected to be realised in, or is intended for sale or consumption in, the Company's normal operating cycle;
(b) it is held primarily for the purpose of being traded;
(c) it is expected to be realised within 12 months after the reporting date; or;
(d) it is cash or cash equivalent unless it is restricted from being exchanged or used to settle a liability for a least 12
months after the reporting date
Liabilities
A liability is classified as current when it satisfies any of the following criteria:
(a) it is expected to be settled in the Company's normal operating cycle;
(b) it is held primarily for the purpose of being traded;
(c) it is due to be settled within 12 months after the reporting date; or;
(d) the company does not have an unconditional right to defer settlement of the liability for at least 12 months after the
reporting date. Terms of a liability that could, at the option of the counterparty, result in its settlement by the issue of
equity instruments do not affect its classification.
Operating Cycle
Based on the nature of products/activities of the Company and the normal time between the acquisition of assets for
processing and their realisation in cash or cash equivalents, the Company has determined its operating cycle as 12
months for the purpose of current and non current classification of assets and liabilities
Notes to the Consolidated Financial Statements for the year ended 31.03.2019
166 | Fiem Industries Limited
(E) Property, Plant and Equipment
Property, plant and equipment held for use in the production or supply of goods or services, or for administrative
purposes, are stated in the balance sheet at cost less accumulated depreciation and accumulated impairment losses.
Cost of acquisition is inclusive of freight, duties, taxes, and other incidental expenses. Freehold land is not depreciated.
Properties in the course of construction for production, supply or administrative purposes are carried at cost, less any
recognised impairment loss. Cost includes items directly attributable to the construction or acquisition of the items of
property, plant and equipment. For qualifying assets borrowing costs are capitalised in accorance with the Company's
accounting policy. Such properties are classified to the appropriate categories of property, plant and equipment when
completed and ready for intended use. Depreciation of these assets is provided on the same basis as-other property
assets & commences when the assets are ready for their intended use.
Subsequent costs are included in the assets's carrying amount only when it is probable that future economic benefits
associated with the items will flow to the Company and the cost of the item can be measured reliably. The cost for day-
to-day servicing of property, plant and equipment are recognized in Statement of Profit and Loss as and when incuured.
The estimated useful lives, residual values and depreciation method are reviewed at the end of each reporting period,
with the effect of any changes in estimate accounted for on a prospective basis.
Depreciation is calculated using the straight-line method on a pro-rata basis from the date in which each asset is put to
use to allocate their cost, net of their residual values, over their useful life generally in accordance with that provided in
the Schedule II to the Act. Moulds and dies & tools are depreciated over a period of 6 years.
Leasehold land is amortised over the primary period of lease
An item of property, plant and equipment is derecognised upon disposal or when no future economic benefits are
expected to arise from the continued use of the asset. Any gain or loss arising on the disposal or retirement of an item of
property, plant and equipment is determined as the difference between the sales proceeds and the carrying amount of
the asset and is recognised in statement of profit and loss.
Capital Work-in-Progress
Capital work-in-progress comprises the cost of property, plant and equipment that are not yet ready for their intended
use at the balance sheet date & expenditure during construction period pending allocation and fixed assets in transit
that are not yet received for their intended use at the balance sheet date. Depreciation is not charged on capital work in
progress until construction and installation are complete and asset ready for its intended use.
Capital Advances
Advances given towards acquisition of fixed assets outstanding at each Balance Sheet date are disclosed as Other Non-
Current Assets.
(F) Intangible Assets
Intangible assets acquired sepretary
Intangible assets with finite useful lives that are acquired separately are carried at cost less accumulated amortisation and
accumulated impairment losses. Amortization is recognised on a straight-line basis over their estimated useful lives. The
estimated useful life and amortization are reviewed at the end of each reporting period, with the effect of any changes
in estimate being accounted for on a prospective basis. Intangible assets with indefinite useful lives that are aquired
separately are carried at cost less accumulated impairment losses.
Intangible Assets Under Development
Intangible Assets Under Development comprises the cost of intangible assets that are not yet ready for their intended use
at the balance sheet date. Amortization is not charged on intangible assets under development.
Notes to the Consolidated Financial Statements for the year ended 31.03.2019
Annual Report 2018-19 | 167
(G) Financial Instruments
Financial assets and financial liabilities are recognised when the Company becomes a party to the contractual provisions
of the instrument. Financial assets and liabilities are initially measured at fair value. Transaction costs that are directly
attributable to the acquisition or issue of financial assets and financial liabilities (other than financial assets and financial
liabilities at fair value through profit or loss) are added to or deducted from the fair value measured on initial recognition
of financial asset or financial liability.
Cash and cash equivalents
The Company considers all highly liquid financial instruments, which are readily convertible into known amounts of cash
that are subject to an insignificant risk of change in value and having original maturities of three months or less from the
date of purchase, to be cash equivalents. Cash and cash equivalents includes balances with banks which are unrestricted
for withdrawal and usage.
Financial assets at amortised cost
Financial assets are subsequently measured at amortised cost if these financial assets are held within a business whose
objective is to hold these assets in order to collect contractual cash flows and the contractual terms of the financial
asset give rise on specified dates to cash flows that are solely payments of principal and interest on the principal amount
outstanding.
Financial assets at fair value through other comprehensive income
Financial assets are measured at fair value through other comprehensive income if these financial assets are held within
a business whose objective is achieved by both collecting contractual cash flows and selling financial assets and the
contractual terms of the financial asset give rise on specified dates to cash flows that are solely payments of principal and
interest on the principal amount outstanding.
Financial assets at fair value through profit or loss
Financial assets are measured at fair value through profit or loss unless it is measured at amortised cost or at fair value
through other comprehensive income on initial recognition. The transaction costs directly attributable to the acquisition
of assets and liabilities at fair value through profit and loss are immediately recognised in the statement of profit and loss.
Investment in subsidiaries and Joint Ventures
Investment in subsidiaries and joint ventures are measured at cost.
Financial liabilities
Financial liabilities are measured at amortised cost using the effective interest method.
Equity instruments
An equity instrument is a contract that evidences residual interest in the assets of the company after deducting all of its
liabilities. Company recognises equity instruments at proceeds received net off direct issue cost.
Reclassification of Financial Assets
The Company determines classification of financial assets and liabilities on initial recognition. After initial recognition, no
reclassification is made for financial assets which are equity instruments and financial liabilities. For financial assets which
are debt instruments, a reclassification is made only if there is a change in the business model for managing those assets.
Changes to the business model are expected to be infrequent. The Company’s senior management determines change
in the business model as a result of external or internal changes which are significant to the company’s operations.
Such changes are evident to external parties. A change in the business model occurs when a company either begins
or ceases to perform an activity that is significant to its operations. If the Company reclassifies financial assets, it applies
the reclassification prospectively from the reclassification date which is the first day of the immediately next reporting
period following the change in business model. The Company does not restate any previously recognized gains, losses
(including impairment gains and losses) or interest.
Notes to the Consolidated Financial Statements for the year ended 31.03.2019

168 | Fiem Industries Limited
Offsetting of financial instruments
Financial assets and financial liabilities are offset and the net amount is reported in the Balance Sheet if there is currently
enforceable legal right to offset the recognized amounts and there is an intention to settle on a net basis, to realize the
assets and settle the liabilities simultaneously.
(H) Inventory
(i) Raw materials, components, stores and spares are valued at lower of cost or net realizable value. However, raw
materials and other supplies held for use in the production of finished products are not written down below cost if
the finished products in which they will be incorporated are expected to be sold at or above cost. In determining the
cost, First in First Out method (FIFO) is used.
(ii) Semi-finished goods and finished goods are valued lower of cost or net realizable value. Cost includes direct materials
and direct labour and a proportion of manufacturing overheads based on normal operating capacity.
(iii) Moulds, block & dies are valued at lower of cost or net realizable value. Manufactured moulds, block & dies include
direct material, direct labour and a proportion of manufacturing overhead based on normal operating capacity. Cost
is determined on a First in First Out basis (FIFO).
(iv) Inventories of non-reusable waste say scrap for which facilities for reprocessing do not exist have been valued at net
realizable value.
(iv) Cost of inventories comprises all cost of purchase, cost of conversion and other costs incurred in bringing the
inventories to their present location and condition.
(v) Net realisable value is the estimated selling price in the ordinary course of business, less the estimated costs of
completion and the estimated costs necessary to make the sale.
(vi) Goods in transit are stated as a component of inventories if the significant risk and rewards of ownership have passed
to the company and valued at actual cost incurred up to the date of Balance Sheet.
(vii) Excise duty in respect of inventories of finished goods manufactured in pre-GST i.e up to 30.06.2017 has been shown
separately as a item of expense.
(I) Revenue Recognition
Revenue is measured at the fair value of the consideration received or receivable. Revenue is reduced for any trade
discounts, volume rebates & others similar allowances.
The Company has adopted Ind AS 115 'Revenue from Contracts with Customers' with the date of initial application being
April 1, 2018. Ind AS 115 establishes a comprehensive framework on revenue recognition. Ind AS 115 replaces Ind AS
18 'Revenue' and Ind AS 11 'Construction Contracts'. The application of Ind AS 115 did not have material impact on the
financial statements. As a result, the comparative information has not been restated.
Sale of Goods
The sale of goods in the course of ordinary activities is recognised when all significant risk & rewards of ownership of the
goods have transferred to the customer and no significant uncertainty exists regarding the amount of the consideration
that will be derived from the sale of goods and regarding its collection.
Revenue from operation up to in previous year 30.06.2017 includes excise duty but excludes value added taxes.
Rendering of Services
Service income is recognised as per the terms of contracts/arrangements when related services are performed.
Insurance Claim
Insurance claims lodged with insurance companies are accounted for on the basis of claim admitted/expected to be
admitted and to the extent that there is no uncertainty in receiving the claims.
Notes to the Consolidated Financial Statements for the year ended 31.03.2019
Annual Report 2018-19 | 169
Dividend and Interest Income
Dividend income from investments is recognized when the right to receive the dividend is established at the Balance
Sheet date.
Interest income from a financial asset is recognised when it is probable that the economic benefits will flow to the
Company and the amount of income can be measured reliably. Interest income is accrued on, time basis, by reference
to the principal outstanding and at the effective interest rate applicable, which is the rate that exactly discounts estimated
future cash receipts through the expected life of the financial asset to that asset's net carrying amount on initial recognition.
(J) Government Grants, Subsidies and Export Incentives
(i) Government grants and subsidies are recognised in the statement of profit and loss in accordance with related
schemes and when there is reasonable assurance that the Company will comply with the conditions attached to
them and the grants/subsidy will be received.
(ii) Duty drawback is recognised in the statement of profit and loss at the time of exports subject to the right to
entitlement has been established.
(K) Foreign Currency Transactions
Functional and Presentation Currency
The functional currency of the Company is Indian rupee.
Transactions and balances
Transactions in foreign currencies are recorded at the exchange rates prevailing on the date of transaction
Foreign currency monetary assets and liabilities such as cash, receivables, payables, etc., are translated at year end
exchange rates.
Non-monetary items denominated in foreign currency such as investments, fixed assets, inventories etc., are valued at
the exchange rate prevailing on the date of transaction.
Exchange differences arising on settlement of transactions and translation of monetary items are recognised as income
or expense in the year in which they arise.
Effective April 1, 2018 the company has adopted Appendix B to Ind AS 21- Foreign Currency Transactions and Advance
Consideration which clarifies the date of transaction for the purpose of determining the exchange rate to use on initial
recognition of the related asset, expense or income when an entity has received or paid advance consideration in a
foreign currency. The effect on account of adoption of this amendment was insignificant.
(L) Research and Development
Revenue expenditure pertaining to reserch is charged to Statement of Profit and Loss. Development costs of products
expenses are capitalized when the Company is certain to recover the development cost from future economic benefits.
Property, plant and equipment utilized for research and development are capitalized and depreciated/amortised in
accordance with the policies stated for property, plant and equipment & intangible assets.
(M) Employee Benefits
Short Term Employee Benefits:
All employee benefits payable wholly within twelve months of rendering the service are classified as short term employee
benefits and they are recognized in the period in which the employee renders the related service. These benefits include
salaries and wages, bonus etc. The Company recognizes the undiscounted amount of short term employee benefits
expected to be paid in exchange for services rendered as a liability (accrued expense) after deducting any amount already
paid.
Notes to the Consolidated Financial Statements for the year ended 31.03.2019
170 | Fiem Industries Limited
Post Employment Benefits:
Provident Fund & Employee State Insurance
Retirement Benefits in the form of Provident Fund and ESI schemes are a defined contribution plans as the Company
does not carry any further obligations, apart from the contributions made on a monthly basis and the contributions are
charged to Statement of Profit & Loss of the year when the contributions to the respective funds are due.
Earned Leave
Leave encashment is applicable to all permanent and full time employees of the company and is provided for on the
basis of actuarial valuation made at the end of each financial year using Projected Unit Credit Method. The present value
of the defined benefit obligation is determined by discounting the estimated future cash outflows using interest rates of
government bonds. Actuarial gains and losses arising from experience adjustments and changes in actuarial assumptions
are recognised in the statement of profit or loss in the period in which they arise. Past-service costs are recognised
immediately in statement of profit or loss.
Gratuity
The Company provides for gratuity, a defined benefit plan (the “Gratuity Plan”) covering eligible employees in accordance
with the Payment of Gratuity Act, 1972. The Gratuity Plan provides a lump sum payment to vested employees at retirement,
death, incapacitation or termination of employment, of an amount based on the respective employee’s salary and the
tenure of employment. The gratuity plan in Company is funded through annual contributions to Exide Life Insurance
Company under its Company’s Gratuity Scheme.
The liability or asset recognised in the balance sheet in respect of defined benefit gratuity plans is the present value of the
defined benefit obligation at the end of the reporting period less the fair value of plan assets. The Company’s liability is
actuarially determined (using the Projected Unit Credit method) at the end of each year. The present value of the defined
benefit obligation is determined by discounting the estimated future cash outflows using interest rates of government
bonds. Remeasurement gains and losses arising from experience adjustments and changes in actuarial assumptions
are charged or credited to equity in other comprehensive income in the period in which they arise. They are included
in retained earnings in the statement of changes in equity and in the balance sheet. Past-service costs are recognised
immediately in statement of profit or loss.
(N) Provisions and Contingent Liabilities
Provision
A provision is recognized when the Company has a present obligation as a result of past event, and it is probable that
an outflow of resources will be required to settle the obligation, in respect of which reliable estimate can be made. The
estimated liability for product warranties is recorded when products are sold based on technical evaluation.
Provisions are measured at the present value of management's best estimate of the expenditure required to settle the
present obligation at the end of the reporting period. The discount rate used to determine the present value is a pre-tax
rate the reflects current market assessment of the time value of money and the risk specific to the liability. The increase
in the provision due to the passage of time is recognised as interest expenses.
Contingent Liabilities
Wherever there is a possible obligation that arises from past events and whose existence will be confirmed only by the
occurrence or non-occurrence of one or more uncertain future events not wholly within the control of the entity or
a present obligation that arises from past events but is not recognised because (a) it is not probable that an outflow of
resources embodying economic benefits will be required to settle the obligation; or (b) the amount of the obligation
cannot be measured with sufficient reliability. Show cause notices are not considered as Contingent Liabilities unless
converted into demand.
Notes to the Consolidated Financial Statements for the year ended 31.03.2019
Annual Report 2018-19 | 171
(O) Taxation
Income Tax expense represent the sum of the tax currently payable and deferred tax
Current Income Tax
The tax currently payable is based on taxable profit for the year. Taxable profit differs from profit before tax as reported
in the statement of profit and loss because of income or expense that are taxable or deductible in other years and items
that are never taxable or deductible. The Company's current tax is calculated using tax rates that have been enacted
or substantively enacted by the end of the reporting period. Advance taxes and provisions for current income taxes
are presented in the balance sheet after off-setting advance tax paid and income tax provision arising in the same tax
jurisdiction and where the relevant tax paying unit intends to settle the asset and liability on a net basis.
Deferred Income Tax
Deferred income tax is recognised using the balance sheet approach. Deferred Tax is recognised on temporary differences
between the carrying amounts of assets and liabilities in the financial statements and the corrosponding tax base used
in the computation of taxable profit. Deferred tax liabilities are generally recognised for all taxable temporary differences.
Deferred tax assets are generally recognised for all deductible temporary differences to the extent it is probable that
taxable profits will be available against which those deductible temporary differences can be utilised.
The carrying amount of deferred tax assets is reviewed at the end of each reporting period and reduced to the extent that
it is no longer probable that sufficient taxable profits will be available to allow all or part of the asset to be recovered.
Deferred tax liabilities and assets are measured at the tax rates that are expected to apply in the period in which the
liability is settled or the asset relised, based on tax rates (and tax laws) that have been enacted or substantively enacted
by the end of the reporting period.
The mesurement of deferred tax liabilities and assets reflects the tax consequences that would follow from the manner
in which the Company expects, at the end of the reporting period, to recover or settle the carrying amount of its assets
and liabilities.
Deferred tax liabilities and assets are offset when they relate to income taxes levied by the same taxation authority and
the relevant entilty intends and has ability to settle its current tax assets and liabilities on a net basis.
Deferred tax assets include Minimum Alternate Tax (MAT) paid in accordance with the tax laws in India, which is likely to
give future econmic benefits in the form of availability of set off against future income tax liability. Accordingly, MAT is
recognised as deferred tax asset in the balance sheet when the asset can be measured reliably and it is probable that the
future economic benefit associated with the asset will be realised.
Current and Deferred Tax For The Year
Current and deferred tax are recognised in profit or loss, except when they relate to item that are recognised in other
comprehensive income or directly in equity, in which case, the current and deferred tax are also recognised in other
comprehensive income or directly in equity repectively.
(P) Borrowing Cost
Borrowing costs are interest and other costs that incurs in connection with the borrowing of funds and include interest
expense calculated using the effective interest method as described in Ind AS 39 Financial Instruments: Recognition
and Measurement, exchange differences arising from foreign currency borrowings to the extent they are regarded as an
adjustment to the interest cost.
Borrowing costs in connection with the borrowing of funds to the extent not directly related to the acquisition of
qualifying assets are charged to the Statement of Profit and Loss.
Borrowing costs, allocated to and utilised for qualifying assets, pertaining to the period from commencement of activities
Notes to the Consolidated Financial Statements for the year ended 31.03.2019
172 | Fiem Industries Limited
relating to construction / development of the qualifying asset up to the date of capitalisation of such asset is added to the
cost of the assets.
For general borrowing used for the purpose of obtaining a qualifying asset, the amount of borrowing costs eligible for
capitalization is determined by applying a capitalization rate to the expenditures on that asset. The capitalization rate is
the weighted average of the borrowing costs applicable to the borrowings of the Company that are outstanding during
the period, other than borrowings made specifically for the purpose of obtaining a qualifying asset. The amount of
borrowing costs capitalized during a period does not exceed the amount of borrowing cost incurred during that period.
Capitalisation of borrowing costs is suspended and charged to the Statement of Profit and Loss during extended periods
when active development activity on the qualifying assets is interrupted.
(Q) Impairment
Assets are tested for impairment whenever events or changes in circumstances indicate that the carrying amount may
not be recoverable. An impairment loss is recognised for the amount by which the assets's carrying amount exceeds
its recoverable amount. The recoverable amount is the higher of an assets's fair value less costs of disposal and value
in use. For the purpose of assesssing impairment, assets are grouped at the lowest levels for which there are separately
identifiable cash inflows which are largely independent of cash inflows from other assets or groups of assets (cash
generating units). Non-financial assets other than goodwill that suffuered an impairment are reviewed for possible
reversal of the impairment at the end of each reporting period.
(R) Cash Flow Statement
The Cash Flow Statement is prepared by the indirect method set out in Ind AS-7 on Cash Flow Statements and presents
cash flows by operating, investing and financing activities of the Company.
(S) Derivatives Instruments and Hedge Accounting
The Company enters into derivatives contracts in the nature of foreign currency swaps, currency options, forward
contracts etc. to hedge its exposure to movements in foreign exchange rates. The use of these contracts reduces the
risk or cost to the Company and the Company does not use those for trading or speculative purposes.
(T) Segment Reporting
Operating segments are reported in a manner consistent with the internal reporting provided to the Core Management
Committee which includes the Managing Director who is the Chief Operating Decision Maker. The Core Management
Committee examines performance both from product and a geographical perspective. The Company has identified two
reportable business segments viz. Automotive and LED Luminaries Segment on the basis of the nature of products, the
risk and return profile of individual business and the internal business reporting systems.
(U) Lease
Leases other than finance lease, are operating leases, and the such assets are not recognized on the Company’s balance
sheet. Payments under operating leases are recognized in statement of operations on a straight-line-basis over the term
of the lease.
(V) Dividend on Equity Share
Final dividends on equity shares are recorded on the date of approval by the shareholders of the Company.
(W) Earnings Per Share
The Basic and Diulated Earnings Per Share ("EPS") is computed by dividing the profit after tax (loss) for the year by
weighted average number of equity shares outstanding during the year. For the purpose of calculating diluted earning
per share, the net profit (loss) for the year attributable to equity shareholder and the weighted average number of share
outstanding during the year are adjusted for the effect of all dilutive potential equity shares. The weighted average
number of shares outstanding during the year are adjusted for events of bonus issue and share split, if any.
Notes to the Consolidated Financial Statements for the year ended 31.03.2019
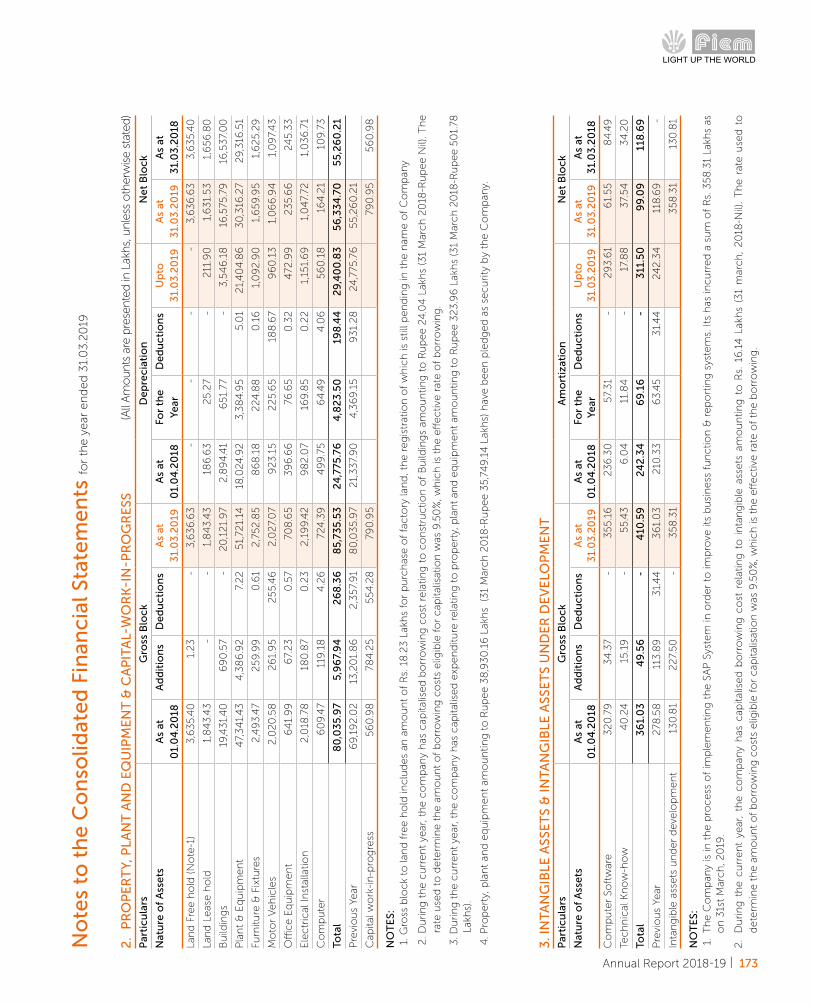
Annual Report 2018-19 | 173
No
tes
to t
he
Co
nso
lidat
ed
Fin
anci
al S
tate
me
nts
for
the y
ear
en
ded
31.
03.
20
19
2.
PR
OP
ER
TY,
PLA
NT
AN
D E
QU
IPM
EN
T &
CA
PIT
AL-
WO
RK
-IN
-PR
OG
RE
SS(A
ll A
mo
un
ts a
re p
rese
nte
d in
Lak
hs,
un
less
oth
erw
ise
stat
ed)
Par
ticu
lars
Gro
ss B
lock
De
pre
ciat
ion
Ne
t B
lock
Nat
ure
of
Ass
ets
As
at
01.
04
.20
18A
dd
itio
ns
De
du
ctio
ns
As
at
31.
03
.20
19A
s at
0
1.0
4.2
018
For
the
Ye
arD
ed
uct
ion
sU
pto
3
1.0
3.2
019
As
at
31.
03
.20
19A
s at
3
1.0
3.2
018
Lan
d F
ree h
old
(N
ote
-1)
3,6
35.
40
1
.23
-
3
,63
6.6
3
-
-
-
-
3,6
36
.63
3
,63
5.4
0
Lan
d L
eas
e h
old
1,8
43.
43
-
-
1
,84
3.4
3
18
6.6
3
25.
27
-
211
.90
1,6
31.
53
1
,65
6.8
0
Bu
ildin
gs
19,4
31.
40
6
90
.57
-
20
,12
1.9
7 2
,89
4.4
1 6
51.
77
-
3,5
46
.18
1
6,5
75.7
9
16
,53
7.0
0
Pla
nt
& E
qu
ipm
en
t 4
7,3
41.
43
4
,38
6.9
2
7.2
2
51,
721.
14
18
,024
.92
3
,38
4.9
5
5.0
1 2
1,4
04
.86
3
0,3
16.2
7 2
9,3
16.5
1
Furn
iture
& F
ixtu
res
2,4
93.
47
25
9.9
9
0.6
1 2
,75
2.8
5
86
8.1
8
224
.88
0
.16
1
,09
2.9
0
1,6
59.9
5
1,6
25.
29
Mo
tor
Veh
icle
s 2
,02
0.5
8
26
1.9
5
25
5.4
6
2,0
27.
07
92
3.15
2
25.
65
1
88
.67
96
0.1
3
1,0
66
.94
1
,09
7.4
3
Offi
ce E
qu
ipm
en
t 6
41.
99
6
7.2
3
0.5
7 7
08
.65
3
96
.66
7
6.6
5
0.3
2
472
.99
2
35.
66
2
45.
33
Ele
ctr
ical
Inst
alla
tion
2,0
18.7
8
18
0.8
7 0
.23
2
,19
9.4
2
98
2.0
7 1
69.8
5
0.2
2
1,1
51.
69
1
,04
7.72
1
,03
6.7
1
Co
mp
ute
r 6
09.4
7 1
19.1
8
4.2
6
724
.39
4
99.7
5
64
.49
4
.06
56
0.1
8 1
64
.21
10
9.7
3
Tota
l 8
0,0
35
.97
5,9
67.
94
2
68
.36
8
5,7
35
.53
2
4,7
75.7
6
4,8
23
.50
19
8.4
4 2
9,4
00
.83
5
6,3
34
.70
5
5,2
60
.21
Pre
vio
us
Year
6
9,1
92
.02
1
3,2
01.
86
2
,35
7.9
1 8
0,0
35.
97
21,
33
7.9
0
4,3
69.1
5
93
1.2
8
24
,775
.76
5
5,2
60
.21
Cap
ital w
ork
-in
-pro
gre
ss
56
0.9
8
78
4.2
5
55
4.2
8
79
0.9
5
79
0.9
5
56
0.9
8
NO
TE
S:
1. G
ross
blo
ck
to la
nd
fre
e h
old
inclu
des
an a
mo
un
t o
f R
s. 1
8.2
3 L
akh
s fo
r p
urc
has
e o
f fa
cto
ry la
nd
, th
e r
eg
istr
atio
n o
f w
hic
h is
stil
l pen
din
g in
th
e n
ame o
f C
om
pan
y
2. D
uri
ng
th
e c
urr
en
t ye
ar, t
he c
om
pan
y h
as c
apita
lised
bo
rro
win
g c
ost
rela
ting
to
co
nst
ructio
n o
f B
uild
ing
s am
ou
ntin
g t
o R
up
ee 2
4.0
4 L
akh
s (3
1 M
arch
20
18-R
up
ee N
il). T
he
rate
use
d t
o d
ete
rmin
e t
he a
mo
un
t o
f b
orr
ow
ing
co
sts
elig
ible
fo
r cap
italis
atio
n w
as 9
.50
%, w
hic
h is
th
e e
ffectiv
e r
ate o
f b
orr
ow
ing
.
3. D
uri
ng
th
e c
urr
en
t ye
ar, t
he c
om
pan
y h
as c
apita
lised
exp
en
ditu
re r
ela
ting
to
pro
pert
y, p
lan
t an
d e
qu
ipm
en
t am
ou
ntin
g t
o R
up
ee 3
23.
96
Lak
hs
(31
Mar
ch
20
18-R
up
ee 5
01.
78
Lakh
s).
4. P
rop
ert
y, p
lan
t an
d e
qu
ipm
en
t am
ou
ntin
g t
o R
up
ee 3
8,9
30
.16
Lak
hs
(3
1 M
arch
20
18-R
up
ee 3
5,74
9.1
4 L
akh
s) h
ave b
een
ple
dg
ed
as
secu
rity
by
the C
om
pan
y.
3. I
NTA
NG
IBLE
ASS
ET
S &
INTA
NG
IBLE
ASS
ET
S U
ND
ER
DE
VE
LOP
ME
NT
Par
ticu
lars
Gro
ss B
lock
Am
ort
izat
ion
Ne
t B
lock
Nat
ure
of
Ass
ets
As
at
01.
04
.20
18A
dd
itio
ns
De
du
ctio
ns
As
at
31.
03
.20
19A
s at
0
1.0
4.2
018
For
the
Ye
arD
ed
uct
ion
sU
pto
3
1.0
3.2
019
As
at
31.
03
.20
19A
s at
3
1.0
3.2
018
Co
mp
ute
r So
ftw
are
32
0.7
9
34
.37
-
35
5.16
2
36
.30
5
7.3
1 -
2
93.
61
61.
55
8
4.4
9
Tech
nic
al K
no
w-h
ow
40
.24
1
5.19
-
5
5.4
3
6.0
4
11.
84
-
1
7.8
8
37.
54
3
4.2
0
Tota
l 3
61.
03
4
9.5
6
-
410
.59
2
42
.34
6
9.1
6
-
311
.50
9
9.0
9
118
.69
Pre
vio
us
Year
2
78.5
8
113
.89
3
1.4
4
36
1.0
3
210
.33
6
3.4
5
31.
44
2
42
.34
1
18.6
9
-
Inta
ng
ible
ass
ets
un
der
deve
lop
men
t 1
30
.81
22
7.5
0
-
35
8.3
1 3
58
.31
13
0.8
1
NO
TE
S:
1.
Th
e C
om
pan
y is
in t
he p
rocess
of
imp
lem
en
ting
th
e S
AP
Sys
tem
in o
rder
to im
pro
ve it
s b
usi
ness
fu
nctio
n &
rep
ort
ing
sys
tem
s. It
s h
as in
cu
rred
a s
um
of
Rs.
35
8.3
1 La
khs
as
on
31s
t M
arch
, 20
19.
2.
Du
rin
g t
he c
urr
en
t ye
ar,
the c
om
pan
y h
as c
apita
lised
bo
rro
win
g c
ost
rela
ting
to
in
tan
gib
le a
ssets
am
ou
ntin
g t
o R
s. 1
6.1
4 L
akh
s (3
1 m
arch
, 2
018
-Nil)
. T
he r
ate u
sed
to
dete
rmin
e t
he a
mo
un
t o
f b
orr
ow
ing
co
sts
elig
ible
fo
r cap
italis
atio
n w
as 9
.50
%, w
hic
h is
th
e e
ffectiv
e r
ate o
f th
e b
orr
ow
ing
.
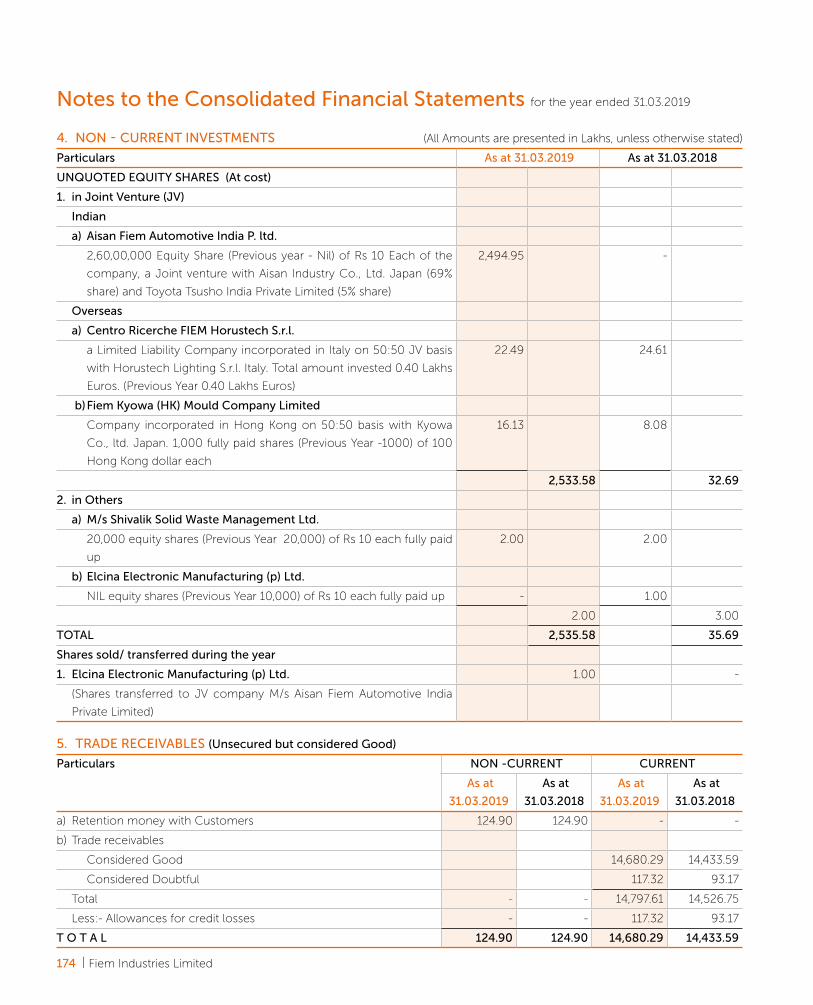
174 | Fiem Industries Limited
Notes to the Consolidated Financial Statements for the year ended 31.03.2019
4. NON - CURRENT INVESTMENTS (All Amounts are presented in Lakhs, unless otherwise stated)
Particulars As at 31.03.2019 As at 31.03.2018
UNQUOTED EQUITY SHARES (At cost)
1. in Joint Venture (JV)
Indian
a) Aisan Fiem Automotive India P. ltd.
2,60,00,000 Equity Share (Previous year - Nil) of Rs 10 Each of the
company, a Joint venture with Aisan Industry Co., Ltd. Japan (69%
share) and Toyota Tsusho India Private Limited (5% share)
2,494.95 -
Overseas
a) Centro Ricerche FIEM Horustech S.r.l.
a Limited Liability Company incorporated in Italy on 50:50 JV basis
with Horustech Lighting S.r.l. Italy. Total amount invested 0.40 Lakhs
Euros. (Previous Year 0.40 Lakhs Euros)
22.49 24.61
b) Fiem Kyowa (HK) Mould Company Limited
Company incorporated in Hong Kong on 50:50 basis with Kyowa
Co., ltd. Japan. 1,000 fully paid shares (Previous Year -1000) of 100
Hong Kong dollar each
16.13 8.08
2,533.58 32.69
2. in Others
a) M/s Shivalik Solid Waste Management Ltd.
20,000 equity shares (Previous Year 20,000) of Rs 10 each fully paid
up
2.00 2.00
b) Elcina Electronic Manufacturing (p) Ltd.
NIL equity shares (Previous Year 10,000) of Rs 10 each fully paid up - 1.00
2.00 3.00
TOTAL 2,535.58 35.69
Shares sold/ transferred during the year
1. Elcina Electronic Manufacturing (p) Ltd. 1.00 -
(Shares transferred to JV company M/s Aisan Fiem Automotive India
Private Limited)
5. TRADE RECEIVABLES (Unsecured but considered Good)
Particulars NON -CURRENT CURRENT
As at
31.03.2019
As at
31.03.2018
As at
31.03.2019
As at
31.03.2018
a) Retention money with Customers 124.90 124.90 - -
b) Trade receivables
Considered Good 14,680.29 14,433.59
Considered Doubtful 117.32 93.17
Total - - 14,797.61 14,526.75
Less:- Allowances for credit losses - - 117.32 93.17
T O T A L 124.90 124.90 14,680.29 14,433.59

Annual Report 2018-19 | 175
Notes to the Consolidated Financial Statements for the year ended 31.03.2019
6. LOANS (Unsecured but considered Good) (All Amounts are presented in Lakhs, unless otherwise stated)
Particulars NON -CURRENT CURRENT
As at
31.03.2019
As at
31.03.2018
As at
31.03.2019
As at
31.03.2018
a) Loan to employees 21.84 37.19 46.36 36.47
b) Security deposit (Considered Good) 834.66 717.29 5.51 21.73
T O T A L 856.51 754.48 51.87 58.19
8. INCOME TAX ASSETS (NET)
Particulars As at 31.03.2019 As at 31.03.2018
a) Advance Income tax 449.13 453.31
T O T A L 449.13 453.31
7. OTHER FINANCIAL ASSETS (Unsecured but considered Good)
Particulars NON -CURRENT CURRENT
As at
31.03.2019
As at
31.03.2018
As at
31.03.2019
As at
31.03.2018
a) Term deposit held as margin money, with more than 12 months maturity 32.00 2.85 -
b) Income accrued on deposits 1.94 1.68 69.61 43.20
c) Insurance Claim Recoverable - 1,473.14 2,607.18
d) Export Incentive Receivables - - 63.85 114.03
e) Derivative Assets -Long term 167.94
f) Other Advances recoverable - 83.50 20.51
T O T A L 201.87 4.53 1,690.09 2,784.92
9. OTHER ASSETS (Unsecured but considered Good) (Amount Rs in Lakhs)
Particulars NON -CURRENT CURRENT
As at
31.03.2019
As at
31.03.2018
As at
31.03.2019
As at
31.03.2018
a) Capital Advances 821.39 1,138.74 - -
b) Advances other than capital advances
i) Advances to Suppliers - 1,667.33 811.83
ii) Balance with Customs, Excise or GST departments - - 245.07 537.89
iii) Prepaid Expenses 9.99 4.56 194.74 138.88
iv) Other Advances/claims recoverable in cash or in kind - - - 29.68
T O T A L 831.38 1,143.29 2,107.15 1,518.28

176 | Fiem Industries Limited
Notes to the Consolidated Financial Statements for the year ended 31.03.2019
12. CASH AND CASH EQUIVALENTS
Particulars As at 31.03.2019 As at 31.03.2018
a) Balances with Banks in current account 362.83 116.76
b) Deposits with original maturity of less than three months 41.51 14.25
c) Cash on Hand 15.82 45.64
T O T A L 420.17 176.65
13. OTHER BANK BALANCES
Particulars As at 31.03.2019 As at 31.03.2018
1) Unpaid Dividend Account 16.67 2.85
2) Margin money deposit with original maturity for more than 3 months
but less than 12 months 9.20 40.11
25.87 42.95
T O T A L 25.87 42.95
10. INVENTORIES (As per Inventory taken valued & certified by the management and valued at lower of cost or net realisable value)
(All Amounts are presented in Lakhs, unless otherwise stated)
Particulars As at 31.03.2019 As at 31.03.2018
a) Raw Materials and Components 6,878.32 6,663.76
b) Raw Materials and Components in transit - 53.01
c) Work in Progress 3,555.53 3,882.22
d) Finished Goods 3,953.54 3,134.68
e) Stock in trade (Others) 0.08 0.14
f) Stores and Spares (including Packing Material) 336.74 293.11
g) Stores and Spares (including Packing Material) in transit - 0.18
14,724.21 14,027.11
T O T A L 14,724.21 14,027.11
11. CURRENT INVESTMENTS
Particulars As at 31.03.2019 As at 31.03.2018
INVESTMENT IN LIQUID MUTUAL FUNDS (QUOTED)
1. KOTAK INCOME OPPORTUNITIES-REGULAR PLAN (GROWTH) - 1,909.56
(NIL UNIT AS ON 31.03.19 (Previous year 99,84,448.177 Unit as on
31.03.18, face Value of Rs 10 each)
- 1,909.56
Aggregate value of unquoted investments - -
Aggregate value of quoted investments - 1,909.56
Market value of quoted investments - 1,909.56
Aggregate value of diminution other than temporary in value of
investments
- -
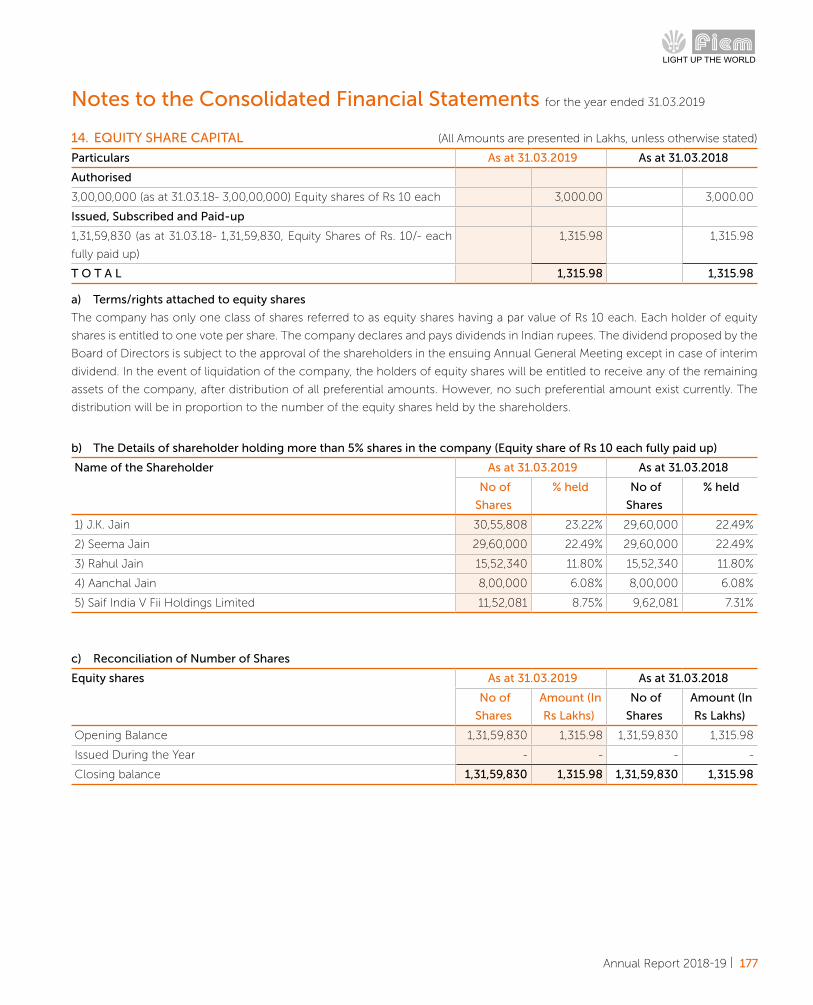
Annual Report 2018-19 | 177
Notes to the Consolidated Financial Statements for the year ended 31.03.2019
a) Terms/rights attached to equity shares
The company has only one class of shares referred to as equity shares having a par value of Rs 10 each. Each holder of equity
shares is entitled to one vote per share. The company declares and pays dividends in Indian rupees. The dividend proposed by the
Board of Directors is subject to the approval of the shareholders in the ensuing Annual General Meeting except in case of interim
dividend. In the event of liquidation of the company, the holders of equity shares will be entitled to receive any of the remaining
assets of the company, after distribution of all preferential amounts. However, no such preferential amount exist currently. The
distribution will be in proportion to the number of the equity shares held by the shareholders.
14. EQUITY SHARE CAPITAL (All Amounts are presented in Lakhs, unless otherwise stated)
Particulars As at 31.03.2019 As at 31.03.2018
Authorised
3,00,00,000 (as at 31.03.18- 3,00,00,000) Equity shares of Rs 10 each 3,000.00 3,000.00
Issued, Subscribed and Paid-up
1,31,59,830 (as at 31.03.18- 1,31,59,830, Equity Shares of Rs. 10/- each
fully paid up)
1,315.98 1,315.98
T O T A L 1,315.98 1,315.98
b) The Details of shareholder holding more than 5% shares in the company (Equity share of Rs 10 each fully paid up)
Name of the Shareholder As at 31.03.2019 As at 31.03.2018
No of
Shares
% held No of
Shares
% held
1) J.K. Jain 30,55,808 23.22% 29,60,000 22.49%
2) Seema Jain 29,60,000 22.49% 29,60,000 22.49%
3) Rahul Jain 15,52,340 11.80% 15,52,340 11.80%
4) Aanchal Jain 8,00,000 6.08% 8,00,000 6.08%
5) Saif India V Fii Holdings Limited 11,52,081 8.75% 9,62,081 7.31%
c) Reconciliation of Number of Shares
Equity shares As at 31.03.2019 As at 31.03.2018
No of
Shares
Amount (In
Rs Lakhs)
No of
Shares
Amount (In
Rs Lakhs)
Opening Balance 1,31,59,830 1,315.98 1,31,59,830 1,315.98
Issued During the Year - - - -
Closing balance 1,31,59,830 1,315.98 1,31,59,830 1,315.98

178 | Fiem Industries Limited
15. OTHER EQUITY (All Amounts are presented in Lakhs, unless otherwise stated)
Particulars As at 31.03.2019 As at 31.03.2018
SECURITIES PREMIUM
As Per Last Balance Sheet 16,722.77 16,722.77
GENERAL RESERVE
As Per Last Balance Sheet 3,280.00 2,760.00
Add :- Transferred from Surplus in the statement of Profit and Loss 560.00 520.00
Closing balance 3,840.00 3,280.00
TRANSLATION RESERVE 1.28 3.92
SURPLUS -OPENING BALANCE 23,611.77 20,214.19
Add:- Total comprehensive income transferred from Statement of
Profit and Loss
5,480.24 5,184.69
Amount Available for Appropriation 29,092.01 25,398.88
Less :- Appropriations
i) Final Dividend Paid (Rs 9 per share- Previous Year Rs 8 per share) 1,184.38 1,052.79
ii) Corporate Dividend Tax Paid on Final Dividend 243.49 214.32
iii) Interim Dividend paid (Rs 8 per share- Previous Year- NIL) 1,052.79 -
iv) Corporate Dividend Tax Paid on Interim Dividend 216.40 -
v) Transfer to General Reserve 560.00 520.00
3,257.07 1,787.11
SURPLUS -CLOSING BALANCE 25,834.95 23,611.77
T O T A L 46,399.00 43,618.46
Description of nature and purpose of each reserve
1 General Reserve - General reserve is created from time to time by way of transfer profits from retained earnings for appropriation
purposes. General reserve is created by a transfer from one component of equity to another and is not an item of other
comprehensive income.
2 Securities premium account is used to record the premium on issue of equity shares. The same is utilised in accordance with
the provisions of the Companies Act, 2013.
16. NON-CURRENT BORROWINGS Particulars NON CURRENT PORTION CURRENT MATURITIES
As at 31.03.2019
As at 31.03.2018
As at 31.03.2019
As at 31.03.2018
SECURED LOANS
1) TERM LOANS FROM BANKS
a) Indian Rupee Loan 1,747.06 1,000.00 3,086.37 400.00
b) Foreign Currency Loan 7,367.42 7,467.91 752.94 2,894.83
9,114.48 8,467.91 3,839.31 3,294.83
2) VEHICLE LOANS
a) from Banks 181.75 174.95 157.59 128.73
b) from Others - 7.48 4.63 85.81
181.75 182.43 162.21 214.54
T O T A L 9,296.24 8,650.34 4,001.52 3,509.37
Notes to the Consolidated Financial Statements for the year ended 31.03.2019

Annual Report 2018-19 | 179
Notes to the Consolidated Financial Statements for the year ended 31.03.2019
INDIAN RUPEE TERM LOANS FROM BANKS INCLUDE
a) From HSBC Bank:- Outstanding as on 31.03.19 is Rs 1000 lakhs, (31.03.18 Rs 1400 Lakhs) The Loan is for 6 year and has 20
quarterly equal repayment beginning after moratorium period of 15 months. Interest is monthly payable. The loan carries
fixed interest rate of 9.50% p.a.. The Loan is Secured against First Pari-Passu charge with HSBC -Mauritius and with CITIBANK
FCNR TERM LOAN -3 by way of equitable mortgage on land and building and hypothecation of Plant and machinery at
project in Gujarat (Survey no 151-153, village karsanpur, Taluka mandal, Distt Ahmedabad) and secured against first pari passu
charge by way of equitable mortgage on Land and Building and hypothecation of Plant and Machinery at Tapukara Rajasthan
along with, HSBC Mauritius, CITIBANK FCNR TERM LOAN -3 and STANDARD CHARTERD BANK ECB-3 LOAN
b) From Citibank :- Outstanding as on 31.03.19 is Rs 1500 lakhs (31.03.18- Nil) The Loan is for 5 year and has 17 quarterly equal
repayment starting from the end of 12 months of drawdown. Interest is monthly payable. Interest is payable at base rate plus
margin basis which may be agreed with bank from time to time, which currently is 8.65% p.a.. The Loan is Secured against
exclusive charge on fixed assets financed out of the term loan and first charge of the movable assets of Unit-V situated at
Hosur, Tamilnadu
FOREIGN CURRENCY TERM LOAN FROM BANKS INCLUDE
a) From Citibank :- FCNR Term Loan -2 outstanding as on 31.03.19- Rs 419.73 lakhs, (as on 31.03.18 - Rs 920.93 Lakhs) has tenor
of 5 years with 16 equal quarterly repayments beginning from the end of 12 months from drawdown. Interest is payable on
monthly basis. The loan carries fully hedged interest cost of 10.25% p.a. The Loan is secured against exclusive charge on fixed
assets financed out of the term loan and is secured against First pari-passu charge on the fixed assets of Kundli Unit-1 and
Hosur Unit-2 with working capital Lenders viz. Citibank, Standard Chartered Bank, HDFC bank and Indusind Bank Guarantee
limit. The Loan is also secured against exclusive charge on fixed assets financed out of the term loan and first charge of the
movable fixed assets of Unit-V situated at Hosur, tamilnadu.
b) From Citibank :- FCNR Term Loan -3 outstanding as on as on 31.03.19 - Rs 2161.26 lakhs,(as on 31.03.18- Rs 2709.74 Lakhs)
has tenor of 6 years with 20 equal quarterly repayments beginning from the end of 15 months from drawdown. Interest is
payable on monthly basis. The loan carries fully hedged interest cost of 9% p.a. The Loan is secured against First pari-passu
charge on the fixed assets of the company including land and building and plant and machinery at Rajasthan unit with other
lender viz. HSBC India, HSBC Mauritius and SCB 5.50 Million USD ECB LOAN and is secured against first pari-passu charge on
all the fixed assets including land and building and plant and machinery of Gujarat unit shared with other lenders viz. HSBC
India, HSBC Mauritius.
c) From Standard Chartered Bank ECB -3 for 55 lakh USD :- Loan outstanding as on 31.03.19- Rs 2680.39 Lakhs (as on 31.03.18-
Rs 3235.94 Lakhs). The loan is for 6 years with 16 equal quarterly repayment beginning from the end of 15 months from the
drawdown. Interest is quarterly payable. The loan carries fully hedged interest cost of 8.90% p.a. The Loan is secured on first
pari passu charge basis with HSBC INDIA, HSBC Mauritius and CITIBNK FCNR TERM LOAN-3 on all assets of Tapukara plant
(Present and future) and secured against exclusive charge on movable fixed assets situated at Mysure unit-4, and Hosur Unit-3
Kelamangalam Road.
d) From HSBC Mauritius ECB :- Loan outstanding as on 31.03.19- Rs 2680.39 Lakhs, (as on 31.03.18- Rs 3496.13 Lakhs). The
loan is for 6 years with 20 equal quarterly repayment beginning from the end of 15 months from the drawdown. Interest is
quarterly payable. The loan carries fully hedged interest cost of 8.99% p.a. The Loan is secured against Equitable Mortgage
with CITIBANK FCNR TERM LOAN-3 (1st Pari Passu with HSBC, India) on Land and Building and Hypothecation of Plant and
Machinery (1st pari- Passu with HSBC, India) located at Ahmedabad, Gujarat and secured against equitable mortgage on Land
and Building with (1st pari- Passu with HSBC, India) and hypothecation of Plant and Machinery (1st pari- Passu with HSBC,
India) along with CITIBANK FCNR TERM LOAN -3 AND STANDARD CHARTERED BANK ECB-3 at Tapukara Rajasthan.
e) From Citibank FCNR Term Loan -4:- Outstanding as on 31.03.19 is Rs 2512.02 lakhs (as on 31.03.18- Nil) The Loan is for 5 year
and has 17 quarterly equal repayment starting from the end of 12 months of drawdown. Interest is monthly payable. The loan
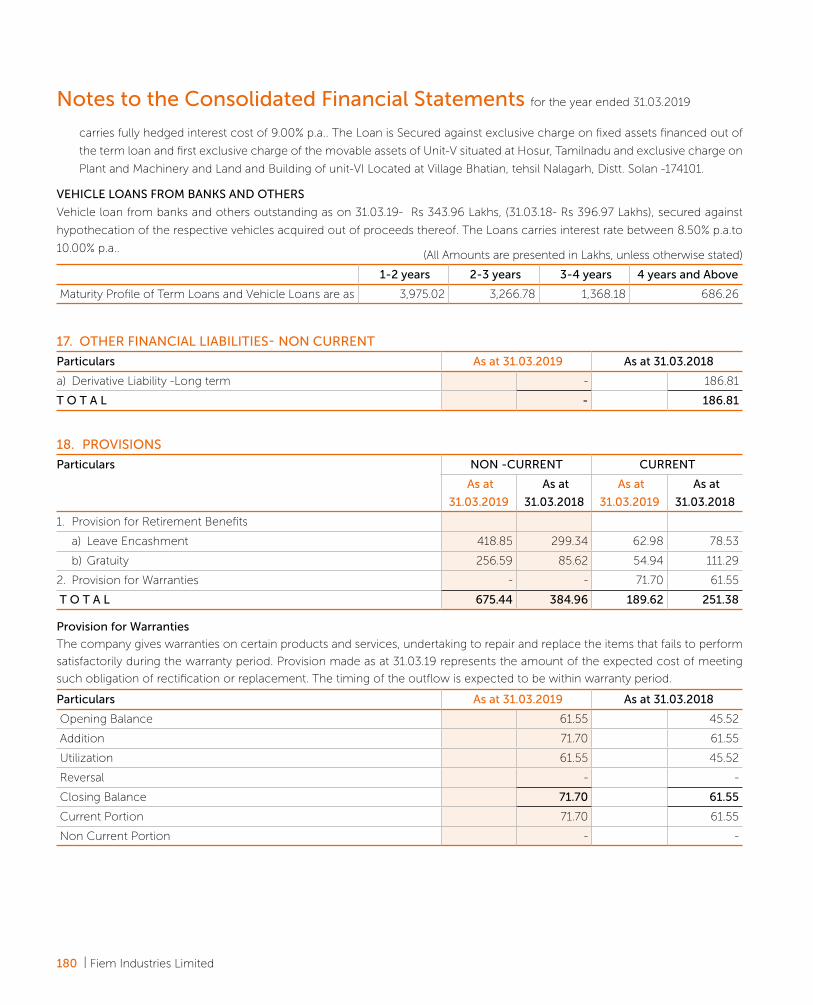
180 | Fiem Industries Limited
carries fully hedged interest cost of 9.00% p.a.. The Loan is Secured against exclusive charge on fixed assets financed out of
the term loan and first exclusive charge of the movable assets of Unit-V situated at Hosur, Tamilnadu and exclusive charge on
Plant and Machinery and Land and Building of unit-VI Located at Village Bhatian, tehsil Nalagarh, Distt. Solan -174101.
VEHICLE LOANS FROM BANKS AND OTHERS
Vehicle loan from banks and others outstanding as on 31.03.19- Rs 343.96 Lakhs, (31.03.18- Rs 396.97 Lakhs), secured against
hypothecation of the respective vehicles acquired out of proceeds thereof. The Loans carries interest rate between 8.50% p.a.to
10.00% p.a..
Provision for Warranties
The company gives warranties on certain products and services, undertaking to repair and replace the items that fails to perform
satisfactorily during the warranty period. Provision made as at 31.03.19 represents the amount of the expected cost of meeting
such obligation of rectification or replacement. The timing of the outflow is expected to be within warranty period.
(All Amounts are presented in Lakhs, unless otherwise stated)
1-2 years 2-3 years 3-4 years 4 years and Above
Maturity Profile of Term Loans and Vehicle Loans are as 3,975.02 3,266.78 1,368.18 686.26
17. OTHER FINANCIAL LIABILITIES- NON CURRENT
Particulars As at 31.03.2019 As at 31.03.2018
a) Derivative Liability -Long term - 186.81
T O T A L - 186.81
Particulars As at 31.03.2019 As at 31.03.2018
Opening Balance 61.55 45.52
Addition 71.70 61.55
Utilization 61.55 45.52
Reversal - -
Closing Balance 71.70 61.55
Current Portion 71.70 61.55
Non Current Portion - -
Notes to the Consolidated Financial Statements for the year ended 31.03.2019
18. PROVISIONS
Particulars NON -CURRENT CURRENT
As at
31.03.2019
As at
31.03.2018
As at
31.03.2019
As at
31.03.2018
1. Provision for Retirement Benefits
a) Leave Encashment 418.85 299.34 62.98 78.53
b) Gratuity 256.59 85.62 54.94 111.29
2. Provision for Warranties - - 71.70 61.55
T O T A L 675.44 384.96 189.62 251.38
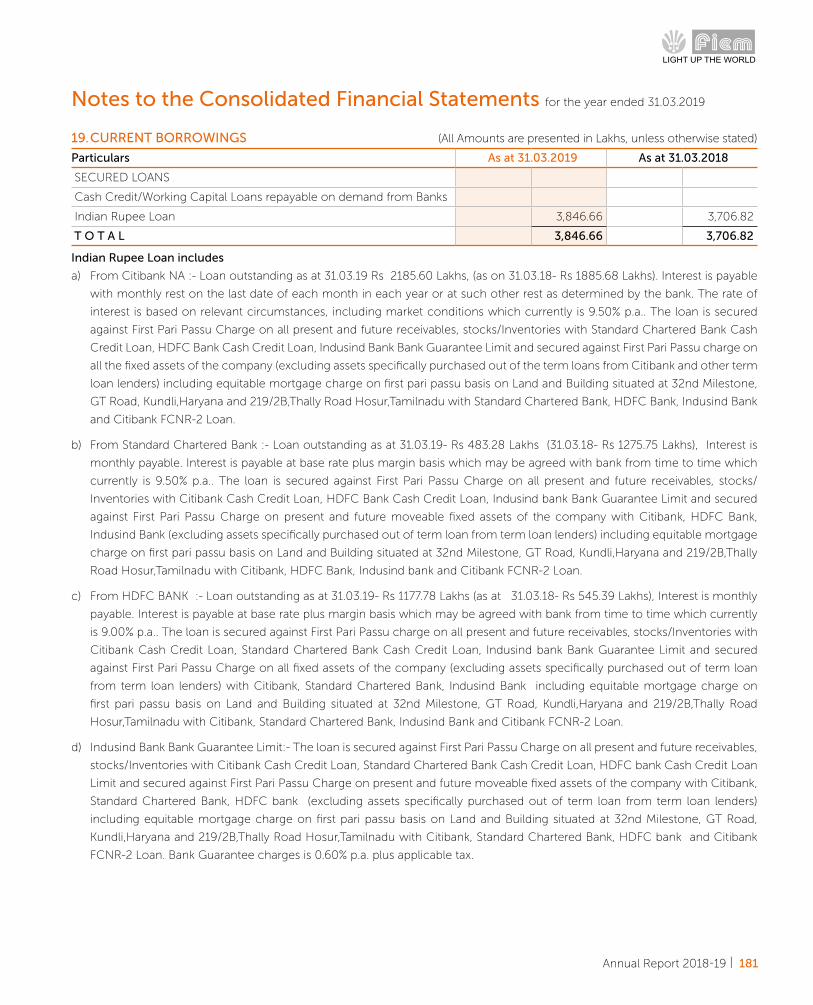
Annual Report 2018-19 | 181
Indian Rupee Loan includes
a) From Citibank NA :- Loan outstanding as at 31.03.19 Rs 2185.60 Lakhs, (as on 31.03.18- Rs 1885.68 Lakhs). Interest is payable
with monthly rest on the last date of each month in each year or at such other rest as determined by the bank. The rate of
interest is based on relevant circumstances, including market conditions which currently is 9.50% p.a.. The loan is secured
against First Pari Passu Charge on all present and future receivables, stocks/Inventories with Standard Chartered Bank Cash
Credit Loan, HDFC Bank Cash Credit Loan, Indusind Bank Bank Guarantee Limit and secured against First Pari Passu charge on
all the fixed assets of the company (excluding assets specifically purchased out of the term loans from Citibank and other term
loan lenders) including equitable mortgage charge on first pari passu basis on Land and Building situated at 32nd Milestone,
GT Road, Kundli,Haryana and 219/2B,Thally Road Hosur,Tamilnadu with Standard Chartered Bank, HDFC Bank, Indusind Bank
and Citibank FCNR-2 Loan.
b) From Standard Chartered Bank :- Loan outstanding as at 31.03.19- Rs 483.28 Lakhs (31.03.18- Rs 1275.75 Lakhs), Interest is
monthly payable. Interest is payable at base rate plus margin basis which may be agreed with bank from time to time which
currently is 9.50% p.a.. The loan is secured against First Pari Passu Charge on all present and future receivables, stocks/
Inventories with Citibank Cash Credit Loan, HDFC Bank Cash Credit Loan, Indusind bank Bank Guarantee Limit and secured
against First Pari Passu Charge on present and future moveable fixed assets of the company with Citibank, HDFC Bank,
Indusind Bank (excluding assets specifically purchased out of term loan from term loan lenders) including equitable mortgage
charge on first pari passu basis on Land and Building situated at 32nd Milestone, GT Road, Kundli,Haryana and 219/2B,Thally
Road Hosur,Tamilnadu with Citibank, HDFC Bank, Indusind bank and Citibank FCNR-2 Loan.
c) From HDFC BANK :- Loan outstanding as at 31.03.19- Rs 1177.78 Lakhs (as at 31.03.18- Rs 545.39 Lakhs), Interest is monthly
payable. Interest is payable at base rate plus margin basis which may be agreed with bank from time to time which currently
is 9.00% p.a.. The loan is secured against First Pari Passu charge on all present and future receivables, stocks/Inventories with
Citibank Cash Credit Loan, Standard Chartered Bank Cash Credit Loan, Indusind bank Bank Guarantee Limit and secured
against First Pari Passu Charge on all fixed assets of the company (excluding assets specifically purchased out of term loan
from term loan lenders) with Citibank, Standard Chartered Bank, Indusind Bank including equitable mortgage charge on
first pari passu basis on Land and Building situated at 32nd Milestone, GT Road, Kundli,Haryana and 219/2B,Thally Road
Hosur,Tamilnadu with Citibank, Standard Chartered Bank, Indusind Bank and Citibank FCNR-2 Loan.
d) Indusind Bank Bank Guarantee Limit:- The loan is secured against First Pari Passu Charge on all present and future receivables,
stocks/Inventories with Citibank Cash Credit Loan, Standard Chartered Bank Cash Credit Loan, HDFC bank Cash Credit Loan
Limit and secured against First Pari Passu Charge on present and future moveable fixed assets of the company with Citibank,
Standard Chartered Bank, HDFC bank (excluding assets specifically purchased out of term loan from term loan lenders)
including equitable mortgage charge on first pari passu basis on Land and Building situated at 32nd Milestone, GT Road,
Kundli,Haryana and 219/2B,Thally Road Hosur,Tamilnadu with Citibank, Standard Chartered Bank, HDFC bank and Citibank
FCNR-2 Loan. Bank Guarantee charges is 0.60% p.a. plus applicable tax.
19. CURRENT BORROWINGS (All Amounts are presented in Lakhs, unless otherwise stated)
Particulars As at 31.03.2019 As at 31.03.2018
SECURED LOANS
Cash Credit/Working Capital Loans repayable on demand from Banks
Indian Rupee Loan 3,846.66 3,706.82
T O T A L 3,846.66 3,706.82
Notes to the Consolidated Financial Statements for the year ended 31.03.2019

182 | Fiem Industries Limited
20. CURRENT TRADE PAYABLES (All Amounts are presented in Lakhs, unless otherwise stated)
Particulars As at 31.03.2019 As at 31.03.2018
- Micro and Small enterprises 122.62 159.11
-Other than Micro and Small enterprises 18,702.40 21,794.65
18,825.02 21,953.76
T O T A L 18,825.02 21,953.76
Considering the company has been extended credit period upto 45 days by its vendors and payments being released on a timely
basis, there is no liability towards interest on delayed payments under “The Micro, Small and Medium Enterprises Development
Act 2006” during the year.
There is also no amount of outstanding interest in this regard, brought forward from previous years. The above information is on
basis of intimations received, from the vendors who have communicated their status with regards to vendors registration under
the said Act on requests made by the company,
21. OTHER FINANCIAL LIABILITIES- CURRENT
Particulars As at 31.03.2019 As at 31.03.2018
a) Trade Security Deposits 304.37 246.54
b) Current Maturity of Long- term debt 4,001.52 3,509.37
Add/(Less) Derivative liability Short Term (131.14) 38.34
3,870.38 3,547.71
c) Interest accrued 89.16 59.93
d) Liabilities for Expenses 1,403.72 1,484.23
e) Unpaid Dividend - (Investor Education and Protection Fund will be
credited by this amount (as and when due))
16.67 2.85
f) Creditors for Capital Expenditure 676.58 2,072.61
T O T A L 6,360.89 7,413.86
22. OTHER CURRENT LIABILITIES
Particulars As at 31.03.2019 As at 31.03.2018
a) Advances received from Customers 2,413.12 627.28
b) Statutory Dues payable 1,422.67 934.51
T O T A L 3,835.79 1,561.79
23. CURRENT TAX LIABILITIES (NET)
Particulars As at 31.03.2019 As at 31.03.2018
Provision for Income tax (Net of advance tax and Tds) 345.57 109.27
345.57 109.27
Notes to the Consolidated Financial Statements for the year ended 31.03.2019
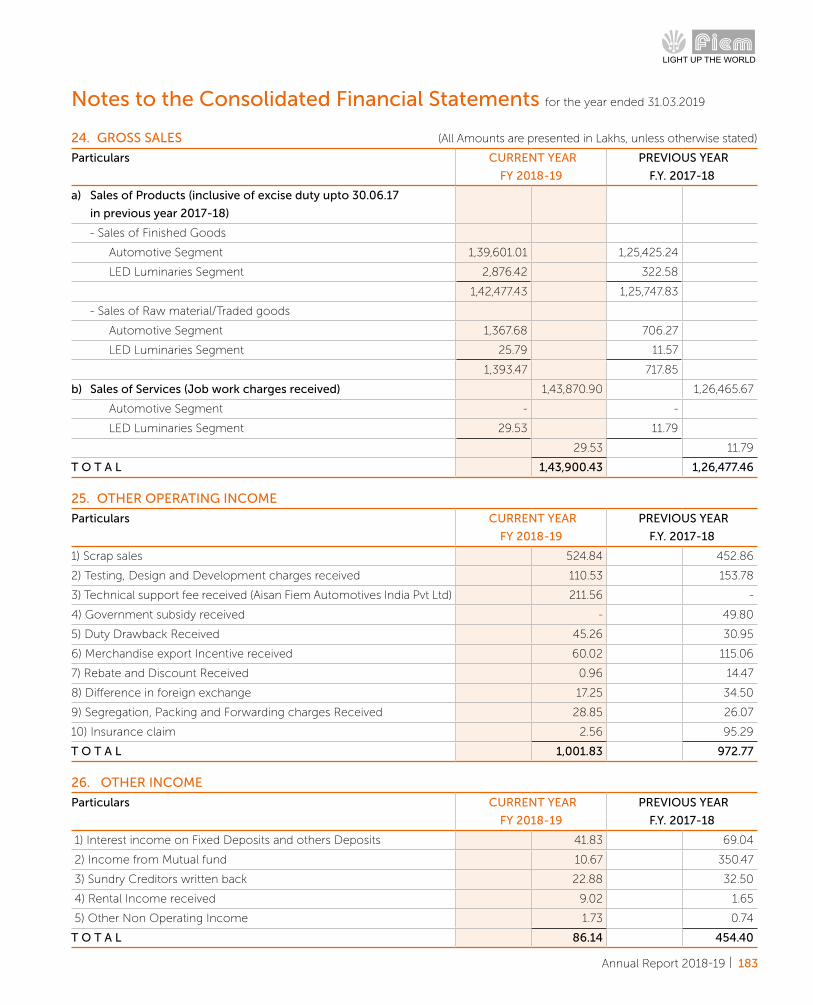
Annual Report 2018-19 | 183
26. OTHER INCOME
Particulars CURRENT YEAR
FY 2018-19
PREVIOUS YEAR
F.Y. 2017-18
1) Interest income on Fixed Deposits and others Deposits 41.83 69.04
2) Income from Mutual fund 10.67 350.47
3) Sundry Creditors written back 22.88 32.50
4) Rental Income received 9.02 1.65
5) Other Non Operating Income 1.73 0.74
T O T A L 86.14 454.40
25. OTHER OPERATING INCOME
Particulars CURRENT YEAR
FY 2018-19
PREVIOUS YEAR
F.Y. 2017-18
1) Scrap sales 524.84 452.86
2) Testing, Design and Development charges received 110.53 153.78
3) Technical support fee received (Aisan Fiem Automotives India Pvt Ltd) 211.56 -
4) Government subsidy received - 49.80
5) Duty Drawback Received 45.26 30.95
6) Merchandise export Incentive received 60.02 115.06
7) Rebate and Discount Received 0.96 14.47
8) Difference in foreign exchange 17.25 34.50
9) Segregation, Packing and Forwarding charges Received 28.85 26.07
10) Insurance claim 2.56 95.29
T O T A L 1,001.83 972.77
24. GROSS SALES (All Amounts are presented in Lakhs, unless otherwise stated)
Particulars CURRENT YEAR
FY 2018-19
PREVIOUS YEAR
F.Y. 2017-18
a) Sales of Products (inclusive of excise duty upto 30.06.17
in previous year 2017-18)
- Sales of Finished Goods
Automotive Segment 1,39,601.01 1,25,425.24
LED Luminaries Segment 2,876.42 322.58
1,42,477.43 1,25,747.83
- Sales of Raw material/Traded goods
Automotive Segment 1,367.68 706.27
LED Luminaries Segment 25.79 11.57
1,393.47 717.85
b) Sales of Services (Job work charges received) 1,43,870.90 1,26,465.67
Automotive Segment - -
LED Luminaries Segment 29.53 11.79
29.53 11.79
T O T A L 1,43,900.43 1,26,477.46
Notes to the Consolidated Financial Statements for the year ended 31.03.2019

184 | Fiem Industries Limited
27. COST OF RAW MATERIALS AND COMPONENTS CONSUMED (All Amounts are presented in Lakhs, unless otherwise stated)
Particulars CURRENT YEAR FY 2018-19
PREVIOUS YEAR F.Y. 2017-18
Opening Stock 6,663.76 5,142.90
Add : Purchases 89,774.49 77,241.28
Less :- Inventories at the end of the year 6,878.32 6,663.76
T O T A L 89,559.92 75,720.43
30. EMPLOYEES BENEFITS EXPENSES Particulars CURRENT YEAR
FY 2018-19 PREVIOUS YEAR
F.Y. 2017-18
Salaries,Wages and Bonus to employees 18,220.06 16,468.40
Contribution to Provident and other Funds 362.63 328.97
Staff Welfare Expenses 709.68 667.99
Gratuity Expenses 196.03 182.88
Earned Leave to staff 158.91 60.39
T O T A L 19,647.31 17,708.63
31. FINANCE COSTS
Particulars CURRENT YEAR
FY 2018-19
PREVIOUS YEAR
F.Y. 2017-18
Interest 2,155.92 2,204.91
Other Borrowing Costs 53.87 67.49
T O T A L 2,209.79 2,272.41
29. CHANGES IN INVENTORIES OF FINISHED GOODS, WORK IN PROGRESS AND STOCK IN TRADEParticulars CURRENT YEAR
FY 2018-19 PREVIOUS YEAR
F.Y. 2017-18
Inventories at the end of the year
a) Finished Goods 3,953.54 3,134.68
b) Work -in- Progress 3,555.53 3,882.22
c) Traded Goods 0.08 0.14
7,509.15 7,017.04
Inventories at the beginning of the year
a) Finished Goods 3,134.68 1,804.80
b) Work -in- Progress 3,882.22 2,902.69
c) Traded Goods 0.14 22.10
7,017.04 4,729.60
(492.11) (2,287.45)
28. PURCHASE OF STOCK IN TRADE (Amount Rs in Lakhs)
Particulars CURRENT YEAR FY 2018-19
PREVIOUS YEAR F.Y. 2017-18
Purchase of Traded Goods 988.04 537.07
T O T A L 988.04 537.07
Notes to the Consolidated Financial Statements for the year ended 31.03.2019
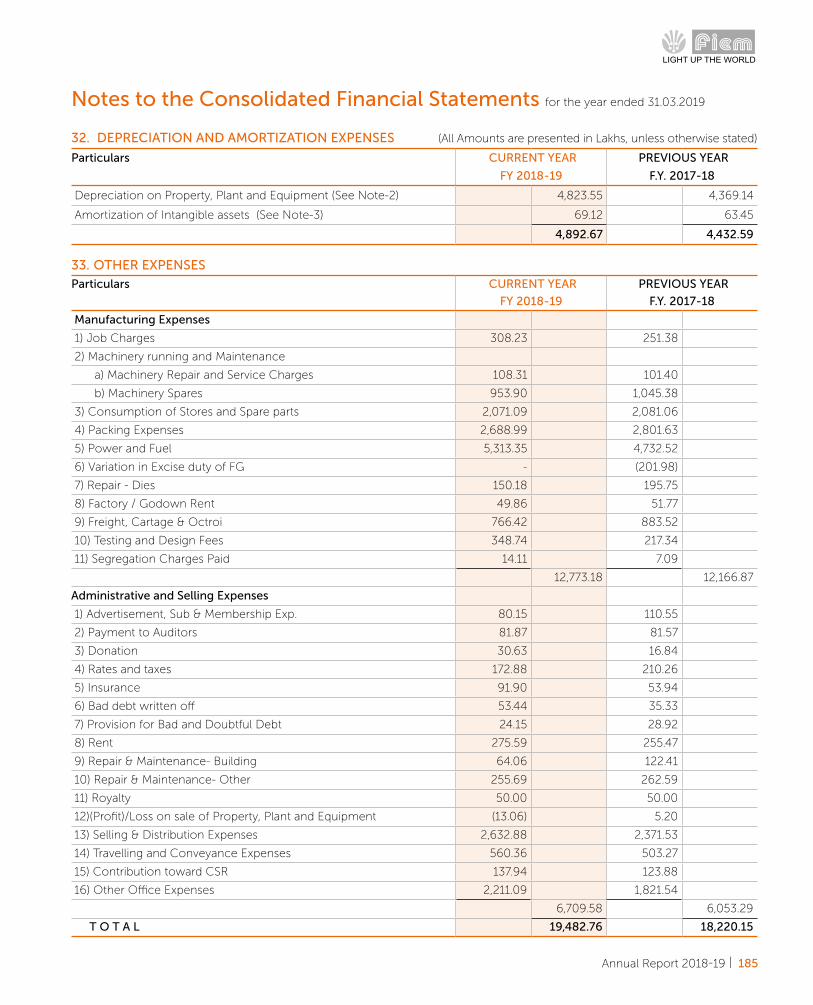
Annual Report 2018-19 | 185
33. OTHER EXPENSES
Particulars CURRENT YEAR
FY 2018-19
PREVIOUS YEAR
F.Y. 2017-18
Manufacturing Expenses
1) Job Charges 308.23 251.38
2) Machinery running and Maintenance
a) Machinery Repair and Service Charges 108.31 101.40
b) Machinery Spares 953.90 1,045.38
3) Consumption of Stores and Spare parts 2,071.09 2,081.06
4) Packing Expenses 2,688.99 2,801.63
5) Power and Fuel 5,313.35 4,732.52
6) Variation in Excise duty of FG - (201.98)
7) Repair - Dies 150.18 195.75
8) Factory / Godown Rent 49.86 51.77
9) Freight, Cartage & Octroi 766.42 883.52
10) Testing and Design Fees 348.74 217.34
11) Segregation Charges Paid 14.11 7.09
12,773.18 12,166.87
Administrative and Selling Expenses
1) Advertisement, Sub & Membership Exp. 80.15 110.55
2) Payment to Auditors 81.87 81.57
3) Donation 30.63 16.84
4) Rates and taxes 172.88 210.26
5) Insurance 91.90 53.94
6) Bad debt written off 53.44 35.33
7) Provision for Bad and Doubtful Debt 24.15 28.92
8) Rent 275.59 255.47
9) Repair & Maintenance- Building 64.06 122.41
10) Repair & Maintenance- Other 255.69 262.59
11) Royalty 50.00 50.00
12)(Profit)/Loss on sale of Property, Plant and Equipment (13.06) 5.20
13) Selling & Distribution Expenses 2,632.88 2,371.53
14) Travelling and Conveyance Expenses 560.36 503.27
15) Contribution toward CSR 137.94 123.88
16) Other Office Expenses 2,211.09 1,821.54
6,709.58 6,053.29
T O T A L 19,482.76 18,220.15
32. DEPRECIATION AND AMORTIZATION EXPENSES (All Amounts are presented in Lakhs, unless otherwise stated)
Particulars CURRENT YEAR
FY 2018-19
PREVIOUS YEAR
F.Y. 2017-18
Depreciation on Property, Plant and Equipment (See Note-2) 4,823.55 4,369.14
Amortization of Intangible assets (See Note-3) 69.12 63.45
4,892.67 4,432.59
Notes to the Consolidated Financial Statements for the year ended 31.03.2019

186 | Fiem Industries Limited
34. EXCEPTIONAL ITEM (All Amounts are presented in Lakhs, unless otherwise stated)
Particulars CURRENT YEAR
FY 2018-19
PREVIOUS YEAR
F.Y. 2017-18
Net Gain (Insurance claim) on Capital Assets - (575.86)
Less:- Loss on Inventory - 38.63
- (537.24)
Less -Exceptional expenses incurred on restoration of supply to customer - 196.66
- (340.58)
T O T A L - (340.58)
Note :- Exceptional item in Previous Year 17-18 is related to fire incident happened in one block of Unit-5, situated at Kelamanglam
Road, Achettipalli Post, Hosur 635110,Tamilnadu.
35. CONTINGENT LIABILITIES
Particulars As at March
31, 2019
As at March
31, 2018
(A) Claims against the Company/disputed liabilities not acknowledged as debts (See Note-1)
(i) Income Tax
(a) Case decided in the Company’s favour by First Appellate Authorities and for which the
department has filed further appeals
827.27 827.27
(ii) Custom Duty
(a) Import Duty Demand towards imported capital goods which were sold to the customer
in relation to nil import duty being paid at the time of import of said capital goods as a
100% EOU unit for which the company has filed an appeal with Commissioner of Central
Excise, Chennai (Net of deposit)
43.40 43.40
(iii) Excise Duty
Excise Duty Demand towards interest & penalty on short payment/reversal of Cenvat
Credit on clearance of capital goods for the period April, 2015 to March, 2017 for which
company has filed appeal with The commissioner, CGST & C.Ex., Ahmadabad-North
39.19 -
(iv) Sales Tax
(a) Sales Tax Demand for F.Y. 2014-15 on Central Sales Tax Reversal under Section 19(2)(v) of
the TNVAT Act, 2006 for which company has filed appeal with High Court, Chennai
150.07 150.07
(b) Sales Tax Demand for A.Y. 2010-11 for which company has filed appeal with High Court of
Punjab & Haryana (net of deposit)
20.00 20.00
1,079.93 1,040.74
(B) Other Money for which the Company is contingently liable
(a) Liability in respect of bill of exchange discounted from bank 4,786.14 4,257.39
Note :- Based on the advice taken by the Company, the Company believes that it has good case in respect of all items under (i)
to (iv) above and hence no provision is considered necessary against the same.
Notes to the Consolidated Financial Statements for the year ended 31.03.2019

Annual Report 2018-19 | 187
36. CAPITAL & OTHER COMMITMENTS (All Amounts are presented in Lakhs, unless otherwise stated)
Particulars As at March
31, 2019
As at March
31, 2018
(i) Estimated amount of contracts remaining to be executed on capital account and not provided,
(net of advances)
812.98 525.74
(ii) Estimated amount of contracts remaining to be executed on purchases account not provided,
(net of advances)
3,644.88 540.85
(iii) Estimated amount of Bank Guarantee Charges payable to Banks 3.43 13.48
4,461.29 1,080.07
Notes to the Consolidated Financial Statements for the year ended 31.03.2019
37. AUDITOR'S REMUNERATION
Particulars 2018-19 2017-18
(a) Auditor's Remuneration
For Statutory Audit 43.22 43.00
For Tax Audit 4.00 4.00
For Limited Review 7.00 7.00
For Other Services 25.00 25.00
Total (a) 79.22 79.00
(b) Cost Auditor's Remuneration
For Cost Audit Fees 2.50 2.50
For Certification Fees 0.07 -
For Reimbursement of Travelling and Out-of-Pocket Expenses 0.09 0.07
Total (b) 2.65 2.57
Total (a+b) 81.87 81.57
38. DEFERRED TAX LIABILITIES (NET)
Particulars As at March
31, 2019
As at March
31, 2018
Deferred Tax Liability
Property, Plant and Equipment & Intangible Assets 5,680.61 5109.36
Fair Valuation of Liquid Mutual Fund - 62.68
Unrealised Exchange Gain 0.19 0.15
Total (a) 5,680.80 5,172.19
Deferred Tax Assets
Unused Tax Credits (MAT Credit Entitlement) - 401.05
Allowances for Credit Losses 40.99 32.55
Provision for Leave Encashment 168.35 132.03
Provision for Gratuity 108.41 68.80
Provision for Bonus 145.80 131.21
Welfare Fund 0.34 0.32
Provision for Warranties 25.05 21.51
Total (b) 488.93 787.47
Net Deferred Tax Liability (a-b) 5,191.87 4,384.71

188 | Fiem Industries Limited
Movement in Deferred Tax Liabilities and Deferred Tax Assets (All Amounts are presented in Lakhs, unless otherwise stated)
Particulars As at March
31, 2019
Statement
of profit
and loss
Utilisation
of unused
tax credit
As at March
31, 2018
Movement in Deferred Tax Liabilities
Property, Plant and Equipment and Intangible Assets 5,680.61 571.25 - 5,109.36
Liquid Mutual Fund - (62.68) - 62.68
Unrealised Exchange Gain 0.19 0.04 - 0.15
Total (A) 5,680.80 508.61 - 5,172.19
Movement in Deferred Tax Assets
Unused Tax Credits (MAT Credit Entitlement) - - (401.05) 401.05
Allowances for Credit Losses 40.99 8.44 32.55
Provision for Leave Encashment 168.35 36.32 132.03
Provision for Gratuity 108.41 39.60 68.80
Provision for Bonus 145.80 14.58 131.21
Welfare Fund 0.34 0.01 0.32
Provision for Warranties 25.05 3.54 21.51
Total (B) 488.93 102.50 (401.05) 787.47
Net Deferred Tax Liability (A-B) 5,191.87 406.11 (401.05) 4,384.71
Previous Year 4,384.71 828.20 (306.94) 3,249.57
(a) Tax expense
Particulars 2018-19 2017-18
Current Tax
Current tax on profit for the year 2,615.07 2,093.75
Adjustment for current tax of prior periods 14.79 (18.81)
Total current tax expense 2,629.86 2,074.94
Deferred tax
Decrease/(Increase) in deferred tax assets (102.50) (145.91)
(Decrease)/Increase in deferred tax liabilities 508.61 974.11
Total deferred tax expense(benefit) 406.11 828.20
Tax Expense (Current Tax plus Deferred tax) 3,035.97 2,903.13
(b) Income Tax recognised in other comprehensive income (Loss)
Particulars Year ended 31st March, 2019 Year ended 31st March, 2018
Before Tax Tax expense Net of tax Before Tax Tax expense Net of tax
Remeasurement of Defined Benefit Plans (130.16) 45.48 (84.68) (110.93) 39.55 (71.38)
Notes to the Consolidated Financial Statements for the year ended 31.03.2019

Annual Report 2018-19 | 189
Notes to the Consolidated Financial Statements for the year ended 31.03.2019
(c) Reconciliation of Effective Tax Rate (All Amounts are presented in Lakhs, unless otherwise stated)
Particulars As at March
31, 2019
As at March
31, 2018
(a) Profit before tax 8,700.01 8,163.39
(b) Enacted tax rate in India 34.94% 34.61%
(c) Expected tax expenses 3,040.13 2,825.19
(d) Other than temporary difference
R&D expenses (Section 352AB) 153.83 (162.13)
CSR Expenditure 46.52 42.87
Profit of Subsidiaries not taxable in India 65.99 1.04
Others (668.30) (787.94)
Deferred Tax Liability (net) 406.11 828.20
(e) Net adjustment 4.15 (77.96)
Income Tax Expenses (c+e) 3,035.97 2,903.13
Amount on which deferred tax assets has not been created and related expiry period
Deferred tax assets has not been recognised in respect of capital loss on sale of property, loss on transfer of land allotment rights
and loss on sale of unquoted equity share because it is not probable that future taxable profit will be available against which the
Company can use the benefit therefrom.
Deferred Tax Assets on Lease-hold Land
Under IND AS deferred tax has been recognised on the adjustments made on transition to IND AS. Leasehold land is a non-
depreciable asset, Management is expecting that its carrying value will not be recovered through sale and indexation benefit at
the time of disposal will not be available, accordingly deferred tax asset on the difference between carrying value and indexed
value has not been created.
(a) Unused Tax Losses
Assessment Year Nature of Loss As at March
31, 2019
As at March
31, 2018
Available up
to A.Y.
2014-15 Long-term capital loss 644.98 644.98 2022-23
2019-20 Long-term capital loss 185.03 - 2027-28
2019-20 Long-term capital loss 0.10 - 2027-28
830.12 644.98

190 | Fiem Industries Limited
Notes to the Consolidated Financial Statements for the year ended 31.03.2019
39. LEASE TRANSACTION A. Lease as Lessee
The company has taken commercial premises under cancellable operating lease. Minimum lease payments in respect of assets
taken on cancellable operating lease are as follows:-
B. Lease as Lessor
The Company has leased out a portion of its building under a operating lease arrangement. The leases may be renewed for a
further period based on mutual agreement of the parties. During the year, an amount of Rupee 9.02 lakhs (previous year Rupee
1.65 lakhs) was recognised as rental income in the Statement of Profit and Loss. As at 31 March 2019, there are no future minimum
lease payments under non-cancellable operating lease as receivable.
40. EARNING PER SHARE
Particulars 2018-19 2017-18
Net Profit after tax attributable to equity shareholders 5,564.92 5,256.07
Weighted average number of equity shares outstanding during the year (Nos in lakhs) 131.60 131.60
Basic/diluted earning per share* (In Rs.) 42.29 39.94
Face value per equity share (In Rs.) 10 10
*There are no dilutive instruments issued by the Company.
41. GOVERNMENT GRANT
Particulars 2018-19 2017-18
Duty Drawback on Export 45.26 30.95
Investment Subsidy Under Investment Promotion Scheme - 49.80
Merchandise Export Incentive on Export 60.02 115.06
Refund of Electricity Duty - 99.68
Waiver of Electricity Duty (Notional) 65.40 65.40 38.64 138.32
Total 170.68 334.13
42. SEGMENT REPORTING (a) Identification of Segments:
Primary-Business Segments
The Company has identified two reportable business segments viz. Automotive and LED Luminaries Segment on the basis
of the nature of products, the risk and return profile of individual business and the internal business reporting systems. The
products included in each of the reported business segments are as follows:-
(i) Automotive comprising of automotive lighting & signalling equipment, rear view mirror, prismatic mirror, plastic moulded
parts, and sheet metal components for motorised vehicles and others parts for automotive.
Particulars 2018-19 2017-18
Total of future minimum lease payments under non-cancellable operating lease for following
periods:
Not later than one year -
Later than one year and not later than five years -
later than five years - -
Total - -
Lease Rental recognized in Statement of Profit & Loss in respect of cancellable leases 325.45 307.24
Total 325.45 307.24
(All Amounts are presented in Lakhs, unless otherwise stated)
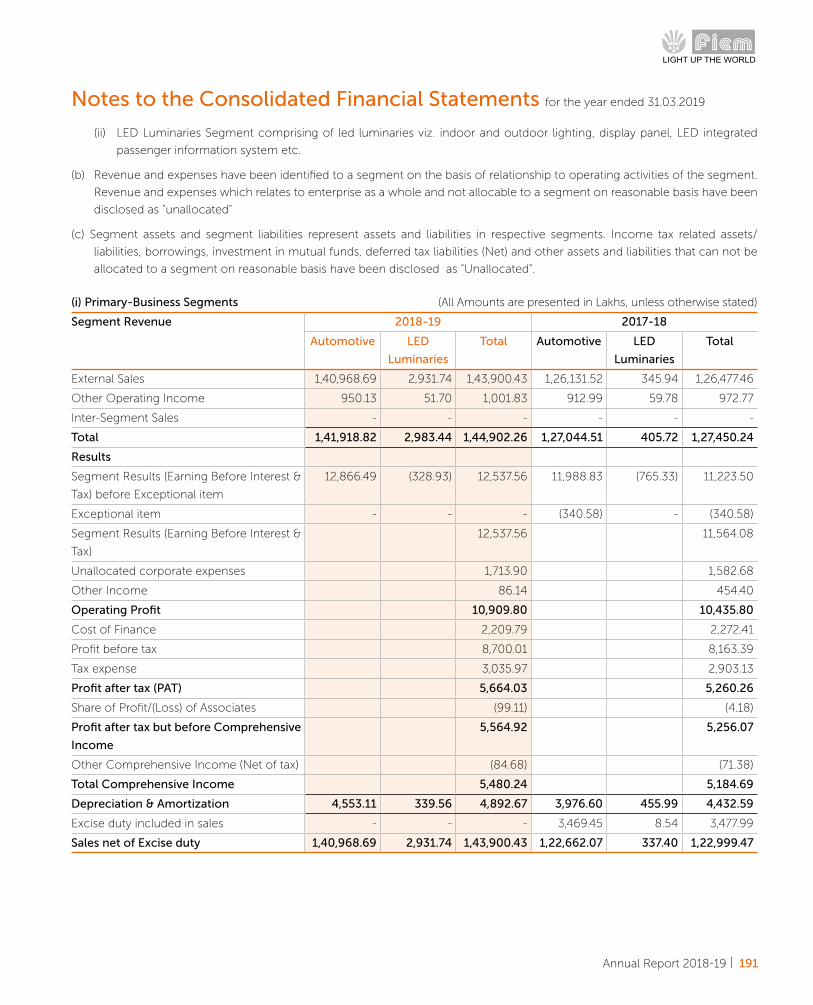
Annual Report 2018-19 | 191
Notes to the Consolidated Financial Statements for the year ended 31.03.2019
(ii) LED Luminaries Segment comprising of led luminaries viz. indoor and outdoor lighting, display panel, LED integrated
passenger information system etc.
(b) Revenue and expenses have been identified to a segment on the basis of relationship to operating activities of the segment.
Revenue and expenses which relates to enterprise as a whole and not allocable to a segment on reasonable basis have been
disclosed as "unallocated"
(c) Segment assets and segment liabilities represent assets and liabilities in respective segments. Income tax related assets/
liabilities, borrowings, investment in mutual funds, deferred tax liabilities (Net) and other assets and liabilities that can not be
allocated to a segment on reasonable basis have been disclosed as "Unallocated".
(i) Primary-Business Segments (All Amounts are presented in Lakhs, unless otherwise stated)
Segment Revenue 2018-19 2017-18
Automotive LED
Luminaries
Total Automotive LED
Luminaries
Total
External Sales 1,40,968.69 2,931.74 1,43,900.43 1,26,131.52 345.94 1,26,477.46
Other Operating Income 950.13 51.70 1,001.83 912.99 59.78 972.77
Inter-Segment Sales - - - - - -
Total 1,41,918.82 2,983.44 1,44,902.26 1,27,044.51 405.72 1,27,450.24
Results
Segment Results (Earning Before Interest &
Tax) before Exceptional item
12,866.49 (328.93) 12,537.56 11,988.83 (765.33) 11,223.50
Exceptional item - - - (340.58) - (340.58)
Segment Results (Earning Before Interest &
Tax)
12,537.56 11,564.08
Unallocated corporate expenses 1,713.90 1,582.68
Other Income 86.14 454.40
Operating Profit 10,909.80 10,435.80
Cost of Finance 2,209.79 2,272.41
Profit before tax 8,700.01 8,163.39
Tax expense 3,035.97 2,903.13
Profit after tax (PAT) 5,664.03 5,260.26
Share of Profit/(Loss) of Associates (99.11) (4.18)
Profit after tax but before Comprehensive
Income
5,564.92 5,256.07
Other Comprehensive Income (Net of tax) (84.68) (71.38)
Total Comprehensive Income 5,480.24 5,184.69
Depreciation & Amortization 4,553.11 339.56 4,892.67 3,976.60 455.99 4,432.59
Excise duty included in sales - - - 3,469.45 8.54 3,477.99
Sales net of Excise duty 1,40,968.69 2,931.74 1,43,900.43 1,22,662.07 337.40 1,22,999.47

192 | Fiem Industries Limited
Notes to the Consolidated Financial Statements for the year ended 31.03.2019
(ii) Secondary-Geographical Segments:-
The analysis of geographical segments is based on geographical location of the customers
The following is the distribution of Company's revenue by geographical market, regardless of where the goods were produced
(a) Revenue from External Customers
Particulars 2018-19 2017-18
India 1,42,424.72 1,25,625.52
Outside India 2,477.54 1,824.72
Total 1,44,902.26 1,27,450.24
(b) Segment Trade Receivables
Particulars As at March
31, 2019
As at March
31, 2018
India 14,604.67 14,456.99
Outside India 200.52 101.50
Total 14,805.19 14,558.49
1. The Company has common assets for producing goods for domestic market and overseas market. Hence, separate figures for
fixed assets have not be furnished.
(c) Major Customers
Details of customers which accounts for more than 10% of Company's total revenue are as follows
Particulars Segment 2018-19 2017-18
Honda Motorcycle and Scooter India Private Limited Automotive 53,831.57 52,362.88
TVS Motors Company Limited Automotive 40,216.75 33,788.13
Segment Assets As at 31st March, 2019 As at 31st March, 2018
Automotive LED
Luminaries
Total Automotive LED
Luminaries
Total
Segment Assets
Segment Assets 85,395.70 9,948.09 95,343.79 78,183.16 12,782.73 90,965.89
Unallocated Corporate Assets 938.28 - - 2,572.25
Total Assets 96,282.07 93,538.14
Segment Liabilities
Segment Liabilities 25,187.89 678.76 25,866.65 27,618.87 365.09 27,983.97
Unallocated Corporate Liabilities 22,700.44 20,619.73
Total Liabilities 48,567.09 48,603.70
Capital Employed (Total Assets Minus
Total Liabilities)
47,714.98 44,934.44
Capital Expenditure During the year (Net
of CWIP)
6,462.66 12.31 6,474.97 12,883.30 561.57 13,444.87
(All Amounts are presented in Lakhs, unless otherwise stated)
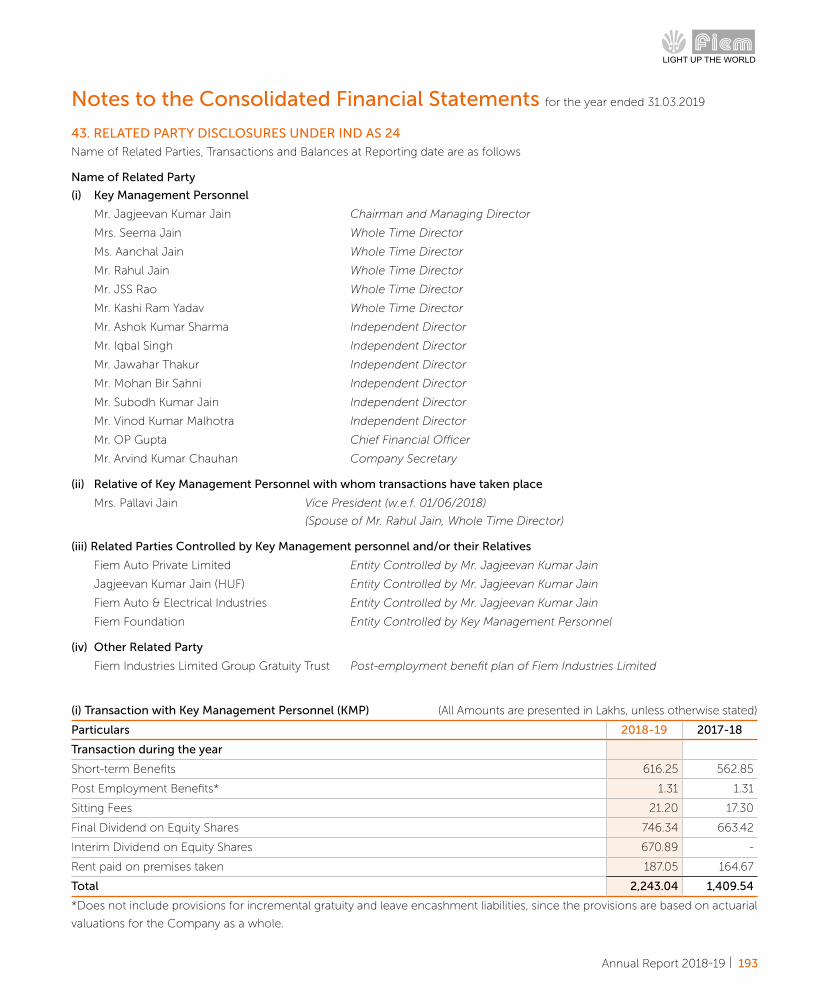
Annual Report 2018-19 | 193
Notes to the Consolidated Financial Statements for the year ended 31.03.2019
43. RELATED PARTY DISCLOSURES UNDER IND AS 24 Name of Related Parties, Transactions and Balances at Reporting date are as follows
Name of Related Party
(i) Key Management Personnel
Mr. Jagjeevan Kumar Jain Chairman and Managing Director
Mrs. Seema Jain Whole Time Director
Ms. Aanchal Jain Whole Time Director
Mr. Rahul Jain Whole Time Director
Mr. JSS Rao Whole Time Director
Mr. Kashi Ram Yadav Whole Time Director
Mr. Ashok Kumar Sharma Independent Director
Mr. Iqbal Singh Independent Director
Mr. Jawahar Thakur Independent Director
Mr. Mohan Bir Sahni Independent Director
Mr. Subodh Kumar Jain Independent Director
Mr. Vinod Kumar Malhotra Independent Director
Mr. OP Gupta Chief Financial Officer
Mr. Arvind Kumar Chauhan Company Secretary
(ii) Relative of Key Management Personnel with whom transactions have taken place
Mrs. Pallavi Jain Vice President (w.e.f. 01/06/2018)
(Spouse of Mr. Rahul Jain, Whole Time Director)
(iii) Related Parties Controlled by Key Management personnel and/or their Relatives
Fiem Auto Private Limited Entity Controlled by Mr. Jagjeevan Kumar Jain
Jagjeevan Kumar Jain (HUF) Entity Controlled by Mr. Jagjeevan Kumar Jain
Fiem Auto & Electrical Industries Entity Controlled by Mr. Jagjeevan Kumar Jain
Fiem Foundation Entity Controlled by Key Management Personnel
(iv) Other Related Party
Fiem Industries Limited Group Gratuity Trust Post-employment benefit plan of Fiem Industries Limited
(i) Transaction with Key Management Personnel (KMP) (All Amounts are presented in Lakhs, unless otherwise stated)
Particulars 2018-19 2017-18
Transaction during the year
Short-term Benefits 616.25 562.85
Post Employment Benefits* 1.31 1.31
Sitting Fees 21.20 17.30
Final Dividend on Equity Shares 746.34 663.42
Interim Dividend on Equity Shares 670.89 -
Rent paid on premises taken 187.05 164.67
Total 2,243.04 1,409.54
*Does not include provisions for incremental gratuity and leave encashment liabilities, since the provisions are based on actuarial
valuations for the Company as a whole.

194 | Fiem Industries Limited
Balance as at year end (All Amounts are presented in Lakhs, unless otherwise stated)
Particulars As at March
31, 2019
As at March
31, 2018
Short-term Benefits 36.23 29.86
Deposit Receivables against premises taken on rent 82.21 82.21
Total 118.44 112.07
Notes to the Consolidated Financial Statements for the year ended 31.03.2019
(a) Compensation Paid during the year
Particulars 2018-19 2017-18
Mr. Jagjeevan Kumar Jain 124.80 124.80
Mrs. Seema Jain 60.00 48.00
Mr. Rahul Jain 60.00 48.00
Ms. Aanchal Jain 48.00 42.00
Mr. JSS Rao 102.00 96.00
Mr. Kashi Ram Yadav 97.45 91.45
Mr. OP Gupta 57.00 52.20
Mr. Arvind Kumar Chauhan 68.31 61.71
Total Compensation 617.56 564.16
(b) Sitting Fee Paid to Independent Directors
Particulars 2018-19 2017-18
Mr. Ashok Kumar Sharma 2.50 2.50
Mr. Iqbal Singh 4.30 3.10
Mr. Jawahar Thakur 3.50 2.50
Mr. Mohan Bir Sahni 2.50 2.50
Mr. Subodh Kumar Jain 3.60 3.10
Mr. Vinod Kumar Malhotra 4.80 3.60
Total Sitting fees 21.20 17.30
(c) Dividend Paid on Equity Share
Final Dividend Interim Dividend
2018-19 2017-18 2018-19 2017-18
Mr. Jagjeevan Kumar Jain 266.40 236.80 244.27 -
Mrs. Seema Jain 266.40 236.80 236.80 -
Ms. Aanchal Jain 72.00 64.00 64.00 -
Mr. Rahul Jain 139.71 124.19 124.19 -
Mr. JSS Rao 0.00 0.00 0.00 -
Mr. Kashi Ram Yadav 0.03 0.03 0.03 -
Mr. Iqbal Singh 1.80 1.60 1.60 -
746.34 663.42 670.89 -

Annual Report 2018-19 | 195
Notes to the Consolidated Financial Statements for the year ended 31.03.2019
(d) Rent Paid for Premises Taken on Rent (All Amounts are presented in Lakhs, unless otherwise stated)
Particulars 2018-19 2017-18
Ms. Aanchal Jain 123.02 109.35
Mr. Rahul Jain 59.23 52.65
Mr. Jagjeevan Kumar Jain 4.80 2.67
187.05 164.67
(ii) Relative of Key Management Personnel with whom transaction have taken place
Particulars 2018-19 2017-18
Salary Paid during the year
Mrs. Pallavi Jain 25.00 -
Particulars As at March
31, 2019
As at March
31, 2018
Salary Payable as at year end
Mrs. Pallavi Jain 3.94 -
(b) Deposit Receivables Against Premises Taken on Rent as at year end
Particulars As at March
31, 2019
As at March
31, 2018
Ms. Aanchal Jain 54.68 54.68
Mr. Rahul Jain 26.33 26.33
Mr. Jagjeevan Kumar Jain 1.20 1.20
82.21 82.21
(a) Short Term Benefits payable as at year end
Particulars As at March
31, 2019
As at March
31, 2018
Mr. Jagjeevan Kumar Jain 7.85 5.76
Mrs. Seema Jain 3.61 2.73
Mr. Rahul Jain 3.05 1.33
Ms. Aanchal Jain 3.15 3.57
Mr. JSS Rao 5.50 4.95
Mr. Kashi Ram Yadav 5.56 5.25
Mr. OP Gupta 3.45 3.17
Mr. Arvind Kumar Chauhan 4.06 3.10
Total 36.23 29.86

196 | Fiem Industries Limited
(iii) Related Parties Controlled by Key Management personnel
(a) Fiem Foundation (All Amounts are presented in Lakhs, unless otherwise stated)
Particulars 2018-19 2017-18
Transaction during the year
Contribution in Corporate Social Responsibility Activities 122.34 123.08
(b) Fiem Auto & Electrical Industries
Particulars 2018-19 2017-18
Transaction during the year
Brand Royalty Paid 50.00 50.00
Notes to the Consolidated Financial Statements for the year ended 31.03.2019
(c) Jagjeevan Kumar Jain (HUF)
Final Dividend Interim Dividend
2018-19 2017-18 2018-19 2017-18
Dividend Paid on Equity Share 1.04 0.92 0.92 -
(d) Fiem Auto Private Limited
Final Dividend Interim Dividend
2018-19 2017-18 2018-19 2017-18
Dividend Paid on Equity Share 7.60 6.75 6.75 -
Particulars As at March
31, 2019
As at March
31, 2018
Balance as at year end
Brand Royalty Payable 13.50 13.50
44. POST EMPLOYMENT BENEFITS PLAN Defined Contribution Plans
Contribution to Defined Contribution Plan, recognized as 'Employee Benefits Expenses' for the year are as under:
Particulars 2018-19 2017-18
Employer’s Contribution to Provident Fund 270.55 249.01
Employer’s Contribution to ESI Fund 80.85 77.02
Employer’s Contribution to Wages Welfare Fund 2.61 2.59
Other 8.62 0.35
Total 362.63 328.97
Defined Benefit Plans
(a) Gratuity
The Company has defined benefit gratuity plan for its employees, which requires contributions to be made to a separately
administered fund. It is governed by the Payment of Gratuity Act, 1972. Under the Act, employee who has completed five years
of service is entitled to specific benefit. The level of benefits provided depends on the member's length of service and salary at
retirement age. The scheme is funded with Exide Life Insurance Company Limited in the form of qualifying insurance policy.

Annual Report 2018-19 | 197
Notes to the Consolidated Financial Statements for the year ended 31.03.2019
(b) Earned Leave The Present value obligation of Leave Encashment is determined based on actuarial valuation using projected unit credit method.
Disclosure requirement as per Indian Accounting Standard on Employee Benefits-Ind AS (19)-As per actuarial valuation as on 31.03.2019 are as follows:
(i) Expenses recognised in the Statement of Profit and Loss under the head employee benefits expense
(All Amounts are presented in Lakhs, unless otherwise stated)
Gratuity Leave Encashment
2018-19 2017-18 2018-19 2017-18
Current service cost 187.67 184.29 91.12 71.33
Interest cost 7.10 (1.41) 27.30 24.10
Actuarial (Gain)/Loss - - 40.49 (35.04)
Expenses recognized in Statement of Profit and Loss 194.77 182.88 158.91 60.39
Amount to be recognised in the Balance Sheet
Particulars For the year
ended 31st
March, 2019
For the year
ended 31st
March, 2018
For the year
ended 31st
March, 2019
For the year
ended 31st
March, 2018
Liability at the end of the year 1,234.32 974.62 481.84 377.87
Fair value of plan assets at the end of the year 924.06 777.71 - -
Amount to be recognised in Balance Sheet 310.26 196.92 481.84 377.87
Current 54.94 111.29 62.98 78.53
Non-Current 255.33 85.62 418.85 299.34
Reconciliation of benefit obligation
Particulars For the year
ended 31st
March, 2019
For the year
ended 31st
March, 2018
For the year
ended 31st
March, 2019
For the year
ended 31st
March, 2018
Liability at the beginning of the year 196.92 58.51 377.87 339.97
Interest cost - - 27.30 24.10
Recognised in Accumulated Other Comprehensive Income (111.35) (0.42) - -
Current service cost 194.77 182.88 91.12 71.33
Employers Contribution (211.59) (155.40) (54.95) (22.48)
Remeasurement (gain) / loss 241.52 111.35 40.49 (35.04)
Liability at the end of the year 310.26 196.92 481.84 377.87
Reconciliation of fair value of plan assets:
Particulars For the year
ended 31st
March, 2019
For the year
ended 31st
March, 2018
For the year
ended 31st
March, 2019
For the year
ended 31st
March, 2018
Fair value of plan assets at the beginning of the year 777.71 643.00 - -
Interest income 63.77 50.89 - -
Employers Contribution 211.59 155.40 54.95 22.48
Benefits paid (129.75) (52.96) (54.95) (22.48)
Return on plan assets-gain /(loss) 0.74 (18.62) - -
Fair value of plan assets at the end of the year 924.06 777.71 - -
Actual return on plan assets 64.51 32.27 - -
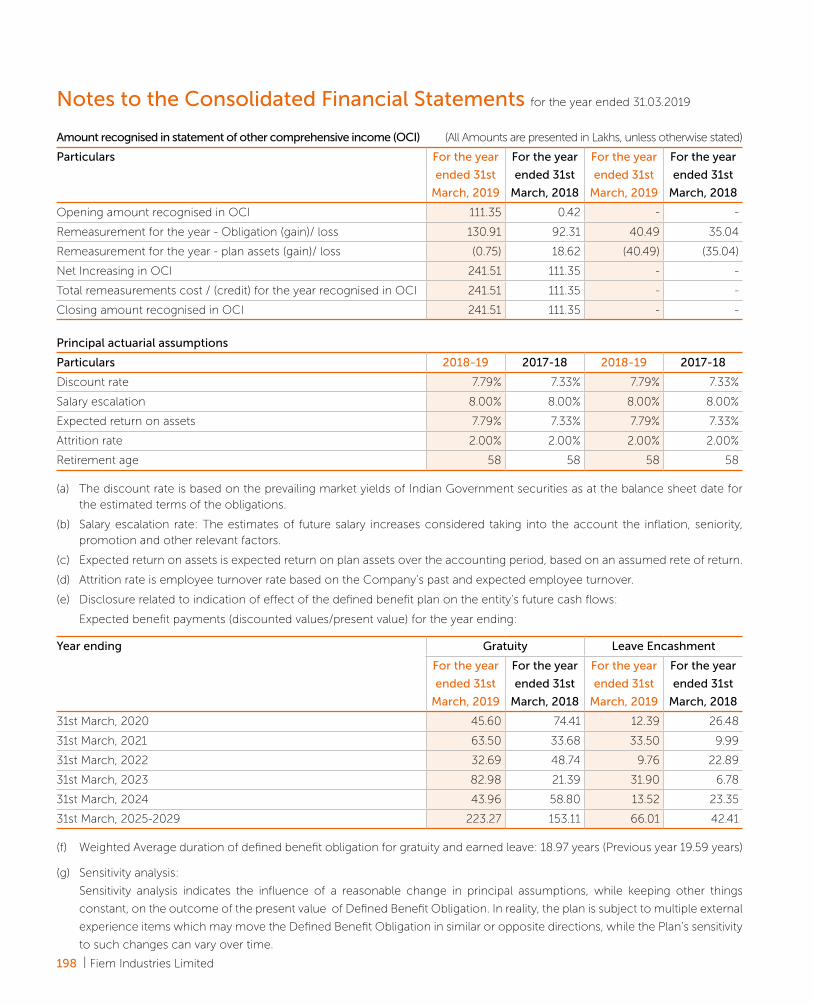
198 | Fiem Industries Limited
Year ending Gratuity Leave Encashment
For the year
ended 31st
March, 2019
For the year
ended 31st
March, 2018
For the year
ended 31st
March, 2019
For the year
ended 31st
March, 2018
31st March, 2020 45.60 74.41 12.39 26.48
31st March, 2021 63.50 33.68 33.50 9.99
31st March, 2022 32.69 48.74 9.76 22.89
31st March, 2023 82.98 21.39 31.90 6.78
31st March, 2024 43.96 58.80 13.52 23.35
31st March, 2025-2029 223.27 153.11 66.01 42.41
Amount recognised in statement of other comprehensive income (OCI) (All Amounts are presented in Lakhs, unless otherwise stated)
Particulars For the year
ended 31st
March, 2019
For the year
ended 31st
March, 2018
For the year
ended 31st
March, 2019
For the year
ended 31st
March, 2018
Opening amount recognised in OCI 111.35 0.42 - -
Remeasurement for the year - Obligation (gain)/ loss 130.91 92.31 40.49 35.04
Remeasurement for the year - plan assets (gain)/ loss (0.75) 18.62 (40.49) (35.04)
Net Increasing in OCI 241.51 111.35 - -
Total remeasurements cost / (credit) for the year recognised in OCI 241.51 111.35 - -
Closing amount recognised in OCI 241.51 111.35 - -
Principal actuarial assumptions
Particulars 2018-19 2017-18 2018-19 2017-18
Discount rate 7.79% 7.33% 7.79% 7.33%
Salary escalation 8.00% 8.00% 8.00% 8.00%
Expected return on assets 7.79% 7.33% 7.79% 7.33%
Attrition rate 2.00% 2.00% 2.00% 2.00%
Retirement age 58 58 58 58
(a) The discount rate is based on the prevailing market yields of Indian Government securities as at the balance sheet date for the estimated terms of the obligations.
(b) Salary escalation rate: The estimates of future salary increases considered taking into the account the inflation, seniority, promotion and other relevant factors.
(c) Expected return on assets is expected return on plan assets over the accounting period, based on an assumed rete of return.
(d) Attrition rate is employee turnover rate based on the Company’s past and expected employee turnover.
(e) Disclosure related to indication of effect of the defined benefit plan on the entity’s future cash flows:
Expected benefit payments (discounted values/present value) for the year ending:
(f) Weighted Average duration of defined benefit obligation for gratuity and earned leave: 18.97 years (Previous year 19.59 years)
(g) Sensitivity analysis:
Sensitivity analysis indicates the influence of a reasonable change in principal assumptions, while keeping other things
constant, on the outcome of the present value of Defined Benefit Obligation. In reality, the plan is subject to multiple external
experience items which may move the Defined Benefit Obligation in similar or opposite directions, while the Plan’s sensitivity
to such changes can vary over time.
Notes to the Consolidated Financial Statements for the year ended 31.03.2019
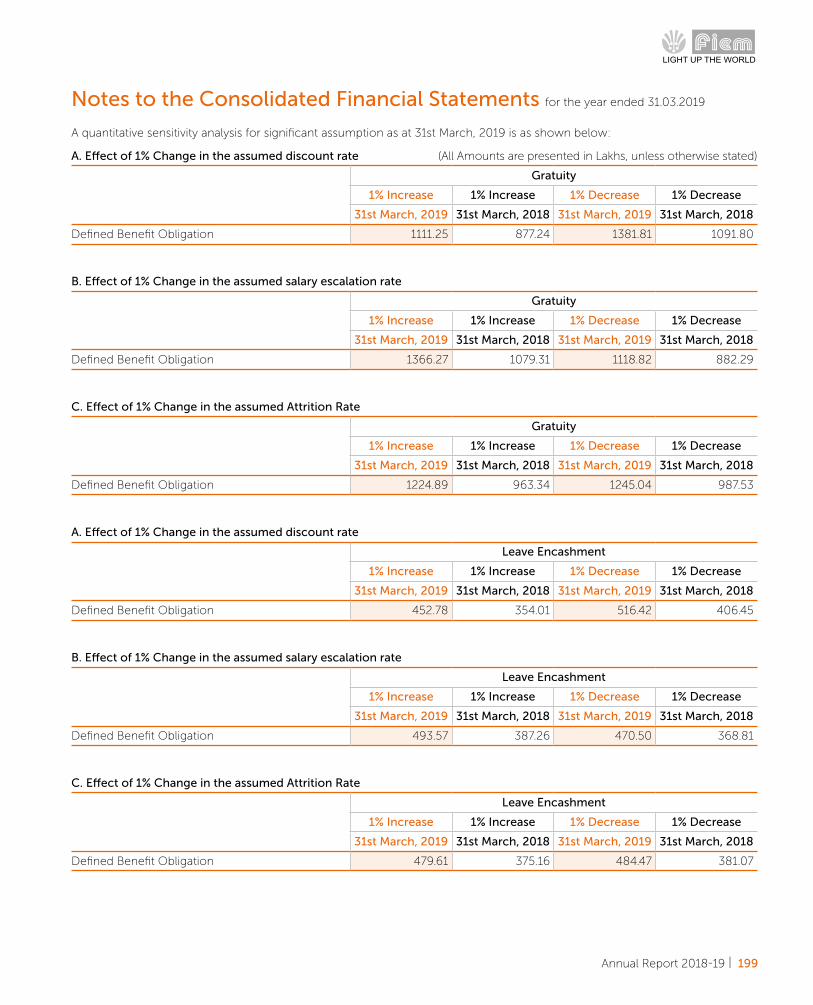
Annual Report 2018-19 | 199
Notes to the Consolidated Financial Statements for the year ended 31.03.2019
A quantitative sensitivity analysis for significant assumption as at 31st March, 2019 is as shown below:
A. Effect of 1% Change in the assumed discount rate (All Amounts are presented in Lakhs, unless otherwise stated)
Gratuity
1% Increase 1% Increase 1% Decrease 1% Decrease
31st March, 2019 31st March, 2018 31st March, 2019 31st March, 2018
Defined Benefit Obligation 1111.25 877.24 1381.81 1091.80
B. Effect of 1% Change in the assumed salary escalation rate
Gratuity
1% Increase 1% Increase 1% Decrease 1% Decrease
31st March, 2019 31st March, 2018 31st March, 2019 31st March, 2018
Defined Benefit Obligation 1366.27 1079.31 1118.82 882.29
C. Effect of 1% Change in the assumed Attrition Rate
Gratuity
1% Increase 1% Increase 1% Decrease 1% Decrease
31st March, 2019 31st March, 2018 31st March, 2019 31st March, 2018
Defined Benefit Obligation 1224.89 963.34 1245.04 987.53
B. Effect of 1% Change in the assumed salary escalation rate
Leave Encashment
1% Increase 1% Increase 1% Decrease 1% Decrease
31st March, 2019 31st March, 2018 31st March, 2019 31st March, 2018
Defined Benefit Obligation 493.57 387.26 470.50 368.81
C. Effect of 1% Change in the assumed Attrition Rate
Leave Encashment
1% Increase 1% Increase 1% Decrease 1% Decrease
31st March, 2019 31st March, 2018 31st March, 2019 31st March, 2018
Defined Benefit Obligation 479.61 375.16 484.47 381.07
A. Effect of 1% Change in the assumed discount rate
Leave Encashment
1% Increase 1% Increase 1% Decrease 1% Decrease
31st March, 2019 31st March, 2018 31st March, 2019 31st March, 2018
Defined Benefit Obligation 452.78 354.01 516.42 406.45
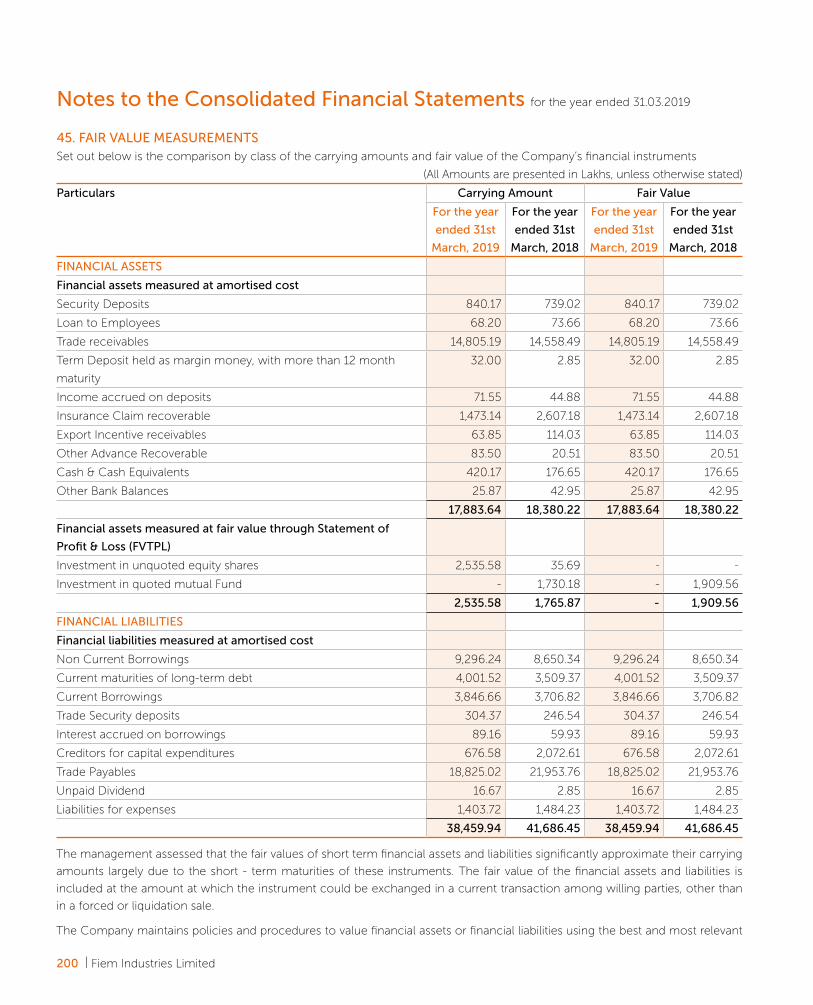
200 | Fiem Industries Limited
45. FAIR VALUE MEASUREMENTSSet out below is the comparison by class of the carrying amounts and fair value of the Company’s financial instruments
(All Amounts are presented in Lakhs, unless otherwise stated)
Particulars Carrying Amount Fair Value
For the year
ended 31st
March, 2019
For the year
ended 31st
March, 2018
For the year
ended 31st
March, 2019
For the year
ended 31st
March, 2018
FINANCIAL ASSETS
Financial assets measured at amortised cost
Security Deposits 840.17 739.02 840.17 739.02
Loan to Employees 68.20 73.66 68.20 73.66
Trade receivables 14,805.19 14,558.49 14,805.19 14,558.49
Term Deposit held as margin money, with more than 12 month
maturity
32.00 2.85 32.00 2.85
Income accrued on deposits 71.55 44.88 71.55 44.88
Insurance Claim recoverable 1,473.14 2,607.18 1,473.14 2,607.18
Export Incentive receivables 63.85 114.03 63.85 114.03
Other Advance Recoverable 83.50 20.51 83.50 20.51
Cash & Cash Equivalents 420.17 176.65 420.17 176.65
Other Bank Balances 25.87 42.95 25.87 42.95
17,883.64 18,380.22 17,883.64 18,380.22
Financial assets measured at fair value through Statement of
Profit & Loss (FVTPL)
Investment in unquoted equity shares 2,535.58 35.69 - -
Investment in quoted mutual Fund - 1,730.18 - 1,909.56
2,535.58 1,765.87 - 1,909.56
FINANCIAL LIABILITIES
Financial liabilities measured at amortised cost
Non Current Borrowings 9,296.24 8,650.34 9,296.24 8,650.34
Current maturities of long-term debt 4,001.52 3,509.37 4,001.52 3,509.37
Current Borrowings 3,846.66 3,706.82 3,846.66 3,706.82
Trade Security deposits 304.37 246.54 304.37 246.54
Interest accrued on borrowings 89.16 59.93 89.16 59.93
Creditors for capital expenditures 676.58 2,072.61 676.58 2,072.61
Trade Payables 18,825.02 21,953.76 18,825.02 21,953.76
Unpaid Dividend 16.67 2.85 16.67 2.85
Liabilities for expenses 1,403.72 1,484.23 1,403.72 1,484.23
38,459.94 41,686.45 38,459.94 41,686.45
The management assessed that the fair values of short term financial assets and liabilities significantly approximate their carrying
amounts largely due to the short - term maturities of these instruments. The fair value of the financial assets and liabilities is
included at the amount at which the instrument could be exchanged in a current transaction among willing parties, other than
in a forced or liquidation sale.
The Company maintains policies and procedures to value financial assets or financial liabilities using the best and most relevant
Notes to the Consolidated Financial Statements for the year ended 31.03.2019
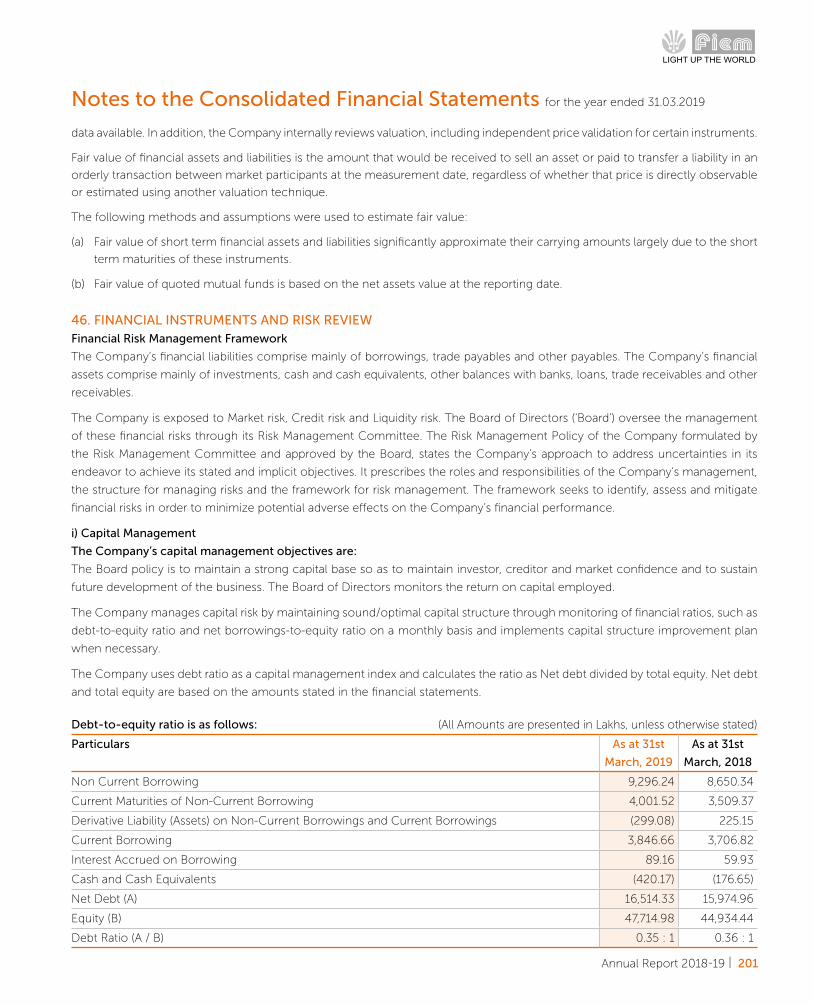
Annual Report 2018-19 | 201
Notes to the Consolidated Financial Statements for the year ended 31.03.2019
data available. In addition, the Company internally reviews valuation, including independent price validation for certain instruments.
Fair value of financial assets and liabilities is the amount that would be received to sell an asset or paid to transfer a liability in an
orderly transaction between market participants at the measurement date, regardless of whether that price is directly observable
or estimated using another valuation technique.
The following methods and assumptions were used to estimate fair value:
(a) Fair value of short term financial assets and liabilities significantly approximate their carrying amounts largely due to the short
term maturities of these instruments.
(b) Fair value of quoted mutual funds is based on the net assets value at the reporting date.
46. FINANCIAL INSTRUMENTS AND RISK REVIEW Financial Risk Management Framework
The Company’s financial liabilities comprise mainly of borrowings, trade payables and other payables. The Company’s financial
assets comprise mainly of investments, cash and cash equivalents, other balances with banks, loans, trade receivables and other
receivables.
The Company is exposed to Market risk, Credit risk and Liquidity risk. The Board of Directors (‘Board’) oversee the management
of these financial risks through its Risk Management Committee. The Risk Management Policy of the Company formulated by
the Risk Management Committee and approved by the Board, states the Company’s approach to address uncertainties in its
endeavor to achieve its stated and implicit objectives. It prescribes the roles and responsibilities of the Company’s management,
the structure for managing risks and the framework for risk management. The framework seeks to identify, assess and mitigate
financial risks in order to minimize potential adverse effects on the Company’s financial performance.
i) Capital Management
The Company’s capital management objectives are:
The Board policy is to maintain a strong capital base so as to maintain investor, creditor and market confidence and to sustain
future development of the business. The Board of Directors monitors the return on capital employed.
The Company manages capital risk by maintaining sound/optimal capital structure through monitoring of financial ratios, such as
debt-to-equity ratio and net borrowings-to-equity ratio on a monthly basis and implements capital structure improvement plan
when necessary.
The Company uses debt ratio as a capital management index and calculates the ratio as Net debt divided by total equity. Net debt
and total equity are based on the amounts stated in the financial statements.
Debt-to-equity ratio is as follows: (All Amounts are presented in Lakhs, unless otherwise stated)
Particulars As at 31st
March, 2019
As at 31st
March, 2018
Non Current Borrowing 9,296.24 8,650.34
Current Maturities of Non-Current Borrowing 4,001.52 3,509.37
Derivative Liability (Assets) on Non-Current Borrowings and Current Borrowings (299.08) 225.15
Current Borrowing 3,846.66 3,706.82
Interest Accrued on Borrowing 89.16 59.93
Cash and Cash Equivalents (420.17) (176.65)
Net Debt (A) 16,514.33 15,974.96
Equity (B) 47,714.98 44,934.44
Debt Ratio (A / B) 0.35 : 1 0.36 : 1
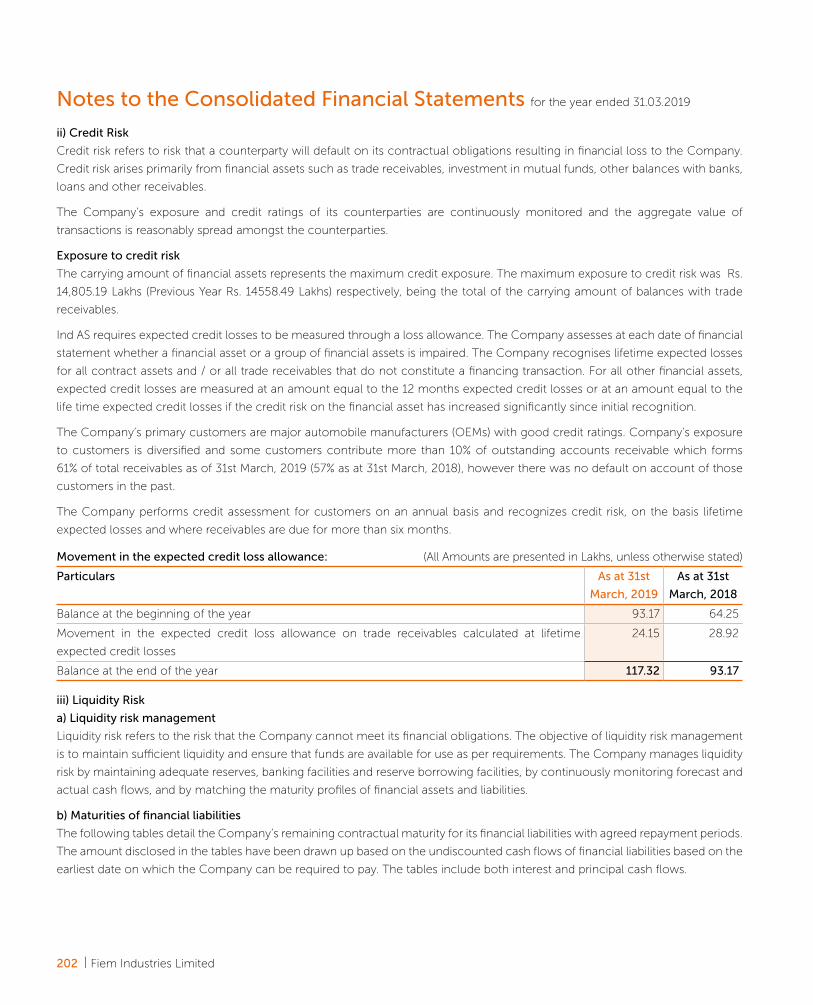
202 | Fiem Industries Limited
ii) Credit Risk
Credit risk refers to risk that a counterparty will default on its contractual obligations resulting in financial loss to the Company.
Credit risk arises primarily from financial assets such as trade receivables, investment in mutual funds, other balances with banks,
loans and other receivables.
The Company’s exposure and credit ratings of its counterparties are continuously monitored and the aggregate value of
transactions is reasonably spread amongst the counterparties.
Exposure to credit risk
The carrying amount of financial assets represents the maximum credit exposure. The maximum exposure to credit risk was Rs.
14,805.19 Lakhs (Previous Year Rs. 14558.49 Lakhs) respectively, being the total of the carrying amount of balances with trade
receivables.
Ind AS requires expected credit losses to be measured through a loss allowance. The Company assesses at each date of financial
statement whether a financial asset or a group of financial assets is impaired. The Company recognises lifetime expected losses
for all contract assets and / or all trade receivables that do not constitute a financing transaction. For all other financial assets,
expected credit losses are measured at an amount equal to the 12 months expected credit losses or at an amount equal to the
life time expected credit losses if the credit risk on the financial asset has increased significantly since initial recognition.
The Company’s primary customers are major automobile manufacturers (OEMs) with good credit ratings. Company’s exposure
to customers is diversified and some customers contribute more than 10% of outstanding accounts receivable which forms
61% of total receivables as of 31st March, 2019 (57% as at 31st March, 2018), however there was no default on account of those
customers in the past.
The Company performs credit assessment for customers on an annual basis and recognizes credit risk, on the basis lifetime
expected losses and where receivables are due for more than six months.
iii) Liquidity Risk
a) Liquidity risk management
Liquidity risk refers to the risk that the Company cannot meet its financial obligations. The objective of liquidity risk management
is to maintain sufficient liquidity and ensure that funds are available for use as per requirements. The Company manages liquidity
risk by maintaining adequate reserves, banking facilities and reserve borrowing facilities, by continuously monitoring forecast and
actual cash flows, and by matching the maturity profiles of financial assets and liabilities.
b) Maturities of financial liabilities
The following tables detail the Company’s remaining contractual maturity for its financial liabilities with agreed repayment periods.
The amount disclosed in the tables have been drawn up based on the undiscounted cash flows of financial liabilities based on the
earliest date on which the Company can be required to pay. The tables include both interest and principal cash flows.
Movement in the expected credit loss allowance: (All Amounts are presented in Lakhs, unless otherwise stated)
Particulars As at 31st
March, 2019
As at 31st
March, 2018
Balance at the beginning of the year 93.17 64.25
Movement in the expected credit loss allowance on trade receivables calculated at lifetime
expected credit losses
24.15 28.92
Balance at the end of the year 117.32 93.17
Notes to the Consolidated Financial Statements for the year ended 31.03.2019

Annual Report 2018-19 | 203
Notes to the Consolidated Financial Statements for the year ended 31.03.2019
Particulars 31st March, 2019 31st March, 2018
Less than 1
Year
1-5 Years Less than 1
Year
1-5 Years
Financial liabilities
Trade payables 18,825.02 - 21,953.76 -
Other Financial Liabilities 2,401.35 - 3,806.23 186.81
Working capital demand loans 3,846.66 - 3,706.82 -
Term loans 4,001.52 9,296.24 3,509.37 8,650.34
Interest Accrued 89.16 - 59.93 -
29,163.71 9,296.24 33,036.11 8,837.15
Particulars 31st March, 2019 31st March, 2018
Less than 1
Year
1-5 Years Less than 1
Year
1-5 Years
Non-derivative Financial assets
Trade receivables 14,680.29 124.90 14,433.59 124.90
Other Financial Assets 2,188.00 3,593.96 4,972.27 794.70
16,868.29 3,718.86 19,405.86 919.60
c) Maturities of financial assets
The following table details the Company’s expected maturity for financial assets. The table has been drawn up based on the
undiscounted contractual maturities of the financial assets including interest that will be earned on such assets.
iv) Market Risk
Market risk is the risk that the fair value or future cash flows of a financial instrument will fluctuate because of changes in market
prices. Such changes in the values of financial instruments may result from changes in the foreign currency exchange rates,
interest rates, credit, liquidity and other market changes. The Company’s exposure to market risk is primarily on account of foreign
currency exchange rate risk.
a) Foreign Currency exchange rate risk
The fluctuation in foreign currency exchange rates may have potential impact on the statement of profit or loss and other
comprehensive income and equity, where any transaction references more than one currency or where assets / liabilities are
denominated in a currency other tha n the functional currency of the respective entities. Considering the countries and economic
environment in which the Company operates, its operations are subject to risks arising from fluctuations in exchange rates in
those countries. The risks primarily relate to fluctuations in US Dollar, Euro, Great Britain Pound and Japanese Yen against the
respective functional currencies of the Company. The Company The Company, as per its risk management policy, uses derivative
instruments primarily to hedge foreign exchange.
The Company evaluates the impact of foreign exchange rate fluctuations by assessing its exposure to exchange rate risks. It
hedges a part of these risks by using derivative financial instruments in line with its risk management policies. The information on
derivative instruments is as follows.
(All Amounts are presented in Lakhs, unless otherwise stated)
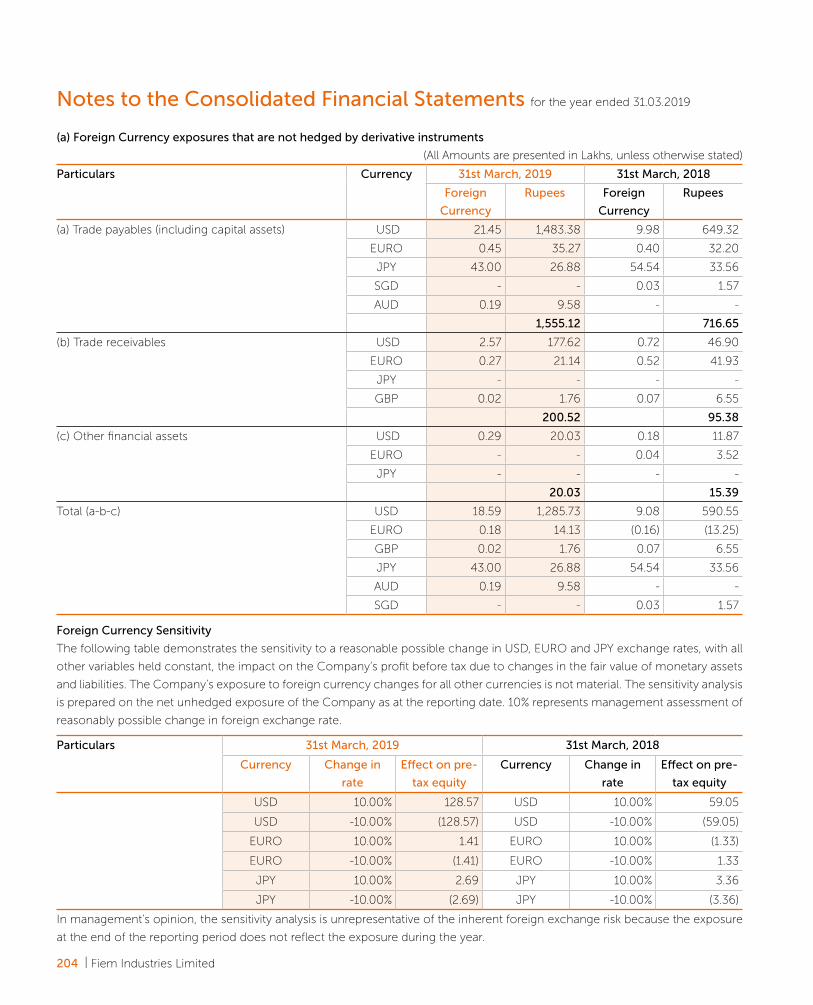
204 | Fiem Industries Limited
Particulars 31st March, 2019 31st March, 2018
Currency Change in
rate
Effect on pre-
tax equity
Currency Change in
rate
Effect on pre-
tax equity
USD 10.00% 128.57 USD 10.00% 59.05
USD -10.00% (128.57) USD -10.00% (59.05)
EURO 10.00% 1.41 EURO 10.00% (1.33)
EURO -10.00% (1.41) EURO -10.00% 1.33
JPY 10.00% 2.69 JPY 10.00% 3.36
JPY -10.00% (2.69) JPY -10.00% (3.36)
In management’s opinion, the sensitivity analysis is unrepresentative of the inherent foreign exchange risk because the exposure
at the end of the reporting period does not reflect the exposure during the year.
(a) Foreign Currency exposures that are not hedged by derivative instruments
(All Amounts are presented in Lakhs, unless otherwise stated)
Particulars Currency 31st March, 2019 31st March, 2018
Foreign
Currency
Rupees Foreign
Currency
Rupees
(a) Trade payables (including capital assets) USD 21.45 1,483.38 9.98 649.32
EURO 0.45 35.27 0.40 32.20
JPY 43.00 26.88 54.54 33.56
SGD - - 0.03 1.57
AUD 0.19 9.58 - -
1,555.12 716.65
(b) Trade receivables USD 2.57 177.62 0.72 46.90
EURO 0.27 21.14 0.52 41.93
JPY - - - -
GBP 0.02 1.76 0.07 6.55
200.52 95.38
(c) Other financial assets USD 0.29 20.03 0.18 11.87
EURO - - 0.04 3.52
JPY - - - -
20.03 15.39
Total (a-b-c) USD 18.59 1,285.73 9.08 590.55
EURO 0.18 14.13 (0.16) (13.25)
GBP 0.02 1.76 0.07 6.55
JPY 43.00 26.88 54.54 33.56
AUD 0.19 9.58 - -
SGD - - 0.03 1.57
Foreign Currency Sensitivity
The following table demonstrates the sensitivity to a reasonable possible change in USD, EURO and JPY exchange rates, with all
other variables held constant, the impact on the Company’s profit before tax due to changes in the fair value of monetary assets
and liabilities. The Company’s exposure to foreign currency changes for all other currencies is not material. The sensitivity analysis
is prepared on the net unhedged exposure of the Company as at the reporting date. 10% represents management assessment of
reasonably possible change in foreign exchange rate.
Notes to the Consolidated Financial Statements for the year ended 31.03.2019
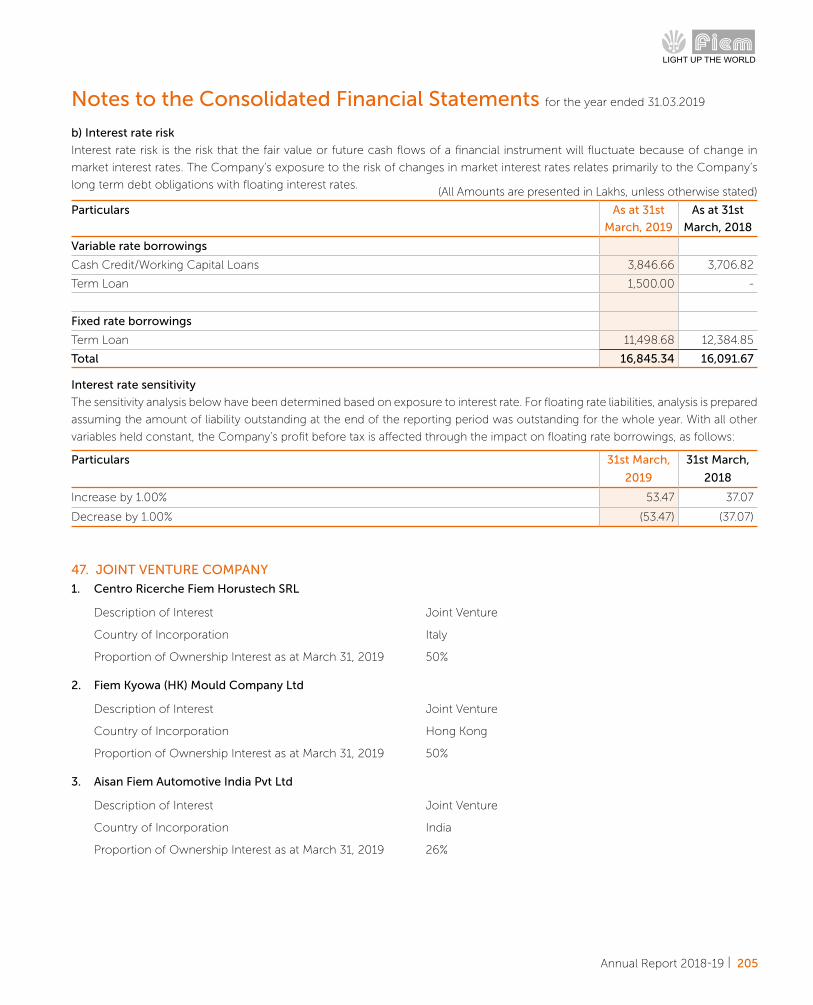
Annual Report 2018-19 | 205
Notes to the Consolidated Financial Statements for the year ended 31.03.2019
b) Interest rate risk
Interest rate risk is the risk that the fair value or future cash flows of a financial instrument will fluctuate because of change in
market interest rates. The Company’s exposure to the risk of changes in market interest rates relates primarily to the Company’s
long term debt obligations with floating interest rates.
Interest rate sensitivity
The sensitivity analysis below have been determined based on exposure to interest rate. For floating rate liabilities, analysis is prepared
assuming the amount of liability outstanding at the end of the reporting period was outstanding for the whole year. With all other
variables held constant, the Company’s profit before tax is affected through the impact on floating rate borrowings, as follows:
Particulars 31st March,
2019
31st March,
2018
Increase by 1.00% 53.47 37.07
Decrease by 1.00% (53.47) (37.07)
47. JOINT VENTURE COMPANY
1. Centro Ricerche Fiem Horustech SRL
Description of Interest Joint Venture
Country of Incorporation Italy
Proportion of Ownership Interest as at March 31, 2019 50%
2. Fiem Kyowa (HK) Mould Company Ltd
Description of Interest Joint Venture
Country of Incorporation Hong Kong
Proportion of Ownership Interest as at March 31, 2019 50%
3. Aisan Fiem Automotive India Pvt Ltd
Description of Interest Joint Venture
Country of Incorporation India
Proportion of Ownership Interest as at March 31, 2019 26%
Particulars As at 31st
March, 2019
As at 31st
March, 2018
Variable rate borrowings
Cash Credit/Working Capital Loans 3,846.66 3,706.82
Term Loan 1,500.00 -
Fixed rate borrowings
Term Loan 11,498.68 12,384.85
Total 16,845.34 16,091.67
(All Amounts are presented in Lakhs, unless otherwise stated)

206 | Fiem Industries Limited
In respect of jointly control entity, the company's share of assets, liabilities, incomes and expenses are as follows-
(All Amounts are presented in Lakhs, unless otherwise stated)
Particulars Centro Ricerche Fiem
Horustech SRL
Fiem Kyowa (HK) Mould
Company Ltd
Aisan Fiem Automotive
India Pvt Ltd
Year ended
31.03.2019
Year ended
31.03.2018
Year ended
31.03.2019
Year ended
31.03.2018
Year ended
31.03.2019
Year ended
31.03.2018
Non Current Assets 37.25 24.18 - - 2,186.27 -
Current Assets 63.88 65.01 177.98 8.08 962.21 -
Non Current Liabilities 37.03 13.42 - - 3.28 -
Current Liabilities 41.86 51.17 161.85 - 650.25 -
Revenue 99.12 104.42 68.55 - 76.68 -
Expenses 101.24 108.28 60.50 0.32 217.92 -
Profit or loss from containing
operations
(2.11) (3.86) 8.05 (0.32) (105.05) -
Post-tax profit or loss from
discontinued operations
- - - - - -
Other comprehensive income - - - - - -
Total comprehensive income (2.11) (3.86) 8.05 (0.32) (105.05) -
Dividend Received - - - - - -
Notes to the Consolidated Financial Statements for the year ended 31.03.2019
48. DUES TO MICRO, SMALL AND MEDIUM ENTERPRISES
The Ministry of Micro, Small and Medium Enterprises has issued an office memorandum dated August 26, 2008 which recommends
that the Micro and Small Enterprises should mention in their correspondence with its customers the Entrepreneurs Memorandum
Number as allocated after filing of the Memorandum in accordance with the ‘Micro, Small and Medium Enterprises Development
Act, 2006’ (‘the Act’). Accordingly, the disclosure in respect of the amounts payable to such enterprises as at March 31, 2019 and
March 31, 2018 has been made in the financial statements based on information received and available with the Company. The
Company has not received any claim for interest from any supplier as at the balance sheet date.
Particulars Year ended
31.03.2019
Year ended
31.03.2018
The principal amount remaining unpaid to any supplier at the end of each accounting year; 122.62 159.11
The interest due thereon remaining unpaid to any supplier at the end of each accounting year; - -
The amount of interest paid by the buyer in terms of section 16 of the Micro, Small and Medium
Enterprises Development Act, 2006 (27 of 2006), along with the amount of the payment made to
the supplier beyond the appointed day during each accounting year;
- -
The amount of interest due and payable for the period of delay in making payment (which has
been paid but beyond the appointed day during the year) but without adding the interest specified
under the Micro, Small and Medium Enterprises Development Act, 2006
- -
The amount of interest accrued and remaining unpaid at the end of each accounting year; and - -
The amount of further interest remaining due and payable even in the succeeding years, until
such date when the interest dues above are actually paid to the small enterprise, for the purpose
of disallowance of a deductible expenditure under section 23 of the Micro, Small and Medium
Enterprises Development Act, 2006
- -
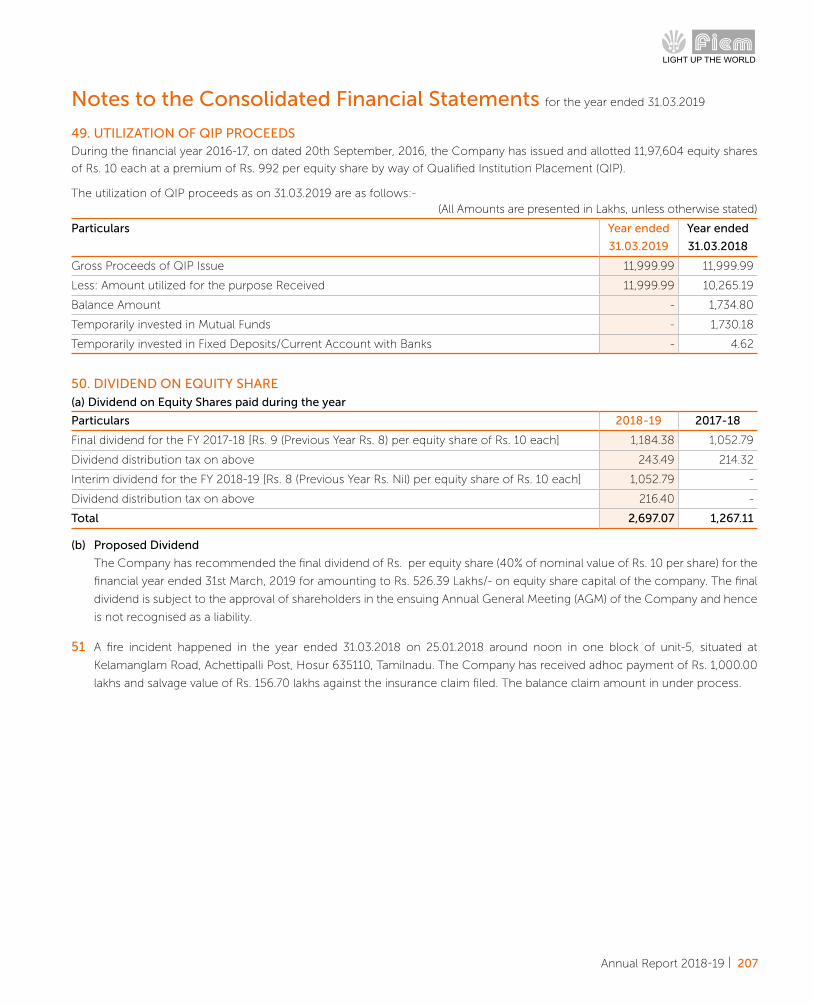
Annual Report 2018-19 | 207
Notes to the Consolidated Financial Statements for the year ended 31.03.2019
50. DIVIDEND ON EQUITY SHARE (a) Dividend on Equity Shares paid during the year
(b) Proposed Dividend
The Company has recommended the final dividend of Rs. per equity share (40% of nominal value of Rs. 10 per share) for the
financial year ended 31st March, 2019 for amounting to Rs. 526.39 Lakhs/- on equity share capital of the company. The final
dividend is subject to the approval of shareholders in the ensuing Annual General Meeting (AGM) of the Company and hence
is not recognised as a liability.
51 A fire incident happened in the year ended 31.03.2018 on 25.01.2018 around noon in one block of unit-5, situated at
Kelamanglam Road, Achettipalli Post, Hosur 635110, Tamilnadu. The Company has received adhoc payment of Rs. 1,000.00
lakhs and salvage value of Rs. 156.70 lakhs against the insurance claim filed. The balance claim amount in under process.
Particulars 2018-19 2017-18
Final dividend for the FY 2017-18 [Rs. 9 (Previous Year Rs. 8) per equity share of Rs. 10 each] 1,184.38 1,052.79
Dividend distribution tax on above 243.49 214.32
Interim dividend for the FY 2018-19 [Rs. 8 (Previous Year Rs. Nil) per equity share of Rs. 10 each] 1,052.79 -
Dividend distribution tax on above 216.40 -
Total 2,697.07 1,267.11
49. UTILIZATION OF QIP PROCEEDS During the financial year 2016-17, on dated 20th September, 2016, the Company has issued and allotted 11,97,604 equity shares
of Rs. 10 each at a premium of Rs. 992 per equity share by way of Qualified Institution Placement (QIP).
The utilization of QIP proceeds as on 31.03.2019 are as follows:-
Particulars Year ended
31.03.2019
Year ended
31.03.2018
Gross Proceeds of QIP Issue 11,999.99 11,999.99
Less: Amount utilized for the purpose Received 11,999.99 10,265.19
Balance Amount - 1,734.80
Temporarily invested in Mutual Funds - 1,730.18
Temporarily invested in Fixed Deposits/Current Account with Banks - 4.62
(All Amounts are presented in Lakhs, unless otherwise stated)

208 | Fiem Industries Limited
Notes to the Consolidated Financial Statements for the year ended 31.03.2019
For and on behalf of the Board of Directors As per our report of even date
For V. Sachdeva & Associates
Chartered Accountants
Firm Registration Number: 004417N
Sd/- Sd/- Sd/- Sd/- Sd/-
J. K. Jain Rahul Jain O.P. Gupta Arvind K. Chauhan (V. Sachdev)
Managing Director Director Chief Financial Officer Company Secretary Prop. (Membership No. 083435)
Place : Rai, Sonepat (HR.)
Date : 14/05/2019
52. ADDITIONAL INFORMATION, AS REQUIRED UNDER SCHEDULE III TO THE COMPANIES ACT, 2013, OF ENTERPRISES CONSOLIDATED AS SUBSIDIARY
Particulars Net Assets i.e. Total Assets
minus Total Liabilities
Share in Profit & Loss
As on 31.03.2019 2018-19
As % of
Consolidated
Net Assets
Amount As % of
Consolidated
Profit and
Loss
Amount
(i) Parent
Fiem Industries Ltd 99.39% 47,425.73 97.90% 5,364.95
(ii) Foreign Subsidiary
Fiem Industries Japan Co., Ltd 0.40% 190.59 2.09% 114.73
Fiem (Thai) Design & Technology Co. Ltd 0.04% 19.64 -0.01% (0.36)
Fiem Research & Technology SRL 0.17% 79.02 0.02% 0.92
Total 47,714.98 5,480.24
Particulars Net Assets i.e. Total Assets
minus Total Liabilities
Share in Profit & Loss
As on 31.03.2018 2017-18
As % of
Consolidated
Net Assets
Amount As % of
Consolidated
Profit and
Loss
Amount
(i) Parent
Fiem Industries Ltd 99.79% 44,841.02 99.95% 5,182.11
(ii) Foreign Subsidiary
Fiem Industries Japan Co., Ltd 0.16% 73.76 0.05% 2.57
Fiem (Thai) Design & Technology Co. Ltd 0.04% 19.68 0.00% -
Total 44,934.46 5,184.69
53 Previous year's figures have been regrouped/reclassified wherever necessary to correspond with the current year's
classification/disclosure.
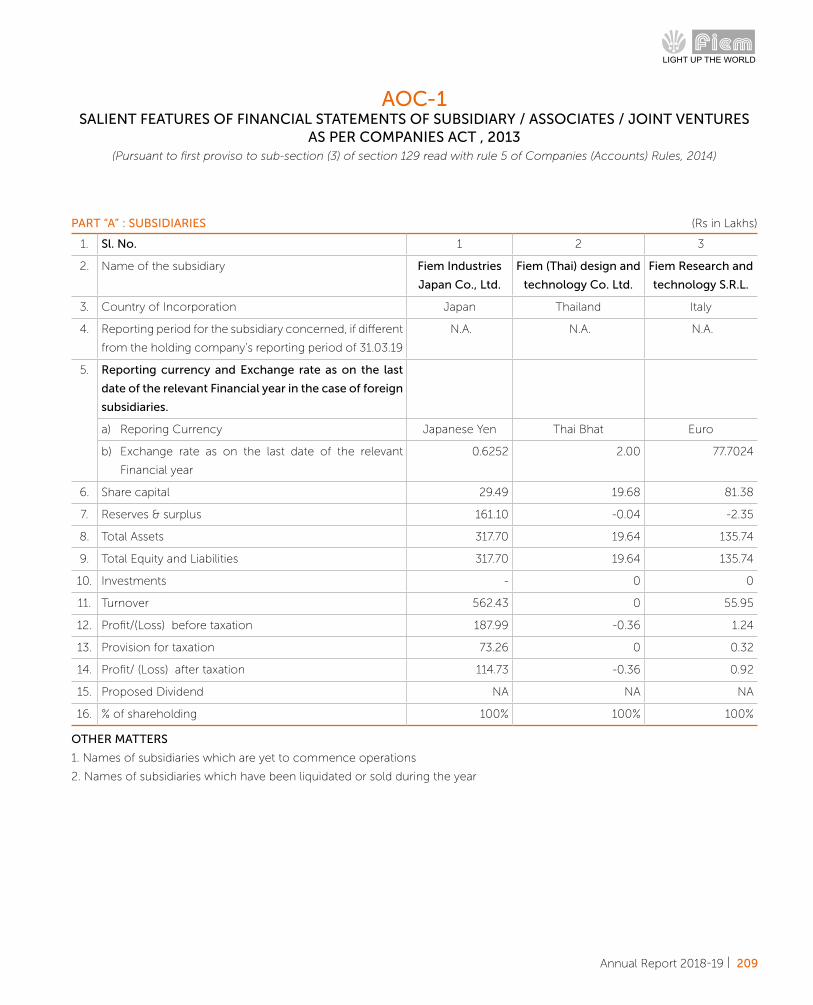
Annual Report 2018-19 | 209
AOC-1SALIENT FEATURES OF FINANCIAL STATEMENTS OF SUBSIDIARY / ASSOCIATES / JOINT VENTURES
AS PER COMPANIES ACT , 2013(Pursuant to first proviso to sub-section (3) of section 129 read with rule 5 of Companies (Accounts) Rules, 2014)
PART “A” : SUBSIDIARIES (Rs in Lakhs)
1. Sl. No. 1 2 3
2. Name of the subsidiary Fiem Industries
Japan Co., Ltd.
Fiem (Thai) design and
technology Co. Ltd.
Fiem Research and
technology S.R.L.
3. Country of Incorporation Japan Thailand Italy
4. Reporting period for the subsidiary concerned, if different
from the holding company’s reporting period of 31.03.19
N.A. N.A. N.A.
5. Reporting currency and Exchange rate as on the last
date of the relevant Financial year in the case of foreign
subsidiaries.
a) Reporing Currency Japanese Yen Thai Bhat Euro
b) Exchange rate as on the last date of the relevant
Financial year
0.6252 2.00 77.7024
6. Share capital 29.49 19.68 81.38
7. Reserves & surplus 161.10 -0.04 -2.35
8. Total Assets 317.70 19.64 135.74
9. Total Equity and Liabilities 317.70 19.64 135.74
10. Investments - 0 0
11. Turnover 562.43 0 55.95
12. Profit/(Loss) before taxation 187.99 -0.36 1.24
13. Provision for taxation 73.26 0 0.32
14. Profit/ (Loss) after taxation 114.73 -0.36 0.92
15. Proposed Dividend NA NA NA
16. % of shareholding 100% 100% 100%
OTHER MATTERS
1. Names of subsidiaries which are yet to commence operations
2. Names of subsidiaries which have been liquidated or sold during the year

210 | Fiem Industries Limited
PART “B”: ASSOCIATES AND JOINT VENTURES (Rs in Lakhs)
S.
No. Particulars
Joint Venture Associates
Centro Ricerche
FIEM HorustecH
S.r.l.
Fiem Kyowa (HK)
Mould Company
Ltd.
Aisan Fiem
Automotive India
Private Ltd.
1 Latest audited Balance Sheet Date 31.03.19 31.03.19 31.03.19
2 Country of Incorporation Italy Hongkong India
3 Shares of Associate/Joint Ventures held by the company on
the year end
No. of shares 50% 1000 Shares 26000000 Equity
shares
Amount of Investment in Associates/Joint Venture- Rs. Lakh 33.16 8.4 2600
Extend of Holding % 50% 50% 26%
4 Description of how there is significant influence 50: 50 Joint
Venture
50: 50 Joint
Venture
26% shareholding
5 Reason why the associate/joint venture is not consolidated N.A. N.A. N.A.
6 Networth attributable to Shareholding as per latest audited
Balance Sheet
22.16 16.13 2,494.95
7 Profit / (Loss) for the year
i. Considered in Consolidation -2.11 8.05 -105.05
i. Not Considered in Consolidation -2.11 8.05 -298.97
OTHER MATTERS
1 Names of associates or joint ventures which are yet to commence operations
2 Names of associates or joint ventures which have been liquidated or sold during the year.
For and on behalf of the Board of Directors As per our report of even date
For V. Sachdeva & Associates
Chartered Accountants
Firm Registration Number: 004417N
Sd/- Sd/- Sd/- Sd/- Sd/-
J. K. Jain Rahul Jain O.P. Gupta Arvind K. Chauhan (V. Sachdev)
Managing Director Director Chief Financial Officer Company Secretary Prop. (Membership No. 083435)
Place : Rai, Sonepat (HR.)
Date : 14/05/2019

Notes

Notes

TVS Apache 160 4V
Suzuki Gixxer 150SF
Yamaha FZ15 V3
Forward-looking statement: This document contains statements about
expected future events and financial and operating results of Fiem
Industries Limited, which are forward looking. By their nature, forward-
looking statements require the Company to make assumptions and are
subject to inherent risks and uncertainties. There is significant risk that
the assumptions, predictions and other forward-looking statements will
not prove to be accurate. Readers are cautioned not to place undue reliance
on forward-looking statements as a number of factors could cause
assumptions, actual future results and events to differ materially from
those expressed in the forward-looking statements. Further, certain
industry data and other information presented in this document are
collected from various reports and sources publicly available. We cannot
authenticate the correctness of such data and information. Accordingly,
this entire document is subject to this disclaimer. Readers are cautioned
that the Company is in no way responsible for any loss / adverse result
caused to them attributable to any statement in this document. Readers
are requested to exercise their own judgment in assessing the risk
associated with the Company.
Scan this QR code to view the report at one go on your hand-held device
WHAT’S IN THIS REPORT...
02 FIEM – Led by conviction
04 Chairman’s message
08 Awards and accolades
LIGHT UP THE WORLD
14 R&D leadership
18 Manufacturing footprint
20 Financial performance
22 Diversified product portfolio
24 Strong client base
25 FIEM: companion of underprivileged
28 Board of directors
29 General information
30 Directors’ report with annexures
89 Financial statements
LIGHT UP THE WORLD
Conviction led growth
FIEM INDUSTRIES LTD.Annual Report 2018-19
LIGHT UP THE WORLD
Fiem Industries limitedCIN: L36999DL1989PLC034928
Registered Office:
D-34, DSIDC Packaging Complex,
Kirti Nagar, New Delhi - 110015, India
Email: [email protected]
Tel. : +91-11-25927820, 25927919 | Fax : +91-11-25927740
Unit - VII & Corporate Office:
Plot No. 1915, Rai Industrial Estate,
Phase-V, Sonepat - 131029 (Haryana) India
Tel. : +91-130-2367905/906/907/909/910
Delhi Head Office:
Unit No. 1A & 1C, 1st Floor, Commercial Towers,
JW Marriott Hotel, Aerocity, New Delhi-110037
Tel. : 9821795327/28/29/30
Website: www.fiemindustries.com