Embed Size (px)
Citation preview
(S
A
LIGHT
SINTESE
ANDRE ALE
T CONTR
E DE ÁCI
EXANDRE
ROLLED
DOS NU
COTTA G
SYNTH
UCLEICO
DisserDoutopela Ciênci
LISBOA, 20
UERRA VI
ESIS OF
OS CONT
rtação apresor em BioquíUniversidadias e Tecnolo
010
IDAL PINH
F NUCLE
TROLAD
sentada parímica – Espede Nova de ogia
HEIRO
EIC ACID
DA POR
a obtenção ecialidade BiLisboa, Fa
DS
LUZ)
do Grau deotecnologia,aculdade de
e e

II

III
Nº de Arquivo
“copyright”

IV

V
A meus pais
To my parents

VI
VII
ACKNOWLEDGEMENTS
As we express our gratitude, we must never forget that the highest appreciation is not to
utter words, but to live by them.
John F. Kennedy
In the course of the years passed, I had the privilege and honor of having the support of many people
and institutions, whose contribution was decisive for the completion of the work here presented.
Without them, none of it would have been possible. To all of you, I present my deepest appreciation, in
particular to:
Aos meus orientadores Professor João Carlos Lima e Professor Pedro Viana Baptista, por me terem
ensinado como um aluno e discutido ideias como um par. Pela vossa incansável disposição e dedicação à
minha formação científica. Pela porta sempre aberta. Pelas palavras de apreço nas victórias, pela
sensatez nos infortúnios e pelos berros na deriva. Por terem embarcado neste projecto.
We are what we repeatedly do. Excellence then, is not an act, but a habit.
Aristotle
Ao meu amigo João Carlos, pelas infindáveis conversas acerca de tudo e mais alguma coisa, dentro e fora
do laboratório. Por me ter ensinado a verdadeira essência da ciência. Por ter sido sempre o contra‐peso
em qualquer situação explosiva e me ensinar a lidar com isso. Por ter sido um oásis de excelência que me
ensinou a “ser arrogante o suficiente para acreditar em mim e humilde o suficiente para aprender com
os melhores”. Por ter sido o contra‐peso que equilibrou a balança.
I am easily satisfied with the very best.
Winston Churchill
Ao meu amigo Pedro, por nunca estar satisfeito, por toda a exigência e intransigências, que fizeram não
mais do que me conduzir a ser mais, maior e melhor. Pelas infindáveis conversas e discussões, por vezes
VIII
acesas, acerca de política, bola ou temas menos elevados. Por ter sido o peso que desiquilibrou a
balança.
À Fundação para a Ciência e Tecnologia, pelo apoio financeiro (SFRH/BD/24276/2005) que permitiu a
condução dos trabalhos realizados e o patrocínio à participação em conferencias nacionais e
internacionais.
Ao Departamento de Quimica e ao Departamento de Ciências da Vida, Faculdade de Ciencias e
Tecnologia, Universidade Nova de Lisboa e aos seus membros pelo apoio e por disponibilizar as
condições necessárias à execução dos trabalhos realizados. Em particular ao Zé Luis, Ricardo Franco,
Jorge Caldeira, João Paulo Noronha, Filipe Folgosa, Luz, Rosario, Vitor, Idalina e Conceição, César,
Maggie, Ana Paula, Sofia, João, Dora, Renato, Marco e Carla.
Ao Grupo de Fotoquímica e Quimica Supramolecular, por ter sido a minha escola de Química, e aos seus
membros que me acompanharam desde o inicio da minha licenciatura, em particular, Carlos Pinheiro,
Leticia, Laura, Carlos Lodeiro, César, Alexandre, Márcia, Avó, Yoan e Raquel. Uma palavra especial ao
Professor Pina por me ter acolhido e por tudo o que me ensinou. À Ana Marta, pela sua profunda
amizade, contagiante boa disposição e atenção que fazia o trabalho valer a pena. À Raquelita, por todos
os cigarros e terapia, pela realidade nua e crua, pela tão querida amizade. Ao Bruno por ter sido o meu
parceiro de cowboiada fora do laboratório, em tantos momentos de trabalho. Uma palavra de
agracedimento em particular ao Professor Jorge Parola, ao meu orientador não oficial, por todo o apoio
durante os vários projectos. Por me ter ensinado as artes obscuras da síntese orgânica. Pela sensatez
durante o delírio colectivo.
Ao Centro de Investigação de Genética Molecular Humana, Pólo 1, por ter sido a minha escola de bio‐
coisas e aos seus membros, em particular, Maria, Ana, Quaresma, Red, Larguinho, Conde, Goku, Tavares,
Inês, Veigas, Rita, Chang, Solange, Madalena e Carina, por todos os momentos imortais que tornaram o
315 a minha segunda casa durante os quatro anos de trabalho experimental. Um grande bem‐haja ao
Revolt e Crossfire por todos os momentos de trabalho árduo que proporcionaram.
Uma palavra em particular ao Gonçalo, meu parceiro de tormentas e calmarias, por toda atenção e
contribuições ao meu trabalho. Pela amizade dentro e fora do laboratório, nas aulas, na gestão do
IX
laboratório e seus colaboradores, pelo apoio incondicional. Uma palavra em particular ao Rosinha, Man,
pelas infindáveis conversas dentro e fora do laboratório e do campo de futebol. À Marta por todos os
vidros partidos, pelos cigarros e msn, pela amizade que 7500 km não mudaram.
Às meninas da Conservação e Restauro, minhas colegas e amigas, por todos os momentos de diversão e
por me terem concedido guarida durante tempos de escrita. Em particular à Joana, Ana, Catarina,
Micaela e Ana.
Ao João Pina e ao Professor Sergio Seixas de Melo, Faculdade de Ciências e Tecnologia, Universidade de
Coimbra, por toda a ajuda e medição dos tempos de vida.
Ao Zé Inácio e à Professora Isabel Sá Nogueira, Instituto de Tecnologia Química e Biológica, Universidade
Nova de Lisboa, pelo auxílio nas experiencias de transcrição in vitro usando nucleótidos marcados com
radioactividade.
To Professor Milan Stojanovic, Columbia University, for the amazing opportunity to join the spider
project and his valuable contributions regarding work and much more. To Professor Hao Yan, Biodesign
Institute, for the opportunity to join his lab, learn DNA structural nanotechnology and for allowing me to
continue the spider project while writing my thesis. To my Biodesign colleagues, in particular to Ashok
and Chad, for their friendship that went beyond work. A special thank to Jeanette for the long AFM
hours, helpful scientific discussions, mutual therapy and her precious friendship.
To my American friends, Lauren, Ashley, Twig, Doug, Kelly, Kylie, Derrick, Brian, Zach, Katie, Lellee,
Amanda, Johna, Jennifer and Tiffany. A special thank to Caity for being my friend and family in a strange
land, so far away from home. For taking care of me and opening the doors to her life. “It isn’t a big thing.
It’s the million little things”.
A todos os meus amigos, em particular, Nucha, Quico, Cardoso, Tiago, Joana, Mario, Sara, Artur, Pedro,
Tiago, Nuno, Pierre, Rato, Pitcher, Ruben e Rita, por terem contribuído de forma decisiva para que esta
etapa tenha sido fantástica. Uma palavra especial para a Mariana pela companhia e gostos em comum
que poucos partilham. À Joaninha, pela extraordinária amizade a sensatez, que me iluminou incontáveis
vezes o caminho. À Ana Diniz, pelo apoio incondicional e força que me deu durante uma parte

X
considerável do doutoramento. Ao Gonçalo, o meu primo acima de todos os outros, pela ajuda mutua
nos tempos difíceis e comemoração nas victórias, pelo respeito e conselho que sempre procuro para
decisões dificeis. Ao Terrinha von Dudster, por todos os tempos que passamos juntos, a fazer tudo ou
nada, pelas nades, balázios, giros sem destio, torranço na praia e raquetada, por estar sempre presente
em todos os momentos. Ao Caldas, e à sua família, pela amizade e carinho que nutriram desde o inicio
da minha vida.
À minha família, em particular à Tia Xanda e o meu Padrinho, às minhas irmãs, cunhado e sobrinhos, e
em especial aos meus pais, pelo apoio incondicional, por terem sempre acreditado em mim, por me
terem guiado, por tudo o que sou e serei. Sem eles nada disto teria sido possível.
My deepest appreciation for the help and contribution to this journey that is now getting to its end.
Thank you!
Andre

XI

XII
XIII
SUMÁRIO
O principal objectivo da tese aqui apresentada foi a criação e desenvolvimento de um sistema para a
síntese enzimática de ácidos nucleicos controlados por luz. A ideia baseia‐se na funcionalização de
nucleótidos com grupos protectores fotolábeis (ou nucleótidos engaiolados), que não são reconhecidos
como substratos pelas polimerases. Através da absorção de luz, o grupo protector fotolábil é removido e
o nucleótido liberto, sendo de seguida incorporado na cadeia de ácido nucleico a ser sintetizada. A
libertação específica do nucleótido desejado, de entre uma mistura de nucleótidos, é conseguida através
da funcionalização de cada tipo de nucleótido com um grupo protector diferente, apresentando um
espectro de absorção distincto. Utilizando radiação monocromática o nucleótido é liberto
inequivocamente, levando à sua incorporação. A sequência de irradiação definiria, em ultima análise, a
sequência da cadeia a ser sintetizada. De modo a ultrapassar a dependência de uma cadeia molde na
síntese de ADN (ou ARN), foi utilizada uma polimerase de ADN que não necessita de cadeia molde –
Terminal deoxinucleotidil Transferase.
Derivados da 4‐metilcumarina foram escolhidos como grupos protectores fotolábeis e a síntese de
nucleótidos engaiolados foi alcançada com sucesso. A caraterização fotofísica e fotoquímica da
[7‐dietilcumarina‐4‐il]metil fosfato (DEACM‐P) foi efectuada. Foi observada uma dependência entre o pH
e a fotoquímica de libertação da DEACM‐P, e um novo modelo para a fotoquímica dos derivados da
4‐metilcumarina foi proposto. Este modelo tem em conta a concentração do ião hidóxilo na formação do
fotoproduto 4‐hidroximetilcumarina. A caracterização fotofísica e fotoquímica da P3‐[7‐dietilcumarina‐4‐
il]metil adenosina trifosfato (DEACM‐ATP), P3‐[7‐dietilcumarina‐4‐il]metil guanosina trifosfato (DEACM‐
GTP), P3‐[7‐metoxycumarina‐4‐il]metil adenosina trifosfato (MCM‐ATP) e P3‐[7‐metoxycumarina‐4‐
il]metil guanosina trifosfato (MCM‐GTP) foi efectuada. Os grupos DEACM e MCM apresentam espectros
de absorção em regiões distintas (λmax = 390 nm e 325 nm, respectivamente), permitindo a irradiação e
libertação selectiva desejada.
XIV
Nucleótidos engaiolados foram utilizados em reacções de trancrição in vitro. Níveis residuais de
transcrição foram observados quando utilizados nucleótidos derivados com um grupo cumarínico. Após
irradiação foram obtidos produtos de transcrição completos e específicos, demonstrando que a luz pode
ser utilizada para a activação da síntese de ácidos nucleicos. Ambos os derivados de DEACM e MCM
foram usados como grupos protectores, apresentando um comportamento semelhante. Derivados de
ATP e GTP foram usados com sucesso como actuadores na síntese de ARN activada por luz, embora não
foi possível obter transcritos quando DEACM‐GTP foi utilizado. A incorporação de nucleótidos numa
cadeia de ácido nucleic em síntese activada por luz foi conseguida com sucesso utilizando a T7 RNA
Polimerase e a Terminal deoxinucleotidil Transferase. Foi observado um efeito inibitório devido à
presença do produto de fotólise 7‐dietilamino‐4‐hidroximetilcumarina (DEACM‐OH) sob a T7 RNA
Polimerase. No entanto, o efeito inibitório pôde ser parcialmente suprimido através da adição de
β‐ciclodextrina à reacção de transcrição in vitro.
XV
ABSTRACT
The main objective of this thesis was the design and development of a system for the enzymatical
synthesis of nucleic acids controlled by light. The overall concept is based on the functionalization of
nucleotides with photoremovable protecting groups (or caged‐nucleotides), that cannot be recognized
as substrates by the polymerases. Upon light absorption, the photo‐protecting group is cleaved and the
nucleotide released, thus being incorporated in a growing nucleic acid chain. The specific release of the
desired nucleotide, from a nucleotide mixture, is achieved functionalizing each type of nucleotide with a
different caging group, presenting a distinct absorption spectrum. Through irradiation with
monochromatic light, the specific nucleotide can be released unambiguously, leading to its
incorporation. The irradiation sequence would, ultimately, define the sequence of the strand being
formed. In order to overcome the template‐directed DNA (or RNA) synthesis, a template‐independent
DNA polymerase was used – Terminal deoxynucleotidyl Transferase.
Derivatives of 4‐methylcoumarin were chosen as photoremovable protecting groups and the successful
synthesis of caged‐nucleotides was achieved. The photophysical and photochemical characterization of
[7‐diethylaminocoumarin‐4‐yl]methyl phosphate (DEACM‐P) was performed. A dependence of the
DEACM‐P photochemistry on pH was found, and a new model for 4‐methylcoumarin derivatives
photochemistry was proposed. This model accounts for the hydroxyl concentration in the
4‐hydroxymethylcoumarin photoproduct formation. The photophysics and photochemistry
characterization of P3‐[7‐diethylaminocoumarin‐4‐yl]methyl adenosine triphosphate (DEACM‐ATP), P3‐
[7‐diethylaminocoumarin‐4‐yl]methyl guanosine triphosphate (DEACM‐GTP), P3‐[7‐methoxycoumarin‐4‐
yl]methyl adenosine triphosphate (MCM‐ATP) and P3‐[7‐methoxycoumarin‐4‐yl]methyl guanosine
triphosphate (MCM‐ATP) was performed. The DEACM and MCM groups present absorption spectra in
different regions (λmax = 390 nm and 325 nm, respectively), allowing for the desired selective irradiation
and cleavage.

XVI
Caged‐nucleotides were applied to in vitro transcription reactions. When the nucleotide was
functionalized with a coumarin derivative, only residual RNA product formation could be detected. After
irradiation, full size specific transcription product was obtained, showing that light can be used to
activate the synthesis of nucleic acids. Both DEACM and MCM derivatives were used as caging groups,
presenting similar behavior. Both ATP and GTP were successfully used as actuators for the light‐
controlled synthesis of RNA, although no transcription was attained when DEACM‐GTP was used. The
light‐activated incorporation of nucleotides in a growing nucleic acid strand was successfully performed
using the T7 RNA Polymerase and the Terminal deoxynucleotidyl Transferase. It was found that the
7‐diethyl‐4‐hydroxymethylcoumarin (DEACM‐OH) photoproduct presented an inhibitory effect over the
T7 RNA Polymerase, but that the inhibition could be partially suppressed through the addition of
β‐cyclodextrin to the reaction.
XVII
SYMBOLS AND NOTATIONS
3’‐OH – 3’‐hydroxyl
f – Mataga solvent polarity
ε ‐ molar extinction coefficient (in M‐1cm‐1)
μ ‐ dipole moment
ν ‐ frequency
Φf – fluorescence quantum yield
Φchem – photochemical quantum yield
τ ‐ lifetime
A – absorbance
Abs ‐ absorption
ADP – adenosine diphosphate
AMP – adenosine monophosphate
AMPA ‐ α‐amino‐3‐hydroxy‐5‐methyl‐4‐isoxazolepropionic acid
anti‐hh – anti‐head‐to‐head
anti‐ht – anti‐head‐to‐tail
ATP – adenosine triphosphate
BAPTA ‐ 1,2‐bis(o‐aminophenoxy)ethane‐N,N,N’N’‐tetraacetic acid
Bhc – 6‐bromo‐7‐hydroxycoumarin
BSA – bovine serum albumin
cAMP – cyclic adenosine monophosphate
cGMP – cyclic guanosine monophosphate
CM – coumarin
CNS – central nervous system
CTP – cytidine triphosphate
dATP – deoxyadenosine triphosphate
dCTP – deoxycytidine triphosphate
DEACM – 7‐diethylamino‐4‐methylcoumarin
DEACM‐ATP – P3‐[7‐diethylaminocoumarin‐4‐yl]methyl adenosine 5’‐triphosphate
DEACM‐GTP ‐ P3‐[7‐diethylaminocoumarin‐4‐yl]methyl guanosine 5’‐triphosphate
DEACM‐OH – 7‐diethylamino‐4‐hydroxymethylcoumarin
DEACM‐P – [7‐diethylaminocoumarin‐4‐yl]methyl phosphate
dGTP – deoxyguanosine triphosphate
DMB ‐ 3’,5’‐dimethoxybenzoin group
DMNB – dimethoxy‐2‐nitrobenzyl group
DMNPE ‐ 1‐(4, 5‐dimethoxy‐2‐nitrophenyl)ethyl group
DNA – deoxyribonucleic acid
dNTP – deoxyribonucleotide
DTT – dithiothreitol
dTTP – deoxythymidine triphosphate
E. coli – Escherichia coli
EDTA – ethylenediamine tetraacetic acid
EGTA – ethylene glicol tetraacetic acid
FISH – fluorescence in situ hybridization
XVIII
GTP – guanosine triphosphate
GFP – green fluorescent protein
HEPES ‐ 4‐(2‐hydroxyethyl)‐1‐piperazineethanesulfonic acid
HMPA – hexamethylphosphoramide
HOMO – highest occupied molecular orbital
HPLC – high performance liquid chromatography
Ka – association constant
kchem – photochemical rate constant
kIC – internal conversion rate constant
kISC – intersystem crossing rate constant
kf – fluorescence rate constant
knr – non‐radiative rate constant
LUMO – lowest unoccupied molecular orbital
MCM – 7‐methoxy‐4‐methylcoumarin
MCM‐ATP – P3‐[7‐methoxy‐4‐hydroxymethyl‐4‐yl]methyl adenosine 5’‐triphosphate
MCM‐GTP – P3‐[7‐methoxy‐4‐hydroxymethyl‐4‐yl]methyl guanosine 5’‐triphosphate
MCM‐OH – 7‐methoxy‐4‐hydroxymethylcoumarin
MCM‐P – [7‐methoxy‐4‐hydroxymethyl‐4‐yl]methyl phosphate
mRNA – messenger ribonucleic acid
NB – nitrobenzyl group
ncPNA – negatively charged peptide nucleic acid
NMDA – N‐methyl‐d‐aspartate
NMR – nuclear magnetic resonance
NPE – nitrophenylethyl group
NSF – N‐ethylmaleimide sensitive factor
NTP (or rNTP) – ribonucleotide
OD – optical density
qPCR – quantitative polymerase chain reaction
PAGE – polyacrylamide gel electrophoresis
PCR – polymerase chain reaction
pHP ‐ p‐hydroxyphenacyl group
PL – photocleavable linker
RISC – RNA induced silencing complex
RNA – ribonucleic acid
rRNA – ribosomal ribonucleic acid
RT‐PCR – reverse transcription polymerase chain reaction
SDS – sodium dodecyl sulphate
siRNA – small interference ribonucleic acid
Sn – singlet excited state n
syn‐hh – syn‐head‐to‐head
syn‐ht – syn‐heat‐to‐tail
TAE – tris acetate EDTA
TBE – tris borate EDTA
TdT – terminal deoxynucleotidyl transferase
THF – tetrahydrofuran
TICT – twisted intramolecular charge transfer
TLC – thin layer chromatography
XIX
Tn – triplet excited state n
Tris – tris(hydroxymethyl)aminomethane
tRNA – tranfer ribonucleic acid
TTP – thymidine triphosphate
UTP – uridine triphosphate
UV – ultra‐violet

XX

XXI
TABLE OF CONTENTS
ACKNOWLEDGEMENTS ............................................................................................................. VII
SUMÁRIO ................................................................................................................................. XIII
ABSTRACT ................................................................................................................................ XV
SYMBOLS AND NOTATIONS .................................................................................................... XVII
TABLE OF CONTENTS ............................................................................................................... XXI
FIGURE INDEX ......................................................................................................................... XXV
TABLE INDEX ......................................................................................................................... XXIX
CHAPTER 1. General Introduction ................................................................................................ 1
1.1. Light to Synthesize Nucleic Acids ........................................................................................................3
1.2. Nucleic Acids Synthesis .......................................................................................................................3
1.2.1. Nucleic Acids Structure ................................................................................................................3
1.2.2. Synthesis of Nucleic Acids in vivo .................................................................................................7
1.2.3. Nucleic Acids Polymerases ...........................................................................................................9
1.2.4. In vitro synthesis of Nucleic Acids ............................................................................................. 18
1.2.5. Light Control of RNA Synthesis ‐ What component should be controlled? .............................. 21
1.3. Caged Molecules .............................................................................................................................. 22
1.3.1. Caged Compounds .................................................................................................................... 22
1.3.2. Caged Compounds in Bio‐Applications ..................................................................................... 23
1.3.3. Photolabile Protecting Groups .................................................................................................. 30
1.4. Photophysics and Photochemistry of Coumarins ............................................................................ 35
1.4.1. Introduction to Photochemistry ................................................................................................ 35
1.4.2. Coumarin Ground‐State and Photophysical Properties ............................................................ 45
1.4.3. Coumarin Photochemical Properties ........................................................................................ 52
1.5. Light‐controlled Nucleic Acids Typewriter – an Overview ............................................................... 59
CHAPTER 2. Materials and Methods .......................................................................................... 63
2.1. General Information ......................................................................................................................... 64
2.2. Synthesis of Coumarin Derivatives ................................................................................................... 64
2.2.1. Synthesis of 7‐diethylamino‐4‐methylhydroxycoumarin (DEACM‐OH) .................................... 64
2.2.2. Synthesis of [7‐diethylaminocoumarin‐4‐yl]methyl di‐tert‐butyl phosphate (DEACM‐tBut) ... 65
XXII
2.2.3. Synthesis of [7‐diethylaminocoumarin‐4‐yl]methyl phosphate (DEACM‐P) ............................. 66
2.2.4. Synthesis of P3‐[7‐diethylaminocoumarin‐4‐yl]methyl adenosine 5’‐triphosphate
(DEACM‐ATP) ....................................................................................................................................... 66
2.2.5. Synthesis of 7‐methoxy‐4‐methylhydroxycoumarin (MCM‐OH) .............................................. 67
2.2.6. Synthesis of [7‐methoxycoumarin‐4‐yl]methyl di‐tert‐butyl phosphate (MCM‐tBut) .............. 68
2.2.7. Synthesis of [7‐methoxycoumarin‐4‐yl]phosphate (MCM‐P) ................................................... 68
2.2.8. Synthesis of P3‐[7‐methoxycoumarin‐4‐yl]methyl adenosine 5’‐triphosphate (MCM‐ATP) and P3‐[7‐methoxycoumarin‐4‐yl]methyl guanine 5’‐triphosphate (MCM‐GTP) ...................................... 69
2.2.9. Synthesis of P3‐[7‐diethylaminocoumarin‐4‐yl]methyl guanine 5’‐triphosphate
(DEACM‐GTP) ....................................................................................................................................... 69
2.3. Photophysical and Photochemical Characterization ........................................................................ 70
2.3.1. Absorption and Emission Titrations .......................................................................................... 70
2.3.2. Fluorescence and Photochemical Quantum Yield Determinations ........................................... 72
2.3.3. Time‐Resolved Fluorescence Spectroscopy Measurements ..................................................... 74
2.3.4. Flash Photolysis Experiments .................................................................................................... 74
2.3.5. DEACM‐ATP Irradiation Profiles ................................................................................................ 75
2.4. Light‐controlled in vitro Synthesis of Nucleic Acids .......................................................................... 75
2.4.1. Transcription Template Cloning and Purification ...................................................................... 75
2.4.2. In vitro Transcription ................................................................................................................. 76
2.4.3. Reverse Transcription (RT) and Real‐Time PCR Reaction .......................................................... 77
2.4.4. Light Activated Polymerization Using Terminal deoxynucleotidyl Transferase ........................ 77
2.5. DEACM‐OH Inhibition Experiments .................................................................................................. 78
2.5.1. DEACM‐OH Inhibition Effect ...................................................................................................... 78
2.5.2. DEACM‐OH Inhibition Suppression: β‐lactoglobulin ................................................................. 79
2.5.3. DEACM‐OH/β‐Cyclodextrin Association Constant Determinations .......................................... 79
2.5.4. DEACM‐OH Inhibition Suppression: β‐cyclodextrin .................................................................. 79
CHAPTER 3. Photophysical and Photochemical Characterization of DEACM Derivatives .......... 81
3.1. Synthesis of P3‐[7‐diethylaminocoumarin‐4‐yl]methyl adenosine 5’‐triphosphate
(DEACM‐ATP) ........................................................................................................................................... 82
3.2. Ground State Properties of DEACM‐OH and DEACM‐P .................................................................... 86
3.3. Dependence of DEACM‐OH and DEACM‐P Photophysics and Photochemistry on pH .................... 89
3.4. Flash Photolysis Studies of DEACM‐H, DEACM‐OH and DEACM‐P ................................................. 101
XXIII
3.5. Characterization of DEACM‐ATP Caged Nucleotide ....................................................................... 108
CHAPTER 4. Light Activated in vitro Transcription Reactions .................................................... 117
4.1. Using Light to Control the Synthesis of RNA .................................................................................. 118
4.1.1. DEACM‐ATP Irradiation Profiles .............................................................................................. 119
4.1.2. Light Activated in vitro Transcription ...................................................................................... 120
4.1.3. Inhibition Effect of DEACM‐OH ............................................................................................... 123
4.2. Suppression of DEACM‐OH Inhibition in Light‐controlled in vitro Transcription Reactions .......... 126
4.2.1. β‐Lactoglobulin ........................................................................................................................ 127
4.2.2. Cyclodextrins ........................................................................................................................... 129
4.3. Light Activated Polymerization Using Terminal deoxynucleotidyl Transferase ............................. 136
CHAPTER 5. Light Controlled Synthesis of Nucleic Acids Using Multi‐Wavelength Excitation .... 143
5.1. Synthesis of 7‐methoxy‐4‐methylcoumarin Derivatives ................................................................ 144
5.2. Photochemical Characterization of DEACM‐GTP, MCM‐ATP and MCM‐GTP ................................ 150
5.3. Light‐activated in vitro Transcription Reactions Using DEACM‐ and MCM‐Caged Nucleotides .... 153
5.4. Light‐Input, RNA‐Output Logic Gates ............................................................................................. 155
CHAPTER 6. Conclusions and Future Perspectives .................................................................... 161
REFERENCES ............................................................................................................................ 169

XXIV
XXV
FIGURE INDEX
Figure 1.1 – Chemical structure of nucleotides ..............................................................................................4
Figure 1.2 – Natural occurring nitrogen bases in DNA and RNA ....................................................................5
Figure 1.3 – The DNA double helix .................................................................................................................7
Figure 1.4 – Central dogma in genetics ..........................................................................................................8
Figure 1.5 – Schematic representation of the polymerization of a DNA strand .......................................... 10
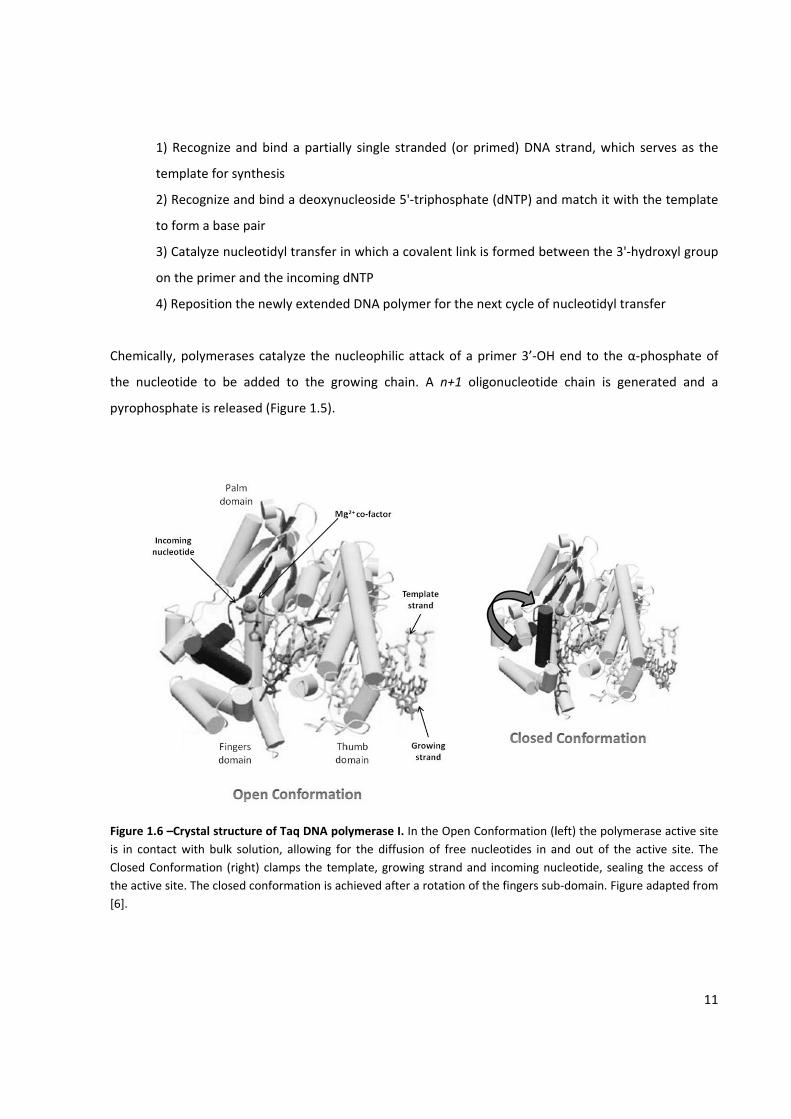
Figure 1.6 –Crystal structure of Taq DNA polymerase I .............................................................................. 11
Figure 1.7 – Crystal structure of the RNA Polymerase/DNA template complex .......................................... 14
Figure 1.8 – Schematization of the transcription bubble complex in RNA Polymerase .............................. 15
Figure 1.9 – Proposed structure of the Terminal deoxynucleotidyl Transferase ......................................... 17
Figure 1.10 – Polymerase Chain Reaction ................................................................................................... 19
Figure 1.11 – The first photo‐activated biomolecule to be called “caged”: Caged‐ATP with a nitrobenzyl
group ........................................................................................................................................................... 23
Figure 1.12 – Photocleavage mechanism of nitrophenil protecting group. ................................................ 31
Figure 1.13 – Photocleavage mechanism of benzoin protecting group ...................................................... 32
Figure 1.14 – Photocleavage mechanism of p‐hydroxyphenancil protecting group ................................... 33
Figure 1.15 – Franck‐Condon principle and vertical transitions .................................................................. 38
Figure 1.16 – The Jablonski diagram ........................................................................................................... 39
Figure 1.17 – The solvatochromic effect ..................................................................................................... 41
Figure 1.18 – Photophysical and photochemical processes ........................................................................ 44
Figure 1.19 – Coumarin moiety and some common derivatives ................................................................. 45
Figure 1.20 – Absorption and emission spectra of the coumarin derivatives shown in Figure 1.19 ........... 46
Figure 1.21 – Absorption and emission spectra of ClMMC ......................................................................... 48
Figure 1.22 – Photophysical deactivating processes in 7‐aminocoumarin derivatives ............................... 51
Figure 1.23 – Effect of the solvent polarity on the non‐radiative rate constant (knr) of DEACM ................ 52
Figure 1.24 – Structures of coumarin dimers .............................................................................................. 53
Figure 1.25 – Mechanism of (coumarin‐4‐yl)methyl photochemistry proposed by Schade and
co‐workers ................................................................................................................................................... 56
Figure 3.1 – Synthesis of 7‐diethylamino‐4‐hydroxymethylcoumarin (DEACM‐OH) ................................... 83
Figure 3.2 – Synthesis of [7‐diethylaminocoumarin‐4‐yl]methyl di‐tert‐butyl phosphate (DEACM‐tBut) .. 84
Figure 3.3 – Synthesis of [7‐diethylaminocoumarin‐4‐yl]phosphate (DEACM‐P) ........................................ 84
XXVI
Figure 3.4 – Activation of ADP precursor ..................................................................................................... 85
Figure 3.5 – Synthesis of P3‐[7‐diethylaminocoumarin‐4‐yl]methyl adenosine triphosphates
(DEACM‐ATP) ............................................................................................................................................... 86
Figure 3.6 – A) DEACM‐OH and DEACM‐P structure ................................................................................... 87
Figure 3.7 – Spectrophotometric titration of DEACM‐OH and DEACM‐P .................................................... 88
Figure 3.8 – Fluorimetric titration of DEACM‐OH and DEACM‐P ................................................................ 89
Figure 3.9 – DEACM‐OH and DEACM‐P acid‐base equilibria ..................................................................... 90
Figure 3.10 – Photochemical and fluorescence quantum yields of DEACM‐P as function of pH ................. 91
Figure 3.11 – Time resolved fluorescence measurements of DEACM‐OH and DEACM‐P as
function of pH .............................................................................................................................................. 92
Figure 3.12 – Overall deactivating rate constant of DEACM‐HPO4– species as function of hydroxyl anion
concentration. ............................................................................................................................................. 95
Figure 3.13 – Kinetic model for the photochemistry of DEACM‐P involving a pH dependent equilibrium
affecting 1[CP] .............................................................................................................................................. 95
Figure 3.14 ‐ Overall deactivating rate constant of DEACM‐HPO4– based on the kinetic model presented in
Figure 3.13. .................................................................................................................................................. 97
Figure 3.15 – Kinetic model for the photochemistry of DEACM‐P involving buffer quenching of 1[CP] ...... 97
Figure 3.16 ‐ Overall deactivating rate constant of DEACM‐HPO4– based on the kinetic model presented in
Figure 3.15 ................................................................................................................................................... 98
Figure 3.17 ‐ Kinetic model for the photochemistry of DEACM‐P involving a nucleophilic attack to an
intermediary formed from 1[CP] state. ........................................................................................................ 99
Figure 3.18 – Flash Photolysis transient spectroscopy of DEACM‐P .......................................................... 101
Figure 3.19 – Effect of the pH on the DEACM‐P transient intermediary species ....................................... 102
Figure 3.20 – Transient spectra of Coumarin 1 and DEACM‐OH ............................................................... 103
Figure 3.21 – Effect of oxygen on the transient spectra of Coumarin 1, DEACM‐OH and DEACM‐P ........ 106
Figure 3.22 – Transient absorption spectra of 6,7‐dimethoxycoumarin ................................................... 107
Figure 3.23 – Absorption and emission spectra of DEACM‐OH, DEACM‐P and DEACM‐ATP solutions ..... 108
Figure 3.24 – DEACM‐ATP spectrophotometic titration in 10 mM Tris‐phosphate buffer ........................ 109
Figure 3.25 – Acid‐base equilibria of adenosine triphosphate .................................................................. 110
Figure 3.26 – DEACM‐ATP fluorimetric titration in 10 mM Tris‐phosphate buffer ................................... 111
Figure 3.27 – Photochemical quantum yield of DEACM‐ATP disappearance and DEACM‐OH production as
function of pH ............................................................................................................................................ 114

XXVII
Figure 3.28 – Photochemical quantum yields of DEACM‐ATP disappearance, and DEACM‐OH and
ATP appearance ........................................................................................................................................ 115
Figure 4.1 – Photolysis of DEACM‐ATP and ATP release ........................................................................... 118
Figure 4.2 – Irradiation profiles of four different concentrations of DEACM‐ATP in water, pH 7.0 .......... 120
Figure 4.3 – In vitro transcription using DEACM‐ATP ................................................................................ 121
Figure 4.4 – Relative quantification of full‐length transcription products as function of ATP released after
DEACM‐ATP irradiation ............................................................................................................................. 122
Figure 4.5 – Effect of DEACM‐OH in transcription reactions ..................................................................... 123
Figure 4.6 – Effect of DEACM‐OH presence in transcription reactions...................................................... 124
Figure 4.7 – Molecular structure of Clorobiocin, Novobiocin and Coumermycin A1 ................................. 125
Figure 4.8 – Crystal structure of β‐lactoglobulin complexed with a cholesterol molecule ....................... 128
Figure 4.9 ‐ Effect of the presence of β‐lactoglobulin in transcription reactions ...................................... 129
Figure 4.10 – DEACM derivatives involved in a light controlled in vitro transcription reaction (DEACM‐OH
and DEACM‐ATP) and β‐cyclodextrin ........................................................................................................ 130
Figure 4.11 – Effect of the presence of β‐cyclodextrin in transcription reactions ..................................... 131
Figure 4.12 – Formation of DEACM‐OH/β‐cyclodextrin complex .............................................................. 132
Figure 4.13 – DEACM‐OH fluorescence emission intensity at 570 nm as function of β‐cyclodextrin
concentration ............................................................................................................................................ 133
Figure 4.14 – β‐Cyclodextrin and reduction of inhibition .......................................................................... 135
Figure 4.15 – Incorporation of deoxyribonucleotides to a 20‐mer oligonucleotide by the Terminal
deoxynucleotidyl Transferase .................................................................................................................... 138
Figure 4.16 – Incorporation of ribonucleotides to a 20‐mer oligonucleotide by the Terminal
deoxynucleotidyl Transferase .................................................................................................................... 140
Figure 4.17 – Effect of the presence of DEACM‐OH in a template independent TdT‐catalyzed ATP addition
to a single stranded 20‐mer oligonucleotide ............................................................................................. 141
Figure 4.18 – Light activated template independent TdT‐catalyzed ATP addition to a single stranded 20‐
mer oligonucleotide ................................................................................................................................... 142
Figure 5.1 – Structure of coumarins with strong electro‐donating groups in the 7‐ position and/or electro‐
withdrawing groups in the 3‐ position ...................................................................................................... 145
Figure 5.2 – Synthesis of the (7‐methoxycoumarin‐4‐yl)methyl acetate .................................................. 146
Figure 5.3 – Synthesis of the 7‐methoxy‐4‐hydroxymethylcoumarin (MCM‐OH) ..................................... 147
Figure 5.4 – Synthesis of MCM‐tBut .......................................................................................................... 147
XXVIII
Figure 5.5 – Synthesis of (7‐methoxycoumarin‐4‐yl)methyl phosphate (MCM‐P) .................................... 148
Figure 5.6 – Synthesis of MCM‐ATP and MCM‐GTP .................................................................................. 149
Figure 5.7 – Synthesis of DEACM‐GTP ....................................................................................................... 149
Figure 5.8 – Absorption and emission spectra of DEACM‐ATP and DEACM‐GTP ...................................... 150
Figure 5.9 – Absorption and emission spectra of MCM‐ATP and MCM‐GTP ............................................ 151
Figure 5.10 – Selective excitation and photochemistry of DEACM and MCM caging groups ................... 152
Figure 5.11 – Light‐activated in vitro transcription reaction using DEACM‐ATP, DEACM‐GTP, MCM‐ATP
or MCM‐GTP ............................................................................................................................................. 154
Figure 5.12 – Truth tables for AND, OR and NOT logic gates .................................................................... 157
Figure 5.13 – Design of a light‐input/RNA‐output OR logic gate .............................................................. 157
Figure 5.14 ‐ Design of a light‐input/RNA‐output AND logic gate ............................................................ 158
Figure 5.15 – Design of a light‐input/RNA‐output NOT logic gate ............................................................ 159
XXIX
TABLE INDEX
Table 1.1 – Photophysics of common coumarins as function of solvent polarity ....................................... 47
Table 1.2 – Photophysics of ClMMC as function of solvent polarity ........................................................... 49
Table 1.3 – Effect of acid moiety in the photophysical and photochemical properties of
7‐methoxy‐4‐methylcoumarin ester derivatives ......................................................................................... 57
Table 1.4 – Photophysical and photochemical properties of cyclic adenosine monophosphates esters of
differently substituted (coumarin‐4‐yl)methyl alcohols .............................................................................. 58
Table 2.1 – Intensity of irradiation setup used for determination of photochemical quantum yields and
nucleotide release as function of the excitation wavelength and slit width ............................................... 72
Table 3.1 – Photophysical and photochemical properties of DEACM‐OH and DEACM‐P ........................... 93
Table 3.2 – Decay times of DEACM‐ATP as function of pH ....................................................................... 112

XXX

1
CHAPTER 1. General Introduction

2
3
1.1. Light to Synthesize Nucleic Acids
In 2004, my supervisors and I discussed for the first time a system in which light would be used to control
the enzymatic synthesis of nucleic acids. The idea was born under the context of supramolecular
chemistry, the field of chemistry that makes use of the known properties of molecules to produce a
desired molecular event. We were aware that the process of in vitro DNA and RNA polymerization
depends on a DNA template that determines the sequence of the forming strands, and that customized
DNA synthesis is, thus far, only possible via chemical synthesis. A system that could put together the
efficiency and simplicity of enzymatic polymerization of nucleic acids and a means to control the
sequence would be of great relevance to molecular biology and supramolecular chemistry. Based on our
photochemistry expertise, we immediately thought of using light to achieve this control. Light as a
“reagent” would present several advantages, namely to eliminate the addition of mass to the system in
each cycle avoiding, theoretically, the necessity of purification steps.
The first step was to perform a careful analysis of natural and in vitro polymerization processes of nucleic
acids to identify its key elements, evaluate the parameters upon which we would need to actuate in
order to obtain sequence control. Also, the essential and common components of RNA and DNA
synthesis should be analyzed to assess the possibility of extending this system to custom RNA synthesis.
1.2. Nucleic Acids Synthesis
1.2.1. Nucleic Acids Structure
The genome of all living organisms is constituted by deoxyribonucleic acid (DNA), where the genetic
information is stored. DNA may then be transcribed into ribonucleic acid (RNA) that, if suitable, can then
be translated into protein.[1] Cellular processes of nucleic acids “management” (processing,
DNA/RNA/protein interaction and elimination) are complex, stimulating and of crucial importance to
understand life and Nature. However, they are also beyond the scope of this work.
4
DNA and RNA are chemically very similar ‐ both present a linear primary structure composed of
monomers called nucleosides. All nucleosides present a common structure: a pentose linked to a
nitrogen base at the 1’ position (Figure 1.1). In RNA, the pentose is ribose; in DNA, it is deoxyribose. A
nucleotide is formed when a phosphate group is linked to the 5’ position of the pentose.
Figure 1.1 – Chemical structure of nucleotides. The presence or absence of a –OH group at the 2’ position in a ribose sugar ring distinguishes between ribose (upper right) or 2’‐deoxyribose (down right). When a nitrogen base is attached to the 1’ position in the (deoxy)ribose a nucleoside is formed (left). When a phosphate group is present at the 5’ position of the (deoxy)nucleoside a nucleotide is attained (left). Figure adapted from [2].
The bases adenine, guanine, and cytosine are found in both DNA and RNA; thymine is only found in
DNA, and uracil is only found in RNA. Adenine and guanine are purines, which contain a fused pyrimidine
and imidazole rings; cytosine, thymine, and uracil are pyrimidines, containing a single ring (Figure 1.2).
Nucleotides can have one, two, or three phosphate groups esterified at the 5‐hydroxyl forming
nucleotide monophosphates, diphosphates or triphosphates, respectively. The nucleotide triphosphates
are used in the synthesis of nucleic acids.[2]
5
Figure 1.2 – Natural occurring nitrogen bases in DNA and RNA. The adenine and guanine nitrogen bases are purines, comprising a fused pyrimidine and imidazole rings (up). The cytosine, thymine and uracil are composed by a single pyrimidine ring (down). In gray are represented the nitrogen atom from which the coupling to the (deoxy)ribose sugar is made to form a nucleoside.
The way these nucleotides are organized into the DNA double helix ‐ the secondary structures ‐ was first
described in 1953 by J. Watson and F. Crick.[3] I have to me this description as one of the most important
papers in Life Sciences and, therefore, deserves to be remembered in its original version:
“We wish to put forward a radically different structure for the salt of deoxyribose acid. This
structure has two helical chains each coiled round the same axis. We have made the usual
chemical assumption, namely, that each chain consists of phosphate diester groups joining
β‐D‐deoxyribofuranose residues with 3’,5’ linkages. The two chains (but not their bases) are
related by a dyad perpendicular to the fibre axis. Both chains follow right‐handed helices, but
owing to the dyad the sequences of the atoms in the two chains run in opposite directions. Each
chain loosely resembles Furberg’s model No. 1; that is, the bases are on the inside of the helix and
the phosphates on the outside. The configuration of the sugar and the atoms near it is close to
Furberg’s standard configuration, the sugar being roughly perpendicular to the attached base.
6
There is a residue on each chain every 3.4 Å in the z‐direction. We have assumed an angle of 36°
between adjacent residues in the same chain, so that the structure repeats after 10 residues on
each chain, that is, after 34 Å. The distance of a phosphorus atom from the fibre axis is 10 Å. As
the phosphates are on the outside, cations have easy access to them. (…) The novel feature of the
structure is the manner in which the two chains are held together by the purine and pyrimidines
bases. The planes of the bases are perpendicular to the fibre axis. They are joined together in
pairs, a single base from the other chain being hydrogen‐bonded to a single base from the other
chain, so that the two lie side by side with identical z‐co‐ordinates. One of the pair must be a
purine and the other a pyrimidines for bonding to occur. (…) If it is assumed that the base only
occur in the structure in the most plausible tautomeric forms (that is, with the keto rather than
the enol configurations) it is found that only specific pairs of bases can bond together. These pairs
are: adenine (purine) with thymine (pyrimidines), and guanine (purine) with (pyrimidines). In
other words, if an adenine forms one member of a pair, on either chain, then on these
assumptions the other member must be thymine; similarly for guanine and cytosine. The
sequence of bases on a single chain does not appear to be restricted in any way. (…) It has been
found experimentally that the ratios of the amounts of adenine to thymine, and the ratio of
guanine to cytosine, are always very close to unity for deoxyribose nucleic acid”.
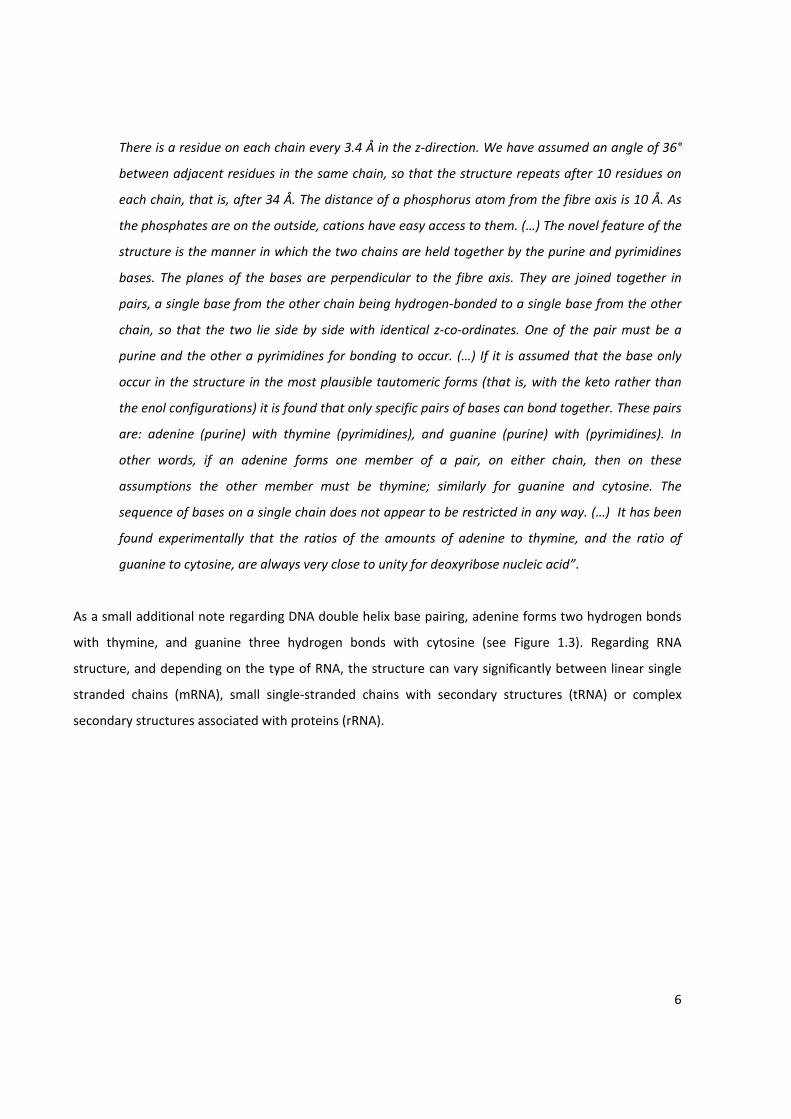
As a small additional note regarding DNA double helix base pairing, adenine forms two hydrogen bonds
with thymine, and guanine three hydrogen bonds with cytosine (see Figure 1.3). Regarding RNA
structure, and depending on the type of RNA, the structure can vary significantly between linear single
stranded chains (mRNA), small single‐stranded chains with secondary structures (tRNA) or complex
secondary structures associated with proteins (rRNA).
Figurepolarinitrog
1.2.2
1.2.2
The c
essen
inform
but
congl
term
begin
Then
e 1.3 – The ization of the gen base pairs
. Synthesis o
.1. Replicati
cellular proc
ntial that its
mation as th
as a gener
lomerate of
ination. Initi
ns, the paren
synthesis o
DNA doubletwo strands ls responsible f
of Nucleic Ac
on
cess through
s genome is
he parental o
ral consider
f enzyme ac
ation involve
ntal strands
of daughter
e helix. A) Sleads to the fofor the forma
cids in vivo
h which DNA
duplicated
one. The rep
ation, replic
ctivities. The
es recognitio
must be sep
strands can
Schematic repormation of ation of the do
A is synthes
so each of
plication pro
cation of d
ere are thre
on of an orig
parated and
be initiated
presentation a major and mouble helix. Fig
sized is calle
the daught
cess is differ
duplex DNA
e stages in
gin by a com
(transiently
d. Elongation
of a DNA dminor groove. gure B adapte
ed replicatio
ter cells can
rent in proka
is a comp
replication:
mplex of prot
) stabilized i
n is underta
double helix. B) Hydrogen ed from [2].
n. For a cel
n contain th
aryotic and e
plex endeav
initiation, e
teins. Before
n the single
ken by anot
The anti‐parbonding betw
ll to divide
e same gen
eukaryotic c
vor involvin
elongation,
e DNA synth
‐stranded st
ther complex
7
rallel ween
it is
netic
ells,
g a
and
hesis
tate.
x of
proteins tha
the end of
taken when
involved, su
stress. Any
chemical co
systems tha
replication a
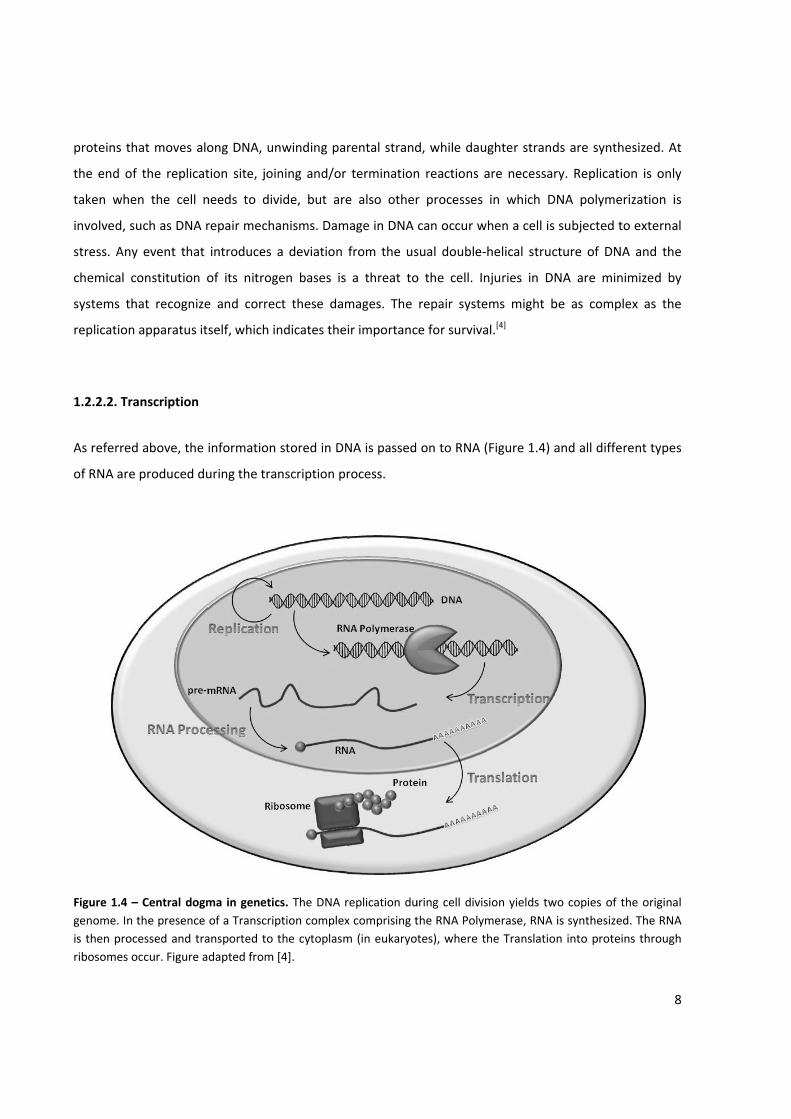
1.2.2.2. Tra
As referred
of RNA are
Figure 1.4 – genome. In tis then proceribosomes oc
at moves alo
the replicat
n the cell n
uch as DNA r
event that
onstitution o
at recognize
apparatus its
nscription
above, the i
produced du
Central dogmthe presence essed and traccur. Figure a
ong DNA, un
tion site, join
needs to div
repair mecha
introduces a
of its nitrog
e and correc
self, which in
information
uring the tra
ma in geneticof a Transcripansported to tdapted from
nwinding par
ning and/or
vide, but are
anisms. Dam
a deviation
en bases is
ct these dam
ndicates the
stored in DN
nscription pr
cs. The DNA rption complexthe cytoplasm[4].
rental strand
termination
e also other
mage in DNA
from the us
a threat to
mages. The
ir importanc
NA is passed
rocess.
replication dux comprising tm (in eukaryo
d, while dau
n reactions a
r processes
can occur w
sual double‐
o the cell. In
repair syste
ce for surviva
on to RNA (
uring cell divisthe RNA Polymtes), where t
ghter strand
are necessar
in which D
hen a cell is
helical struc
njuries in DN
ems might b
al.[4]
(Figure 1.4) a
sion yields twmerase, RNA he Translatio
ds are synthe
ry. Replicatio
NA polymer
subjected to
cture of DNA
NA are mini
be as comple
and all differ
wo copies of tis synthesizedn into protein
8
esized. At
on is only
rization is
o external
A and the
imized by
ex as the
rent types
he original d. The RNA ns through
9
Transcription is also the first stage in gene expression, and the main step at which it is controlled.
Regulatory proteins determine whether a particular gene is available to be transcribed by the RNA
polymerase (enzyme that connects the nucleotides to form a strand). The initial (and often the only) step
in regulation is the decision of whether to transcribe a gene or not. Transcription initiation requires the
binding of several proteins which are called transcription factors.[4,5] The presence of cellular signals to
these protein complexes determine the existence of transcription (as an on/off state), but also its
transcription rate. This modulation of gene expression is crucial for cell function since it regulates which
proteins are being synthesized at what rate, and defines how the cell interacts with external medium. In
prokaryotic cells, which have no nuclei, translation of an mRNA into protein can begin from the 5’ end of
the mRNA even while the 3’ end is still being synthesized. In eukaryotic cells not only is the nucleus
separated from the cytoplasm where translation occurs, but also the primary transcripts of protein‐
coding genes are precursor mRNAs (pre‐mRNAs) that must undergo several modifications to yield a
functional mRNA, termed RNA processing. This mRNA must then be exported to the cytoplasm before it
can be translated into protein.[2]
1.2.3. Nucleic Acids Polymerases
The control of replication and transcription processes in the cell requires many protein complexes with
different functions. Although the proteins present in each process vary from each organism, there is a
type of enzyme that is not only the core of both DNA and RNA synthesis processes, but also present in all
living organisms: the polymerases.
1.2.3.1. DNA Polymerases
DNA polymerases are enzymes that catalyze the synthesis of deoxyribonucleic acid in a template‐
dependent process that results in a faithful copy of the original DNA molecule. Based on their functions,
DNA polymerases can be broadly classified into two groups: replicative DNA polymerases (DNA
replicases), that are responsible primarily for duplicating genomic DNA and repair polymerases, that
primarily fix damaged DNA strands. Replicative DNA polymerases must synthesize extended lengths of
DNA with high speed and accuracy to ensure that each daughter cell receives a true copy of the genome
upon cell division. In general, these DNA replicases are complex assemblies of several proteins that

10
function together for efficient DNA replication. Polymerases dedicated to DNA repair generally have a
simpler architecture and appear designed for DNA synthesis localized to areas of DNA damage.[6]
Figure 1.5 – Schematic representation of the polymerization of a DNA strand. A) The polymerization requires the presence of a template (long chain) and a primer (short chain) with a free 3’‐OH group. B) In the presence of a free nucleotide that forms a Watson‐Crick base pair with the template’s nucleotide, the addition catalysis might occur. C) Upon catalysis, the formation of a phosphodiester bond between the n nucleotide and the n+1 incoming nucleotide occurs, leading to the release of a pyrophosphate.
Polymerases are unusual enzyme catalysts since DNA is not only a substrate (template) but also the
product. In order to make a copy of DNA, these enzymes are designed to:
Chem
the n
pyrop
Figureis in cClosedthe ac[6].
1) Recogn
template
2) Recogn
to form a
3) Catalyz
on the pr
4) Reposi
mically, polym
nucleotide t
phosphate is
e 1.6 –Crystalcontact with d Conformatictive site. The
nize and bin
for synthesi
nize and bind
base pair
ze nucleotidy
rimer and the
tion the new
merases cata
o be added
s released (Fi
l structure of bulk solutionon (right) clae closed confo
nd a partially
is
d a deoxynu
yl transfer in
e incoming d
wly extended
alyze the nu
d to the gro
igure 1.5).
Taq DNA poln, allowing fomps the temormation is ach
y single stra
cleoside 5'‐t
n which a cov
dNTP
d DNA polym
ucleophilic at
owing chain.
ymerase I. Inr the diffusioplate, growinhieved after a
nded (or pri
triphosphate
valent link is
mer for the ne
ttack of a pr
. A n+1 olig
the Open Con of free nucng strand and a rotation of t
imed) DNA s
e (dNTP) and
s formed bet
ext cycle of n
rimer 3’‐OH
gonucleotide
onformation (lcleotides in aincoming nuhe fingers sub
strand, whic
d match it wi
tween the 3'
nucleotidyl tr
end to the
e chain is ge
left) the polymnd out of thecleotide, sealb‐domain. Fig
ch serves as
th the temp
‐hydroxyl gr
ransfer
α‐phosphate
enerated an
merase activee active site. ling the accesure adapted f
11
the
plate
roup
e of
nd a
e site The ss of from
12
From a structural point of view, the shape of the polymerase is by far the most prominent feature
common to all the polymerase structures determined to date. As described first for the Klenow fragment
from E. coli DNA Pol I, the polymerase resembles a half‐open right hand with the "palm" sub‐domain
forming a cleft that is flanked by the "fingers" and "thumb" sub‐domains.[6] Together, the three sub‐
domains hold the primer‐template DNA and position the incoming dNTP for incorporation into DNA. The
palm sub‐domain contains the catalytic site where nucleotidyl transfer takes place. The fingers sub‐
domain interacts with and positions the template DNA strand and the incoming dNTP. The thumb sub‐
domain primarily binds the duplex DNA in a sequence‐independent manner along the minor groove
(Figure 1.6).[6,7]
The active site contains several acidic and polar amino acid residues as well as two metal cations (usually
Mg2+) that are essential for catalysis. In particular, two aspartate residues are absolutely conserved
between the polymerase families, and these provide the carboxylate oxygens that coordinate the metal
ions. Ion A is located near the 3'‐ hydroxyl group of the DNA primer and the α‐phosphate of the incoming
dNTP. In this location, ion A is ideally positioned to lower the pKa of the hydroxyl group and facilitate the
formation of a hydroxide anion, which can initiate nucleophilic attack on the α‐phosphate of incoming
dNTP. Metal ion B co‐ordinates oxygen in all three phosphate groups of the dNTP, likely helping align the
triphosphate moiety for attack by the 3'‐hydroxyl, as well as stabilizing the charge on the transition state.
Other polar residues in the active site, and possibly ion B, help stabilize the charged pyrophosphate
group as it dissociates from the polymerase after nucleotidyl transfer is complete.[7‐9]
The ability of a DNA polymerase to faithfully complement a DNA template depends on how well it selects
for correct pairing between the template and the incoming nucleotide. The dNTP‐binding site is located
in a narrow junction between the fingers and thumb domains. The 3’‐end of the primer lies right next to
the dNTP‐binding site, and together with residues from the fingers domain forms a highly constrained
binding pocket for the new base pair .[8,10‐12] DNA polymerases can select for correct Watson‐Crick base
pairs and reject distorted mismatched base pairs when the incoming dNTP initially fits into the binding
pocket. The dissociation constant for interaction between polymerase and the correct nucleotide is 20
μM versus 4 to 8 mM for nucleotides that do not match the DNA template.[9,10] The nucleotide binding
site in DNA polymerases can also discriminate between dNTPs and rNTPs (ribonucleoside triphosphates)
such that the polymerase synthesizes DNA, not RNA. This selection is possible due to the presence of
13
phenylalanine or tyrosine residues that work as a steric gate. The longer –OH group in NTPs present then
much lower association constants in template‐polymerase complex.[9]
When the correct dNTP is inside the catalytic site, the polymerase can change from an open to a close
conformation, where the nucleotidyl transfer can occur (Figure 1.6). This conformational change is the
rate limiting step in the nucleotide addition reaction. A 10‐fold increase in the association constant of
the correct dNTP‐template‐polymerase complex is observed, as a consequence of the clamping down of
the catalytic site, due to the conformational change. Also, the closed conformation permits the correct
alignment of the incoming dNTP triphosphate moiety for nucleophilic attack. After catalysis, an open
conformation is taken, from which the pyrophosphate product is released. Then, dissociation between
the polymerase and the template (now with n+1 nucleotides) may happen, although it is usually
prevented either through interaction with other proteins, or in the case of processive DNA polymerases,
by the thumb domain forming a clamp‐like structure that wraps the double stranded DNA. This way, it is
more likely the polymerase to slide to the new incorporation position than releasing the template
strand.[7‐9]
1.2.3.2. RNA Polymerases
DNA‐dependent RNA polymerases are responsible for the vital process of synthesis of RNA from a
double‐stranded DNA template. Although nuclear transcription within eukaryotes is performed by a
complicated multi‐enzyme RNA polymerase machine, most mitochondria, chloroplast and bacteriophage
genes are transcribed by a homologous family of smaller nucleus‐encoded RNA polymerase.[4] While
larger cellular RNA polymerases present multiple subunits related with regulation and proof‐reading
functions, single‐subunit RNA polymerases share many of the biochemical characteristics, including
catalytic specifications. These single‐unit RNA polymerases (Figure 1.7) resemble DNA polymerases in
structure and catalysis mechanism, but the process of RNA synthesis is conceptually more complex.[13‐16]
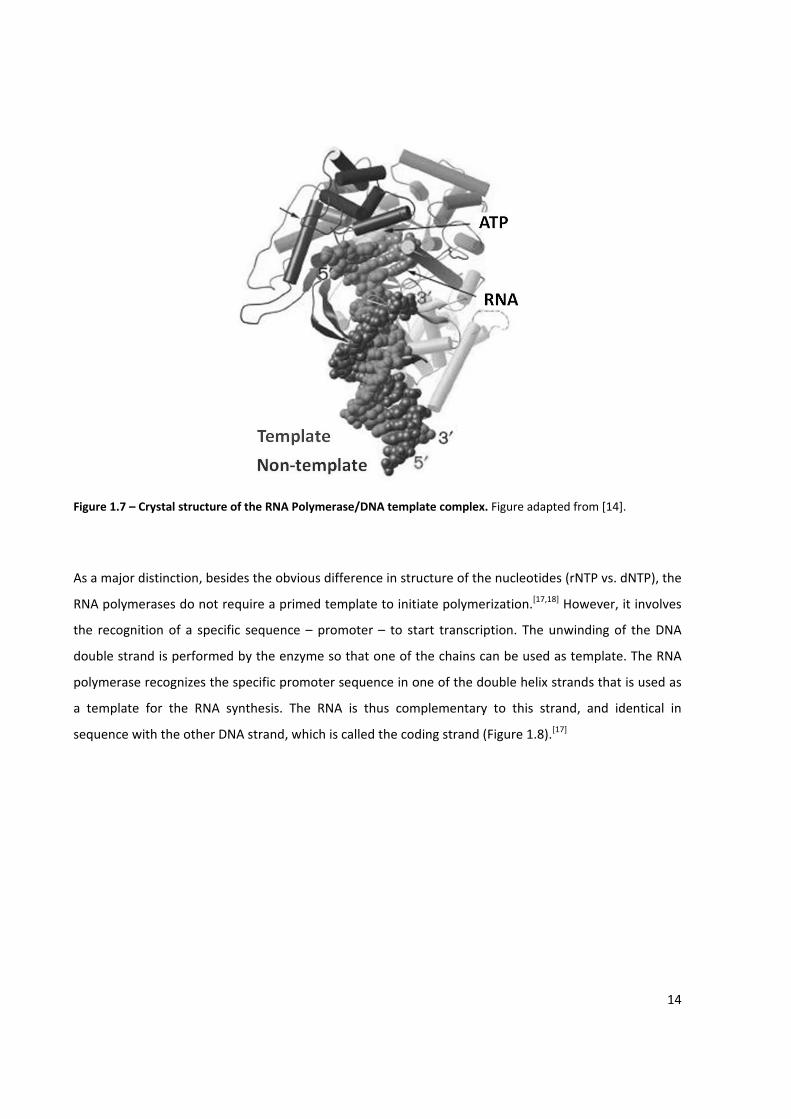
Figure 1.7 – C
As a major d
RNA polym
the recogni
double stra
polymerase
a template
sequence w
Crystal struct
distinction, b
erases do no
ition of a sp
nd is perfor
e recognizes
for the RN
with the othe
ture of the RN
besides the o
ot require a
pecific seque
med by the
the specific
NA synthesis
er DNA strand
NA Polymeras
obvious diffe
primed tem
ence – prom
enzyme so t
promoter se
s. The RNA
d, which is c
e/DNA templ
erence in stru
plate to init
moter – to st
that one of t
equence in o
is thus com
alled the cod
late complex.
ucture of the
iate polymer
tart transcrip
the chains ca
one of the do
mplementary
ding strand (
. Figure adapt
e nucleotide
rization.[17,18
ption. The u
an be used a
ouble helix s
y to this stra
Figure 1.8).[1
ted from [14].
s (rNTP vs. d] However, i
nwinding of
as template.
strands that
and, and id17]
14
dNTP), the
t involves
f the DNA
The RNA
is used as
entical in
15
Figure 1.8 – Schematization of the transcription bubble complex. The unwinding of the double helix is essential for the hybridization of the incoming ribonucleotides and the DNA template strand, forming a bubble. Incorporation of the successive ribonucleotides leads to the formation of a RNA chain that becomes single‐stranded upon rewinding of the duplex DNA strands.
Transcription can be divided into four stages, in which a bubble is created, RNA synthesis begins, the
bubble moves along the DNA and finally is terminated:[4,15,18‐21]
1) Template recognition begins with the binding of RNA polymerase to the double‐stranded
DNA at the promoter to form a "closed complex". Then the DNA strands are separated to
form the "open complex" that makes the template strand available for base pairing with
ribonucleotides.
2) Initiation describes the synthesis of the first nucleotide bonds in RNA. The enzyme remains
at the promoter site while it synthesizes the first ~9 nucleotide bonds. The initiation phase is
often protracted by the occurrence of abortive events, in which the enzyme makes short
transcripts, releases them, and then starts synthesis of RNA again. The initiation phase ends
when the enzyme succeeds in extending the chain downstream of the promoter region.
16
3) During elongation the enzyme moves along the DNA and extends the growing RNA chain. As
the enzyme moves, it unwinds the DNA helix to expose a new segment of the template in
single‐stranded condition. Nucleotides are covalently added to the 3' end of the growing
RNA chain, forming an RNA‐DNA hybrid in the unwound region. Behind the unwound region,
the DNA template strand pairs with its original partner to reform the double helix. The RNA
emerges as a free single strand.
4) Termination involves recognition of the point at which no further bases should be added to
the chain. When the last base is added to the RNA chain, the transcription bubble collapses
as the RNA‐DNA hybrid is disrupted, the DNA reforms in duplex state, and the enzyme and
RNA are both released. The sequence of DNA required for these reactions defines the
terminator.
The catalysis of nucleotidyl transfers is very similar to the one observed in DNA polymerases involving
two divalent cations (usually Mg2+).[22] Recognition of ribonucleotides as substrate and differentiation
from their deoxy‐ analogues is believed to be due to the interaction of a tyrosine residue which interacts
specifically with the 2’‐OH from the nucleotide’s ribose sugar, as opposed to the bulky residue present in
DNA polymerases. The differentiation of the correct nitrogen base is achieved by the same “close‐fit”
model as in DNA polymerases.[23] The nature of the changes from initiation to elongation complex that
allow translocation of the enzyme along the template, away from the promoter, is not known. It has
been suggested that the non‐template strand may play an important role in the elongation complex,
perhaps in RNA displacement.[14]
1.2.3.3. Terminal deoxynucleotidyl Transferase
Deoxynucleotidyl transferases belong to the only family of DNA polymerases that elongates DNA strands
in a template independent manner. Unlike any other polymerase, Terminal deoxynucleotidyl Tranferase
(TdT) has only minor preference for the incorporation of deoxyribo‐ over ribonucleotides on DNA strands
in vitro. However, incorporation of ribonucleotides by TdT leads to premature termination of chain
elongation.[24] All known nucleotidyl tranferases contain a catalytic domain which is topologically
different from the structures of other DNA polymerases. Despite these topological differences, the local
structure of the catalytic site is made of three carboxylate side chains and two divalent cations in the
same
palm
bindi
Figure
The p
absen
incor
group
Altho
the m
for Td
addit
gene
adapt
e spatial arra
domain con
ng of the DN
e 1.9 – Propos
presence of a
nce of activ
porated is t
ps of nucleot
ough TdT wa
most poorly u
dT remained
tion of nuc
rating subtle
tation of the
ngement. Fu
ntaining the
NA primer an
sed structure
a lasso‐like 1
ity over 3’‐O
thought to d
tide’s ribose
s one of the
understood e
d elusive for
leotides to
e randomiza
e vertebrate
urthermore,
catalytic car
nd nucleotide
of the Termi
16 amino aci
OH recessed
derive from
group.[25]
e first DNA po
enzymes tha
several deca
single‐stran
tion of this
immune syst
the hand m
rboxylate tri
e (Figure 1.9
nal deoxynuc
d loop impe
d DNA chain
the lack of
olymerase a
at catalyzes D
ades. It is now
nded DNA
genetic mat
tem (for a re
etaphor use
iad and a fin
).
cleotidyl Trans
edes the pres
ns. The lack
interactions
ctivities iden
DNA synthes
w recognized
during V(D)
terial, TdT p
eview see [29
d in DNA po
nger and thu
sferase. Figur
sence of a te
of specificit
s between t
ntified in ma
is. Indeed, th
d that TdT is
)J recombin
plays a crucia
9] and refere
olymerases h
umb domain
re adapted fro
emplate stra
ty towards t
he protein a
ammals,[26] it
he specific p
responsible
nation.[27,28]
al role in the
ences therein
olds true wi
involved in
om [25].
nd, showing
the sugar be
and 2’ or 3’
t remains on
hysiological
for the rand
By delibera
e evolution
n).
17
th a
the
the
eing
‐OH
e of
role
dom
ately
and
18
1.2.4. In vitro synthesis of Nucleic Acids
In vivo synthesis of nucleic acids is a complex phenomenon which involves a multitude of enzymes and
regulators. However, it is possible to mimic these processes into a much more simplified system for in
vitro applications.
1.2.4.1. Primer Extension Reaction
As referred in the above section, DNA polymerase requires a primed template for addition of subsequent
nucleotides. That is, a region of double stranded DNA with a free 3’‐OH extremity for the synthesis of the
growing chain. From a biochemical point of view, for the synthesis of DNA it is only essential the
presence of a substrate (template strand and a complementary primer), the catalyst (DNA polymerase)
and free triphosphate nucleotides, or dNTPs. It is also necessary a buffer for controlled pH and ionic
strength, and magnesium (or manganese) as co‐factor for the polymerase.[8] As a consequence of the
absence of all the replication control proteins and enzymes, the processetivity of the free polymerase is
reduced,[7,9] which decreases dramatically the number of bases that can be added. Moreover, the
template region where the incoming nucleotide is to be added must be single‐stranded per se. In vivo
replication machinery possesses special enzymes that unwind the template double helix to overcome
this requirement. In vitro systems only present the polymerases theirselves, so special conditions must
be met regarding template/primer hybridization for DNA synthesis.
In primer extension reactions,[30‐32] polymerization is achieved over a sticky end at the 5´ end of the
template strand (Figure 1.5), and polymerization continues until the polymerase successfully reaches the
5’ end of the template strand, producing a full double stranded molecule. The most thoroughly used
DNA polymerase for primer extension reactions is the Klenow fragment of E. coli DNA polymerase I.[33]
The Klenow fragment possesses the 5’‐3’ transferase activity and also a 5’‐3’ exonuclease activity, which
confers the ability to remove nucleotides present downstream of polymerization direction.
Primer extension reactions are widely used for sticky end filling in genetic engineering or incorporation
of labeled nucleotides in double stranded DNA molecules. It is also the simplest in vitro DNA
polymerization reaction.
19
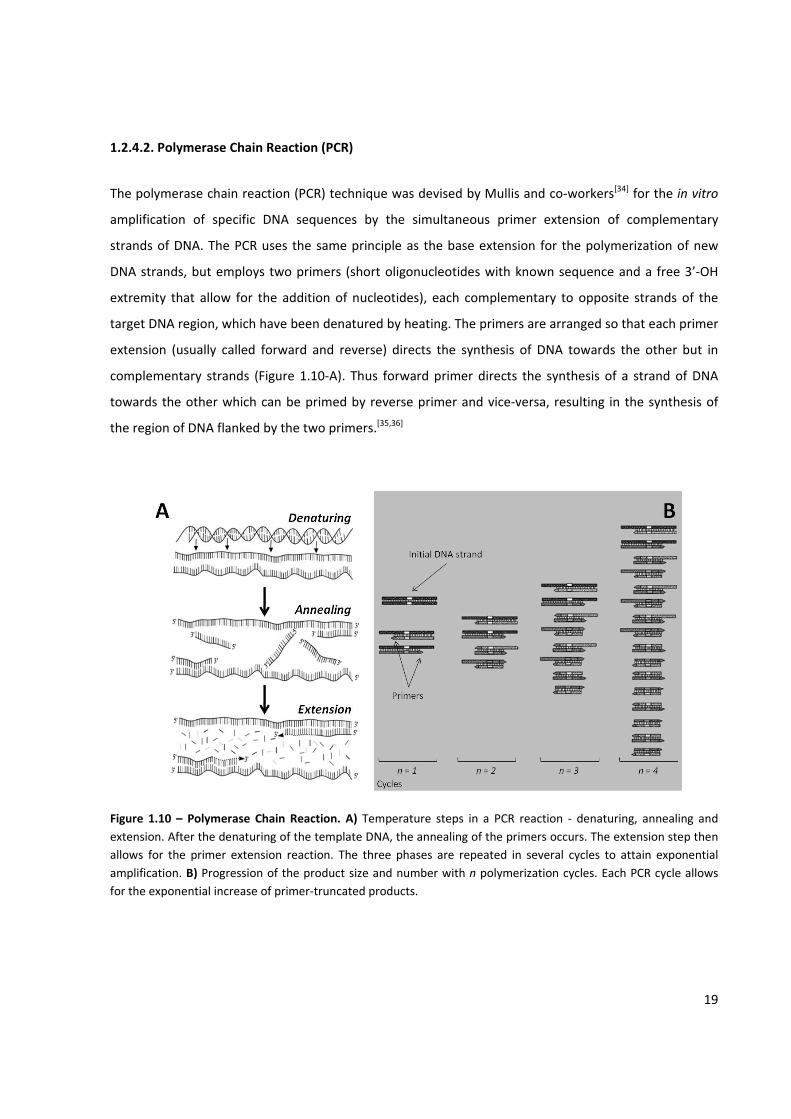
1.2.4.2. Polymerase Chain Reaction (PCR)
The polymerase chain reaction (PCR) technique was devised by Mullis and co‐workers[34] for the in vitro
amplification of specific DNA sequences by the simultaneous primer extension of complementary
strands of DNA. The PCR uses the same principle as the base extension for the polymerization of new
DNA strands, but employs two primers (short oligonucleotides with known sequence and a free 3’‐OH
extremity that allow for the addition of nucleotides), each complementary to opposite strands of the
target DNA region, which have been denatured by heating. The primers are arranged so that each primer
extension (usually called forward and reverse) directs the synthesis of DNA towards the other but in
complementary strands (Figure 1.10‐A). Thus forward primer directs the synthesis of a strand of DNA
towards the other which can be primed by reverse primer and vice‐versa, resulting in the synthesis of
the region of DNA flanked by the two primers.[35,36]
Figure 1.10 – Polymerase Chain Reaction. A) Temperature steps in a PCR reaction ‐ denaturing, annealing and extension. After the denaturing of the template DNA, the annealing of the primers occurs. The extension step then allows for the primer extension reaction. The three phases are repeated in several cycles to attain exponential amplification. B) Progression of the product size and number with n polymerization cycles. Each PCR cycle allows for the exponential increase of primer‐truncated products.
20
The PCR technique comprises three steps, which repeated in a cyclic fashion leads to exponential
amplification of the target region. The first is the denaturing step, usually at 95°C, necessary for the
separation of the two complementary DNA strands. Next, in the annealing step the primers are allowed
to specifically hybridize to its target sequence in each complementary strand. The temperature used in
this step depends critically on the primer size, sequence, GC composition or type of PCR technique used,
although for most common applications the temperature used is the average primer melting
temperature (temperature at which 50% of the primers are hybridized to the template). The final step is
the extension, when the polymerase extends the primed strand to a fully double stranded DNA chain.
The most widely spreaded DNA polymerase for PCR use is the Taq Polymerase from Thermus aquaticus,
which optimal activity temperature is 74°C. This allows not only repetitive denaturing‐annealing‐
extension cycles, but also annealing at higher temperatures than regular polymerases, increasing
sequence specificity.[35,36]
With each cycle being repeated, there is an exponential increase of the DNA product flaked by the two
primers, until one of the reagents (nucleotides or one of the primers) become limiting (Figure 10‐B).[35,36]
The expression relating the number of product copies per amplification cycle is given by Equation 1.
1 Equation 1
Where Xn is the number of target DNA copies in the cycle n, X0 is the initial number of target DNA copies
and E is the amplification efficiency (between 0 and 1).[37] Nowadays there are countless PCR variants for
a myriad of applications, such as asymmetric PCR,[38,39] hot‐start PCR,[40,41] methylation‐specific PCR,[42]
nested PCR,[43,44] quantitative PCR (qPCR)[45,46] or reverse transcription PCR (RT‐PCT).[47] All of them are
based in the same basic product amplification principle here presented.
1.2.4.3. In vitro Transcription Reaction
As previously seen for DNA, requirements for in vivo RNA synthesis[5,48] can be conveniently simplified for
in vitro applications. RNA Polymerases require a double stranded promoter region for RNA
polymerization (see section 1.2.3.2). Also, most in vitro transcription reactions use phage T7, T3 or SP6
RNA polymerases for two reasons: i) these polymerases have simple structures with considerable
processivity that do not require extra transcription factors; and ii) the promoter regions are well known
21
and easily available for other techniques, such as cloning vectors, sequencing and other classic
molecular biology techniques.[49,50] In vitro transcription reactions are commonly applied to the synthesis
of RNA probes for hybridization (some Northern Blot applications and standards,[51‐53] Fluorescence in
situ Hybridization (FISH),[54‐57] etc.), RNase protection assays,[58‐60] antisense RNAs,[61‐63] RNA
interference,[64‐66] RNA secondary structure or RNA‐protein interaction studies.[50] In our work, in vitro
transcription reactions were also used for the proof of concept of light‐activated synthesis of nucleic
acids.
For the in vitro synthesis of a certain RNA molecule, a DNA template with the T7, T3 or SP6 promoter
sequence upstream of the target sequence must be present. Cloning, restriction enzyme digestion /
fragment ligation or PCR can be used to fuse the phage promoter to the template, although special care
must be taken regarding strand orientation, since only one of the DNA template strands is going to be
transcribed.[50] Upon incubation of promoter‐template DNA strand, ribonucleotides and phage RNA
polymerase, at 37°C, the synthesis of a RNA strand is achieved.
1.2.5. Light Control of RNA Synthesis ‐ What component should be controlled?
After a careful analysis of the DNA and RNA polymerization processes, I learned that the control of
nucleic acids synthesis might be achieved though control of one of three main components: DNA
template, polymerase or nucleotides.
i) The DNA template ‐ it requires the presence of a control point at each base composing the
template in order to achieve selection over each incoming nucleotide. Also, the size of the “controlling”
template would limit the strand size.
ii) The polymerase ‐ seemingly the more straightforward means to achieve the goal. However,
one would require not only the insertion of photo‐responsive elements inside the enzyme to modulate
the ON/OFF state, but also to discriminate which nucleotide is to be incorporated. This was judged an
unrealistic solution due to human resources and budget.
22
iii) The nucleotides ‐ every nucleotide can be used as an ON/OFF modulator, since in the absence
of nucleotides there is no reaction. Through the use of four different photo‐responsive elements it is
theoretically possible to activate the insertion of the desired nucleotide in a stepwise fashion.
Nucleotides are also independent of template size and polymerase. The chemistry of ribonucleotides and
deoxyribonucleotides is very similar, which seemed an advantage for applying the same strategies for
DNA and RNA synthesis.
Having carefully evaluated the possibilities, the choice was to use the nucleotides as an effective process
to exert control over the polymerization reaction. Therefore, the next step was to find a proper way to
control the selective insertion of nucleotides through light.
1.3. Caged Molecules
1.3.1. Caged Compounds
The term caged compound refers to a biomolecule rendered biologically inert through derivatization
with a photoremovable protecting group.[67] After light irradiation, the protecting group is cleaved and
the target molecule released, changing it to an active state that can lead to further signaling or
interactions. Caged compounds are biologically useful because illumination can be easily controlled in
timing, location, and amplitude. Therefore, abrupt or localized changes in concentration of active species
can be generated with controlled amplitudes.[68] This capability is particularly valuable when rapid
mechanical mixing is impractical, for example inside a more‐or‐less intact cell, tissue, or protein crystal,
or when microscopic spatial gradients are desired. Photolysis of caged compounds is one of the best
techniques to examine the fast kinetics or spatial heterogeneity of biochemical responses in such
systems.[69] Caged molecules for biological applications were first reported in 1978 when Hoffman and
co‐workers[70] at Yale University synthesized an ATP analogue functionalized with a nitrobenzyl
protecting group that could be removed upon UV light irradiation. By that time, photolabile protecting
groups for synthetic purposes were already known but the breakthrough was to apply them in
biochemical reactions with spatial‐temporal control (Figure 1.11).
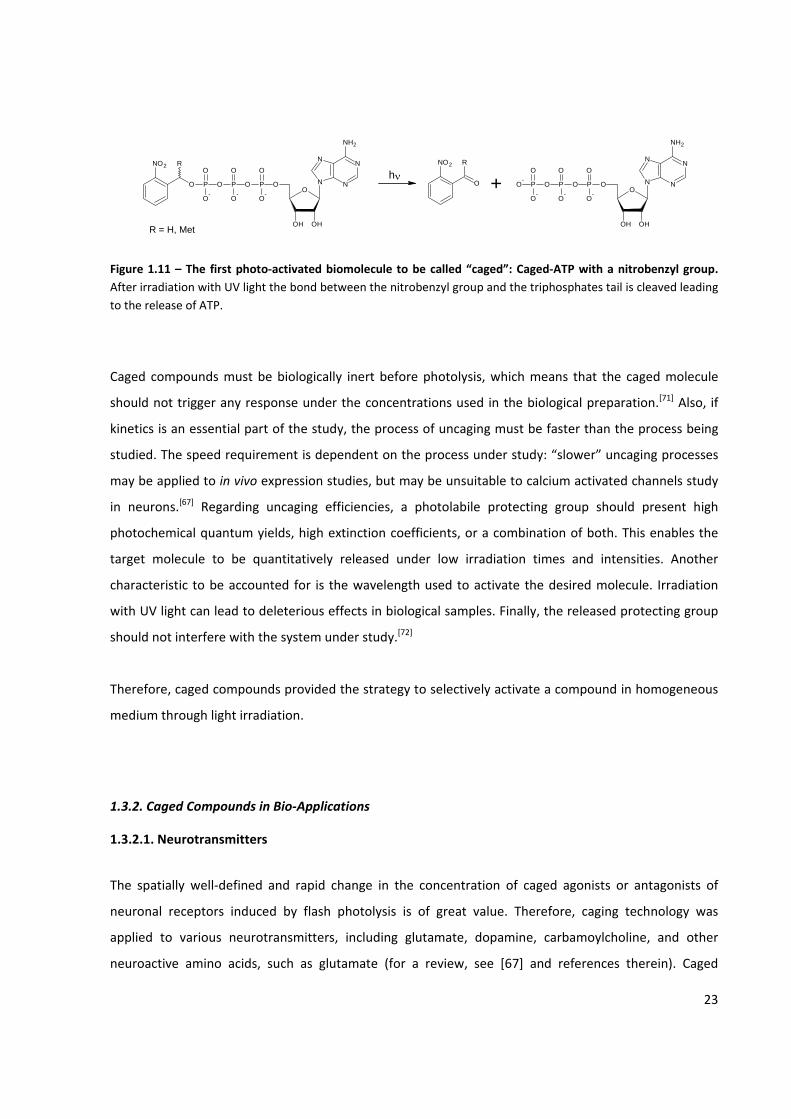
23
Figure 1.11 – The first photo‐activated biomolecule to be called “caged”: Caged‐ATP with a nitrobenzyl group. After irradiation with UV light the bond between the nitrobenzyl group and the triphosphates tail is cleaved leading to the release of ATP.
Caged compounds must be biologically inert before photolysis, which means that the caged molecule
should not trigger any response under the concentrations used in the biological preparation.[71] Also, if
kinetics is an essential part of the study, the process of uncaging must be faster than the process being
studied. The speed requirement is dependent on the process under study: “slower” uncaging processes
may be applied to in vivo expression studies, but may be unsuitable to calcium activated channels study
in neurons.[67] Regarding uncaging efficiencies, a photolabile protecting group should present high
photochemical quantum yields, high extinction coefficients, or a combination of both. This enables the
target molecule to be quantitatively released under low irradiation times and intensities. Another
characteristic to be accounted for is the wavelength used to activate the desired molecule. Irradiation
with UV light can lead to deleterious effects in biological samples. Finally, the released protecting group
should not interfere with the system under study.[72]
Therefore, caged compounds provided the strategy to selectively activate a compound in homogeneous
medium through light irradiation.
1.3.2. Caged Compounds in Bio‐Applications
1.3.2.1. Neurotransmitters
The spatially well‐defined and rapid change in the concentration of caged agonists or antagonists of
neuronal receptors induced by flash photolysis is of great value. Therefore, caging technology was
applied to various neurotransmitters, including glutamate, dopamine, carbamoylcholine, and other
neuroactive amino acids, such as glutamate (for a review, see [67] and references therein). Caged
N
N
N
N
NH2
OO
OHOH
P
O
O-
P
O
O
O-
O
O-
O
O
P
NO2 R
N
N
N
N
NH2
OO
OHOH
P
O
O-
P
O
O
O-
O-
O-
O
O
PO
NO2 R
+hν
R = H, Met
24
glutamate has been applied to address different questions regarding the kinetics of neuronal signaling
and highly regulated spatiotemporal events. It has been used for the analysis of receptor kinetics of ion
channels gated by glutamate in different neuronal cell lines;[73] the localization of the excitatory synaptic
input in CA1 pyramidal cells;[74] the agonistic effects of caged glutamate on N‐methyl‐d‐aspartate
(NMDA).[75] Photolabile protecting groups were also used to study the kinetics of metabotropic and
ionotropic receptors, for example NMDA, and α‐amino‐3‐hydroxy‐5‐methyl‐4‐isoxazolepropionic acid
(AMPA) receptors, with respect to glutamate.[76,77] In another study, caged glutamate was used to
investigate the pharmacology and kinetics of mitral cell glutamate receptors.[78] Hess et al.[79] described
the synthesis of caged serotonin. Lee et al.[80] synthesized caged dopamine for the analysis of the
influence of dopamine concentration on the endogenous dopamine release and they showed that
endogenous dopamine release could be repressed by photoinduced dopamine concentration jumps. A
caged peptide‐based inhibitor of N‐ethylmaleimide sensitive factor (NSF) was used by Kuner and
colleagues[81] in order to study the effect of NSF on the interaction between presynaptic terminal,
synaptic vesicles and neurotransmitters release. The ultra‐fast response obtained prior to
neurotransmitter release was only possible due to the application of localized in vivo light release of NSF.
1.3.2.2. Caged Calcium
Several studies report the application of caged compounds for the release of calcium, for its great
relevance as second messenger in cell physiology (see [82‐86] and references therein). Because Ca2+ does
not form covalent bonds in aqueous solution, it cannot be caged by simple derivatization as in most
other caged species. Instead Ca2+ is sequestered by a chelator that changes from high (but not infinite)
affinity to a much lower affinity upon photolysis. Depending on the complexity of these equilibria and
the presence of other buffers and Ca2+ transporting systems, pulsed photolysis can generate step
increases or pulses, or more complicated waveforms of Ca2+ concentration change.[69]
The general strategy of calcium uncaging has been applied in two different ways. One based on
photochemical modification of the buffering capacity of 1,2‐bis(o‐aminophenoxy)ethane‐N,N,N’N’‐
tetraacetic acid (BAPTA) derivatives (nitr‐5 or azid‐1),[87,88] and the other based on photochemical scission
of the backbone of either EDTA (dimethoxy (DM)‐nitrophen)[89] or EGTA (nitrphenyl (NP)‐EGTA).[90] For a
review on the use of calcium chelators activated by light, please refer to [72] and references therein.
25
1.3.2.3. Caged Peptides and Proteins
Thus far, caged peptides are small inhibitory peptides that can be used to disrupt an important
intracellular protein‐protein interaction.[91‐93] Caged enzymes are macromolecule counterparts of
standard caged compounds, in which the catalytic function of the enzyme is blocked by the caging
chromophores. Such syntheses are often more challenging as peptides seem to be inherently unstable.
However, the development and use of caged peptides is important because they provide another means
of controlling the fate of a cell that is conceptually distinct from the uncaging of small‐molecules,
especially given that many cellular processes are not regulated by essential co‐factors but simply by
protein‐protein interactions.[72]
Cages and light‐activated photo‐switches can be introduced into proteins by different methods. In the
simplest, caging can be achieved by statistically modifying a protein through the reactivity of functional
groups of amino acid side chains with caging agents. One such approach makes use of cysteine residues
of proteins and the sulfhydryl groups of caging agents. In another approach, synthetic peptides can be
generated bearing a caged moiety at a desired position and replace the wild‐type counterpart, in
heterodimeric proteins.[67] Another elegant approach was introduced by Schultz et al.,[94,95] as they used a
nonsense‐codon and a corresponding tRNA, loaded with the desired caged amino acid. Slightly earlier an
artificial four‐base codon approach had been used by Endo et al..[96] Both these methods allow
introducing caged amino acids into larger proteins in a site‐directed manner. The irreversible
photoactivation of proteins has been described for several protein classes including hydrolases,
proteases, kinases, nucleases, toxins, cell‐matrix proteins, receptors, serum proteins, galactosidase, and
antibodies (for a review, please see [67,72]).
The state of the art in photo‐activated proteins showed that functionalization of a certain polymerase
with a photo‐actuator was not the most viable strategy. The ability to control a polymerase ON/OFF
state would be challenging enough. To specifically achieve the selection of the substrate at the same
time (adenine, guanine, thymine, cytosine or uracil nucleotides) continued to appear an unrealistic
approach.
26
1.3.2.4. Caged Nucleic Acids
The applicability of caged‐ technology to nucleic acids is broad, involving various conceptual principles.
For this reason, I have decided to divide this section in several classes of caged nucleic acids applications.
1.3.2.4.1. Gene Expression Systems
Here are presented several reports on the control of gene expression. As referred above, for a gene to be
translated, the information has to pass on from DNA to RNA and further transcribed into functional
proteins. Gene expression and regulation is of critical importance in cell function, so light controlled
expression is a potentially powerful tool for cell studies.
Like peptides and proteins, the strategy for turning a DNA or RNA strand into a photo‐active one is
different from caging small molecules. One of the existing strategies for the preparation of caged nucleic
acids relies on what could be called “statistical backbone caging”: In a pioneering investigation by
Haselton et al. [97] plasmid DNAs coding for luciferase or GFP were modified with Nv‐groups. Owing to the
unselective nature of these conditions, the plasmids were modified with caging groups with a statistical
distribution of positions —presumably mainly at backbone phosphate groups. The modified plasmids
were introduced into either rat skin cells or HeLa cells, and were transcriptionally inactive prior to
activation with light. Irradiation with a laser at 355 nm induced transcription in a dose‐dependent
fashion. However, full transcriptional activity could not be restored.
The same strategy of backbone caging was pursued by Okamoto and co‐workers[98] using a 6‐bromo‐7‐
hydroxycoumarin (Bhc) caged GFP‐mRNA (ca. 30 sites per 1 kb RNA). Bhc‐caged mRNA was injected in
the one‐cell stage of zebrafish embryos and turned out to be remarkably stable. The modified mRNA was
almost translationally inactive prior to uncaging. Again, upon irradiation, the translational activity could
be partly recovered in the irradiated part of the embryo, despite the fact that mRNA injected in the one
cell stage is distributed ubiquitously in the whole embryonic body.
Friedman et al. [99] have recently applied the strategy of statistical backbone phosphate caging to small
interfering RNA (siRNA). siRNA molecules are a powerful and broadly applicable gene regulatory
technique. The double‐stranded siRNA interacts with the RNA induced silencing complex (RISC) which
will then degrade cellular mRNA with the same sequence as one of the siRNA strands. The rationale
27
behind the suggested approach is to prevent the interaction between the caged siRNA and the RISC
complex. In this study, the caged siRNA contained an average of 1.4 caging groups per duplex. As a
model system, the silencing of GFP expression in HeLa cells was used. The caged siRNA was not
completely inactive but could be fully activated upon irradiation. An increase in the number of caging
groups made the siRNA inactive but then the full activity could no longer be restored by irradiation. The
elegance of this approach of statistical backbone caging clearly lies in its simplicity of preparation.[67]
However ‐ at least with the modifying reactions and the caging groups used to date ‐ a clean ON/OFF
reaction is not yet possible.
An alternative to the statistical backbone caging approach is the direct functionalization of a determined
base with a caging agent. Mikat and co‐workers, [100] followed a different approach for siRNA, where the
influence of functionalizing photolabile protection groups at nucleobases surrounding the mRNA
cleavage site between the 10th and 11th nucleotides on siRNA activity was assessed. The designed siRNAs
were completely inactive. By irradiation with UV light (366 nm) they could be fully reactivated and
showed the same activity as their unmodified siRNA counterparts. It was suggested that the photolabile
NPP group used masks the Watson–Crick interaction capability of the nucleobases to create a temporary
bulge region in the siRNA:mRNA duplex of the RISC, which can be completely removed by irradiation.
This direct functionalization was also applied to the control of autocatalytic nucleic acids. Chaulk et al.
[101] presented a hammerhead self‐cleaving ribozyme caged at the 2’‐OH of a critical nucleotide for
catalysis. After laser photolysis, full ribozyme activity was recovered. A similar approach was also used by
Lusic and co‐workers[102] to a trans‐cleaving deoxyribozyme. In this case, the caging group was
functionalized directly to thymine rings of the deoxyribozime. Each thymine present in the
deoxyribozyme was individually functionalized with a caging group and its effect on the catalytic
properties was assessed. This system was based on hydrogen bonding disruption between critical base
pairs that impede the formation of secondary structures necessary for catalysis. However, full catalytic
properties were not achieved after irradiation.
An anti‐sense oligonucleotide gene silencing was recently proposed by Tang et al.[103] Anti‐sense
approach uses an oligonucleotide relatively larger than siRNA (30 ‐ 40 nt long) in which one of the
strands is complementary to a target mRNA. Upon hybridization the RNA‐DNA hybrid can be cleaved by
RNase H, leading to suppression of the desired gene. In the referred work, a double‐stranded antisense
oligonucleotide was used, with the two strands covalently attached via a photocleavable linker (PL) to
28
partially complementary 20‐mer sense strand. This way, the melting temperature of the conjugate is
highly increased, impairing hybridization with target mRNA. Upon photolysis the duplex conjugate is
cleaved, the antisense oligonucleotide released and a 10‐fold increase in mRNA digestion was obtained.
In a similar approach, a chain of negatively charged peptide nucleic acid (ncPNA) was covalently attached
to a partially complementary oligonucleotide via a photolabile linker. After release, the ncPNA hybridize
to target mRNA forming an ultra‐stable duplex that impairs ribosome translation.[104]
1.3.2.4.2. In vitro Nucleic Acid Synthesis Systems
With the exception to the work of Monroe[97] and its caged plasmid DNA, all the above mentioned
applications for gene expression control are based on interaction with mRNA molecules. None applies a
direct control of nucleic acid synthesis through DNA or RNA polymerase. Krock and co‐workers[105]
presented a DNA template for in vitro transcription showing single and multi‐base targeted
functionalization with a caging group so as to disrupt base pairing between template strands. In this way,
RNA polymerase recognition of its substrate was impeded. Once again, multi‐base caging revealed that
full release was slow and did not achieve the same transcription levels as single‐base functionalization.
Moreover, a phosphoramidite synthesis method proved that this strategy can be applied to every
oligonucleotide synthesis for directed functionalization with a caging group. In a different approach,
Tang et al. [106] presented the control of DNA synthesis by Klenow polymerase through steric hindrance.
The template strand was functionalized with a caging group in the nucleotide adjacent to 3’‐OH terminal
of the growing strand, creating a bulky obstacle to Klenow docking or efficient catalysis and only after
photolysis primer extension could be observed. A similar strategy was used by Tanaka and co‐workers[107]
for controlling PCR reactions to provide sticky ended products that after cleavage could be used for
simpler cloning procedure.
These strategies present a way to activate in vitro nucleic acid synthesis through template derivatization.
However, only the first ON/OFF state can be achieved, impeding stepwise activation. The state of the art
at the beginning of this project confirmed that control through template would not be viable to achieve
selection of a desired nucleotide for every incorporation position.
29
1.3.2.5. Caged Nucleotides
Nucleotides were the first class of molecules chosen for caging applications by the pioneer work of
Hoffman and co‐workers.[70] Their importance, particularly cyclic nucleotides, is related to the fact that
they are second messengers involved in many biological processes. Harz et al.[108] generated an
intracellular concentration gradient of cAMP by irradiating the growth cones of chicken sensory neurons
with UV light at distinct positions in order to turn off the growth cones. Yoshimura and Kato[109] used a
caged cAMP derivative in neurons to analyze the synaptic up‐ or down‐regulation of after‐potentials
after an increase of cAMP in neurons. Scott et al.[110] compared the inward currents activated in rat
neurons by the cellular increase in cGMP levels, maintained by the flash photolysis of caged cyclic
guanine monophosphate (cGMP) precursors. In another study, Takeuchi and Kurahashi[111] investigated
secondary‐messenger‐based signal‐transduction pathways in the olfactory receptor system using caged
cNMP molecules.
Several studies by Hagen and co‐workers[112] have shown the use and development of coumarin‐based
caging groups and their application in the study of cyclic nucleotide‐gated channels. In one of their
studies, cAMP and cGMP were functionalized with coumarines as ultra‐fast and highly efficient
phototriggers for activation of cAMP‐gated and cGMP‐gated channels. [112] In a more recent study, the
same cyclic nucleotide‐gated channels were studied using 8‐bromo derivatives of cAMP and cGMP
nucleotides, as they present a higher biological efficacy.[113] With the aim of maximizing the release
effect, more soluble coumarin‐derivatized cyclic nucleotides were also reported.[114] The range of caged
nucleotides was extended to cytidine 5’‐diphosphate for the study of ribonucleotide reductases[115] and
coumarin‐caged AMP, ADP and ATP derivatives.[116] Furuta and co‐workers[71] also developed coumarin‐
functionalized cyclic monophosphates nucleotides with the possibility of two‐photon excitation for
cAMP‐mediated transduction channels in olfactory receptor cells and cAMP‐mediated motility responses
in epidermal melanophores in scales from medaka fish. All the studies presented above are based on
functionalization of the respective nucleotides at the phosphate groups. This strategy is rather
interesting since, apart from Watson‐Crick base pairing with the template, phosphate groups’ position
and interaction with metal ion co‐factors are critical for catalysis. Inactivation of nucleotides through
derivatization on phosphate groups might also lead to loss of polymerase activity.
30
Curiously, although nucleotides are used as second messengers in biological processes, their main
function in cells is the integration into nucleic acids. The application of caged groups to control directly
the synthesis of DNA molecules was only described in a work by Ju’s and Turro’s at Columbia University.
[116‐121] They devised a system in which sequencing by synthesis strategy was coupled to the use of
photolabile reversible terminator in DNA chips. Modified nucleotides were used as reversible
terminators, in which a different fluorophore with a distinct fluorescent emission was linked to each of
the four bases through a photocleavable linker. Also, the 3’‐OH group is capped by a small chemical
moiety. This way, the DNA polymerase only incorporates a single‐nucleotide analogue complementary to
the base on a DNA template covalently linked to a surface. After incorporation, the unique fluorescence
emission is detected to identify the incorporated nucleotide, and the fluorophore is subsequently
removed photochemically. The 3’‐OH group is then chemically regenerated, allowing the next cycle of
the polymerase reaction to proceed (for a review see [121] and references therein).
This sequencing by synthesis proposed by Ju and Turro is in principle, the direct opposite of the work
proposed within the present thesis. They use a reversible terminator of DNA synthesis, acting chemically
on the nucleotides as a STOP signal; whereas in this project, light is supposed to be the START signal for
synthesis. In another point, they use different emission wavelengths to distinguish which nucleotide was
added to the growing sequence; within this project the aim is to use different absorption features to use
light of different wavelengths as different inputs, rather than as output.
To achieve the task of controlling DNA/RNA polymerization one would need four different caging groups
with distinct absorption bands, and to functionalize each nucleotide in order to obtain selective
excitation/cleavage. Through monochromatic excitation, the start signal would select which nucleotide
was to be incorporated in the growing strand. The next step was to choose a suitable collection of caging
groups.
1.3.3. Photolabile Protecting Groups
There are few described classes of photolabile protecting groups, each with several structural
modifications, but conserving the intrinsic release mechanism and photochemical properties: o‐alkylated
nitrophenil, benzoin, p‐hydroxyphenacil and coumarins.[69,74,122]
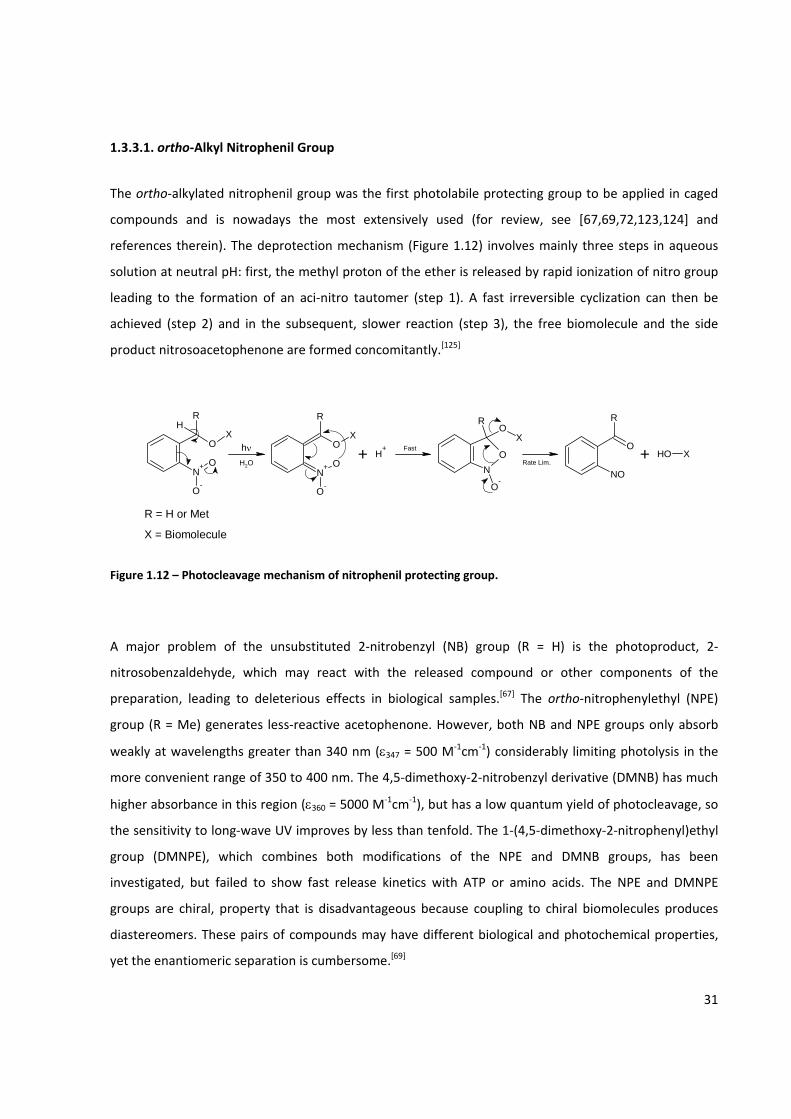
31
1.3.3.1. ortho‐Alkyl Nitrophenil Group
The ortho‐alkylated nitrophenil group was the first photolabile protecting group to be applied in caged
compounds and is nowadays the most extensively used (for review, see [67,69,72,123,124] and
references therein). The deprotection mechanism (Figure 1.12) involves mainly three steps in aqueous
solution at neutral pH: first, the methyl proton of the ether is released by rapid ionization of nitro group
leading to the formation of an aci‐nitro tautomer (step 1). A fast irreversible cyclization can then be
achieved (step 2) and in the subsequent, slower reaction (step 3), the free biomolecule and the side
product nitrosoacetophenone are formed concomitantly.[125]
Figure 1.12 – Photocleavage mechanism of nitrophenil protecting group.
A major problem of the unsubstituted 2‐nitrobenzyl (NB) group (R = H) is the photoproduct, 2‐
nitrosobenzaldehyde, which may react with the released compound or other components of the
preparation, leading to deleterious effects in biological samples.[67] The ortho‐nitrophenylethyl (NPE)
group (R = Me) generates less‐reactive acetophenone. However, both NB and NPE groups only absorb
weakly at wavelengths greater than 340 nm (ε347 = 500 M‐1cm‐1) considerably limiting photolysis in the
more convenient range of 350 to 400 nm. The 4,5‐dimethoxy‐2‐nitrobenzyl derivative (DMNB) has much
higher absorbance in this region (ε360 = 5000 M‐1cm‐1), but has a low quantum yield of photocleavage, so
the sensitivity to long‐wave UV improves by less than tenfold. The 1‐(4,5‐dimethoxy‐2‐nitrophenyl)ethyl
group (DMNPE), which combines both modifications of the NPE and DMNB groups, has been
investigated, but failed to show fast release kinetics with ATP or amino acids. The NPE and DMNPE
groups are chiral, property that is disadvantageous because coupling to chiral biomolecules produces
diastereomers. These pairs of compounds may have different biological and photochemical properties,
yet the enantiomeric separation is cumbersome.[69]
R
N+
OX
H
O-
O
R
N+
OX
O-
OhνH2O
+ H+
R
NO
O-
OX
Fast
R
NO
O + OH XRate Lim.
R = H or Met
X = Biomolecule
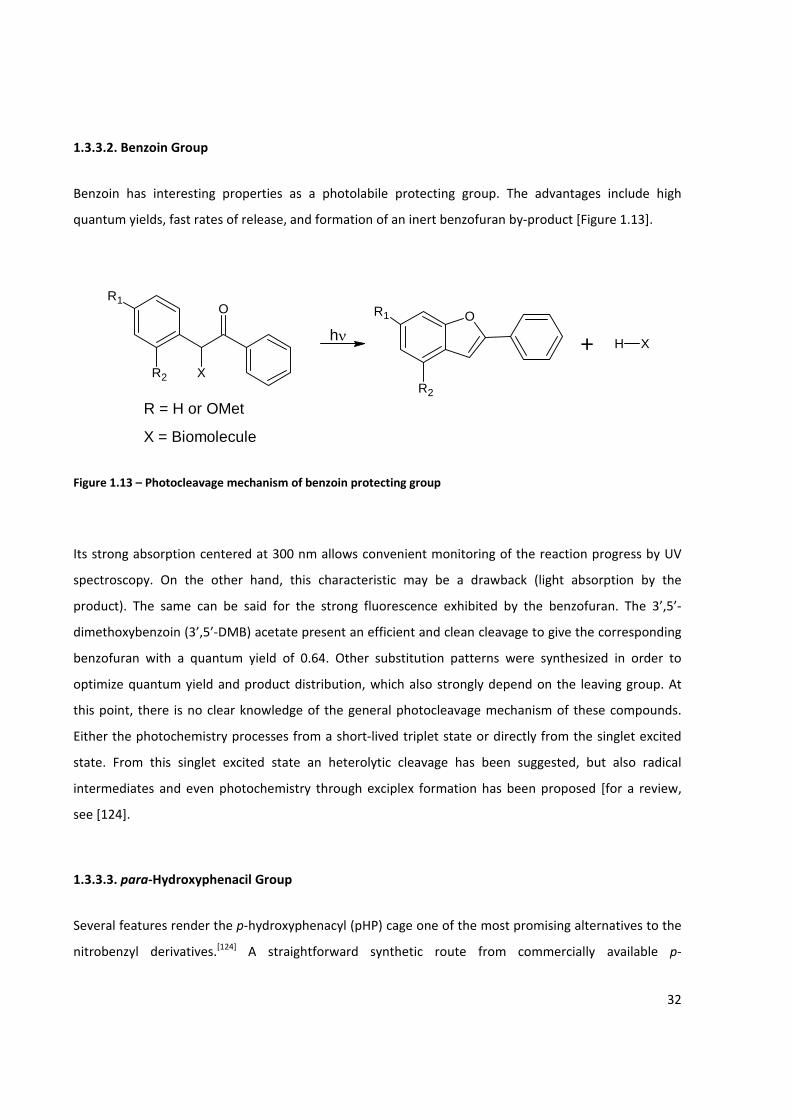
32
1.3.3.2. Benzoin Group
Benzoin has interesting properties as a photolabile protecting group. The advantages include high
quantum yields, fast rates of release, and formation of an inert benzofuran by‐product [Figure 1.13].
Figure 1.13 – Photocleavage mechanism of benzoin protecting group
Its strong absorption centered at 300 nm allows convenient monitoring of the reaction progress by UV
spectroscopy. On the other hand, this characteristic may be a drawback (light absorption by the
product). The same can be said for the strong fluorescence exhibited by the benzofuran. The 3’,5’‐
dimethoxybenzoin (3’,5’‐DMB) acetate present an efficient and clean cleavage to give the corresponding
benzofuran with a quantum yield of 0.64. Other substitution patterns were synthesized in order to
optimize quantum yield and product distribution, which also strongly depend on the leaving group. At
this point, there is no clear knowledge of the general photocleavage mechanism of these compounds.
Either the photochemistry processes from a short‐lived triplet state or directly from the singlet excited
state. From this singlet excited state an heterolytic cleavage has been suggested, but also radical
intermediates and even photochemistry through exciplex formation has been proposed [for a review,
see [124].
1.3.3.3. para‐Hydroxyphenacil Group
Several features render the p‐hydroxyphenacyl (pHP) cage one of the most promising alternatives to the
nitrobenzyl derivatives.[124] A straightforward synthetic route from commercially available p‐
X
OR1
R2
R = H or OMet
hνO
R2
R1
+ H X
X = Biomolecule
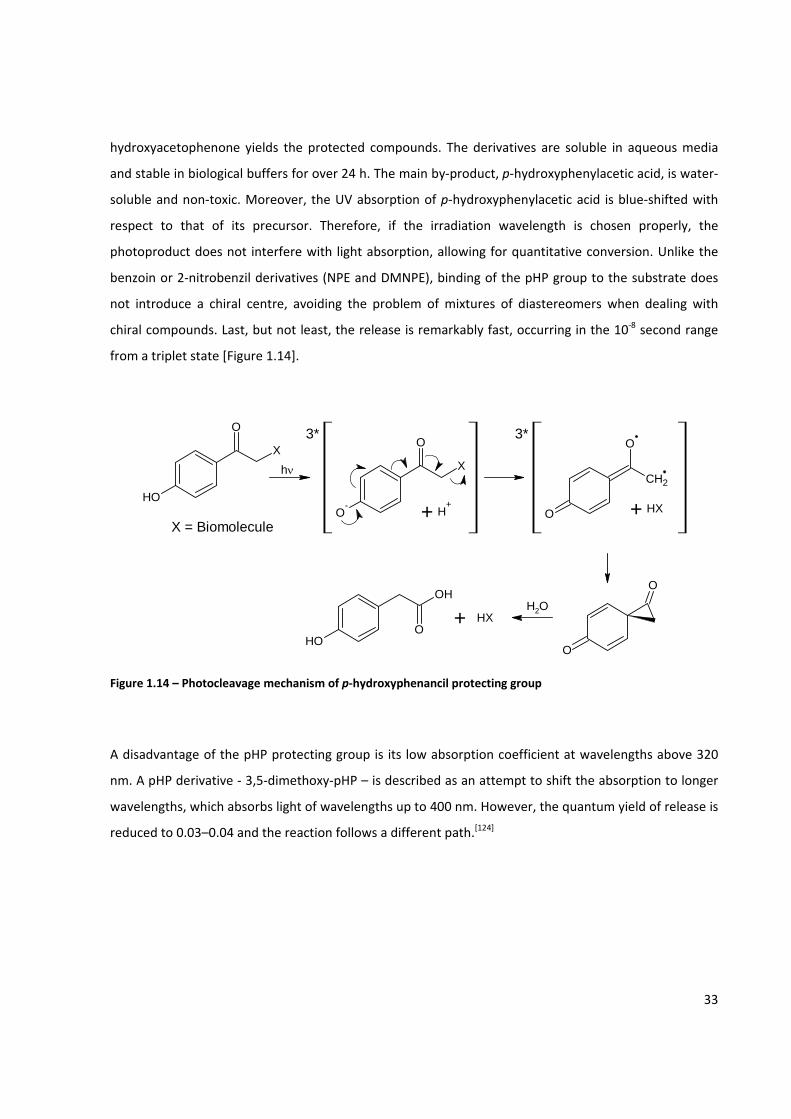
33
hydroxyacetophenone yields the protected compounds. The derivatives are soluble in aqueous media
and stable in biological buffers for over 24 h. The main by‐product, p‐hydroxyphenylacetic acid, is water‐
soluble and non‐toxic. Moreover, the UV absorption of p‐hydroxyphenylacetic acid is blue‐shifted with
respect to that of its precursor. Therefore, if the irradiation wavelength is chosen properly, the
photoproduct does not interfere with light absorption, allowing for quantitative conversion. Unlike the
benzoin or 2‐nitrobenzil derivatives (NPE and DMNPE), binding of the pHP group to the substrate does
not introduce a chiral centre, avoiding the problem of mixtures of diastereomers when dealing with
chiral compounds. Last, but not least, the release is remarkably fast, occurring in the 10‐8 second range
from a triplet state [Figure 1.14].
Figure 1.14 – Photocleavage mechanism of p‐hydroxyphenancil protecting group
A disadvantage of the pHP protecting group is its low absorption coefficient at wavelengths above 320
nm. A pHP derivative ‐ 3,5‐dimethoxy‐pHP – is described as an attempt to shift the absorption to longer
wavelengths, which absorbs light of wavelengths up to 400 nm. However, the quantum yield of release is
reduced to 0.03–0.04 and the reaction follows a different path.[124]
OH
O
Xhν
O-
O
X
+ H+
3*
O
CH2
O
+ HX
3*
O
O
H2O
OH
OH
O+ HX
X = Biomolecule
34
1.3.3.4. Coumarin Group
A short description of this class of caging groups is presented, focused mainly on its origins and recent
applications. A detailed photochemical and photophysical description of coumarin derivatives is
presented in section 1.4.
Coumarin (1,2‐Benzopyrone or 2H‐1‐benzopyran‐2‐one) and its derivatives (coumarins) are widely
distributed throughout nature and many exhibit useful and diverse biological and pharmacological
activities.[126‐130] Coumarins occur as secondary metabolites in the seeds, roots and leaves of many plant
species, notably in high concentration in tonka bean.[131] Their function is far from clear, although
suggestions include plant growth regulations, fungistasis, bacteriostasis and even, waste products. Some
naturally occurring coumarin derivatives include warfarin, umbelliferone (7‐hydroxycoumarin),
aesculetin (6,7‐ dihydroxycoumarin), herniarin (7‐methoxycoumarin), psoralen and imperatorin.[131,132]
Now the diversity of coumarin derivatives, both natural and synthetic, has grown. Coumarin derivatives
have been found to have numerous therapeutic applications including photochemotherapy, antitumor
and anti‐HIV therapy, and as central nervous system (CNS) stimulants, antibacterials, anti‐inflammatory,
anti‐coagulants, activity against breast cancer and dyes. In addition, coumarins are known to be lipid
lowering agents with moderate triglyceride lowering activity. The pattern of substitutions on the basic
chemical structure is said to influence both the coumarin’s pharmacological and biochemical properties,
including the therapeutic applications, and can beneficially affect toxicity (for review see [127,131‐133]
and references therein).
From a chemical point of view, the spectral range of coumarin derivatives absorption extends to the
visible region. The substituent pattern of the coumarinic core is important to regulate the absorption and
emission spectra, photophysical properties, photochemical reactivity and hydrophilicity of the
compound. The quantum yields observed in 4‐methylcoumarin derivatives are up to 0.25 at most,
nevertheless they present much higher absorption coefficients when compared to other caging groups.
Also, the fast rate of photorelease makes this system suitable for a number of applications, such as
photorelease of carboxylic acids, phosphates and sulfonates. Recently, 4‐methylcoumarin derivatives
have also been applied to the caging of alcohols and phenols,[134] aldehides and ketones,[135] diols,[136]
amines,[68,98] carboxylates[134] and carbonyls.[137] The coumarinyl group is also suitable for two‐photon
35
excitation experiments, thanks to its relatively high two‐photon excitation cross section.[71] The more
relevant characteristics of this class are not only the possibility to irradiate in the visible region of the
spectrum but also the tunable absorption properties of the coumarin molecules through the substitution
pattern. Furthermore, the previous work of Hagen and colleagues described the synthesis of a coumarin‐
caged ATP through derivatization of phosphate group.[116]
Due to all the mentioned characteristics, coumarins were considered the most suitable caging group for
application to the light control of nucleic acids presented in this Thesis.
1.4. Photophysics and Photochemistry of Coumarins
1.4.1. Introduction to Photochemistry
Before proceeding to the state of the art of coumarin’s photophysics and photochemistry, this sub‐
chapter presents a short introduction to some general Photochemistry principles that are related to this
work.
1.4.1.1. Absorption of Radiation
K. K. Rohatgi‐Mukherjee[138] presents a simple and clear explanation of this subject:
“When electromagnetic radiation falls on an atom or molecule, the electric field of the radiation
tends to disturb the charge cloud around the atom or the molecule. (…) The oscillating electric
field of the electromagnetic radiation (…) creates an oscillating dipole in the atom or the molecule
with which it is interacting. The dipole is generated in the direction of the electric vector of the
incident radiation.
From electrodynamics, it is known that when a positive and a negative charge oscillate with
respect to each other, it becomes a source of electromagnetic radiation. The radiation emanating
from the source is propagated in all directions like a sound from a ringing bell. A similar situation
36
applies to the present case. The disturbed molecule becomes a source of electromagnetic
radiation of the same frequency as the frequency of the incident radiation. This is the mechanism
of scattering of radiation by a particle of molecular dimensions. The secondary radiation thus
scattered uniformly in all directions interferes with the primary incident radiation. As a result,
radiation waves are cancelled out by destructive interference in all directions except that of the
reflection or refraction.
As long as the frequency of incident radiation νi is not close to that of the natural frequency νn of
the molecule as given by its energy states, the oscillations are due to forced distortion of the
molecule by the electromagnetic wave. But when νi ≈ νn, and the resonance condition is
established between the two interacting partners (the photon and the molecule), the oscillations
classically become “free”. Under this condition a quantum of radiation or a photon is absorbed by
the atom or molecule, promoting it to a higher energy state. An oscillating dipole moment μ
(defined by the product of charge e times the distance of separation r between the centers of
gravity of positive and negative charges) is created and designated as the transition moment.”
Quantitatively, the intensity of absorption for an electronic transition is the probability of absorption
between two given energy states. Experimental determination of intensity of absorption is based on
Lambert‐Beer law. When the radiation of frequency ν is incident on an absorbing system composed of
atoms or molecules, the fractional decrease in intensity on passage through the solution of molar
concentration C and layer thickness dl can be expressed as
Equation 2
αν is the proportionality constant and is a function of incident light frequency ν. On integration over the
path length l and converted to decimal logarithm the expression becomes
Equation 3
37
where I0 is the incident intensity at L = 0, and I is the transmitted intensity at L=L. Hence εν expresses the
probability of absorption per unit time per unit concentration per unit length of the optical path. For a
range of frequencies
Equation 4
where A is the molar integrated intensity over the absorption band. The simplified version and widely
applied Lambert‐Beer equation refers to the relation between absorbance A at a discrete wavelength,
molar concentration C, optical path l and molar extinction coefficient ε at the same wavelength
Equation 5
For more than one absorbing components, optical density, or absorbance is given by AT=lΣiενiCi.[138]
Concerning electronic transitions that occur upon photon absorption, the types of electronic orbitals that
may be present in organic molecules are σ, π, n, π* and σ* (respectively, by ascending energy order),
which originate from the overlap of atomic s and p orbitals. Also, according to molecular orbital theory,
most organic molecules are closed‐shell molecules in which the highest occupied molecular orbitals
(HOMO) are bonding (σ or π) or non‐bonding (n) orbitals. On excitation, an electron may be promoted to
the lowest unoccupied molecular orbital (LUMO) which is usually an anti‐bonding (σ* or π*) orbital. The
n π* and π π* transitions are the most characteristic transitions in organic molecules since they are
generally observed in the near UV and visible regions of the spectrum.[139] Among some differences
between both transition types, the more pronounced is the intensity of the absorption band. Transitions
of n π* type usually present smaller transition probabilities (and consequently, smaller extinction
coefficients) due to the poor overlap of the wave functions describing the initial and final states.[138]
1.4.1.2. Photophysical Processes in Electronic Excited Molecules
The electronic transition induced by the electromagnetic radiation occurs rapidly (10‐15 s) compared to
nuclear motion (≈10‐13 s). Thus, the nuclei remain essentially frozen at the equilibrium configuration of
the ground state molecule during transition. Since the electronically excited state thus generated is likely
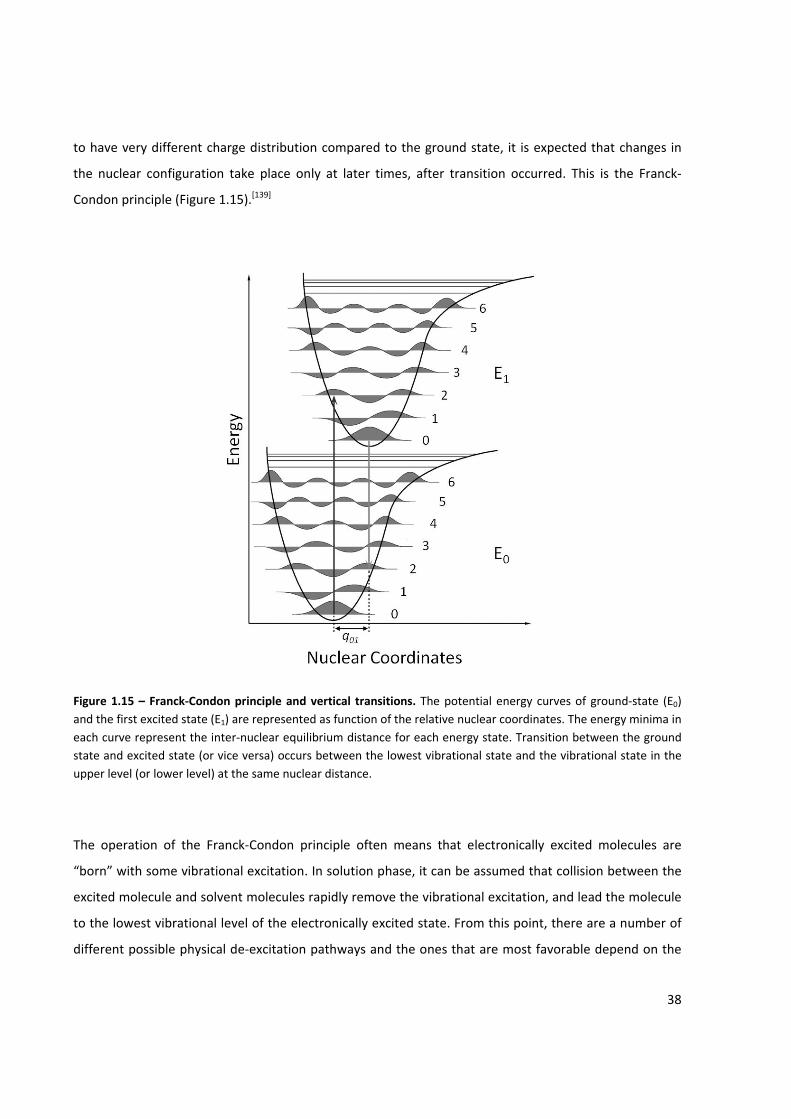
38
to have very different charge distribution compared to the ground state, it is expected that changes in
the nuclear configuration take place only at later times, after transition occurred. This is the Franck‐
Condon principle (Figure 1.15).[139]
Figure 1.15 – Franck‐Condon principle and vertical transitions. The potential energy curves of ground‐state (E0) and the first excited state (E1) are represented as function of the relative nuclear coordinates. The energy minima in each curve represent the inter‐nuclear equilibrium distance for each energy state. Transition between the ground state and excited state (or vice versa) occurs between the lowest vibrational state and the vibrational state in the upper level (or lower level) at the same nuclear distance.
The operation of the Franck‐Condon principle often means that electronically excited molecules are
“born” with some vibrational excitation. In solution phase, it can be assumed that collision between the
excited molecule and solvent molecules rapidly remove the vibrational excitation, and lead the molecule
to the lowest vibrational level of the electronically excited state. From this point, there are a number of
different possible physical de‐excitation pathways and the ones that are most favorable depend on the
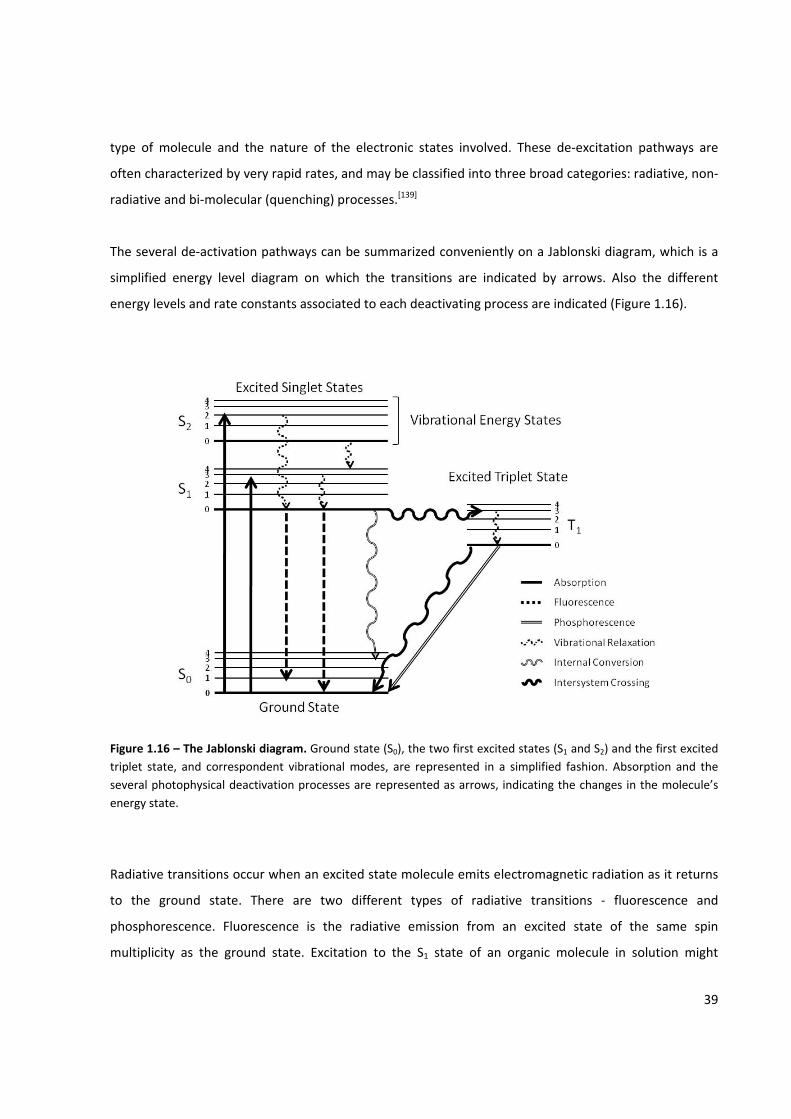
39
type of molecule and the nature of the electronic states involved. These de‐excitation pathways are
often characterized by very rapid rates, and may be classified into three broad categories: radiative, non‐
radiative and bi‐molecular (quenching) processes.[139]
The several de‐activation pathways can be summarized conveniently on a Jablonski diagram, which is a
simplified energy level diagram on which the transitions are indicated by arrows. Also the different
energy levels and rate constants associated to each deactivating process are indicated (Figure 1.16).
Figure 1.16 – The Jablonski diagram. Ground state (S0), the two first excited states (S1 and S2) and the first excited triplet state, and correspondent vibrational modes, are represented in a simplified fashion. Absorption and the several photophysical deactivation processes are represented as arrows, indicating the changes in the molecule’s energy state.
Radiative transitions occur when an excited state molecule emits electromagnetic radiation as it returns
to the ground state. There are two different types of radiative transitions ‐ fluorescence and
phosphorescence. Fluorescence is the radiative emission from an excited state of the same spin
multiplicity as the ground state. Excitation to the S1 state of an organic molecule in solution might
40
therefore be followed by the emission of fluorescence accompanying the S1 S0 transition (Figure 1.16).
Since there is no change of spin multiplicity, the transition is spin‐allowed. In the absence of other
factors that might make the transition forbidden (orbital symmetry, for example), fluorescence is
strongly allowed with the result that it occurs on relatively fast timescales. Typical timescales lie in the
nanosecond (10‐8 ‐ 10‐9 s) range. If the spin multiplicity of the emitting state differs from that of the
ground state, the mission is referred to as phosphorescence. Thus, if the T1 state is populated by
intersystem crossing from the S1 state (or by any other means), the subsequent T1 S0 transition is spin
forbidden (Figure 1.16). Typical timescales for phosphorescence lie in the microsecond to second
range.[139]
Non‐radiative transitions involve the conversion of one molecular quantum state to another without
emission of radiation. In one sense, all transitions that do not yield emission are non‐radiative
transitions, including the removal of vibrational excitation by solvent molecules mentioned above.
However, the term non‐radiative will be used to imply an intramolecular photophysical process – a
transition that occurs between the quantum states of an individual molecule – without the need for
external perturbations such as collisions with other molecules. If radiative transitions are imagined to be
“vertical” due to Franck‐Condon principle, non‐radiative transitions are “horizontal”. The implication of a
horizontal transition is that it occurs between quantum states of the same energy. Two different types of
non‐radiative transitions can be identified according to the spin multiplicities of the participating states.
Internal conversion involves the transfer of population between electronic states of the same multiplicity
and intersystem crossing involves the transfer of population between states of different spin
multiplicity.[139]
Bi‐molecular processes (de‐excitation through quenching) involve the encounter and collision of the
excited state molecule and a second molecule, or quencher. A quenching process is defined as one which
competes with the spontaneous emission process and thereby shortens the lifetime of the emitting
molecule. Basically, these quenching reactions fall into one of the three main categories: energy transfer,
electron transfer or proton transfer.[138] These processes are widely studied and fascinating, but are also
out of the scope of this work.
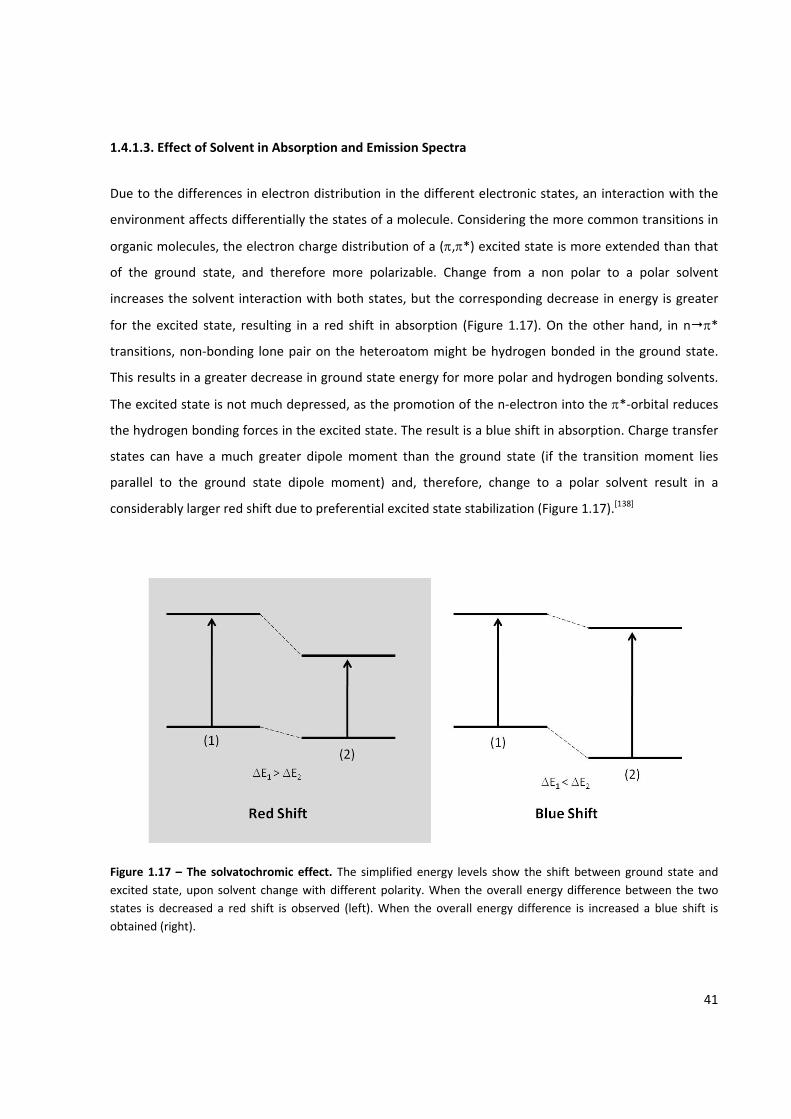
41
1.4.1.3. Effect of Solvent in Absorption and Emission Spectra
Due to the differences in electron distribution in the different electronic states, an interaction with the
environment affects differentially the states of a molecule. Considering the more common transitions in
organic molecules, the electron charge distribution of a (π,π*) excited state is more extended than that
of the ground state, and therefore more polarizable. Change from a non polar to a polar solvent
increases the solvent interaction with both states, but the corresponding decrease in energy is greater
for the excited state, resulting in a red shift in absorption (Figure 1.17). On the other hand, in n π*
transitions, non‐bonding lone pair on the heteroatom might be hydrogen bonded in the ground state.
This results in a greater decrease in ground state energy for more polar and hydrogen bonding solvents.
The excited state is not much depressed, as the promotion of the n‐electron into the π*‐orbital reduces
the hydrogen bonding forces in the excited state. The result is a blue shift in absorption. Charge transfer
states can have a much greater dipole moment than the ground state (if the transition moment lies
parallel to the ground state dipole moment) and, therefore, change to a polar solvent result in a
considerably larger red shift due to preferential excited state stabilization (Figure 1.17).[138]
Figure 1.17 – The solvatochromic effect. The simplified energy levels show the shift between ground state and excited state, upon solvent change with different polarity. When the overall energy difference between the two states is decreased a red shift is observed (left). When the overall energy difference is increased a blue shift is obtained (right).
42
1.4.1.4. Lifetime and Quantum Yield
If the radiative process is considered alone, after a concentration of electronically excited molecules,
[M*], is formed in the excited state, it decays to zero as a function of time due to the spontaneous
emission of radiation. Spontaneous emission is a random process, following first‐order kinetics:
Equation 6
i.e. the rate of removal of M* depends on the first power of [M*]. The rate coefficient kr0 characterizes
the rate of the spontaneous emission process and is determined by the nature and properties of the
emitting state. Integration of Equation 5 gives:
Equation 7
and hence the concentration of M* decays exponentially to zero from some initial concentration [M*]0
at t = 0. However, additional deactivating processes are generally present in organic molecules. If we
take as an example the existence of radiative, internal conversion and intersystem crossing processes,
the rate of decay of [M*] is given by:
Equation 8
where kf is the radiative rate constant, kIC is the internal conversion rate constant and kISC is the
intersystem crossing rate constant. The decay of [M*] still obeys first‐order kinetics:
Equation 9
The time that a population of molecules takes to decay [M*]0 to 1/e of its original value is called lifetime
(τ), and is defined as the reciprocal of the sum of all deactivating processes:
Equation 10
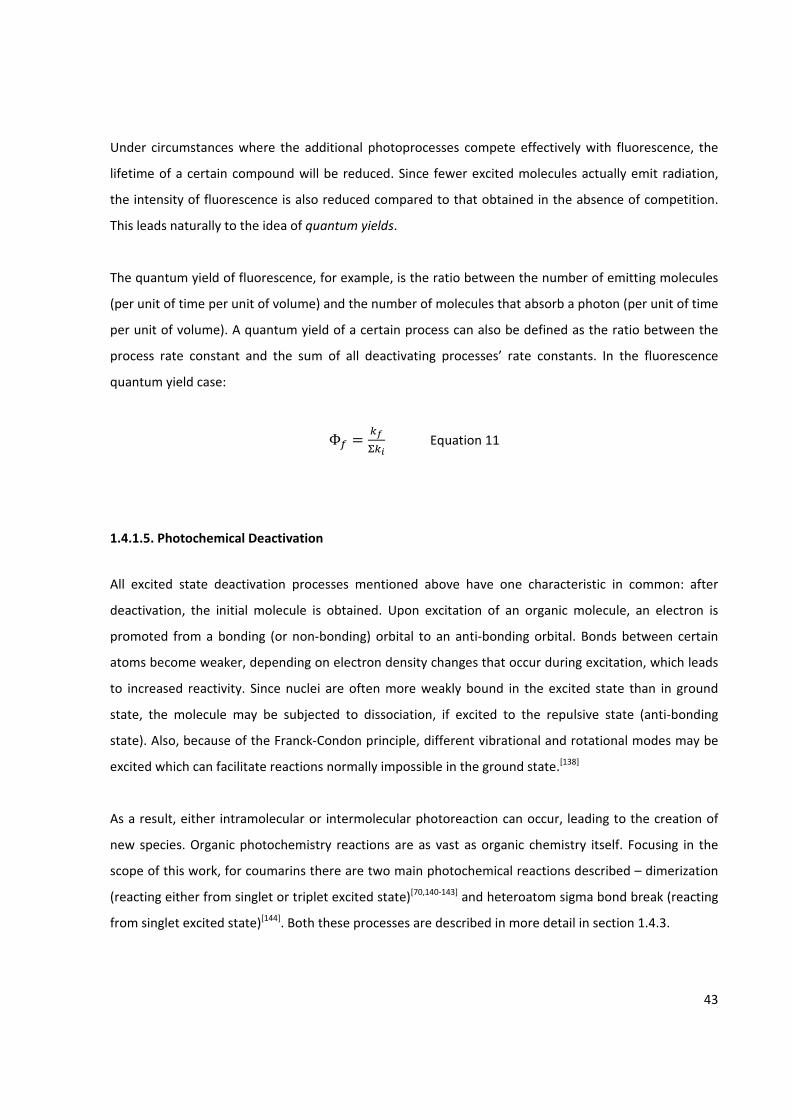
43
Under circumstances where the additional photoprocesses compete effectively with fluorescence, the
lifetime of a certain compound will be reduced. Since fewer excited molecules actually emit radiation,
the intensity of fluorescence is also reduced compared to that obtained in the absence of competition.
This leads naturally to the idea of quantum yields.
The quantum yield of fluorescence, for example, is the ratio between the number of emitting molecules
(per unit of time per unit of volume) and the number of molecules that absorb a photon (per unit of time
per unit of volume). A quantum yield of a certain process can also be defined as the ratio between the
process rate constant and the sum of all deactivating processes’ rate constants. In the fluorescence
quantum yield case:
Φ Equation 11
1.4.1.5. Photochemical Deactivation
All excited state deactivation processes mentioned above have one characteristic in common: after
deactivation, the initial molecule is obtained. Upon excitation of an organic molecule, an electron is
promoted from a bonding (or non‐bonding) orbital to an anti‐bonding orbital. Bonds between certain
atoms become weaker, depending on electron density changes that occur during excitation, which leads
to increased reactivity. Since nuclei are often more weakly bound in the excited state than in ground
state, the molecule may be subjected to dissociation, if excited to the repulsive state (anti‐bonding
state). Also, because of the Franck‐Condon principle, different vibrational and rotational modes may be
excited which can facilitate reactions normally impossible in the ground state.[138]
As a result, either intramolecular or intermolecular photoreaction can occur, leading to the creation of
new species. Organic photochemistry reactions are as vast as organic chemistry itself. Focusing in the
scope of this work, for coumarins there are two main photochemical reactions described – dimerization
(reacting either from singlet or triplet excited state)[70,140‐143] and heteroatom sigma bond break (reacting
from singlet excited state)[144]. Both these processes are described in more detail in section 1.4.3.
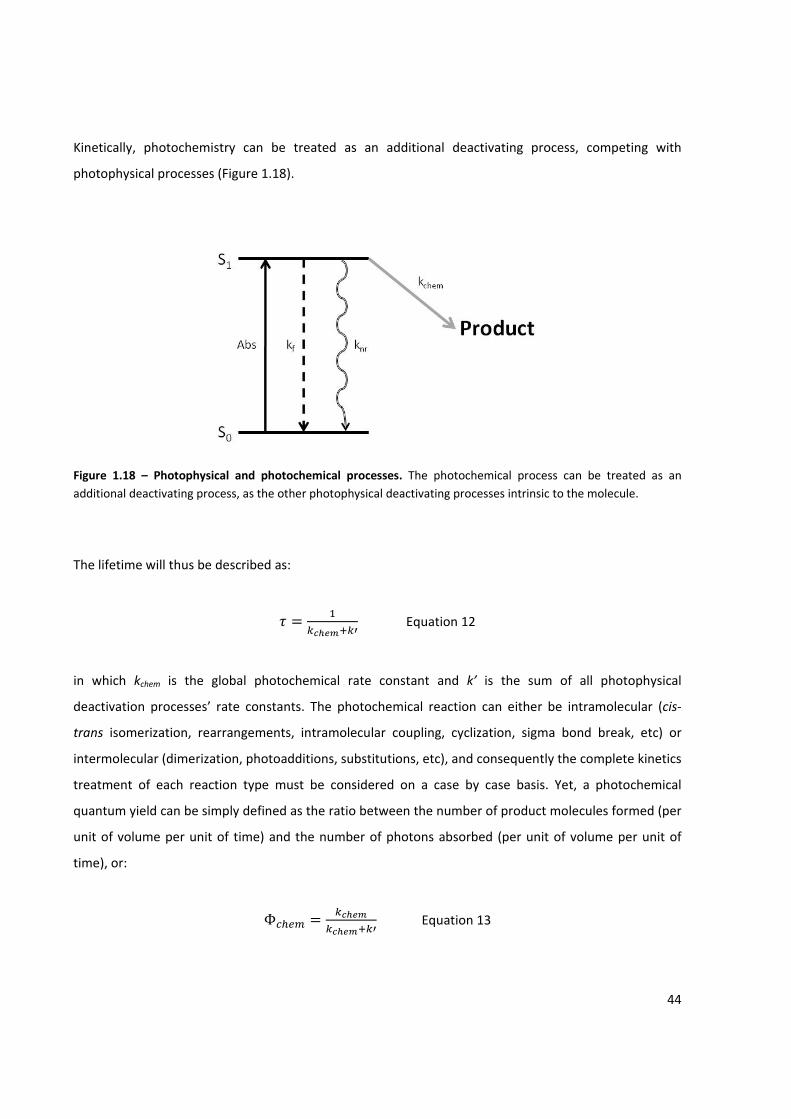
44
Kinetically, photochemistry can be treated as an additional deactivating process, competing with
photophysical processes (Figure 1.18).
Figure 1.18 – Photophysical and photochemical processes. The photochemical process can be treated as an additional deactivating process, as the other photophysical deactivating processes intrinsic to the molecule.
The lifetime will thus be described as:
Equation 12
in which kchem is the global photochemical rate constant and k’ is the sum of all photophysical
deactivation processes’ rate constants. The photochemical reaction can either be intramolecular (cis‐
trans isomerization, rearrangements, intramolecular coupling, cyclization, sigma bond break, etc) or
intermolecular (dimerization, photoadditions, substitutions, etc), and consequently the complete kinetics
treatment of each reaction type must be considered on a case by case basis. Yet, a photochemical
quantum yield can be simply defined as the ratio between the number of product molecules formed (per
unit of volume per unit of time) and the number of photons absorbed (per unit of volume per unit of
time), or:
Φ Equation 13
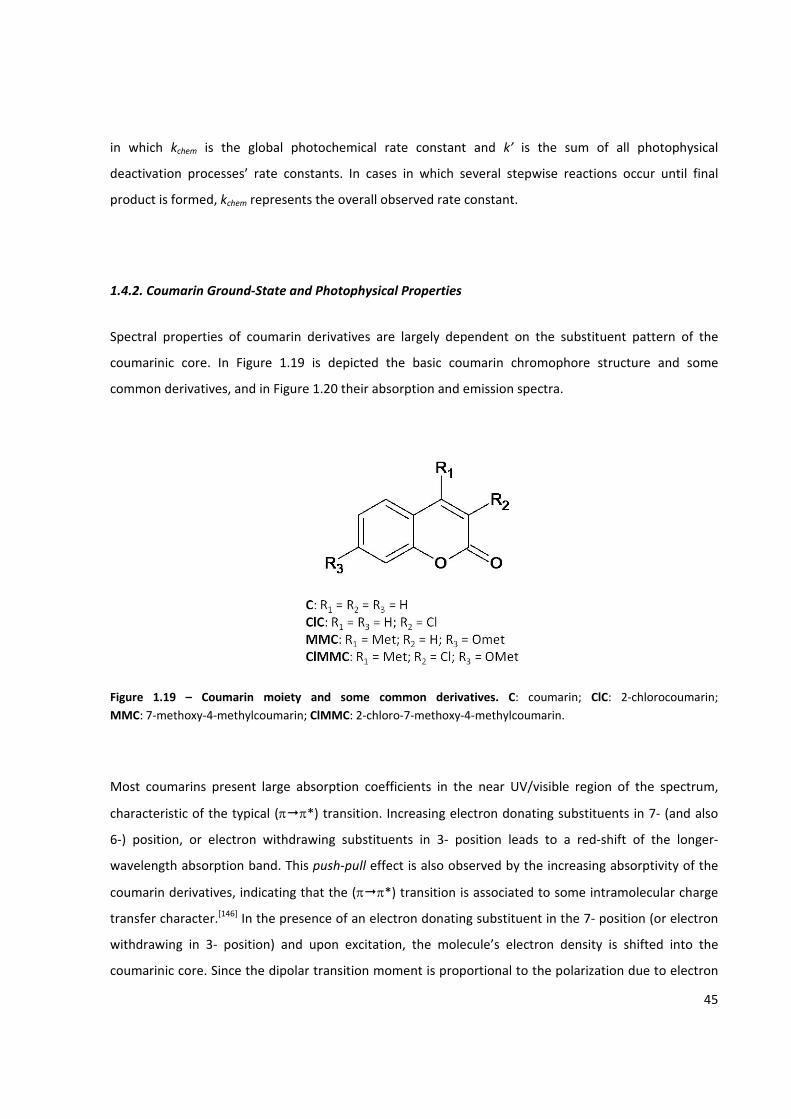
45
in which kchem is the global photochemical rate constant and k’ is the sum of all photophysical
deactivation processes’ rate constants. In cases in which several stepwise reactions occur until final
product is formed, kchem represents the overall observed rate constant.
1.4.2. Coumarin Ground‐State and Photophysical Properties
Spectral properties of coumarin derivatives are largely dependent on the substituent pattern of the
coumarinic core. In Figure 1.19 is depicted the basic coumarin chromophore structure and some
common derivatives, and in Figure 1.20 their absorption and emission spectra.
Figure 1.19 – Coumarin moiety and some common derivatives. C: coumarin; ClC: 2‐chlorocoumarin; MMC: 7‐methoxy‐4‐methylcoumarin; ClMMC: 2‐chloro‐7‐methoxy‐4‐methylcoumarin.
Most coumarins present large absorption coefficients in the near UV/visible region of the spectrum,
characteristic of the typical (π π*) transition. Increasing electron donating substituents in 7‐ (and also
6‐) position, or electron withdrawing substituents in 3‐ position leads to a red‐shift of the longer‐
wavelength absorption band. This push‐pull effect is also observed by the increasing absorptivity of the
coumarin derivatives, indicating that the (π π*) transition is associated to some intramolecular charge
transfer character.[146] In the presence of an electron donating substituent in the 7‐ position (or electron
withdrawing in 3‐ position) and upon excitation, the molecule’s electron density is shifted into the
coumarinic core. Since the dipolar transition moment is proportional to the polarization due to electron
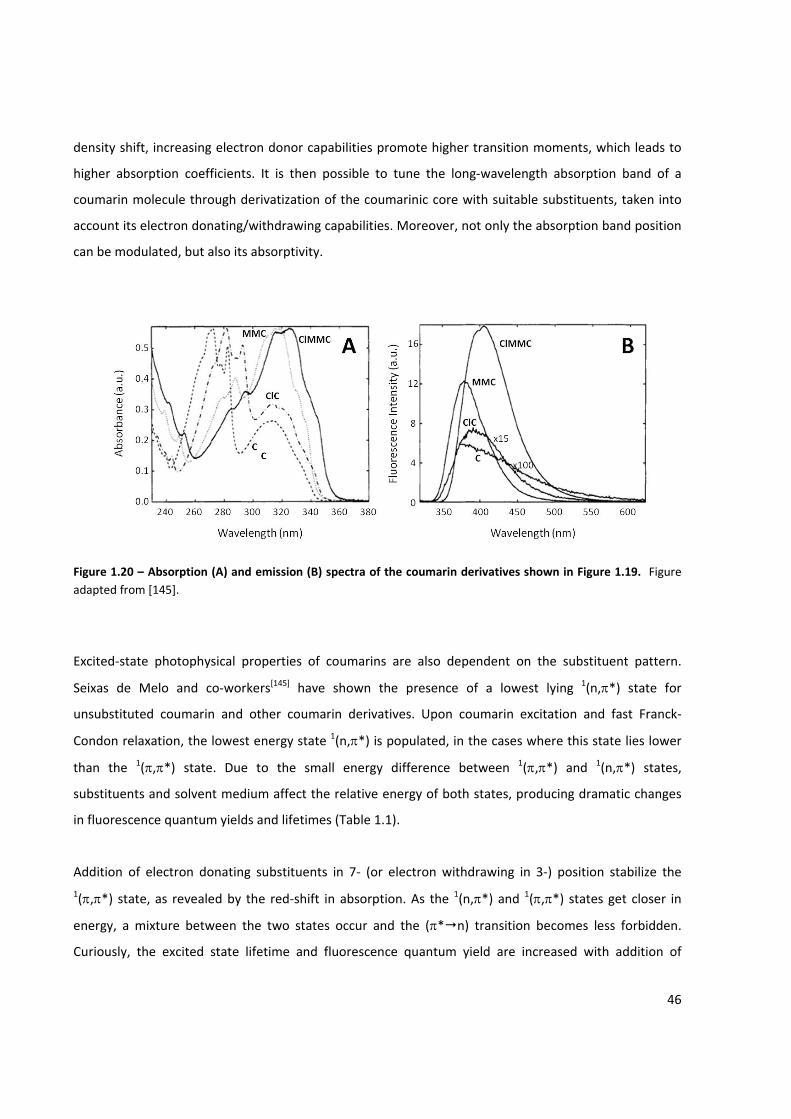
46
density shift, increasing electron donor capabilities promote higher transition moments, which leads to
higher absorption coefficients. It is then possible to tune the long‐wavelength absorption band of a
coumarin molecule through derivatization of the coumarinic core with suitable substituents, taken into
account its electron donating/withdrawing capabilities. Moreover, not only the absorption band position
can be modulated, but also its absorptivity.
Figure 1.20 – Absorption (A) and emission (B) spectra of the coumarin derivatives shown in Figure 1.19. Figure adapted from [145].
Excited‐state photophysical properties of coumarins are also dependent on the substituent pattern.
Seixas de Melo and co‐workers[145] have shown the presence of a lowest lying 1(n,π*) state for
unsubstituted coumarin and other coumarin derivatives. Upon coumarin excitation and fast Franck‐
Condon relaxation, the lowest energy state 1(n,π*) is populated, in the cases where this state lies lower
than the 1(π,π*) state. Due to the small energy difference between 1(π,π*) and 1(n,π*) states,
substituents and solvent medium affect the relative energy of both states, producing dramatic changes
in fluorescence quantum yields and lifetimes (Table 1.1).
Addition of electron donating substituents in 7‐ (or electron withdrawing in 3‐) position stabilize the
1(π,π*) state, as revealed by the red‐shift in absorption. As the 1(n,π*) and 1(π,π*) states get closer in
energy, a mixture between the two states occur and the (π* n) transition becomes less forbidden.
Curiously, the excited state lifetime and fluorescence quantum yield are increased with addition of
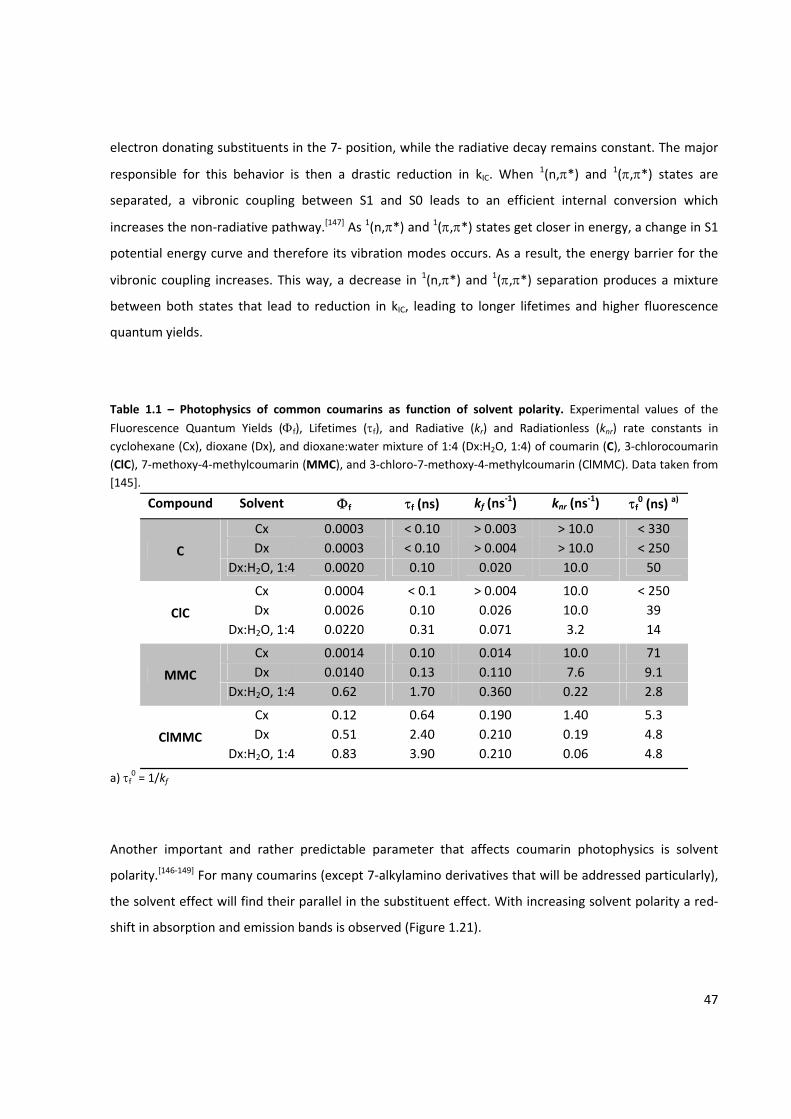
47
electron donating substituents in the 7‐ position, while the radiative decay remains constant. The major
responsible for this behavior is then a drastic reduction in kIC. When 1(n,π*) and 1(π,π*) states are
separated, a vibronic coupling between S1 and S0 leads to an efficient internal conversion which
increases the non‐radiative pathway.[147] As 1(n,π*) and 1(π,π*) states get closer in energy, a change in S1
potential energy curve and therefore its vibration modes occurs. As a result, the energy barrier for the
vibronic coupling increases. This way, a decrease in 1(n,π*) and 1(π,π*) separation produces a mixture
between both states that lead to reduction in kIC, leading to longer lifetimes and higher fluorescence
quantum yields.
Table 1.1 – Photophysics of common coumarins as function of solvent polarity. Experimental values of the
Fluorescence Quantum Yields (Φf), Lifetimes (τf), and Radiative (kr) and Radiationless (knr) rate constants in cyclohexane (Cx), dioxane (Dx), and dioxane:water mixture of 1:4 (Dx:H2O, 1:4) of coumarin (C), 3‐chlorocoumarin (ClC), 7‐methoxy‐4‐methylcoumarin (MMC), and 3‐chloro‐7‐methoxy‐4‐methylcoumarin (ClMMC). Data taken from [145].
Compound Solvent Φf τf (ns) kf (ns‐1) knr (ns
‐1) τf0 (ns) a)
C
Cx 0.0003 < 0.10 > 0.003 > 10.0 < 330 Dx 0.0003 < 0.10 > 0.004 > 10.0 < 250
Dx:H2O, 1:4 0.0020 0.10 0.020 10.0 50
ClC
Cx 0.0004 < 0.1 > 0.004 10.0 < 250 Dx 0.0026 0.10 0.026 10.0 39
Dx:H2O, 1:4 0.0220 0.31 0.071 3.2 14
MMC
Cx 0.0014 0.10 0.014 10.0 71 Dx 0.0140 0.13 0.110 7.6 9.1
Dx:H2O, 1:4 0.62 1.70 0.360 0.22 2.8
ClMMC
Cx 0.12 0.64 0.190 1.40 5.3 Dx 0.51 2.40 0.210 0.19 4.8
Dx:H2O, 1:4 0.83 3.90 0.210 0.06 4.8
a) τf0 = 1/kf
Another important and rather predictable parameter that affects coumarin photophysics is solvent
polarity.[146‐149] For many coumarins (except 7‐alkylamino derivatives that will be addressed particularly),
the solvent effect will find their parallel in the substituent effect. With increasing solvent polarity a red‐
shift in absorption and emission bands is observed (Figure 1.21).
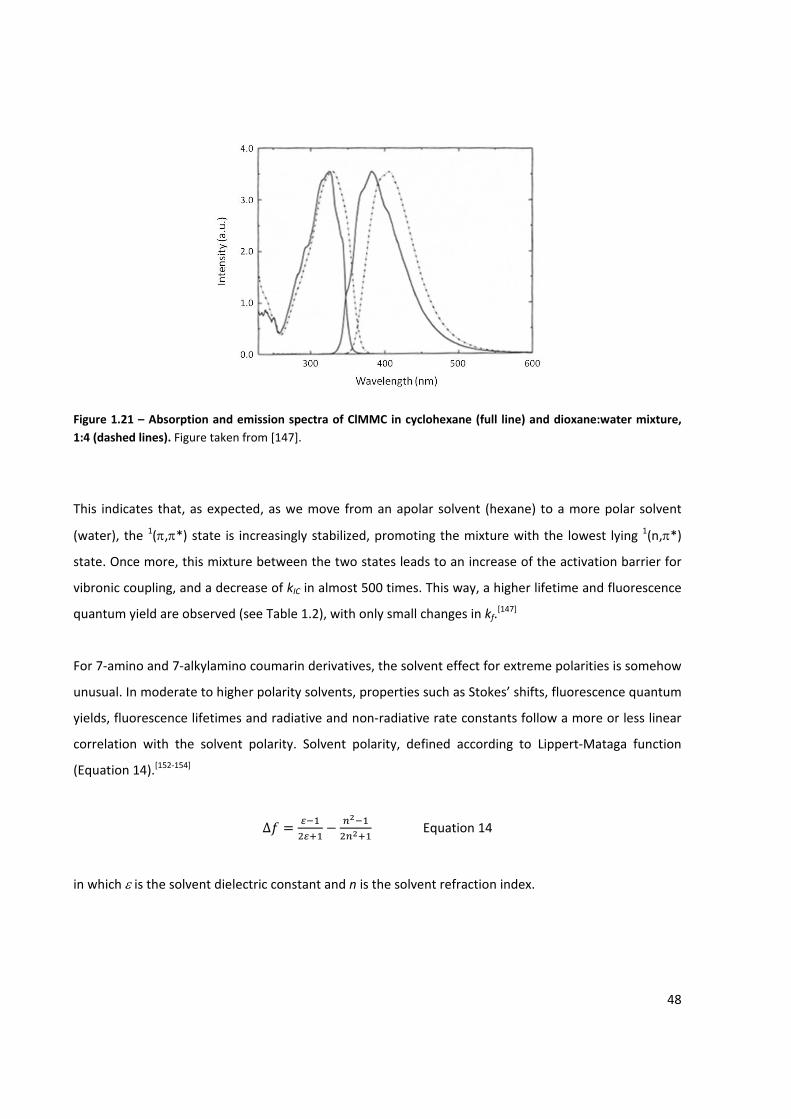
48
Figure 1.21 – Absorption and emission spectra of ClMMC in cyclohexane (full line) and dioxane:water mixture, 1:4 (dashed lines). Figure taken from [147].
This indicates that, as expected, as we move from an apolar solvent (hexane) to a more polar solvent
(water), the 1(π,π*) state is increasingly stabilized, promoting the mixture with the lowest lying 1(n,π*)
state. Once more, this mixture between the two states leads to an increase of the activation barrier for
vibronic coupling, and a decrease of kIC in almost 500 times. This way, a higher lifetime and fluorescence
quantum yield are observed (see Table 1.2), with only small changes in kf.[147]
For 7‐amino and 7‐alkylamino coumarin derivatives, the solvent effect for extreme polarities is somehow
unusual. In moderate to higher polarity solvents, properties such as Stokes’ shifts, fluorescence quantum
yields, fluorescence lifetimes and radiative and non‐radiative rate constants follow a more or less linear
correlation with the solvent polarity. Solvent polarity, defined according to Lippert‐Mataga function
(Equation 14).[152‐154]
Δ Equation 14
in which ε is the solvent dielectric constant and n is the solvent refraction index.
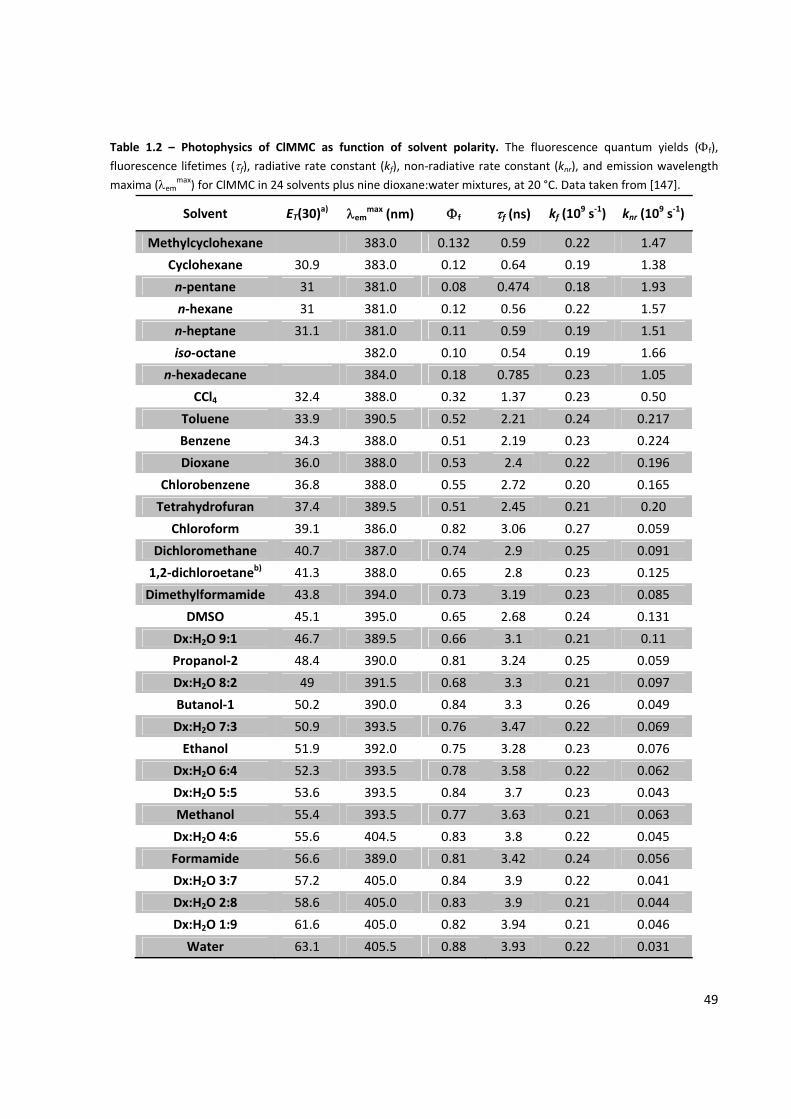
49
Table 1.2 – Photophysics of ClMMC as function of solvent polarity. The fluorescence quantum yields (Φf),
fluorescence lifetimes (τf), radiative rate constant (kf), non‐radiative rate constant (knr), and emission wavelength
maxima (λemmax) for ClMMC in 24 solvents plus nine dioxane:water mixtures, at 20 °C. Data taken from [147].
Solvent ET(30)a) λem
max (nm) Φf τf (ns) kf (109 s‐1) knr (10
9 s‐1)
Methylcyclohexane 383.0 0.132 0.59 0.22 1.47
Cyclohexane 30.9 383.0 0.12 0.64 0.19 1.38
n‐pentane 31 381.0 0.08 0.474 0.18 1.93
n‐hexane 31 381.0 0.12 0.56 0.22 1.57
n‐heptane 31.1 381.0 0.11 0.59 0.19 1.51
iso‐octane 382.0 0.10 0.54 0.19 1.66
n‐hexadecane 384.0 0.18 0.785 0.23 1.05
CCl4 32.4 388.0 0.32 1.37 0.23 0.50
Toluene 33.9 390.5 0.52 2.21 0.24 0.217
Benzene 34.3 388.0 0.51 2.19 0.23 0.224
Dioxane 36.0 388.0 0.53 2.4 0.22 0.196
Chlorobenzene 36.8 388.0 0.55 2.72 0.20 0.165
Tetrahydrofuran 37.4 389.5 0.51 2.45 0.21 0.20
Chloroform 39.1 386.0 0.82 3.06 0.27 0.059
Dichloromethane 40.7 387.0 0.74 2.9 0.25 0.091
1,2‐dichloroetaneb) 41.3 388.0 0.65 2.8 0.23 0.125
Dimethylformamide 43.8 394.0 0.73 3.19 0.23 0.085
DMSO 45.1 395.0 0.65 2.68 0.24 0.131
Dx:H2O 9:1 46.7 389.5 0.66 3.1 0.21 0.11
Propanol‐2 48.4 390.0 0.81 3.24 0.25 0.059
Dx:H2O 8:2 49 391.5 0.68 3.3 0.21 0.097
Butanol‐1 50.2 390.0 0.84 3.3 0.26 0.049
Dx:H2O 7:3 50.9 393.5 0.76 3.47 0.22 0.069
Ethanol 51.9 392.0 0.75 3.28 0.23 0.076
Dx:H2O 6:4 52.3 393.5 0.78 3.58 0.22 0.062
Dx:H2O 5:5 53.6 393.5 0.84 3.7 0.23 0.043
Methanol 55.4 393.5 0.77 3.63 0.21 0.063
Dx:H2O 4:6 55.6 404.5 0.83 3.8 0.22 0.045
Formamide 56.6 389.0 0.81 3.42 0.24 0.056
Dx:H2O 3:7 57.2 405.0 0.84 3.9 0.22 0.041
Dx:H2O 2:8 58.6 405.0 0.83 3.9 0.21 0.044
Dx:H2O 1:9 61.6 405.0 0.82 3.94 0.21 0.046
Water 63.1 405.5 0.88 3.93 0.22 0.031

50
a) ET(30) values dioxane:water mixtures were taken from [150]. All the others from [151]. b) For this particular solvent single exponential behavior was not found. Two component decay is obtained, being the lifetime obtained the one with the major contribution to the overall decay. DMSO ‐ Dimethylsulfoxide; CCl4 ‐ Carbon tetrachloride; Dx:H2O ‐ dioxane:water mixture.
In non polar solvents like cyclohexane, methylcyclohexane, 3‐methylpentane and decalin, however, all
the above‐mentioned properties show unusual deviation. Pal and co‐workers[148,149] found that 7‐amino‐
4‐methylcoumarin (ACM) presents decreased fluorescence quantum yields, accompanied by a decrease
in lifetime in the referred solvents. These authors suggest the presence of a fast non‐radiative
deactivation channel for the dye’s S1 state in these solvents, not related to intersystem crossing
processes. Comparing the absorption and fluorescence maxima and Stokes’ shifts in different solvents,
they have inferred that in moderate to higher polarity solvents, the dye exists in a planar intramolecular
charge transfer (ICT) configuration, whereas in non polar solvents the dye exists in non‐planar
configurations, with its 7‐NH2 group not participating in resonance with the coumarin moiety. Since in
the non‐planar configurations the ‐NH2 group is very flexible due to loss of some π character, it can
undergo flip‐flop motions and thereby coupled to the solvent modes to efficiently deactivate the excited
state. In other solvents, due to the ICT structure, the flexibility of the ‐NH2 group is strongly restricted,
and thus, the non‐radiative constant decreased (Figure 1.22‐A). This hypothesis would also explain the
flip‐flop mechanism temperature dependence. The same authors shown that substituting the ‐NH2 group
for a ‐ND2 analogue, the kIC is considerably decreased. Moreover, ethylamino‐ and diethylamino‐
analogues show opposite properties in non polar solvents[146] – higher fluorescence quantum yields and
longer lifetimes. They rationalize these observations by suggesting that increase in size/mass of the
amino substituents hampers the flip‐flop motion, increasing the activation energy barrier for vibronic
coupling, thus reducing non‐radiative deactivation (Figure 1.22‐B).[146]
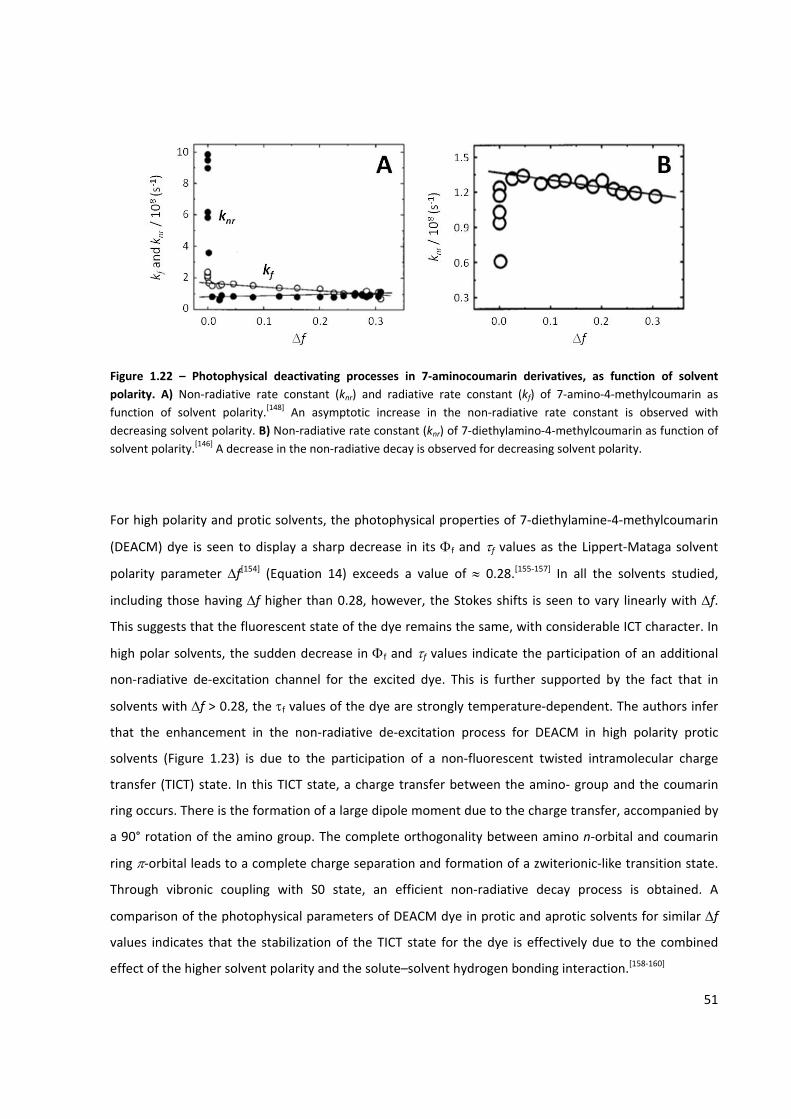
51
Figure 1.22 – Photophysical deactivating processes in 7‐aminocoumarin derivatives, as function of solvent polarity. A) Non‐radiative rate constant (knr) and radiative rate constant (kf) of 7‐amino‐4‐methylcoumarin as function of solvent polarity.[148] An asymptotic increase in the non‐radiative rate constant is observed with decreasing solvent polarity. B) Non‐radiative rate constant (knr) of 7‐diethylamino‐4‐methylcoumarin as function of solvent polarity.[146] A decrease in the non‐radiative decay is observed for decreasing solvent polarity.
For high polarity and protic solvents, the photophysical properties of 7‐diethylamine‐4‐methylcoumarin
(DEACM) dye is seen to display a sharp decrease in its Φf and τf values as the Lippert‐Mataga solvent
polarity parameter Δf[154] (Equation 14) exceeds a value of ≈ 0.28.[155‐157] In all the solvents studied,
including those having Δf higher than 0.28, however, the Stokes shifts is seen to vary linearly with Δf.
This suggests that the fluorescent state of the dye remains the same, with considerable ICT character. In
high polar solvents, the sudden decrease in Φf and τf values indicate the participation of an additional
non‐radiative de‐excitation channel for the excited dye. This is further supported by the fact that in
solvents with Δf > 0.28, the τf values of the dye are strongly temperature‐dependent. The authors infer
that the enhancement in the non‐radiative de‐excitation process for DEACM in high polarity protic
solvents (Figure 1.23) is due to the participation of a non‐fluorescent twisted intramolecular charge
transfer (TICT) state. In this TICT state, a charge transfer between the amino‐ group and the coumarin
ring occurs. There is the formation of a large dipole moment due to the charge transfer, accompanied by
a 90° rotation of the amino group. The complete orthogonality between amino n‐orbital and coumarin
ring π‐orbital leads to a complete charge separation and formation of a zwiterionic‐like transition state.
Through vibronic coupling with S0 state, an efficient non‐radiative decay process is obtained. A
comparison of the photophysical parameters of DEACM dye in protic and aprotic solvents for similar Δf
values indicates that the stabilization of the TICT state for the dye is effectively due to the combined
effect of the higher solvent polarity and the solute–solvent hydrogen bonding interaction.[158‐160]
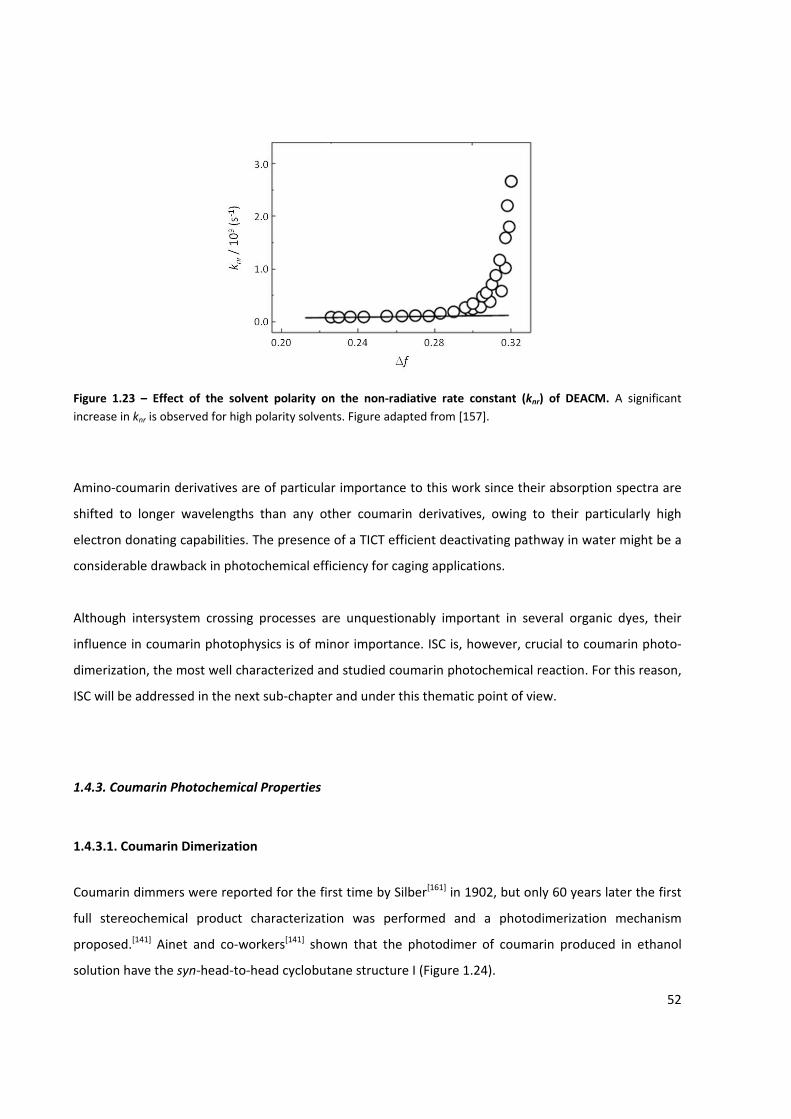
52
Figure 1.23 – Effect of the solvent polarity on the non‐radiative rate constant (knr) of DEACM. A significant increase in knr is observed for high polarity solvents. Figure adapted from [157].
Amino‐coumarin derivatives are of particular importance to this work since their absorption spectra are
shifted to longer wavelengths than any other coumarin derivatives, owing to their particularly high
electron donating capabilities. The presence of a TICT efficient deactivating pathway in water might be a
considerable drawback in photochemical efficiency for caging applications.
Although intersystem crossing processes are unquestionably important in several organic dyes, their
influence in coumarin photophysics is of minor importance. ISC is, however, crucial to coumarin photo‐
dimerization, the most well characterized and studied coumarin photochemical reaction. For this reason,
ISC will be addressed in the next sub‐chapter and under this thematic point of view.
1.4.3. Coumarin Photochemical Properties
1.4.3.1. Coumarin Dimerization
Coumarin dimmers were reported for the first time by Silber[161] in 1902, but only 60 years later the first
full stereochemical product characterization was performed and a photodimerization mechanism
proposed.[141] Ainet and co‐workers[141] shown that the photodimer of coumarin produced in ethanol
solution have the syn‐head‐to‐head cyclobutane structure I (Figure 1.24).
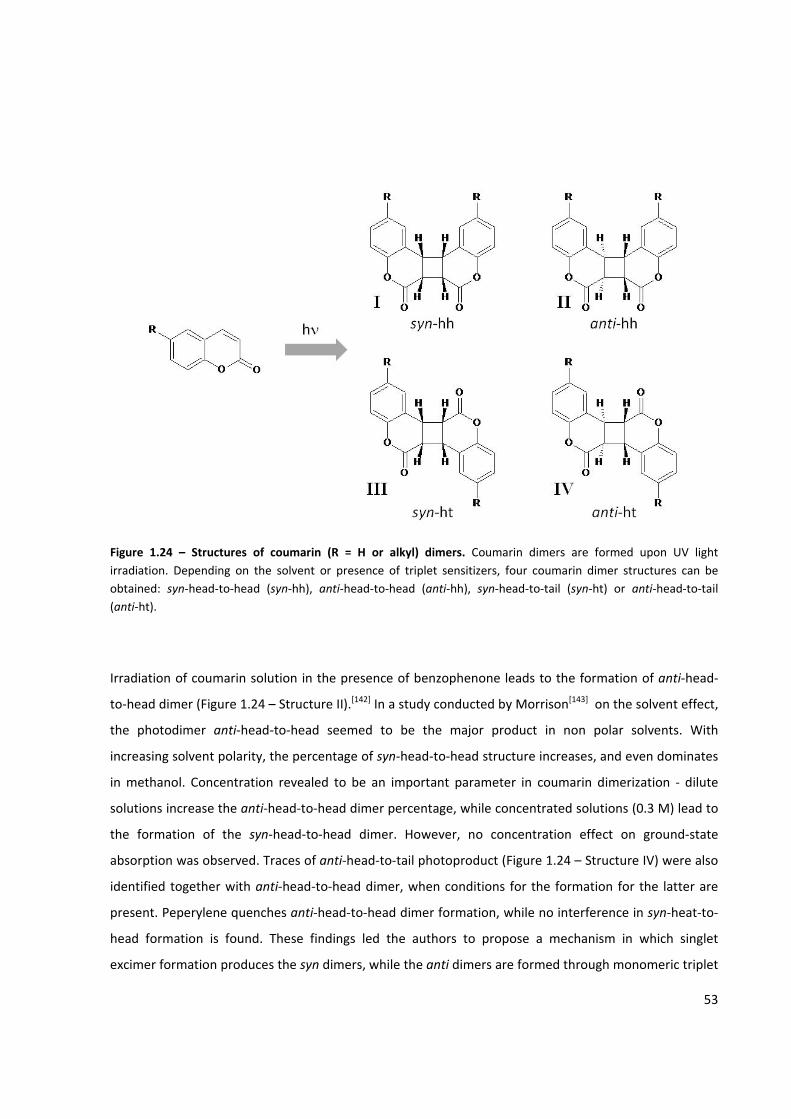
53
Figure 1.24 – Structures of coumarin (R = H or alkyl) dimers. Coumarin dimers are formed upon UV light irradiation. Depending on the solvent or presence of triplet sensitizers, four coumarin dimer structures can be obtained: syn‐head‐to‐head (syn‐hh), anti‐head‐to‐head (anti‐hh), syn‐head‐to‐tail (syn‐ht) or anti‐head‐to‐tail (anti‐ht).
Irradiation of coumarin solution in the presence of benzophenone leads to the formation of anti‐head‐
to‐head dimer (Figure 1.24 – Structure II).[142] In a study conducted by Morrison[143] on the solvent effect,
the photodimer anti‐head‐to‐head seemed to be the major product in non polar solvents. With
increasing solvent polarity, the percentage of syn‐head‐to‐head structure increases, and even dominates
in methanol. Concentration revealed to be an important parameter in coumarin dimerization ‐ dilute
solutions increase the anti‐head‐to‐head dimer percentage, while concentrated solutions (0.3 M) lead to
the formation of the syn‐head‐to‐head dimer. However, no concentration effect on ground‐state
absorption was observed. Traces of anti‐head‐to‐tail photoproduct (Figure 1.24 – Structure IV) were also
identified together with anti‐head‐to‐head dimer, when conditions for the formation for the latter are
present. Peperylene quenches anti‐head‐to‐head dimer formation, while no interference in syn‐heat‐to‐
head formation is found. These findings led the authors to propose a mechanism in which singlet
excimer formation produces the syn dimers, while the anti dimers are formed through monomeric triplet

54
state.[142,143] Polar solvents are able to enhance the stabilization of the highly polar excited state
coumarin, that in high concentrations form exciplexes. The exciplex geometry set up the exclusive
formation of syn‐head‐to‐head dimer. For non polar solvents excimer formation is disfavored, and dilute
solutions present a double effect. On one hand, lower concentrations decrease the bimolecular
encounter probability between S1 coumarin and a ground‐state one, and on the other hand decreases
triplet excited state coumarin quenching.[70] Works describing photodimerization of 6‐alkylcoumarin
derivatives led to higher dimerization yields, but qualitatively presented the same results.[140]
Cyclobutane coumarin dimers are formed through [2+2] cycloaddition between the C3‐C4 of two
coumarin molecules. In what our work is concerned, 4‐methylcoumarin derivatives will be used as
photolabile protecting groups which makes coumarin dimerization an important factor to consider. Will
4‐methylcoumarin derivatives present the same dimerization properties? Our first guess was that the 4‐
methyl group (with bulky leaving groups) would prevent such dimerization reaction. In a work presented
by Guo and co‐workers[162], Langmuir and Langmuir‐Schaefer (LS) films of two coumarin derivatives, 4‐
octadecyloxylcoumarin (4‐CMC18) and 7‐octadecyloxylcoumarin (7‐CMC18) were synthesized, and their
interfacial assemblies were investigated. Owing to the different substituent position of the long
octadecyloxy chain in the coumarin parent, the two compounds showed completely different behaviors
in the interfacial assemblies. While coumarin groups stacked in a face‐to‐face arrangement in 7‐CMC18
film, they stacked in a head‐to‐tail manner in 4‐CMC18 film. Furthermore, distinct properties of the
multilayer films were observed. It was revealed that a reversible [2+2] photodimerization and
photocleavage could be induced in the LS film of 7‐CMC18 under photo‐irradiation with UV light of 365
and 254 nm, respectively. No photodimerization occurred in the 4‐CMC18 film. However, some
coumarins derivatives like psolarens are also known to produce photodimers with thymine rings[163‐165]
through similar [2+2] cycloaddition. Kanne and co‐workers[165] present the dimerization of 4‐
methylpsolarens with thymine, mostly under the form of thymine‐psolaren‐thymine photodiadducts.
Although the monoadduct formation was also observed, the four different psoralens studied (TMP, HMT,
8‐MOP, and Pso) reveal that the predominant event is photoaddition at the 4‘,5‘ furan double bond. The
reaction is also extremely region‐ and stereo‐specific, yielding only cis‐syn structures, attributed to the
psolaren and thymine docking in high molecular weight double stranded DNA. At this point, we thought
that coumarin dimerization might be a relevant factor and a possible drawback in the system devised,
although intrinsic to it and unable to be overcome in a practical sense.
55
1.4.3.2. Esters of 4‐methylcoumarin Derivatives
In 1995, Furuta and co‐workers[166] introduced a 4‐methylcoumarin derivative (the 7‐methoxy ‐MCM) as
a caging group, where higher photochemical release yields and higher dark hydrolysis stability in
physiological medium were reported. In a latter work, the same authors studied the effect of halogen
substituents for two‐photon excitation applications.[68] Two relevant conclusions were taken: the first
was that 6‐bromo‐7‐hydroxy‐4‐methylcoumarin (Bhc) derivative presented high two‐photon absorption
cross section at 740 nm, suitable for in vivo applications; the second was that the substitution pattern
from 6‐chloro to 6‐bromo to 3,6,8‐tribromo increased the quantum yield of substrate release. Although
the mechanism of Bhc photolysis was not analyzed, experiments on the related 7‐methoxycoumarin‐4‐
ylmethyl diethylphosphate, taken together with the halogen substitution effect, lead the authors to
propose that the solvolysis occurs via the triplet state with a lifetime of about 1 μs (T.F., M. Kanehara,
and M. Iwamura, unpublished data)[68]. The experimental evidence for this proposed mechanism was
never published, probably due to the release in the same year of Schade’s work[167] on the “Deactivation
Behavior and Excited‐State Properties of (Coumarin‐4‐yl)methyl Derivatives”. This German group aimed
to clarify the photochemical cleavage mechanism of 4‐methylcoumarin derivatives, since they did not
believe that a triplet intermediate was present, that would lead to homolytic bond cleavage. Their
arguments were that no phosphorescence of these derivatives was observed, and that if a bi‐radical
intermediate was present, hydrogen atom abstraction from the solvent should be observed. They
observed that only 0.5% of the irradiation products were 7‐methoxy‐4‐methylcoumarin, which indicated
that the major photochemical pathway should occur through singlet state and non‐radicalar
intermediates.
The irradiation product of 4‐methylcoumarin phosphate esters derivatives are the corresponding free
phosphate and the 4‐methylhydroxycoumarin alcohol.[68,166,168,169] Schade and co‐workers[167] tried to
answer the question of whether the heterolytic bond cleavage proceeded through a photo‐SN1 or a
photosolvolysis. A photo‐SN1 reaction would involve the CH2‐PO bond breakage in the excited state, while
a photosolvolysis would involve water (or –OH) nucleophilic attack to the phosphorous atom, also in the
excited state. Water with O18 isotope was used as solvent in the photochemical reaction, yielding
exclusively the coumarin alcohol photoproduct with O18 isotope. From this experiment, and considering
the bi‐radical mechanism negligible, an ion‐pair 1[CM+ A‐] intermediate was postulated.[167] The following
mechanism was then proposed (Figure 1.25):
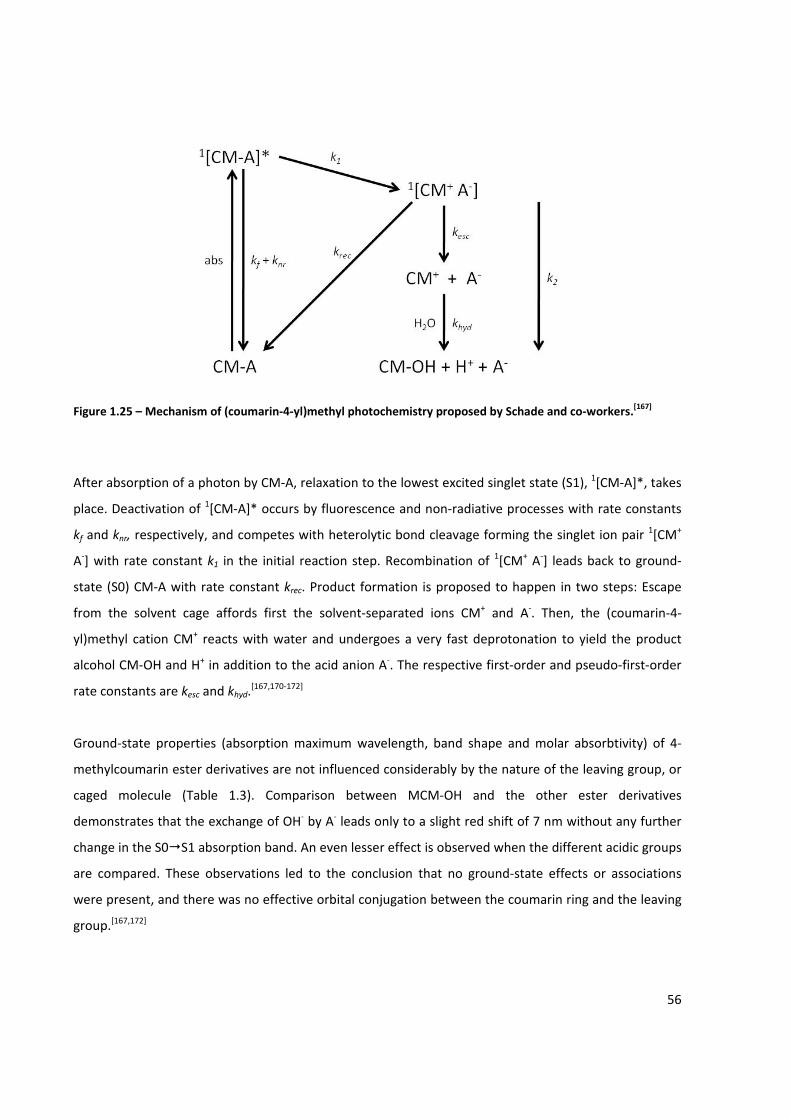
56
Figure 1.25 – Mechanism of (coumarin‐4‐yl)methyl photochemistry proposed by Schade and co‐workers.[167]
After absorption of a photon by CM‐A, relaxation to the lowest excited singlet state (S1), 1[CM‐A]*, takes
place. Deactivation of 1[CM‐A]* occurs by fluorescence and non‐radiative processes with rate constants
kf and knr, respectively, and competes with heterolytic bond cleavage forming the singlet ion pair 1[CM+
A‐] with rate constant k1 in the initial reaction step. Recombination of 1[CM+ A‐] leads back to ground‐
state (S0) CM‐A with rate constant krec. Product formation is proposed to happen in two steps: Escape
from the solvent cage affords first the solvent‐separated ions CM+ and A‐. Then, the (coumarin‐4‐
yl)methyl cation CM+ reacts with water and undergoes a very fast deprotonation to yield the product
alcohol CM‐OH and H+ in addition to the acid anion A‐. The respective first‐order and pseudo‐first‐order
rate constants are kesc and khyd.[167,170‐172]
Ground‐state properties (absorption maximum wavelength, band shape and molar absorbtivity) of 4‐
methylcoumarin ester derivatives are not influenced considerably by the nature of the leaving group, or
caged molecule (Table 1.3). Comparison between MCM‐OH and the other ester derivatives
demonstrates that the exchange of OH‐ by A‐ leads only to a slight red shift of 7 nm without any further
change in the S0 S1 absorption band. An even lesser effect is observed when the different acidic groups
are compared. These observations led to the conclusion that no ground‐state effects or associations
were present, and there was no effective orbital conjugation between the coumarin ring and the leaving
group.[167,172]
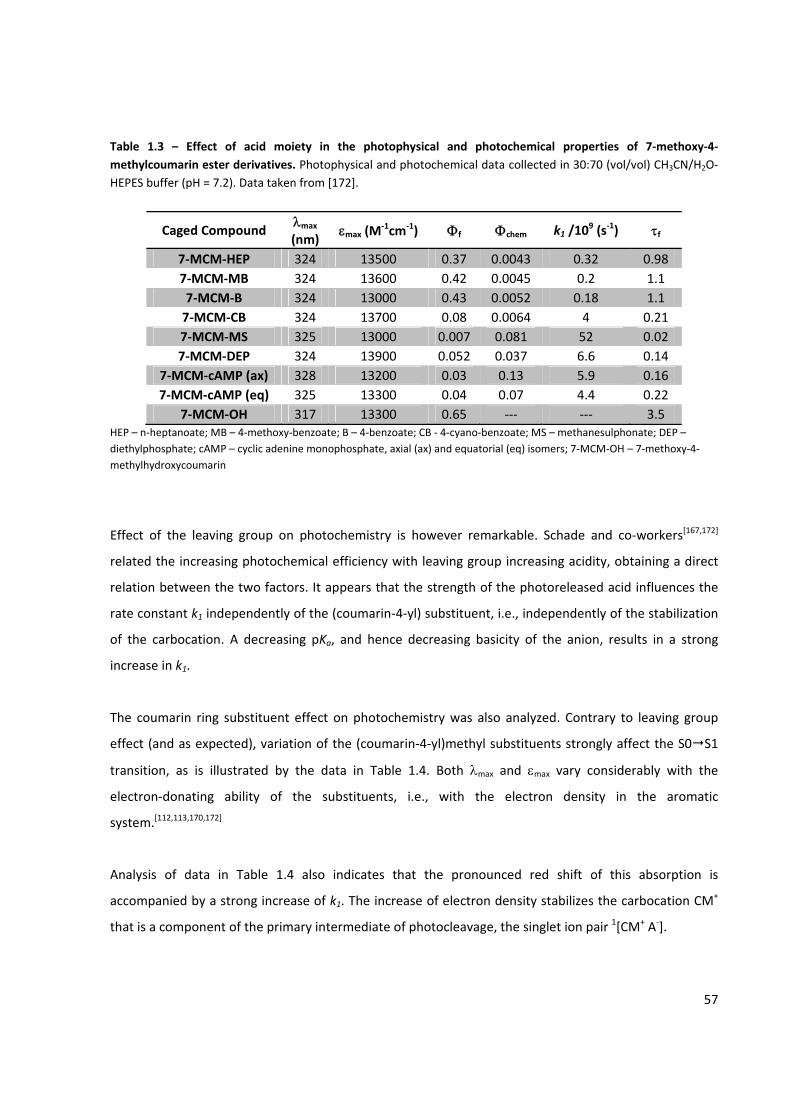
57
Table 1.3 – Effect of acid moiety in the photophysical and photochemical properties of 7‐methoxy‐4‐methylcoumarin ester derivatives. Photophysical and photochemical data collected in 30:70 (vol/vol) CH3CN/H2O‐HEPES buffer (pH = 7.2). Data taken from [172].
Caged Compound λmax (nm)
εmax (M‐1cm‐1) Φf Φchem k1 /10
9 (s‐1) τf
7‐MCM‐HEP 324 13500 0.37 0.0043 0.32 0.98 7‐MCM‐MB 324 13600 0.42 0.0045 0.2 1.1 7‐MCM‐B 324 13000 0.43 0.0052 0.18 1.1 7‐MCM‐CB 324 13700 0.08 0.0064 4 0.21 7‐MCM‐MS 325 13000 0.007 0.081 52 0.02 7‐MCM‐DEP 324 13900 0.052 0.037 6.6 0.14
7‐MCM‐cAMP (ax) 328 13200 0.03 0.13 5.9 0.16 7‐MCM‐cAMP (eq) 325 13300 0.04 0.07 4.4 0.22
7‐MCM‐OH 317 13300 0.65 ‐‐‐ ‐‐‐ 3.5 HEP – n‐heptanoate; MB – 4‐methoxy‐benzoate; B – 4‐benzoate; CB ‐ 4‐cyano‐benzoate; MS – methanesulphonate; DEP – diethylphosphate; cAMP – cyclic adenine monophosphate, axial (ax) and equatorial (eq) isomers; 7‐MCM‐OH – 7‐methoxy‐4‐methylhydroxycoumarin
Effect of the leaving group on photochemistry is however remarkable. Schade and co‐workers[167,172]
related the increasing photochemical efficiency with leaving group increasing acidity, obtaining a direct
relation between the two factors. It appears that the strength of the photoreleased acid influences the
rate constant k1 independently of the (coumarin‐4‐yl) substituent, i.e., independently of the stabilization
of the carbocation. A decreasing pKa, and hence decreasing basicity of the anion, results in a strong
increase in k1.
The coumarin ring substituent effect on photochemistry was also analyzed. Contrary to leaving group
effect (and as expected), variation of the (coumarin‐4‐yl)methyl substituents strongly affect the S0 S1
transition, as is illustrated by the data in Table 1.4. Both λmax and εmax vary considerably with the
electron‐donating ability of the substituents, i.e., with the electron density in the aromatic
system.[112,113,170,172]
Analysis of data in Table 1.4 also indicates that the pronounced red shift of this absorption is
accompanied by a strong increase of k1. The increase of electron density stabilizes the carbocation CM+
that is a component of the primary intermediate of photocleavage, the singlet ion pair 1[CM+ A‐].
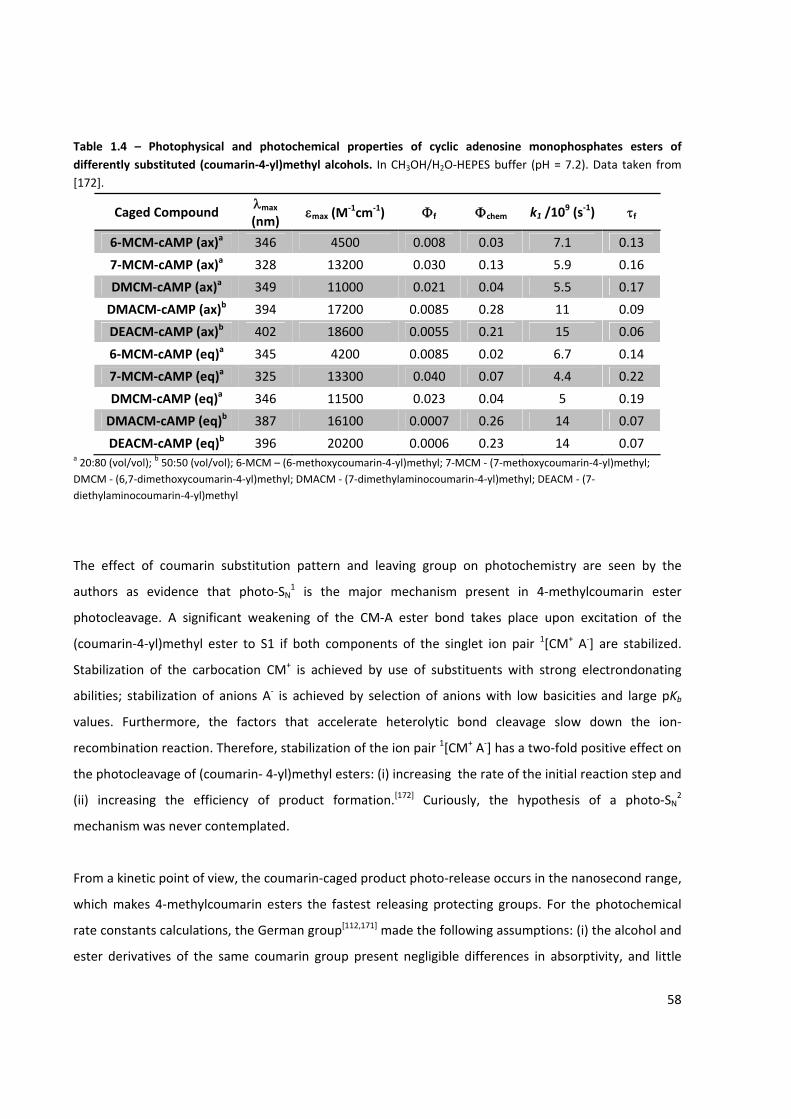
58
Table 1.4 – Photophysical and photochemical properties of cyclic adenosine monophosphates esters of differently substituted (coumarin‐4‐yl)methyl alcohols. In CH3OH/H2O‐HEPES buffer (pH = 7.2). Data taken from [172].
Caged Compound λmax (nm)
εmax (M‐1cm‐1) Φf Φchem k1 /10
9 (s‐1) τf
6‐MCM‐cAMP (ax)a 346 4500 0.008 0.03 7.1 0.13
7‐MCM‐cAMP (ax)a 328 13200 0.030 0.13 5.9 0.16
DMCM‐cAMP (ax)a 349 11000 0.021 0.04 5.5 0.17
DMACM‐cAMP (ax)b 394 17200 0.0085 0.28 11 0.09
DEACM‐cAMP (ax)b 402 18600 0.0055 0.21 15 0.06
6‐MCM‐cAMP (eq)a 345 4200 0.0085 0.02 6.7 0.14
7‐MCM‐cAMP (eq)a 325 13300 0.040 0.07 4.4 0.22
DMCM‐cAMP (eq)a 346 11500 0.023 0.04 5 0.19
DMACM‐cAMP (eq)b 387 16100 0.0007 0.26 14 0.07
DEACM‐cAMP (eq)b 396 20200 0.0006 0.23 14 0.07 a 20:80 (vol/vol); b 50:50 (vol/vol); 6‐MCM – (6‐methoxycoumarin‐4‐yl)methyl; 7‐MCM ‐ (7‐methoxycoumarin‐4‐yl)methyl; DMCM ‐ (6,7‐dimethoxycoumarin‐4‐yl)methyl; DMACM ‐ (7‐dimethylaminocoumarin‐4‐yl)methyl; DEACM ‐ (7‐diethylaminocoumarin‐4‐yl)methyl
The effect of coumarin substitution pattern and leaving group on photochemistry are seen by the
authors as evidence that photo‐SN1 is the major mechanism present in 4‐methylcoumarin ester
photocleavage. A significant weakening of the CM‐A ester bond takes place upon excitation of the
(coumarin‐4‐yl)methyl ester to S1 if both components of the singlet ion pair 1[CM+ A‐] are stabilized.
Stabilization of the carbocation CM+ is achieved by use of substituents with strong electrondonating
abilities; stabilization of anions A‐ is achieved by selection of anions with low basicities and large pKb
values. Furthermore, the factors that accelerate heterolytic bond cleavage slow down the ion‐
recombination reaction. Therefore, stabilization of the ion pair 1[CM+ A‐] has a two‐fold positive effect on
the photocleavage of (coumarin‐ 4‐yl)methyl esters: (i) increasing the rate of the initial reaction step and
(ii) increasing the efficiency of product formation.[172] Curiously, the hypothesis of a photo‐SN2
mechanism was never contemplated.
From a kinetic point of view, the coumarin‐caged product photo‐release occurs in the nanosecond range,
which makes 4‐methylcoumarin esters the fastest releasing protecting groups. For the photochemical
rate constants calculations, the German group[112,171] made the following assumptions: (i) the alcohol and
ester derivatives of the same coumarin group present negligible differences in absorptivity, and little

59
differences in absorption maximum wavelength, which indicates that radiative decay should be the same
for both derivatives, and thus, kfOH = kf
A = kf; (ii) the electronic conjugation decoupling between the
coumarin ring and leaving group indicates that the non‐radiative decay should also be the same for the
alcohol and ester derivatives, thus knrOH = knr
A = knr. Under these considerations, k1 values were
calculated, finding values between 109‐1010 s‐1. The kinetic separation between krec, kesc and khyd was not
possible with the available experimental data, so a global product formation k2 rate constant was
considered, and values between 108‐109 s‐1 were found, which showed that the rate limiting step in CM‐
A photochemistry is not the bond cleavage, but rather the ion effective separation and/or carbocation
solvatation. Additionally, H2O molecules present in the inner surface of the cage surrounding the ion pair
can act as potential reaction partners of Cou‐CH2+. Therefore, product formation could occur in
competition with recombination directly in the reaction of the Cou‐CH2+ cation with a neighboring water
molecule followed by a very fast deprotonation step; that is, the distinction between cage escape and
hydrolysis reaction could well be meaningless. Moreover, the German group stated that the H2O
concentration is 53 M, and at pH 7.4 (the pH value used for all their experiments) the OH‐ concentration
is 9 orders of magnitude smaller, and thus [OH‐] is not important for CM‐OH formation.
1.5. Light‐controlled Nucleic Acids Typewriter – an Overview
After thorough analysis, the final objective of the work here presented was to build a light controlled
nucleic acids typewriter in the following manner:
• Addition of a nucleotide will be impaired by the presence of a photolabile protecting group
• 4‐Methylcoumarin esters derivatives will be used to cage the nucleotides.
• After light irradiation, nucleotides will be released and incorporated in the growing DNA or RNA
strand.
• Each of the four nucleotides will be caged with a different coumarin, each coumarin presenting
different absorption spectrum.
• To select the nucleotide to be incorporated, the correspondent light wavelength should be used,
releasing specifically the desired nucleotide.
• To overcome the template dependency on DNA or RNA synthesis, the Terminal Nucleotidyl
Transferase will be used.
60
Albeit elegant, this approach still presented some problems (even considering that everything went
according to plan). After almost 5 years, and several proof‐of‐concept accomplished, some of these
problems continue to lack a completely satisfactory solution. The first question regards the spectral
separation between four different absorbing caging groups, and their existence. At what extend
coumarin absorption can be shifted towards the visible region of the spectrum? Also, will the different
absorption bands be separated enough in order to avoid cross‐excitation during irradiation? Another
question is that, even if TdT Polymerase could be successfully applied to a template‐independent DNA or
RNA synthesis, how can we control the addition of a single nucleotide in n strands after releasing n
nucleotides in solution?
In 2009, Lee and co‐workers[123] published a review entitled “Illuminating the Chemistry of Life: Design,
Synthesis, and Applications of “Caged” and Related Photoresponsive Compounds”. In this paper, in the
final recent advances chapter, the following consideration is found:
“Kinesins are motor proteins that employ ATPase activity to move along microtubules. (…) In
short, it is now possible to both initiate and halt kinesin trafficking. However, this work, as well as
others using light to initiate and terminate a biochemical process, highlights a limitation in
current caging technology: it is difficult to distinguish between photocleavable groups on the
basis of wavelength. Unlike the azobenzene series, in which the cis and trans isomers display a
well‐resolved response to different wavelengths, the overwhelming majority of photocleavable
caging groups respond to light in a relatively narrow range of 320–370 nm. In the absence of two
or more photophysically distinct caging agents, it is challenging to place multiple reagents under
separate photochemical control. Photophysically distinct caging groups could be used to create
light‐activatable biochemical activators and inhibitors that are sensitive to different wavelengths,
thereby enabling the investigator to control, for example, both the initiation and termination of a
biochemical pathway in a single experiment. Although the wavelength‐controlled photolysis of
two photosensitive protecting groups has been described in nonbiological systems, one of these
groups, a benzoin derivative, suffers photocleavage at a wavelength (254 nm) much too short to
be biologically useful. In addition to this limitation, it may be experimentally desirable to
separately control three or more caged compounds in a wavelength‐sensitive fashion. This will
require both the appropriate instrumentation (a tunable laser or a combination of bandpass
filters) and a toolkit of wavelength‐distinctive caging agents. (…) In short, it is important to keep
61
in mind that, for any caging group, there will be a minimum amount of energy required to effect
efficient photocleavage. Consequently, extending the light absorbance wavelength of the caging
group by conjugation could very well produce a species that fails to undergo photolysis. On the
other hand, and in marked contrast to the nitrobenzyl family, a long wavelength absorbing (400
nm) coumarin caging group has been described that undergoes efficient photorelease.”
Six months later, Kotzur and their German co‐workers[173] published a work in which 2‐nitrobenzyl and a
coumarin were used to peptide release with binary wavelength irradiation. This was the same time as
this project was exploring the dual coumarin light activated logic gates. Apparently, the scientific
community has been interested in these questions.
However, back in 2005 the feeling was rather different. As one of my supervisors so eloquently put it ‐
“This is never going to work…, let’s try it!”

62
63
CHAPTER 2. Materials and Methods
Consistency is the last refuge of the unimaginative.
Oscar Wilde
64
2.1. General Information
All chemicals were purchased from Sigma Aldrich in the highest purity available and used without further
purification. All oligonucleotides were purchased from STAB Vida (Lisbon, Portugal). The 1H‐NMR spectra
at 298.0 K were obtained on a Bruker AMX400 operating at 400.13 MHz. The ESI mass spectra were run
on a Platform II spectrometer from Micromass. All spectroscopic measurements and irradiations were
performed in 3 mL quartz fluorescence cuvettes (1 cm optical path) at 21°C, unless otherwise stated.
Absorption spectra were recorded on a Varian Cary Bio 100 UV‐Visible spectrophotometer. Fluorescence
measurements of aerated solutions were performed on a Horiba‐Jobin‐Yvon SPEX Fluorolog 3.22
spectrofluorimeter. All emission spectra were collected with 1.5 nm slit bandwidth for excitation and
emission, with correction files.
2.2. Synthesis of Coumarin Derivatives
2.2.1. Synthesis of 7‐diethylamino‐4‐methylhydroxycoumarin (DEACM‐OH)
The 7‐diethylamino‐4‐methylcoumarin (Coumarin 1; 20 mmol; 4.63 g) were dissolved in 120 mL of
p‐xylene and heated until full coumarin dissolution. Selenium dioxide (SeO2; 30 mmol; 3.33 g) was added
to the mixture. The reaction was refluxed under vigorous stirring for 25 hours. p‐Xylene was evaporated
from the brownish heterogeneous mixture. The mixture was resuspended in ethanol, filtered and
washed twice with diatomaceous earth to remove precipitated selenium oxide. The filtrate volume was
reduced to 130 mL by evaporation and sodium borohydride was added to the solution (NaBH4; 10 mmol;
380 mg). The reaction was stirred at room temperature for 5 hours. The reaction was stopped with 20
mL of hydrochloric acid 1 M, diluted with water and extracted three times with dichloromethane. The
combined organic phases were washed with water, brine and dried with magnesium sulphate. The
mixture was filtrated and solvent evaporated, yielding brown oil. The DEACM‐OH was purified by flash
chromatography (Rf = 0.3; CH2Cl2/acetone 5:1) and a yellow solid was attained after solvent evaporation.
A maximum final yield of 46% was attained.
65
DEACM‐OH was further re‐crystallized for photochemical studies dissolving the solid in minimum amount
of hot dichloromethane and pouring the solution into hexane. The product precipitated as a fine yellow
powder.
For DEACM‐OH, 1H‐NMR (400 MHz, CDCl3) δ/ppm 7.32 (d, J = 9.2 Hz, 1H, H5), δ 6.56 (d, J = 9.2 Hz, 1H,
H6), δ 6.50 (s, 1H, H8), δ 4.83 (d, J = 5.6 Hz, 2H, CH2‐OH), δ 3.40 (q, J = 7.2 Hz, 2H, N‐CH2‐CH3), δ 1.19 (t, J
= 6.8 Hz, 3H, N‐CH2‐CH3); MS (ESI+) m/z [M+H]+ = 248.3; calculated for C14H18NO3 248.30.
2.2.2. Synthesis of [7‐diethylaminocoumarin‐4‐yl]methyl di‐tert‐butyl phosphate (DEACM‐tBut)
The DEACM‐OH (3 mmol; 657 mg) was dissolved in 60 mL of THF (dried in Na/benzophenone and freshly
destilled). 1H‐Tetrazole (0.45 M in acetonitrile; 12 mmol; 26.7 mL) was added and the mixture cooled to
‐20°C (with a calcium chloride and ice bath). The di‐tert‐butyl‐N,N’‐diethylaminophosphoramoidite was
added to the mixture drop‐wise. The reaction proceeded under stirring and argon. After 2 hours the
reaction was allowed to warm up to 4°C and reacted for one hour. The reaction was allowed to warm up
at room temperature and reacted for another hour. The orange solution was cooled again to 4°C and
triethylamine (36 mmol; 5.01 mL) was added, followed by addition of tert‐butyl‐hydroperoxyde (70%
solution in water; 24 mmol; 2.33 mL). After 10 minutes at 4°C the reaction mixture was allowed to warm
up to room temperature. After 3 hours, 90 mL of a saturated tiosulfate aqueous solution was added and
the mixture diluted with ethyl acetate (120 mL). The aqueous phase was extracted twice with ethyl
acetate. The combined organic phases were washed with water, brine and the solvent evaporated. A
brownish‐yellow oil was commonly obtained. Resuspending the oil in dichlorometane or acetone and
evaporate yielded a yellow solid, with a final yield of 74%. All the procedures were executed under dim
or red light, and all vessels were covered in aluminum foil to protect from light exposure.
For DEACM‐tBut, TLC (Et2O): Rf = 0.3; 1H‐NMR (400MHz, CDCl3, heteronuclear coupled): δ/ppm 7,32 (s,
1H, H5), δ 6,67 (m, 1H, H6), δ 6,59 (s, 1H, H8), δ 6,28 (s, 1H, H3), δ 5,12 (d, J = 6,0 Hz, CH2‐O), δ 3,42 (q, J =
7,1 Hz, 4H, N‐CH2CH3), δ 1,51 (s, 18H, H(t‐but)), δ 1,21 (t, J = 7,1 Hz, 6H, N‐CH2CH3); 31P‐NMR (161 MHz,
CDCl3, heteronuclear decoupled): δ/ppm ‐9,49 (s); MS (EI,+): m/z (%) 441 (50) [MH]+, 327 (50) [M‐(t‐
But)]+, 57 (75) [(t‐But)]+.
66
2.2.3. Synthesis of [7‐diethylaminocoumarin‐4‐yl]methyl phosphate (DEACM‐P)
The DEACM‐tBut (3 mmol; 1.23 g) was dissolved in 20 mL of anhydrous dichloromethane and cooled at
4°C. Trifluoracetic acid (16.5 mmol; 1.25 mL) was added drop‐wise, and the reaction was carried out
under stirring for 6 hours. The mixture was poured into ice‐cold hexane (25 mL) and a brownish oil
precipitated. The mixture was centrifuged and the supernatant removed. Acetone was added to the
dichloromethane wet residue and a turbid solution with a yellow precipitate was attained. After solvent
evaporation the yellow compact powder product was obtained with an 89% yield.
For DEACM‐P, 1H‐NMR (400 MHz, D2O, heteronuclear coupled) δ 7.86 (d, J = 8.4 Hz, 1H, H5), δ 7.60 (s,
1H, H8), δ 7.45 (d, J = 8.0 Hz, 1H, H6), δ 6.72 (s, 1H, H3), δ 5.13 (d, J = 7.2 Hz, 2H, CH2‐O‐P), δ 3.62 (q, J =
7.2 Hz, 2H, N‐CH2‐CH3), δ 1.04 (t, J = 6.8 Hz, 3H, N‐CH2‐CH3).
2.2.4. Synthesis of P3‐[7‐diethylaminocoumarin‐4‐yl]methyl adenosine 5’‐triphosphate
(DEACM‐ATP)
For the coupling reaction of DEACM‐P and ADP precursor, the ADP nucleotide had to be “activated”. The
first step was to obtain the fully protonated ADP form. A Dowex 50W‐X8 (Na+) resin (6 g) was washed
with water and treated with a hydrochloride acid solution (1 M; 20 mL). A chromatography column was
filled with the acidified resin and washed with miliQ water (18 mΩ) until the filtrate was at neutral pH.
The commercial disodium ADP (70 mg) was dissolved in the least amount of miliQ water possible
(between 1.5 – 2 mL). The nucleotide solution was filtered through the resin column at low flux. Aliquots
were analyzed through UV spectroscopy in order to detect the presence of (H+)ADP. The acidified
nucleotide aliquots were lyophilized and a cotton‐like white powder was obtained.
The acidified ADP (0.14 mmol; 61.3 mg) was diluted in hexamethylphosphoramide (HMPA; 2.5 mL) and a
heterogeneous white mixture was formed. Tri‐n‐octylamine (0.24 mmol; 70.05 μL) was added to the
mixture and heated to 80°C for 4 minutes. The solution became clear and the solution was brought to
room temperature. Carbonyldiimidazole (0.48 mmol; 93.26 mg) was dissolved in 1 mL of HMPA and
added to the nucleotide solution. The mixture was stirred at room temperature for 18 hours.
67
The DEACM‐P (0.1 mmol; 28.7 mg) was diluted in a methanol/ethanol solution (1:1, dried under
molecular sieves), and tributylamine (0.1 mmol; 22.78 μL) was added. The solvent was evaporated. The
activated nucleotide solution was transferred to the DEACM‐P reaction vessel, resuspended and stirred
at room temperature and under argon for 4 days.
A Hitachi‐Merck HPLC L6200A Pump with an L‐4500 Diode Array Detector using a Polystirene‐
Divinylbenzene (PLRP‐S, Polymer Labs) semi‐preparative column (7.4 mm x 15 mm, 8 µm, 300 Å) was
employed for separation and purification of DCEAM‐ATP. Eluent A was triethylammonium acetate buffer
in water, 5 mM, pH 6.9; eluent B was methanol. Semi‐preparative gradient started with 20 min at 30% of
B in A; with an increase to 100% B after 21 min, and finished after 26 min at 100% of B. Separations were
run at a flow rate of 3 mL/min and the column temperature was 35°C. A final DEACM‐ATP yield of circa
20% was estimated. After peak separation and collection, samples were lyophilized, resuspended in
water and stored in the dark at ‐20°C. A purity of >95% was determined by HPLC. All solutions were
protected from light and DEACM‐ATP manipulations were made under dim or red‐light illumination.
For DEACM‐ATP, 1H‐NMR (400 MHz, D2O, heteronuclear decoupled): δ/ppm 8.12 (Ade‐H6), δ 7.91 (Ade‐
H1), δ 7.10 (H5), δ 7.01 (H8), δ 6.38 (H6), δ 6.19 (Ade‐NH2), δ 5.68 (CH2‐O), δ 4.30 – 4.17 (ribose), δ 3.09
(N‐CH2‐CH3), δ 1.16 (N‐CH2‐CH3).
2.2.5. Synthesis of 7‐methoxy‐4‐methylhydroxycoumarin (MCM‐OH)
The 7‐methoxy‐4‐methylbromocoumarin (372 μmol; 100 mg) and sodium acetate (4.06 mmol; 333 mg)
were dissolved in acetic anhydride (2.5 mL) and refluxed for 2 hours. The reactants were insoluble at
room temperature and complete dissolution was observed when reflux temperature was reached. After
cooling a precipitate was formed, filtered and washed in acetic anhydride. The filtrate was resuspended
in ethanol/acetic acid (37%) 1:1 mixture. The mixture was refluxed for 1 hour. The filtrate was only
completely dissolved at reflux temperature. The reaction mixture was kept at 4°C over night to allow for
product precipitation. The precipitate was filtered and washed with water, obtaining a product as white
soft needles, with a final yield of 71%.
68
For MCM‐OH, 1H‐NMR (400 MHz, CDCl3) δ 7.43 (d, J = 4.8 Hz, 1H, H5), δ 6.86 (d, J = 2.8 Hz, 1H, H6), δ 6.85
(s, 1H, H8), δ 6.47 (s, 1H, H3), δ 4.88 (s, 2H, CH2‐OH), δ 3.88 (s, 3H, O‐CH3); MS (EI,+): m/z (%) 206.05
(100), [MH]+, calc. 206.20.
2.2.6. Synthesis of [7‐methoxycoumarin‐4‐yl]methyl di‐tert‐butyl phosphate (MCM‐tBut)
The 7‐methoxy‐4‐hydroxymethylcoumarin (0.97 mmol; 200 mg) was dissolved in a THF (20 mL) dried
with sodium and acetonitrile (4 mL) dried under sieves. 1H‐tetrazole (0.45 M solution in acetonitrile; 4
mmol; 8.8 mL) was added and the mixture was cooled to ‐20°C (ice and calcium chloride mixture), where
di‐tert‐butyl‐N,N’‐diethylaminophosphoramidoite (1.5 mmol; 420 μL) was added dropwise under stirring.
The mixture was allowed to slowly warm up for 2 hours. The reaction was transferred to an ice bath and
allowed to react for an additional 4 hours, when it was warmed up to room temperature for an extra
hour. The reaction was treated with triethylamine (1.58 mL) and cooled at 0°C, where
tert‐butylhydroperoxyde (70% solution in water, 780 μL) was added. The mixture was warmed up to
room temperature and allowed to react for 3 hours. The mixture was extracted with ethyl acetate and
the organic phase was washed with water, brine, dried with magnesium sulfate and the solvent removed
under vacuum. The product was obtained as a yellow powder with a yield of 50%.
For MCM‐tBut, 1H‐NMR (400 MHz, CDCl3, heteronuclear decoupled): δ/ppm 7.41 (d, J = 7.6 Hz, 1H, H5), δ
6.84 (s, 1H, H8), δ 6.81 (d, J = 10.4 Hz, 1H, H6), δ 6.49 (s, 1H, H3), δ 4.85 (s, 3H, CH3‐O), δ 3.85 (d, J = 5.2
Hz, 2H, CH2‐O), δ 3.09 (q, J = 7.2 Hz, 18H, H(t‐but)); 31P‐NMR (161 MHz, CDCl3, heternuclear decoupled):
δ/ppm ‐9,64 (s).
2.2.7. Synthesis of [7‐methoxycoumarin‐4‐yl]phosphate (MCM‐P)
The MCM‐tBut (0.7 mmol; 279 mg) was dissolved in dichloromethane (4 mL) and cooled at 4°C.
Trifluoroacetic acid (4 mmol; 300 μL) was added dropwise under stirring. The mixture was allowed to
react for 6 hours. Ice‐cold hexane (10 mL) was added to the mixture and brownish oil was precipitated.
The oil was decanted, washed with ice‐cold hexane (10 mL). After decantation, the oil was dried under
vacuum and resuspended in acetone. After new cycle of solvent removal, a yellow‐brownish solid was
69
attained. The 1H‐NMR revealed that the MCM‐P presented considerable impurities, so the solid was
dissolved in water, filtered and the aqueous phase liophylized, obtaining the pure product as a yellow
powder with a final yield of 81%.
For MCM‐P, 1H‐NMR (400 MHz, D2O, heteronuclear coupled): δ/ppm 7.39 (d, J = 8.8 Hz, 1H, H5), δ 6.82
(d, J = 9.2 Hz, 1H, H6), δ 6.78 (s, 1H, H8), δ 6.28 (s, 1H, H3), δ 4.99 (s, 3H, CH3‐O), δ 3.77 (d, J = 4.4 Hz, 2H,
CH2‐O); 31P‐NMR (161 MHz, D2O, heternuclear decoupled): δ/ppm 0.20 (s).
2.2.8. Synthesis of P3‐[7‐methoxycoumarin‐4‐yl]methyl adenosine 5’‐triphosphate (MCM‐ATP) and
P3‐[7‐methoxycoumarin‐4‐yl]methyl guanine 5’‐triphosphate (MCM‐GTP)
For the synthesis of MCM‐ATP and MCM‐GTP, the same procedure was followed as indicated in Section
2.2.4. The reaction was carried out in dry HMPA (2.6 mL), where activated ADP (53.1 mg; or GDP) was
reacted with MCM‐P (24.86 mg). The reaction was carried out for 4 days. The final mixture was analyzed
by HPLC, using the same separation method as indicated in Section 2.3.2. A product yield of 20% was
estimated.
For MCM‐ATP, 1H‐NMR (400 MHz, D2O, heteronuclear decoupled): δ/ppm 8.13 (Ade‐H6), δ 7.92 (Ade‐H1), δ 7.16 (H5), δ 6.60 (H6), δ 6.56 (H8), δ 6.26 (H3), δ 5.66 (CH3‐O), δ 4.32 – 4.16 (ribose), δ 3.72 (CH2‐O).
For MCM‐GTP, 1H‐NMR (400 MHz, D2O, heteronuclear decoupled): δ/ppm 7.45 (Gua‐H6), δ 7.21 (H5), δ 6.73 (H8), δ 6.64 (H6), δ 6.31 (H3), δ 5.49 (Gua‐NH2), δ 5.01 (CH3‐O), δ 4.6 – 4.17 (ribose), δ 3.77 (CH2‐O).
2.2.9. Synthesis of P3‐[7‐diethylaminocoumarin‐4‐yl]methyl guanine 5’‐triphosphate
(DEACM‐GTP)
The same procedure as described in Section 2.2.4 was used for the synthesis of DEACM‐GTP, using
activated GDP as a nucleotide precursor. A final product yield of 20% was estimated by HPLC.
70
For DEACM‐GTP, 1H‐NMR (400 MHz, D2O, heteronuclear decoupled): δ/ppm 8.04 (Gua‐H6), δ 7.75 (H5), δ
7.17 (H8), δ 7.09 (H6), δ 6.42 (H3), δ 6.09 (Gua‐NH2), δ 5.05 (CH2‐O), δ 4.82 – 4.17 (ribose), δ 3.07 (N‐CH2‐
CH3), δ 1.17 (N‐CH2‐CH3); 31P‐NMR (161 MHz, D2O, heternuclear decoupled): δ/ppm ‐8.6 (s), δ ‐20.1 (s).
2.3. Photophysical and Photochemical Characterization
2.3.1. Absorption and Emission Titrations
Absorption and emission titrations were carried out in 10 mM phosphate buffer, initial pH 6.9. Solutions
with approximate 0.1 absorbance units at this pH were prepared. The pH was then adjusted with HCl and
the titration was performed via addition of NaOH. Absorption spectra were corrected for baseline and
dilution. Corrected absorbance values at 385 nm were plotted as function of pH. Fitting of absorption
titration curve for the acid‐base equilibrium between two species to experimental data was processed,
using the following equation:
lK
lK
KA ×
+××+×
+××= +
++
+ ]H[]H[]A[)HA(
]H[]A[)A(
a0
a
a0T εε Equation 15
AT is the total absorbance at 385 nm; l is the optical path length; ε(A) and ε(HA+) are the extinction
coefficients of the unprotonated and protonated species, respectively; Ka is the equilibrium constant and
[A]0 is the initial concentration. Ka and ε(HA+) values were used as adjustable parameters for the fitting.
Emission spectra were collected with excitation at 325 nm (isosbestic point) and corrected for light
absorption at this wavelength. The total emission band area was normalized at pH 8.2 for fluorescence
quantum yield. For DEACM‐OH, fitting of an emission titration curve of the equilibrium between two
species to experimental data was processed, using the following equation:
Φ Φ Equation 16
IT is the integrated emission area with excitation at 325 nm; I0 is the integrated emission area with
excitation at 325 nm for the sample with higher emission; Φf(A) and Φf(HA+) are the fluorescence
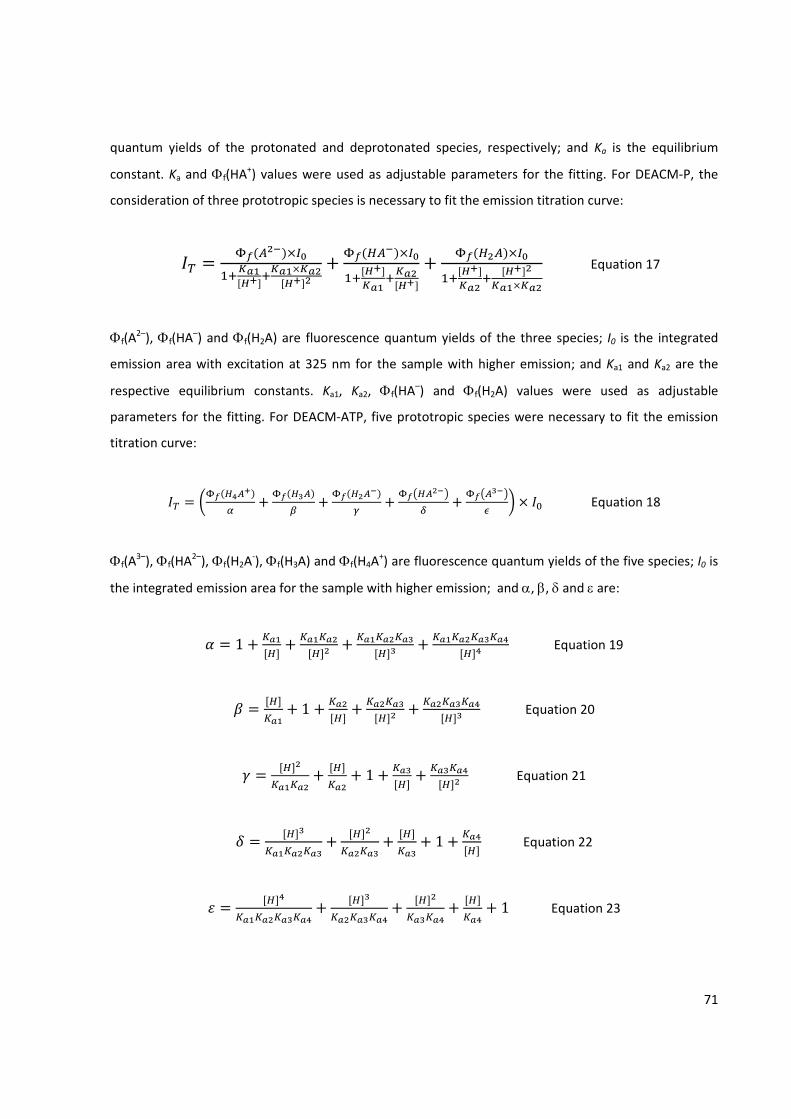
71
quantum yields of the protonated and deprotonated species, respectively; and Ka is the equilibrium
constant. Ka and Φf(HA+) values were used as adjustable parameters for the fitting. For DEACM‐P, the
consideration of three prototropic species is necessary to fit the emission titration curve:
Equation 17
Φf(A2–), Φf(HA
–) and Φf(H2A) are fluorescence quantum yields of the three species; I0 is the integrated
emission area with excitation at 325 nm for the sample with higher emission; and Ka1 and Ka2 are the
respective equilibrium constants. Ka1, Ka2, Φf(HA–) and Φf(H2A) values were used as adjustable
parameters for the fitting. For DEACM‐ATP, five prototropic species were necessary to fit the emission
titration curve:
Equation 18
Φf(A3–), Φf(HA
2–), Φf(H2A‐), Φf(H3A) and Φf(H4A
+) are fluorescence quantum yields of the five species; I0 is
the integrated emission area for the sample with higher emission; and α, β, δ and ε are:
1 Equation 19
1 Equation 20
1 Equation 21
1 Equation 22
1 Equation 23
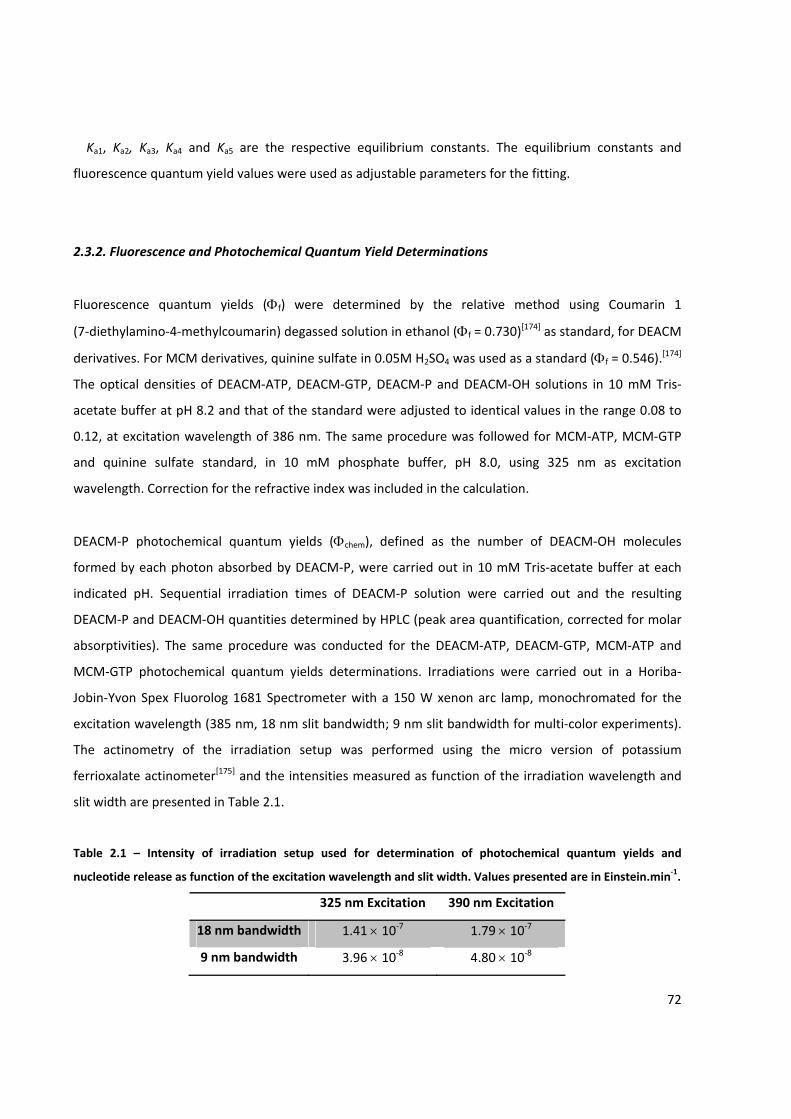
72
Ka1, Ka2, Ka3, Ka4 and Ka5 are the respective equilibrium constants. The equilibrium constants and
fluorescence quantum yield values were used as adjustable parameters for the fitting.
2.3.2. Fluorescence and Photochemical Quantum Yield Determinations
Fluorescence quantum yields (Φf) were determined by the relative method using Coumarin 1
(7‐diethylamino‐4‐methylcoumarin) degassed solution in ethanol (Φf = 0.730)[174] as standard, for DEACM
derivatives. For MCM derivatives, quinine sulfate in 0.05M H2SO4 was used as a standard (Φf = 0.546).[174]
The optical densities of DEACM‐ATP, DEACM‐GTP, DEACM‐P and DEACM‐OH solutions in 10 mM Tris‐
acetate buffer at pH 8.2 and that of the standard were adjusted to identical values in the range 0.08 to
0.12, at excitation wavelength of 386 nm. The same procedure was followed for MCM‐ATP, MCM‐GTP
and quinine sulfate standard, in 10 mM phosphate buffer, pH 8.0, using 325 nm as excitation
wavelength. Correction for the refractive index was included in the calculation.
DEACM‐P photochemical quantum yields (Φchem), defined as the number of DEACM‐OH molecules
formed by each photon absorbed by DEACM‐P, were carried out in 10 mM Tris‐acetate buffer at each
indicated pH. Sequential irradiation times of DEACM‐P solution were carried out and the resulting
DEACM‐P and DEACM‐OH quantities determined by HPLC (peak area quantification, corrected for molar
absorptivities). The same procedure was conducted for the DEACM‐ATP, DEACM‐GTP, MCM‐ATP and
MCM‐GTP photochemical quantum yields determinations. Irradiations were carried out in a Horiba‐
Jobin‐Yvon Spex Fluorolog 1681 Spectrometer with a 150 W xenon arc lamp, monochromated for the
excitation wavelength (385 nm, 18 nm slit bandwidth; 9 nm slit bandwidth for multi‐color experiments).
The actinometry of the irradiation setup was performed using the micro version of potassium
ferrioxalate actinometer[175] and the intensities measured as function of the irradiation wavelength and
slit width are presented in Table 2.1.
Table 2.1 – Intensity of irradiation setup used for determination of photochemical quantum yields and
nucleotide release as function of the excitation wavelength and slit width. Values presented are in Einstein.min‐1.
325 nm Excitation 390 nm Excitation
18 nm bandwidth 1.41 × 10‐7 1.79 × 10‐7
9 nm bandwidth 3.96 × 10‐8 4.80 × 10‐8
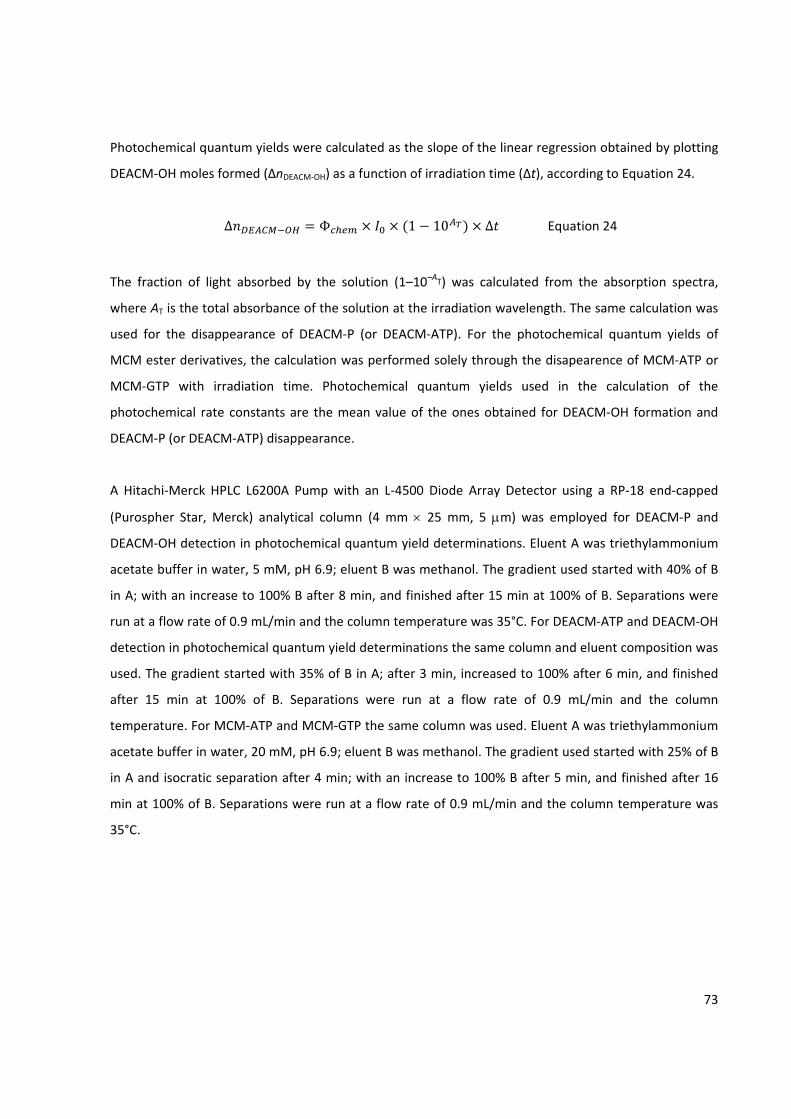
73
Photochemical quantum yields were calculated as the slope of the linear regression obtained by plotting
DEACM‐OH moles formed (ΔnDEACM‐OH) as a function of irradiation time (Δt), according to Equation 24.
Δ Φ 1 10 Δ Equation 24
The fraction of light absorbed by the solution (1–10–AT) was calculated from the absorption spectra,
where AT is the total absorbance of the solution at the irradiation wavelength. The same calculation was
used for the disappearance of DEACM‐P (or DEACM‐ATP). For the photochemical quantum yields of
MCM ester derivatives, the calculation was performed solely through the disapearence of MCM‐ATP or
MCM‐GTP with irradiation time. Photochemical quantum yields used in the calculation of the
photochemical rate constants are the mean value of the ones obtained for DEACM‐OH formation and
DEACM‐P (or DEACM‐ATP) disappearance.
A Hitachi‐Merck HPLC L6200A Pump with an L‐4500 Diode Array Detector using a RP‐18 end‐capped
(Purospher Star, Merck) analytical column (4 mm × 25 mm, 5 μm) was employed for DEACM‐P and
DEACM‐OH detection in photochemical quantum yield determinations. Eluent A was triethylammonium
acetate buffer in water, 5 mM, pH 6.9; eluent B was methanol. The gradient used started with 40% of B
in A; with an increase to 100% B after 8 min, and finished after 15 min at 100% of B. Separations were
run at a flow rate of 0.9 mL/min and the column temperature was 35°C. For DEACM‐ATP and DEACM‐OH
detection in photochemical quantum yield determinations the same column and eluent composition was
used. The gradient started with 35% of B in A; after 3 min, increased to 100% after 6 min, and finished
after 15 min at 100% of B. Separations were run at a flow rate of 0.9 mL/min and the column
temperature. For MCM‐ATP and MCM‐GTP the same column was used. Eluent A was triethylammonium
acetate buffer in water, 20 mM, pH 6.9; eluent B was methanol. The gradient used started with 25% of B
in A and isocratic separation after 4 min; with an increase to 100% B after 5 min, and finished after 16
min at 100% of B. Separations were run at a flow rate of 0.9 mL/min and the column temperature was
35°C.
2.3.3. Time‐
Fluorescenc
counting (T
Spectra Phy
tuning rang
diode‐pump
Physics) is
frequency o
output bea
(WDPOL‐A)
Emission a
Cornerstone
Signal acqu
module. Flu
channels in
half maximu
The obtaine
2.3.4. Flash
Flash photo
from Applie
harmonic (λ
used as mo
absorption
dependence
adjusted to
600 nm, un
during trans
the solution
‐Resolved Fl
ce decays w
TCSPC) appa
ysics mode‐l
ge 700–1000
ped, solid‐st
used to pro
output. The s
am from th
and after
t 90° geom
eTM 260 mo
uisition and
uorescence d
a 0.814 ps p
um of the IR
ed fluorescen
h Photolysis E
olysis experi
ed Photophy
λexc=532 nm,
onitoring lam
between 0.
e experimen
o a light‐leve
nless otherwi
sient spectru
ns prior and
luorescence S
were measu
aratus descri
ock Tsunam
nm), pumpe
tate laser (
oduce the se
samples wer
e GWU (se
by a Glan‐
metry collect
onochromato
data proces
decays and t
per channel s
RF was about
nce decays w
Experiments
iments were
ysics, with a
290 mJ, lase
mp to analy
.1 and 0.2
nts). Decays
l of 260 ± 5%
ise stated. T
um measure
after transi
Spectroscop
red using a
ibed elsewh
mi® Laser (Ti:S
ed by a Mille
em = 532
econd and t
re measured
cond harmo
Thompson
ted at mag
or by a Ham
ssing were
the instrume
scale, until 5
t 22 ps and w
were deconv
s
e performed
a Brilliant Q
er pulse half‐
yze transient
at 355 nm,
were obtain
% mV. Trans
To prevent bi
ments, rand
ient spectra
py Measurem
a home‐built
here.[176] The
Sapphire) M
ennia Pro‐10
nm). A harm
hird harmon
d with excitat
onic) was fi
polarizer (N
gic angle po
amatsu micr
performed e
ental respon
× 103 counts
was highly re
oluted using
d in a LKS.60
Q‐Switch Nd
‐width equa
t absorption
unless othe
ned using a
sient spectra
iased variati
om wavelen
were perfor
ments
t picosecond
e excitation
odel 3950 (
0s, frequency
monic gener
nic from the
tion at 425 n
rst passed
Newport 10G
olarization w
rochannel pl
employing a
nse function
s at maximu
eproducible w
g the modula
0 nanosecon
‐YAG laser
l to 6 ns). A p
. The coum
erwise state
2.0 nm slits
a were meas
ons in inten
gth selection
rmed to asse
d time‐corre
source cons
repetition ra
y‐doubled co
rator model
e Ti:Sapphire
nm and the
through a T
GT04) with
was detecte
late photom
a Becker &
(IRF) where
m were reac
with identica
ating function
nd laser pho
from Quant
pulsed 150 W
arin solution
ed (in the c
s, and photo
sured at each
sity due to c
n was used.
ess coumari
elated singl
sists of a pi
ate of about
ontinuous wa
GWU‐23PS
e laser excit
horizontally
ThorLabs de
vertical pol
ed through
ultiplier (R38
Hickl SPC‐63
collected u
ched. The ful
al system pa
ns method.[1
otolysis spec
tel, using th
W xenon arc
ns studied p
ase of conc
omultiplier s
h 10 nm, fro
coumarin de
Absorption s
n degradatio
74
e photon
icosecond
t 82 MHz,
ave (CW),
S (Spectra
ing beam
polarized
epolarizer
larization.
an Oriel
809U‐50).
30 TCSPC
sing 4096
ll width at
rameters. 177,178]
ctrometer
e second
lamp was
presented
centration
sensitivity
om 300 to
gradation
spectra of
on. When
75
more than 10% of initial absorbance was lost due to laser/flash lamp excitation, the coumarin solution
was replaced by fresh one. For oxygen dependence experiments, solutions were subjected to bubbling
nitrogen during a minimum of 10 minutes and sealed with a cell cap and wrapped in parafilm. Transient
spectra and decays were taken immediately after.
Decay analysis was performed by adjusting a single‐exponential decay fitting curve to experimental
decay using OriginPro 8 software. When fitting yielded high chi‐square values, a double‐exponential
decay curve was used for fitting.
2.3.5. DEACM‐ATP Irradiation Profiles
The irradiation of DEACM‐ATP solutions in water, pH 7.0, with increasing concentrations (50, 91, 230 and
500 μM) was performed in 60 μL fluorescence quartz cells, using the same irradiation apparatus as
indicated above (Section 2.3.2). At each concentration, individual data points were obtained through
independent measurements. The DEACM‐ATP and resulting DEACM‐OH concentrations were determined
by HPLC using a Polystirene‐Divinylbenzene (PLRP‐S, Polymer Labs) column (4.6 mm x 15 mm, 8 µm, 300
Å). Eluent A was triethylammonium acetate buffer in water, 5 mM, pH 6.9; eluent B was methanol.
Eluent gradient started with 2 min at 30% of B in A, with an increase to 90% B after 2.5 min, and finished
after 10 min at 90% of B. Separations were run at a flow rate of 2 mL/min, at 35°C column temperature.
Product separation was monitored at 380 nm and DEACM‐OH (retention time = 6.32 min) concentration
determined by peak area quantification.
2.4. Light‐controlled in vitro Synthesis of Nucleic Acids
2.4.1. Transcription Template Cloning and Purification
A 110 bp fragment of Exon 7 of the human p53 gene (TP53 tumor protein p53 [Homo sapiens], GenBank
accession no. X54156) was PCR amplified using primers E7p53Fw: 5'‐gttggctctgactgtaccac‐3' and
E7p53Rev: 5'‐ctggagtcttccagtgtgatg‐3'. PCR amplification was carried out in 20 µL using 0.5 µM of
76
primers, 0.2 mM dNTPs with 0.5 U Taq DNA polymerase (Amersham Biosciences) on a Tpersonal
Thermocycler (Whatman Biometra, Germany). Following denaturation at 95°C for 5 min, amplification
was performed for 25 cycles, each cycle consisting of 95°C for 30 sec, annealing at 54°C for 30 sec,
extension at 72°C for 30 sec, with a final extension step at 72°C for 5 min. The resulting product was re‐
amplified using a T7 promoter‐E7p53Fw primer (5’‐taatacgactcactatagggagagttggctctgactgtaccac‐3’) and
subsequently cloned in pJET1.2 (CloneJET™ PCR Cloning Kit, Fermentas) according to manufacturer’s
protocol. The resulting 133 bp fragment was PCR amplified using primers E7p53Rev and T7 primer (5’‐
taatacgactcactatagggaga‐3’) as described above, purified through SureClean purification kit (Bioline) and
used as template for in vitro transcription reactions. The cloned fragment was confirmed by direct
sequencing using ABI Prism 3100 and ABI Prism Big Dye technology (Applied Biosystems).
2.4.2. In vitro Transcription
Standard in vitro transcription using 200 ng of template was performed with 20 U of T7 RNA Polymerase
(Fermentas) according to the manufacturer’s protocol. Reactions were incubated 1 h at 37°C, followed
by heat inactivation of enzyme for 15 min at 75°C. DNA template digestion ensuring absence of DNA
after transcription, when applied, was performed with 27 U of DNase I (Invitrogen, Karlsbad, CA, USA) for
1 h at 37°C, which was subsequently heat inactivated for 15 min at 75°C. In assays involving caged‐ATP,
ATP was substituted by the equivalent amount of DEACM‐ATP. The same protocol was followed when
DEACM‐GTP, MCM‐ATP and MCM‐GTP were used. Products were analyzed on 3% agarose gel
electrophoresis in 1x TBE buffer, ran at constant voltage (40 V) for 2‐3 hours. Gels were stained by dye
incorporation on the gel matrix with GelRed (Biotium, Hayward, CA, United States) and products
visualized using a UV transilluminator. Non‐denaturing 10% polyacrylamide gel electrophoresis was used
as alternative to product analysis. PAGE gels were run at constant power (6 W) for 3‐4 hours in TBE
buffer, and subsequently stained with Sybr Green I (Invitrogen, Karlsbad, CA, USA). Products were
visualized in a SafeImager™ (Invitrogen, Karlsbad, CA, USA) transilluminator. The in vitro transcription
reactions with radiolabelled α‐32P‐UTP (Perkin Elmer, 800 Ci/mL, 10 mCi/mL), followed the same
procedure as described above, to which 1.5 µL of α‐32P‐UTP were added and reactions incubated 1 hour
at 37°C. The resulting products were denaturated for 2 min at 75°C and analyzed on a 12%
polyacrylamide / 8M urea gel electrophoresis in 1x TBE. Denaturing PAGE was run at 70 W for 2 hours.
Results were visualized in an Optical Scanner Storm™ 860 Intrument (Molecular Dynamics).

77
2.4.3. Reverse Transcription (RT) and Real‐Time PCR Reaction
Reverse Transcription (RT) was performed with Revert‐Aid™ M‐MuLV Reverse Transcriptase (Fermentas)
according to manufacturer’s specifications, using 0.25 µM of E7p53Rev primer, annealing at 42°C for 1
hour. As template for the RT reaction, 5 μL of non‐purified solution from the DNase‐digested
transcription reaction were used. Exact RNA quantification through UV spectrometry prior to purification
was not possible since DTT (present in the Transcription buffer) absorption in the UV region masks the
nucleic acids absorption.
Real‐time PCR assays were performed in a Corbett Research Rotor‐Gene RG3000 using SYBR® GreenER
Real‐Time PCR kit (Invitrogen, Karlsbad, CA, USA) according to manufacturer’s specifications. Reactions
were performed in a total volume of 25 µL with 0.5 µM of primers E7p53Fw and E7p53Rev. Following a
pre‐incubation at 50°C for 2 min and denaturation at 95°C for 10 min, Real‐time PCR was performed for
40 cycles, each cycle consisting of 95°C for 30 sec, annealing at 54°C for 30 sec, extension at 72°C for 30
sec, with a final extension step at 72°C for 5 min.
2.4.4. Light Activated Polymerization Using Terminal deoxynucleotidyl Transferase
Standard TdT reactions (20 μL total volume) were carried out in Y‐Tango buffer (33 mM Tris‐acetate, 10
mM magnesium acetate, 66 mM potassium acetate, 0.1 mg/mL BSA, pH 7.5; Fermentas, Vilnius,
Lithuania), 1 mM cobalt chloride, 20 U of Terminal deoxynucleotidyl Transferase (Fermentas, Vilnius,
Lithuania), a nucleotide source and 25 pmol of a 20‐mer oligonucleotide (E7p53FW ‐ see Section 2.4.1 for
details). A molar ratio of 1:40 (DNA:nucleotide) was used in all reactions unless otherwise stated.
Samples were incubated at 37°C for 1 hour, followed by heat‐deactivation step at 75°C for 15 minutes.
Products were analyzed in a denaturing 12% polyacrilamide / 8 M urea gel electrophoresis, in TBE buffer.
The gels were run at constant power (6 W) for 2 hours and subsequently stained in a Gelred™ bath.
Products were visualized in a UV transilluminator.
Plots of band intensity versus band mobility (measured in pixel number) were obtained from gel images
and using ImageJ 1.42q software. The E7p53FW (20b) and GeneRuler™ Low Range DNA Ladder (25, 50,
75 and 100b fragments; Fermentas, Vilnius, Lithuania) fragments were used as standards to create a
78
calibration curve to obtain the relation between the pixel number and fragment size in experiments
using dNTP as nucleotide source. When NTP (or DEACM‐ATP) nucleotides were used, the calibration
curve was obtained using the E7p53FW (20b) and GeneRuler™ Low Range DNA Ladder (25 and 50b
fragments; Fermentas, Vilnius, Lithuania) fragments.
For the study of DEACM‐OH influence on TdT reactions, ATP was used as a nucleotide source and
E7p53FW as initiatior, in a 40:1 ratio, respectively. Increasing amounts of DEACM‐OH (from a 300 μM
water solution) were added to each sample. Reactions and product analysis were carried out as
described above.
For the light‐activated TdT incorporation study, ATP was replaced by DEACM‐ATP (from a 540 μM
solution in water) in test samples. A 1:10 ratio between E7p53FW initiator oligonucleotide and ATP
(control) or DEACM‐ATP (test samples) was used. Irradiation and DEACM‐ATP/DEACM‐OH quantification
was performed as described in Section 2.3.2. A purity of DEACM‐ATP >98% for non‐irradiated sample
was determined, and no DEACM‐ATP was detected after irradiation. TdT reactions and product analysis
were carried out as described above.
2.5. DEACM‐OH Inhibition Experiments
2.5.1. DEACM‐OH Inhibition Effect
The in vitro transcription reactions were carried out following the same procedure as described in
Section 2.4.2. To each sample, a 300 μM DEACM‐OH water solution was added to final concentration as
indicated in Section 4.1.3. Products were analyzed in a 3% agarose gel in TBE buffer. The gel was run for
2 hours at constant voltage (40 V) and stained by incorporation of Gelred™ (Biotium, Hayward, CA, USA)
in the gel matrix.
Fluorescence studies on the interaction of DEACM‐OH and DNA/ T7 RNA Polymerase were carried out in
10 mM phosphate buffer, 0.1 M sodium chloride, pH 7.9, for a final solution volume of 60 μL. A final
concentration of 2.3 μM of DEACM‐OH was used for all samples. The T7 RNA polymerase (90 U,
Fermentas, Vilnius, Lithuania) was added to one of the samples and DNA template (600 ng; see Section
79
2.4.1) was added to another sample. Fluorescence spectra were collected as described in Section 2.1.
Experiments were conducted at 20°C and samples were incubated for 10 minutes prior to fluorescence
measurements.
2.5.2. DEACM‐OH Inhibition Suppression: β‐lactoglobulin
For the study of the presence of β‐lactoglobulin in transcription, increasing amounts of β‐lactoglobulin
(in 10 mM phosphate buffer, pH 8.0) were added to each sample to a final concentration as indicated in
Section 4.2.1. Transcription reactions were carried out as described in Section 2.4.2. Products were
analyzed in a 3% agarose gel in TBE buffer (for details see Section 2.4.2).
2.5.3. DEACM‐OH/β‐Cyclodextrin Association Constant Determinations
The absorption and emission spectra of a 30 μM DEACM‐OH solution in transcription buffer (50 mM
Tris‐HCl, 6 mM MgCl2, 10 mM Dithiothreitol (DTT), 30 mM NaCl and 2 mM spermidine) were measured
after the addition of increasing β‐cyclodextrin quantity at 37°C. A 10 minutes equilibration period was
used between each cyclodextrin addition and measurement cycle. Emission at 570 nm was corrected for
absorption/dilution variation and plotted as function of β‐cyclodextrin concentration. Using Valeur’s
model[179] and a non‐linear least square fit, the association constant was determined (see Section 4.2.2
for details).
2.5.4. DEACM‐OH Inhibition Suppression: β‐cyclodextrin
Transcription reactions were carried out as described in Section 2.4.2. For the study of the presence of
β‐cyclodextrin in transcription, increasing amounts of a 500 mM β‐cyclodextrin water solution was
added to each sample. Transcription products were analyzed on a 10% non‐denaturing PAGE gel (see
Section 2.4.2 for details). For the study of inhibition suppression, to a series of samples increasing
DEACM‐OH was added; to another series the same DEACM‐OH were added to samples containing 500
80
mM of β‐cyclodextrin. Products were analyzed in a 3% agarose gel in TBE buffer (see Section 2.4.2 for
details).
Gel band intensity analysis was performed using Adobe Photoshop™ image software. To a constant pixel
area (defined by the largest band on each band series), the gray‐scale intensity was measured for each
band. DNA template band was used as internal standard for inter‐sample normalization. Each
measurement was conducted in triplicate, independently, to account for small variations in band area
selection (an error of less than 5% was attained between repeats).
The super‐saturated 300 μM DEACM‐OH water solution was prepared as followed. DEACM‐OH (1.48 mg)
was dissolved in 10 mL of acetone, and evaporated under vacuum forming a thin film on the volumetric
flask walls. Hot water (20 mL) was added to the flask and the solution was put in an ultra‐sound bath for
10 minutes. No precipitation at room temperature was observed after a couple of weeks.
81
CHAPTER 3. Photophysical and Photochemical Characterization of DEACM Derivatives Part of the results presented in this chapter were published in the Journal of Physical Chemistry, 2010, Vol. 114, 12795‐12803.
A person who never made a mistake, never tried anything new. Albert Einstein
82
3.1. Synthesis of P3‐[7‐diethylaminocoumarin‐4‐yl]methyl adenosine 5’‐triphosphate (DEACM‐ATP)
Coumarins were selected as photolabile protecting groups to form caged nucleotides. Geiβler and co‐
workers[116] describe the synthesis of a caged ATP, in which a 7‐diethylamino‐4‐methylcoumarin (DEACM)
was linked to the γ‐phosphate of the ATP molecule. This constituted the synthesis starting point for
several reasons: First, the DEACM‐ATP has its maximum absorbance around 400 nm, far from the
DNA/RNA/protein absorption bands. It also presents high extinction coefficients (ε390nm = 15000 M‐1cm‐1)
and relatively high photochemical quantum yields (Φchem = 0.086). Second, the synthesis of the caged
derivative, although cumbersome and with poor yields, had already been developed using the
thoroughly studied and cheap Coumarin 1 laser dye (7‐diethylamino‐4‐methylcoumarin) as starting
material. Third, the linkage between the coumarin molecule and the nucleotide was found to be
promising for our application: the presence of a bulky group attached to the triphosphate tail should
difficult (at least) the recognition of the nucleotide by the polymerase. Also, the addition of an extra
ester group to the triphosphates moiety was expected to change the local phosphate acidity, crucial for
the magnesium complexation and nucleophilic attack during condensation reaction. And finally, the
synthetic strategy seemed to be independent on the nucleotide – any nitrogen base or sugar could be
employed, not being restricted to ATP. Adenine was selected as the first case study.
Just one final decision was missing: ATP or dATP, which meant RNA or DNA. Common knowledge and
molecular biology tools available made the synthesis of DNA more appealing. DNA is easier to detected,
has higher stability, and is easily amplified and purified. It is simply easier to work with DNA. However,
one blunt factor answered this ATP vs. dATP question: money. The price of 1 g of ATP was 22 €, while 100
mg of dATP was 246 €.[180] The forecast of failed first attempts in synthesizing the caged dATP settled our
decision. The first proof of concept would be directed to control RNA synthesis with light.
The first synthesis step was the Coumarin 1’s 4‐methyl oxidation with selenium dioxide and subsequent
reduction with sodium borohydride, to yield the 7‐diethylamino‐7‐hydroxymethylcoumarin (DEACM‐OH)
– Figure 3.1. Although several by‐products were obtained, the final alcohol product could be easily
isolated by flash chromatography with a final yield of 46%. The synthesis of the DEACM‐OH was
convenient since this compound is the photoproduct generated after DEACM‐ATP release (and all other
DEACM ester derivatives), which is of great value for photochemical characterization and control
experiments.
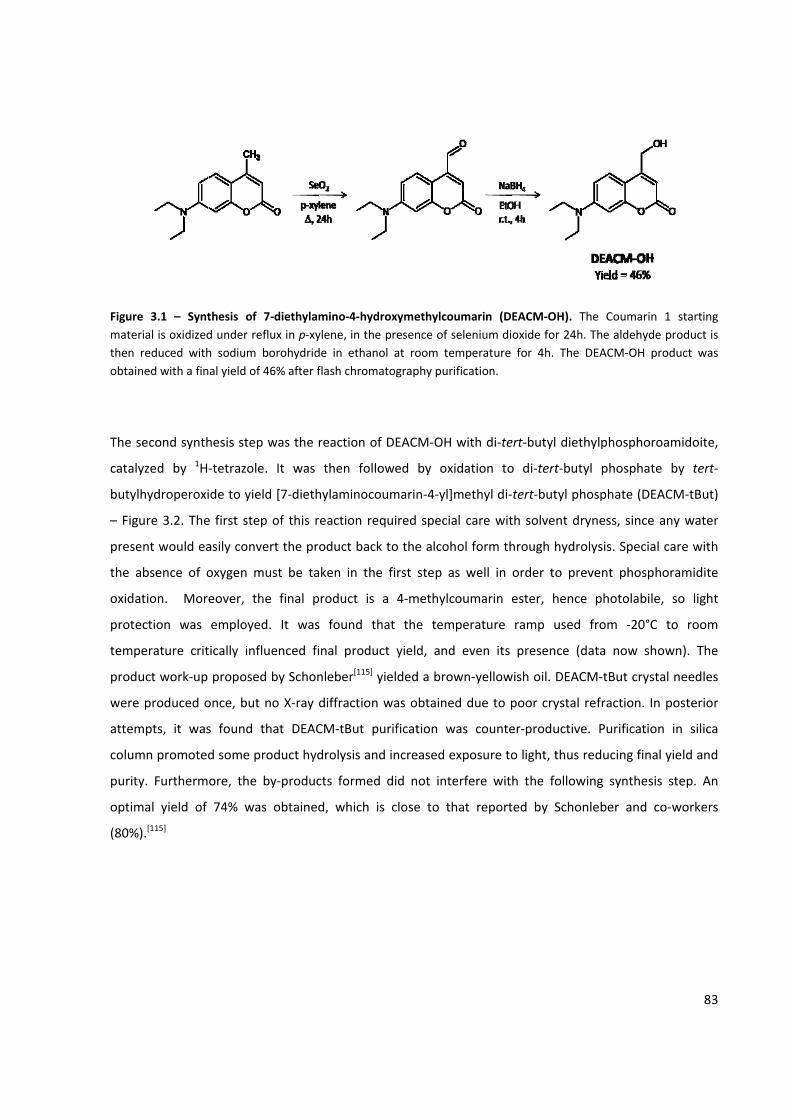
Figurematerthen obtain
The s
cataly
butyl
– Fig
prese
the a
oxida
prote
temp
produ
were
attem
colum
purity
optim
(80%
e 3.1 – Syntrial is oxidizedreduced withned with a fin
second synth
yzed by 1H‐
hydroperoxi
ure 3.2. The
ent would ea
absence of o
ation. More
ection was
perature crit
uct work‐up
produced o
mpts, it was
mn promoted
y. Furtherm
mal yield of
).[115]
thesis of 7‐dd under refluxh sodium boral yield of 46%
hesis step w
‐tetrazole. I
ide to yield [
e first step o
asily convert
oxygen must
eover, the
employed.
tically influe
proposed b
once, but no
s found tha
d some prod
ore, the by‐
74% was o
diethylamino‐x in p‐xylene, rohydride in % after flash c
as the react
It was then
[7‐diethylam
of this reacti
t the product
t be taken
final produ
It was fou
nced final p
y Schonlebe
o X‐ray diffra
at DEACM‐tB
duct hydrolys
‐products fo
obtained, wh
‐4‐hydroxymein the presenethanol at rochromatograp
ion of DEAC
n followed
minocoumarin
on required
t back to the
in the first
ct is a 4‐m
nd that the
product yield
er[115] yielded
action was o
But purificat
sis and incre
ormed did n
hich is close
ethylcoumarinnce of seleniuoom temperaphy purificatio
M‐OH with
by oxidatio
n‐4‐yl]methy
special care
e alcohol for
step as wel
methylcouma
e temperat
d, and even
d a brown‐ye
btained due
tion was co
eased exposu
ot interfere
e to that re
n (DEACM‐Oum dioxide forature for 4h. on.
di‐tert‐butyl
n to di‐tert
yl di‐tert‐but
e with solve
rm through h
l in order to
arin ester, h
ure ramp u
n its presen
ellowish oil. D
e to poor cry
ounter‐produ
ure to light, t
with the fo
eported by S
H). The Cour 24h. The aldThe DEACM‐
diethylphos
t‐butyl phos
tyl phosphat
nt dryness, s
hydrolysis. S
o prevent p
hence photo
used from
ce (data no
DEACM‐tBut
ystal refracti
uctive. Purif
thus reducin
ollowing syn
Schonleber
marin 1 stardehyde produ‐OH product
sphoroamido
sphate by t
e (DEACM‐tB
since any wa
pecial care w
hosphorami
olabile, so l
‐20°C to ro
ow shown).
t crystal nee
on. In poste
ication in s
g final yield
nthesis step.
and co‐work
83
rting uct is was
oite,
tert‐
But)
ater
with
dite
ight
oom
The
dles
erior
ilica
and
. An
kers
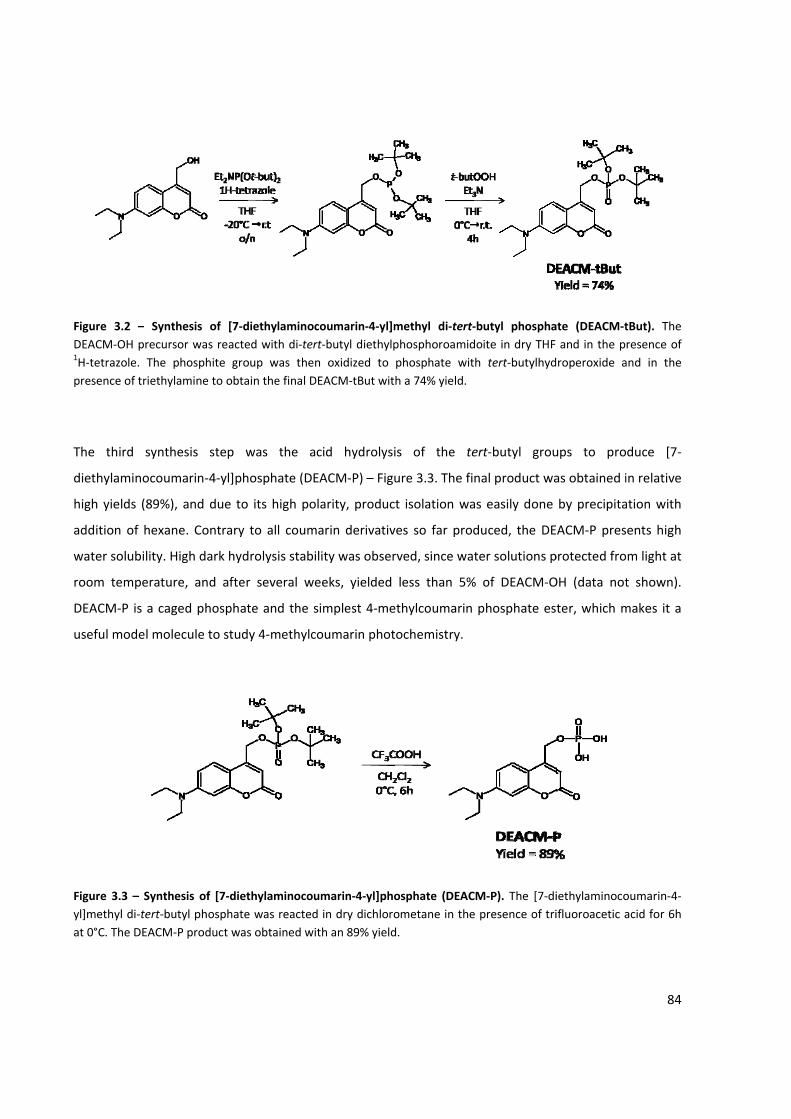
Figure 3.2 –DEACM‐OH p1H‐tetrazole.presence of t
The third
diethylamin
high yields
addition of
water solub
room temp
DEACM‐P is
useful mode
Figure 3.3 – yl]methyl di‐at 0°C. The D
– Synthesis precursor was The phosphtriethylamine
synthesis
nocoumarin‐
(89%), and
hexane. Co
bility. High da
perature, an
s a caged ph
el molecule t
Synthesis of‐tert‐butyl phoDEACM‐P prod
of [7‐diethyls reacted withite group w to obtain the
step was
4‐yl]phospha
due to its h
ntrary to all
ark hydrolysi
d after seve
hosphate and
to study 4‐m
f [7‐diethylamosphate was duct was obta
laminocoumah di‐tert‐buty
was then oxide final DEACM
the acid h
ate (DEACM‐
igh polarity,
l coumarin d
is stability w
eral weeks,
d the simple
methylcouma
minocoumarinreacted in dryined with an 8
arin‐4‐yl]methyl diethylphosdized to phos‐tBut with a 7
hydrolysis o
‐P) – Figure 3
, product iso
derivatives s
was observed
yielded less
est 4‐methyl
arin photoch
n‐4‐yl]phosphy dichloromet89% yield.
hyl di‐tert‐busphoroamidoitsphate with 74% yield.
of the tert
3.3. The fina
olation was
so far produ
, since water
s than 5% o
coumarin ph
emistry.
hate (DEACM‐tane in the p
utyl phosphate in dry THF tert‐butylhyd
t‐butyl grou
l product wa
easily done
ced, the DE
r solutions p
of DEACM‐O
hosphate es
‐P). The [7‐diresence of tri
ate (DEACM‐tand in the properoxide a
ups to pro
as obtained i
by precipita
ACM‐P pres
protected fro
OH (data not
ter, which m
iethylaminocoifluoroacetic a
84
tBut). The resence of and in the
oduce [7‐
in relative
ation with
sents high
om light at
t shown).
makes it a
oumarin‐4‐acid for 6h
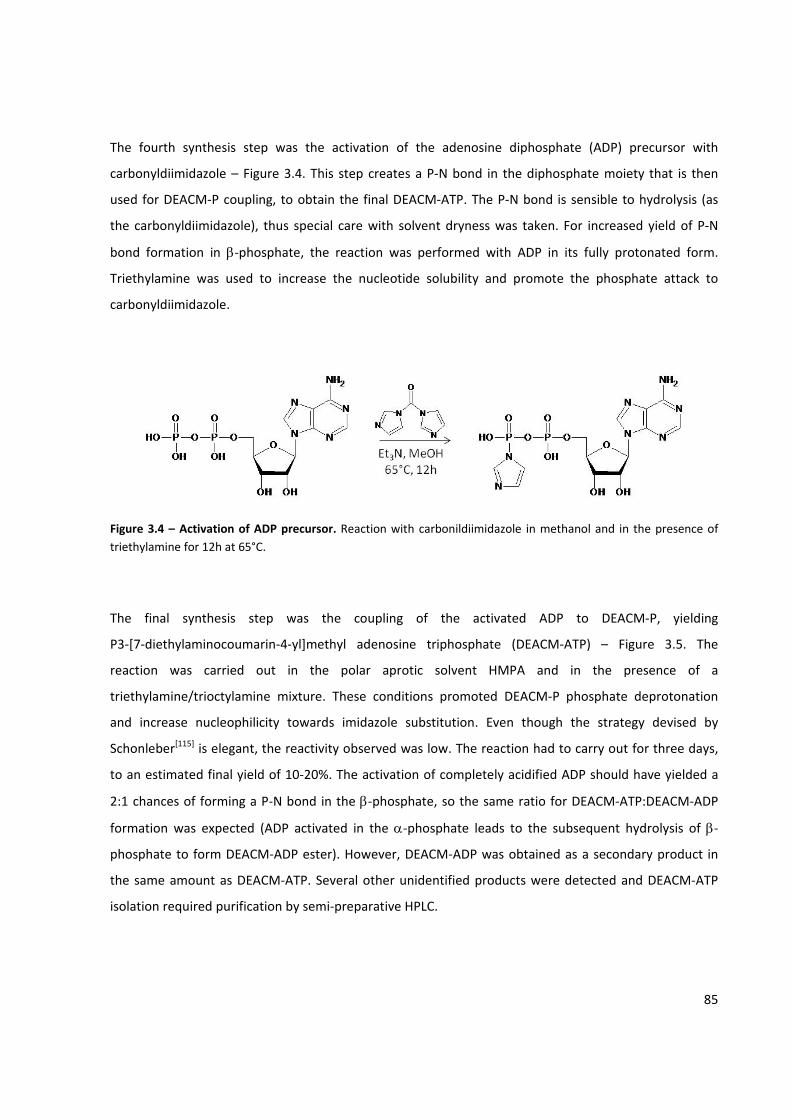
85
The fourth synthesis step was the activation of the adenosine diphosphate (ADP) precursor with
carbonyldiimidazole – Figure 3.4. This step creates a P‐N bond in the diphosphate moiety that is then
used for DEACM‐P coupling, to obtain the final DEACM‐ATP. The P‐N bond is sensible to hydrolysis (as
the carbonyldiimidazole), thus special care with solvent dryness was taken. For increased yield of P‐N
bond formation in β‐phosphate, the reaction was performed with ADP in its fully protonated form.
Triethylamine was used to increase the nucleotide solubility and promote the phosphate attack to
carbonyldiimidazole.
Figure 3.4 – Activation of ADP precursor. Reaction with carbonildiimidazole in methanol and in the presence of triethylamine for 12h at 65°C.
The final synthesis step was the coupling of the activated ADP to DEACM‐P, yielding
P3‐[7‐diethylaminocoumarin‐4‐yl]methyl adenosine triphosphate (DEACM‐ATP) – Figure 3.5. The
reaction was carried out in the polar aprotic solvent HMPA and in the presence of a
triethylamine/trioctylamine mixture. These conditions promoted DEACM‐P phosphate deprotonation
and increase nucleophilicity towards imidazole substitution. Even though the strategy devised by
Schonleber[115] is elegant, the reactivity observed was low. The reaction had to carry out for three days,
to an estimated final yield of 10‐20%. The activation of completely acidified ADP should have yielded a
2:1 chances of forming a P‐N bond in the β‐phosphate, so the same ratio for DEACM‐ATP:DEACM‐ADP
formation was expected (ADP activated in the α‐phosphate leads to the subsequent hydrolysis of β‐
phosphate to form DEACM‐ADP ester). However, DEACM‐ADP was obtained as a secondary product in
the same amount as DEACM‐ATP. Several other unidentified products were detected and DEACM‐ATP
isolation required purification by semi‐preparative HPLC.
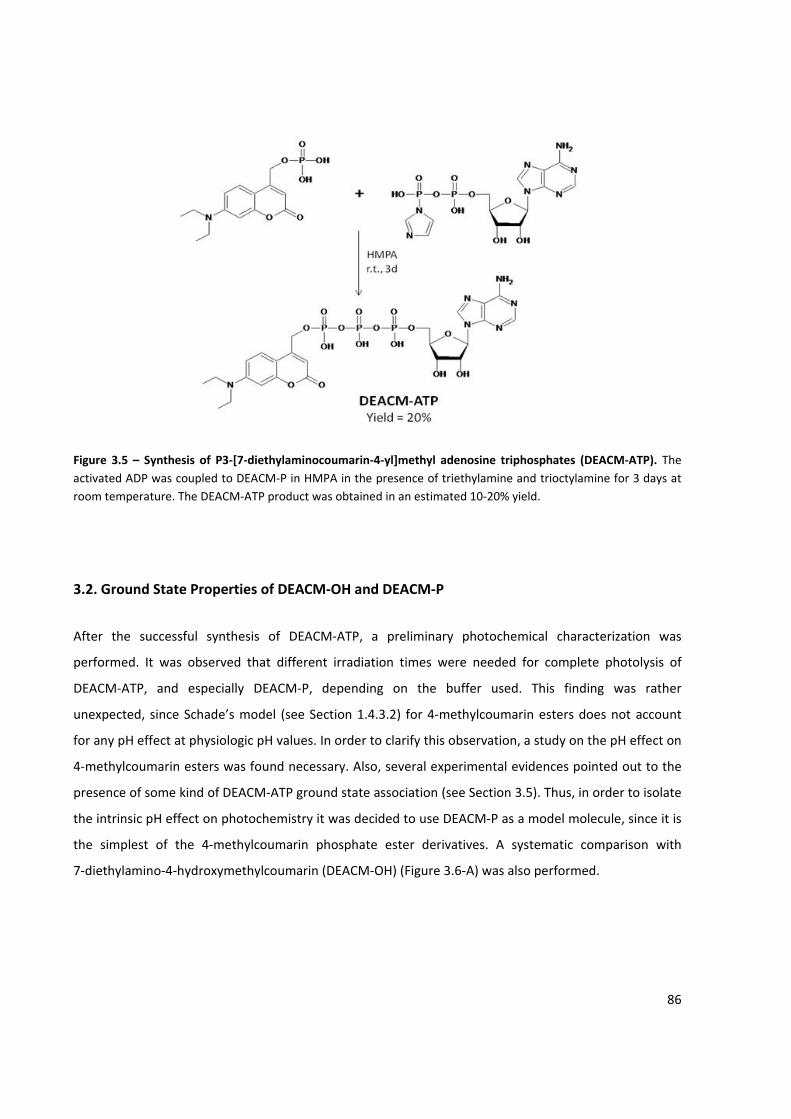
86
Figure 3.5 – Synthesis of P3‐[7‐diethylaminocoumarin‐4‐yl]methyl adenosine triphosphates (DEACM‐ATP). The activated ADP was coupled to DEACM‐P in HMPA in the presence of triethylamine and trioctylamine for 3 days at room temperature. The DEACM‐ATP product was obtained in an estimated 10‐20% yield.
3.2. Ground State Properties of DEACM‐OH and DEACM‐P
After the successful synthesis of DEACM‐ATP, a preliminary photochemical characterization was
performed. It was observed that different irradiation times were needed for complete photolysis of
DEACM‐ATP, and especially DEACM‐P, depending on the buffer used. This finding was rather
unexpected, since Schade’s model (see Section 1.4.3.2) for 4‐methylcoumarin esters does not account
for any pH effect at physiologic pH values. In order to clarify this observation, a study on the pH effect on
4‐methylcoumarin esters was found necessary. Also, several experimental evidences pointed out to the
presence of some kind of DEACM‐ATP ground state association (see Section 3.5). Thus, in order to isolate
the intrinsic pH effect on photochemistry it was decided to use DEACM‐P as a model molecule, since it is
the simplest of the 4‐methylcoumarin phosphate ester derivatives. A systematic comparison with
7‐diethylamino‐4‐hydroxymethylcoumarin (DEACM‐OH) (Figure 3.6‐A) was also performed.
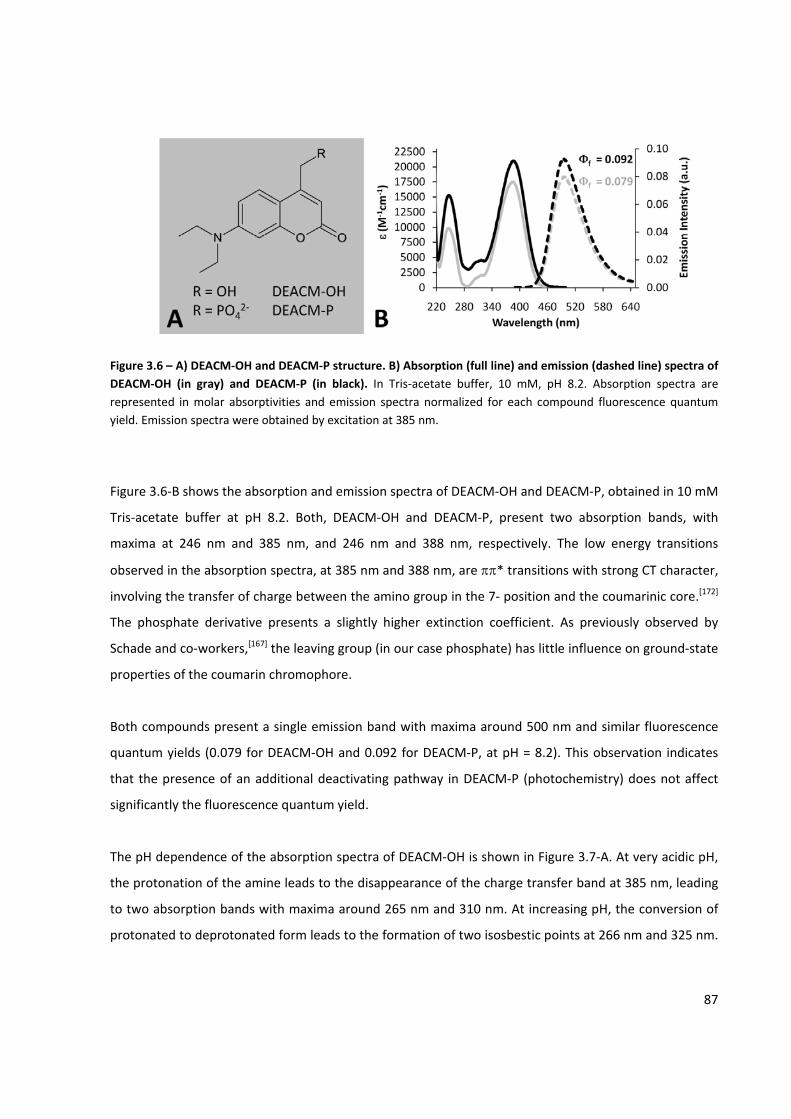
87
Figure 3.6 – A) DEACM‐OH and DEACM‐P structure. B) Absorption (full line) and emission (dashed line) spectra of DEACM‐OH (in gray) and DEACM‐P (in black). In Tris‐acetate buffer, 10 mM, pH 8.2. Absorption spectra are represented in molar absorptivities and emission spectra normalized for each compound fluorescence quantum yield. Emission spectra were obtained by excitation at 385 nm.
Figure 3.6‐B shows the absorption and emission spectra of DEACM‐OH and DEACM‐P, obtained in 10 mM
Tris‐acetate buffer at pH 8.2. Both, DEACM‐OH and DEACM‐P, present two absorption bands, with
maxima at 246 nm and 385 nm, and 246 nm and 388 nm, respectively. The low energy transitions
observed in the absorption spectra, at 385 nm and 388 nm, are ππ* transitions with strong CT character,
involving the transfer of charge between the amino group in the 7‐ position and the coumarinic core.[172]
The phosphate derivative presents a slightly higher extinction coefficient. As previously observed by
Schade and co‐workers,[167] the leaving group (in our case phosphate) has little influence on ground‐state
properties of the coumarin chromophore.
Both compounds present a single emission band with maxima around 500 nm and similar fluorescence
quantum yields (0.079 for DEACM‐OH and 0.092 for DEACM‐P, at pH = 8.2). This observation indicates
that the presence of an additional deactivating pathway in DEACM‐P (photochemistry) does not affect
significantly the fluorescence quantum yield.
The pH dependence of the absorption spectra of DEACM‐OH is shown in Figure 3.7‐A. At very acidic pH,
the protonation of the amine leads to the disappearance of the charge transfer band at 385 nm, leading
to two absorption bands with maxima around 265 nm and 310 nm. At increasing pH, the conversion of
protonated to deprotonated form leads to the formation of two isosbestic points at 266 nm and 325 nm.
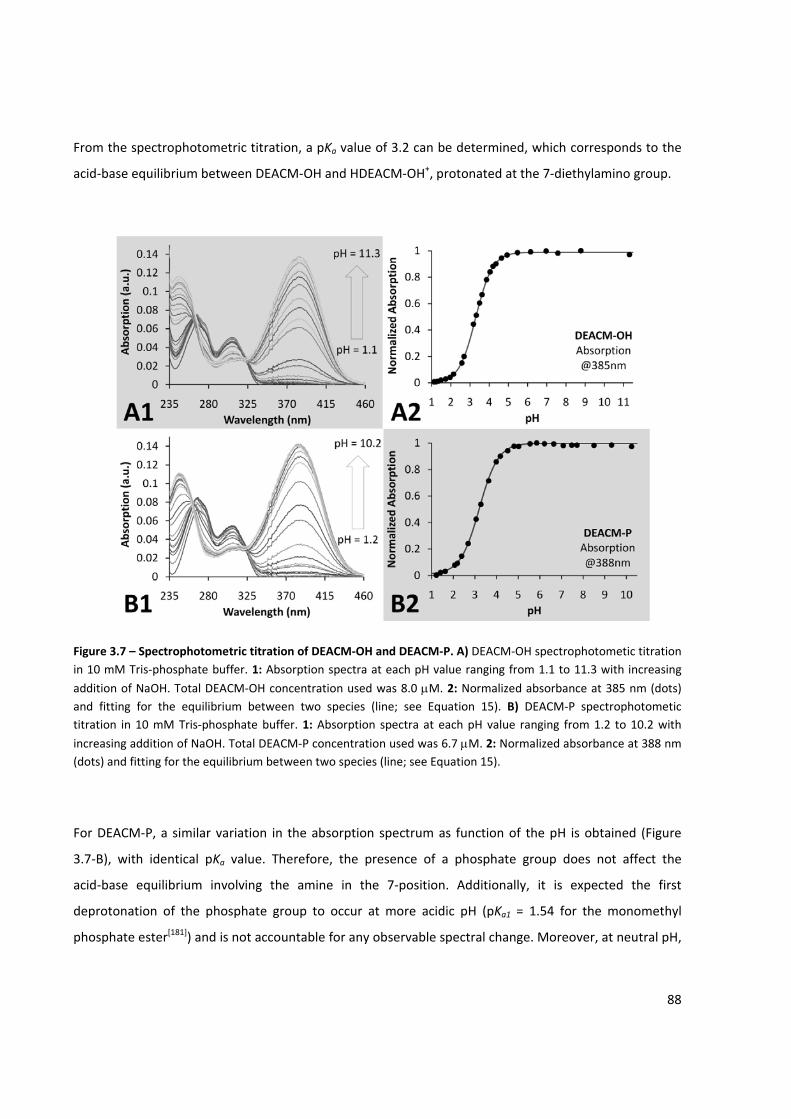
88
From the spectrophotometric titration, a pKa value of 3.2 can be determined, which corresponds to the
acid‐base equilibrium between DEACM‐OH and HDEACM‐OH+, protonated at the 7‐diethylamino group.
Figure 3.7 – Spectrophotometric titration of DEACM‐OH and DEACM‐P. A) DEACM‐OH spectrophotometic titration in 10 mM Tris‐phosphate buffer. 1: Absorption spectra at each pH value ranging from 1.1 to 11.3 with increasing
addition of NaOH. Total DEACM‐OH concentration used was 8.0 μM. 2: Normalized absorbance at 385 nm (dots) and fitting for the equilibrium between two species (line; see Equation 15). B) DEACM‐P spectrophotometic titration in 10 mM Tris‐phosphate buffer. 1: Absorption spectra at each pH value ranging from 1.2 to 10.2 with
increasing addition of NaOH. Total DEACM‐P concentration used was 6.7 μM. 2: Normalized absorbance at 388 nm (dots) and fitting for the equilibrium between two species (line; see Equation 15).
For DEACM‐P, a similar variation in the absorption spectrum as function of the pH is obtained (Figure
3.7‐B), with identical pKa value. Therefore, the presence of a phosphate group does not affect the
acid‐base equilibrium involving the amine in the 7‐position. Additionally, it is expected the first
deprotonation of the phosphate group to occur at more acidic pH (pKa1 = 1.54 for the monomethyl
phosphate ester[181]) and is not accountable for any observable spectral change. Moreover, at neutral pH,

89
where deprotonation of the second phosphate group is expected, no spectral changes were observed.
The protonation degree of the phosphate group does not seem to affect the absorption spectrum.
3.3. Dependence of DEACM‐OH and DEACM‐P Photophysics and Photochemistry on pH
The fluorescence titration for DEACM‐OH fully corroborates the results obtained by absorption
spectroscopy, i.e., as the amine‐protonated species is produced at more acidic pH values, a decrease in
the fluorescence intensity is observed (Figure 3.8‐A), confirming that the emission arises from the charge
transfer state that is absent in the amine protonated form (Figure 3.9‐A). The protonated amine species
present similar photophysical properties to unsubstituted coumarin. A pKa value of 3.2 is also obtained
and no evidence for other excited state pH dependent processes was found.
Figure 3.8 – Fluorimetric titration of DEACM‐OH and DEACM‐P. A) DEACM‐OH fluorimetric titration in 10 mM Tris‐phosphate buffer. 1: Emission spectra obtained with excitation at 325 nm at each pH value ranging from 1.1 to 11.3. Fluorescence intensities are normalized for fluorescence quantum yield measured at pH 8.2. 2: Fluorescence intensities obtained by integrated emission area normalized for fluorescence quantum yields (dots) and fitting for the equilibrium between two species (line; see Equation 16). B) DEACM‐P fluorimetric titration in 10 mM Tris‐
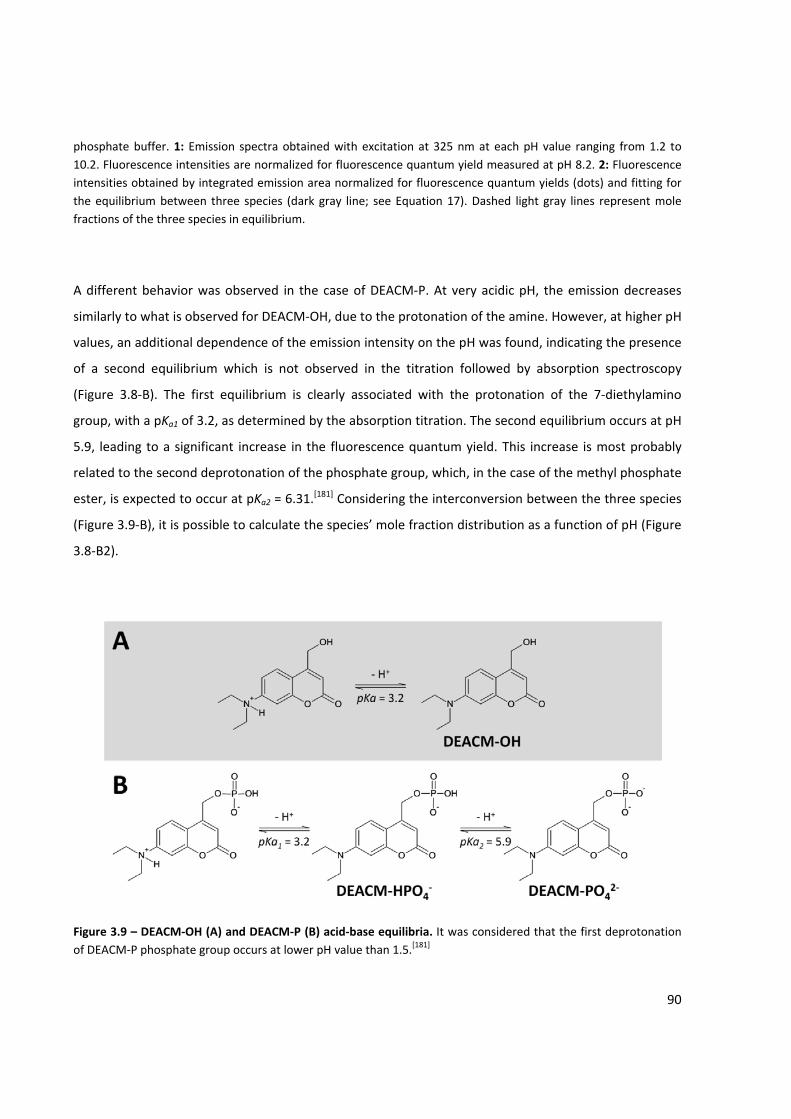
90
phosphate buffer. 1: Emission spectra obtained with excitation at 325 nm at each pH value ranging from 1.2 to 10.2. Fluorescence intensities are normalized for fluorescence quantum yield measured at pH 8.2. 2: Fluorescence intensities obtained by integrated emission area normalized for fluorescence quantum yields (dots) and fitting for the equilibrium between three species (dark gray line; see Equation 17). Dashed light gray lines represent mole fractions of the three species in equilibrium.
A different behavior was observed in the case of DEACM‐P. At very acidic pH, the emission decreases
similarly to what is observed for DEACM‐OH, due to the protonation of the amine. However, at higher pH
values, an additional dependence of the emission intensity on the pH was found, indicating the presence
of a second equilibrium which is not observed in the titration followed by absorption spectroscopy
(Figure 3.8‐B). The first equilibrium is clearly associated with the protonation of the 7‐diethylamino
group, with a pKa1 of 3.2, as determined by the absorption titration. The second equilibrium occurs at pH
5.9, leading to a significant increase in the fluorescence quantum yield. This increase is most probably
related to the second deprotonation of the phosphate group, which, in the case of the methyl phosphate
ester, is expected to occur at pKa2 = 6.31.[181] Considering the interconversion between the three species
(Figure 3.9‐B), it is possible to calculate the species’ mole fraction distribution as a function of pH (Figure
3.8‐B2).
Figure 3.9 – DEACM‐OH (A) and DEACM‐P (B) acid‐base equilibria. It was considered that the first deprotonation of DEACM‐P phosphate group occurs at lower pH value than 1.5.[181]
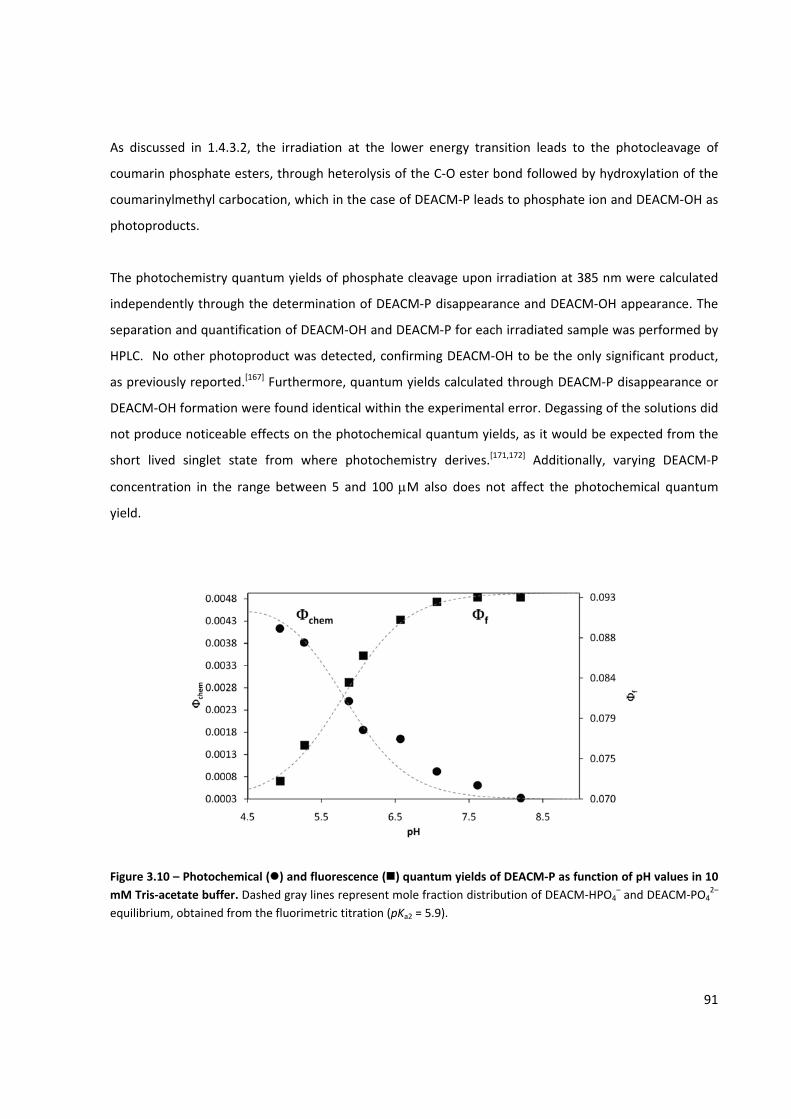
91
As discussed in 1.4.3.2, the irradiation at the lower energy transition leads to the photocleavage of
coumarin phosphate esters, through heterolysis of the C‐O ester bond followed by hydroxylation of the
coumarinylmethyl carbocation, which in the case of DEACM‐P leads to phosphate ion and DEACM‐OH as
photoproducts.
The photochemistry quantum yields of phosphate cleavage upon irradiation at 385 nm were calculated
independently through the determination of DEACM‐P disappearance and DEACM‐OH appearance. The
separation and quantification of DEACM‐OH and DEACM‐P for each irradiated sample was performed by
HPLC. No other photoproduct was detected, confirming DEACM‐OH to be the only significant product,
as previously reported.[167] Furthermore, quantum yields calculated through DEACM‐P disappearance or
DEACM‐OH formation were found identical within the experimental error. Degassing of the solutions did
not produce noticeable effects on the photochemical quantum yields, as it would be expected from the
short lived singlet state from where photochemistry derives.[171,172] Additionally, varying DEACM‐P
concentration in the range between 5 and 100 μM also does not affect the photochemical quantum
yield.
Figure 3.10 – Photochemical ( ) and fluorescence ( ) quantum yields of DEACM‐P as function of pH values in 10 mM Tris‐acetate buffer. Dashed gray lines represent mole fraction distribution of DEACM‐HPO4
– and DEACM‐PO42–
equilibrium, obtained from the fluorimetric titration (pKa2 = 5.9).
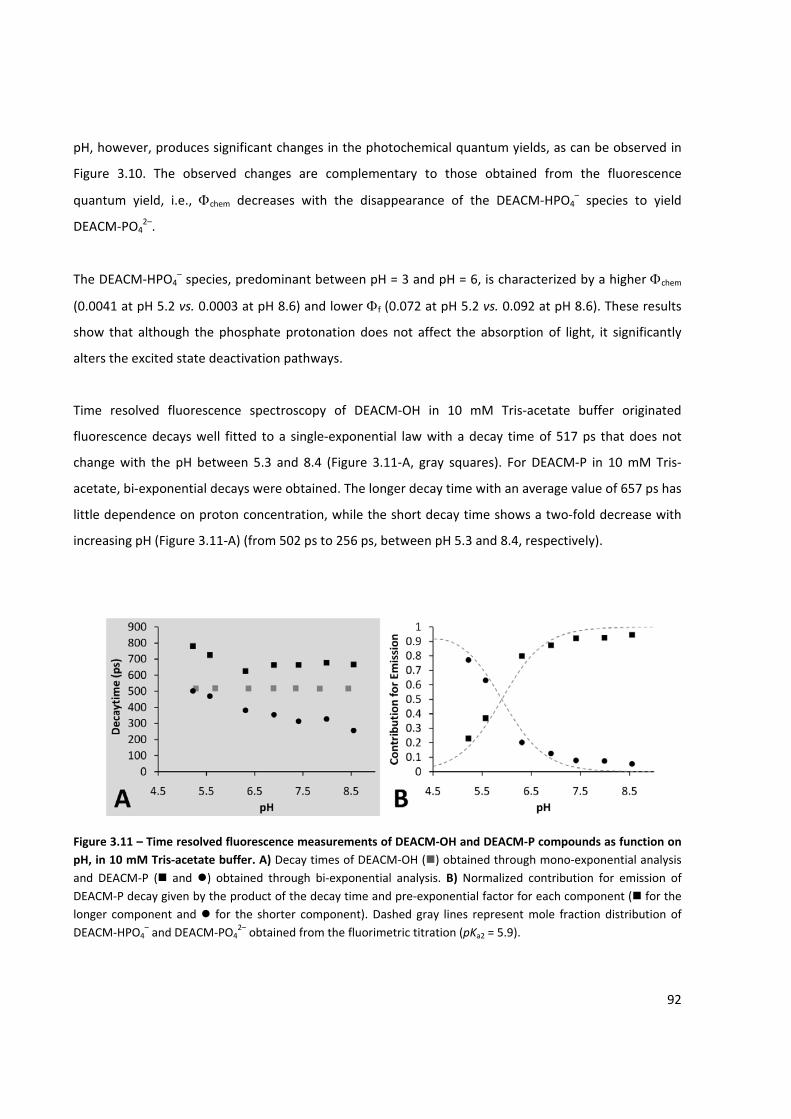
92
pH, however, produces significant changes in the photochemical quantum yields, as can be observed in
Figure 3.10. The observed changes are complementary to those obtained from the fluorescence
quantum yield, i.e., Φchem decreases with the disappearance of the DEACM‐HPO4– species to yield
DEACM‐PO42–.
The DEACM‐HPO4– species, predominant between pH = 3 and pH = 6, is characterized by a higher Φchem
(0.0041 at pH 5.2 vs. 0.0003 at pH 8.6) and lower Φf (0.072 at pH 5.2 vs. 0.092 at pH 8.6). These results
show that although the phosphate protonation does not affect the absorption of light, it significantly
alters the excited state deactivation pathways.
Time resolved fluorescence spectroscopy of DEACM‐OH in 10 mM Tris‐acetate buffer originated
fluorescence decays well fitted to a single‐exponential law with a decay time of 517 ps that does not
change with the pH between 5.3 and 8.4 (Figure 3.11‐A, gray squares). For DEACM‐P in 10 mM Tris‐
acetate, bi‐exponential decays were obtained. The longer decay time with an average value of 657 ps has
little dependence on proton concentration, while the short decay time shows a two‐fold decrease with
increasing pH (Figure 3.11‐A) (from 502 ps to 256 ps, between pH 5.3 and 8.4, respectively).
Figure 3.11 – Time resolved fluorescence measurements of DEACM‐OH and DEACM‐P compounds as function on pH, in 10 mM Tris‐acetate buffer. A) Decay times of DEACM‐OH ( ) obtained through mono‐exponential analysis and DEACM‐P ( and ) obtained through bi‐exponential analysis. B) Normalized contribution for emission of DEACM‐P decay given by the product of the decay time and pre‐exponential factor for each component ( for the longer component and for the shorter component). Dashed gray lines represent mole fraction distribution of DEACM‐HPO4
– and DEACM‐PO42– obtained from the fluorimetric titration (pKa2 = 5.9).
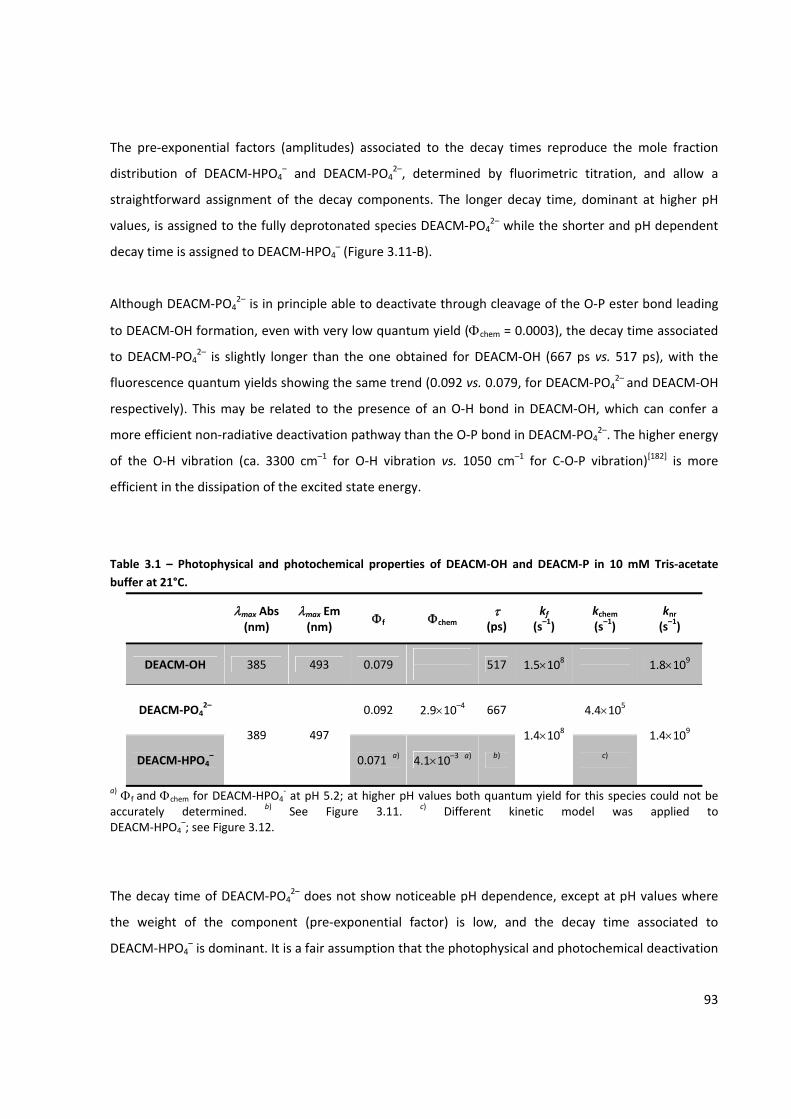
93
The pre‐exponential factors (amplitudes) associated to the decay times reproduce the mole fraction
distribution of DEACM‐HPO4– and DEACM‐PO4
2–, determined by fluorimetric titration, and allow a
straightforward assignment of the decay components. The longer decay time, dominant at higher pH
values, is assigned to the fully deprotonated species DEACM‐PO42– while the shorter and pH dependent
decay time is assigned to DEACM‐HPO4– (Figure 3.11‐B).
Although DEACM‐PO42– is in principle able to deactivate through cleavage of the O‐P ester bond leading
to DEACM‐OH formation, even with very low quantum yield (Φchem = 0.0003), the decay time associated
to DEACM‐PO42– is slightly longer than the one obtained for DEACM‐OH (667 ps vs. 517 ps), with the
fluorescence quantum yields showing the same trend (0.092 vs. 0.079, for DEACM‐PO42– and DEACM‐OH
respectively). This may be related to the presence of an O‐H bond in DEACM‐OH, which can confer a
more efficient non‐radiative deactivation pathway than the O‐P bond in DEACM‐PO42–. The higher energy
of the O‐H vibration (ca. 3300 cm–1 for O‐H vibration vs. 1050 cm–1 for C‐O‐P vibration)[182] is more
efficient in the dissipation of the excited state energy.
Table 3.1 – Photophysical and photochemical properties of DEACM‐OH and DEACM‐P in 10 mM Tris‐acetate buffer at 21°C.
λmax Abs (nm)
λmax Em(nm)
Φf Φchem τ
(ps) kf (s–1)
kchem (s–1)
knr (s–1)
DEACM‐OH 385 493 0.079
517 1.5×10⁸
1.8×10⁹
DEACM‐PO42–
389 497
0.092 2.9×10⁻⁴ 667
1.4×10⁸
4.4×10⁵
1.4×10⁹
DEACM‐HPO4– 0.071 a) 4.1×10⁻³ a) b) c)
a) Φf and Φchem for DEACM‐HPO4‐ at pH 5.2; at higher pH values both quantum yield for this species could not be
accurately determined. b) See Figure 3.11. c) Different kinetic model was applied to DEACM‐HPO4
–; see Figure 3.12.
The decay time of DEACM‐PO42– does not show noticeable pH dependence, except at pH values where
the weight of the component (pre‐exponential factor) is low, and the decay time associated to
DEACM‐HPO4– is dominant. It is a fair assumption that the photophysical and photochemical deactivation
94
of DEACM‐PO42– are pH independent, as evidenced by the constancy of the decay times obtained in the
pH region where this species dominates and its parallel behavior with DEACM‐OH. From the data
obtained at pH = 8.2 (fluorescence and photochemical quantum yields and decay time), where only
DEACM‐PO42– species is present in solution, the deactivation rate constants for the singlet excited state
could be calculated and are presented in Table 3.1.
Photocleavage of DEACM‐PO42– is quite inefficient when compared to the other deactivation pathways.
One might associate the increase in negative charge of the leaving group with an increase in the
activation energy for the heterolytic cleavage, probably due to the electrostatic repulsion towards the
incoming electron. This is reflected in a very low photocleavage quantum yield. Unexpectedly,
DEACM‐HPO4– decay times show pH dependence, becoming progressively shorter with the increase of
pH. Bendig and co‐workers[167,170‐172] proposed that an ion‐pair is formed in the S1 state, followed by an
escape, leading to ion‐pair separation. Then, reaction with water molecules would lead to the alcohol
photoproduct and free leaving group. No pH effect was considered.
For DEACM‐HPO4–, if the overall decay rate constant (or the reciprocal of the short decay time) is plotted
as function of the hydroxyl anion concentration, a non‐linear dependence is found (Figure 3.12), which
shows clearly that the hydroxyl (or proton) concentration has an effect in the excited state deactivating
processes.
The non‐linear correlation between overall deactivating decay and hydroxyl concentration indicates that
OH– anion does not interact directly with S1 state of DEACM‐HPO4– (referred hereafter as 1[CP] for
simplicity) through a SN2 mechanism involving direct nucleophilic attack by OH–.
Three possible mechanisms were considered to explain the sigmoidal dependence of the excited state
lifetime with the hydroxyl concentration: i) equilibrium between 1[CP] and a protonated excited state; ii)
quenching by the buffer; and iii) hydroxyl attack to an intermediary species.
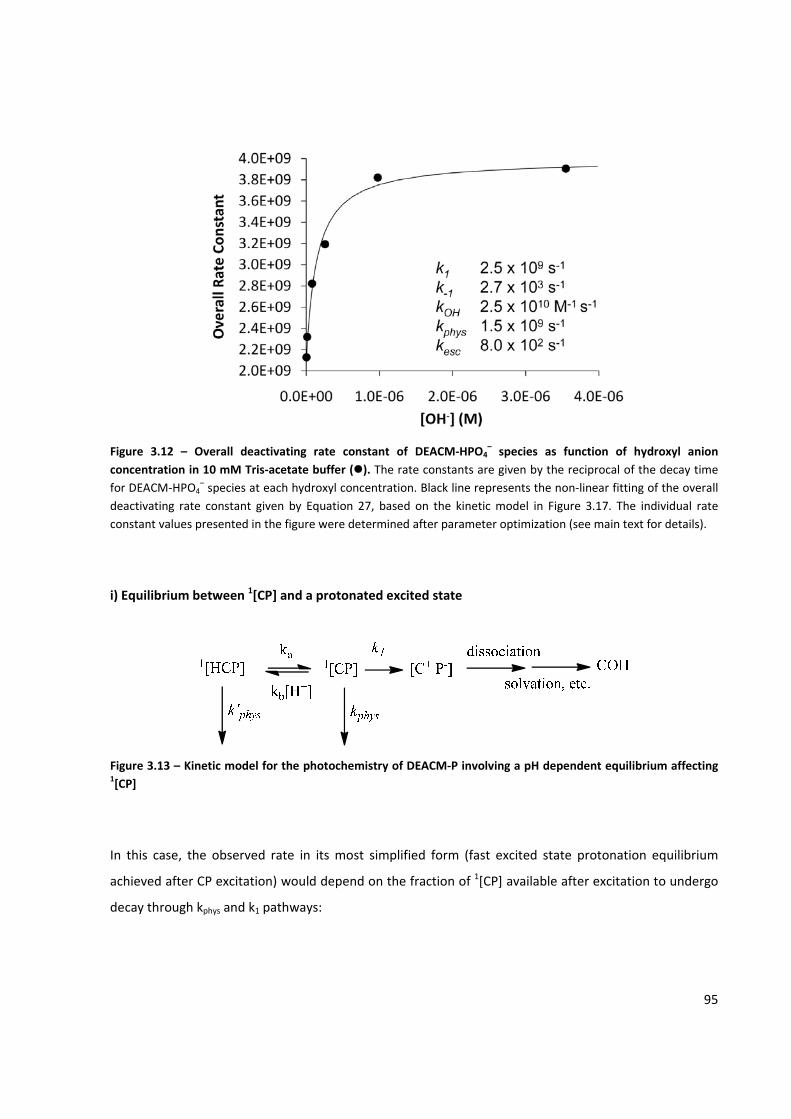
95
Figure 3.12 – Overall deactivating rate constant of DEACM‐HPO4– species as function of hydroxyl anion
concentration in 10 mM Tris‐acetate buffer ( ). The rate constants are given by the reciprocal of the decay time for DEACM‐HPO4
– species at each hydroxyl concentration. Black line represents the non‐linear fitting of the overall deactivating rate constant given by Equation 27, based on the kinetic model in Figure 3.17. The individual rate constant values presented in the figure were determined after parameter optimization (see main text for details).
i) Equilibrium between 1[CP] and a protonated excited state
Figure 3.13 – Kinetic model for the photochemistry of DEACM‐P involving a pH dependent equilibrium affecting 1[CP]
In this case, the observed rate in its most simplified form (fast excited state protonation equilibrium
achieved after CP excitation) would depend on the fraction of 1[CP] available after excitation to undergo
decay through kphys and k1 pathways:
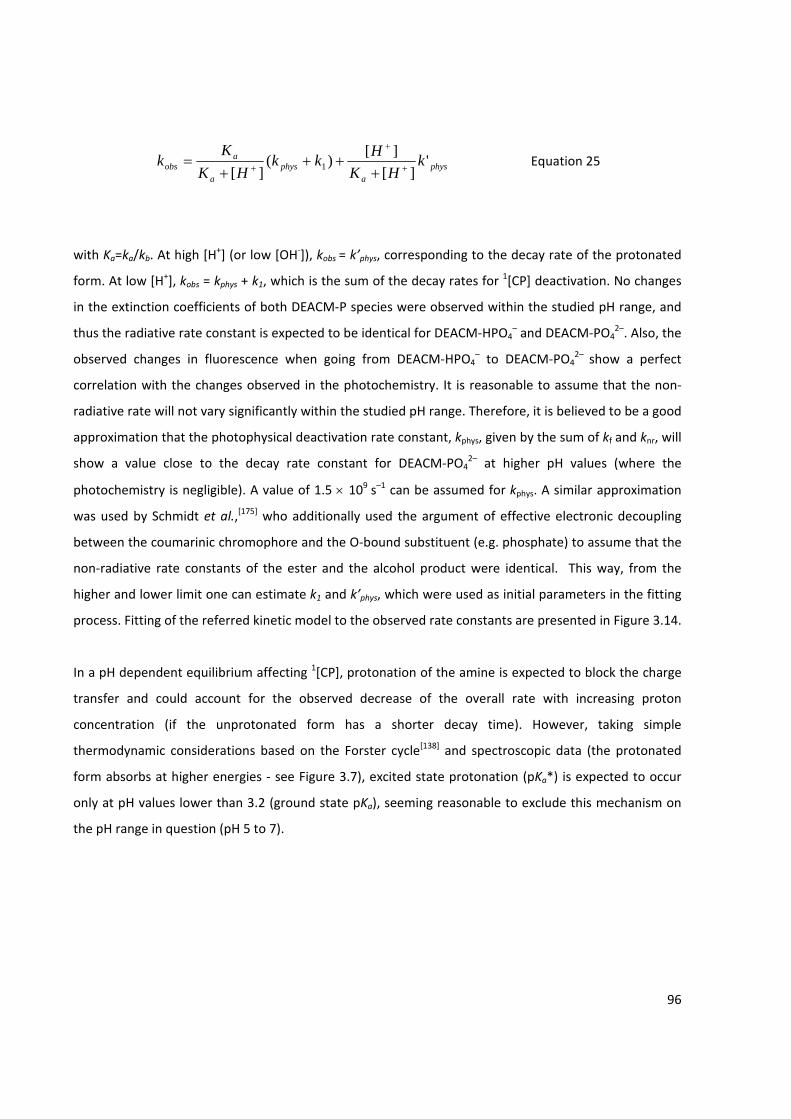
96
physa
physa
aobs k
HKHkk
HKK
k '][
][)(][ 1 +
+
+ +++
+= Equation 25
with Ka=ka/kb. At high [H+] (or low [OH‐]), kobs = k’phys, corresponding to the decay rate of the protonated
form. At low [H+], kobs = kphys + k1, which is the sum of the decay rates for 1[CP] deactivation. No changes
in the extinction coefficients of both DEACM‐P species were observed within the studied pH range, and
thus the radiative rate constant is expected to be identical for DEACM‐HPO4– and DEACM‐PO4
2–. Also, the
observed changes in fluorescence when going from DEACM‐HPO4– to DEACM‐PO4
2– show a perfect
correlation with the changes observed in the photochemistry. It is reasonable to assume that the non‐
radiative rate will not vary significantly within the studied pH range. Therefore, it is believed to be a good
approximation that the photophysical deactivation rate constant, kphys, given by the sum of kf and knr, will
show a value close to the decay rate constant for DEACM‐PO42– at higher pH values (where the
photochemistry is negligible). A value of 1.5 × 10⁹ s–1 can be assumed for kphys. A similar approximation
was used by Schmidt et al.,[175] who additionally used the argument of effective electronic decoupling
between the coumarinic chromophore and the O‐bound substituent (e.g. phosphate) to assume that the
non‐radiative rate constants of the ester and the alcohol product were identical. This way, from the
higher and lower limit one can estimate k1 and k’phys, which were used as initial parameters in the fitting
process. Fitting of the referred kinetic model to the observed rate constants are presented in Figure 3.14.
In a pH dependent equilibrium affecting 1[CP], protonation of the amine is expected to block the charge
transfer and could account for the observed decrease of the overall rate with increasing proton
concentration (if the unprotonated form has a shorter decay time). However, taking simple
thermodynamic considerations based on the Forster cycle[138] and spectroscopic data (the protonated
form absorbs at higher energies ‐ see Figure 3.7), excited state protonation (pKa*) is expected to occur
only at pH values lower than 3.2 (ground state pKa), seeming reasonable to exclude this mechanism on
the pH range in question (pH 5 to 7).
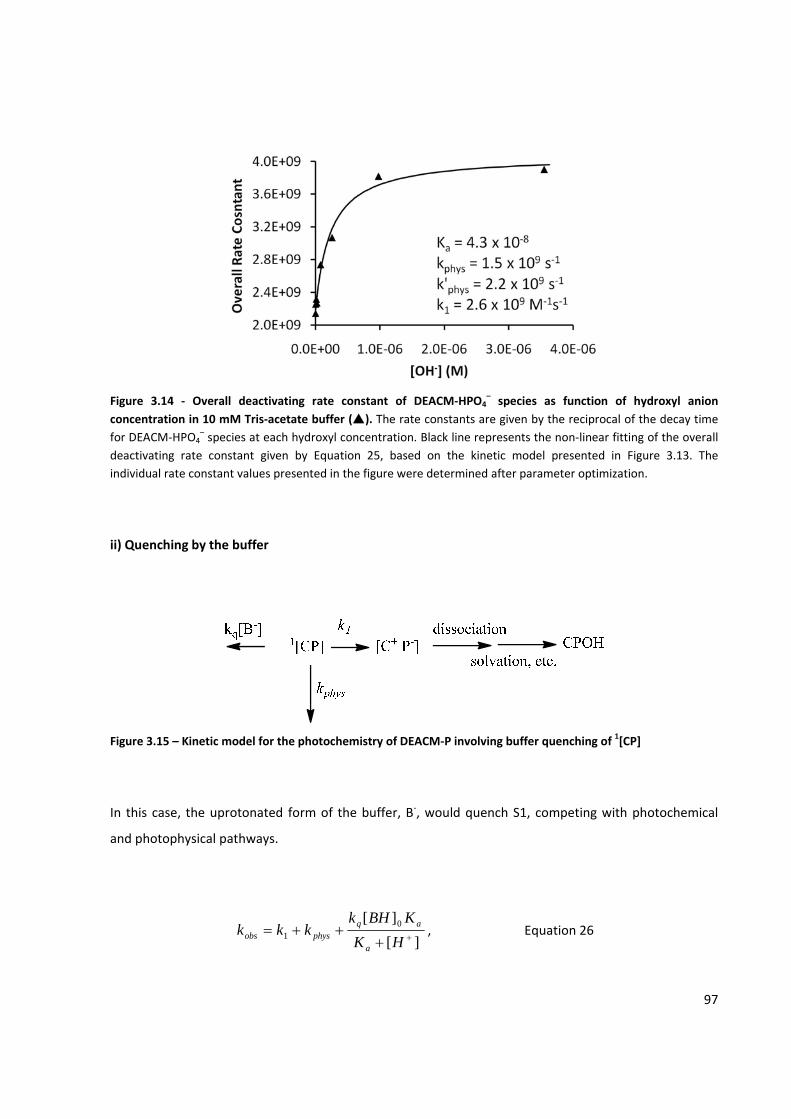
97
Figure 3.14 ‐ Overall deactivating rate constant of DEACM‐HPO4– species as function of hydroxyl anion
concentration in 10 mM Tris‐acetate buffer ( ). The rate constants are given by the reciprocal of the decay time for DEACM‐HPO4
– species at each hydroxyl concentration. Black line represents the non‐linear fitting of the overall deactivating rate constant given by Equation 25, based on the kinetic model presented in Figure 3.13. The individual rate constant values presented in the figure were determined after parameter optimization.
ii) Quenching by the buffer
Figure 3.15 – Kinetic model for the photochemistry of DEACM‐P involving buffer quenching of 1[CP]
In this case, the uprotonated form of the buffer, B‐, would quench S1, competing with photochemical
and photophysical pathways.
][][ 0
1 ++++=
HKKBHk
kkka
aqphysobs , Equation 26
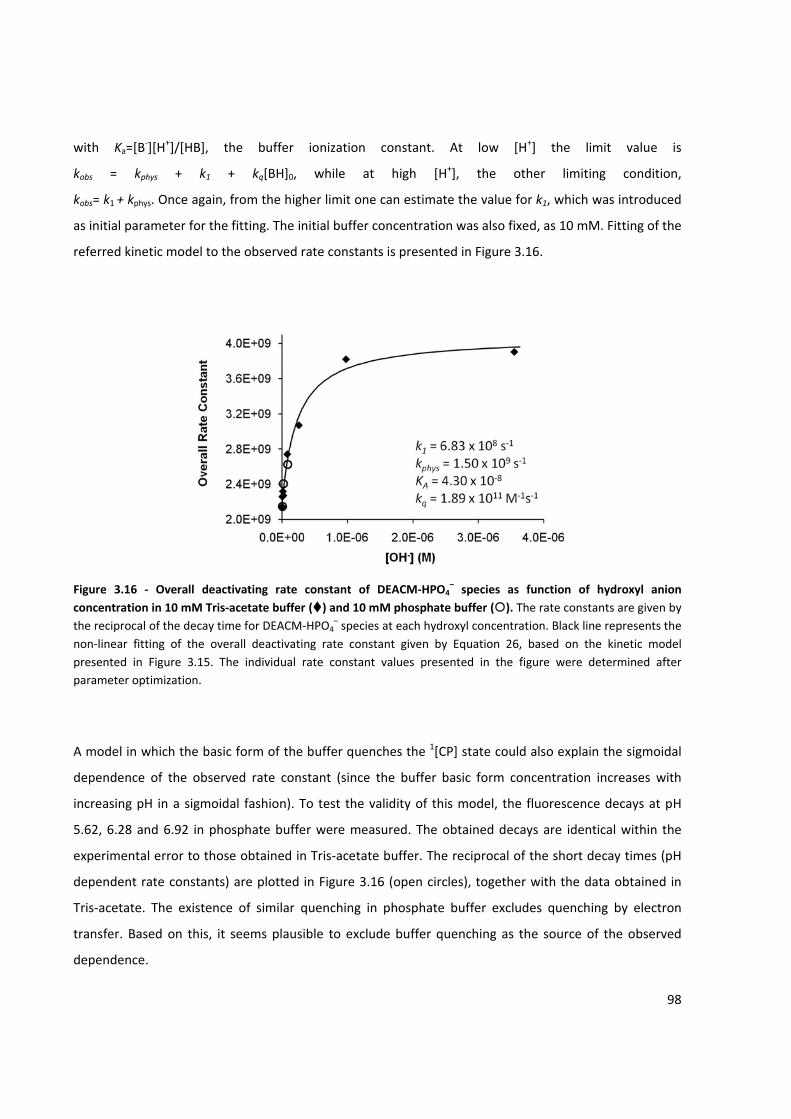
98
with Ka=[B‐][H+]/[HB], the buffer ionization constant. At low [H+] the limit value is
kobs = kphys + k1 + kq[BH]0, while at high [H+], the other limiting condition,
kobs= k1 + kphys. Once again, from the higher limit one can estimate the value for k1, which was introduced
as initial parameter for the fitting. The initial buffer concentration was also fixed, as 10 mM. Fitting of the
referred kinetic model to the observed rate constants is presented in Figure 3.16.
Figure 3.16 ‐ Overall deactivating rate constant of DEACM‐HPO4– species as function of hydroxyl anion
concentration in 10 mM Tris‐acetate buffer ( ) and 10 mM phosphate buffer ( ). The rate constants are given by the reciprocal of the decay time for DEACM‐HPO4
– species at each hydroxyl concentration. Black line represents the non‐linear fitting of the overall deactivating rate constant given by Equation 26, based on the kinetic model presented in Figure 3.15. The individual rate constant values presented in the figure were determined after parameter optimization.
A model in which the basic form of the buffer quenches the 1[CP] state could also explain the sigmoidal
dependence of the observed rate constant (since the buffer basic form concentration increases with
increasing pH in a sigmoidal fashion). To test the validity of this model, the fluorescence decays at pH
5.62, 6.28 and 6.92 in phosphate buffer were measured. The obtained decays are identical within the
experimental error to those obtained in Tris‐acetate buffer. The reciprocal of the short decay times (pH
dependent rate constants) are plotted in Figure 3.16 (open circles), together with the data obtained in
Tris‐acetate. The existence of similar quenching in phosphate buffer excludes quenching by electron
transfer. Based on this, it seems plausible to exclude buffer quenching as the source of the observed
dependence.
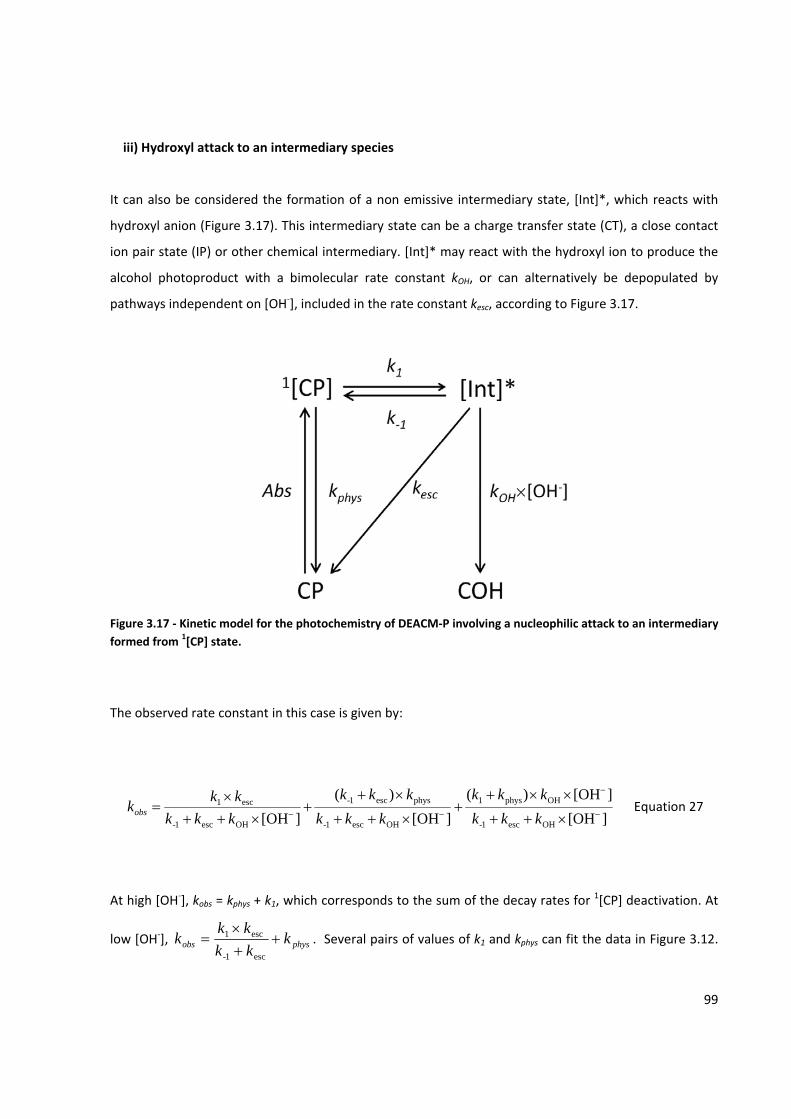
99
iii) Hydroxyl attack to an intermediary species
It can also be considered the formation of a non emissive intermediary state, [Int]*, which reacts with
hydroxyl anion (Figure 3.17). This intermediary state can be a charge transfer state (CT), a close contact
ion pair state (IP) or other chemical intermediary. [Int]* may react with the hydroxyl ion to produce the
alcohol photoproduct with a bimolecular rate constant kOH, or can alternatively be depopulated by
pathways independent on [OH‐], included in the rate constant kesc, according to Figure 3.17.
Figure 3.17 ‐ Kinetic model for the photochemistry of DEACM‐P involving a nucleophilic attack to an intermediary formed from 1[CP] state.
The observed rate constant in this case is given by:
]OH[]OH[)(
]OH[)(
]OH[ OHesc1-
OHphys1
OHesc1-
physesc1-
OHesc1-
esc1−
−
−− ×++
××++
×++
×++
×++×
=kkkkkk
kkkkkk
kkkkk
kobs Equation 27
At high [OH‐], kobs = kphys + k1, which corresponds to the sum of the decay rates for 1[CP] deactivation. At
low [OH‐], physobs kkkkk
k ++×
=esc1-
esc1 . Several pairs of values of k1 and kphys can fit the data in Figure 3.12.
100
As refered above in model i), kphys can be estimated as 1.5 × 10⁹ s‐1, which is then used to get and
approximate value of k1 for the limit of high hydroxyl concentration. The sigmoidal shape of Figure 3.12
is only obtained if the sum (k‐1 + kesc) is of the same order of magnitude than that of kOH[OH–]. On one
hand, (k‐1 + kesc) >> kOH[OH–] leads to a linear dependence and, on the other hand, (k‐1 + kesc) << kOH[OH
–]
leads to an observed rate constant independent of [OH–]. Nevertheless, several pairs of values for
kOH[OH–] and (k‐1 + kesc) can also fit the data. If we assume the highest possible value for the bimolecular
rate constant kOH, i.e., its diffusional limit (kOH = 7 × 10⁹ M‐1s‐1), calculated as the rate constant for a
diffusion‐controlled bimolecular reaction in water using Fick’s first law of diffusion and the Stokes‐
Einstein equation[183,184], the upper limit for the sum (k‐1 + kesc) that can be obtained with the presented
mechanism is in the order of 103 s‐1. It should be noted that an unusual low pseudo‐unimolecular rate
constant (kOH[OH–]) is obtained since the hydroxyl concentrations are below 10‐7 M.
As a consequence, and according to the proposed model (Figure 3.17), if the intermediary state is a close
contact ion pair and only electrostatic considerations are taken into account, the ion pair dissociation
(which is included in the term (k‐1 + kesc)) may be predicted through the Eigen equation[185].
))exp(1
)())((
1(2 w
wrrrr
Tkk Bdiss −
−×+
=−+−+πη
Equation 28
Where Tkrr
ezzw
BSεπε )(41 2
0 −+
−+
+= , η is the solvent viscosity (0.891 cP at 298 K in the case of water[184]),
T is the absolute temperature, kB the Boltzman constant, r‐ and r+ the radii of anion and cation (estimated
around 4.3 Å for OH‐ and 8.2 Å for DEACM+, respectively, from the ionic volumes obtained with
Hyperchem software package), z‐ and z+ the negative and positive charge of the ions (1 in both cases), ε0
the vacuum permittivity and εs the dielectric constant of the solvent (78.5 for water at 25°C). If only
electrostatic considerations are taken into account the ion pair dissociation is predicted to occur with a
rate constant k‐d = 6.6 x 10⁸ s‐1. Unless some strong (non electrostatic) interaction is present, which could
prevent the ion pair dissociation (increasing its life time to the millisecond time scale), the ion pair
intermediary may not seem plausible.
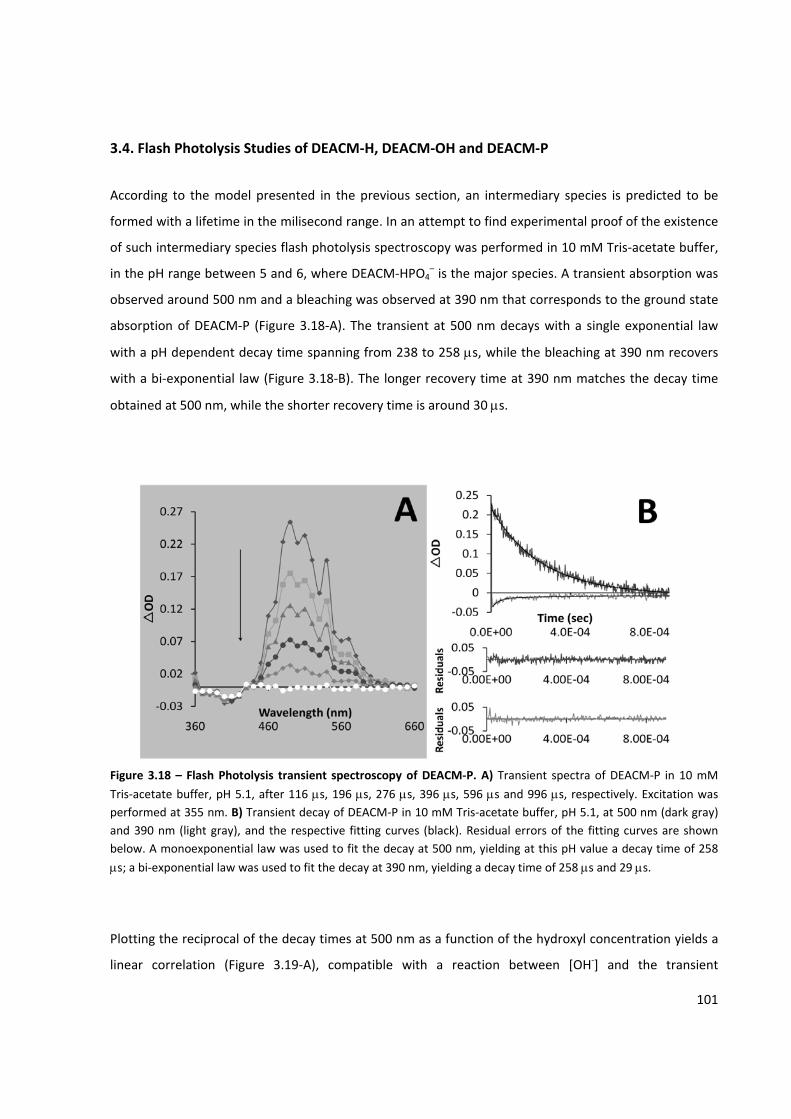
101
3.4. Flash Photolysis Studies of DEACM‐H, DEACM‐OH and DEACM‐P
According to the model presented in the previous section, an intermediary species is predicted to be
formed with a lifetime in the milisecond range. In an attempt to find experimental proof of the existence
of such intermediary species flash photolysis spectroscopy was performed in 10 mM Tris‐acetate buffer,
in the pH range between 5 and 6, where DEACM‐HPO4– is the major species. A transient absorption was
observed around 500 nm and a bleaching was observed at 390 nm that corresponds to the ground state
absorption of DEACM‐P (Figure 3.18‐A). The transient at 500 nm decays with a single exponential law
with a pH dependent decay time spanning from 238 to 258 μs, while the bleaching at 390 nm recovers
with a bi‐exponential law (Figure 3.18‐B). The longer recovery time at 390 nm matches the decay time
obtained at 500 nm, while the shorter recovery time is around 30 μs.
Figure 3.18 – Flash Photolysis transient spectroscopy of DEACM‐P. A) Transient spectra of DEACM‐P in 10 mM
Tris‐acetate buffer, pH 5.1, after 116 μs, 196 μs, 276 μs, 396 μs, 596 μs and 996 μs, respectively. Excitation was performed at 355 nm. B) Transient decay of DEACM‐P in 10 mM Tris‐acetate buffer, pH 5.1, at 500 nm (dark gray) and 390 nm (light gray), and the respective fitting curves (black). Residual errors of the fitting curves are shown below. A monoexponential law was used to fit the decay at 500 nm, yielding at this pH value a decay time of 258
μs; a bi‐exponential law was used to fit the decay at 390 nm, yielding a decay time of 258 μs and 29 μs.
Plotting the reciprocal of the decay times at 500 nm as a function of the hydroxyl concentration yields a
linear correlation (Figure 3.19‐A), compatible with a reaction between [OH‐] and the transient
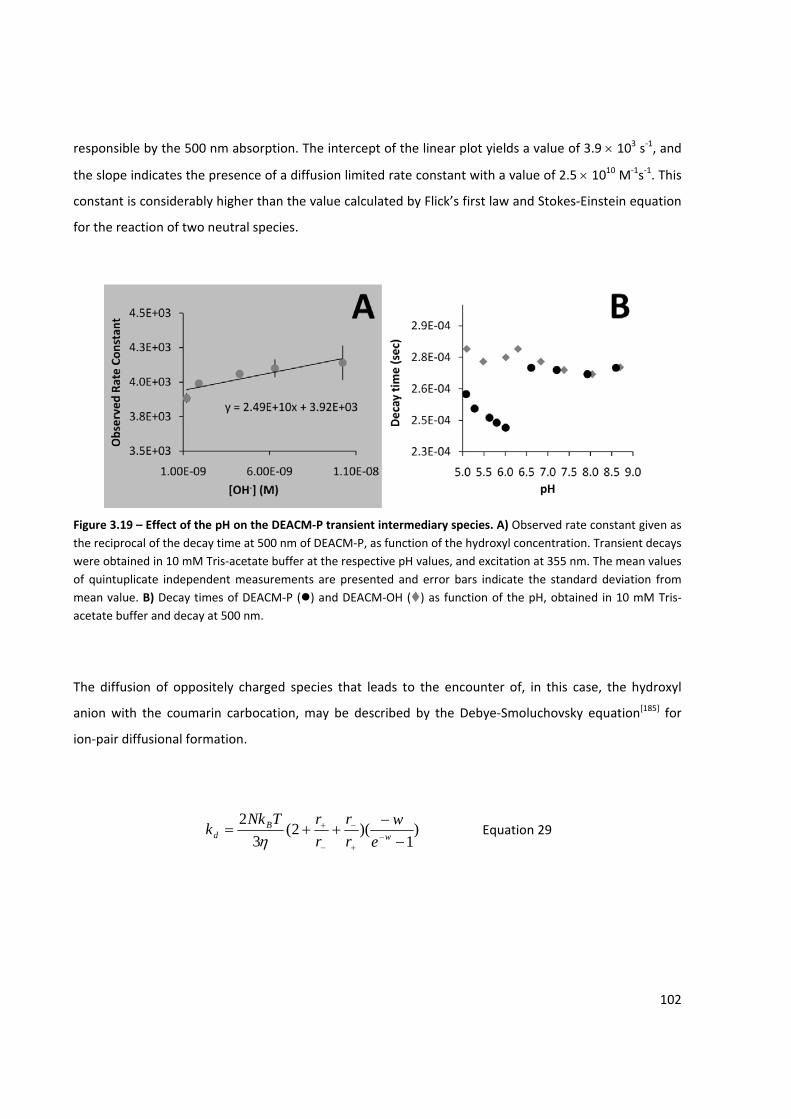
102
responsible by the 500 nm absorption. The intercept of the linear plot yields a value of 3.9 × 10³ s‐1, and
the slope indicates the presence of a diffusion limited rate constant with a value of 2.5 × 10¹⁰ M‐1s‐1. This
constant is considerably higher than the value calculated by Flick’s first law and Stokes‐Einstein equation
for the reaction of two neutral species.
Figure 3.19 – Effect of the pH on the DEACM‐P transient intermediary species. A) Observed rate constant given as the reciprocal of the decay time at 500 nm of DEACM‐P, as function of the hydroxyl concentration. Transient decays were obtained in 10 mM Tris‐acetate buffer at the respective pH values, and excitation at 355 nm. The mean values of quintuplicate independent measurements are presented and error bars indicate the standard deviation from mean value. B) Decay times of DEACM‐P ( ) and DEACM‐OH ( ) as function of the pH, obtained in 10 mM Tris‐acetate buffer and decay at 500 nm.
The diffusion of oppositely charged species that leads to the encounter of, in this case, the hydroxyl
anion with the coumarin carbocation, may be described by the Debye‐Smoluchovsky equation[185] for
ion‐pair diffusional formation.
)1
)(2(3
2−
−++= −
+
−
−
+w
Bd e
wrr
rrTNk
kη
Equation 29
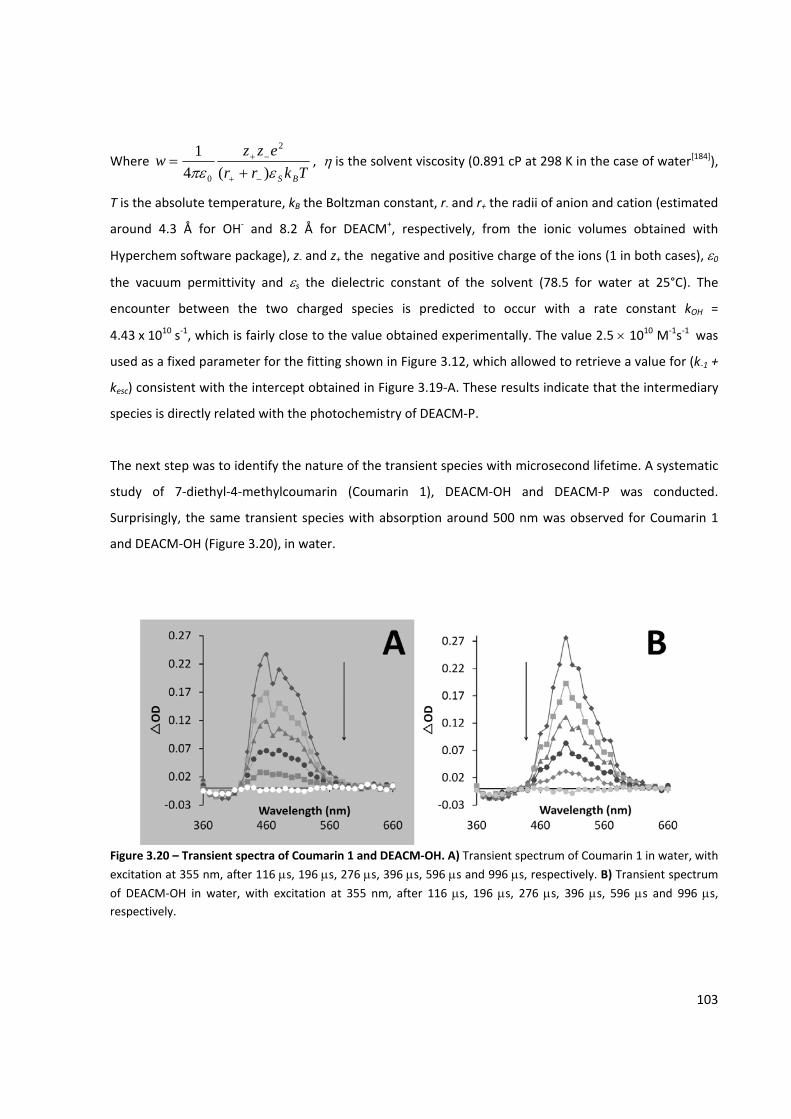
103
Where Tkrr
ezzw
BSεπε )(41 2
0 −+
−+
+= , η is the solvent viscosity (0.891 cP at 298 K in the case of water[184]),
T is the absolute temperature, kB the Boltzman constant, r‐ and r+ the radii of anion and cation (estimated
around 4.3 Å for OH‐ and 8.2 Å for DEACM+, respectively, from the ionic volumes obtained with
Hyperchem software package), z‐ and z+ the negative and positive charge of the ions (1 in both cases), ε0
the vacuum permittivity and εs the dielectric constant of the solvent (78.5 for water at 25°C). The
encounter between the two charged species is predicted to occur with a rate constant kOH =
4.43 x 10¹⁰ s‐1, which is fairly close to the value obtained experimentally. The value 2.5 × 10¹⁰ M‐1s‐1 was
used as a fixed parameter for the fitting shown in Figure 3.12, which allowed to retrieve a value for (k‐1 +
kesc) consistent with the intercept obtained in Figure 3.19‐A. These results indicate that the intermediary
species is directly related with the photochemistry of DEACM‐P.
The next step was to identify the nature of the transient species with microsecond lifetime. A systematic
study of 7‐diethyl‐4‐methylcoumarin (Coumarin 1), DEACM‐OH and DEACM‐P was conducted.
Surprisingly, the same transient species with absorption around 500 nm was observed for Coumarin 1
and DEACM‐OH (Figure 3.20), in water.
Figure 3.20 – Transient spectra of Coumarin 1 and DEACM‐OH. A) Transient spectrum of Coumarin 1 in water, with
excitation at 355 nm, after 116 μs, 196 μs, 276 μs, 396 μs, 596 μs and 996 μs, respectively. B) Transient spectrum
of DEACM‐OH in water, with excitation at 355 nm, after 116 μs, 196 μs, 276 μs, 396 μs, 596 μs and 996 μs, respectively.
104
As previously seen for DEACM‐P, both compounds present a transient absorption with positive OD,
with Coumarin 1 slightly blue‐shifted when comparing to DEACM‐OH and DEACM‐P, and a bleaching at
390 nm that corresponds to the ground state absorption of coumarin. The transient at 500 nm decays
with a single exponential law with a pH independent decay time (245 μs for Coumarin 1 and 223 μs for
DEACM‐OH), while the bleaching at 390 nm recovers with a bi‐exponential law. The longer recovery time
at 390 nm matches the decay time obtained at 500 nm, while the shorter recovery time is 26 μs and 38
μs, for Coumarin 1 and DEACM‐OH respectively. It should be noted that the decays of the three
compounds at 390 nm present a final small negative absorption, i.e. the final absorption after decay is
slightly lower than prior to excitation. Steady‐state absorption spectra before and after flash‐photolysis
experiments revealed a considerable reduction in intensity, although band shape and width remained
the same. Both these observations indicate that coumarin molecules were suffering some degradation
upon laser (or flash lamp) excitation. To prevent the observed degradation during experiments it was
necessary to reduce the amount of readings (and consequently laser and flash‐lamp irradiation) for each
decay measurement, increasing significantly the noise level.
The long decay times in the microsecond timescale suggested that the transient species might be triplet
in nature. Intersystem crossing was described as residual at room temperature,[145,147,186,187] and not
participating in 4‐methylcoumarin ester derivatives photochemistry.[167,170‐172] However, the assumption
for the absence of triplet photochemistry by the german group might have been merely speculative. It
was shown that the transient species identified by flash photolysis spectroscopy is directly related to
photochemistry, although it was puzzling why this intermediary species is also observed in DEACM‐OH,
and specially, in Coumarin 1. A closer look into the effect of the pH in the decay times of the transient
absorbing at 500 nm for DEACM‐P and DEACM‐OH show that a clear dependence is observed for
DEACM‐P in the pH range where the photoactive DEACM‐HPO4‐ species is present (up to pH 6 – Figure
3.19‐B). For the DEACM‐PO42‐ species, it was observed no effect of the hydroxyl concentration in the
transient decay time, and they are similar to the DEACM‐OH decay times. This transient state thus seems
to be part of intrinsic coumarin deactivation, which only leads to photochemical reaction under certain
conditions (in this case, the leaving group nature). In order to answer the question if the observed
transient absorption corresponds to a triplet coumarin species, the presence of oxygen and
concentration effect was assessed.
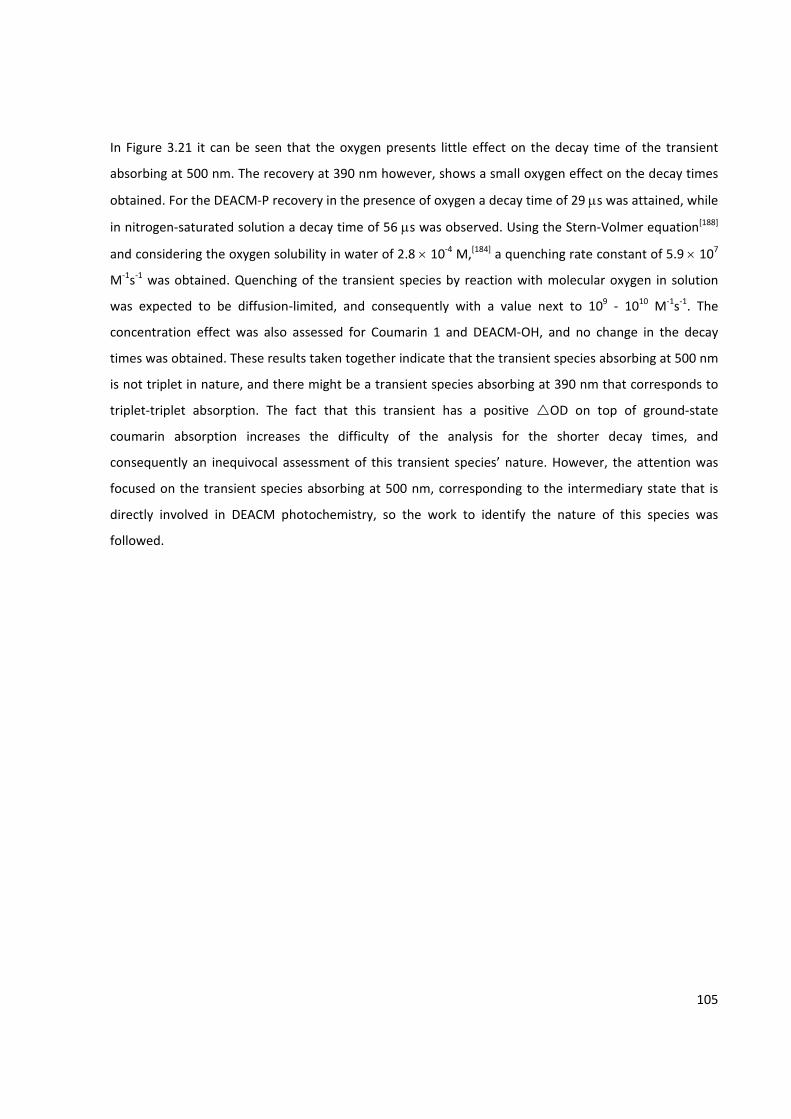
105
In Figure 3.21 it can be seen that the oxygen presents little effect on the decay time of the transient
absorbing at 500 nm. The recovery at 390 nm however, shows a small oxygen effect on the decay times
obtained. For the DEACM‐P recovery in the presence of oxygen a decay time of 29 μs was attained, while
in nitrogen‐saturated solution a decay time of 56 μs was observed. Using the Stern‐Volmer equation[188]
and considering the oxygen solubility in water of 2.8 × 10‐4 M,[184] a quenching rate constant of 5.9 × 10⁷
M‐1s‐1 was obtained. Quenching of the transient species by reaction with molecular oxygen in solution
was expected to be diffusion‐limited, and consequently with a value next to 109 ‐ 1010 M‐1s‐1. The
concentration effect was also assessed for Coumarin 1 and DEACM‐OH, and no change in the decay
times was obtained. These results taken together indicate that the transient species absorbing at 500 nm
is not triplet in nature, and there might be a transient species absorbing at 390 nm that corresponds to
triplet‐triplet absorption. The fact that this transient has a positive OD on top of ground‐state
coumarin absorption increases the difficulty of the analysis for the shorter decay times, and
consequently an inequivocal assessment of this transient species’ nature. However, the attention was
focused on the transient species absorbing at 500 nm, corresponding to the intermediary state that is
directly involved in DEACM photochemistry, so the work to identify the nature of this species was
followed.
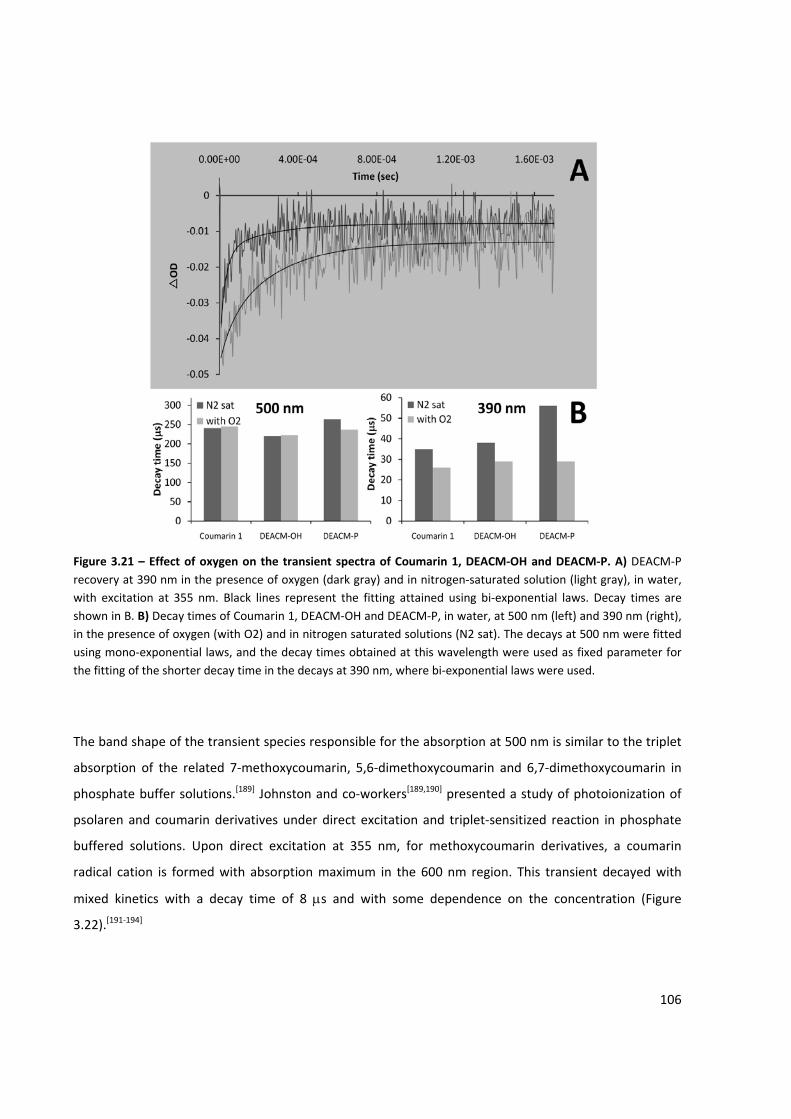
106
Figure 3.21 – Effect of oxygen on the transient spectra of Coumarin 1, DEACM‐OH and DEACM‐P. A) DEACM‐P recovery at 390 nm in the presence of oxygen (dark gray) and in nitrogen‐saturated solution (light gray), in water, with excitation at 355 nm. Black lines represent the fitting attained using bi‐exponential laws. Decay times are shown in B. B) Decay times of Coumarin 1, DEACM‐OH and DEACM‐P, in water, at 500 nm (left) and 390 nm (right), in the presence of oxygen (with O2) and in nitrogen saturated solutions (N2 sat). The decays at 500 nm were fitted using mono‐exponential laws, and the decay times obtained at this wavelength were used as fixed parameter for the fitting of the shorter decay time in the decays at 390 nm, where bi‐exponential laws were used.
The band shape of the transient species responsible for the absorption at 500 nm is similar to the triplet
absorption of the related 7‐methoxycoumarin, 5,6‐dimethoxycoumarin and 6,7‐dimethoxycoumarin in
phosphate buffer solutions.[189] Johnston and co‐workers[189,190] presented a study of photoionization of
psolaren and coumarin derivatives under direct excitation and triplet‐sensitized reaction in phosphate
buffered solutions. Upon direct excitation at 355 nm, for methoxycoumarin derivatives, a coumarin
radical cation is formed with absorption maximum in the 600 nm region. This transient decayed with
mixed kinetics with a decay time of 8 μs and with some dependence on the concentration (Figure
3.22).[191‐194]
107
Figure 3.22 – Transient absorption spectra of 6,7‐dimethoxycoumarin. Transient obtained via direct excitation at
355 nm (OD355 = 0.4) of oxygen‐saturated aqueous phosphate buffer (pH = 7.0) at delays of 1.4, 3.4, 13 and 35 μs after the laser pulse. Figure taken from [189].
No spectral changes were found associated with the presence of oxygen. In the 400‐500 nm region,
broad absorption bands were also observed, that were dependent on the presence of oxygen and were
assigned as triplet‐triplet absorption, in agreement with previous reports.[191‐194] In the presence of
oxygen this band was strongly quenched. One of the key findings for the assignment of the 600 nm
absorbing transient as a coumarin radical cation was the presence of a sharp absorption at 700 nm,
correspondent to a solvated electron ejected from the coumarin to solvent medium.
On one hand, the transient species observed for the DEACM derivatives could not be identified as triplet‐
triplet absorption due to the absence of quenching by oxygen. On the other hand, the absence of
concentration effect on the transients (within the studied concentration range), reported to be present
in methoxycoumarin derivatives, prevent the classification of the transient as being the DEACM radical
cation. Also, the reported methoxycoumarin radical cation transient spectra are red‐shifted related to
the DEACM transients and with shorter decay times (8 μs vs. 270 μs). Although methoxy‐ and amino‐
coumarin derivatives are closely related in structure, both substituents affect coumarin photophysics
and photochemistry very differently (as indicated in Sections 1.4.2 and 1.4.3). For this reason it is hard to
predict if the absorption wavelength and decay time differences suffice for ruling out the assignment of
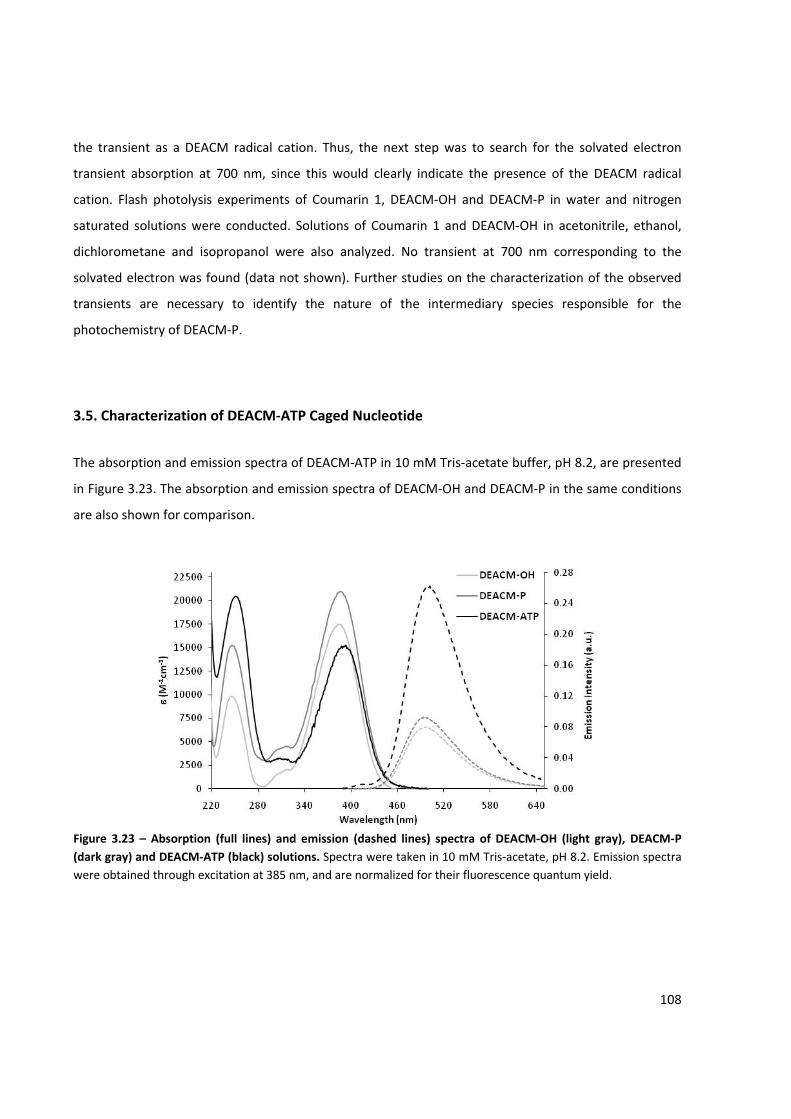
108
the transient as a DEACM radical cation. Thus, the next step was to search for the solvated electron
transient absorption at 700 nm, since this would clearly indicate the presence of the DEACM radical
cation. Flash photolysis experiments of Coumarin 1, DEACM‐OH and DEACM‐P in water and nitrogen
saturated solutions were conducted. Solutions of Coumarin 1 and DEACM‐OH in acetonitrile, ethanol,
dichlorometane and isopropanol were also analyzed. No transient at 700 nm corresponding to the
solvated electron was found (data not shown). Further studies on the characterization of the observed
transients are necessary to identify the nature of the intermediary species responsible for the
photochemistry of DEACM‐P.
3.5. Characterization of DEACM‐ATP Caged Nucleotide
The absorption and emission spectra of DEACM‐ATP in 10 mM Tris‐acetate buffer, pH 8.2, are presented
in Figure 3.23. The absorption and emission spectra of DEACM‐OH and DEACM‐P in the same conditions
are also shown for comparison.
Figure 3.23 – Absorption (full lines) and emission (dashed lines) spectra of DEACM‐OH (light gray), DEACM‐P (dark gray) and DEACM‐ATP (black) solutions. Spectra were taken in 10 mM Tris‐acetate, pH 8.2. Emission spectra were obtained through excitation at 385 nm, and are normalized for their fluorescence quantum yield.
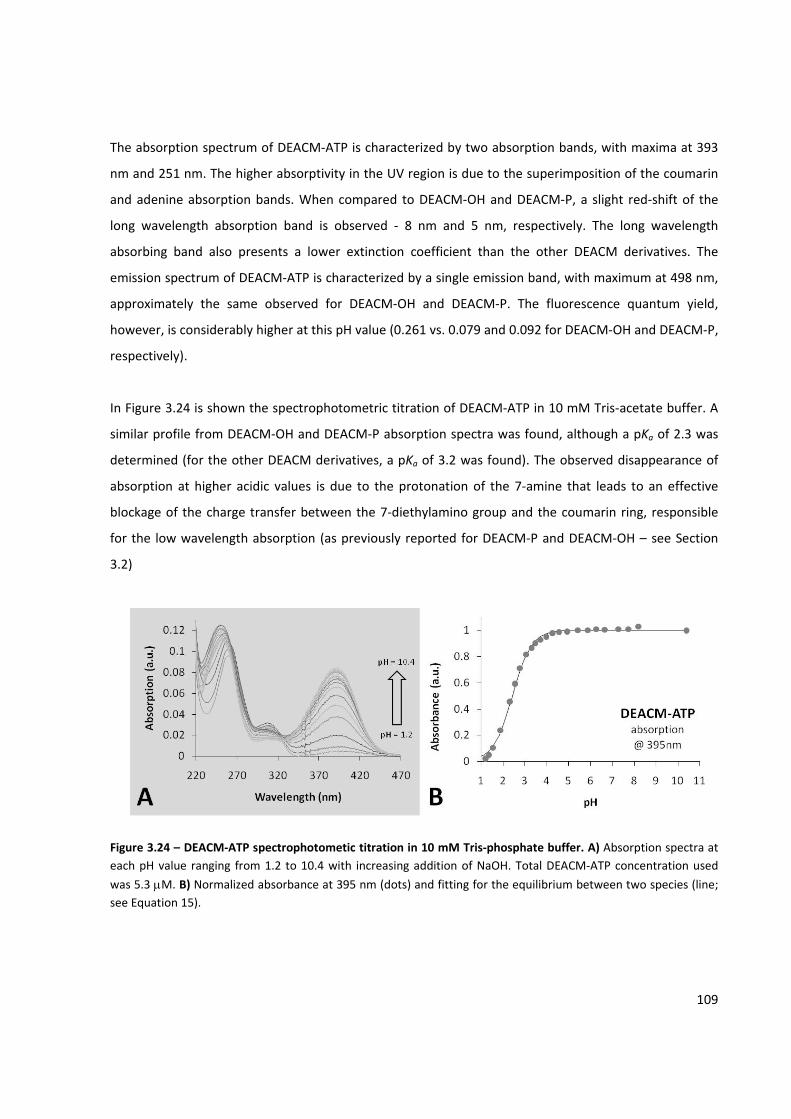
109
The absorption spectrum of DEACM‐ATP is characterized by two absorption bands, with maxima at 393
nm and 251 nm. The higher absorptivity in the UV region is due to the superimposition of the coumarin
and adenine absorption bands. When compared to DEACM‐OH and DEACM‐P, a slight red‐shift of the
long wavelength absorption band is observed ‐ 8 nm and 5 nm, respectively. The long wavelength
absorbing band also presents a lower extinction coefficient than the other DEACM derivatives. The
emission spectrum of DEACM‐ATP is characterized by a single emission band, with maximum at 498 nm,
approximately the same observed for DEACM‐OH and DEACM‐P. The fluorescence quantum yield,
however, is considerably higher at this pH value (0.261 vs. 0.079 and 0.092 for DEACM‐OH and DEACM‐P,
respectively).
In Figure 3.24 is shown the spectrophotometric titration of DEACM‐ATP in 10 mM Tris‐acetate buffer. A
similar profile from DEACM‐OH and DEACM‐P absorption spectra was found, although a pKa of 2.3 was
determined (for the other DEACM derivatives, a pKa of 3.2 was found). The observed disappearance of
absorption at higher acidic values is due to the protonation of the 7‐amine that leads to an effective
blockage of the charge transfer between the 7‐diethylamino group and the coumarin ring, responsible
for the low wavelength absorption (as previously reported for DEACM‐P and DEACM‐OH – see Section
3.2)
Figure 3.24 – DEACM‐ATP spectrophotometic titration in 10 mM Tris‐phosphate buffer. A) Absorption spectra at each pH value ranging from 1.2 to 10.4 with increasing addition of NaOH. Total DEACM‐ATP concentration used
was 5.3 μM. B) Normalized absorbance at 395 nm (dots) and fitting for the equilibrium between two species (line; see Equation 15).
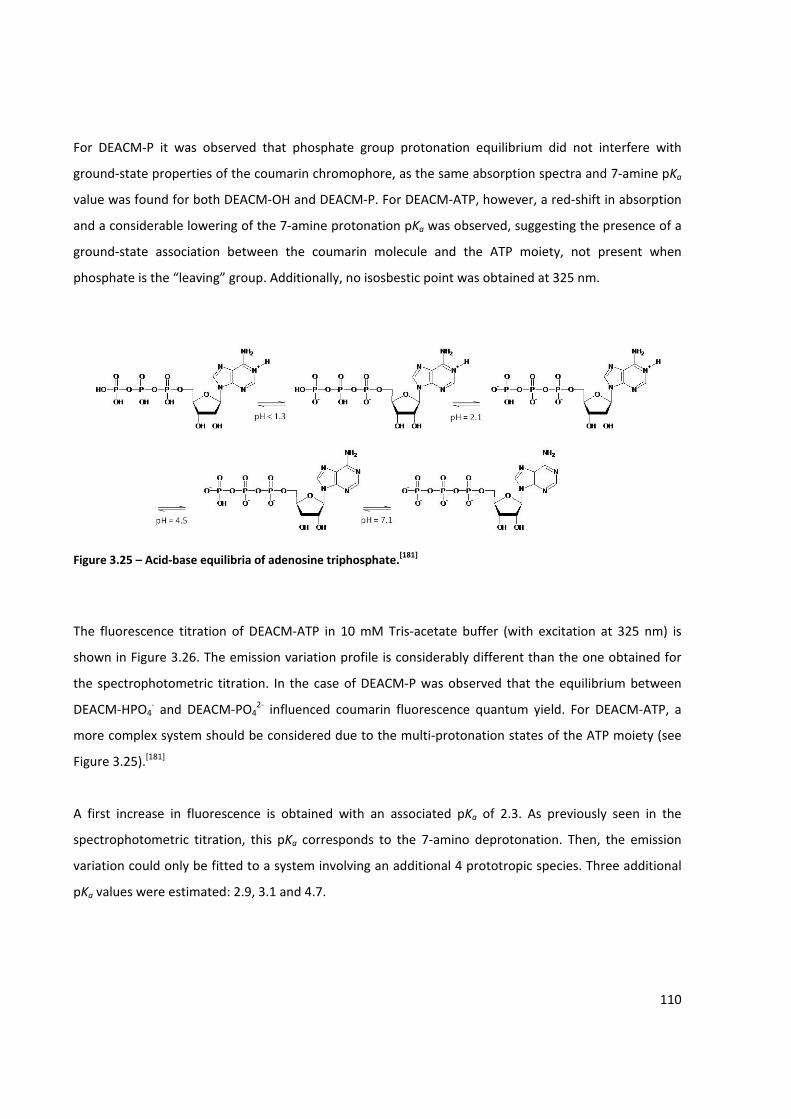
110
For DEACM‐P it was observed that phosphate group protonation equilibrium did not interfere with
ground‐state properties of the coumarin chromophore, as the same absorption spectra and 7‐amine pKa
value was found for both DEACM‐OH and DEACM‐P. For DEACM‐ATP, however, a red‐shift in absorption
and a considerable lowering of the 7‐amine protonation pKa was observed, suggesting the presence of a
ground‐state association between the coumarin molecule and the ATP moiety, not present when
phosphate is the “leaving” group. Additionally, no isosbestic point was obtained at 325 nm.
Figure 3.25 – Acid‐base equilibria of adenosine triphosphate.[181]
The fluorescence titration of DEACM‐ATP in 10 mM Tris‐acetate buffer (with excitation at 325 nm) is
shown in Figure 3.26. The emission variation profile is considerably different than the one obtained for
the spectrophotometric titration. In the case of DEACM‐P was observed that the equilibrium between
DEACM‐HPO4‐ and DEACM‐PO4
2‐ influenced coumarin fluorescence quantum yield. For DEACM‐ATP, a
more complex system should be considered due to the multi‐protonation states of the ATP moiety (see
Figure 3.25).[181]
A first increase in fluorescence is obtained with an associated pKa of 2.3. As previously seen in the
spectrophotometric titration, this pKa corresponds to the 7‐amino deprotonation. Then, the emission
variation could only be fitted to a system involving an additional 4 prototropic species. Three additional
pKa values were estimated: 2.9, 3.1 and 4.7.
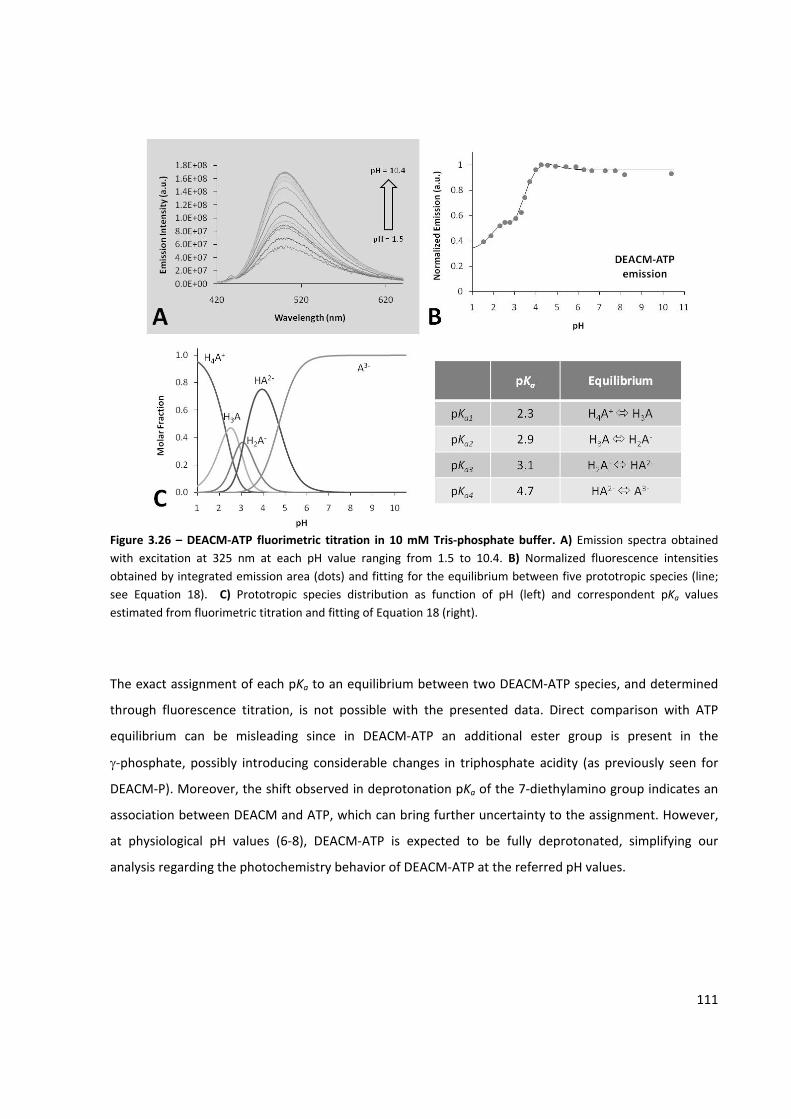
111
Figure 3.26 – DEACM‐ATP fluorimetric titration in 10 mM Tris‐phosphate buffer. A) Emission spectra obtained with excitation at 325 nm at each pH value ranging from 1.5 to 10.4. B) Normalized fluorescence intensities obtained by integrated emission area (dots) and fitting for the equilibrium between five prototropic species (line; see Equation 18). C) Prototropic species distribution as function of pH (left) and correspondent pKa values estimated from fluorimetric titration and fitting of Equation 18 (right).
The exact assignment of each pKa to an equilibrium between two DEACM‐ATP species, and determined
through fluorescence titration, is not possible with the presented data. Direct comparison with ATP
equilibrium can be misleading since in DEACM‐ATP an additional ester group is present in the
γ‐phosphate, possibly introducing considerable changes in triphosphate acidity (as previously seen for
DEACM‐P). Moreover, the shift observed in deprotonation pKa of the 7‐diethylamino group indicates an
association between DEACM and ATP, which can bring further uncertainty to the assignment. However,
at physiological pH values (6‐8), DEACM‐ATP is expected to be fully deprotonated, simplifying our
analysis regarding the photochemistry behavior of DEACM‐ATP at the referred pH values.
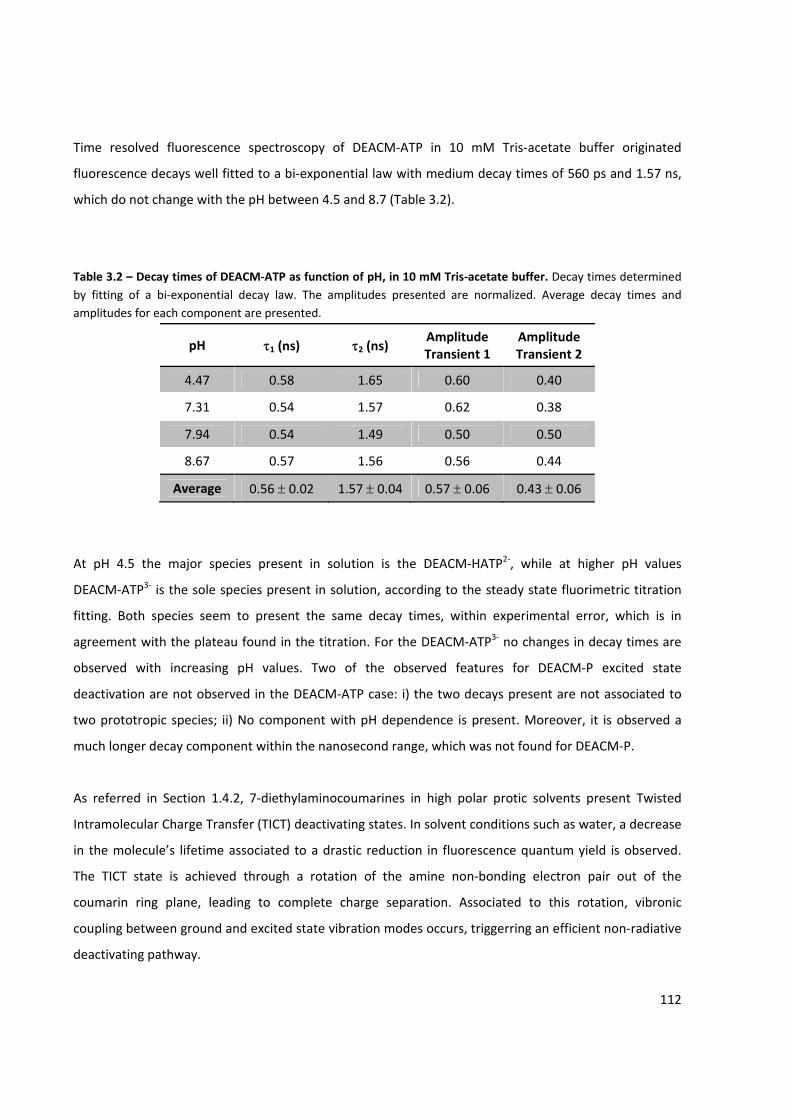
112
Time resolved fluorescence spectroscopy of DEACM‐ATP in 10 mM Tris‐acetate buffer originated
fluorescence decays well fitted to a bi‐exponential law with medium decay times of 560 ps and 1.57 ns,
which do not change with the pH between 4.5 and 8.7 (Table 3.2).
Table 3.2 – Decay times of DEACM‐ATP as function of pH, in 10 mM Tris‐acetate buffer. Decay times determined by fitting of a bi‐exponential decay law. The amplitudes presented are normalized. Average decay times and amplitudes for each component are presented.
pH τ1 (ns) τ2 (ns) Amplitude Transient 1
Amplitude Transient 2
4.47 0.58 1.65 0.60 0.40
7.31 0.54 1.57 0.62 0.38
7.94 0.54 1.49 0.50 0.50
8.67 0.57 1.56 0.56 0.44
Average 0.56 ± 0.02 1.57 ± 0.04 0.57 ± 0.06 0.43 ± 0.06
At pH 4.5 the major species present in solution is the DEACM‐HATP2‐, while at higher pH values
DEACM‐ATP3‐ is the sole species present in solution, according to the steady state fluorimetric titration
fitting. Both species seem to present the same decay times, within experimental error, which is in
agreement with the plateau found in the titration. For the DEACM‐ATP3‐ no changes in decay times are
observed with increasing pH values. Two of the observed features for DEACM‐P excited state
deactivation are not observed in the DEACM‐ATP case: i) the two decays present are not associated to
two prototropic species; ii) No component with pH dependence is present. Moreover, it is observed a
much longer decay component within the nanosecond range, which was not found for DEACM‐P.
As referred in Section 1.4.2, 7‐diethylaminocoumarines in high polar protic solvents present Twisted
Intramolecular Charge Transfer (TICT) deactivating states. In solvent conditions such as water, a decrease
in the molecule’s lifetime associated to a drastic reduction in fluorescence quantum yield is observed.
The TICT state is achieved through a rotation of the amine non‐bonding electron pair out of the
coumarin ring plane, leading to complete charge separation. Associated to this rotation, vibronic
coupling between ground and excited state vibration modes occurs, triggerring an efficient non‐radiative
deactivating pathway.
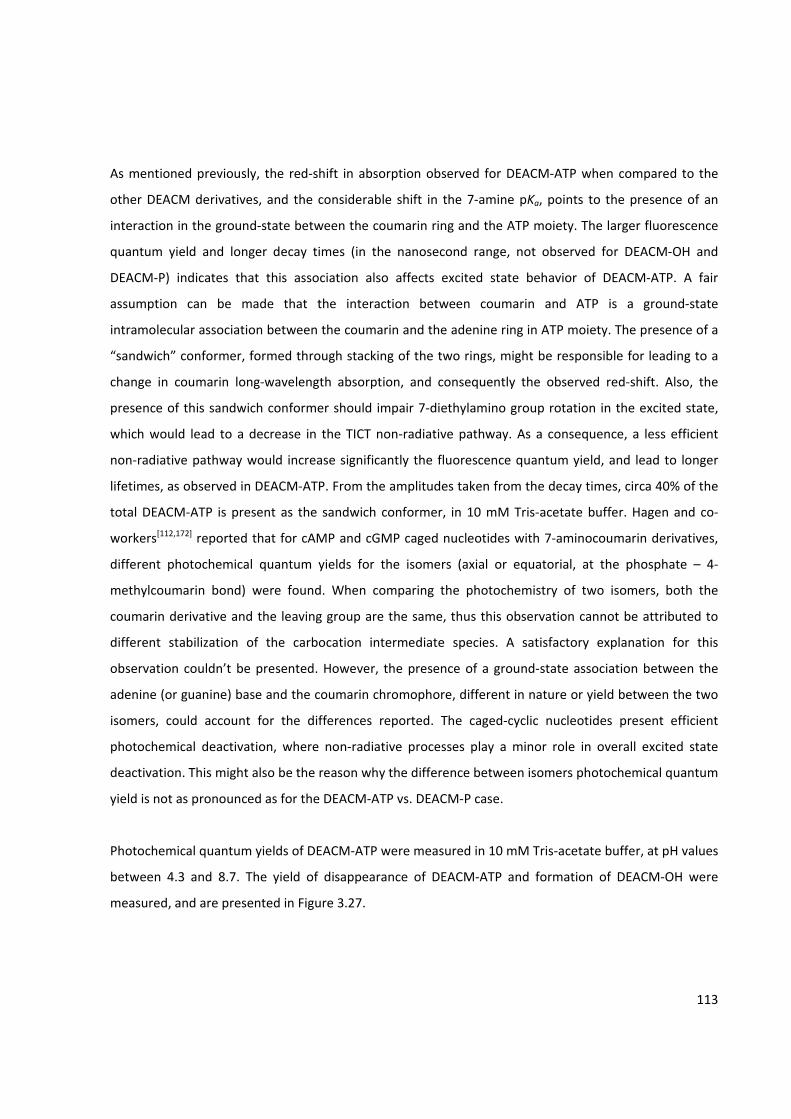
113
As mentioned previously, the red‐shift in absorption observed for DEACM‐ATP when compared to the
other DEACM derivatives, and the considerable shift in the 7‐amine pKa, points to the presence of an
interaction in the ground‐state between the coumarin ring and the ATP moiety. The larger fluorescence
quantum yield and longer decay times (in the nanosecond range, not observed for DEACM‐OH and
DEACM‐P) indicates that this association also affects excited state behavior of DEACM‐ATP. A fair
assumption can be made that the interaction between coumarin and ATP is a ground‐state
intramolecular association between the coumarin and the adenine ring in ATP moiety. The presence of a
“sandwich” conformer, formed through stacking of the two rings, might be responsible for leading to a
change in coumarin long‐wavelength absorption, and consequently the observed red‐shift. Also, the
presence of this sandwich conformer should impair 7‐diethylamino group rotation in the excited state,
which would lead to a decrease in the TICT non‐radiative pathway. As a consequence, a less efficient
non‐radiative pathway would increase significantly the fluorescence quantum yield, and lead to longer
lifetimes, as observed in DEACM‐ATP. From the amplitudes taken from the decay times, circa 40% of the
total DEACM‐ATP is present as the sandwich conformer, in 10 mM Tris‐acetate buffer. Hagen and co‐
workers[112,172] reported that for cAMP and cGMP caged nucleotides with 7‐aminocoumarin derivatives,
different photochemical quantum yields for the isomers (axial or equatorial, at the phosphate – 4‐
methylcoumarin bond) were found. When comparing the photochemistry of two isomers, both the
coumarin derivative and the leaving group are the same, thus this observation cannot be attributed to
different stabilization of the carbocation intermediate species. A satisfactory explanation for this
observation couldn’t be presented. However, the presence of a ground‐state association between the
adenine (or guanine) base and the coumarin chromophore, different in nature or yield between the two
isomers, could account for the differences reported. The caged‐cyclic nucleotides present efficient
photochemical deactivation, where non‐radiative processes play a minor role in overall excited state
deactivation. This might also be the reason why the difference between isomers photochemical quantum
yield is not as pronounced as for the DEACM‐ATP vs. DEACM‐P case.
Photochemical quantum yields of DEACM‐ATP were measured in 10 mM Tris‐acetate buffer, at pH values
between 4.3 and 8.7. The yield of disappearance of DEACM‐ATP and formation of DEACM‐OH were
measured, and are presented in Figure 3.27.
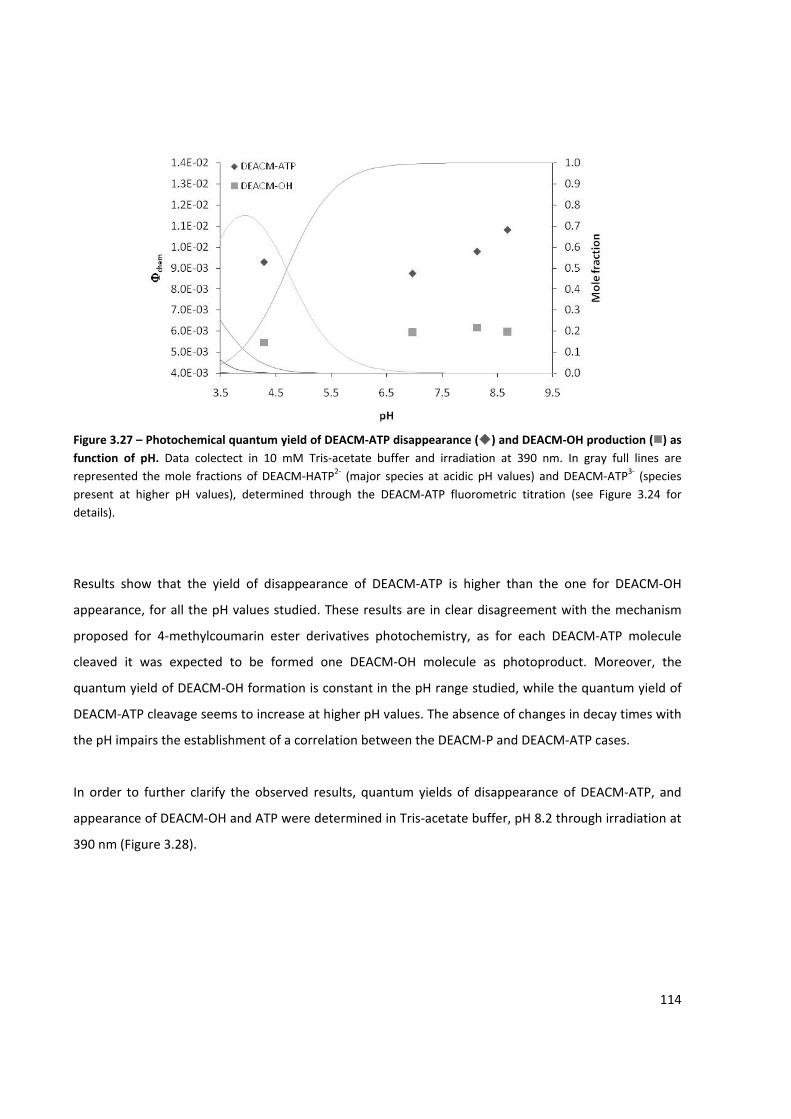
114
Figure 3.27 – Photochemical quantum yield of DEACM‐ATP disappearance ( ) and DEACM‐OH production ( ) as function of pH. Data colectect in 10 mM Tris‐acetate buffer and irradiation at 390 nm. In gray full lines are represented the mole fractions of DEACM‐HATP2‐ (major species at acidic pH values) and DEACM‐ATP3‐ (species present at higher pH values), determined through the DEACM‐ATP fluorometric titration (see Figure 3.24 for details).
Results show that the yield of disappearance of DEACM‐ATP is higher than the one for DEACM‐OH
appearance, for all the pH values studied. These results are in clear disagreement with the mechanism
proposed for 4‐methylcoumarin ester derivatives photochemistry, as for each DEACM‐ATP molecule
cleaved it was expected to be formed one DEACM‐OH molecule as photoproduct. Moreover, the
quantum yield of DEACM‐OH formation is constant in the pH range studied, while the quantum yield of
DEACM‐ATP cleavage seems to increase at higher pH values. The absence of changes in decay times with
the pH impairs the establishment of a correlation between the DEACM‐P and DEACM‐ATP cases.
In order to further clarify the observed results, quantum yields of disappearance of DEACM‐ATP, and
appearance of DEACM‐OH and ATP were determined in Tris‐acetate buffer, pH 8.2 through irradiation at
390 nm (Figure 3.28).
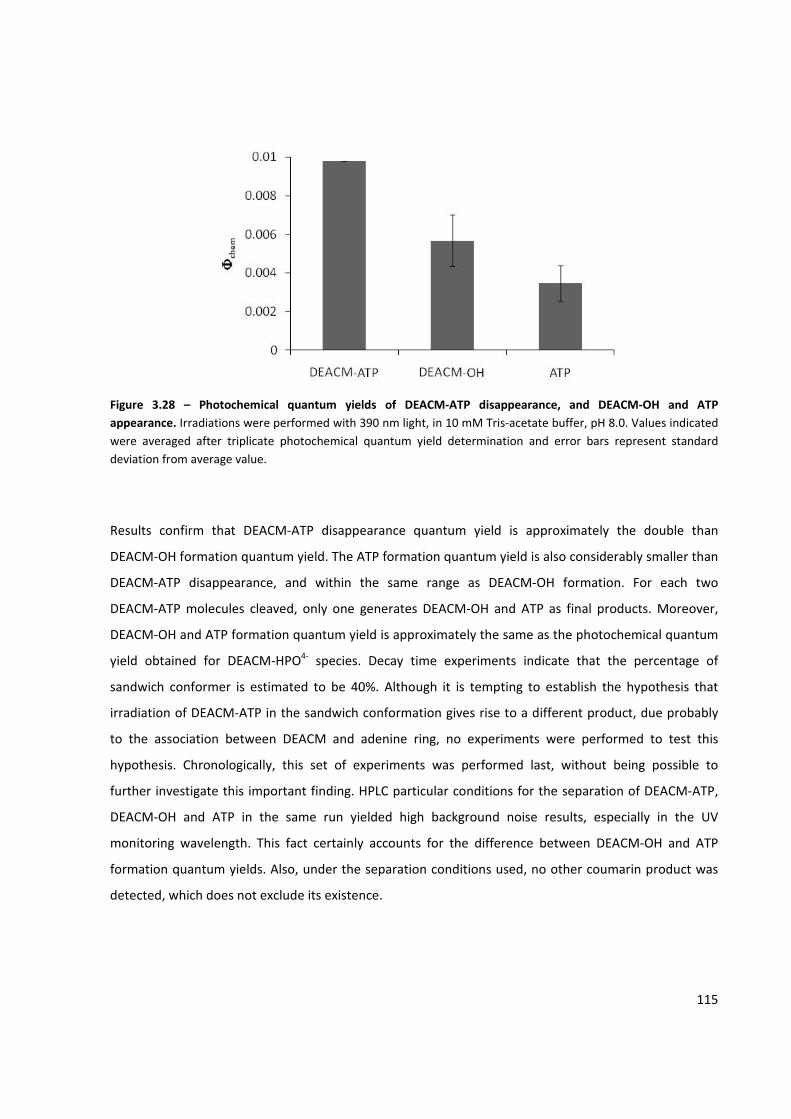
115
Figure 3.28 – Photochemical quantum yields of DEACM‐ATP disappearance, and DEACM‐OH and ATP appearance. Irradiations were performed with 390 nm light, in 10 mM Tris‐acetate buffer, pH 8.0. Values indicated were averaged after triplicate photochemical quantum yield determination and error bars represent standard deviation from average value.
Results confirm that DEACM‐ATP disappearance quantum yield is approximately the double than
DEACM‐OH formation quantum yield. The ATP formation quantum yield is also considerably smaller than
DEACM‐ATP disappearance, and within the same range as DEACM‐OH formation. For each two
DEACM‐ATP molecules cleaved, only one generates DEACM‐OH and ATP as final products. Moreover,
DEACM‐OH and ATP formation quantum yield is approximately the same as the photochemical quantum
yield obtained for DEACM‐HPO4‐ species. Decay time experiments indicate that the percentage of
sandwich conformer is estimated to be 40%. Although it is tempting to establish the hypothesis that
irradiation of DEACM‐ATP in the sandwich conformation gives rise to a different product, due probably
to the association between DEACM and adenine ring, no experiments were performed to test this
hypothesis. Chronologically, this set of experiments was performed last, without being possible to
further investigate this important finding. HPLC particular conditions for the separation of DEACM‐ATP,
DEACM‐OH and ATP in the same run yielded high background noise results, especially in the UV
monitoring wavelength. This fact certainly accounts for the difference between DEACM‐OH and ATP
formation quantum yields. Also, under the separation conditions used, no other coumarin product was
detected, which does not exclude its existence.

116

117
CHAPTER 4. Light Activated in vitro Transcription Reactions
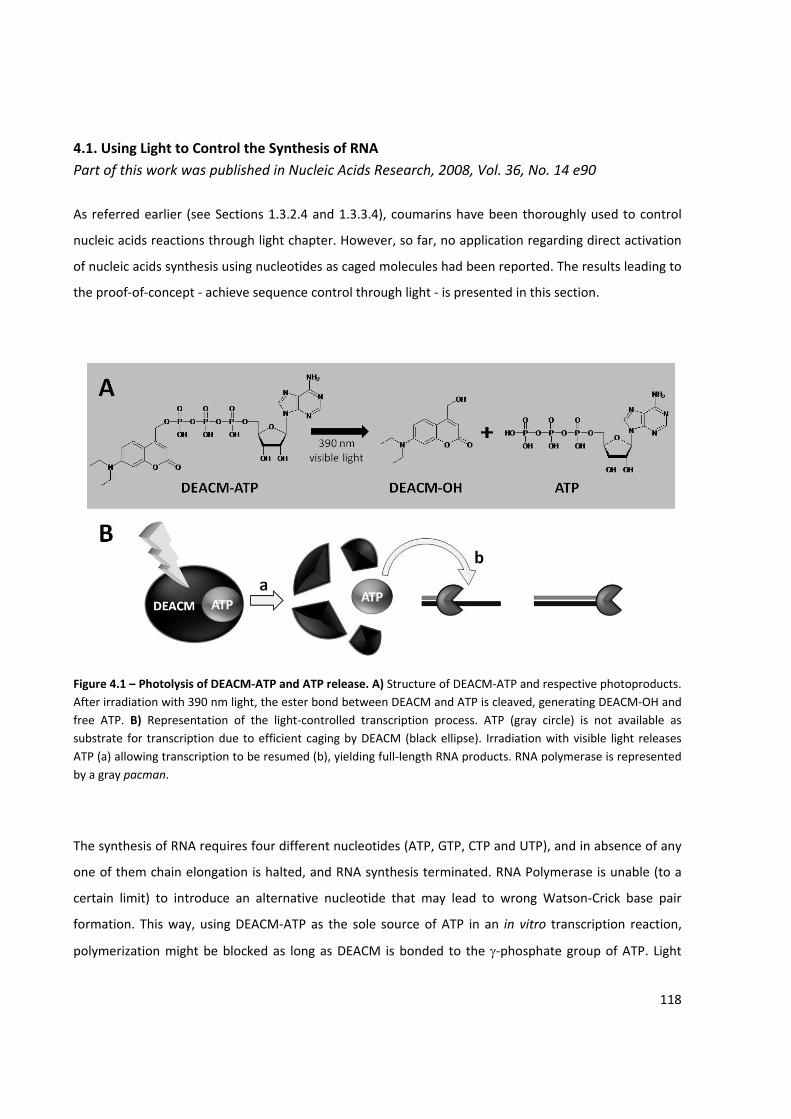
118
4.1. Using Light to Control the Synthesis of RNA Part of this work was published in Nucleic Acids Research, 2008, Vol. 36, No. 14 e90
As referred earlier (see Sections 1.3.2.4 and 1.3.3.4), coumarins have been thoroughly used to control
nucleic acids reactions through light chapter. However, so far, no application regarding direct activation
of nucleic acids synthesis using nucleotides as caged molecules had been reported. The results leading to
the proof‐of‐concept ‐ achieve sequence control through light ‐ is presented in this section.
Figure 4.1 – Photolysis of DEACM‐ATP and ATP release. A) Structure of DEACM‐ATP and respective photoproducts. After irradiation with 390 nm light, the ester bond between DEACM and ATP is cleaved, generating DEACM‐OH and free ATP. B) Representation of the light‐controlled transcription process. ATP (gray circle) is not available as substrate for transcription due to efficient caging by DEACM (black ellipse). Irradiation with visible light releases ATP (a) allowing transcription to be resumed (b), yielding full‐length RNA products. RNA polymerase is represented by a gray pacman.
The synthesis of RNA requires four different nucleotides (ATP, GTP, CTP and UTP), and in absence of any
one of them chain elongation is halted, and RNA synthesis terminated. RNA Polymerase is unable (to a
certain limit) to introduce an alternative nucleotide that may lead to wrong Watson‐Crick base pair
formation. This way, using DEACM‐ATP as the sole source of ATP in an in vitro transcription reaction,
polymerization might be blocked as long as DEACM is bonded to the γ‐phosphate group of ATP. Light
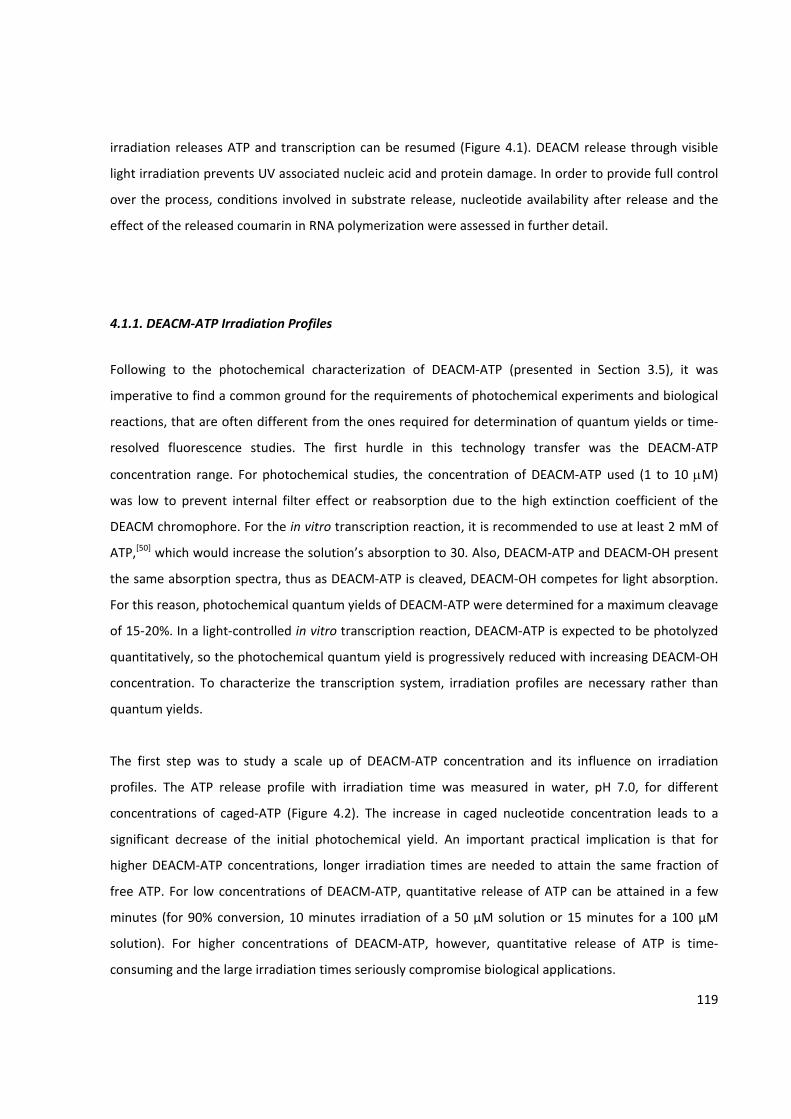
119
irradiation releases ATP and transcription can be resumed (Figure 4.1). DEACM release through visible
light irradiation prevents UV associated nucleic acid and protein damage. In order to provide full control
over the process, conditions involved in substrate release, nucleotide availability after release and the
effect of the released coumarin in RNA polymerization were assessed in further detail.
4.1.1. DEACM‐ATP Irradiation Profiles
Following to the photochemical characterization of DEACM‐ATP (presented in Section 3.5), it was
imperative to find a common ground for the requirements of photochemical experiments and biological
reactions, that are often different from the ones required for determination of quantum yields or time‐
resolved fluorescence studies. The first hurdle in this technology transfer was the DEACM‐ATP
concentration range. For photochemical studies, the concentration of DEACM‐ATP used (1 to 10 μM)
was low to prevent internal filter effect or reabsorption due to the high extinction coefficient of the
DEACM chromophore. For the in vitro transcription reaction, it is recommended to use at least 2 mM of
ATP,[50] which would increase the solution’s absorption to 30. Also, DEACM‐ATP and DEACM‐OH present
the same absorption spectra, thus as DEACM‐ATP is cleaved, DEACM‐OH competes for light absorption.
For this reason, photochemical quantum yields of DEACM‐ATP were determined for a maximum cleavage
of 15‐20%. In a light‐controlled in vitro transcription reaction, DEACM‐ATP is expected to be photolyzed
quantitatively, so the photochemical quantum yield is progressively reduced with increasing DEACM‐OH
concentration. To characterize the transcription system, irradiation profiles are necessary rather than
quantum yields.
The first step was to study a scale up of DEACM‐ATP concentration and its influence on irradiation
profiles. The ATP release profile with irradiation time was measured in water, pH 7.0, for different
concentrations of caged‐ATP (Figure 4.2). The increase in caged nucleotide concentration leads to a
significant decrease of the initial photochemical yield. An important practical implication is that for
higher DEACM‐ATP concentrations, longer irradiation times are needed to attain the same fraction of
free ATP. For low concentrations of DEACM‐ATP, quantitative release of ATP can be attained in a few
minutes (for 90% conversion, 10 minutes irradiation of a 50 µM solution or 15 minutes for a 100 µM
solution). For higher concentrations of DEACM‐ATP, however, quantitative release of ATP is time‐
consuming and the large irradiation times seriously compromise biological applications.

120
Figure 4.2 – Irradiation profiles of four different concentrations of DEACM‐ATP in water, pH 7.0. DEACM‐OH molar fraction obtained after discrete irradiation times (using 390 nm light) were determined by HPLC (see Section 2.3.5).
This concentration quenching effect is an important drawback, as for quantitative release with short
irradiation times diluted solutions of DEACM‐ATP are necessary, which decrease the amount of RNA
produced, and consequently hampering its detection and analysis.
4.1.2. Light Activated in vitro Transcription
For in vitro transcription, and to avoid long irradiation times, 50 µM of a ribonucleotide mix (CTP, UTP
and GTP) was employed. To the control series, ATP was added to each sample in increasing
concentrations to a maximum of 50 μM. The polymerization reactions were then analyzed in a
denaturing polyacrylamide gel ‐ Figure 4.3‐A. In the absence of ATP, no transcription product was
detected. With increasing ATP concentrations, increasing amount of transcription product could be
detected. Direct relation between ATP concentration and product quantity was observed, indicating that
the nucleotide concentration is the limiting factor of product formation. For the test series, DEACM‐ATP
was used as sole source of ATP (Figure 4.3‐B), to a final concentration of 50 μM in all samples. In the
absence of irradiation, only residual amounts of full length RNA product were detected. This indicates
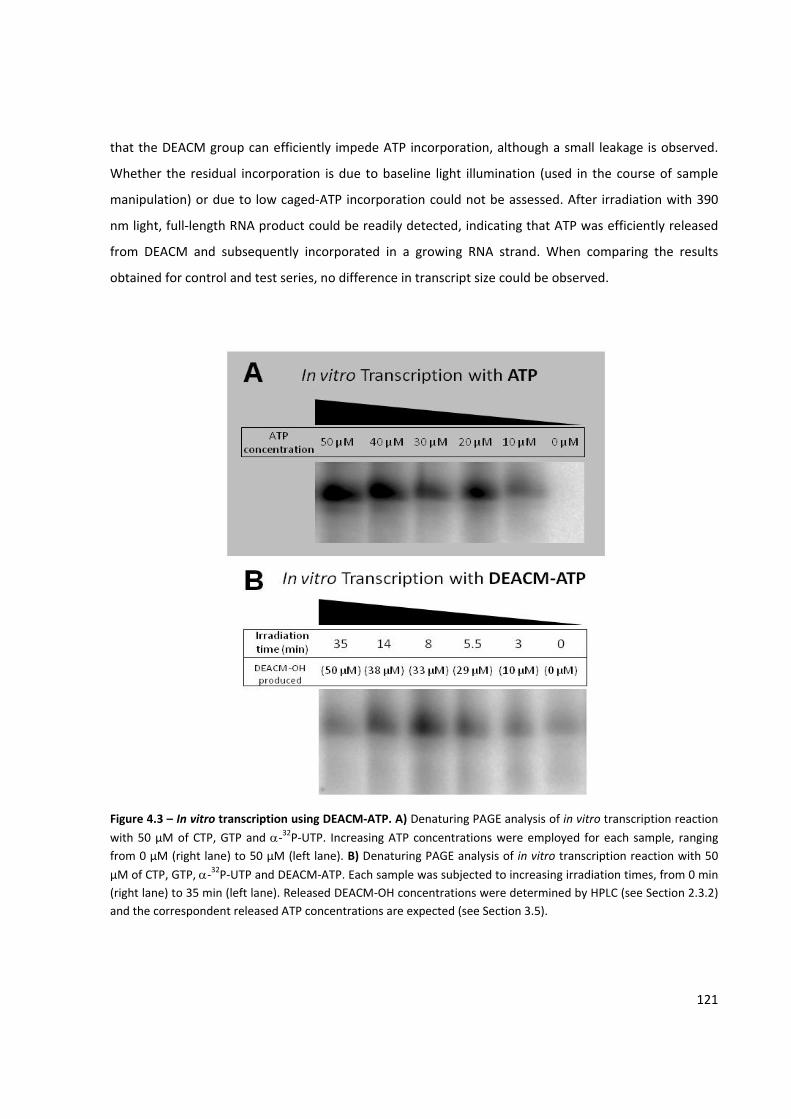
121
that the DEACM group can efficiently impede ATP incorporation, although a small leakage is observed.
Whether the residual incorporation is due to baseline light illumination (used in the course of sample
manipulation) or due to low caged‐ATP incorporation could not be assessed. After irradiation with 390
nm light, full‐length RNA product could be readily detected, indicating that ATP was efficiently released
from DEACM and subsequently incorporated in a growing RNA strand. When comparing the results
obtained for control and test series, no difference in transcript size could be observed.
Figure 4.3 – In vitro transcription using DEACM‐ATP. A) Denaturing PAGE analysis of in vitro transcription reaction
with 50 µM of CTP, GTP and α‐32P‐UTP. Increasing ATP concentrations were employed for each sample, ranging from 0 µM (right lane) to 50 µM (left lane). B) Denaturing PAGE analysis of in vitro transcription reaction with 50
µM of CTP, GTP, α‐32P‐UTP and DEACM‐ATP. Each sample was subjected to increasing irradiation times, from 0 min (right lane) to 35 min (left lane). Released DEACM‐OH concentrations were determined by HPLC (see Section 2.3.2) and the correspondent released ATP concentrations are expected (see Section 3.5).
122
Taken together, these results constitute the proof‐of‐concept that DEACM can be used to cage ATP in
light‐activated transcription reaction. Moreover, with increasing irradiation times, leading to increasing
amounts of cleaved DEACM‐ATP and consequently higher ATP concentration, higher quantity of
transcription product was attained. The increase in transcription products reaches its maximum after 8
minutes of irradiation at 390 nm, corresponding to the formation of 33 μM of DEACM‐OH. For higher
irradiation times, formation of lower quantities of RNA was detected. Nevertheless, considering the
concentration range up to 30 μM, similar transcription yields could be found for both control and test
series.
Figure 4.4 – Relative quantification of full‐length transcription products as function of ATP released after DEACM‐ATP irradiation. Transcript quantification by RT‐Real‐time PCR as function of DEACM‐ATP cleaved concentration. Relative product quantity was normalized in relation to the sample showing the highest product quantity (25 µM ATP) (see Section 2.4.3).
Confirmation that full‐length specific transcripts were attained was shown by RT‐Real‐Time PCR, which
also allowed for product quantification. This step takes advantage of a sequence specific amplification
primer (E7p53Rev primer – see Section 2.4.1), which hybridizes to the RNA chain at its 3’ end, allowing
for a clear distinction between non‐specific or truncated transcription and full‐length specific products.
The relative amount of initial template in each sample was determined as a ratio with the sample with
the highest product quantity – 25 µM of released ATP (values obtained directly relate to quantities
generated in transcription) ‐ see Figure 4.4. Amplification products were additionally submitted to
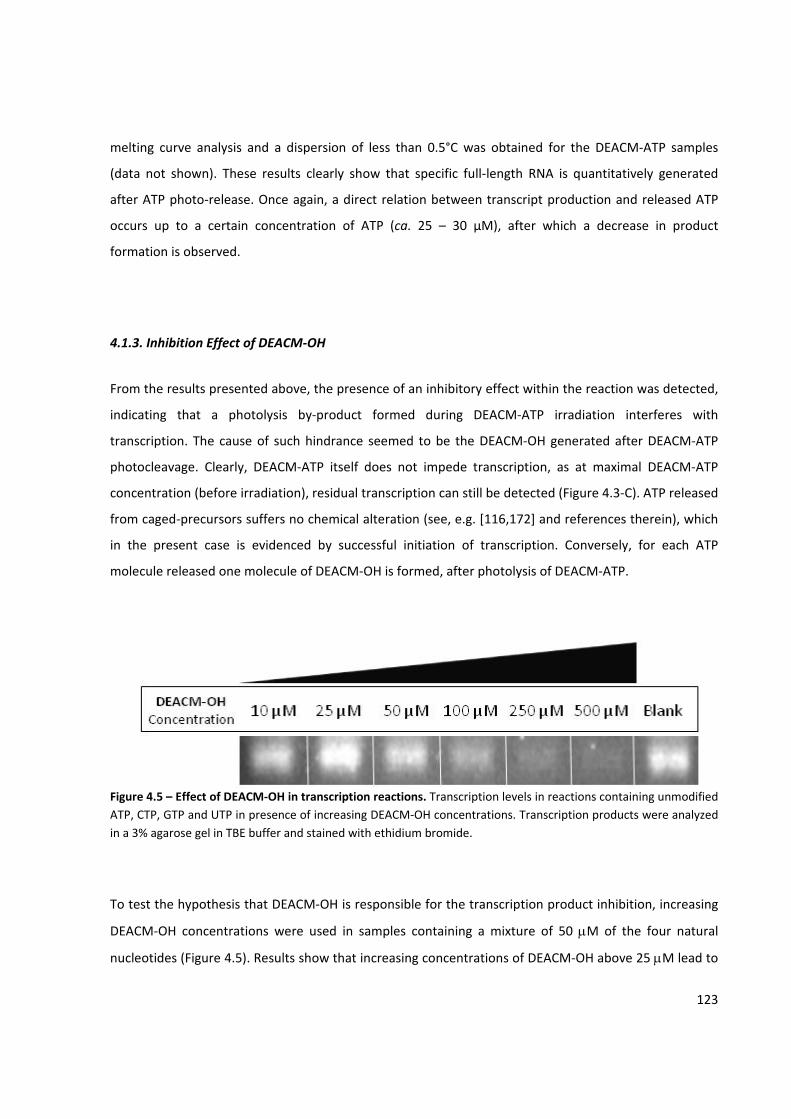
123
melting curve analysis and a dispersion of less than 0.5°C was obtained for the DEACM‐ATP samples
(data not shown). These results clearly show that specific full‐length RNA is quantitatively generated
after ATP photo‐release. Once again, a direct relation between transcript production and released ATP
occurs up to a certain concentration of ATP (ca. 25 – 30 µM), after which a decrease in product
formation is observed.
4.1.3. Inhibition Effect of DEACM‐OH
From the results presented above, the presence of an inhibitory effect within the reaction was detected,
indicating that a photolysis by‐product formed during DEACM‐ATP irradiation interferes with
transcription. The cause of such hindrance seemed to be the DEACM‐OH generated after DEACM‐ATP
photocleavage. Clearly, DEACM‐ATP itself does not impede transcription, as at maximal DEACM‐ATP
concentration (before irradiation), residual transcription can still be detected (Figure 4.3‐C). ATP released
from caged‐precursors suffers no chemical alteration (see, e.g. [116,172] and references therein), which
in the present case is evidenced by successful initiation of transcription. Conversely, for each ATP
molecule released one molecule of DEACM‐OH is formed, after photolysis of DEACM‐ATP.
Figure 4.5 – Effect of DEACM‐OH in transcription reactions. Transcription levels in reactions containing unmodified ATP, CTP, GTP and UTP in presence of increasing DEACM‐OH concentrations. Transcription products were analyzed in a 3% agarose gel in TBE buffer and stained with ethidium bromide.
To test the hypothesis that DEACM‐OH is responsible for the transcription product inhibition, increasing
DEACM‐OH concentrations were used in samples containing a mixture of 50 μM of the four natural
nucleotides (Figure 4.5). Results show that increasing concentrations of DEACM‐OH above 25 μM lead to
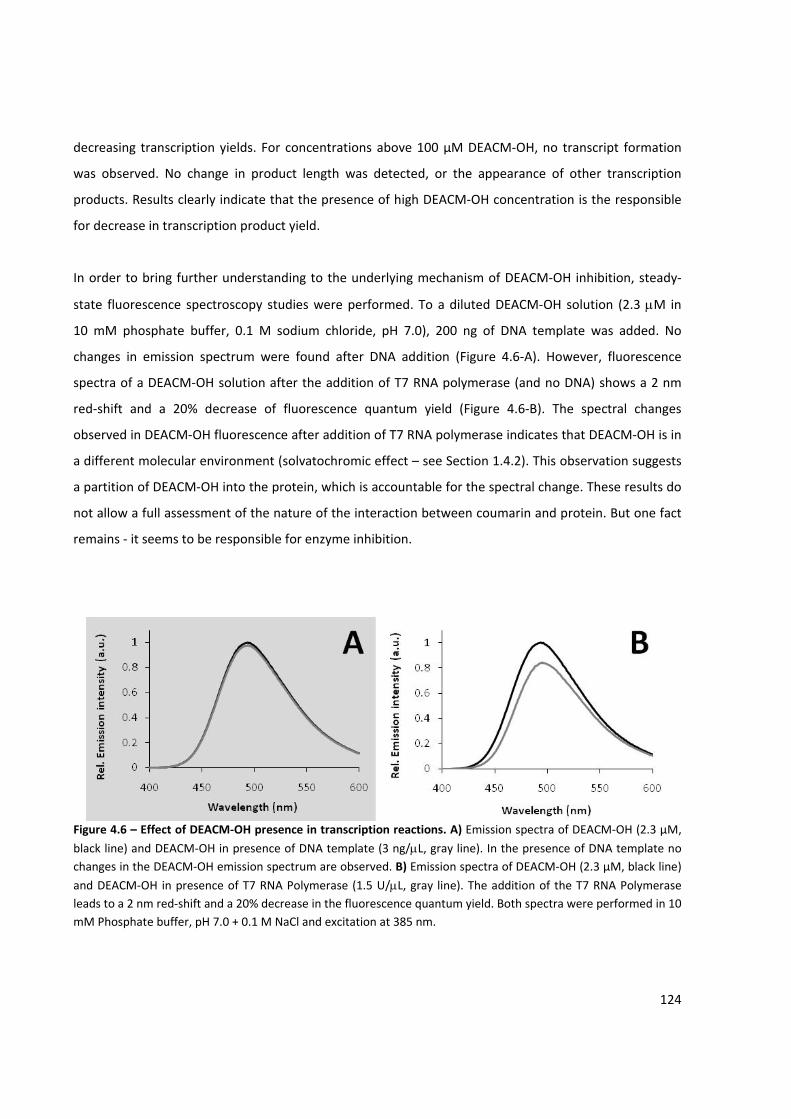
124
decreasing transcription yields. For concentrations above 100 µM DEACM‐OH, no transcript formation
was observed. No change in product length was detected, or the appearance of other transcription
products. Results clearly indicate that the presence of high DEACM‐OH concentration is the responsible
for decrease in transcription product yield.
In order to bring further understanding to the underlying mechanism of DEACM‐OH inhibition, steady‐
state fluorescence spectroscopy studies were performed. To a diluted DEACM‐OH solution (2.3 μM in
10 mM phosphate buffer, 0.1 M sodium chloride, pH 7.0), 200 ng of DNA template was added. No
changes in emission spectrum were found after DNA addition (Figure 4.6‐A). However, fluorescence
spectra of a DEACM‐OH solution after the addition of T7 RNA polymerase (and no DNA) shows a 2 nm
red‐shift and a 20% decrease of fluorescence quantum yield (Figure 4.6‐B). The spectral changes
observed in DEACM‐OH fluorescence after addition of T7 RNA polymerase indicates that DEACM‐OH is in
a different molecular environment (solvatochromic effect – see Section 1.4.2). This observation suggests
a partition of DEACM‐OH into the protein, which is accountable for the spectral change. These results do
not allow a full assessment of the nature of the interaction between coumarin and protein. But one fact
remains ‐ it seems to be responsible for enzyme inhibition.
Figure 4.6 – Effect of DEACM‐OH presence in transcription reactions. A) Emission spectra of DEACM‐OH (2.3 µM,
black line) and DEACM‐OH in presence of DNA template (3 ng/μL, gray line). In the presence of DNA template no changes in the DEACM‐OH emission spectrum are observed. B) Emission spectra of DEACM‐OH (2.3 µM, black line)
and DEACM‐OH in presence of T7 RNA Polymerase (1.5 U/μL, gray line). The addition of the T7 RNA Polymerase leads to a 2 nm red‐shift and a 20% decrease in the fluorescence quantum yield. Both spectra were performed in 10 mM Phosphate buffer, pH 7.0 + 0.1 M NaCl and excitation at 385 nm.

125
Coumarin derivatives are known for their antibiotic characteristics, particularly interacting with DNA
gyrases. These bacterial enzymes belong to the topoisomerase family, involved in DNA replication and
transcription (for a review see [195]). The Escherichia coli DNA gyrase is a type II topoisomerase
catalyzing the negative supercoiling of the closed‐circular DNA, a function essential for DNA replication
and transcription in prokaryotes. Since this is an energetically unfavourable process, the enzyme requires
ATP as cofactor for activity.[196] The target for the coumarin‐based antibiotics is the ATP binding site in
subunit B, where the coumarin derivatives compete for the binding site with ATP molecule.[197‐200] The
more thoroughly studied coumarin derivatives as inhibitors of DNA gyrase activity are the
aminocoumarin antibiotics clorobiocin, novobiocin, and coumermycin A1, which are structurally more
complex than DEACM (Figure 4.7).[198]
Figure 4.7 – Molecular structure of Clorobiocin, Novobiocin and Coumermycin A1. Coumarin ring(s) present in each molecule is highlighted in gray.
One might speculate that the interactions governing the ATP recognition in DNA gyrase might be similar
in nature than the ones found in DNA and RNA polymerases. Considering the same inhibition mechanism
for DEACM‐T7 RNA polymerase would be a fair starting point for further investigations. Moreover, the
experimental evidence showing that transcription product length is not affected by DEACM‐OH

126
concentration indicates the absence of an irreversible inhibition process. If a DEACM‐OH molecule binds
irreversibily to the polymerase active site during elongation, the outcome would be a premature RNA
chain termination. A competitive inhibition mechanism should lead to a slower elongation rate (seen as a
reduction of product yield for the same reaction time), that under certain limits would not lead to chain
termination.
Curiously, DEACM‐OH presents a poor solubility in water (between 10‐4 M and 10‐5 M), which could be
the driving force for the observed partition and resulting inhibitory effect over T7 RNA Polymerase. The
partitioning to a more apolar protein medium however, does not account for the observed red‐shift and
decrease in fluorescence quantum yield. In fact, the exactly opposite effect would be expected (due to
decrease of TICT deactivation state efficiency). Further studies on the DEACM‐OH/T7 RNA Polymerase
interaction are required to fully understand this inhibitory effect. From a practical approach, this
inhibitory effect limits the concentration range of DEACM‐ATP that can be used for light controlled in
vitro transcription reactions.
4.2. Suppression of DEACM‐OH Inhibition in Light‐controlled in vitro Transcription Reactions Part of this work was published in the Journal of Photochemistry and Photobiology – Chemistry, 2010, 213, 147‐151.
The inhibitory effect observed for high DEACM‐OH concentrations to in vitro transcription reactions was
associated to the interaction of the coumarin molecule and the T7 RNA Polymerase. The relation
between DEACM‐OH saturation concentration and inhibition threshold led to the idea that coumarin’s
poor water solubility might be a driving force in the inhibition mechanism. If this hypothesis is true,
increasing DEACM‐OH solubility would ultimately lead to a decrease in inhibition effect (or higher
threshold concentration). In order to circumvent the low coumarin solubility issue, first Furuta and then
Hagen presented a strategy in which acetate groups were added to 6‐ and 7‐methoxy‐4‐methylcoumarin
moiety. Due to their anionic characteristics at physiological pH, the presence of the acetate groups
increases considerably the coumarin water solubility.[71,114] Although it might constitute a robust process
for increasing solubility and thus reducing the inhibition, it requires additional synthesis steps, on top of
an already complex synthetic route. Moreover, the water‐soluble coumarins presented are derivatives of

127
6‐ and 7‐methoxy‐4‐methylcoumarin, which present a blue‐shifted absorption, lower extinction
coefficients and lower photochemical quantum yields, when compared to DEACM.
An alternative supramolecular approach was devised to decrease the inhibitory effect of water insoluble
DEACM photo‐by‐products in enzymatic reactions. The overall strategy was based in the addition of a
molecule (or macro‐molecule) with a hydrophobic cavity that seizes the DEACM‐OH formed after
photolysis. This way, DEACM‐OH could be sequestered by the scavenger molecule, rather than
partitionate into the T7 RNA Polymerase. There are three requirements for the accomplishment of this
strategy:
i) The presence of the scavenger molecule should not cause inhibition of the
transcription reaction itself,
ii) The scavenger molecule should present a high association constant with DEACM‐OH,
and
iii) The scavenger molecule should not interfere with DEACM‐ATP photochemical release.
Two classes of possible scavengers were considered: β‐lactoglobulin and cyclodextrins.
4.2.1. β‐Lactoglobulin
The first class of potential scavenger studied was the β‐lactoglobulin, a small water soluble 18.4 kDa
protein member of the lipocalin protein family. Its 162 amino acid residues fold up into an 8‐stranded,
antiparallel β‐barrel with a 3‐turn α‐helix on the outer surface and a ninth β‐strand flanking the first
strand (Figure 4.8). In physiologic conditions (pH and ionic strength), the β‐lactoglobulin is present as a
dimer.[201] To date, no clear physiological function for the protein has been defined although several
suggestions have been made. Because β‐lactoglobulin belongs to the lipocalin family, a transport role
has been suggested by analogy to other family members whose function is known.[202] Several studies of
association between β‐lactoglobulin and hydrophobic molecules were thoroughly published, such as
retinol, lauric and palmitic acid, SDS, Tween 20, retinoic acid, cis‐parinaric acid, toluene, bromophenol
blue, vitamin D2 and cholesterol (for a review, please see [203] and references therein). Crystal
structures of β‐lactoglobulin with cholesterol and vitamin D2 indicates that the hydrophobic part of
these molecules is buried inside the protein cavity, although there is no clear proof of this fact. The
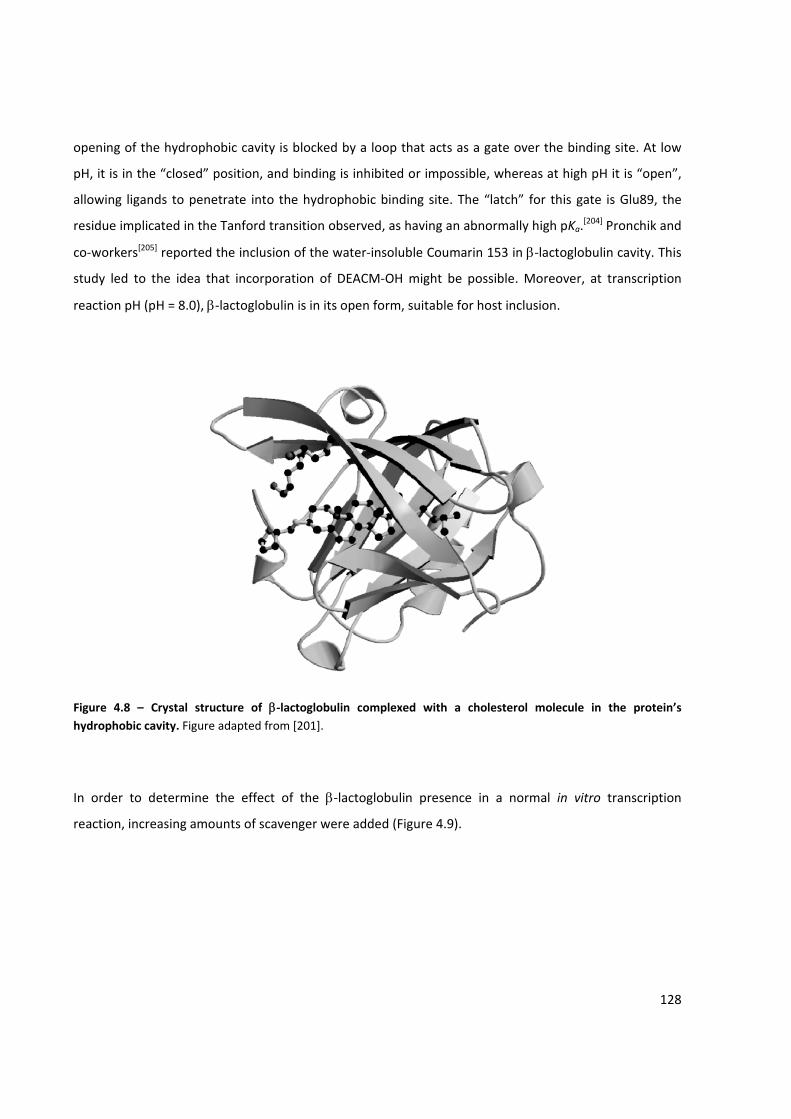
128
opening of the hydrophobic cavity is blocked by a loop that acts as a gate over the binding site. At low
pH, it is in the “closed” position, and binding is inhibited or impossible, whereas at high pH it is “open”,
allowing ligands to penetrate into the hydrophobic binding site. The “latch” for this gate is Glu89, the
residue implicated in the Tanford transition observed, as having an abnormally high pKa.[204] Pronchik and
co‐workers[205] reported the inclusion of the water‐insoluble Coumarin 153 in β‐lactoglobulin cavity. This
study led to the idea that incorporation of DEACM‐OH might be possible. Moreover, at transcription
reaction pH (pH = 8.0), β‐lactoglobulin is in its open form, suitable for host inclusion.
Figure 4.8 – Crystal structure of β‐lactoglobulin complexed with a cholesterol molecule in the protein’s hydrophobic cavity. Figure adapted from [201].
In order to determine the effect of the β‐lactoglobulin presence in a normal in vitro transcription
reaction, increasing amounts of scavenger were added (Figure 4.9).
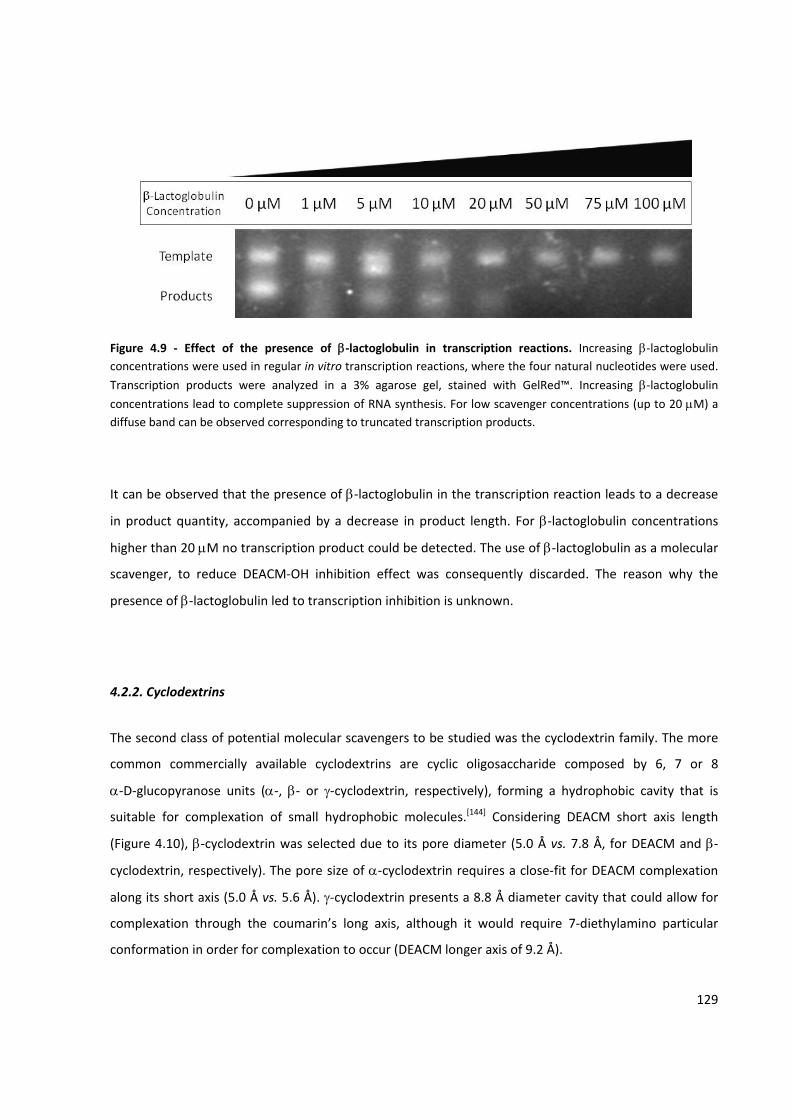
129
Figure 4.9 ‐ Effect of the presence of β‐lactoglobulin in transcription reactions. Increasing β‐lactoglobulin concentrations were used in regular in vitro transcription reactions, where the four natural nucleotides were used.
Transcription products were analyzed in a 3% agarose gel, stained with GelRed™. Increasing β‐lactoglobulin concentrations lead to complete suppression of RNA synthesis. For low scavenger concentrations (up to 20 μM) a diffuse band can be observed corresponding to truncated transcription products.
It can be observed that the presence of β‐lactoglobulin in the transcription reaction leads to a decrease
in product quantity, accompanied by a decrease in product length. For β‐lactoglobulin concentrations
higher than 20 μM no transcription product could be detected. The use of β‐lactoglobulin as a molecular
scavenger, to reduce DEACM‐OH inhibition effect was consequently discarded. The reason why the
presence of β‐lactoglobulin led to transcription inhibition is unknown.
4.2.2. Cyclodextrins
The second class of potential molecular scavengers to be studied was the cyclodextrin family. The more
common commercially available cyclodextrins are cyclic oligosaccharide composed by 6, 7 or 8
α‐D‐glucopyranose units (α‐, β‐ or γ‐cyclodextrin, respectively), forming a hydrophobic cavity that is
suitable for complexation of small hydrophobic molecules.[144] Considering DEACM short axis length
(Figure 4.10), β‐cyclodextrin was selected due to its pore diameter (5.0 Å vs. 7.8 Å, for DEACM and β‐
cyclodextrin, respectively). The pore size of α‐cyclodextrin requires a close‐fit for DEACM complexation
along its short axis (5.0 Å vs. 5.6 Å). γ‐cyclodextrin presents a 8.8 Å diameter cavity that could allow for
complexation through the coumarin’s long axis, although it would require 7‐diethylamino particular
conformation in order for complexation to occur (DEACM longer axis of 9.2 Å).
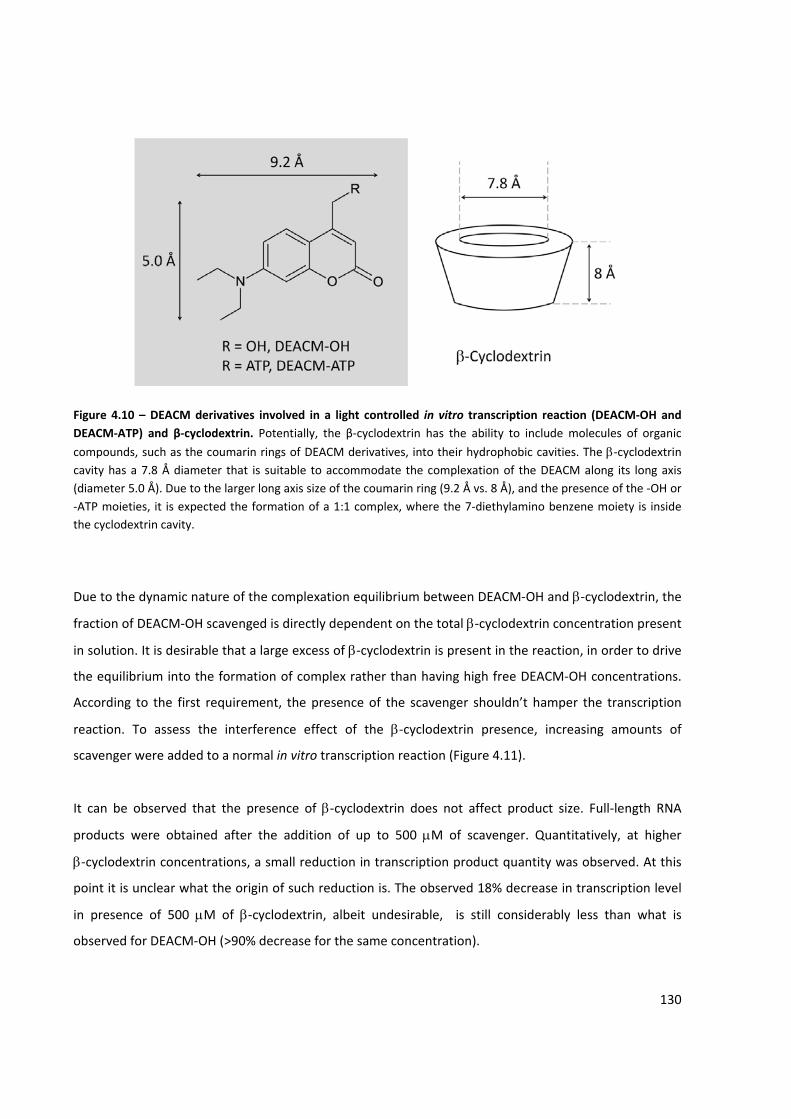
130
Figure 4.10 – DEACM derivatives involved in a light controlled in vitro transcription reaction (DEACM‐OH and DEACM‐ATP) and β‐cyclodextrin. Potentially, the β‐cyclodextrin has the ability to include molecules of organic
compounds, such as the coumarin rings of DEACM derivatives, into their hydrophobic cavities. The β‐cyclodextrin cavity has a 7.8 Å diameter that is suitable to accommodate the complexation of the DEACM along its long axis (diameter 5.0 Å). Due to the larger long axis size of the coumarin ring (9.2 Å vs. 8 Å), and the presence of the ‐OH or ‐ATP moieties, it is expected the formation of a 1:1 complex, where the 7‐diethylamino benzene moiety is inside the cyclodextrin cavity.
Due to the dynamic nature of the complexation equilibrium between DEACM‐OH and β‐cyclodextrin, the
fraction of DEACM‐OH scavenged is directly dependent on the total β‐cyclodextrin concentration present
in solution. It is desirable that a large excess of β‐cyclodextrin is present in the reaction, in order to drive
the equilibrium into the formation of complex rather than having high free DEACM‐OH concentrations.
According to the first requirement, the presence of the scavenger shouldn’t hamper the transcription
reaction. To assess the interference effect of the β‐cyclodextrin presence, increasing amounts of
scavenger were added to a normal in vitro transcription reaction (Figure 4.11).
It can be observed that the presence of β‐cyclodextrin does not affect product size. Full‐length RNA
products were obtained after the addition of up to 500 μM of scavenger. Quantitatively, at higher
β‐cyclodextrin concentrations, a small reduction in transcription product quantity was observed. At this
point it is unclear what the origin of such reduction is. The observed 18% decrease in transcription level
in presence of 500 μM of β‐cyclodextrin, albeit undesirable, is still considerably less than what is
observed for DEACM‐OH (>90% decrease for the same concentration).
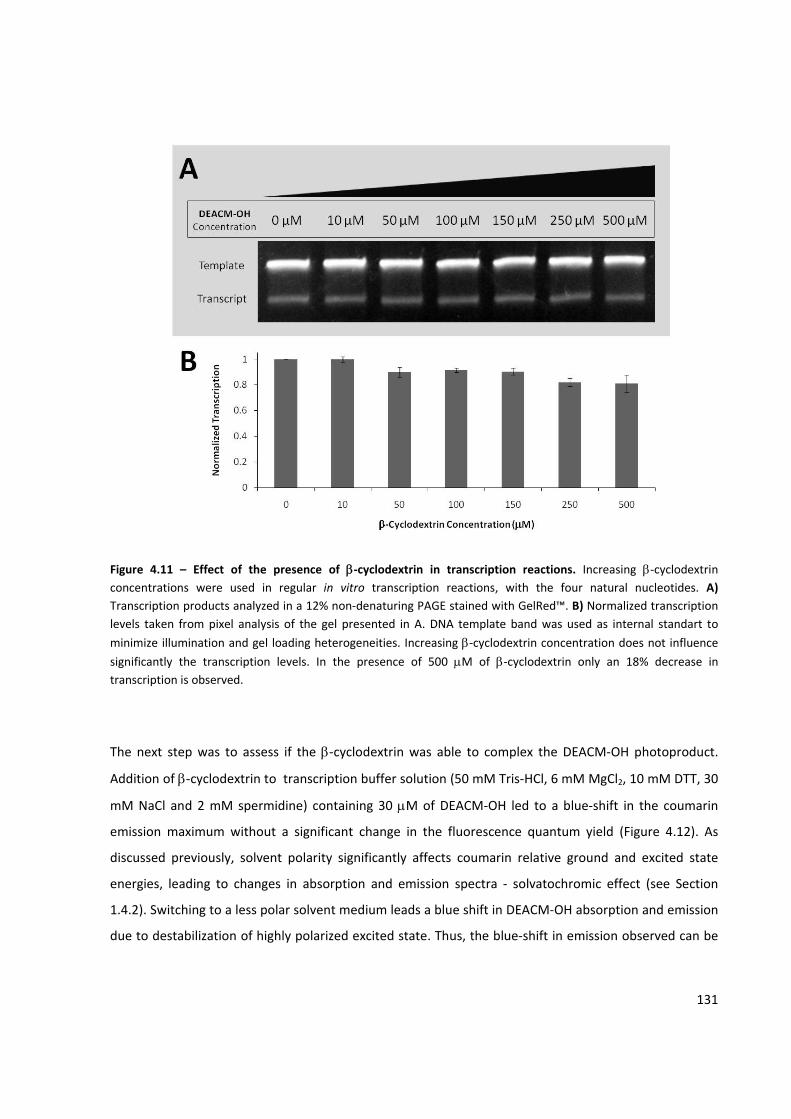
131
Figure 4.11 – Effect of the presence of β‐cyclodextrin in transcription reactions. Increasing β‐cyclodextrin concentrations were used in regular in vitro transcription reactions, with the four natural nucleotides. A) Transcription products analyzed in a 12% non‐denaturing PAGE stained with GelRed™. B) Normalized transcription levels taken from pixel analysis of the gel presented in A. DNA template band was used as internal standart to
minimize illumination and gel loading heterogeneities. Increasing β‐cyclodextrin concentration does not influence significantly the transcription levels. In the presence of 500 μM of β‐cyclodextrin only an 18% decrease in transcription is observed.
The next step was to assess if the β‐cyclodextrin was able to complex the DEACM‐OH photoproduct.
Addition of β‐cyclodextrin to transcription buffer solution (50 mM Tris‐HCl, 6 mM MgCl2, 10 mM DTT, 30
mM NaCl and 2 mM spermidine) containing 30 μM of DEACM‐OH led to a blue‐shift in the coumarin
emission maximum without a significant change in the fluorescence quantum yield (Figure 4.12). As
discussed previously, solvent polarity significantly affects coumarin relative ground and excited state
energies, leading to changes in absorption and emission spectra ‐ solvatochromic effect (see Section
1.4.2). Switching to a less polar solvent medium leads a blue shift in DEACM‐OH absorption and emission
due to destabilization of highly polarized excited state. Thus, the blue‐shift in emission observed can be
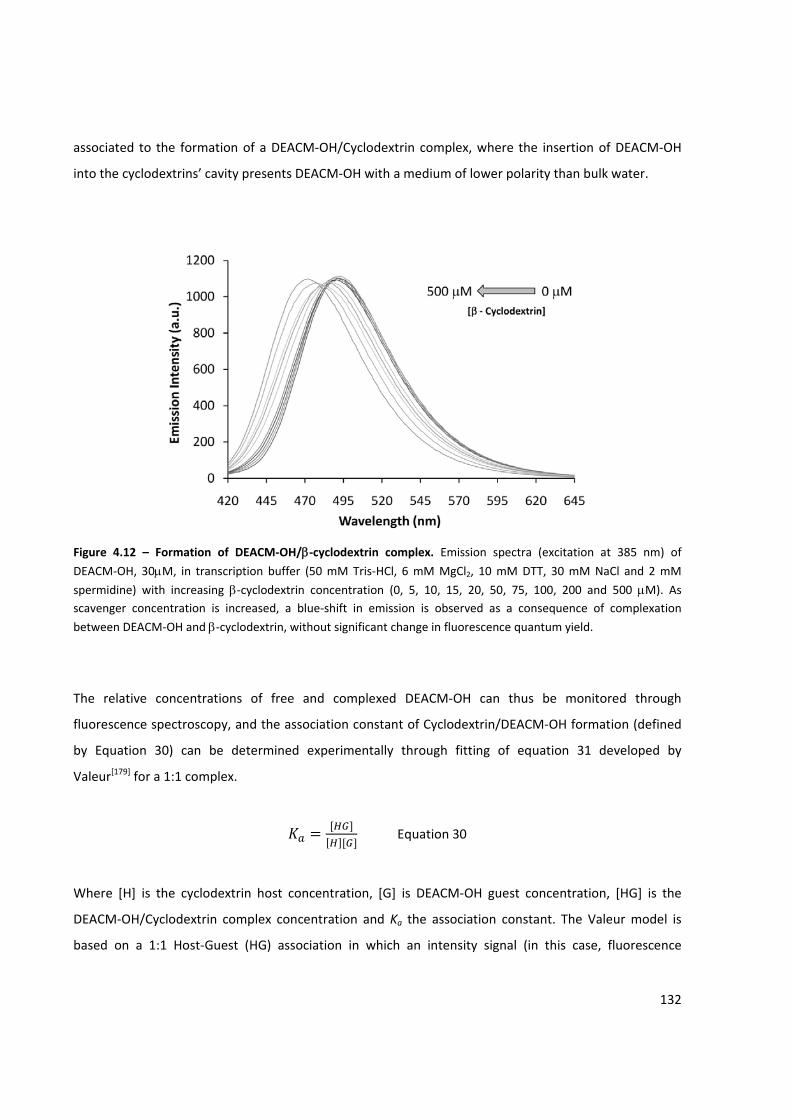
132
associated to the formation of a DEACM‐OH/Cyclodextrin complex, where the insertion of DEACM‐OH
into the cyclodextrins’ cavity presents DEACM‐OH with a medium of lower polarity than bulk water.
Figure 4.12 – Formation of DEACM‐OH/β‐cyclodextrin complex. Emission spectra (excitation at 385 nm) of
DEACM‐OH, 30μM, in transcription buffer (50 mM Tris‐HCl, 6 mM MgCl2, 10 mM DTT, 30 mM NaCl and 2 mM
spermidine) with increasing β‐cyclodextrin concentration (0, 5, 10, 15, 20, 50, 75, 100, 200 and 500 μM). As scavenger concentration is increased, a blue‐shift in emission is observed as a consequence of complexation
between DEACM‐OH and β‐cyclodextrin, without significant change in fluorescence quantum yield.
The relative concentrations of free and complexed DEACM‐OH can thus be monitored through
fluorescence spectroscopy, and the association constant of Cyclodextrin/DEACM‐OH formation (defined
by Equation 30) can be determined experimentally through fitting of equation 31 developed by
Valeur[179] for a 1:1 complex.
Equation 30
Where [H] is the cyclodextrin host concentration, [G] is DEACM‐OH guest concentration, [HG] is the
DEACM‐OH/Cyclodextrin complex concentration and Ka the association constant. The Valeur model is
based on a 1:1 Host‐Guest (HG) association in which an intensity signal (in this case, fluorescence
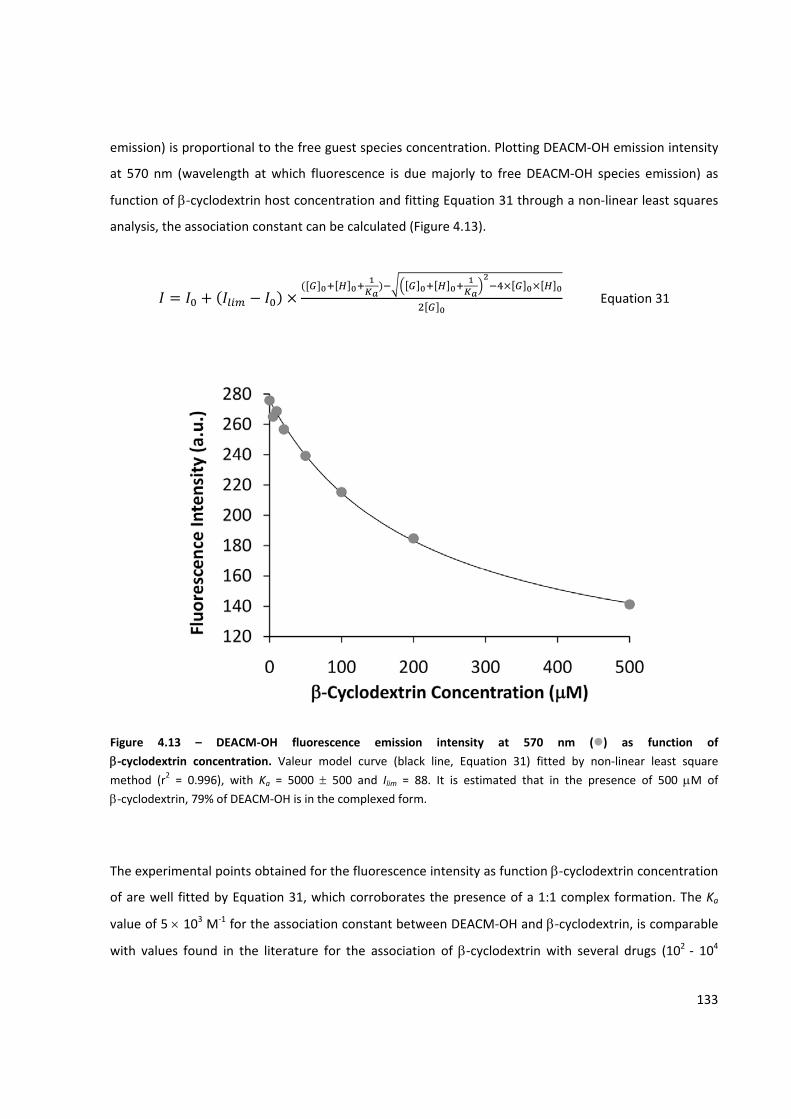
133
emission) is proportional to the free guest species concentration. Plotting DEACM‐OH emission intensity
at 570 nm (wavelength at which fluorescence is due majorly to free DEACM‐OH species emission) as
function of β‐cyclodextrin host concentration and fitting Equation 31 through a non‐linear least squares
analysis, the association constant can be calculated (Figure 4.13).
Equation 31
Figure 4.13 – DEACM‐OH fluorescence emission intensity at 570 nm ( ) as function of
β‐cyclodextrin concentration. Valeur model curve (black line, Equation 31) fitted by non‐linear least square
method (r2 = 0.996), with Ka = 5000 ± 500 and Ilim = 88. It is estimated that in the presence of 500 μM of
β‐cyclodextrin, 79% of DEACM‐OH is in the complexed form.
The experimental points obtained for the fluorescence intensity as function β‐cyclodextrin concentration
of are well fitted by Equation 31, which corroborates the presence of a 1:1 complex formation. The Ka
value of 5 × 10³ M‐1 for the association constant between DEACM‐OH and β‐cyclodextrin, is comparable
with values found in the literature for the association of β‐cyclodextrin with several drugs (102 ‐ 104
134
M‐1),[206] much higher than 4‐trifluoromethyl‐7‐diethylaminocoumarin (101 M‐1),[207] half of the closely
related Coumarin 153 (104 M‐1)[208] and similar to 3‐carboxyl‐7‐diethylaminocoumarin (5 × 10³ M‐1)[209].
Averting inhibition due to the formation of DEACM‐OH photo‐product requires that the cyclodextrin
scavenger is present in solution prior to ATP release. Since DEACM‐ATP is the sole DEACM species
present in solution before irradiation, this poses two additional questions: i) is DEACM‐ATP able to form
a complex with β‐cyclodextrin, and ii) if it does, is there any change in photochemical properties that
might affect effective release of the substrate?
At the transcription buffer pH value (pH = 8.0), the ATP moiety is fully deprotonated[181] with a net charge
of ‐3, while DEACM‐OH is neutral. Since the β‐cyclodextrin’s core is hydrophobic, the ATP negative
charge and also the introduction of a bulky substituent (ATP vs. OH) would be expected to impair
association of DEACM‐ATP and the cyclodextrin. The association constant of β‐cyclodextrin with DEACM‐
ATP was determined and a value of 9 × 10³ M‐1 was obtained, which was surprisingly similar (even
slightly higher) to the association constant found for DEACM‐OH/cyclodextrin complex. This seems to
indicate that association is achieved through the coumarin hydrophobic part (7‐diethylamino group and
benzene ring) and driven solely by hydrophobic aspects (entropy increase due to the release of water
from the cyclodextrin cavity).
The photochemical quantum yields for DEACM‐ATP alone or in association with
β‐cyclodextrin were determined, and results show similar yields for both species within experimental
error: (10 ± 1) × 10‐4 and (9.4 ± 0.3) × 10‐4, respectively. It should be pointed out that the
DEACM‐ATP/β‐cyclodextrin photochemical quantum yield indicated is a mixture of both complexed and
free DEACM‐ATP. Due to complete overlap of the absorption spectra of the two species, both forms
were irradiated simultaneously in the DEACM‐ATP/β‐cyclodextrin sample. For a DEACM‐ATP
concentration of 30 μM and in the presence of 500 μM of β‐cyclodextrin (which are approximately the
same conditions used for in vitro transcription reactions), 81% of DEACM‐ATP is in the complexed form.
Furthermore, no additional photoproducts were detected by HPLC after irradiation with the separation
method used. Such a similarity between both quantum yields suggests that DEACM‐ATP photochemical
deactivating pathways remain unaltered upon association with β‐cyclodextrin.
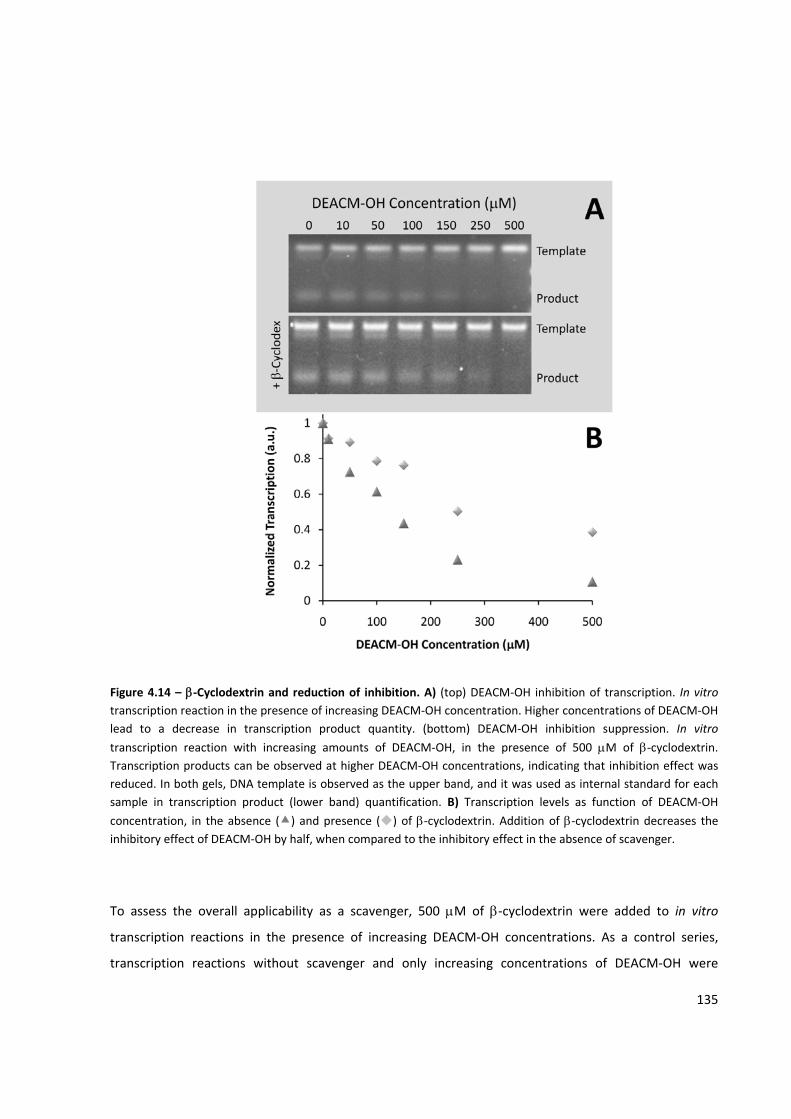
135
Figure 4.14 – β‐Cyclodextrin and reduction of inhibition. A) (top) DEACM‐OH inhibition of transcription. In vitro transcription reaction in the presence of increasing DEACM‐OH concentration. Higher concentrations of DEACM‐OH lead to a decrease in transcription product quantity. (bottom) DEACM‐OH inhibition suppression. In vitro
transcription reaction with increasing amounts of DEACM‐OH, in the presence of 500 μM of β‐cyclodextrin. Transcription products can be observed at higher DEACM‐OH concentrations, indicating that inhibition effect was reduced. In both gels, DNA template is observed as the upper band, and it was used as internal standard for each sample in transcription product (lower band) quantification. B) Transcription levels as function of DEACM‐OH
concentration, in the absence ( ) and presence ( ) of β‐cyclodextrin. Addition of β‐cyclodextrin decreases the inhibitory effect of DEACM‐OH by half, when compared to the inhibitory effect in the absence of scavenger.
To assess the overall applicability as a scavenger, 500 μM of β‐cyclodextrin were added to in vitro
transcription reactions in the presence of increasing DEACM‐OH concentrations. As a control series,
transcription reactions without scavenger and only increasing concentrations of DEACM‐OH were
136
performed. Figure 4.14 shows that a significant decrease of transcription levels for DEACM‐OH
concentrations above 50 μM is observed, which is in clear agreement to what has been previously
observed. Inhibition linearly increases up to 250 μM of DEACM‐OH, and at 500 μM only 11% of
transcription product is obtained when compared to transcription without DEACM‐OH. Addition of
β‐cyclodextrin (Figure 4.14) significantly quenches the inhibitory effect of DEACM‐OH, and inhibition is
reduced approximately by half.
These results seem to indicate that DEACM‐OH is being channeled into the β‐cyclodextrin complex,
removing the inhibitor from solution. Thus, twice the previously allowed amount of DEACM‐ATP can now
be used in the light‐activated in vitro transcription reaction. The need of using caged nucleotides in
concentrations much lower than those commonly used in standard transcription reactions can now be
effectively improved by means of the proposed supramolecular strategy.
4.3. Light Activated Polymerization Using Terminal deoxynucleotidyl Transferase
The light‐activated polymerization of RNA molecules through the use of DEACM‐caged ATP was
presented in the previous sections. In the described system, transcription was hampered by the absence
of “free” ATP, that once released by light irradiation allowed transcription to resume. This was the proof‐
of‐concept that caged nucleotides can be used to control nucleotide availability in solution and may be
used as selectors/actuators for nucleotide incorporation. However, the resulting RNA molecule after
irradiation has one specific sequence, i.e. ATP incorporation position in a strand was determined by the
DNA template sequence.
Terminal deoxynucleotidyl Transferase (TdT) is a template‐independent DNA polymerase presenting a
low preference for the incorporation of deoxyribonucleotides than ribonucleotides[24], (see Section
1.2.3.3), meaning that it can incorporate efficiently ribonucleotides in a DNA strand, forming a hybrid
structure. Even though, we had not a particular interest in such a hybrid polymer, it serves as a good
model to test the possibility of activating the addition of a controlled number of nucleotides to a growing
strand, i.e., the controlled release of stoichiometric amounts by light pulses with known photon counts.
This was a further step towards the completion of our DNA (or RNA) typewriter.
137
At this point, the addition of nucleotides in a template‐independent manner raised the question of how
to control the number of nucleotides added in each growing strand? In other words ‐ if there is one mole
of growing strands in solution and one mole of ATP is released, how can it be assured that each growing
strand will incorporate only one ATP molecule? One conceptual solution would be to add a caging group
at the 3’ end of each nucleotide, acting as a reversible terminator. This is, in many ways similar to the
principle of sequencing by synthesis recently proposed.[116,117,121] After the first nucleotide was
incorporated the synthesis would halt, until de‐caging of the 3’ strand was processed. This strategy has a
serious drawback: irradiation of the sample will decage 3’ position in both free and incorporated
nucleotides. Furthermore, it requires the inclusion of an additional chromophore to the spectral window,
increasing spectral overlap and cross irradiation problems.
As an alternative, it was decided to follow a statistical/probabilistic approach to control the number of
nucleotides incorporated in each growing strand. By characterizing the size distribution after each
incorporation cycle, and taking into account each nucleotide’s different incorporation efficiency, it
should be fairly simple to assess the confidence interval in which the final desired sequence would be
produced, after n cycles of incorporation. A study conducted by Chang and co‐workers[210] regarding the
formation of homopolymers, in which the initiator strand/free nucleotide ratio was controlled indicated
that little bias was obtained in product size distribution, and a statistical product size population could be
predicted.
According to the commercially available TdTs manufacturer[50], in the presence of 130 equivalents of
dATP or dTTP, between 100 and 130 nucleotides will be incorporated per equivalent growing strand. In
the presence of 60 equivalents of dCTP or dGTP however, only 20 to 30 nucleotides will be incorporated.
This demonstrates lower incorporation efficiency for dGTP and dCTP, when compared to dATP and dTTP.
In order to assess the effect of the different nitrogen base on product size after free deoxyribonucleotide
(dNTP) incorporation, the following experiment was conducted. Using a single‐stranded DNA
oligonucleotide as substrate (20 bases long), one deoxyribonucleotide type was added to each sample, in
a 1:40 ratio (substrate:nucleotide) and incubated at 37°C. Products were analyzed on a 12%
polyacrylamide ‐ 8M urea denaturing gel electrophoresis ‐ Figure 4.15.
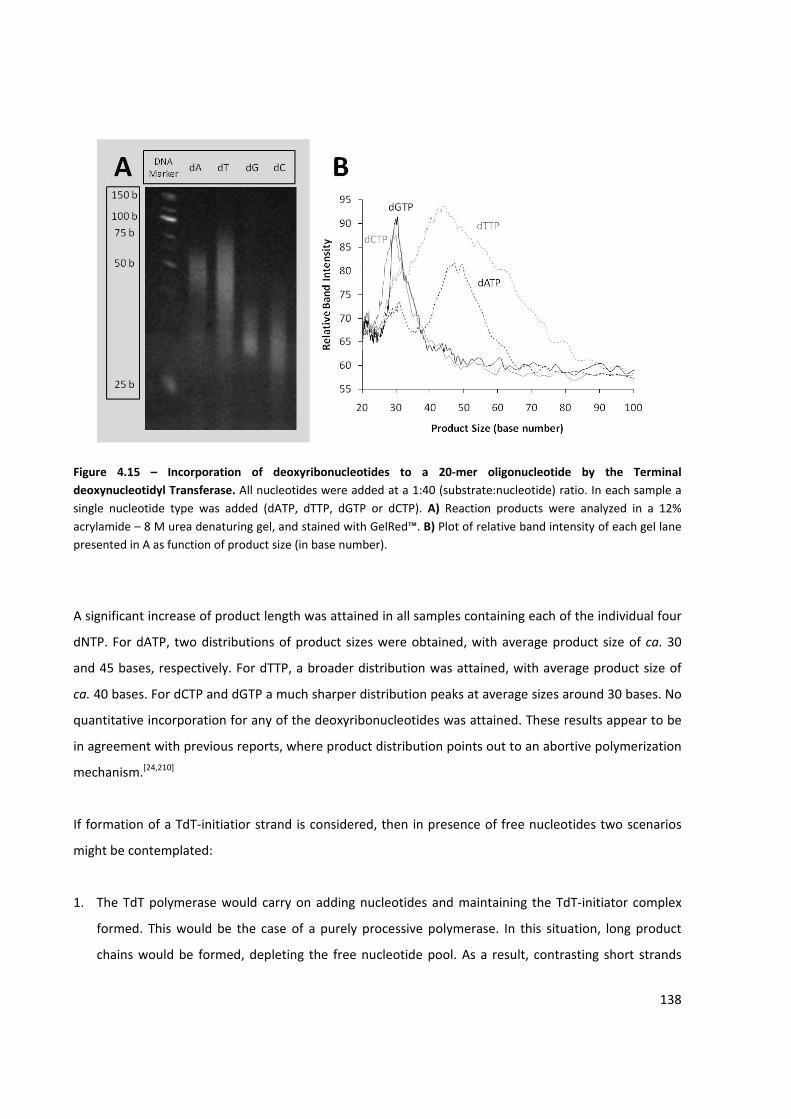
138
Figure 4.15 – Incorporation of deoxyribonucleotides to a 20‐mer oligonucleotide by the Terminal deoxynucleotidyl Transferase. All nucleotides were added at a 1:40 (substrate:nucleotide) ratio. In each sample a single nucleotide type was added (dATP, dTTP, dGTP or dCTP). A) Reaction products were analyzed in a 12% acrylamide – 8 M urea denaturing gel, and stained with GelRed™. B) Plot of relative band intensity of each gel lane presented in A as function of product size (in base number).
A significant increase of product length was attained in all samples containing each of the individual four
dNTP. For dATP, two distributions of product sizes were obtained, with average product size of ca. 30
and 45 bases, respectively. For dTTP, a broader distribution was attained, with average product size of
ca. 40 bases. For dCTP and dGTP a much sharper distribution peaks at average sizes around 30 bases. No
quantitative incorporation for any of the deoxyribonucleotides was attained. These results appear to be
in agreement with previous reports, where product distribution points out to an abortive polymerization
mechanism.[24,210]
If formation of a TdT‐initiatior strand is considered, then in presence of free nucleotides two scenarios
might be contemplated:
1. The TdT polymerase would carry on adding nucleotides and maintaining the TdT‐initiator complex
formed. This would be the case of a purely processive polymerase. In this situation, long product
chains would be formed, depleting the free nucleotide pool. As a result, contrasting short strands
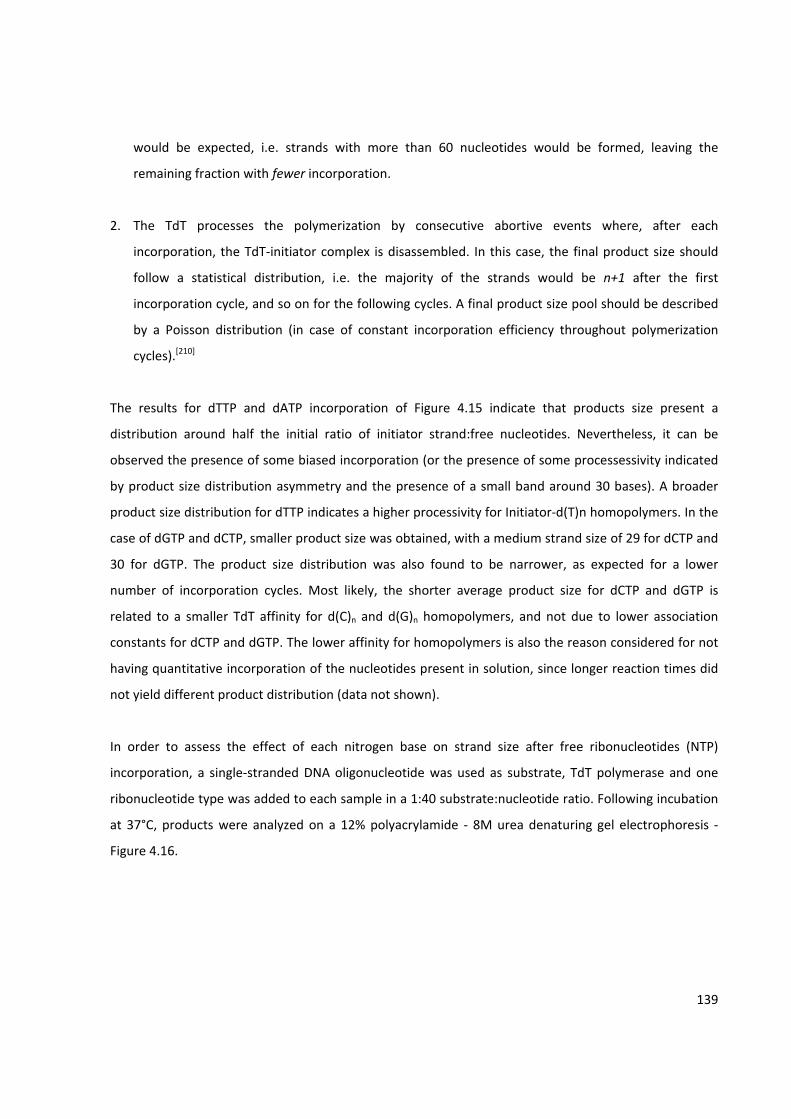
139
would be expected, i.e. strands with more than 60 nucleotides would be formed, leaving the
remaining fraction with fewer incorporation.
2. The TdT processes the polymerization by consecutive abortive events where, after each
incorporation, the TdT‐initiator complex is disassembled. In this case, the final product size should
follow a statistical distribution, i.e. the majority of the strands would be n+1 after the first
incorporation cycle, and so on for the following cycles. A final product size pool should be described
by a Poisson distribution (in case of constant incorporation efficiency throughout polymerization
cycles).[210]
The results for dTTP and dATP incorporation of Figure 4.15 indicate that products size present a
distribution around half the initial ratio of initiator strand:free nucleotides. Nevertheless, it can be
observed the presence of some biased incorporation (or the presence of some processessivity indicated
by product size distribution asymmetry and the presence of a small band around 30 bases). A broader
product size distribution for dTTP indicates a higher processivity for Initiator‐d(T)n homopolymers. In the
case of dGTP and dCTP, smaller product size was obtained, with a medium strand size of 29 for dCTP and
30 for dGTP. The product size distribution was also found to be narrower, as expected for a lower
number of incorporation cycles. Most likely, the shorter average product size for dCTP and dGTP is
related to a smaller TdT affinity for d(C)n and d(G)n homopolymers, and not due to lower association
constants for dCTP and dGTP. The lower affinity for homopolymers is also the reason considered for not
having quantitative incorporation of the nucleotides present in solution, since longer reaction times did
not yield different product distribution (data not shown).
In order to assess the effect of each nitrogen base on strand size after free ribonucleotides (NTP)
incorporation, a single‐stranded DNA oligonucleotide was used as substrate, TdT polymerase and one
ribonucleotide type was added to each sample in a 1:40 substrate:nucleotide ratio. Following incubation
at 37°C, products were analyzed on a 12% polyacrylamide ‐ 8M urea denaturing gel electrophoresis ‐
Figure 4.16.
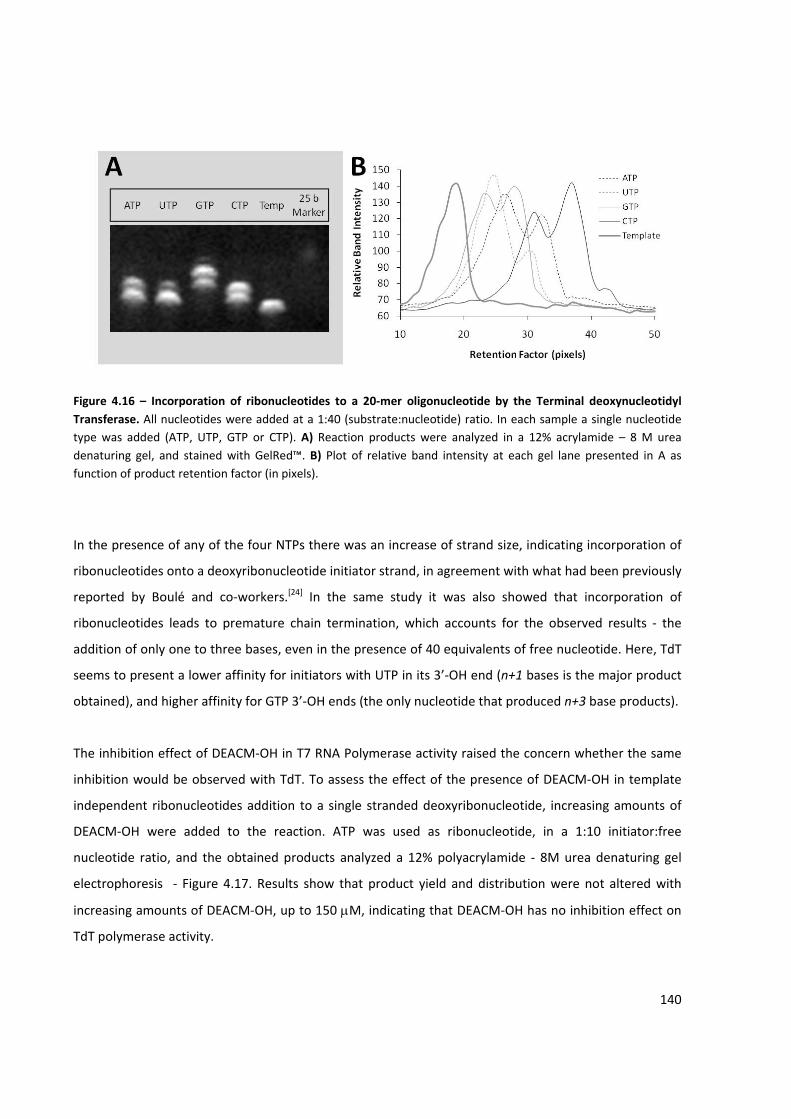
140
Figure 4.16 – Incorporation of ribonucleotides to a 20‐mer oligonucleotide by the Terminal deoxynucleotidyl Transferase. All nucleotides were added at a 1:40 (substrate:nucleotide) ratio. In each sample a single nucleotide type was added (ATP, UTP, GTP or CTP). A) Reaction products were analyzed in a 12% acrylamide – 8 M urea denaturing gel, and stained with GelRed™. B) Plot of relative band intensity at each gel lane presented in A as function of product retention factor (in pixels).
In the presence of any of the four NTPs there was an increase of strand size, indicating incorporation of
ribonucleotides onto a deoxyribonucleotide initiator strand, in agreement with what had been previously
reported by Boulé and co‐workers.[24] In the same study it was also showed that incorporation of
ribonucleotides leads to premature chain termination, which accounts for the observed results ‐ the
addition of only one to three bases, even in the presence of 40 equivalents of free nucleotide. Here, TdT
seems to present a lower affinity for initiators with UTP in its 3’‐OH end (n+1 bases is the major product
obtained), and higher affinity for GTP 3’‐OH ends (the only nucleotide that produced n+3 base products).
The inhibition effect of DEACM‐OH in T7 RNA Polymerase activity raised the concern whether the same
inhibition would be observed with TdT. To assess the effect of the presence of DEACM‐OH in template
independent ribonucleotides addition to a single stranded deoxyribonucleotide, increasing amounts of
DEACM‐OH were added to the reaction. ATP was used as ribonucleotide, in a 1:10 initiator:free
nucleotide ratio, and the obtained products analyzed a 12% polyacrylamide ‐ 8M urea denaturing gel
electrophoresis ‐ Figure 4.17. Results show that product yield and distribution were not altered with
increasing amounts of DEACM‐OH, up to 150 μM, indicating that DEACM‐OH has no inhibition effect on
TdT polymerase activity.
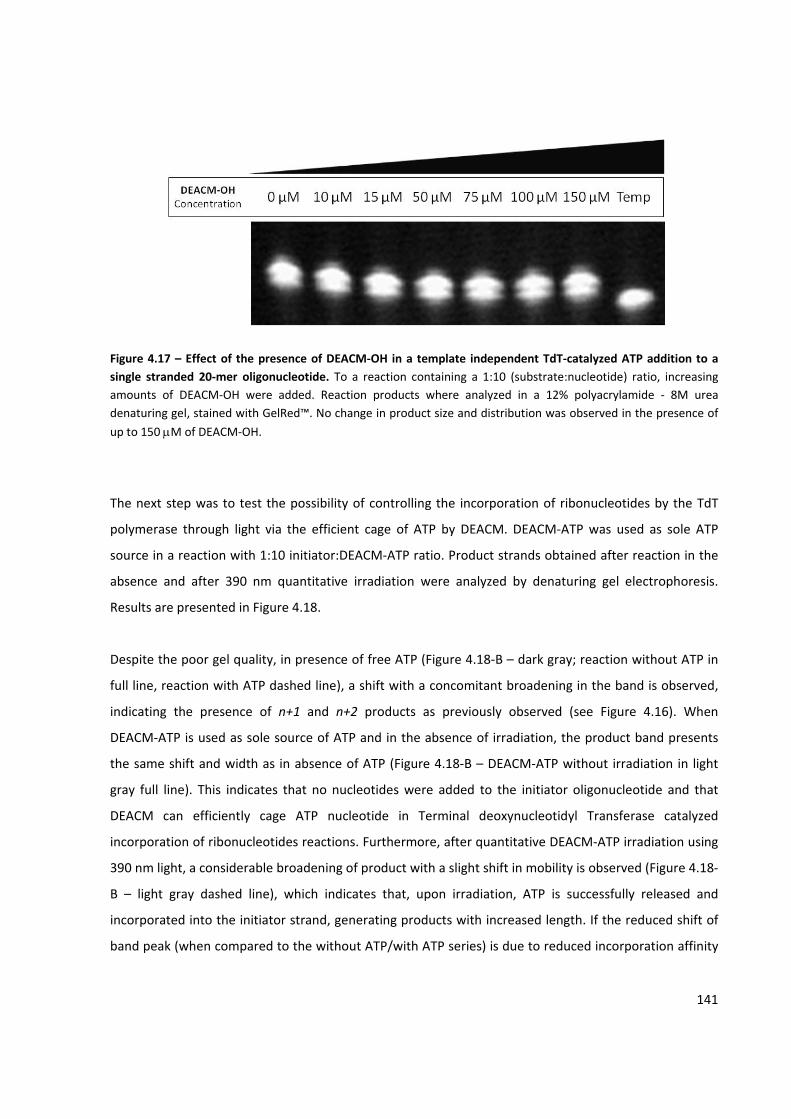
141
Figure 4.17 – Effect of the presence of DEACM‐OH in a template independent TdT‐catalyzed ATP addition to a single stranded 20‐mer oligonucleotide. To a reaction containing a 1:10 (substrate:nucleotide) ratio, increasing amounts of DEACM‐OH were added. Reaction products where analyzed in a 12% polyacrylamide ‐ 8M urea denaturing gel, stained with GelRed™. No change in product size and distribution was observed in the presence of
up to 150 μM of DEACM‐OH.
The next step was to test the possibility of controlling the incorporation of ribonucleotides by the TdT
polymerase through light via the efficient cage of ATP by DEACM. DEACM‐ATP was used as sole ATP
source in a reaction with 1:10 initiator:DEACM‐ATP ratio. Product strands obtained after reaction in the
absence and after 390 nm quantitative irradiation were analyzed by denaturing gel electrophoresis.
Results are presented in Figure 4.18.
Despite the poor gel quality, in presence of free ATP (Figure 4.18‐B – dark gray; reaction without ATP in
full line, reaction with ATP dashed line), a shift with a concomitant broadening in the band is observed,
indicating the presence of n+1 and n+2 products as previously observed (see Figure 4.16). When
DEACM‐ATP is used as sole source of ATP and in the absence of irradiation, the product band presents
the same shift and width as in absence of ATP (Figure 4.18‐B – DEACM‐ATP without irradiation in light
gray full line). This indicates that no nucleotides were added to the initiator oligonucleotide and that
DEACM can efficiently cage ATP nucleotide in Terminal deoxynucleotidyl Transferase catalyzed
incorporation of ribonucleotides reactions. Furthermore, after quantitative DEACM‐ATP irradiation using
390 nm light, a considerable broadening of product with a slight shift in mobility is observed (Figure 4.18‐
B – light gray dashed line), which indicates that, upon irradiation, ATP is successfully released and
incorporated into the initiator strand, generating products with increased length. If the reduced shift of
band peak (when compared to the without ATP/with ATP series) is due to reduced incorporation affinity
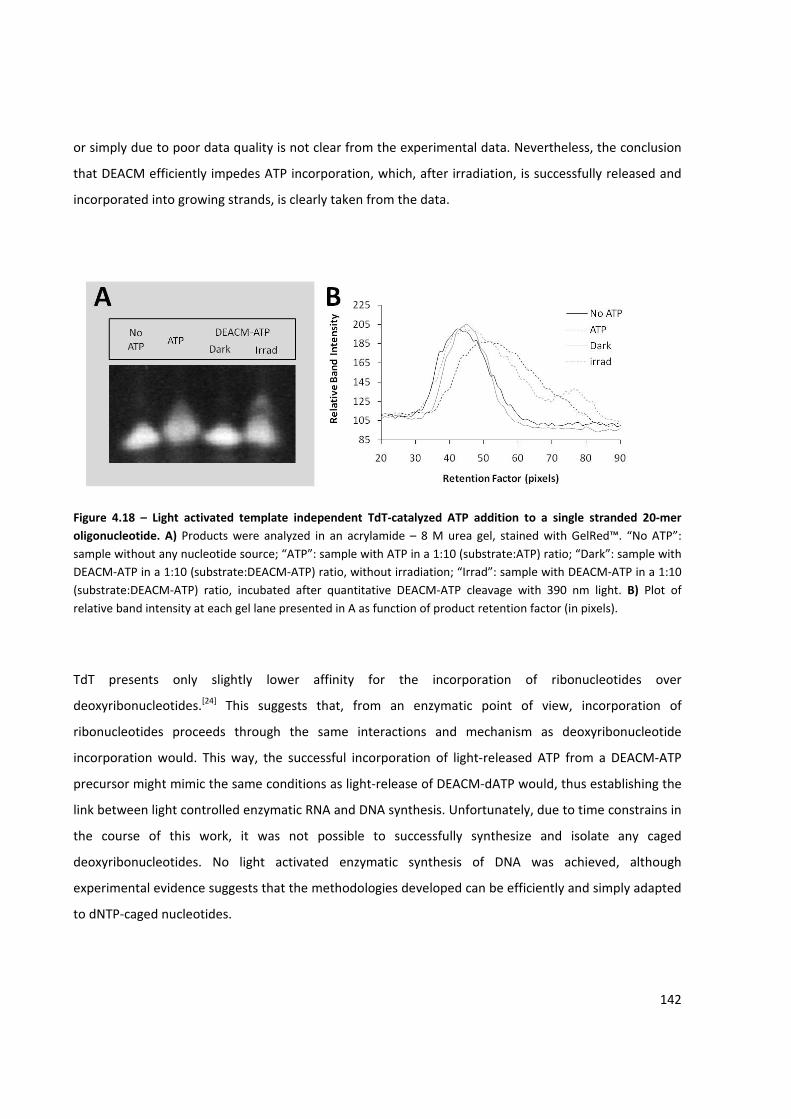
142
or simply due to poor data quality is not clear from the experimental data. Nevertheless, the conclusion
that DEACM efficiently impedes ATP incorporation, which, after irradiation, is successfully released and
incorporated into growing strands, is clearly taken from the data.
Figure 4.18 – Light activated template independent TdT‐catalyzed ATP addition to a single stranded 20‐mer oligonucleotide. A) Products were analyzed in an acrylamide – 8 M urea gel, stained with GelRed™. “No ATP”: sample without any nucleotide source; “ATP”: sample with ATP in a 1:10 (substrate:ATP) ratio; “Dark”: sample with DEACM‐ATP in a 1:10 (substrate:DEACM‐ATP) ratio, without irradiation; “Irrad”: sample with DEACM‐ATP in a 1:10 (substrate:DEACM‐ATP) ratio, incubated after quantitative DEACM‐ATP cleavage with 390 nm light. B) Plot of relative band intensity at each gel lane presented in A as function of product retention factor (in pixels).
TdT presents only slightly lower affinity for the incorporation of ribonucleotides over
deoxyribonucleotides.[24] This suggests that, from an enzymatic point of view, incorporation of
ribonucleotides proceeds through the same interactions and mechanism as deoxyribonucleotide
incorporation would. This way, the successful incorporation of light‐released ATP from a DEACM‐ATP
precursor might mimic the same conditions as light‐release of DEACM‐dATP would, thus establishing the
link between light controlled enzymatic RNA and DNA synthesis. Unfortunately, due to time constrains in
the course of this work, it was not possible to successfully synthesize and isolate any caged
deoxyribonucleotides. No light activated enzymatic synthesis of DNA was achieved, although
experimental evidence suggests that the methodologies developed can be efficiently and simply adapted
to dNTP‐caged nucleotides.
143
CHAPTER 5. Light Controlled Synthesis of Nucleic Acids Using Multi‐Wavelength Excitation
144
The light‐activated in vitro transcription reactions experiments showed that DEACM efficiently cages the
incorporation of ATP in growing RNA strands. These results are the first proof‐of‐concept that light can
be used as an actuator for the nucleotide’s transition between an OFF and ON state in the
polymerization of nucleic acids. Once the nucleotides are switched to the ON state, progressive
incorporation of released nucleotides occurs. The Terminal deoxynucleotidyl Transferase experiments
showed that a template independent polymerization of nucleic acids controlled by light is also possible.
Experimental results indicate that using caged‐dNTP the strand size might be modulated by means of
bursts of nucleotide release and using a statistical approach to control final product size. The qualitative
ON/OFF polymerization state found in the in vitro transcription reactions (absence/presence of a full size
product) is then transformed into a quantitative state, where product length might be modulated. So far,
all light‐controlled experiments were conducted with only one caged nucleotide type. The next step is to
achieve control over the release of one type of nucleotide, in a mixture of caged nucleotides. In this
chapter are presented the synthesis, characterization and application of a second caged‐nucleotide type
– the 7‐methoxy‐4‐methylcoumarin (MCM). It is also presented the exploratory work conducted in the
development of a specific release of a nucleotide in the presence of a binary caged‐nucleotide system,
light‐input/RNA output logic gates.
5.1. Synthesis of 7‐methoxy‐4‐methylcoumarin Derivatives
Spectral properties of coumarin derivatives, more particularly the absorption spectrum, can be
modulated through the substitution pattern of the coumarinic core (see Section 1.4.2). In order to obtain
a coumarin chromophore that displays a significant shifted absorption spectrum from the DEACM one,
the push‐pull electro donating/withdrawing balance has to be altered. Ideally the absorption should be
red‐shifted from the DEACM chromophore, for which it would be required to add strong electro‐
withdrawing substituents in the 3‐position or stronger electro‐donating substituents in the 6‐ or 7‐
position of the coumarinic core. The addition of either a “locked” amino group at the 7‐ position (Figure
5.1 – 1 and 2) or an acetyl (Figure 5.1 – 2), carbohydrazide (Figure 5.1 – 3), 1‐methyl‐1H‐benzimidazol‐2‐yl
(Figure 5.1 – 4), 2‐benzimidazolyl (Figure 5.1 – 5), 2‐benzoxazolyl (Figure 5.1 – 6), or 2‐benzothiazolyl
(Figure 5.1 – 7) at the 3‐position shifts the absorption to higher wavelengths. However, several
drawbacks can be found when using the referred groups: synthesis complexity, price and water
solubility. Most commercially available starting materials with the referred substituents do not have a
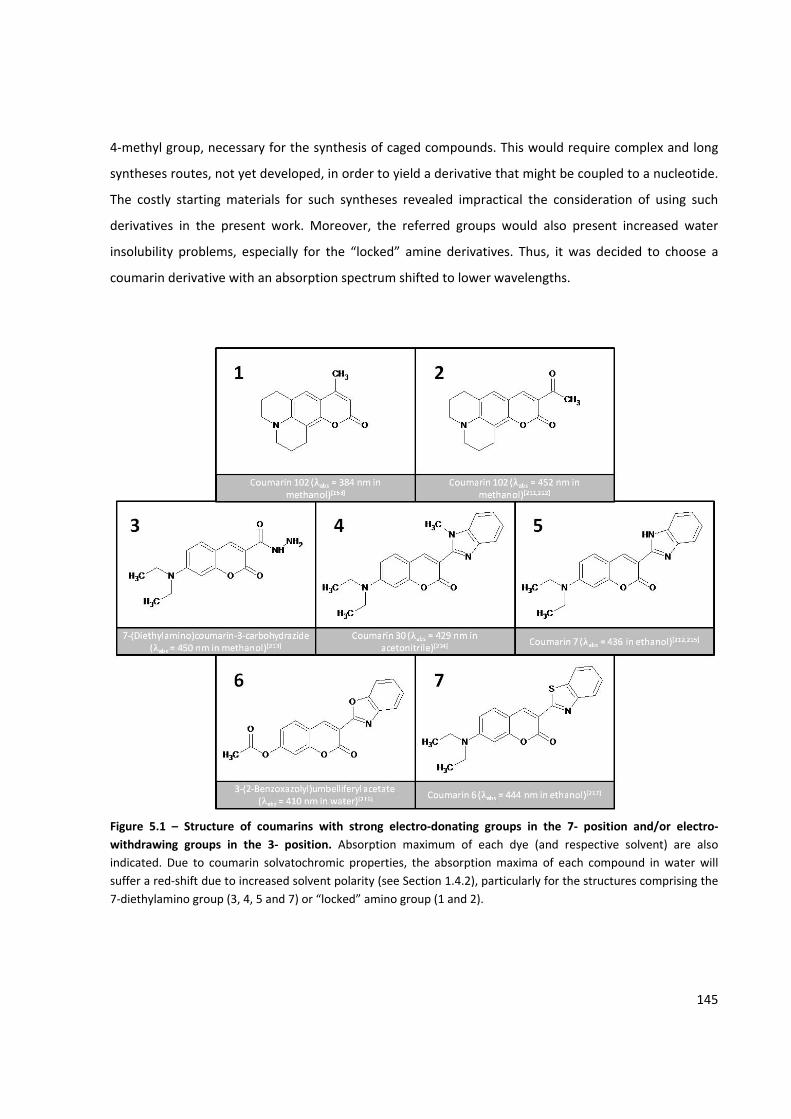
145
4‐methyl group, necessary for the synthesis of caged compounds. This would require complex and long
syntheses routes, not yet developed, in order to yield a derivative that might be coupled to a nucleotide.
The costly starting materials for such syntheses revealed impractical the consideration of using such
derivatives in the present work. Moreover, the referred groups would also present increased water
insolubility problems, especially for the “locked” amine derivatives. Thus, it was decided to choose a
coumarin derivative with an absorption spectrum shifted to lower wavelengths.
Figure 5.1 – Structure of coumarins with strong electro‐donating groups in the 7‐ position and/or electro‐withdrawing groups in the 3‐ position. Absorption maximum of each dye (and respective solvent) are also indicated. Due to coumarin solvatochromic properties, the absorption maxima of each compound in water will suffer a red‐shift due to increased solvent polarity (see Section 1.4.2), particularly for the structures comprising the 7‐diethylamino group (3, 4, 5 and 7) or “locked” amino group (1 and 2).
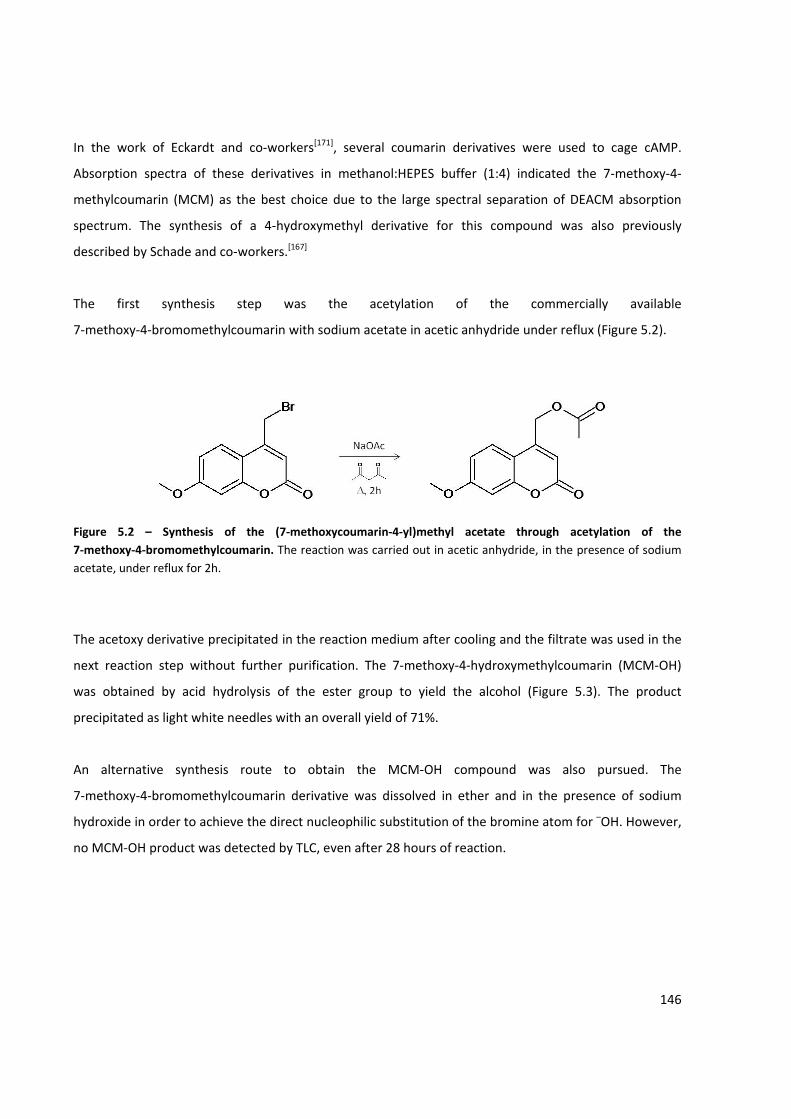
146
In the work of Eckardt and co‐workers[171], several coumarin derivatives were used to cage cAMP.
Absorption spectra of these derivatives in methanol:HEPES buffer (1:4) indicated the 7‐methoxy‐4‐
methylcoumarin (MCM) as the best choice due to the large spectral separation of DEACM absorption
spectrum. The synthesis of a 4‐hydroxymethyl derivative for this compound was also previously
described by Schade and co‐workers.[167]
The first synthesis step was the acetylation of the commercially available
7‐methoxy‐4‐bromomethylcoumarin with sodium acetate in acetic anhydride under reflux (Figure 5.2).
Figure 5.2 – Synthesis of the (7‐methoxycoumarin‐4‐yl)methyl acetate through acetylation of the 7‐methoxy‐4‐bromomethylcoumarin. The reaction was carried out in acetic anhydride, in the presence of sodium acetate, under reflux for 2h.
The acetoxy derivative precipitated in the reaction medium after cooling and the filtrate was used in the
next reaction step without further purification. The 7‐methoxy‐4‐hydroxymethylcoumarin (MCM‐OH)
was obtained by acid hydrolysis of the ester group to yield the alcohol (Figure 5.3). The product
precipitated as light white needles with an overall yield of 71%.
An alternative synthesis route to obtain the MCM‐OH compound was also pursued. The
7‐methoxy‐4‐bromomethylcoumarin derivative was dissolved in ether and in the presence of sodium
hydroxide in order to achieve the direct nucleophilic substitution of the bromine atom for –OH. However,
no MCM‐OH product was detected by TLC, even after 28 hours of reaction.
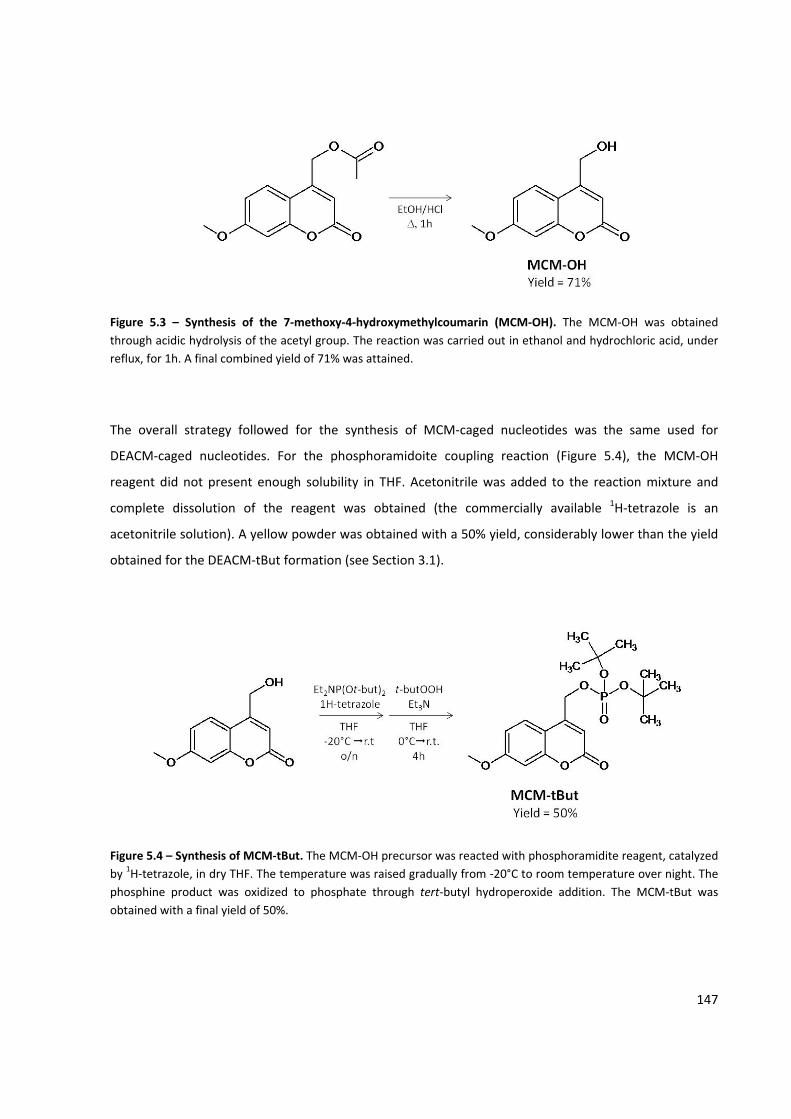
147
Figure 5.3 – Synthesis of the 7‐methoxy‐4‐hydroxymethylcoumarin (MCM‐OH). The MCM‐OH was obtained through acidic hydrolysis of the acetyl group. The reaction was carried out in ethanol and hydrochloric acid, under reflux, for 1h. A final combined yield of 71% was attained.
The overall strategy followed for the synthesis of MCM‐caged nucleotides was the same used for
DEACM‐caged nucleotides. For the phosphoramidoite coupling reaction (Figure 5.4), the MCM‐OH
reagent did not present enough solubility in THF. Acetonitrile was added to the reaction mixture and
complete dissolution of the reagent was obtained (the commercially available 1H‐tetrazole is an
acetonitrile solution). A yellow powder was obtained with a 50% yield, considerably lower than the yield
obtained for the DEACM‐tBut formation (see Section 3.1).
Figure 5.4 – Synthesis of MCM‐tBut. The MCM‐OH precursor was reacted with phosphoramidite reagent, catalyzed by 1H‐tetrazole, in dry THF. The temperature was raised gradually from ‐20°C to room temperature over night. The phosphine product was oxidized to phosphate through tert‐butyl hydroperoxide addition. The MCM‐tBut was obtained with a final yield of 50%.
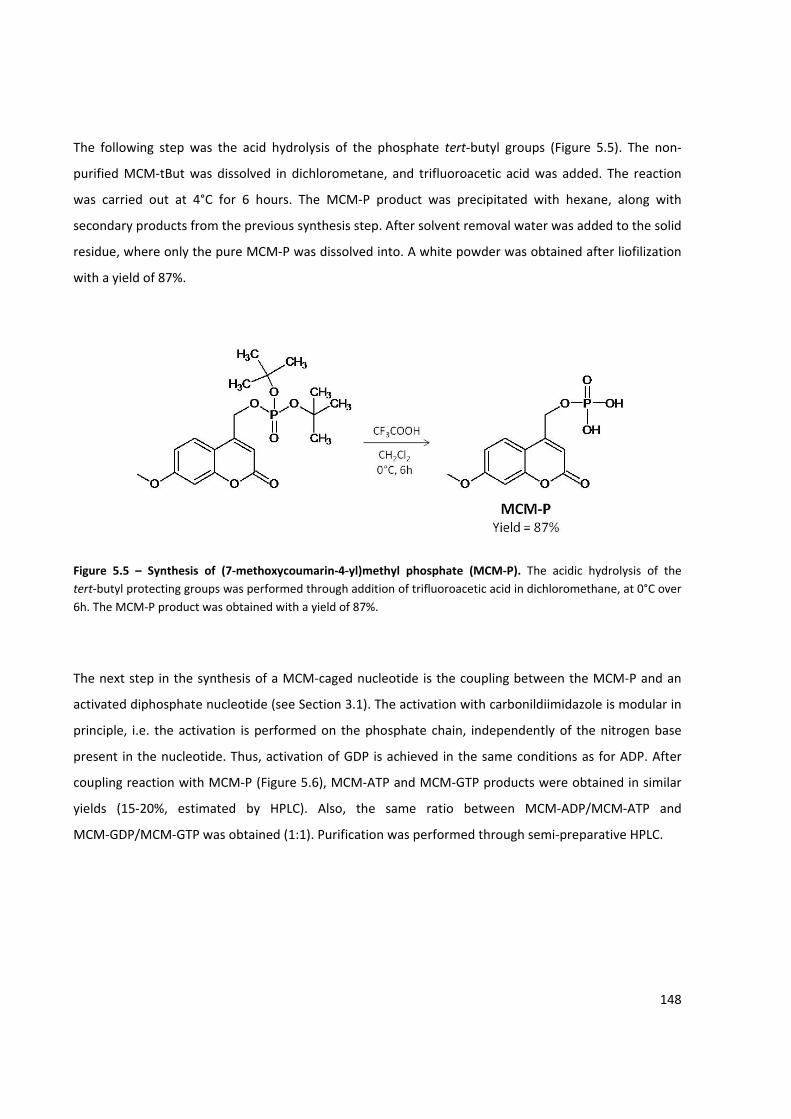
148
The following step was the acid hydrolysis of the phosphate tert‐butyl groups (Figure 5.5). The non‐
purified MCM‐tBut was dissolved in dichlorometane, and trifluoroacetic acid was added. The reaction
was carried out at 4°C for 6 hours. The MCM‐P product was precipitated with hexane, along with
secondary products from the previous synthesis step. After solvent removal water was added to the solid
residue, where only the pure MCM‐P was dissolved into. A white powder was obtained after liofilization
with a yield of 87%.
Figure 5.5 – Synthesis of (7‐methoxycoumarin‐4‐yl)methyl phosphate (MCM‐P). The acidic hydrolysis of the tert‐butyl protecting groups was performed through addition of trifluoroacetic acid in dichloromethane, at 0°C over 6h. The MCM‐P product was obtained with a yield of 87%.
The next step in the synthesis of a MCM‐caged nucleotide is the coupling between the MCM‐P and an
activated diphosphate nucleotide (see Section 3.1). The activation with carbonildiimidazole is modular in
principle, i.e. the activation is performed on the phosphate chain, independently of the nitrogen base
present in the nucleotide. Thus, activation of GDP is achieved in the same conditions as for ADP. After
coupling reaction with MCM‐P (Figure 5.6), MCM‐ATP and MCM‐GTP products were obtained in similar
yields (15‐20%, estimated by HPLC). Also, the same ratio between MCM‐ADP/MCM‐ATP and
MCM‐GDP/MCM‐GTP was obtained (1:1). Purification was performed through semi‐preparative HPLC.
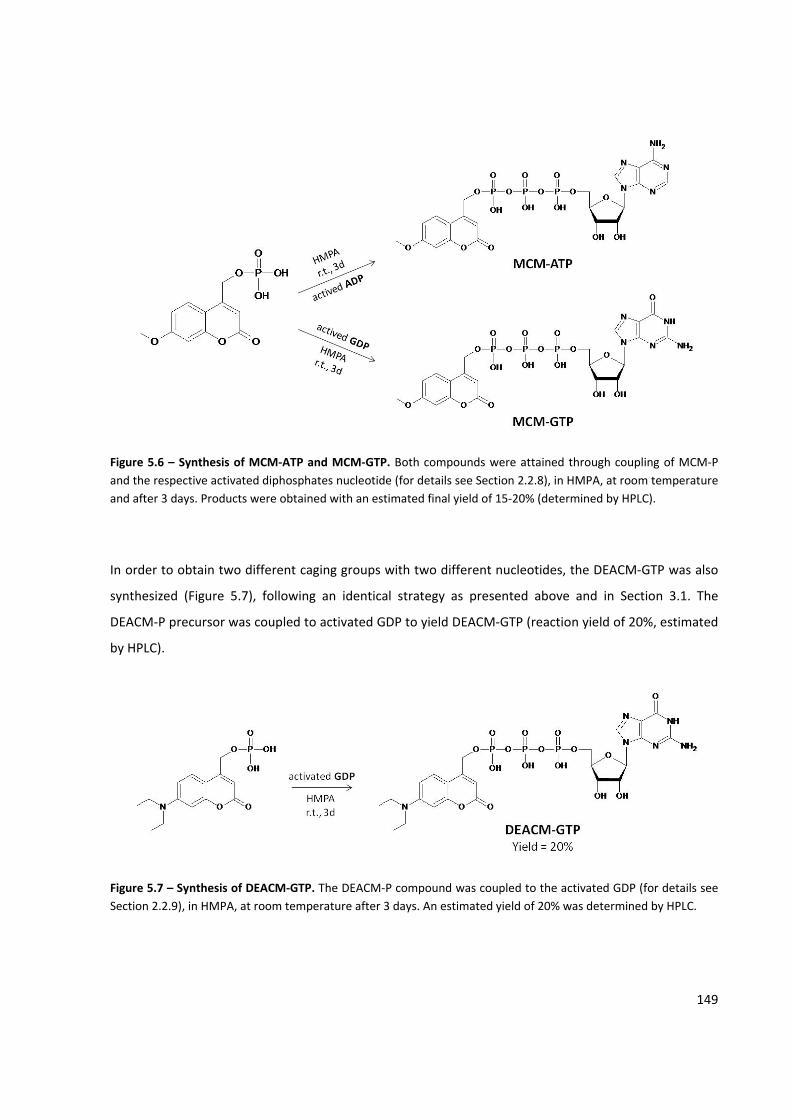
149
Figure 5.6 – Synthesis of MCM‐ATP and MCM‐GTP. Both compounds were attained through coupling of MCM‐P and the respective activated diphosphates nucleotide (for details see Section 2.2.8), in HMPA, at room temperature and after 3 days. Products were obtained with an estimated final yield of 15‐20% (determined by HPLC).
In order to obtain two different caging groups with two different nucleotides, the DEACM‐GTP was also
synthesized (Figure 5.7), following an identical strategy as presented above and in Section 3.1. The
DEACM‐P precursor was coupled to activated GDP to yield DEACM‐GTP (reaction yield of 20%, estimated
by HPLC).
Figure 5.7 – Synthesis of DEACM‐GTP. The DEACM‐P compound was coupled to the activated GDP (for details see Section 2.2.9), in HMPA, at room temperature after 3 days. An estimated yield of 20% was determined by HPLC.
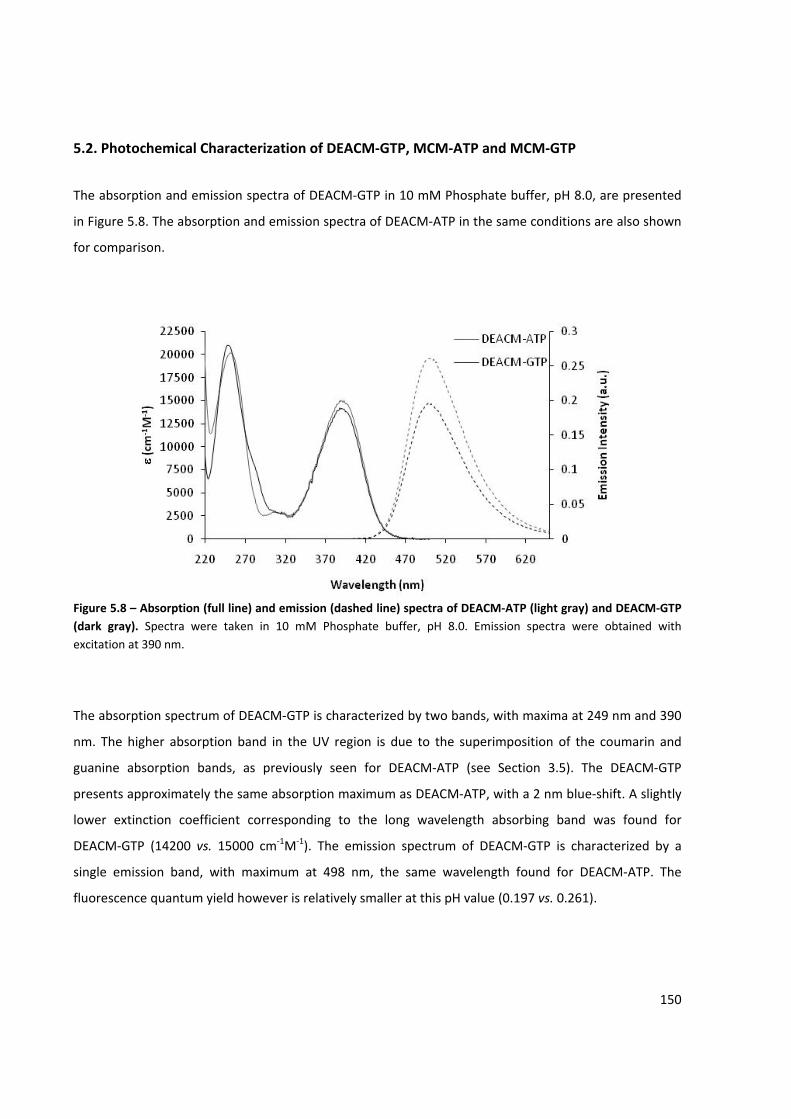
150
5.2. Photochemical Characterization of DEACM‐GTP, MCM‐ATP and MCM‐GTP
The absorption and emission spectra of DEACM‐GTP in 10 mM Phosphate buffer, pH 8.0, are presented
in Figure 5.8. The absorption and emission spectra of DEACM‐ATP in the same conditions are also shown
for comparison.
Figure 5.8 – Absorption (full line) and emission (dashed line) spectra of DEACM‐ATP (light gray) and DEACM‐GTP (dark gray). Spectra were taken in 10 mM Phosphate buffer, pH 8.0. Emission spectra were obtained with excitation at 390 nm.
The absorption spectrum of DEACM‐GTP is characterized by two bands, with maxima at 249 nm and 390
nm. The higher absorption band in the UV region is due to the superimposition of the coumarin and
guanine absorption bands, as previously seen for DEACM‐ATP (see Section 3.5). The DEACM‐GTP
presents approximately the same absorption maximum as DEACM‐ATP, with a 2 nm blue‐shift. A slightly
lower extinction coefficient corresponding to the long wavelength absorbing band was found for
DEACM‐GTP (14200 vs. 15000 cm‐1M‐1). The emission spectrum of DEACM‐GTP is characterized by a
single emission band, with maximum at 498 nm, the same wavelength found for DEACM‐ATP. The
fluorescence quantum yield however is relatively smaller at this pH value (0.197 vs. 0.261).
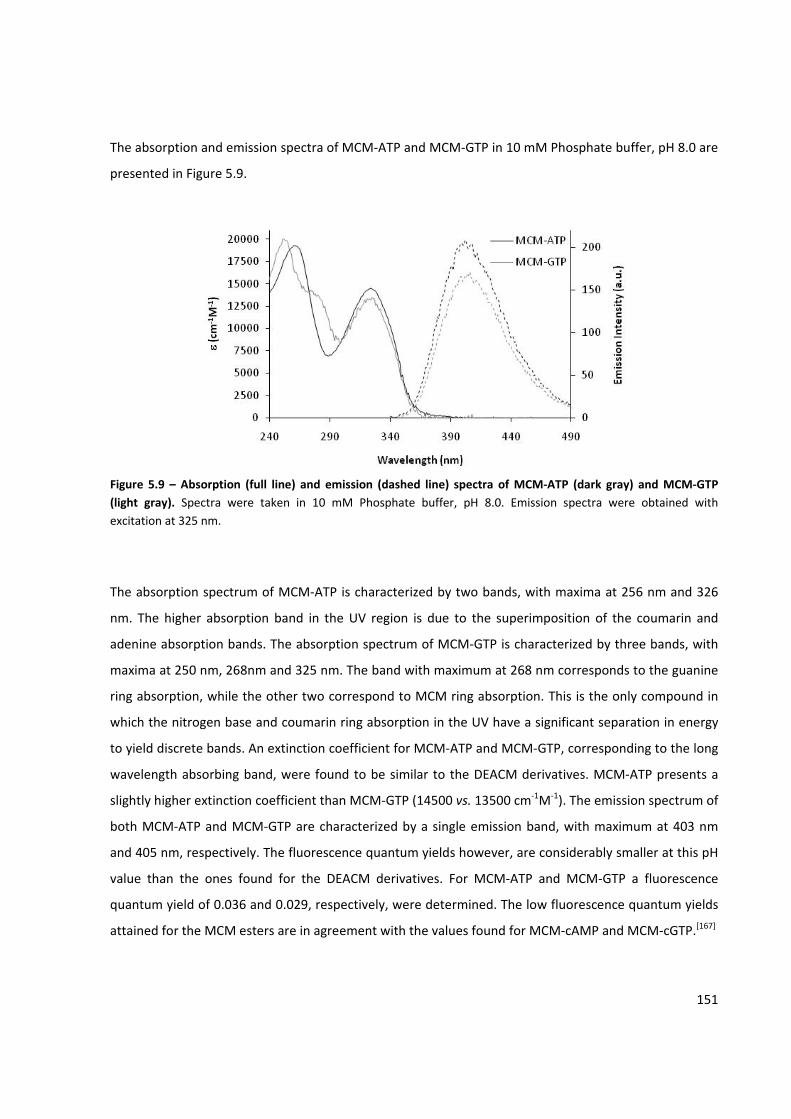
151
The absorption and emission spectra of MCM‐ATP and MCM‐GTP in 10 mM Phosphate buffer, pH 8.0 are
presented in Figure 5.9.
Figure 5.9 – Absorption (full line) and emission (dashed line) spectra of MCM‐ATP (dark gray) and MCM‐GTP (light gray). Spectra were taken in 10 mM Phosphate buffer, pH 8.0. Emission spectra were obtained with excitation at 325 nm.
The absorption spectrum of MCM‐ATP is characterized by two bands, with maxima at 256 nm and 326
nm. The higher absorption band in the UV region is due to the superimposition of the coumarin and
adenine absorption bands. The absorption spectrum of MCM‐GTP is characterized by three bands, with
maxima at 250 nm, 268nm and 325 nm. The band with maximum at 268 nm corresponds to the guanine
ring absorption, while the other two correspond to MCM ring absorption. This is the only compound in
which the nitrogen base and coumarin ring absorption in the UV have a significant separation in energy
to yield discrete bands. An extinction coefficient for MCM‐ATP and MCM‐GTP, corresponding to the long
wavelength absorbing band, were found to be similar to the DEACM derivatives. MCM‐ATP presents a
slightly higher extinction coefficient than MCM‐GTP (14500 vs. 13500 cm‐1M‐1). The emission spectrum of
both MCM‐ATP and MCM‐GTP are characterized by a single emission band, with maximum at 403 nm
and 405 nm, respectively. The fluorescence quantum yields however, are considerably smaller at this pH
value than the ones found for the DEACM derivatives. For MCM‐ATP and MCM‐GTP a fluorescence
quantum yield of 0.036 and 0.029, respectively, were determined. The low fluorescence quantum yields
attained for the MCM esters are in agreement with the values found for MCM‐cAMP and MCM‐cGTP.[167]
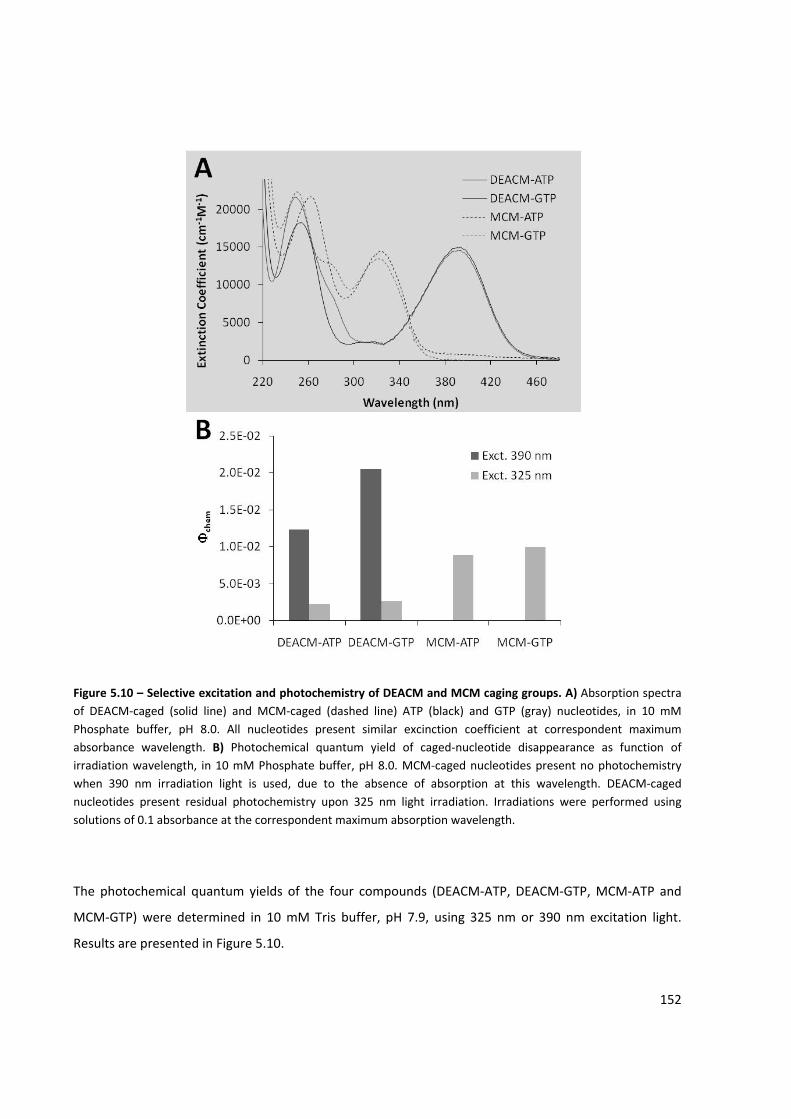
152
Figure 5.10 – Selective excitation and photochemistry of DEACM and MCM caging groups. A) Absorption spectra of DEACM‐caged (solid line) and MCM‐caged (dashed line) ATP (black) and GTP (gray) nucleotides, in 10 mM Phosphate buffer, pH 8.0. All nucleotides present similar excinction coefficient at correspondent maximum absorbance wavelength. B) Photochemical quantum yield of caged‐nucleotide disappearance as function of irradiation wavelength, in 10 mM Phosphate buffer, pH 8.0. MCM‐caged nucleotides present no photochemistry when 390 nm irradiation light is used, due to the absence of absorption at this wavelength. DEACM‐caged nucleotides present residual photochemistry upon 325 nm light irradiation. Irradiations were performed using solutions of 0.1 absorbance at the correspondent maximum absorption wavelength.
The photochemical quantum yields of the four compounds (DEACM‐ATP, DEACM‐GTP, MCM‐ATP and
MCM‐GTP) were determined in 10 mM Tris buffer, pH 7.9, using 325 nm or 390 nm excitation light.
Results are presented in Figure 5.10.
153
MCM‐caged nucleotides present no absorption at 390 nm (when the same concentration of both MCM
and DEACM derivatives is used) and, consequently, no photochemistry when this wavelength is used for
excitation (Figure 5.10‐B). The photochemical quantum yields of MCM‐caged nucleotide cleavage are
similar for both nucleotides (0.0089 for MCM‐ATP and 0.0100 for MCM‐GTP). Although the spectral
separation between the absorption bands of the DEACM and MCM derivatives is clear, at 325 nm there
is some DEACM absorption (circa 15% of the maximum absorption). The photochemical quantum yields
of the DEACM derivatives, when 325 nm light is used as excitation, show the presence of residual
photochemistry. This observation should be taken into account in multi‐excitation experiments, where
both DEACM and MCM are present in solution. In order to reduce the leakage effect on DEACM upon
325 nm excitation, MCM nucleotide relative concentration might be increased. This way, competition for
excitation light and higher photochemical quantum yield might reduce the amount of DEACM‐caged
nucleotide cleavage upon 325 nm irradiation. The photochemical quantum yield of DEACM‐GTP
disappearance (using 390 nm excitation) is higher than for DEACM‐ATP. Conversely, as previously seen
for DEACM‐ATP, the photochemical quantum yield of DEACM‐OH formation is considerably lower for this
compound, even lower than in the DEACM‐ATP case (0.0034 vs. 0.0071, respectively). The similar
photophysical and photochemical properties for DEACM‐ATP and DEACM‐GTP seem to sugest that a
ground‐state interaction between the coumarin and guanine ring is also present in DEACM‐GTP.
However, more studies are requirered to confirm this hypothesis, such as lifetime measurements and
photochemistry dependence on pH.
5.3. Light‐activated in vitro Transcription Reactions Using DEACM‐ and MCM‐Caged Nucleotides
Coumarin derivatives and their coupling to the ATP triphosphate tail was chosen for their theoretical
modular application. The synthesis strategy seemed to be independent on the nitrogen base of the
nucleotide, which was confirmed by the successful synthesis and characterization of both DEACM‐ATP
and DEACM‐GTP. Moreover, the synthesis strategy seemed independent of the coumarin ring
substituent pattern, which was also confirmed by the sucessful synthesis and characterization of
MCM‐ATP and MCM‐GTP. From an application point of view, the proof‐of‐concept presented in Chapter
4, of using DEACM‐ATP as an actuator was also expected to be extendable to other nucleotides, as well
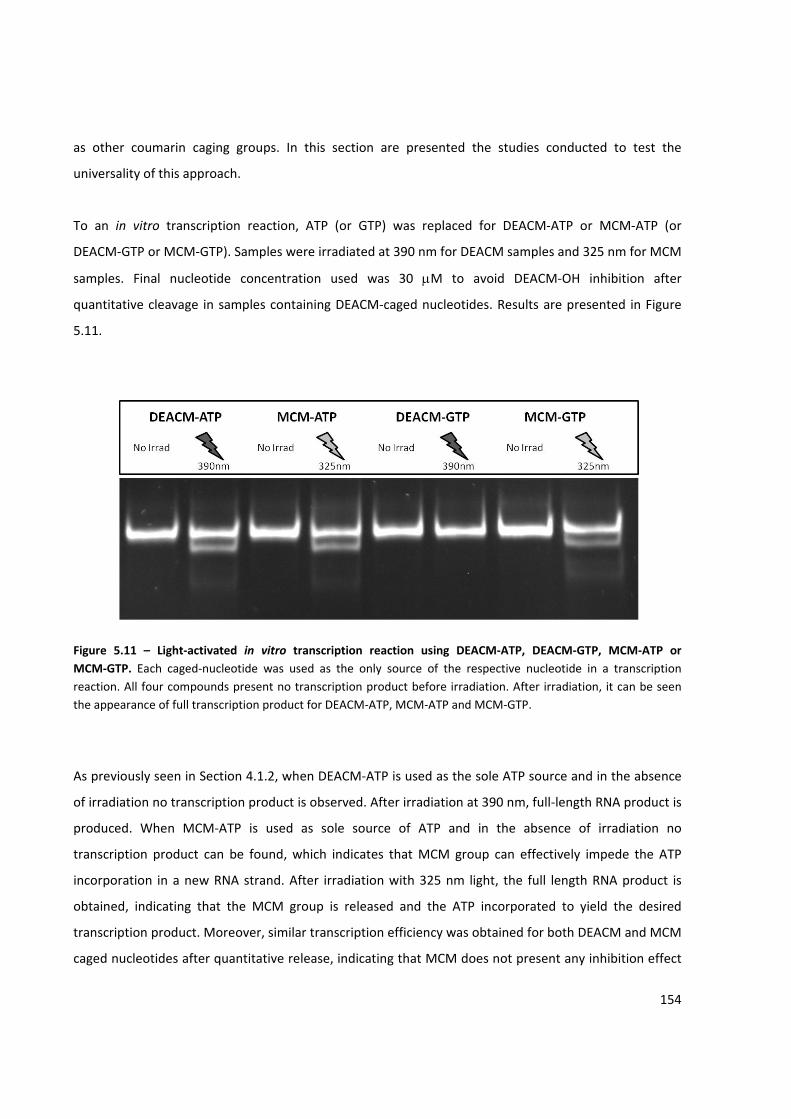
154
as other coumarin caging groups. In this section are presented the studies conducted to test the
universality of this approach.
To an in vitro transcription reaction, ATP (or GTP) was replaced for DEACM‐ATP or MCM‐ATP (or
DEACM‐GTP or MCM‐GTP). Samples were irradiated at 390 nm for DEACM samples and 325 nm for MCM
samples. Final nucleotide concentration used was 30 μM to avoid DEACM‐OH inhibition after
quantitative cleavage in samples containing DEACM‐caged nucleotides. Results are presented in Figure
5.11.
Figure 5.11 – Light‐activated in vitro transcription reaction using DEACM‐ATP, DEACM‐GTP, MCM‐ATP or MCM‐GTP. Each caged‐nucleotide was used as the only source of the respective nucleotide in a transcription reaction. All four compounds present no transcription product before irradiation. After irradiation, it can be seen the appearance of full transcription product for DEACM‐ATP, MCM‐ATP and MCM‐GTP.
As previously seen in Section 4.1.2, when DEACM‐ATP is used as the sole ATP source and in the absence
of irradiation no transcription product is observed. After irradiation at 390 nm, full‐length RNA product is
produced. When MCM‐ATP is used as sole source of ATP and in the absence of irradiation no
transcription product can be found, which indicates that MCM group can effectively impede the ATP
incorporation in a new RNA strand. After irradiation with 325 nm light, the full length RNA product is
obtained, indicating that the MCM group is released and the ATP incorporated to yield the desired
transcription product. Moreover, similar transcription efficiency was obtained for both DEACM and MCM
caged nucleotides after quantitative release, indicating that MCM does not present any inhibition effect
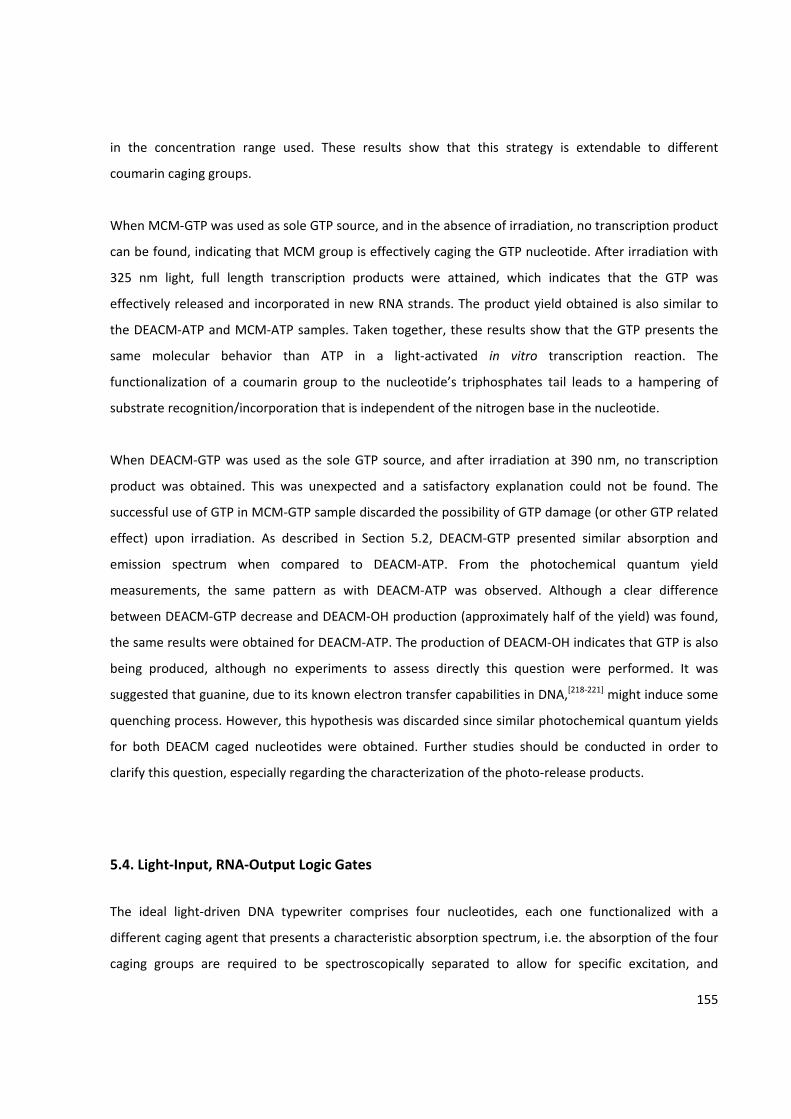
155
in the concentration range used. These results show that this strategy is extendable to different
coumarin caging groups.
When MCM‐GTP was used as sole GTP source, and in the absence of irradiation, no transcription product
can be found, indicating that MCM group is effectively caging the GTP nucleotide. After irradiation with
325 nm light, full length transcription products were attained, which indicates that the GTP was
effectively released and incorporated in new RNA strands. The product yield obtained is also similar to
the DEACM‐ATP and MCM‐ATP samples. Taken together, these results show that the GTP presents the
same molecular behavior than ATP in a light‐activated in vitro transcription reaction. The
functionalization of a coumarin group to the nucleotide’s triphosphates tail leads to a hampering of
substrate recognition/incorporation that is independent of the nitrogen base in the nucleotide.
When DEACM‐GTP was used as the sole GTP source, and after irradiation at 390 nm, no transcription
product was obtained. This was unexpected and a satisfactory explanation could not be found. The
successful use of GTP in MCM‐GTP sample discarded the possibility of GTP damage (or other GTP related
effect) upon irradiation. As described in Section 5.2, DEACM‐GTP presented similar absorption and
emission spectrum when compared to DEACM‐ATP. From the photochemical quantum yield
measurements, the same pattern as with DEACM‐ATP was observed. Although a clear difference
between DEACM‐GTP decrease and DEACM‐OH production (approximately half of the yield) was found,
the same results were obtained for DEACM‐ATP. The production of DEACM‐OH indicates that GTP is also
being produced, although no experiments to assess directly this question were performed. It was
suggested that guanine, due to its known electron transfer capabilities in DNA,[218‐221] might induce some
quenching process. However, this hypothesis was discarded since similar photochemical quantum yields
for both DEACM caged nucleotides were obtained. Further studies should be conducted in order to
clarify this question, especially regarding the characterization of the photo‐release products.
5.4. Light‐Input, RNA‐Output Logic Gates
The ideal light‐driven DNA typewriter comprises four nucleotides, each one functionalized with a
different caging agent that presents a characteristic absorption spectrum, i.e. the absorption of the four
caging groups are required to be spectroscopically separated to allow for specific excitation, and
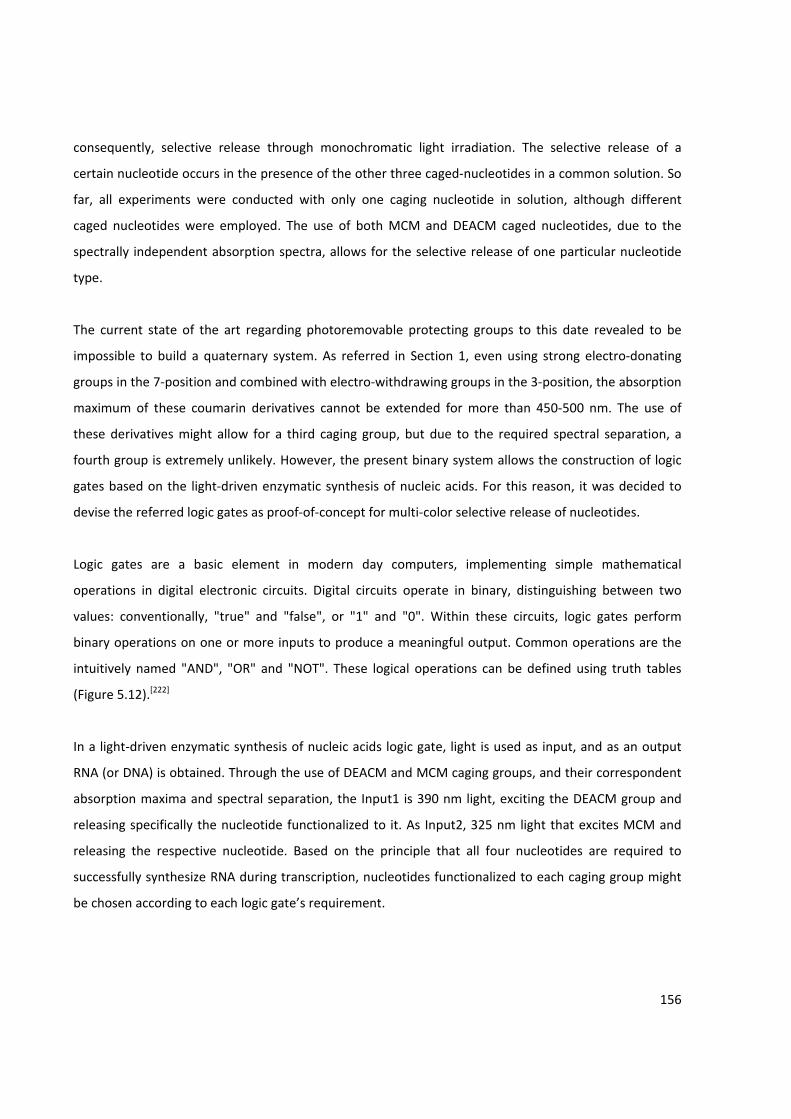
156
consequently, selective release through monochromatic light irradiation. The selective release of a
certain nucleotide occurs in the presence of the other three caged‐nucleotides in a common solution. So
far, all experiments were conducted with only one caging nucleotide in solution, although different
caged nucleotides were employed. The use of both MCM and DEACM caged nucleotides, due to the
spectrally independent absorption spectra, allows for the selective release of one particular nucleotide
type.
The current state of the art regarding photoremovable protecting groups to this date revealed to be
impossible to build a quaternary system. As referred in Section 1, even using strong electro‐donating
groups in the 7‐position and combined with electro‐withdrawing groups in the 3‐position, the absorption
maximum of these coumarin derivatives cannot be extended for more than 450‐500 nm. The use of
these derivatives might allow for a third caging group, but due to the required spectral separation, a
fourth group is extremely unlikely. However, the present binary system allows the construction of logic
gates based on the light‐driven enzymatic synthesis of nucleic acids. For this reason, it was decided to
devise the referred logic gates as proof‐of‐concept for multi‐color selective release of nucleotides.
Logic gates are a basic element in modern day computers, implementing simple mathematical
operations in digital electronic circuits. Digital circuits operate in binary, distinguishing between two
values: conventionally, "true" and "false", or "1" and "0". Within these circuits, logic gates perform
binary operations on one or more inputs to produce a meaningful output. Common operations are the
intuitively named "AND", "OR" and "NOT". These logical operations can be defined using truth tables
(Figure 5.12).[222]
In a light‐driven enzymatic synthesis of nucleic acids logic gate, light is used as input, and as an output
RNA (or DNA) is obtained. Through the use of DEACM and MCM caging groups, and their correspondent
absorption maxima and spectral separation, the Input1 is 390 nm light, exciting the DEACM group and
releasing specifically the nucleotide functionalized to it. As Input2, 325 nm light that excites MCM and
releasing the respective nucleotide. Based on the principle that all four nucleotides are required to
successfully synthesize RNA during transcription, nucleotides functionalized to each caging group might
be chosen according to each logic gate’s requirement.
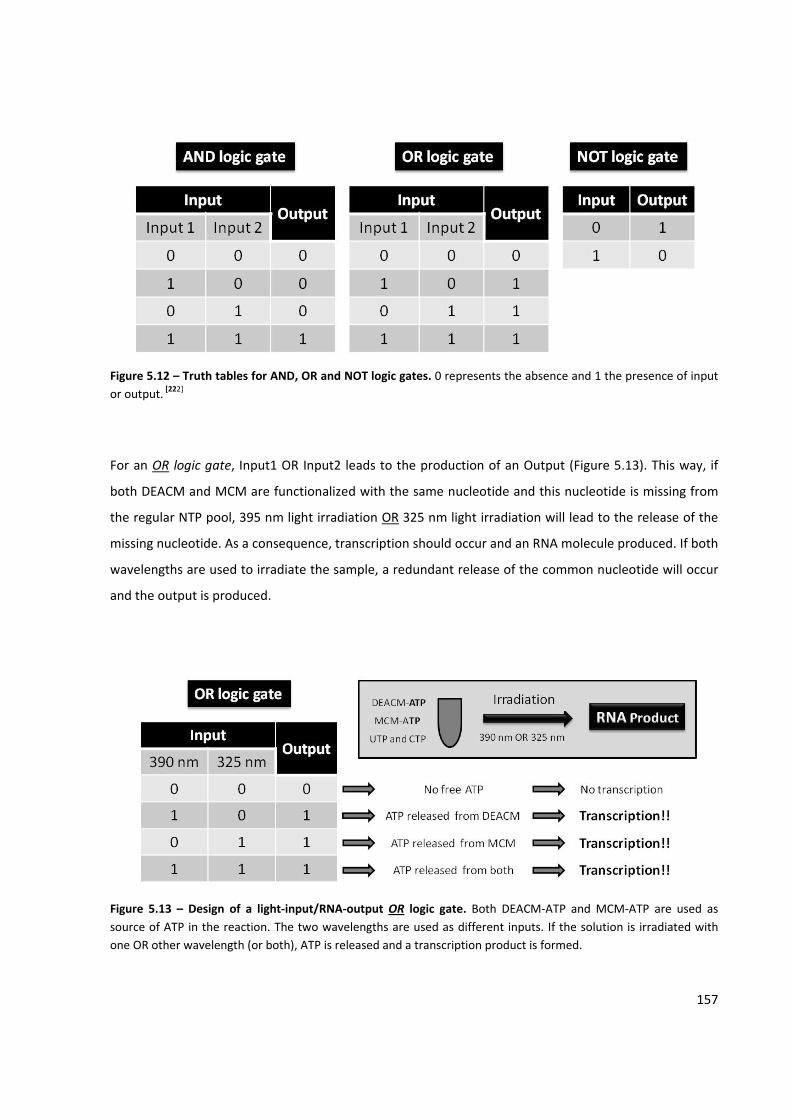
157
Figure 5.12 – Truth tables for AND, OR and NOT logic gates. 0 represents the absence and 1 the presence of input or output. [222]
For an OR logic gate, Input1 OR Input2 leads to the production of an Output (Figure 5.13). This way, if
both DEACM and MCM are functionalized with the same nucleotide and this nucleotide is missing from
the regular NTP pool, 395 nm light irradiation OR 325 nm light irradiation will lead to the release of the
missing nucleotide. As a consequence, transcription should occur and an RNA molecule produced. If both
wavelengths are used to irradiate the sample, a redundant release of the common nucleotide will occur
and the output is produced.
Figure 5.13 – Design of a light‐input/RNA‐output OR logic gate. Both DEACM‐ATP and MCM‐ATP are used as source of ATP in the reaction. The two wavelengths are used as different inputs. If the solution is irradiated with one OR other wavelength (or both), ATP is released and a transcription product is formed.
158
For an AND logic gate, the presence of both Input1 AND Input2 is required for Output (Figure 5.14). This
way, if DEACM and MCM are functionalized with different nucleotides, not present in the regular NTP
pool, only irradiation with 390 AND 325 nm will lead to the presence of the four nucleotides required for
transcription. If only one of the wavelengths is used, one of the free nucleotides will be missing and thus
no product is attained.
Figure 5.14 ‐ Design of a light‐input/RNA‐output AND logic gate. DEACM‐ATP is used as source of ATP and MCM‐GTP as source of GTP in the reaction. The two wavelengths are used as different inputs. Only if the solution is irradiated with both wavelengths, ATP and GTP are released and a transcription product is formed.
A NOT logic gate can be devised taking advantage of the undesirable DEACM‐OH inhibition effect (see
Figure 5.15). For this logic gate, all four free natural nucleotides are present in the nucleotide pool, that
in the absence of irradiation lead to the synthesis of a transcription product. Also, high concentrations of
DEACM‐ATP are added to the solution ([DEACM‐ATP] > 250 μM, see Section 4.1.3), that in the presence
of irradiation with 390 nm light will lead to the release of high amounts of both ATP and DEACM‐OH. The
DEACM‐OH produced in such high concentrations will lead to the inhibition of the T7 RNA Polymerase
that will impede transcription product synthesis.
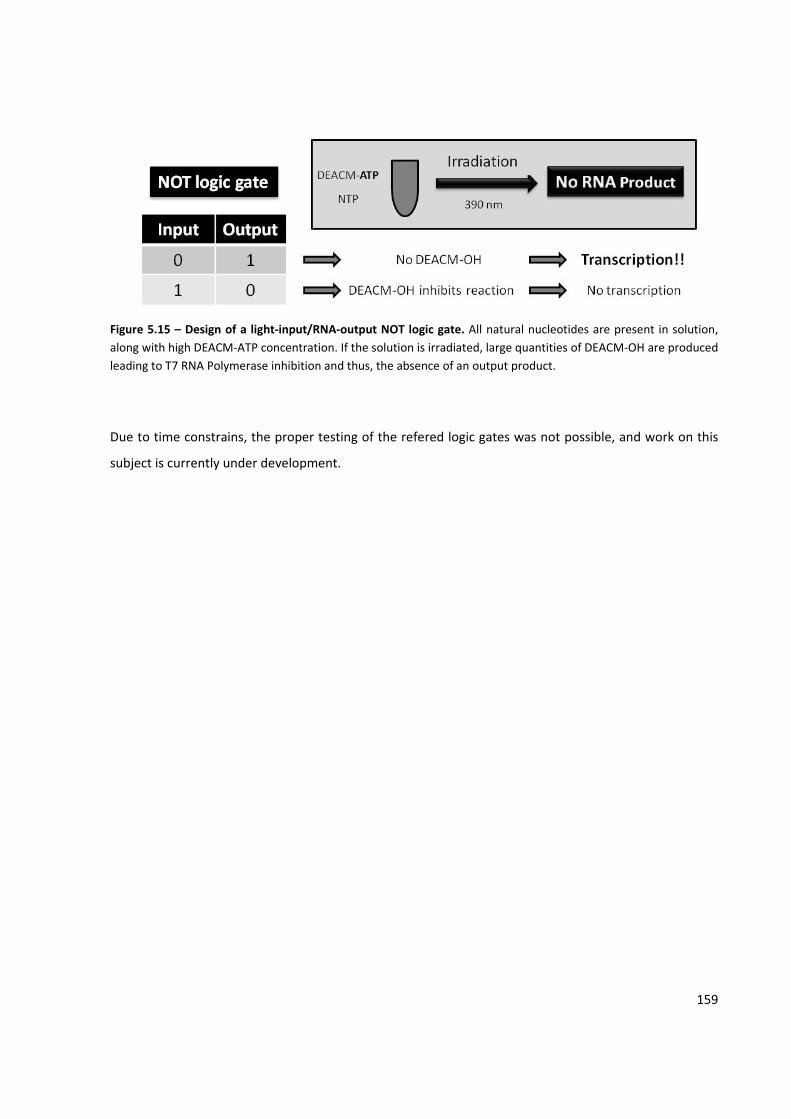
159
Figure 5.15 – Design of a light‐input/RNA‐output NOT logic gate. All natural nucleotides are present in solution, along with high DEACM‐ATP concentration. If the solution is irradiated, large quantities of DEACM‐OH are produced leading to T7 RNA Polymerase inhibition and thus, the absence of an output product.
Due to time constrains, the proper testing of the refered logic gates was not possible, and work on this
subject is currently under development.

160

161
CHAPTER 6. Conclusions and Future Perspectives
162
The aim of the presented work was the design and development of a light‐controlled DNA (or RNA)
typewriter. During the almost five years of research several landmarks were achieved, although many
questions were still left unanswered and new questions arised. The strategy followed is based on the
functionalization of nucleotides with photoremovable protecting groups (caged‐nucleotides) that can
only be incorporated in a growing nucleic acid chain when the protecting group is released. In order to
release a certain nucleotide, each should be functionalized with a protecting group absorbing in a
specific and exclusive wavelength. Thus, irradiating the solution with monochromatic light would release
the desired nucleotide that can be incorporated in the growing strand, in a template‐independent
fashion. The suppression of DNA complementarity can be overcomed by using a particular DNA
polymerase – Terminal deoxynucleotidyl Transferase (TdT), so that a function between the availability of
a certain nucleotide and its incorporation dictates the sequence of the strand being formed and not the
template strand sequence.
Starting with the choice of a suitable caging group, the 4‐methylcoumarin derivatives were thought to be
the best match to fulfill all the requirements. The substituent pattern of the coumarinic core tunes the
absorption of the molecule in the visible region of the spectrum. The 7‐diethylamino‐4‐methylcoumarin
(DEACM) was selected as a model protecting group and a study of the photochemistry of the simplest
DEACM esters – DEACM‐P – was performed as function of pH. It was found that the pH produces
significant changes in the photochemical quantum yield of DEACM‐P. The observed changes are
complementary to those obtained from the fluorescence quantum yield, i.e., Φchem decreases with the
disappearance of the DEACM‐HPO4– species to yield DEACM‐PO4
2– while the fluorescence quantum yield
increases. For DEACM‐P, we show that a 14× overall decrease in photochemistry quantum yield was due
to deprotonation of the phosphate group. Furthermore, time resolved fluorescence and flash photolysis
experiments point to:
i) Hydroxyl concentration affects S1 decay indirectly, possibly through an intermediary
species formed in the first photochemical step;
ii) ii) A long decay time transient was identified whose decay rate depends linearly on the
hydroxyl anion concentration, consistent with the intermediary species;
iii) iii) The intermediary is quenched by hydroxyl anion with a diffusional‐limited rate
constant, and;
iv) iv) The intermediary seems to present a cationic nature.
163
Flash photolysis studies were also performed in an attempt to characterize the intermediary nature in
DEACM photochemistry. The observed transient’s lifetime did not vary with the presence/absence of
molecular oxygen or with increasing concentration, discarding triplet‐triplet transition as transient
absorption’s nature. The recovery at the ground‐state coumarin absortion wavelengths however,
presented a bi‐exponential decay in which one of the components was quenched by oxygen. Also, no
transient at 700 nm corresponding to the solvated electron was observed, ruling out the identification of
the transient absorbing at 500 nm as DEACM radical cation, as proposed by Johnson and co‐
workers.[189,190]
The successful synthesis of a caged‐nucleotide – DEACM‐ATP – was achieved, although the synthesis
process is cumbersome, time consuming and result in low yields. Several attempts to obtain a more
direct synthesis route were pursued, in particular the direct reaction of DEACM‐OH with activated ATP
(data not presented), but no product formation was observed.
The photophysical characterization of DEACM‐ATP indicated, when compared to DEACM‐P, a red‐shift in
absorption, decrease in the 7‐amino protonation pKa, considerable increase in fluorescence quantum
yield and lifetime. These differences were attributed to the presence of a ground‐state interaction
between the coumarin and adenine rings, forming a sandwich conformer. This conformer might impair
the 7‐diethylamino group rotation in the excited state, reducing the possibility of non‐radiative decay
through efficient TICT state. Photochemical DEACM‐ATP characterization revealed that the quantum
yield of DEACM‐ATP cleavage is considerably higher than DEACM‐OH and ATP formation, which cannot
be accounted as experimental error. Moreover, DEACM‐ATP photochemical quantum yield increases
with increasing pH values, and thus OH‐ concentration, as expected from the studies conducted with
DEACM‐P. The DEACM‐OH’s does not. Although no additional coumarin photo‐products were found
during experiments, there is a strong possibility that coumarin‐adenine dimers (produced due to the
presence of a sandwich conformer) could’ve been missed, since dimerization would lead to a strong
blue‐shift in absorption.
The DEACM‐ATP was used as a single source of ATP in a light‐activated in vitro transcription reaction. In
the absence of irradiation the DEACM was proven to efficiently block ATP incorporation by the T7 RNA
Polymerase, and thus only residual product formation was observed. After light irradiation full‐length
specific transcription product was produced. These results taken together shown that light can be used
164
as an ON input signal to nucleic acids synthesis. Synthesis of MCM‐ATP and MCM‐GTP, and their
successful application to light‐activated in vitro transcription reactions, shown that the approach is
extendable to other nucleotides and caging groups. It is proposed that the universality of the proposed
strategy is related with the functionalization of the coumarin molecule in the triphosphate moiety,
producing a double effect on the polymerase:nucleotide recognition as substrate:
i) The presence of an additional ester group alters considerably the prototropic equilibrium of
the triphosphates moiety, essential for magnesium‐assisted catalysis
ii) The presence of a bulky hydrophobic group hampers the correct alignment of the nucleotide
in the hydrophilic polymerase’s active site, decreasing dramatically the protein activity
It was also found that the DEACM‐OH produced after ATP release had an inhibitory effect in T7 RNA
Polymerase activity, for concentrations higher than 25 μM. The exact mechanism is unknown, but no
change in product size was found. Fluorescence studies showed that DEACM‐OH interacts specifically
with the polymerase and not with template DNA, as a 2 nm red‐shift in emission and a 20% decrease in
fluorescence quantum yield were observed in the presence of the polymerase. This indicated that, due
to solvatochromic properties of coumarin derivatives, the DEACM‐OH is in a different molecular
environment than bulk solvent, which taken together with the absence of a irreversible inhibition (due to
the presence of full transcription products and the absence of truncated ones) is consistent with a
partition of the DEACM‐OH to T7 RNA Polymerase’s active site. Moreover, this partition is thought to be
associated to poor DEACM‐OH solubility in water.
In order to overcome the inhibition effect, a supramolecular strategy to sequester the DEACM‐OH
formed upon DEACM‐ATP cleavage was pursued. Two different scavengers were screened for their
ability to form a complex with DEACM‐OH and preventing the nefarious interaction with T7 RNA
Polymerase. The first scavenger ‐ β‐lactoglobulin – showed a significant reduction of activity in a regular
transcription reaction per se, and was thus abandoned. The second scavenger ‐ β‐cyclodextrin –
presented a satisfactory association constant (Ka = 5 × 10³ M‐1) with the DEACM‐OH, forming a 1:1
complex. The association, however, was not specific for the alcohol molecule and a
cyclodextrin/DEACM‐ATP was also obtained (Ka = 9 × 10³ M‐1). The formation of this complex did not
interfere with DEACM‐ATP photochemistry, and the same photochemical quantum yields for both free
and complexed forms were found. When 500 μM of β‐cyclodextrin was added to a light‐activated in vitro
165
transcription reaction, a 50% reduction in inhibitory effect was attained. The strategy proposed has the
advantage of being easily adapted to new caging groups and nucleotides, without requiring cumbersome
and time‐consuming changes in synthesis routes, as proposed by Furuta[71] and Hagen[114].
The next step in the path towards the goal was to overcome a process that Nature has been developing
for millions of years: the complementarity of the DNA double strand, and the template‐driven
polymerization by Polymerases. The solution found was to use a unique category of DNA polymerases
that perform the addition of nucleotides in a template‐independent fashion – Terminal deoxynucleotidyl
Transferase. This polymerase showed a preference for the synthesis of dA and dT homopolymers, rather
than dG and dC, forming longer chains for the former (45 and 40 bases, respectively) than the last (30
bases). Overcoming the issue of the complementarity using TdT raised an additional problem, related to
the incorporation of n, n+1, n+2, … , n+m nucleotides, when a certain nucleotide is released in solution.
The solution found was a statistical/probabilistic approach. The generation of a distribution of strand
sizes depends not only on TdT intrinsic catalytic properties but also on reaction conditions, such as
concentration, initial nucleotide concentration and ratio, temperature and reaction time, etc. Studies are
being conducted to narrow the product distribution size in order to increase the number of bases that
might be incorporated with a satisfactory confidence interval in the final sequence obtained.
TdT also presents the ability to incorporate ribonucleotides, although it is unable to form long
homopolymers. This presented a good opportunity to test the caged‐nucleotides principle with TdT,
since the synthesis of caged‐dNTP was not pursued. When DEACM‐ATP was used as source of ATP,
similar results were obtained when no ATP was present in the control sample, i.e. no nucleotide addition
could be detected. After irradiation, an increase in product size was attained, showing that DEACM is
also effective as a caging agent in polymerization reactions catalyzed with TdT. Additionally, TdT didn’t
show any reduction in activity in the presence of DEACM‐OH, in concentrations up to 150 μM. These
results suggest that a caged‐dNTP will present the same behavior as the DEACM‐ATP, and that light‐
controlled DNA polymerization is just one step away.
After approaching the light‐activation of RNA (and DNA) polymerization, and after discussing the strategy
for the step‐wise addition of nucleotides, the next step was to move from a single caged‐nucleotide to
the selective release of a certain nucleotide in a caged‐nucleotides mixture. For that, a second class of
coumarin derivatives was used – the 7‐methoxy‐4‐methylcoumarins (MCM). A palette of four
166
compounds was successfully synthesized: DEACM‐ATP, DEACM‐GTP, MCM‐ATP and MCM‐GTP. The
spectral separation between the two classes of compounds was near optimal, with DEACM maximum
absorption at 390 nm and MCM at 325 nm. However, the DEACM also presents residual absorption at
325 nm. At this wavelength, the photochemical quantum yield of the DEACM is approximately 1/5 of the
MCM derivatives. This leakage might be minimized with a concentration inbalance between the two
compounds: excess MCM‐caged nucleotides will promote a larger “competition for irradiation light”,
leading to a higher number of MCM molecules cleaved with lower irradiation times. When used in light‐
activated in vitro transcription reactions, both MCM‐caged nucleotides presented similar behavior than
DEACM‐ATP‐activated reactions. This showed that the strategy proposed is universal and can be
extended to both different caging groups and nucleotides. When DEACM‐GTP was used as sole source of
GTP, after irradiation no product could be detected. No clear explanation for this unexpected result was
found and further studies need to be conducted to clarify this issue.
A binary system of selective excitation and consequent release of nucleotides was devised to light‐
input/RNA‐output logic gates. AND, OR and NOT logic gates were constructed based on the release of
ATP and/or GTP, caged by DEACM and/or MCM. Light with different wavelengths is used as input signals,
and the consequent production (or absence) of a transcription product is used as an output. As in
voltage‐gated logic circuits, this system also presents the advantage of overcoming the DEACM leakage
at 325 nm problem – the leakage might lead to residual production of RNA when 325 nm light is
exclusively used in AND logic gates. However, establishing a transcription level threshold to distinguish
between a (1,1) input and a (0,1) (or (1,0)) leads to a clear differentiation between the two output
situations, just as in electronic computing devices. Unfortunately, there was not enough time to perform
the necessary experimental studies on these logic gates during the course of this work.
Regarding the DNA typewriter, the selective release of nucleotides stands, in the state of the art, of a
binary system, although a quaternary system is necessary. As discussed in Section 5.1, through the
functionalization of the coumarinic core with “exotic” electron‐widthrawing groups in the 3‐position, the
absorption spectrum of the coumarin derivative can be shifted further into the red. Nevertheless, if this
might be true for attaining a caged‐nucleotide absorbing in the 450 nm region, it is not likely that a
fourth group might be produced using coumarin derivatives. No additional photoremovable protecting
group absorbing at wavelengths higher than 500 nm was, so far, reported in the literature. A new group
of photolabile protecting groups is therefore necessary.
167
Analyzing the electronic transition, the molecular structure and molecular orbitals involved in coumarin
excitation and photochemistry, some paralelism was found in xantene and flavillium salts. Due to the
knwolege and experience working with flavillium salt compounds in our photochemistry group several
studies were conducted to screen this class of molecules for their possible application as photolabile
protecting groups. As in coumarin derivatives, the substituent pattern of the flavillium core produces
dramatic changes in the molecule’s absorption that spam deep into the visible. The
7‐hydroxy‐4‐methylflavillium was used as model compound to search for a synthesis route to obtain a
4‐hydroxymethyl derivative that could be coupled to a phosphate group and test for photochemistry. A
set of unclear data point out for the successful synthesis of the 7‐hydroxy‐4‐hydroxymethylflavillium salt,
but it could not be efficiently isolated and presented poor water stability. The project of pursuing
flavillium‐based photolabile protecting groups is currently under development by our group.
As a general perspective of the goals achieved, in the past five years many milestones were
accomplished and much was learnt about this exciting field. Clearly there are many obstacles to be
overcome in order to achieve a light‐controlled typewriter. Also, many questions were raised, in
particular the difference between the DEACM‐ATP (or DEACM‐GTP) cleavage quantum yield and
DEACM‐OH formation quantum yield. My major personal concern is, however, the control of the number
of nucleotides that are incorporated upon release. The statistic approach is one answer, but only
thorough experiments will prove if this strategy might be used in such a refined application. Our group is
currently working on this subject as well. The overall path was long, it still is, but it has, and certainly will,
open several doors for new related projects. And at the end, we might have contributed to light the way
on DNA synthesis.

168

169
REFERENCES
170
[1] F. Crick (1970) Central Dogma in Molecular Biology. Nature, 227, 561‐563
[2] H. Lodish, A. Berk, P. Matsudaira, C.A. Kaiser, M. Krieger, M.P. Scott, L. Zipursky, J. Darnel (2003)
Molecular Cell Biology, 5th edition. W. H. Freeman, New York, USA
[3] J.D. Watson, F.H.C. Crick (1953) Molecular Structure of Nucleic Acids. Nature, 4356, 737‐738
[4] B. Lewin (2004) Genes VIII. Pearson Prentice Hall, Upper Saddle River, USA
[5] R.D. Kornberg (2007) The molecular basis of eucaryotic transcription. Cell Death Differ, 14, 1989‐1997
[6] P.H. Patel, M. Suzuki, E. Adman, A. Shinkai, L.A. Loeb (2001) Prokaryotic DNA Polymerase I: Evolution,
Structure, and ``Base Flipping'' Mechanism for Nucleotide Selection. J Mol Biol, 308, 823‐837
[7] A.J. Berdis (2009) Mechanism of DNA polymerases. Chem Rev, 109, 2862‐2879
[8] M.M. Hingorani, M. O'Donnell (2000) DNA Polymerase Structure and Mechanisms of Action. Curr Org
Chem, 4, 887‐913
[9] K.A. Johnson (2010) The kinetic and chemical mechanism of high‐fidelity DNA polymerases.
Biochimica et Biophysica Acta, 1804, 1041‐1048
[10] C.M. Joyce (1997) Choosing the right sugar: How polymerases select a nucleotide substrate. Proc
Natl Acad Sci USA, 94, 1619–1622
[11] U. Hubscher, G. Maga, S. Spadari (2002) Eukatyotic DNA Polymerases. Annu Rev Biochem, 71, 133‐63
[12] S. Ramanathan, K.V.R. Chary, B.J. Rao (2001) Incoming nucleotide binds to Klenow ternary complex
leading to stable physical sequestrion of preceding dNTP on DNA. Nucleic Acids Res, 29, 2097‐2105
[13] S.N. Kochetkov, E.E. Rusakova, V.L. Tunitskaya (1998) Recent studies of T7 RNA polymerase
mechanism. FEBS Lett, 440, 264‐267
171
[14] G.M.T. Cheetham, T.A. Steitz (2000) Insights into transcription: structure and function of
singlesubunit DNA‐dependent RNA polymerases. Curr Opin Struct Biol, 10, 117‐123
[15] L. Bai, T.J. Santangelo, M.D. Wang (2006) Single‐Molecule Analysis of RNA Polymerase Transcription.
Annu Rev Biophys Biomol Struct, 35, 343‐360
[16] A. Gnatt (2002) Elongation by RNA polymerase II: structure–function relationship. Biochimica et
Biophysica Acta, 1577, 175‐190
[17] R. Sousa (1996) Structural and mechanistic relationships between nucleic acid polymerases. Trends
Biochem Sci, 21, 186‐190
[18] D.A. Erie (2002) The many conformational states of RNA polymerase elongation complexes and their
roles in the regulation of transcription. Biochimica et Biophysica Acta, 1577, 224‐239
[19] F. Brueckner, J. Ortiz, P. Crame (2009) A movie of the RNA polymerase nucleotide addition cycle.
Curr Opin Struc Biol, 19, 294‐299
[20] S.N. Kochetkov, E.E. Rusakova, V.L. Tunitskaya (1998) Recent studies of T7 RNA polymerase
mechanism. FEBS Lett, 440, 264‐267
[21] A. Dvir (2002) Promoter escape by RNA polymerase II. Biochimica et Biophysica Acta, 1577, 208‐223
[22] R. Landick (2004) Active‐Site Dynamics in RNA Polymerases. Cell, 116, 351–358
[23] D. Temiakov, V. Patlan, M. Anikin, W.T. McAllister, S. Yokoyama, D.G. Vassylyev (2004) Structural
Basis for Substrate Selection by T7 RNA Polymerase. Cell, 116, 381–391
[24] J.B. Boule, F. Rougeon, C. Papanicolaou (2001) Terminal Deoxynucleotidyl Transferase
Indiscriminately Incorporates Ribonucleotides and Deoxyribonucleotides. J Biol Chem, 276, 31388–31393
172
[25] M. Delarue, J.B. Boule, J. Lescar, N. Expert‐Bezancon, N. Jourdan, N. Sukumar, F. Rougeon, C.
Papanicolaou (2002) Crystal structures of a template independent DNA polymerase: murine terminal
deoxynucleotidyltransferase. EMBO J, 21, 427‐439
[26] F.J. Bollum (1960) Calf thymus polymerase. J Biol Chem, 235, 2399‐2403
[27] D. Baltimore (1974) Is terminal deoxynucleotidyl transferase a somatic mutagen in lymphocytes?.
Nature, 248, 409‐411
[28] S.V. Desiderio, G.D. Yancopoulos, M. Paskind, E. Thomas, M.A. Boss, N. Landau, F.W. Alt, D.
Baltimore (1984) Insertion of N regions into heavy‐chain genes is correlated with expression of terminal
deoxytransferase in B cells. Nature, 311, 752‐755
[29] E.A. Motea, A.J. Berdis (2010) Terminal deoxynucleotidyl transferase: The story of a misguided DNA
polymerase. Biochimica et Biophysica Acta, 1804, 1151‐1166
[30] M.F. Goodman, S. Creighton, L.B. Bloom, J. Petruska (1993) Biochemical Basis of DNA Replication
Fidelity. Crit Rev Biochem Mol, 28, 83‐126
[31] F.J. Calzone, R.J. Britten, E.H. Davioson (1987) Mapping of Gene Transcripts by Nuclease Protection
Assays and cDNA Primer Extension. Method Enzymol, 152, 611‐632
[32] W.R. Boorstein, E.A. Craig (1989) Primer Extension Analysis of RNA. Method Enzymol, 180, 347‐369
[33] S.S. Carroll, S.J. Benkovic (1990) Mechanistic Aspects of DNA Polymerases: Escherichia coli DNA
Polymerase I (Klenow Fragment) as a Paradigm. Chem Rev, 90, 1291‐1307
[34] K. Mullis, F. Faloona (1987) Specific synthesis of DNA in vitro via a polymerase‐catalyzed chain
reaction. Methods in enzymology, 155, 335
[35] M.J. McPherson, P. Quirke, G.R. Taylor (1994) PCR, Volume 1 – A Practical Approach. Oxford
University Press, Oxford, United Kingdom
173
[36] M.J. McPherson, P. Quirke, G.R. Taylor (1995) PCR, Volume 2 – A Practical Approach. Oxford
University Press, Oxford, United Kingdom
[37] W.M. Freeman, S.J. Walker, K.E. Vrana (1999) Quantitative RT‐PCR: Pitfalls and Potential.
BioTechniques, 26, 112‐125
[38] G.R. Mazars, C. Moyret, P. Jeanteur, C.G. Theillet (1991) Direct sequencing by thermal asymmetric
PCR. Nucleic Acids Res, 19, 4783
[39] S. Perrin, G. Gilliland (1990) Site‐specific mutagenesis using asymmetric polymerase chain reaction
and a single mutant primer. Nucleic Acids Res, 18, 7433‐7438
[40] Q. Chou, M. Russell, D.E. Birch, J. Raymond, W. Bloch (1992) Prevention of pre‐PCR mis‐priming and
primer dimerization improves low‐copy‐number amplifications. Nucleic Acids Res, 20, 1717‐1723
[41] D. Kellogg (1994) TAQStart antibody(TM) ‐ Hot start PCR facilitated by a neutralizing monoclonal
antibody directed against TAQ DNA polymerase. Biotechniques, 16, 1134
[42] J.G. Herman, J.R. Graff, S. Myohanen, B.D. Nelkin, S.B. Baylin (1996) Methylation‐specific PCR: A
novel PCR assay for methylation status of CpG islands. Proc Natl Acad Sci USA, 93, 9821‐9826
[43] E. Aurelius, B. Johansson, B. Skoldenberg, A. Staland, M. Forsegren (1991) Rapid diagnosis of herpes
simplex encephalitis by nested polymerase chain reaction assay of cerebrospinal fluid. Lancet, 337, 189‐
192
[44] R.J.M. Berkhout, L.M. Tieben, H.L. Smits, J.N.B. Bavink, B.J. Vermeer, J. Schegget (1995) Nested PCR
Approach for Detection and Typing of Epidermodysplasia Verruciformis‐Associated Human
Papillomavirus Types in Cutaneous Cancers from Renal Transplant Recipients. J Clin Microbiol, 33, 690‐
695
[45] K.J. Livak, T.D. Schmittgen (2001) Analysis of Relative Gene Expression Data Using Real‐Time
Quantitative PCR and the 22DDCT Method. Methods, 25, 402‐408
174
[46] C.A. Heid, J. Stevens, K.J. Livak, P.M. Williams (1996) Real time quantitative PCR. Genome Res, 6,
986‐994
[47] S.A. Bustin (2000) Absolute quantification of mRNA using real‐time reverse transcription polymerase
chain reaction assays. J Mol Endocrinol, 25, 169‐193
[48] N.F. Lue, P.M. Flanagan, R.J. Kelleher, A.M. Edwards, R.D. Kornberg (1991) RNA Polymerase II
transcription in vitro. Method Enzymol, 194, 545‐550
[49] J. Sambrook, D.W. Russell (2001) Molecular cloning: a laboratory manual, 3rd Edition, Cold Spring
Harbor Laboratory Press, New York, USA
[50] http://www.fermentas.com/templates/files/tiny_mce/coa_pdf/coa_ep0111.pdf ‐ T7 RNA Polymerase specs datasheet, product #EP0111, Fermentas, Vilnius, Lithuania. Information and link in August 18th, 2010
[51] J.C. Alwine, D.J. Kemp, G.R. Stark (1977) Method for detection of specific RNAs in agarose gels by
transfer to diazobenzyloxymethyl‐paper and hybridization with DNA probes. Proc Natl Acad Sci USA, 74,
5350‐5354
[52] P.S. Thomas (1983) Hybridization of denatured RNA transferred or dotted to nitrocellulose paper.
Method Enzymol, 100, 255‐266
[53] J. Meinkoth, G. Wahl (1984) Hybridization of nucleic acids immobilized on solid supports. Anal
Biochem, 138, 167‐284
[54] R.I. Amann, W. Ludwig, K.H. Schleifer (1995) Phylogenetic identification and in‐situ detection of
individual microbial‐cells without cultivation. Microbiol Rev, 59, 143‐169
[55] M. Deo, J.Y. Yu, K.H. Chunq, M. Tippens, D.L. Turner (2006) Detection of mammalian microRNA
expression by in situ hybridization with RNA oligonucleotides. Dev Dynam, 235, 2538‐2548
175
[56] L. Kearney (2006) Multiplex‐FISH (M‐FISH): technique, developments and applications. Cytogen
Genome Res, 114, 189‐198
[57] J.M. Levsky, R.H. Singer (2003) Fluorescence in situ hybridization: past, present and future. J Cell Sci,
116, 2833‐2838
[58] M.S. Bartolomei, S. Zemel, S.M. Tilghman (1991) Parental imprinting of the mouse H19 gene.
Nature, 351, 153‐155
[59] G.J.R. Zaman, C.H.M. Versantvoort, J.J.M. Smit, E.W. Eijdems, M. Dehaas, A.J. Smith, H.J.
Broxterman, N.H. Mulder, E.G.E. Devries, F. Baas, P. Borst (1993)Analysis of the expression of MRP, the
gene for a new putative transmembrane drug transporter, in human multidrug resistant lung‐cancer cell‐
lines. Cancer Res, 53, 1747‐1750
[60] A. Vidal‐Puig, M. JimenezLinan, B.B. Lowell, A. Hamann, E. Hu, B. Spiegelman, J.S. Flier, D.E. Moller
(1996) Regulation of PPAR gamma gene expression by nutrition and obesity in rodents. J Clin Invest, 97,
2553‐2561
[61] R.C. Lee, R.L. Feinbaum, V. Ambros (1993) The C. elegans heterchronic gene Lin‐4 encodes small
RNAs with antisense complementary to Lin‐14. Cell, 75, 843‐854
[62] A.J. Hammilton, D.C. Baulcombe (1999) A species of small antisense RNA in posttranscriptional gene
silencing in plants. Science, 216, 950‐952
[63] D.A. Knecht, W.F. Loomis (1987) Antisense RNA inactivation of myosin heavy‐chain gene‐expression
in Dictyostelium discoideum. Science, 236, 1081‐1086
[64] A. Fire, S.Q. Xu, M.K. Montgomery, S.A. Kostas, S.E. Driver, C.C. Mello (1998) Potent and specific
genetic interference by double‐stranded RNA in Caenorhabditis elegans. Nature, 391, 806‐811
[65] G.J. Hannon (2002) RNA interference. Nature, 418, 244‐251
176
[66] R. Vassar, B.D. Bennett, S. Babu‐Khan, S. Kahn, E.A. Mendjaz, P. Denis, D.B. Teplow, S. Ross, P.
Amarante, R. Loeloff, Y. Luo, S. Fisher, L. Fuller, S. Edenson, J. Lile, M.A. Jarosinski, A.L. Biere, E. Curran, T.
Burgess, J.C. Louis, F. Collins, J. Treanor, G. Rogers, M. Citron (1999) beta‐Secretase cleavage of
Alzheimer's amyloid precursor protein by the transmembrane aspartic protease BACE. Science, 286, 735‐
741
[67] G. Mayer, A. Heckel (2006) Biologically Active Molecules with a “Light Switch”. Angew Chem Int Ed,
45, 4900‐4921
[68] T. Furuta, S.S.H. Wang, J.L. Dantzker, T.M. Dore, W.J. Bybee, E.M. Callaway, W. Denk, R.Y. Tsien
(1999) Brominated 7‐hydroxycoumarin‐4‐ylmethyls: Photolabile protecting groups with biologically
useful cross‐sections for two photon photolysis. Proc Natl Acad Sci USA, 96, 1193‐1200
[69] S.R. Adams, R.Y. Tsien (1993) Controlling cell chemistry with caged compounds. Annu Rev Physiol,
55, 755‐784
[70] R. Hoffman, P. Wells, H. Morrison (1971) Further Studies on the Mechanism of Coumarin
Photodimerization ‐ Observation of an Unusual “Heavy Atom” Effect. J Org Chem, 36, 102‐108
[71] T. Furuta, H. Takeuchi, M. Isozaki, Y. Takahashi, M. Kanehara, M. Sugimoto, T. Watanabe, K.
Noguchi, T.M. Dore, T. Kurahashi, M. Iwamura, R.Y. Tsien (2004) Bhc‐cNMPs as either Water‐Soluble or
Membrane‐Permeant Photoreleasable Cyclic Nucleotides for both One‐ and Two‐Photon Excitation.
ChemBioChem, 5, 1119‐1128
[72] G.C.R. Ellis‐Davies (2007) Caged compounds: photorelease technology for control of cellular
chemistry and physiology. Nat Methods, 4, 619‐628
[73] E.M. Callaway, R. Yuste (2002) Stimulating neurons with light. Curr Opin Neurobiol, 12, 587‐592
[74] L.R. Shao, F.E. Dudek (2005) Electrophysiological Evidence Using Focal Flash Photolysis of Caged
Glutamate That CA1 Pyramidal Cells Receive Excitatory Synaptic Input From the Subiculum. J
Neurophysiol, 93, 3007‐3011
177
[75] W. Maier, J.E.T. Corrie, G. Papageorgiou, B. Laube, C. Grewer (2005) Comparative analysis of
inhibitory effects of caged ligands for the NMDA receptor. J Neurosci Methods, 142, 1‐9
[76] M. Canepari, L. Nelson, G. Papageorgiou, J.E.T. Corrie, D. Ogden (2001) Photochemical and
pharmacological evaluation of 7‐nitroindolinyl‐and 4‐methoxy‐7‐nitroindolinyl‐amino acids as novel, fast
caged neurotransmitters. J Neurosci Methods, 112, 29‐42
[77] G. Papageorgiou, D.C. Ogden, A. Barth, J.E.T. Corrie (1999) Photorelease of Carboxylic Acids from 1‐
Acyl‐7‐nitroindolines in Aqueous Solution: Rapid and Efficient Photorelease of L‐Glutamate. J Am Chem
Soc, 121, 6503‐6504
[78] G. Lowe (2003) Flash Photolysis Reveals a Diversity of Ionotropic Glutamate Receptors on the Mitral
Cell Somatodendritic Membrane. J Neurophysiol, 90, 1737‐1746
[79] H.G.A. Breitinger, R. Wieboldt, D. Ramesh, B.K. Carpenter, G.P. Hess (2000) Synthesis and
Characterization of Photolabile Derivatives of Serotonin for Chemical Kinetic Investigations of the
Serotonin 5‐HT3 Receptor. Biochemistry, 39, 5500‐5508
[80] T.H. Lee, K.R. Gee, C. Davidson, E.H. Ellinwood (2002) Direct, real‐time assessment of dopamine
release autoinhibition in the rat caudate‐putamen. Neuroscience, 112, 647‐54
[81] T. Kuner, Y. Li, K.R. Gee, L.F. Bonewald, G.J. Augustine (2008) Photolysis of a caged peptide reveals
rapid action of N‐ethylmaleimide sensitive factor before neurotransmitter release, Proc Natl Acad Sci
USA, 105, 347‐352
[82] M. Desai‐Shah, R.L. Cooper (2009) Different Mechanisms of Ca2+ RegulationThat Influence Synaptic
Transmission: Comparison Between Crayfish and Drosophila Neuromuscular Junctions. Synapse, 63,
1100‐1121
[83] A.P.H. Jong, M. Verhage (2009) Presynaptic signal transduction pathways that modulate synaptic
transmission. Curr Opin Neurobiol, 19, 245‐253

178
[84] F.J. Urbano, M.R. Pagani, O.D. Uchitel (2008) Calcium channels, neuromuscular synaptic
transmission and neurological diseases. J Neuroimmunol, 201‐202, 136‐144
[85] E. Neher, T. Sakaba (2008) Multiple Roles of Calcium Ions in the Regulation of Neurotransmitter
Release. Neuron, 59, 861‐872
[86] X. Cao, Y. Chen (2009) Mitochondria and calcium signaling in embryonic development. Seminars in
Cell & Developmental Biology, 20, 337‐345
[87] S.R. Adams, J.P.Y. Kao, G. Grynkiewicz, A. Minta, R.Y. Tsien (1988) Biologically useful chelators that
release Ca2+ upon illumination. J Am Chem Soc, 110, 3212‐3220
[88] S.R. Adams, V. Lev‐Ram, R.Y. Tsien (1997) A new caged Ca2+, azid‐1, is far more photosensitive than
nitrobenzyl‐based chelators. Chem Biol, 4, 867‐878
[89] G.C.R. Ellis‐Davies, J.H. Kaplan (1988) A new class of photolabile chelators for the rapid release of
divalent cations: generation of Ca and caged Mg. J Org Chem, 53, 1966‐1969
[90] G.C.R. Ellis‐Davies, J.H. Kaplan (1994) EGTA photolabile chelator that selectively binds Ca2+ with high
affinity and releases it rapidly upon photolysis. Proc Natl Acad Sci USA, 91, 187‐191
[91] Y.O. Matsuyama, Y. Tatsu (2008) Photocontrolled Cell Adhesion on a Surface Functionalized with a
Caged Arginine‐Glycine‐Aspartate Peptide. Angew Chem Int Ed, 47, 7527‐7529
[92] T. Kuner, Y. Li, K.R. Gee, L.F. Bonewald, G.J. Augustine (2008) Photolysis of a caged peptide reveals
rapid action of N‐ethylmaleimide sensitive factor before neurotransmitter release. Proc Natl Acad Sci
USA, 105, 347‐352
[93] S. Bourgault, M. Letourneau, A. Fournier (2007) Development of photolabile caged analogs of
endothelin‐1. Peptides, 28, 1074‐1082
179
[94] N.Wu, A. Deiters, T. A. Cropp, D. King, P. G. Schultz (2004) A Genetically Encoded Photocaged Amino
Acid. J Am Chem Soc, 126, 14306‐14307
[95] L.Wang, P. G. Schultz (2005) Expanding the Genetic code. Angew Chem Int Ed, 44, 34‐66
[96] M. Endo, K. Nakayama, Y. Kaida, T. Majima (2004) Design and synthesis of photochemically
controllable caspase‐3. Angew Chem Int Ed, 43, 5643‐5645
[97] W. T. Monroe, M. M. McQuain, M. S. Chang, J. S. Alexander, F. R. Haselton (1999) Targeting
Expression with Light Using Caged DNA. J Biol Chem, 274, 20895‐20900
[98] H. Ando, T. Furuta, R. Y. Tsien, H. Okamoto (2001) Photo‐mediated gene activation using caged
RNA/DNA in zebrafish embryos. Nat Genet, 28, 317‐325
[99] S. Shah, S. Rangarajan, S. H. Friedman (2005) Light‐Activated RNA Interference. Angew Chem Int Ed,
44, 1328‐1332
[100] V. Mikat, A. Heckel (2007) Light‐dependent RNA interference with nucleobase‐caged siRNAs. RNA,
13, 2341‐2347
[101] S.G. Chaulk, A.M. MacMillan (1998) Caged RNA: photo‐control of a ribozyme reaction. Nucleic Acids
Res, 26, 3173‐3178
[102] H. Lusic, D.D. Young, M.O. Lively, A. Deiters (2007) Photochemical DNA Activation. Org Lett, 9,
1903‐1906
[103] X. Tang, J. Swaminathan, A.M. Gewirtz, I.J. Dmochowski (2008) Regulating gene expression in
human leukemia cells using light‐activated oligodeoxynucleotides. Nucleic Acids Res, 36, 559‐569
[104] X. Tang, S. Maegawa, E.S. Weinberg, I.J. Dmochowski (2007) Regulating Gene Expression in
Zebrafish Embryos Using Light‐Activated, Negatively Charged Peptide Nucleic Acids. J Am Chem Soc, 129,
11000‐11001
180
[105] L. Krock, A. Heckel (2005) Photoinduced Transcription by Using Temporarily Mismatched Caged
Oligonucleotides, Angew Chem Int Ed, 44, 471‐473
[106] X. Tang, J.L. Richards, A.E. Peritz, I.J. Dmochowski (2005) Photoregulation of DNA polymerase I
(Klenow) with caged fluorescent oligodeoxynucleotides. Bioorg Med Chem Lett, 15, 5303‐5306
[107] K. Tanaka, H. Katada, N. Shigi, A. Kuzuya, M. Komiyama (2008) Site‐Selective Blocking of PCR by a
Caged Nucleotide Leading to Direct Creation of Desired Sticky Ends in The Products. ChemBioChem, 9,
2120‐2126
[108] S. Munck, P. Bedner, T. Bottaro, H. Harz (2004) Spatiotemporal properties of cytoplasmic cyclic
AMP gradients can alter the turning behaviour of neuronal growth cones. Eur J Neurisci, 19, 791‐797
[109] H. Yoshimura, N. Kato (2000) Diverse roles of intracellular cAMP in early synaptic modifications in
the rat visual cortex. J Physiol, 522, 417‐426
[110] J. Pollock, J. H. Crawford, J. F. Wootton, J. E. T. Corrie, R. H. Scott (2003) A comparison between the
distinct inward currents activated in rat cultured dorsal root ganglion neurones by intracellular flash
photolysis of two forms of caged cyclic guanosine monophosphates. Neurosci Lett, 338, 143‐146
[111] H. Takeuchi, T. Kurahashi (2003) Identification of Second Messenger Mediating Signal Transduction
in the Olfactory Receptor Cell. J Gen Physiol, 122, 557‐567
[112] V. Hagen, J. Bendig, S. Frings, T. Eckardt, S. Helm, D. Reuter, U.B. Kaupp (2001) Highly Efficient and
Ultrafast Phototriggers for cAMP and cGMP by Using Long‐Wavelength UV/Vis‐Activation. Angew Chem
Int Ed, 40, 1046‐1048
[113] V. Hagen, S. Frings, B. Wiesner, S. Helm, U.B. Kaupp, J. Bendig (2003) [7‐(Dialkylamino)coumarin‐4‐
yl]methyl‐Caged Compounds as Ultrafast and Effective Long‐Wavelength Phototriggers of 8‐Bromo‐
Substituted Cyclic Nucleotides. ChemBioChem, 4, 434‐442
181
[114] V. Hagen, B. Dekowski, V. Nache, R. Schmidt, D. Geissler, D. Lorenz, J. Eichhorst, S. Keller, H.
Kaneko, K. Benndorf, B. Wiesner (2005) Coumarinylmethyl Esters for Ultrafast Release of High
Concentrations of Cyclic Nucleotides upon One‐ and Two‐Photon Photolysis. Angew Chem Int Ed, 44,
7887‐7891
[115] R.O. Schonleber, J. Bendig, V. Hagen, B. Giese (2002) Rapid Photolytic Release of Cytidine 5’‐
Diphosphate from a Coumarin Derivative: a New Tool for the Investigation of Ribonucleotide Reductases.
Bioorg Med Chem, 10, 97‐101
[116] D. Geissler, W. Kresse, B. Wiesner, J. Bendig, H. Kettenmann, V. Hagen (2003) DMACM‐Caged
Adenosine Nucleotides: Ultrafast Phototriggers for ATP, ADP, and AMP Activated byLong‐W avelength
Irradiation. ChemBioChem, 4, 162‐170
[116] T.S. Seo, X. Bai, D.H. Kim, Q. Meng, S. Shi, H. Ruparel, Z. Li, N.J. Turro, J. Ju (2005) Four‐color DNA
sequencing by synthesis on a chip using photocleavable fluorescent nucleotides, Proc Natl Acad Sci USA,
102, 5926‐5931
[117] Q. Meng, D.H. Kim, X. Bai, L. Bi, N.J. Turro, J. Ju (2006) Design and Synthesis of a Photocleavable
Fluorescent Nucleotide 3¢‐O‐Allyl‐dGTP‐PC‐Bodipy‐FL‐510 as a Reversible Terminator for DNA
Sequencing by Synthesis. J Org Chem, 71, 3248‐3252
[118] Z. Li, X. Bai, H. Ruparel, S. Kim, N.J. Turro, J. Ju (2003) A photocleavable fluorescent nucleotide for
DNA sequencing and analysis. Proc Natl Acad Sci USA, 100, 414‐419
[119] T.S. Seo, X. Bai, H. Ruparel, Z. Li, N.J. Turro, J. Ju (2004) Photocleavable fluorescent nucleotides for
DNA sequencing on a chip constructed by site‐specific coupling chemistry. Proc Natl Acad Sci USA, 101,
5488‐5493
[120] X. Bai, Z. Li, S. Jockusch, N.J. Turro, J. Ju (2003) Photocleavage of a 2‐nitrobenzyl linker bridging a
fluorophore to the 5’ end of DNA. Proc Natl Acad Sci USA, 100, 409‐413
182
[121] J. Guo, L. Yu, N.J. Turro, J. Ju (2010) An Integrated System for DNA Sequencing by Synthesis Using
Novel Nucleotide Analogues. Accounts Chem Res, 43, 551‐563
[122] W.H. Li (2006) Crafting new cages. Nat. Methods, 3, 13‐15
[123] H.M. Lee, D.R. Larson, D.S. Lawrence (2009) Illuminating the Chemistry of Life: Design, Synthesis,
and Applications of “Caged” and Related Photoresponsive Compounds. ACS Chem Biol, 6, 409‐427
[124] A.P. Pelliccioli, J. Wirz (2002) Photoremovable protecting groups: reaction mechanisms and
applications. Photochem Photobiol Sci, 1, 441–458
[125] J.W. Walker, G.P. Reid, J.A. McCray, D.R. Trentham (1988) Photolabile 1‐(2‐nitrophenyl)ethyl
phosphate esters of adenine nucleotide analogues: Synthesis and mechanism of photolysis. J Am Chem
Soc, 110, 7170‐7177
[126] M.E. Riveiro, N.D. Kimpe, A. Moglioni, R. Vazquez, F. Monczor, C. Shavo, C. Davio (2010)
Coumarins: Old Compounds with Novel Promising Therapeutic Perspectives. Curr Med Chem, 17, 1325‐
1338
[127] M.A. Musa, J.S. Cooperwood, M.O.F. Khan (2008) A Review of Coumarin Derivatives in
Pharmacotherapy of Breast Cancer. Curr Med Chem, 15, 2664‐2679
[128] M. Curini, G. Cravotto, F. Epifano, G. Giannone (2006) Chemistry and biological activity of natural
and synthetic prenyloxycoumarins. Curr Med Chem, 13, 199‐222
[129] D. Voora, H.L. McLeod, C. Eby, B.F. Gage (2005) The pharmacogenetics of coumarin therapy.
Pharmacogenomics, 6, 503‐513
[130] L. Wu, X. Wang, W. Xu, F. Farzaneh, R. Xu (2009) The Structure and Pharmacological Functions of
Coumarins and Their Derivatives. Curr Med Chem, 16, 4236‐4260
[131] R. D. H. Murray (1989) Coumarins. Natural Products Reports, 6, 477‐505
183
[132] A. Lacy, R. O’Kennedy (2004) Studies on Coumarins and Coumarin‐Related Compounds to
Determine their Therapeutic Role in the Treatment of Cancer. Curr Pharm Design, 10, 3797‐3811
[133] K.C. Fylaktakidoua, D.J. Hadjipavlou‐Litinab, K.E. Litinasc, D.N. Nicolaides (2004) Natural and
Synthetic Coumarin Derivatives with Anti‐Inflammatory/Antioxidant Activities. Curr Pharm Design, 10,
3813‐3833
[134] A.Z. Suzuki, T. Watanabe, M. Kawamoto, K. Nishiyama, H. Yamashita, M. Ishii, M. Iwamura, T.
Furuta (2003) Coumarin‐4‐ylmethoxycarbonyls as Phototriggers for Alcohols and Phenols. Org Lett, 5,
4867‐4870
[135] F. Kilic, N.D. Kashikar, R. Schmidt, L. Alvarez, L. Dai, I. Weyand, B. Wiesner, N. Goodwin, V. Hagen,
U.B. Kaupp (2009) Caged Progesterone: A New Tool for Studying Rapid Nongenomic Actions of
Progesterone. J Am Chem Soc, 131, 4027‐4030
[136] W. Lin, D.S. Lawrence (2002) A Strategy for the Construction of Caged Diols Using a Photolabile
Protecting Group. J Org Chem, 67, 2723‐2726
[137] M. Lu, O.D. Fedoryak, B.R. Moister, T.M. Dore (2003) Bhc‐diol as a Photolabile Protecting Group for
Aldehydes and Ketones. Org Lett, 5, 2119‐2122
[138] K. K. Rohatgi‐Mukherjee (1986) Fundamentals of Photochemistry, Revised Edition. Wiley Eastern
Limited, New Deli, India
[139] A. Gilbert, J. Baggott (1991) Essentials of Molecular Photochemistry. Blackwell Scientific
Publications, Oxford, United Kingdom
[140] X. Yu, D. Scheller, O. Rademacher, T. Wolff (2003) Selectivity in the Photodimerization of 6‐
Alkylcoumarins. J Org Chem, 68, 7386‐7399
[141] R. Ainet (1962) The Photodimers of coumarin and related compounds. Canadian Journal of
Chemistry, 40, 1249‐1257
184
[142] G. Hammondch, A.A. Stout, A.A. Lamo (1964) Mechanisms of Photochemical Reactions in Solution.
XXV: The Photodimerization of Coumarin. J Am Chem Soc, 86, 3103‐3106
[143] H. Morrison, H. Curtis, T. McDowell (1966) Solvent Effects on the Photodimerization of Coumarin. J
Am Chem Soc, 88, 5415‐5419
[144] V. Ramamurthy, K.S. Schanze (2005) Molecular and Supramolecular Chemistry – Optical Sensors
and Switches, Volume 7. Marcel Dekker, Inc., New York, USA
[145] J. S. Seixas de Melo, R. S. Becker, A. L. Maçanita (1994) Photophysical Behavior of Coumarins as a
Function of Substitution and Solvent: Experimental Evidence for the Existence of a Lowest Lying 1(n,π*)
State. J Phys Chem, 98, 6054‐6058
[146] A. Barik, S. Nath, H. Pal (2003) Effect of solvent polarity on the photophysical properties of
coumarin‐1 dye. J Chem Phys, 119, 10202‐10208
[147] J. Seixas de Melo, R.S. Becker, F. Elisei, A.L. Maçanita (1997) The photophysical behavior of 3‐
chloro‐7‐methoxy‐4‐methylcoumarin related to the energy separation of the two lowest‐lying singlet
excited states. J Chem Phys, 107, 6062‐6069
[148] S. Nad, H. Pal (2001) Unusual Photophysical Properties of Coumarin‐151. J Phys Chem A, 105, 1097‐
1106
[149] H. Pal, S. Nad, M. Kumbhakar (2003) Photophysical properties of coumarin‐120: Unusual behavior
in nonpolar solvents. J Chem Phys, 119, 443‐452
[150] C. Reichardt, K. Dimroth (1968) Fortschr Chemischen Forschung, Bd 11/1
[151] C. Reichardt (1988) Solvents and Solvent Effects in Organic Chemistry, 2nd Edition. VCH, Weinheim,
Germany
185
[152] M.L. Horng, J.A. Gardecki, A. Papazyan, M. Maroncelli (1995) Subpicosecond Measurements of
Polar Solvation Dynamics: Coumarin 153 Revisited. J Phys Chem, 99, 17311‐17337
[153] R.S. Moog, W.W. Davis, S.G. Ostrowski, G.L. Wilson (1999) Solvent effects on electronic transitions
in several coumarins. Chem Phys Lett, 299, 265‐271
[154] N. Mataga, Y. Kaifu, M. Koizumi (1956) Solvent Effects upon Fluorescence Spectra and the Dipole
Moments of Excited Molecules. B Chem Soc Jpn 29, 465‐470
[155] G. Jones II, W.R. Jackson, C. Choi (1985) Solvent Effects on Emission Yield and Lifetime for
Coumarin Laser Dyes: Requirements for a Rotatory Decay Mechanism. J Phys Chem, 89, 294‐300
[156] P. Dahiya, M. Kumbhakar, T. Mukherjee, H. Pal (2005) Effect of protic solvents on twisted
intramolecular charge transfer state formation in coumarin‐152 and coumarin‐481 dyes. Chem Phys Lett,
414, 148‐154
[157] A. Barik, M. Kumbhakar, S. Nath, H. Pal (2005) Evidence for the TICT mediated non‐radiative
deexcitation process for the excited coumarin‐1 dye in high polarity protic solvents. Chem Phys, 315,
277‐285
[158] K. Das, B. Jain, H. S. Patel (2006) Hydrogen Bonding Properties of Coumarin 151, 500, and 35: The
Effect of Substitution at the 7‐Amino Position. J Phys Chem A, 110, 1698‐1704
[159] T.L. Arbeloa, F.L. Arbeloa, M.J. Tapia, I.L. Arbeloa (1993) Hydrogen‐Bonding Effect on the
Photophysical Properties of 7‐ Aminocoumarin Derivatives. J Phys Chem, 97, 4704‐4707
[160] T. Gustavsson, L. Cassara, V. Gulbinas, G. Gurzadyan, J.C. Mialocq, S. Pommeret,
M. Sorgius, P. van der Meulen (1998) Femtosecond Spectroscopic Study of Relaxation Processes of Three
Amino‐Substituted Coumarin Dyes in Methanol and Dimethyl Sulfoxide. J Phys Chem A, 102, 4229‐4245
186
[161] G. Ciamician, P. Silber (1902) Chemische Lichtwirkungen. Berichte der deutschen chemischen
Gesellschaft, 35, 4229
[162] Z. Guo, T. Jiao, M. Liu (2007) Effect of Substituent Position in Coumarin Derivatives on the
Interfacial Assembly: Reversible Photodimerization and Supramolecular Chirality. Langmuir, 23, 1824‐
1829
[163] K. Mori, O. Murai, S. Hashimoto, Y. Nakamura (1996) Highly Regio‐ and Stereoselective
Photocycloaddition between Coumarin and Thymine by Molecular Recognition. Tetrahedron Lett, 37,
8523‐8526
[164] S.C. Shim, S.C. Chae (1979) Photochem. Photobiol., 30, 349
[165] D. Kanne, K. Straub, J.E. Hearst, H. Rapoport (1982) Isolation and Characterization of Pyrimidine‐
Psoralen‐Pyrimidine Photodiadducts from DNA. J Am Chem Soc, 104, 6754‐6764
[166] T. Furuta, H. Torigai, M. Sugimoto, M. Iwamura (1995) Photochemical Properties of New
Photolabile CAMP Derivatives in a Physiological Saline Solution. J Org Chem, 60, 3953‐3956
[167] B. Schade, V. Hagen, R. Schmidt, R. Herbrich, E. Krause, T. Eckardt, J. Bendig (1999) Deactivation
Behavior and Excited‐State Properties of (Coumarin‐4‐yl)methyl Derivatives. 1. Photocleavage of (7‐
Methoxycoumarin‐4‐yl)methyl‐Caged Acids with Fluorescence Enhancement. J Org Chem, 64, 9109‐9117
[168] R.S. Givens, B. Matuszewski (1984) Photochemistry of phosphate esters: an efficient method for
the generation of electrophiles. J Am Chem Soc, 106, 6860‐6861
[169] J. Bendig, S. Helm, V. Hagen (1997) (Coumarin‐4‐yl)methyl Ester of cGMP and 8‐Br‐cGMP:
Photochemical Fluorescence Enhancement. J Fluoresc, 7, 357‐361
187
[170] T. Eckardt, V. Hagen, B. Schade, R. Schmidt, C. Schweitzer, J. Bendig (2002) Deactivation Behavior
and Excited‐State Properties of (Coumarin‐4‐yl)methyl Derivatives. 2. Photocleavage of Selected
(Coumarin‐4‐yl)methyl‐Caged Adenosine Cyclic 3’,5’‐Monophosphates with Fluorescence Enhancement.
J Org Chem, 67, 703‐710
[171] R. Schmidt, D. Geissler, V. Hagen, J. Bendig (2005) Kinetics Study of the Photocleavage of
(Coumarin‐4‐yl)methyl Esters. J Phys Chem A, 109, 5000‐5004
[172] R. Schmidt, D. Geissler, V. Hagen, J. Bendig (2007) Mechanism of Photocleavage of (Coumarin‐4‐
yl)methyl Esters. J Phys Chem A, 111, 5768‐5774
[173] N. Kotzur, B. Briand, M. Beyermann, V. Hagen (2009) Wavelength‐Selective Photoactivatable
Protecting Groups for Thiols. J Am Chem Soc, 2009, 131, 16927‐16931
[174] H. Du, R.A. Fuh, J. Li, A. Corkan, J.S. Lindsey (1998) PhotochemCAD: A Computer‐Aided Design and
Research Tool in Photochemistry. Photochem Photobiol, 68, 141‐142
[175] M. Montalti, A. Credi, L. Prodi, M.T. Gandolfi (2006) Handbook of Photochemistry, 3rd Edition, CRC
Press, Taylor and Francis Group, Boca Raton, FL, USA
[176] J. Pina, J. Seixas de Melo, H.D. Burrows, A.L. Maçanita, F. Galbrecht, T. Bunnagel, U. Scherf (2009)
Alternating Binaphthyl−Thiophene Copolymers: Synthesis, Spectroscopy, and Photophysics and Their
Relevance to the Question of Energy Migration versus Conformational Relaxation. Macromolecules, 42,
1710‐1719
[177] G. Striker (1982) Effective Implementation of Modulation Functions in Deconvolution and
Reconvolution of Analytical Signals, edited by M. Bouchy. University Press, Nancy, France
[178] G. Striker, V. Subramaniam, C.A. Seidel, A. Volkmer, (1999) Photochromicity and Fluorescence
Lifetimes of Green Fluorescent Protein. J Phys Chem B, 103, 8612
188
[179] J. Bourson, J. Pouget, B. Valeur (1993) Ion‐responsive fluorescent compounds. 4. Effect of cation
binding on the photophysical properties of a coumarin linked to monoaza‐ and diaza‐crown ethers. J
Phys Chem, 97, 4552‐4557
[180]
http://www.sigmaaldrich.com/catalog/ProductDetail.do?lang=en&N4=A26209|ALDRICH&N5=SEARCH_C
ONCAT_PNO|BRAND_KEY&F=SPEC ‐ Adenosine 5’‐triphosphate disodium salt hydrate, Aldrich, 99%, 1g,
22.10€;
http://www.sigmaaldrich.com/catalog/ProductDetail.do?lang=en&N4=D6500|SIGMA&N5=SEARCH_CON
CAT_PNO|BRAND_KEY&F=SPEC ‐ 2’‐Deoxyadenosine 5’‐triphosphate disodium salt, Sigma, 97%, 100 mg,
246.60€. Sigma Aldrich website, prices and information available in February 17th, 2010
[181] W. D. Kumler, J. J. Eiler (1943) The Acid Strength of Mono and Diesters of Phosphoric Acid. The n‐
Alkyl Esters from Methyl to Butyl, the Esters of Biological Importance, and the Natural Guanidine
Phosphoric Acids. J Am Chem Soc, 65, 2355‐2361
[182] D.O. Hummel (2002) Atlas of Plastics Additives: Analysis by Spectrometric Methods. Springer,
Berlin, Germany
[183] P.W. Atkins (1990) Physical Chemistry, 4th Edition. Oxford University Press, Oxford, United Kingdom,
page 848, equation 7
[184] R.D. Lide (1991) CRC Handbook of Chemistry and Physics, 72nd Edition, CRC Press, Inc., Boca Raton,
USA
[185] R. Billing, D. Rehorek, H. Hennig (1990) Photoinduced Electron Transfer in Ion Pairs, in J. Mattay,
Photoinduced Electron Transfer II, Topics of Current Chemistry, Vol 158, Springer‐Verlag, Berlin
Heidelberg, Germany
[186] K. Rechthaler, G. Kohler (1994) Excited state properties and deactivation pathways of 7‐
aminocoumarins. Chem Phys, 189, 99‐116
189
[187] M. Yamaji, K. Nozaki, X. Allonas, S. Nakajima, S. Tero‐Kubota, B. Marciniak (2009) Photoinduced
Bond Dissociation of 4‐Methylcoumarin Derivatives in Solution Studied by Laser Flash Photolysis and DFT
Calculations. J Phys Chem A, 113, 5815‐5822
[188] V.O. Stern, M. Volmer (1919) On the quenching‐time of fluorescence. Physik Zeitschr, 20, 183‐188
[189] P.D. Wood, L.J. Johnston (1998) Photoionization and Photosensitized Electron‐Transfer Reactions
of Psoralens and Coumarins. J Phys Chem A, 102, 5585‐5591
[190] L. Chen, P.D. Wood, A. Mnyusiwalla, J. Marlinga, L.J. Johnston (2001) Electron‐Transfer Reactions in
Micelles: Dynamics of Psoralen and Coumarin Radical Cations. J Phys Chem B, 105, 10927‐10935
[191] H.K. Kang, E.J. Shin, S.C. Shim (1992) Transient absorption spectra and quenching of coumarin
excited states by nucleic acid bases. J Photochem Photobiol B, 13, 19
[192] E.J. Land, T.G. Truscott (1979) Triplet excited state of coumarin and 4’5’ dihydropsolaren: reaction
with nucleic bases and aminoacids. Photochem Photobiol, 29, 861
[193] P. Crozet (1974) Triplet‐triplet absorption of coumarin and 7‐hydroxycoumarin. Chem Phys Lett, 25,
114
[194] B.R. Henry, E.A. Lawler (1973) Substituent effects on the triplet‐triplet absorption spectra of
coumarin and its derivatives. J Mol Spectrosc, 48, 117
[195] J. C. Wang (1996) DNA Topoisomerases. Annu Rev Biochem, 65, 635‐692
[196] R.J. Lewis, F.T.F. Tsai, D.B. Wigley (1996) Molecular mechanisms of durg inhibition of DNA gyrase.
BioEssays, 18, 661‐671
190
[197] F.T.F. Tsai, O.M.P. Singh, T. Skarzynski, A.J. Wonacott, S. Weston, A. Tucker, R.A. Pauptit, A.L.
Breeze, J.P. Poyser, R. O’Brien, J.E. Ladbury, D.B. Wigley (1997) The High‐Resolution Crystal Structure of a
24‐kDa Gyrase B Fragment From E. coli Complexed With One of the Most Potent Coumarin Inhibitors,
Clorobiocin. Proteins, 28, 41‐52
[198] U. Galm, M.A. Dessoy, J. Schmidt, L.A. Wessjohann, L. Heide (2004) In Vitro and In Vivo Production
of New Aminocoumarins by a Combined Biochemical, Genetic, and Synthetic Approach. Chem Biol, 11,
173‐183
[199] D. Lafitte, V. Lamour, P.O. Tsvetkov, A.A. Makarov, M. Klich, P. Deprez, D. Moras, C. Briand, R. Gilli
(2002) DNA Gyrase Interaction with Coumarin‐Based Inhibitors: The Role of the Hydroxybenzoate
Isopentenyl Moiety and the 5’‐Methyl Group of the Noviose. Biochemistry, 41, 7217‐7223
[200] A. Maxwell (1997) DNA gyrase as a drug target. Trends Microbiol, 5, 102‐109
[201] G. Kontopidis, C. Holt, L. Sawyer (2004) β‐Lactoglobulin: Binding Properties, Structure, and
Function. J Dairy Sci, 87, 785‐796
[202] D. R. Flower (1996) The lipocalin protein family : structure and function. Biochem J, 318, 1‐14
[203] L. Sawyer, G. Kontopidis (2000) The core lipocalin, bovine L‐lactoglobulin. Biochimica et Biophysica
Acta, 1482, 136‐148
[204] C. Tanford, L.G. Bunville, Y. Nozaki (1959) The reversible transformation of beta‐lactoglobulin at pH
7.5. J Am Chem Soc, 81, 4032‐4036
[205] J. Pronchik, J.T. Giurleo, D.S. Talaga (2008) Separation and Analysis of Dynamic Stokes Shift with
Multiple Fluorescence Environments: Coumarin 153 in Bovine b‐Lactoglobulin A. J Phys Chem B, 112,
11422‐11434
[206] J. Szejtli, L. Szente (2005) Elimination of bitter, disgusting tastes of drugs and foods by
cyclodextrins. Eur J Pharm Biopharm, 61, 115‐125
191
[207] S. Scypinski, J. M. Drake (1985) Photophysics of coumarin inclusion complexes with cyclodextrin:
Evidence for normal and inverted complex formation. J Phys Chem, 89, 2432‐2435
[208] P. Sen, D. Roy, S.K. Mondal, K. Sahu, S. Ghosh, K. Bhattacharyya (2005) Fluorescence Anisotropy
Decay and Solvation Dynamics in a Nanocavity: Coumarin 153 in Methyl β‐Cyclodextrins. J Phys Chem A,
109, 9716‐9722
[209] S. Sakamoto, K. Kudo (2008) Supramolecular Control of Split‐GFP Reassembly by Conjugation of β‐
Cyclodextrin and Coumarin Units. J Am Chem Soc, 130, 9574‐9582
[210] L.M.S. Chang, F.J. Bollum (1971) Enzymatic Synthesis of Oligodeoxynucleotides. Biochemistry, 10,
536‐542
[211] G.B. Dutt, T.K. Ghanty (2003) Rotational Diffusion of Coumarins in Electrolyte Solutions: The Role of
Ion Pairs. J Phys Chem B, 107, 3257‐3264
[212] http://www.exciton.com/laserdyeslist.html Coumarin laser dyes product specs sheets, Exciton.
Information as in August 19th, 2010
[213]
http://www.sigmaaldrich.com/catalog/ProductDetail.do?lang=en&N4=36798|SIGMA&N5=SEARCH_CON
CAT_PNO|BRAND_KEY&F=SPEC, Sigma‐Aldrich product specs sheet. Information as in September 11th,
2010
[214] U.S. Raikar, C.G. Renuka, Y.F. Nadaf, B.G. Mulimani (2006) Steady‐state, time‐resolved fluorescence
polarization behaviour and determination of dipole moments of coumarin laser dye. J Mol Struct, 787,
127‐130
[215] A. Rapaport, F. Szipocs, M. Bass (2004) Dependence of two‐photon absorption excited fluorescence
in dye solutins on the angle between the linear polarizations of two intersecting beams. Appl Phys B, 78,
65‐72
192
[216]
http://www.sigmaaldrich.com/catalog/ProductDetail.do?lang=en&N4=12832|FLUKA&N5=SEARCH_CON
CAT_PNO|BRAND_KEY&F=SPEC. Sigma‐Aldrich product specs sheet. Information as in September 11th,
2010
[217] U.S. Raikar, C.G. Renuka, Y.F. Nadaf, B.G. Mulimani, A.M. Karguppikar (2006) Rotational Diffusion
and Solvatochromic Correlation of Coumarin 6 Laser Dye. J Fluoresc, 16, 847‐854
[218] R.N. Barnett, C.L. Cleveland, U. Landman (2010) Oxidation of DNA: Damage to Nucleobases.
Accounts Chem Res, 43, 280‐287
[219] F. Boussicault, M. Robert (2008) Electron Transfer in DNA and in DNA‐Related Biological Processes:
Electrochemical Insights. Chem Rev, 108, 2622‐2645
[220] K. Senthilkumar, F.C. Grozema, C.F. Guerra, F.M. Bickelhaupt, F.D. Lewis, Y.A. Berlin, M.A. Ratner,
L.D.A. Siebbeles (2005) Absolute Rates of Hole Transfer in DNA. J Am Chem Soc, 127, 14894‐14903
[221] B. Giese (2002) Electron transfer in DNA. Curr Opin Chem Biol, 6, 612‐618
[222] M. Amos (2005) Theoretical and Experimental DNA Computation, Springer‐Verlag, Berlin
Heidelberg, Germany