Embed Size (px)
Citation preview

Ligand-induced Assembling of the Type I InterferonReceptor on Supported Lipid Bilayers
Peter Lamken†, Suman Lata†, Martynas Gavutis and Jacob Piehler*
Institute of BiochemistryJohann WolfgangGoethe-University, BiocenterN210, Marie-Curie-Straße 960439 Frankfurt am MainGermany
Type I interferons (IFNs) elicit antiviral, antiproliferative and immuno-modulatory responses through binding to a shared receptor consisting ofthe transmembrane proteins ifnar1 and ifnar2. Differential signaling bydifferent interferons, in particular IFNas and IFNb, suggests differentmodes of receptor engagement. Using reflectometric interference spec-troscopy (RIfS), we studied kinetics and affinities of the interactionsbetween IFNs and the extracellular receptor domains of ifnar1 (ifnar1-EC) and ifnar2 (ifnar2-EC). For IFNa2, we determined a KD value of3 nM and 5 mM for the interaction with ifnar2-EC and ifnar1-EC, respect-ively. As compared to IFNa2, IFNb formed complexes with ifnar2-EC aswell as ifnar1-EC with substantially higher affinity. For neither IFNa2nor IFNb was stabilization of the complex with ifnar1-EC in the presenceof soluble ifnar2-EC observed. We investigated ligand-induced complexformation with ifnar1-EC and ifnar2-EC being tethered onto solid-supported, fluid lipid bilayers by RIfS and total internal reflection fluor-escence spectroscopy. We observed very stable binding of IFNa2 at highreceptor surface concentrations with an apparent kd value approximately200 times lower than that for ifnar2-EC alone. The apparent kd value wasstrongly dependent on the surface concentration of the receptor com-ponents, suggesting kinetic stabilization. This was corroborated by thefast exchange of labeled IFNa2 bound to the receptor by unlabeledIFNa2. Taken together, our results indicate that IFN first binds to ifnar2and subsequently recruits ifnar1 in a transient fashion. In particular, thissecond step is much more efficient for IFNb than for IFNa2, which couldexplain differential activities observed for these IFNs.
q 2004 Elsevier Ltd. All rights reserved.
Keywords: type I interferon receptor; protein–protein interaction; solid-supported lipid bilayer; reflectometric interference spectroscopy; totalinternal reflection fluorescence spectroscopy*Corresponding author
Introduction
Signaling induced by type I interferons (IFNs)plays a key role in host innate response to viral
infection by eliciting a pleiotrophic responseincluding antiviral, antiproliferative andimmunmodulatory activities. Because of theseactivities, type I IFNs are attractive for clinicalapplications in different fields.1 Although type Iinterferons are already used successfully in thetreatment of several diseases, the complexity oftheir action interferes with a pharmacologicallycontrolled administration. Thus, better under-standing of the receptor recruitment by IFNs andthe following downstream events is required forfully exploiting the therapeutical potentials ofIFNs.
All type I interferons (13 different IFNas, 1 IFNband 1 IFNv) exert their activity through binding tothe same receptor components, ifnar1 and ifnar2.2
Upon ligand binding, tyrosine kinases associated
0022-2836/$ - see front matter q 2004 Elsevier Ltd. All rights reserved.
†P. L. and S. L. contributed equally to this paper
E-mail address of the corresponding author:[email protected]
Abbreviations used: IFN, human type I interferon;ifnar1-EC and ifnar2-EC, extracellular domains of thehuman type I interferon receptor ifnar1 and ifnar2; wt,wild-type; ifnar2-tl, tag-less ifnar2-EC; NTA,nitrilotriacetic acid; RIfS, reflectometric interferencespectroscopy; FRAP, fluorescence recovery after photo-bleaching; TIRFS, total internal reflection fluorescencespectroscopy; MBP-H10, decahistidine-tagged maltose-binding protein; OG, Oregon green; AF, Alexa Fluor.
doi:10.1016/j.jmb.2004.05.059 J. Mol. Biol. (2004) 341, 303–318

with the cytoplasmic domains are activated byauto-phosphorylation, followed by phosphoryl-ation of several tyrosine residues on the receptorand other effector molecules, which are mainlymembers of the STAT family. It appears, however,that the function of different type I IFNs is notfully redundant, and differential signaling bydifferent IFNs has been observed.3 – 8 In particularbetween IFNa subtypes and IFNb, substantialdifferences have been observed on the level ofreceptor phosphorylation3 and STAT recruitment,9
as well as on the level of gene induction.10,11 As sofar no further receptor component has been identi-fied, these differences need to be explainedthrough the mode of interaction of IFNs with theextracellular domains of ifnar1 and ifnar2 (ifnar1-EC and ifnar2-EC, respectively). Therefore, a com-prehensive structural, biophysical and mechanisticpicture of how the receptor domains are recruitedin time and space is required for understandingthe specificity of signal propagation through themembrane. In the absence of structural data, therecognition of IFNs by the receptor componentshas been intensively investigated by mutagenesis.1
The high-affinity interactions between ifnar2-ECand different IFNs have been investigated indetail,12 – 14 and a model for the complex betweenIFNa2 and ifnar2-EC based on double mutantcycle analysis has been reported.15,16 However, thedifferences in affinity, binding kinetics and orien-tation, which have been so far observed for theinteraction of IFNa2 and IFNb with ifnar2-EC areonly minute,13,15,17 and therefore can hardly explainthe functional differences. The low-affinity inter-action of IFNs with ifnar1 has been much less wellcharacterized and the KD value was estimated tobe in the micromolar range. Compared to cellsexpressing ifnar2 alone a 10–40-fold decrease inthe KD value has been reported. By using neutraliz-ing antibodies, the binding site for IFNs on ifnar1was mapped to the Ig-like domains 2 and 3 ofifnar1.18 This observation was confirmed by severalstudies with bovine ifnar1,19,20 which binds humanIFNas with high affinity. These results indicatedthat the ligand binding site of ifnar1 does notcorrespond to a classical cytokine binding module.In vitro, a stable ternary complex of IFNb withifnar1-EC and ifnar2-EC was observed by size-exclusion chromatography.21 As no stable complexbetween IFNb and ifnar1-EC was detectableunder these conditions, this result indicated thatcooperative interaction leads to stabilization of theternary complex. For members of the class Icytokine family, contacts between the two extra-cellular receptor domains apparently contribute tothe stability of the ternary complex,22 – 26 andpre-association of the receptor chains has beenproposed for several receptors.25,27,28 For the IFNg-receptor as a member of the class II cytokinereceptor family, a similar mechanism wassuggested recently.29 However, the role of stem–stem contacts between the extracellular receptordomains has not been clearly resolved so far,
because lateral interactions between membrane-anchored proteins are difficult to study: cellularassays with the full-length receptors do notprovide the experimental control required foranalyzing inter-receptor interactions properly;binding studies with the extracellular receptordomains in solution do not provide the biophysicalconstraints of protein–protein interaction withinbiological membranes such as the reduced numberof degrees of freedom (reduced dimensionality)and the reduced diffusion rates.30
Here, we have analyzed the interactions at theextracellular domains of ifnar involved in the for-mation of the active ternary complex for bothIFNa2 and IFNb. We furthermore present a novelapproach for studying ligand-induced receptorassembling by combining full experimental controlof an in vitro reconstituted system with mimickingtwo-dimensional protein–protein interactionswithin the plane of the plasma membrane.Through their C-terminal histidine tags, wetethered ifnar1-EC and ifnar2-EC in an orientedmanner onto supported fluid lipid bilayers con-taining lipids carrying high-affinity chelator headgroups. We evaluated the interaction of IFNs tothe receptor components reconstituted on fluidlipid bilayers by reflectometric interferencespectroscopy (RIfS) and total internal reflectionfluorescence spectroscopy (TIRFS). Based on theseresults, we discuss a biophysical model of the tern-ary complex formation and for differential receptorrecruitment by IFNs.
Results
Expression and purification of ifnar1-EC
Ifnar1-EC with a C-terminal decahistidine-tagwas expressed in Sf9 cells infected with a baculo-virus harboring the gene of mature ifnar1-ECfused to the secretion sequence of the baculoviralprotein gp67. The protein was purified to homo-geneity from the supernatant by IMAC and size-exclusion chromatography (Figure 1A). In SDS-PAGE, a molecular mass of approximately 57 kDawas observed (Figure 1A), suggesting substantialglycosylation of the protein. Removal of theglycans with PNGaseF yielded a protein with anapparent molecular mass of 48 kDa (Figure 1B) cor-responding to the expected molecular mass of thepolypeptide chain. Under non-reducing conditionsthe band of ifnar1 was shifted to a lower molecularmass compared to the reduced protein, indicatinginternal disulfide bridge formation (Figure 1B).Glycosylated ifnar1-EC proved to be a stableprotein, which was stored frozen at 280 8C. Afterone cycle of freezing and thawing, only insignifi-cant loss of monomeric protein was observed bysize-exclusion chromatography (Figure 1C). For allthe following binding experiments, the glycosyl-ated protein was used, because it was more stablethan the deglycosylated protein.
304 Type I Interferon Receptor Assembling

We first characterized the interaction of ligands(IFNa2 and IFNb with each of the receptor com-ponents (ifnar1-EC and ifnar2-EC) separately, inorder to precisely determine affinities, rate con-stants and stoichiometries. These measurementswere carried out by immobilizing either ifnar1-ECor ifnar2-EC via their C-terminal His-tag on theplanar surface of the PEG polymer brush in anoriented fashion using high-affinity chelator headgroups. Under these conditions, lateral interactionsbetween the surface-attached proteins are mini-mized due to the short, covalently bound PEGchains. Protein binding was monitored label-freeby RIfS detection. All binding data obtained fromthese measurements are summarized in Table 1.
Interaction of IFNs with ifnar2-EC
Binding of IFNa2 to immobilized ifnar2-tl hasbeen studied before on different surfaces.31 IFNa2interacted specifically with ifnar2-EC immobilizedvia its C-terminal His-tag (Figure 2A) and thestoichiometry as determined from the relativebinding amplitudes was 1 : 1. From concentration-dependent binding curves, a kd value of0.010(^0.002) s21, a ka of 3(^1) £ 106 M21 s21 and aKD of 3(^1) nM were determined. These valuesare in excellent agreement with the values obtainedfor ifnar2-tl immobilized via monoclonalantibodies.31 The association phase was signifi-cantly biased by mass transport limitation asindicated by the systematic deviation from themodel (Figure 2C). Also the dissociation phasedeviated significantly from a single-exponentialdecay indicating rebinding (Figure 2C) in agree-ment with that reported.31 The interaction of IFNbwith immobilized ifnar2-EC had been investigated
only at increased ionic strength in order to over-come its otherwise strong non-specific binding tothe surface.13 At the PEG polymer brush surfaceused in this study, no significant non-specific bind-ing of IFNb was detectable at physiological ionicstrength after fully blocking the chelator headgroups with MBP-H10 (Figure 2A). Under theseconditions, IFNb bound substantially tighter toifnar2-EC compared to IFNa2 (Figure 2A), whilefrom the relative signals, a 1 : 1 stoichiometrybetween ifnar2-EC and IFNb was confirmed. Thedissociation was very slow with an estimated kd
value of 0.0005 s21. From the I47A mutant ofifnar2-EC, IFNb dissociated with a rate constantof 0.005(^0.002) s21 (Figure 2B). From this value,the kd of approximately 0.0005 s21 was confirmedfor the wild-type complex, assuming the same ten-fold difference as observed at high ionic strength.13
Thus, the half-life of the complex with ifnar2-EC isprobably about 20-fold higher for IFNb comparedto IFNa2. The observed association was stronglymass transport limited (Figure 2D), indicating thatthe association rate constant, ka, is well above5 £ 106 M21 s21. The high ka value can be explainedby electrostatic rate enhancement, as IFNb is posi-tively charged and ifnar2-EC is strongly negativelycharged at physiological pH.
The strong dependence of the complex stabilityon the ionic strength suggests that electrostaticforces also stabilize the interaction of IFNb withifnar2-EC. This effect, however, could also be dueto rebinding on the surface, which is dependenton the ka, value and thus also on the ionic strength.We therefore investigated the contribution ofrebinding by injecting ifnar2-tl at high concen-tration (10 mM) during the dissociation phase(Figure 2E and F). In both cases, a significant faster
Figure 1. Purification and bio-chemical characterization of ifnar1-EC. A, SDS-PAGE of the purifiedprotein: elution fraction fromIMAC (lane 1) and fractions fromsize-exclusion chromatography(lane 2–8). B, SDS-PAGE of purifiedifnar1-EC after deglycosylationwith PNGaseF under non-reducingand reducing conditions in com-parison to the non-deglycosylatedprotein. C, Size-exclusion chroma-togram (Superdex 200 HR10/30) ofpurified ifnar1-EC after freezingand thawing (E, exclusion volume;B, bed volume).
Type I Interferon Receptor Assembling 305

Table 1. Rate and equilibrium constants of the interaction with ifnar1-EC and ifnar2-EC determined for different IFNs and different mutants
Ifnar2-EC Ifnar1-EC Ifnar2-EC/Ifnar1-ECa
IFN ka (M21 s21) kd (s21) KD (nM) ka (M21 s21) kd (s21) KD (nM) ka (M21 s21) kd (s21) KD (nM)
IFNa2 wt (3 ^ 1) £ 106 0.012 ^ 0.002 3 ^ 1 – .0.5 5000 ^ 2000 (3 ^ 1) £ 106 ,0.0001 ,0.03IFNa2 S136Cb (3 ^ 1) £ 106 0.013 ^ 0.002 3 ^ 1 .0.5 ,5000 (3 ^ 1) £ 106 ,0.0001 ,0.03IFNa2 wtc n.b. n.b. n.b. – .0.5 4000 ^ 2000 n.b. n.b. n.b.IFNa2 wtd (3 ^ 1) £ 106 0.20 ^ 0.04 60 ^ 20 – – – – 0.0012 ^ 0.0002 –IFNa2 R149A – ,2 500 ^ 100 – .0.5 5000 ^ 2000 – 0.010 ^ 0.003 –IFNb .5 £ 106 ,0.001 ,0.1 (3 ^ 2) £ 105 0.017 ^ 0.004 50 ^ 30 – ,0.0005 –IFNbc n.b. n.b. n.b. (4 ^ 2) £ 105 0.019 ^ 0.004 50 ^ 30 n.b. n.b. n.b.IFNbe .5 £ 106 0.003 ^ 0.001 ,0.6 – – – – – –IFNbd .5 £ 106 0.005 ^ 0.002 ,1 – – – – ,0.0005 –
Mean values and standard deviations were determined from at least three independent experiments. n.b., no binding detectable.a Co-immobilized on lipid bilayers at high surface concentration.b Labeled with OG-488 or AF-488 at the additional cysteine residue.c In stoichiometric complex with ifnar2-tl.d With the mutant ifnar2-EC I47A.e At 500 mM NaCl.

dissociation was observed resulting in correcteddissociation rate constants of 0.012(^0.003) s21 forIFNa2 and ,0.001 s21 for IFNb, respectively.
Interaction of IFNs with ifnar1-EC
Binding of IFNa2 to immobilized ifnar1-EC wasonly detectable at concentrations above 300 nMand rapid dissociation was observed (Figure 3A).This interaction was entirely specific as confirmedby control experiments without ifnar1-EC on thesurface (data not shown). From the equilibriumresponses, Req, observed for IFNa2 at concen-trations between 100 nM and 100 mM, titrationcurves were obtained (Figure 3B). A KD value of5(^2) mM was determined by fitting a Langmuirisotherm. Hence, the affinity of IFNa2 towardsifnar1-EC is about three orders of magnitude
lower than for ifnar2-EC. The maximum bindingsignal, Rmax, obtained from such titration corre-sponded to a 1 : 1 interaction between ifnar1-ECand IFNa2 assuming full activity of the immobi-lized ifnar1-EC. The same experiment was carriedout with a stoichiometric complex of IFNa2 withifnar2-tl. This complex with a life-time of ,100 scan be assumed static during the time-scale of theinteraction with ifnar1-EC. Binding curves for the0.1 mM and 10 mM IFNa2–ifnar2-tl complex areshown in Figure 3E. The relative binding signalsobtained from a full titration (results not shown)confirmed a 1 : 1 stoichiometric ratio between theIFNa2–ifnar2-tl complex and immobilized ifnar1-EC. A KD value of 4(^2) mM was obtained, whichwas not significantly different from the KD deter-mined for IFNa2 alone. This result suggests thatthe ternary complex of ifnar1, ifnar2 and IFNa2 is
Figure 2. Interaction of IFNa2 and IFNb with ifnar2-EC on a PEG polymer brush. A, Binding curve for 50 nM IFNa2(· · ·· · ·) and 50 nM IFNb (—) to ifnar2-EC in comparison to 50 nM IFNb exposed to immobilized MBP-H10 (- - - -).B, Dissociation of IFNa2 (· · ·· · ·) and IFNb (—) from immobilized ifnar2-EC I47A. C, Fit and residuals for associationand dissociation of IFNa2 shown in A. D, Fit and residuals for association and dissociation of IFNb shown in A.E and F, dissociation of IFNa2 (E) and IFNb (F) from immobilized ifnar2-EC in the absence (—) and in the presence(· · ·· · ·) of 10 mM ifnar2-tl.
Type I Interferon Receptor Assembling 307
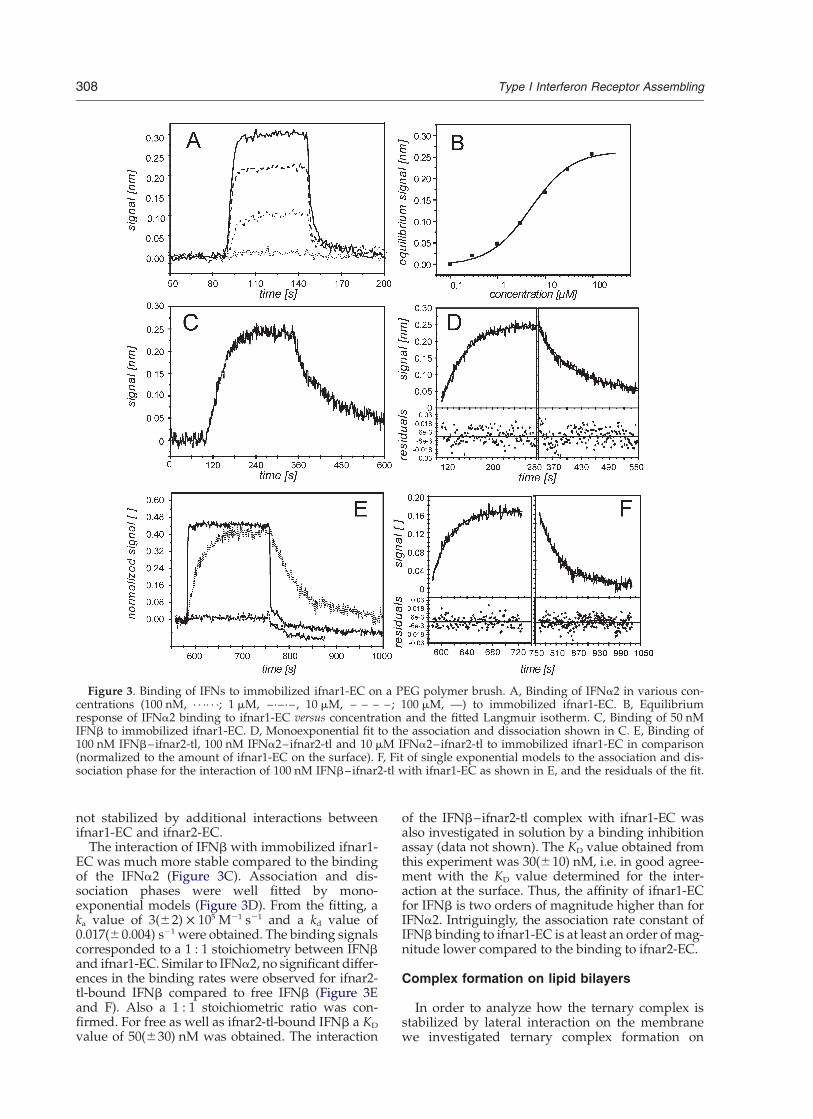
not stabilized by additional interactions betweenifnar1-EC and ifnar2-EC.
The interaction of IFNb with immobilized ifnar1-EC was much more stable compared to the bindingof the IFNa2 (Figure 3C). Association and dis-sociation phases were well fitted by mono-exponential models (Figure 3D). From the fitting, aka value of 3(^2) £ 105 M21 s21 and a kd value of0.017(^0.004) s21 were obtained. The binding signalscorresponded to a 1 : 1 stoichiometry between IFNband ifnar1-EC. Similar to IFNa2, no significant differ-ences in the binding rates were observed for ifnar2-tl-bound IFNb compared to free IFNb (Figure 3Eand F). Also a 1 : 1 stoichiometric ratio was con-firmed. For free as well as ifnar2-tl-bound IFNb a KD
value of 50(^30) nM was obtained. The interaction
of the IFNb–ifnar2-tl complex with ifnar1-EC wasalso investigated in solution by a binding inhibitionassay (data not shown). The KD value obtained fromthis experiment was 30(^10) nM, i.e. in good agree-ment with the KD value determined for the inter-action at the surface. Thus, the affinity of ifnar1-ECfor IFNb is two orders of magnitude higher than forIFNa2. Intriguingly, the association rate constant ofIFNb binding to ifnar1-EC is at least an order of mag-nitude lower compared to the binding to ifnar2-EC.
Complex formation on lipid bilayers
In order to analyze how the ternary complex isstabilized by lateral interaction on the membranewe investigated ternary complex formation on
Figure 3. Binding of IFNs to immobilized ifnar1-EC on a PEG polymer brush. A, Binding of IFNa2 in various con-centrations (100 nM, · · ·· · ·; 1 mM, –·–·–, 10 mM, – – – –; 100 mM, —) to immobilized ifnar1-EC. B, Equilibriumresponse of IFNa2 binding to ifnar1-EC versus concentration and the fitted Langmuir isotherm. C, Binding of 50 nMIFNb to immobilized ifnar1-EC. D, Monoexponential fit to the association and dissociation shown in C. E, Binding of100 nM IFNb–ifnar2-tl, 100 nM IFNa2–ifnar2-tl and 10 mM IFNa2–ifnar2-tl to immobilized ifnar1-EC in comparison(normalized to the amount of ifnar1-EC on the surface). F, Fit of single exponential models to the association and dis-sociation phase for the interaction of 100 nM IFNb–ifnar2-tl with ifnar1-EC as shown in E, and the residuals of the fit.
308 Type I Interferon Receptor Assembling

solid-supported membranes. We tethered ifnar1-EC and ifnar2-EC to the surface of a solid-supported fluid lipid bilayer doped with chelatorlipids using their C-terminal histidine-tags. Whenifnar1-EC or ifnar2-EC were individually immobi-lized on solid-supported lipid bilayers, the bindingcurves obtained for IFNa2 and IFNb binding toifnar2-EC (Figure 4A and B) and ifnar1-EC(Figure 4C and D), respectively, were very similarto the corresponding measurements on the non-fluid polymer brush support. The rate and equi-librium constants obtained from these curvesmatched the rate constants determined from themeasurements on non-fluid support. Neither forIFNa2 nor for IFNb was significant non-specificbinding detectable on the solid-supported lipidbilayers (Figure 4A, C and D).
Upon co-immobilization of ifnar1-EC and ifnar2-EC the binding kinetics of IFNa2 drasticallychanged (Figure 5A and B). No significant dis-sociation was observed within 15 minutes, and asecond injection of IFNa2 did not give any signifi-cant signal (data not shown). Also the associationkinetics was changed (Figure 5C–E): a constantbinding rate until saturation was observed indicat-ing highly diffusion-controlled binding. No dis-sociation of IFNa2 was discernible only if a 1 : 1molar ratio for ifnar1-EC and ifnar2-EC was strictlymaintained. With a molar excess of ifnar1-EC, weobserved partial fast dissociation of IFNa2, and
the amount of stably bound ligand correspondedto the amount of tethered ifnar2-EC (data notshown). With a molar excess of ifnar2-EC, weobserved partial dissociation with a rate constantcorresponding to the ifnar2–IFNa2 interaction,and the amount of stably bound ligand corre-sponded to the amount of ifnar1-EC on the bilayer(results not shown). These results confirmed thatwith IFNa2 a complex with a stoichiometry of1 : 1 : 1 (or multiples thereof) was formed. For-mation of a stable stoichiometric ternary complexwas observed only on fluid supports (Figure 5B),confirming that orientation and lateral reorganiz-ation of the receptor domains were required toobtain maximum binding affinity. In order tocharacterize the lateral distribution of the immobi-lized proteins, laser scanning confocal fluorescencemicroscopy was carried out using ifnar2-EC-S35Clabeled with OG-488 as a probe. Homogeneouslateral distribution of ifnar2-EC was observed onboth polymer brush and supported membrane.The lateral diffusion of the receptor was investi-gated by FRAP experiments (Figure 6). No FRAPwas observed for the polymer brush support (datanot shown), while full FRAP was observed for thesupported lipid bilayers (Figure 6A and B). Forifnar2-EC tethered to the chelator lipid, a diffusionconstant of 1(^0.5) mm2/s was determined,which is very similar to the diffusion constantof GPI-anchored proteins in living cells.32 No
Figure 4. Ligand binding to ifnar1-EC and ifnar2-EC tethered on solid-supported lipid bilayers as detected by RIfS.A, Interaction of 50 nM IFNa2 (· · ·· · ·) and 50 nM IFNb (—) with ifnar2-EC in comparison to 50 nM IFNb exposed toa surface loaded with MBP-H10 (- - - -). B, Fit of the association and dissociation curves shown in A. C, Interaction of10 mM IFNa2 (—) with immobilized ifnar1-EC in comparison to 10 mM IFNa2 exposed to a surface loaded withMBP-H10 (· · ·· · ·). D, Interaction of 100 nM IFNb (—) with ifnar1-EC in comparison to 100 nM IFNb exposed to asurface loaded with MBP-H10 (· · ·· · ·).
Type I Interferon Receptor Assembling 309

significant change in recovery time was observedupon co-immobilization with ifnar1, while bindingof IFNa2 clearly reduced the recovery rate by afactor of 2 (Figure 6C). These results also confirmedthat no substantial interaction between ifnar1-ECand ifnar2-EC takes place in the absence of theligand.
Since for the wt proteins no dissociation from theternary complex was observed, we investigatedseveral mutants of ifnar2-EC and IFNa2 formingrelatively less stable binary complexes with eachother compared to their wild-type counterparts(Figure 7A and B). IFNa2 dissociates from ifnar2-EC I47A with a rate constant of 0.2 s21 (20-foldhigher than wt ifnar2-EC). Upon co-immobilizationof ifnar-1EC, a kd value of 0.0012(^0.0002) s21 wasobserved (Figure 7C). For IFNa2 R149A (KD,500 nM, kd < 2 s21), a dissociation rate constant of0.01(^0.003) s21 in the presence of tethered ifnar1-EC was observed (Figure 7D). From these experi-ments it was estimated that in the presence ofifnar1-EC the apparent affinity is approximately200-fold higher compared to the affinity towardsifnar2-EC alone.
All these measurements, however, were carriedout at very high receptor surface concentrations(approximately 20–40 fmol/mm2, i.e. 20–40% of amonolayer). The stability of the ternary complexat lower receptor concentration was studied using
TIRFS because of the higher sensitivity of fluor-escence detection compared to RIfS. Binding offluorescent IFNa2 (S136C labeled with AF-488) tothe receptor on lipid bilayers was measured atdifferent surface concentrations of the receptor(Figure 8). At a high surface concentration ofifnar1-EC and ifnar2-EC, fluorescence detectionprincipally showed similar dissociation phase asdid RIfS (Figure 8A). However, a decay of the sig-nal while rinsing was observed. This was not dueto ligand dissociation, as stable binding was con-firmed by simultaneous RIfS detection (data notshown), but can be ascribed to photobleaching.With a decreasing surface concentration of ifnar1-EC and ifnar2-EC we observed a decreasingstability of the ternary complex (Figure 8B). Thedissociation curves were fitted by a single-expo-nential decay (Figure 8B and C), and increasing kd
values were obtained with decreasing surface con-centrations. In Figure 8D, the dissociation rateconstants were plotted as a function of receptorsurface concentration, the corresponding valuesare listed in Table 2. At the lowest receptorsurface concentration of approximately 0.3 fmol/mm2 (,200 molecules/mm2), the stability of theternary complex was only three times higher thanfor ifnar2-EC alone. For surface concentrations of2–4 fmol/mm2 we determined kd values corre-sponding to the affinities that have been
Figure 5. Ligand binding to ifnar1-EC and ifnar2-EC co-immobilized on solid-supported, fluid lipid bilayers.A, Immobilization of ifnar2-EC and ifnar1-EC in stoichiometric ratio, and interaction with 50 nM IFNa2. B, Dis-sociation of IFNa2 from the ternary complex with ifnar1-EC and ifnar2-EC on lipid bilayers (—) and on polymer brushsupport (- - - -), compared to the dissociation from ifnar2-EC alone (· · ·· · ·). C, Comparison of the association phases forbinding of 50 nM IFNa2 to ifnar1-EC and ifnar2-EC on supported bilayers (—) and to ifnar2-EC alone (· · ·· · ·). D and E,Mono-exponential fit and residuals of the associations phases shown in C (with the same coding of the curves).
310 Type I Interferon Receptor Assembling
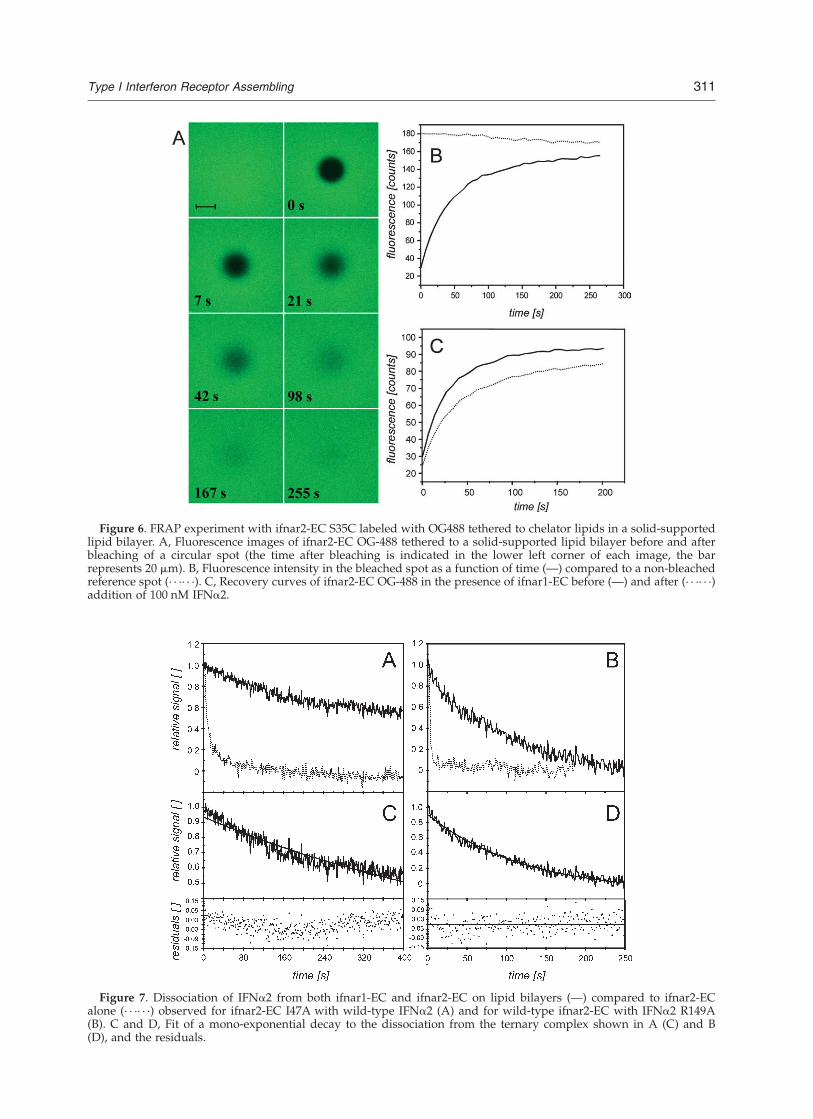
Figure 6. FRAP experiment with ifnar2-EC S35C labeled with OG488 tethered to chelator lipids in a solid-supportedlipid bilayer. A, Fluorescence images of ifnar2-EC OG-488 tethered to a solid-supported lipid bilayer before and afterbleaching of a circular spot (the time after bleaching is indicated in the lower left corner of each image, the barrepresents 20 mm). B, Fluorescence intensity in the bleached spot as a function of time (—) compared to a non-bleachedreference spot (· · ·· · ·). C, Recovery curves of ifnar2-EC OG-488 in the presence of ifnar1-EC before (—) and after (· · ·· · ·)addition of 100 nM IFNa2.
Figure 7. Dissociation of IFNa2 from both ifnar1-EC and ifnar2-EC on lipid bilayers (—) compared to ifnar2-ECalone (· · ·· · ·) observed for ifnar2-EC I47A with wild-type IFNa2 (A) and for wild-type ifnar2-EC with IFNa2 R149A(B). C and D, Fit of a mono-exponential decay to the dissociation from the ternary complex shown in A (C) and B(D), and the residuals.
Type I Interferon Receptor Assembling 311

observed in binding assays with living cells.33 Theassociation phases of the binding curvesnormalized to the saturation signal are shown inFigure 8E. At receptor surface concentrationsbelow 8 fmol/mm2, the association curves over-layed. These curves were fitted well by a pseudo-first-order model (Figure 8F) and gave associationrate constants very similar to the interaction ofIFNa2 with ifnar2-EC alone (Table 2). At a highersurface concentration, significant lower associationrate constants were obtained and systematicdeviations from the model, as well as from theother binding curves were observed (Figure 8F).
This was probably due to mass transportlimitations at these high receptor surface concen-trations, which have already been observed for theinteraction of IFNa2 with ifnar2-EC alone.
The dependence of the complex stability on thereceptor surface concentration suggested that theternary complex is not static, but stabilized by fastre-association, the kinetics of which depends onthe receptor surface concentration. This wasfurther corroborated by the observation that stableternary complexes were formed at low surfaceconcentrations of ifnar2-EC but high surface con-centrations of ifnar1-EC (results not shown). In
Figure 8. The IFNa2 interaction with ifnar1-EC and ifnar2-EC tethered onto supported lipid bilayers as detected byTIRFS. A, Binding of 100 nM AF-488-labeled IFNa2 at different surface concentrations of ifnar2-EC and ifnar1-EC ina stoichiometric ratio (black, 12 fmol/mm2; red, 8 fmol/mm2; green, 4 fmol/mm2; blue, 2 fmol/mm2; brown, 1 fmol/mm2; orange, 0.5 fmol/mm2). B, Dissociation phases of the binding curves shown in A normalized to the signal at thebeginning of dissociation (same color coding as for A) including the fit curve of a mono-exponential decay (blacklines). C, Residuals for fitting curves shown in B (same color coding as for A). D, Dissociation rate constant as a func-tion of the surface concentration of the receptor. E, Association phases of binding curves shown in A normalized tothe saturation signal (same color coding as for A). F, Residuals of a first-order association model fitted to the curvesshown in E.
312 Type I Interferon Receptor Assembling

order to analyze this kinetic stabilization, wechallenged the apparently stable ternary complexformed with fluorescently labeled IFNa2 (S136Cwith OG-488) by injecting unlabeled IFNa2 orifnar2-tl (Figure 9A). Already at a concentrationof 1 mM unlabeled IFNa2, an exchange rate of0.002 s21 was observed. At the same time the totalamount of bound IFN did not change as simul-taneously detected by RIfS (data not shown). Incontrast, no significant change in dissociationkinetics was observed when ifnar2-tl was injected,even at a concentration as high as 10 mM(Figure 9A). Furthermore, even at much lower sur-face concentrations of ifnar2-EC (,0.5 fmol/mm2),fast exchange was observed in the presence of1 mM unlabeled IFNa2 (Figure 9B). These experi-ments confirm that the ligand does not dissociatefrom the surface and re-associates (rebinding-effect), because then ifnar2-tl should interfere asefficiently as does IFNa2, and the effect should bemuch less pronounced at low surface concen-trations. The fact that the ligand is exchangedmuch faster than the apparent dissociation ratefurthermore corroborates the kinetic stabilizationof the ternary complex.
Binding assays with ifnar1 and ifnar2co-immobilized on lipid bilayers were also carriedout with IFNb. However, very stable binding wasobserved already for the interaction with ifnar2-EC alone, and thus no substantial difference instability could be observed in the presence ofifnar1-EC. Upon challenging the ternary complexformed with IFNb by injecting fluorescentlylabeled IFNa2, no exchange could be observed(data not shown), confirming the anticipated highstability of the ternary complex. Since the alreadyformulated IFNb could not be labeled appropri-ately, binding assays at low surface concentrationwere also not feasible.
Discussion
In this study we dissected the individual contri-butions of the different interactions betweenifnar1-EC, ifnar2-EC and IFNs involved in for-mation of the ternary complex. For understandingtheir role for ligand-induced receptor assembling,we investigated the ternary complex formation bytethering the extracellular receptor domains in anoriented fashion on supported membranes. Basedon combined fluorescence and label-free detectionwe studied receptor assembling on a mechanisticlevel, which may help to explain how differencesin receptor engagement by IFNa2 and IFNb resultin differential signaling.
Interaction between ifnar1 and ifnar2
Interaction between receptor components cross-linked by binding to different sites of a ligand isthe basic paradigm for cytokine receptor activation.Yet the mode of its induction is currently undercontroversial debate, and probably differentmodes apply for different systems.34,35 Increasingly,pre-association of the receptor chains,27,29,36 andtheir activation by ligand-induced conformational
Table 2. Rate and equilibrium constants of IFNa2 bind-ing at different stoichiometric surface concentrations ofifnar1-EC and ifnar2-EC on supported lipid bilayers
Ifnar1-EC(fmol/mm2)
ka
(106 M21 s21)kd
(1023 s21)KD
(nM)a
12 ^ 3 1 ^ 0.3 0.5 ^ 0.1 0.17 ^ 0.068 ^ 2 1 ^ 0.3 0.5 ^ 0.1 0.17 ^ 0.065.5 ^ 1 3 ^ 1 0.6 ^ 0.1 0.21 ^ 0.074 ^ 1 4 ^ 1 0.8 ^ 0.2 0.28 ^ 0.12 ^ 0.4 5 ^ 2 1.4 ^ 0.2 0.46 ^ 0.161 ^ 0.2 3.5 ^ 1 2.1 ^ 0.2 0.70 ^ 0.240.5 ^ 0.1 3 ^ 1 3.3 ^ 0.3 1.11 ^ 0.40.3 ^ 0.1 4 ^ 1 4.4 ^ 0.4 1.48 ^ 0.50 4 ^ 1 12 ^ 1 4 ^ 1.5
a Calculated using the average ka of 3(^1) £ 106 M21 s21.
Figure 9. Chase experiments with fluorescent-labeled IFNa2 bound to ifnar2-EC and ifnar1-EC co-immobilized onsupported lipid bilayers. A, Dissociation of OG-488-labeled IFNa2 (—) at high surface concentrations of both ifnar2-EC and ifnar1-EC, in the presence of 1 mM (- - - -) and 10 mM (– – – –) ifnar2-tl, and in the presence of 1 mM unlabeledIFN (· · ·· · ·). B, Dissociation of OG-488-labeled IFNa2 from the ternary complex at low surface concentration of ifnar2-EC in the absence (—) and in the presence (· · ·· · ·) of 1 mM unlabeled IFNa2.
Type I Interferon Receptor Assembling 313

changes have been postulated. In the case of class Icytokine receptors, namely growth hormonereceptor,37,26 interleukin-4 receptor23 and inter-leukin-6 receptor,24 stem–stem contacts betweenthe membrane-proximal, extracellular receptordomains have been shown to be important for theformation of stable ternary complexes. Though theaffinities of such receptor–receptor interactionshave not been quantified yet, stabilization bycooperative inter-receptor and ligand-receptorcontacts was clearly shown. Gel-filtration assayscarried out with recombinant ifnar1-EC, ifnar2-ECand IFNb indicated a similar scenario for the typeI interferon receptor.21 For both IFNa2 and IFNb,we could clearly exclude such co-operative inter-action, as we did not detect a significant differencein the affinity of ifnar1-EC for free compared toifnar2-tl-complexed ligand. Furthermore, no directinteraction between ifnar1-EC and ifnar2-EC wasdetectable, neither by solid-phase detection nor byFRAP. These results suggest a different mode ofinteraction for this member of the class II cytokinereceptor superfamily compared to the members ofthe class I family mentioned above. This is ingood agreement with the observation that thebinding site for IFNa is not located on the mem-brane-proximal tandem Ig-like domains, but at thehinge between the two extracellular tandem Ig-likedomains of ifnar1-EC.18,20
Kinetic stabilization of the ternary complexwith IFNa2
In order to understand the contributions of theindividual interactions towards the stability of theternary complex on the cell surface, we studiedcomplex formation with ifnar1-EC and ifnar2-ECtethered onto solid-supported membranes. IFNa2binding was extremely stable at high surface con-centrations of ifnar1-EC and ifnar2-EC, decreasingthe apparent kd value compared to ifnar2-EC aloneby approximately 200-fold. The dependence of thecomplex stability on the surface concentration ofthe receptor and the possibility of exchanging thebound ligand with much faster rates than theapparent dissociation rate constant suggest kineticrather than static stabilization of the complex. Thekd value of .0.5 s21 for the interaction betweenifnar1-EC and the IFNa2–ifnar2-tl complex impliesthat the life-time of an individual ternary complex
is of the order of a second. Since we could notobserve direct interactions between ifnar2-EC andifnar1-EC, we propose a two-step assemblingmechanism as shown in Figure 10 after binding ofIFNa2 to ifnar2 (k1), ifnar1 transiently associates ina second step to the complex. Owing to the shortlife-time of the IFNa2–ifnar1 interaction, the com-plex dissociates (k22) and re-associates (k2) in a fastmanner (on a sub-second scale). Thus, dependingon the receptor surface concentrations, only partof the bound ligand is involved in the ternary com-plex. This fraction is defined by the equilibriumdissociation constant for the interaction of theifnar2-EC–IFN complex with ifnar1-EC on the sur-face K2 ¼ k22=k2: Since direct dissociation of IFNa2from the ternary complex is very unlikely (at least200-fold slower than from ifnar2-EC alone), theapparent kd value reflects the fraction of ifnar2-EC–IFNa2 not in complex with ifnar1-EC. In cellu-lar binding assays, a 10–40-fold decrease in KD
caused by ifnar1 has been observed for IFNa2.33
Assuming that the biophysical environment is inprinciple mimicked appropriately, our resultshave several important implications for the mech-anism of receptor assembling. (i) The formation ofa stable pre-formed receptor-complex by inter-actions mediated via the extracellular domains assuggested for other receptors25,27,28 is very unlikely.(ii) The receptor components are in some wayco-localized on the surface of the plasma mem-brane, as random distribution of several hundredreceptors on the plasma membrane would not besufficient for gaining 20–40 times increasedstability. This is in line with the observation thatifnar1 and ifnar2 are located in caveolae,38 leadingto a higher effective concentration. (iii) Differentreceptor concentrations not only lead to differentapparent binding affinities, but also different frac-tions of IFN involved in the ternary complex. Thiscould explain the different actions and relativeactivities of IFNs on different cell types.
Differential signaling
One striking observation of this study was themuch higher affinity of IFNb compared to IFNa2not only towards ifnar2-EC, but even moredramatically towards ifnar1-EC. This result is con-sistent with the observation that ifnar1 co-immuno-precipitated with ifnar2 in presence of IFNb, but
Figure 10. Scheme of a two-stepformation and kinetic stabilizationof the ternary complex upon IFNbinding.
314 Type I Interferon Receptor Assembling

not IFNa2.5,8 The higher affinity of ifnar1-ECtowards ifnar2-EC and ifnar1-EC has two mainconsequences: first of all it implies that IFNbbinds to the cellular receptor with more than oneorder of magnitude higher affinity than IFNa2.For IFNa2 mutants, a clear correlation betweenaffinity towards ifnar2-EC and anti-viral activityhas been shown.14 The antiviral activity of IFNb isonly by a factor of 2 to 4 higher than for IFNa2,and not by orders of magnitude. However, satur-ation of activity has also been observed for humangrowth hormone upon enhancing its bindingaffinity substantially.39 While the reason for thissaturation is not fully clear, it is plausible, that thiseffect is different for different types of responses.Second, the higher affinity of IFNb towards ifnar1implies more efficient ternary complex formationat low receptor surface concentrations and longerstability of individual ternary complexes comparedto IFNa2. Such differential efficiencies in theengagement of ifnar1 (and ifnar2) by IFNb com-pared to IFNa2 could then explain several featuresof differential signal activation by IFNs: (i) com-pared to IFNa, IFNb shows additional gene acti-vation at lower (i.e. physiological) concentrations,while at higher concentration similar activitieswere observed;11 (ii) differential signaling is depen-dent on the cell type,9 which may be related to(local) receptor concentrations. Further studies,and in particular binding experiments with fulltransmembrane proteins in living cells, will berequired to test this hypothesis fully. Strikingly,the important role of the surface affinity K2 (cf.Figure 10) for the formation of the IL4 receptorcomplex has been demonstrated in living cells.40
Materials and Methods
Materials
IFNb (formulated Rebif 22 mg and 44 mg) was a giftfrom Serono GmbH, Unterschleißheim, Germany.Oregon green 488 (OG-488) maleimide and Alexa Fluor488 (AF-488) maleimide were purchased from MolecularProbes Europe BV, Leiden, Netherlands. Syntheticstearoyl-oleoyl phosphatidylcholine (SOPC) was pur-chased from Avanti Polar Lipids, Alabaster, USA. Thevector pACgp67B and the BaculoGold baculovirus kitwere purchased from BD Biosciences GmbH, Heidel-berg, Germany. The vector pMAL-c2x and PNGaseFwere purchased from New England Biolabs, Frankfurtam Main, Germany.
Protein expression, purification and labeling
IFNa2, IFNa2-R149A and tag-less ifnar2-EC (ifnar2-tl)were expressed in Escherichia coli, refolded frominclusion bodies and purified by anion-exchange andsize-exclusion chromatography as described.41 The wtifnar2-EC carrying a C-terminal decahistidine-tag andits mutant I47A were expressed and purified in thesame manner. The ifnar2-EC mutant S35C and theIFNa2 mutant S136C were refolded and purified asthe wt. After size-exclusion chromatography, the pro-
teins were labeled by adding a threefold molar excess ofOG-488 maleimide or AF-488 maleimide at 4 8C for 18hours. Finally, they were further purified by desaltingand anion-exchange chromatography. Binding experi-ments confirmed that the interaction properties of bothproteins were not affected by mutagenesis and labeling.OG-488 and AF-488 labeled proteins showed very simi-lar properties in terms of fluorescence intensities andbleaching rates. Ifnar1-EC with a C-terminal His-tagwas cloned into the vector pACgp67B and expressed inSf9 insect cells using the baculovirus system (Baculo-Gold). The supernatant was harvested three to fourdays after infection and ifnar1-EC was purified byimmobilized metal chelate affinity chromatography(IMAC) and size-exclusion chromatography. The proteinwas analytically deglycosylated using PNGaseF.MBP-H10 was expressed using the pMal-c2x vector andpurified by IMAC and size-exclusion chromatography.All purified proteins were more than 95% homogeneousand monomeric as detected by non-reducing SDS-PAGEand size-exclusion chromatography.
Solid phase detection techniques
Receptor immobilization, lipid bilayer assembling andprotein interactions were monitored by RIfS. This label-free detection technique monitors binding on the surfaceof a thin silica interference layer,42,43 and therefore iscompatible with fluorescence detection. Furthermore,background signals due to changes in the bulk refractiveindex as observed by evanescent field detection aremuch less critical in RIfS-detection.31 Binding curveswere obtained from the shift of the interference spectrumof the silica layer: a shift of 1 nm corresponds to approxi-mately 1 ng/mm2 protein on the surface. Measurementswere carried out in a flow chamber with an acquisitionrate of 1 Hz under continuous flow-through conditionsas described.31,42
Binding of fluorescence-labeled proteins was moni-tored by TIRFS using a home-built setup. A 25 mWargon ion laser was used for fluorescence excitation at488 nm. Typically a low excitation power of 2–3 mWfocused onto an area of ,1–2 mm2 was used in order tominimize photobleaching. Fluorescence was collected byan optical fiber and detected by a photomultiplier tubethrough a bandpass filter. The same transducer slides asfor RIfS detection were used as substrates, and all pro-cesses on the surface were monitored simultaneously bysingle-wavelength RIfS detection at 800 nm. The com-bined TIRFS-RIfS set-up will be described in more detailelsewhere. Continuous flow-through conditions weremaintained for all experiments. Data were acquiredwith a time resolution between 1.5 s and 16 s, dependingon the kinetics of the process. Photobleaching was mini-mized by closing the shutter of the excitation sourcebetween the measurements.
Surface modification
For probing the interactions between individualproteins involved in the formation of the ternary com-plex, the silica surface of the transducer was modifiedwith a two-dimensional molecular polymer brush ofpoly(ethylene glycol) (PEG) as described.44 For orientedimmobilization, a chelator head group carrying nitrilo-triacetic acid (NTA) moieties was covalently coupled tothe PEG polymer brush. This chelator head group bindsdecahistidine-tagged proteins with high stability
Type I Interferon Receptor Assembling 315

allowing complete blocking of excessive binding sites. Itssynthesis and characterization will be describedelsewhere.
Solid-supported lipid bilayers were obtained byvesicle fusion on the bare silica surface of the transduceras described.45 SOPC in chloroform was mixed with1–5 mol% of a chelator lipid based on the same chelatorhead group mentioned above. After removing thesolvent in vacuo and resuspension into buffer, smallunilaminar vesicles (SUV) were prepared by probesonication. The transducer surface was incubated for30 minutes in a freshly prepared mixture of two parts30% (v/v) hydrogen peroxide and three parts concen-trated sulfuric acid. After extensive washing with water,the transducer was mounted immediately into the flowcell. SUVs at a concentration of 250 mM were injectedand bilayer formation was followed by RIfS-detection.
Binding assays
All binding assays were carried out in 20 mM Hepes(pH 7.5) and 150 mM NaCl. The chelator head groupswere loaded with Ni ions by injecting 15 mM nickel(II)-chloride in running buffer. Depending on the targetedsurface concentrations, the histidine-tagged receptor pro-teins were injected at concentrations between 2 nM and1 mM for 100–400 s. Excessive binding sites were blockedby injecting 1 mM decahistidine-tagged maltose-bindingprotein (MBP-H10). Immobilized proteins were removedwith a pulse of 200 mM imidazole (pH 8.0). Ligand bind-ing experiments and their evaluation were carried out asdescribed.31 Protein solutions were diluted at least five-fold into the running buffer to avoid backgroundsignals. As a control for specificity, the highest proteinconcentration was applied either without immobilizedprotein or after immobilizing MBP-H10. Complexstoichiometries were estimated from the relative satur-ation signals taking the molecular masses of the proteinsinto account. In the case of rate constants below 0.3 s21,association and dissociation rate constants were deter-mined by fitting a single-exponential function andassuming a 1 : 1 interaction stoichiometry. Low-affinityinteractions with kd . 0:3 s21 were investigated by deter-mining the equilibrium response at various ligand con-centrations. The equilibrium dissociation constant KD
was determined from dose-response curves by fittingthe Langmuir equation. For studying the interaction ofcomplexes of IFNs and ifnar2-EC with immobilizedifnar1-EC, ifnar2-tl was added in stoichiometricamounts, and formation of the stoichiometric complexwas verified by analytical gel-filtration.41 The KD valueof the interaction of ifnar1-EC with IFNb–ifnar2-ECcomplex in solution was determined by a bindinginhibition assay with 20 nM IFNb–ifnar2-EC and ifnar1-EC at concentrations between 10 nM and 1 mM. Theinitial slope versus ifnar1-EC concentration in solutionwas plotted and the KD value determined by fitting theexact solution of the law of mass action as described.46
Fluorescence recovery after photo-bleaching (FRAP)
Fluorescence imaging and recovery experiments werecarried out with a laser scanning confocal microscope(LSM 510; Zeiss, Jena) equipped with a 25 mW argonion laser. Bilayer assembling and receptor attachmentwere carried out in a flow cell with automated samplehandling. The ifnar2-EC mutant S35C labeled with OG-488 was immobilized as described above. A circular
spot with a diameter of 20–30 mm was bleached by scan-ning for 9 s at 75% laser power. Immediately afterwardsimages were acquired at 0.1–0.4% laser power by scan-ning for 1.9 s with a time interval of 5–10 s. Diffusionconstants were calculated from the t1=2 determined fromthe recovery curves as described47 using a g-factor of 1.
Acknowledgements
IFNb (Rebif) was provided by Dr H.-J. Obert,Serono GmbH, Unterschleißheim. The expressionvectors for IFNa2 and ifnar2-EC were obtainedfrom Gideon Schreiber, Weizmann Institute ofScience. A vector containing the gene of ifnar1-ECwas obtained from Gilles Uze, CNRS Montpellier.Labeled IFNa2 was prepared by Pia Muller. Wethank Bernd Otto, Fraunhofer IGB, Hannover forhelpful discussions. This work was supported bythe Deutsche Forschungsgemeinschaft within theEmmy-Noether Program for young investigators(PI-405/1-1,2), by the Human Frontier ScienceProgram (RGP60/2002) and by Stiftung P.E:Kempkes (10/2000). The support from the labora-tory of Robert Tampe is gratefully acknowledged,in particular the help of Eckhard Linker with insectcell culture.
References
1. Deonarain, R., Chan, D. C., Platanias, L. C. & Fish,E. N. (2002). Interferon-alpha/beta-receptor inter-actions: a complex story unfolding. Curr. Pharm. Des.8, 2131–2217.
2. Uze, G., Lutfalla, G. & Mogensen, K. E. (1995). Alphaand beta interferons and their receptor and theirfriends and relations. J. Interferon Cytokine Res. 15,3–26.
3. Abramovich, C., Shulman, L. M., Ratovitski, E.,Harroch, S., Tovey, M., Eid, P. & Revel, M. (1994).Differential tyrosine phosphorylation of the IFNARchain of the type I interferon receptor and of anassociated surface protein in response to IFN-alphaand IFN-beta. EMBO J. 13, 5871–5877.
4. Platanias, L. C., Uddin, S., Domanski, P. &Colamonici, O. R. (1996). Differences in interferonalpha and beta signaling. Interferon beta selectivelyinduces the interaction of the alpha and betaL sub-units of the type I interferon receptor. J. Biol. Chem.271, 23630–23633.
5. Croze, E., Russell-Harde, D., Wagner, T. C., Pu, H.,Pfeffer, L. M. & Perez, H. D. (1996). The human typeI interferon receptor. Identification of the interferonbeta-specific receptor-associated phosphoprotein.J. Biol. Chem. 271, 33165–33168.
6. Mintzer, R. J., Croze, E., Rubanyi, G. M. & Johns, A.(1998). Differential effects of IFN-beta1b on the pro-liferation of human vascular smooth muscle andendothelial cells. J. Interferon Cytokine Res. 18,939–945.
7. Domanski, P., Nadeau, O. W., Platanias, L. C., Fish,E., Kellum, M., Pitha, P. & Colamonici, O. R. (1998).Differential use of the betaL subunit of the type Iinterferon (IFN) receptor determines signalling
316 Type I Interferon Receptor Assembling

specificity for IFNalpha2 and IFNbeta. J. Biol. Chem.273, 3144–3147.
8. Russell-Harde, D., Wagner, T. C., Perez, H. D. &Croze, E. (1999). Formation of a uniquely stable typeI interferon receptor complex by interferon beta isdependent upon particular interactions betweeninterferon beta and its receptor and independent oftyrosine phosphorylation. Biochem. Biophys. Res.Commun. 255, 539–544.
9. Grumbach, I. M., Fish, E. N., Uddin, S., Majchrzak,B., Colamonici, O. R., Figulla, H. R. et al. (1999). Acti-vation of the Jak-Stat pathway in cells that exhibitselective sensitivity to the antiviral effects of IFN-beta compared with IFN- alpha. J. Interferon CytokineRes. 19, 797–801.
10. Der, S. D., Zhou, A., Williams, B. R. & Silverman,R. H. (1998). Identification of genes differentiallyregulated by interferon alpha, beta, or gamma usingoligonucleotide arrays. Proc. Natl Acad. Sci. USA, 95,15623–15628.
11. da Silva, A. J., Brickelmaier, M., Majeau, G. R.,Lukashin, A. V., Peyman, J., Whitty, A. & Hochman,P. S. (2002). Comparison of gene expression patternsinduced by treatment of human umbilical vein endo-thelial cells with IFN-alpha 2b versus IFN-beta 1a:understanding the functional relationship betweendistinct type I interferons that act through a commonreceptor. J. Interferon Cytokine Res. 22, 173–188.
12. Runkel, L., Pfeffer, L., Lewerenz, M., Monneron, D.,Yang, C. H., Murti, A. et al. (1998). Differences inactivity between alpha and beta type I interferonsexplored by mutational analysis. J. Biol. Chem. 273,8003–8008.
13. Piehler, J. & Schreiber, G. (1999). Mutational andstructural analysis of the binding interface betweentype I interferons and their receptor ifnar2. J. Mol.Biol. 294, 223–237.
14. Piehler, J., Roisman, L. C. & Schreiber, G. (2000). Newstructural and functional aspects of the type I inter-feron- receptor interaction revealed by compre-hensive mutational analysis of the binding interface.J. Biol. Chem. 275, 40425–40433.
15. Roisman, L. C., Piehler, J., Trosset, J. Y., Scheraga,H. A. & Schreiber, G. (2001). Structure of the inter-feron-receptor complex determined by distance con-straints from double-mutant cycles and flexibledocking. Proc. Natl Acad. Sci. USA, 98, 13231–13236.
16. Chill, J. H., Quadt, S. R., Levy, R., Schreiber, G. &Anglister, J. (2003). The human type I interferonreceptor. NMR structure reveals the molecular basisof ligand binding. Structure (Camb), 11, 791–802.
17. Runkel, L., De Dios, C., Karpusas, M., Baker, D., Li,Z., Zafari, M. et al. (2001). Mapping of IFN-beta epi-topes important for receptor binding and biologicactivation: comparison of results achieved usingantibody- based methods and alanine substitutionmutagenesis. J. Interferon Cytokine Res. 21, 931–941.
18. Lu, J., Chuntharapai, A., Beck, J., Bass, S., Ow, A., DeVos, A. M. et al. (1998). Structure-function study ofthe extracellular domain of the human IFN-alphareceptor (hIFNAR1) using blocking monoclonal anti-bodies: the role of domains 1 and 2. J. Immunol. 160,1782–1788.
19. Goldman, L. A., Cutrone, E. C., Dang, A., Hao, X.,Lim, J. K. & Langer, J. A. (1998). Mapping humaninterferon-alpha (IFN-alpha 2) binding determinantsof the type I interferon receptor subunit IFNAR-1with human/bovine IFNAR- 1 chimeras.Biochemistry, 37, 13003–13010.
20. Cutrone, E. C. & Langer, J. A. (2001). Identification ofcritical residues in bovine IFNAR-1 responsible forinterferon binding. J. Biol. Chem. 276, 17140–17148.
21. Arduini, R. M., Strauch, K. L., Runkel, L. A., Carlson,M. M., Hronowski, X., Foley, S. F. et al. (1999).Characterization of a soluble ternary complexformed between human interferon-beta-1a and itsreceptor chains. Protein Sci. 8, 1867–1877.
22. Wells, J. A. (1996). Binding in the growth hormonereceptor complex. Proc. Natl Acad. Sci. USA, 93, 1–6.
23. Letzelter, F., Wang, Y. & Sebald, W. (1998). The inter-leukin-4 site-2 epitope determining binding of thecommon receptor gamma chain. Eur. J. Biochem. 257,11–20.
24. Ozbek, S., Grotzinger, J., Krebs, B., Fischer, M.,Wollmer, A., Jostock, T. et al. (1998). The membraneproximal cytokine receptor domain of the humaninterleukin- 6 receptor is sufficient for ligand bindingbut not for gp130 association. J. Biol. Chem. 273,21374–21379.
25. Livnah, O., Stura, E. A., Middleton, S. A., Johnson,D. L., Jolliffe, L. K. & Wilson, I. A. (1999). Crystallo-graphic evidence for preformed dimers of erythro-poietin receptor before ligand activation. Science,283, 987–990.
26. Bernat, B., Pal, G., Sun, M. & Kossiakoff, A. A. (2003).Determination of the energetics governing the regu-latory step in growth hormone-induced receptorhomodimerization. Proc. Natl Acad. Sci. USA, 100,952–957.
27. Remy, I., Wilson, I. A. & Michnick, S. W. (1999).Erythropoietin receptor activation by a ligand-induced conformation change. Science, 283, 990–993.
28. Grotzinger, J. (2002). Molecular mechanisms ofcytokine receptor activation. Biochim. Biophys. Acta,1592, 215–223.
29. Krause, C. D., Mei, E., Xie, J., Jia, Y., Bopp, M. A.,Hochstrasser, R. M. & Pestka, S. (2002). Seeing thelight: preassembly and ligand-induced changes ofthe interferon gamma receptor complex in cells.Mol. Cell Proteomics, 1, 805–815.
30. Lenaz, G. (1987). Lipid fluidity and membraneprotein dynamics. Biosci. Rep. 7, 823–837.
31. Piehler, J. & Schreiber, G. (2001). Fast transientcytokine-receptor interactions monitored in realtime by reflectometric interference spectroscopy.Anal. Biochem. 289, 173–186.
32. Poo, H., Krauss, J. C., Mayo-Bond, L., Todd, R. F., 3rd& Petty, H. R. (1995). Interaction of Fc gammareceptor type IIIB with complement receptor type 3in fibroblast transfectants: evidence from lateraldiffusion and resonance energy transfer studies.J. Mol. Biol. 247, 597–603.
33. Lim, J. K., Xiong, J., Carrasco, N. & Langer, J. A.(1994). Intrinsic ligand binding properties of thehuman and bovine alpha- interferon receptors. FEBSLetters, 350, 281–286.
34. Frank, S. J. (2002). Receptor dimerization in GH anderythropoietin action–it takes two to tango, buthow? Endocrinology, 143, 2–10.
35. Sebald, W. & Mueller, T. D. (2003). The interaction ofBMP-7 and ActRII implicates a new mode of receptorassembly. Trends Biochem. Sci. 28, 518–521.
36. Gent, J., Van Den Eijnden, M., Van Kerkhof, P. &Strous, G. J. (2003). Dimerization and signaltransduction of the growth hormone receptor. Mol.Endocrinol. 17, 967–975.
37. Cunningham, B. C., Ultsch, M., De Vos, A. M.,Mulkerrin, M. G., Clauser, K. R. & Wells, J. A.
Type I Interferon Receptor Assembling 317

(1991). Dimerization of the extracellular domain ofthe human growth hormone receptor by a singlehormone molecule. Science, 254, 821–825.
38. Takaoka, A., Mitani, Y., Suemori, H., Sato, M.,Yokochi, T., Noguchi, S. et al. (2000). Cross talkbetween interferon-gamma and -alpha/beta signal-ing components in caveolar membrane domains.Science, 288, 2357–2360.
39. Pearce, K. H., Jr, Cunningham, B. C., Fuh, G., Teeri, T.& Wells, J. A. (1999). Growth hormone bindingaffinity for its receptor surpasses the requirementsfor cellular activity. Biochemistry, 38, 81–89.
40. Whitty, A., Raskin, N., Olson, D. L., Borysenko, C. W.,Ambrose, C. M., Benjamin, C. D. & Burkly, L. C.(1998). Interaction affinity between cytokine receptorcomponents on the cell surface. Proc. Natl Acad. Sci.USA, 95, 13165–13170.
41. Piehler, J. & Schreiber, G. (1999). Biophysical analysisof the interaction of human ifnar2 expressed in E. coliwith IFN alpha 2. J. Mol. Biol. 289, 57–67.
42. Schmitt, H. M., Brecht, A., Piehler, J. & Gauglitz, G.
(1997). An integrated system for optical biomolecularinteraction analysis. Biosens. Bioelectron. 12, 809–816.
43. Piehler, J., Brecht, A. & Gauglitz, G. (1996). Affinitydetection of low molecular weight analytes. Anal.Chem. 68, 139–143.
44. Piehler, J., Brecht, A., Valiokas, R., Liedberg, B. &Gauglitz, G. (2000). A high-density poly(ethyleneglycol) polymer brush for immobilization on glass-type surfaces. Biosens. Bioelectron. 15, 473–481.
45. Brian, A. A. & McConnell, H. M. (1984). Allogeneicstimulation of cytotoxic T cells by supported planarmembranes. Proc. Natl Acad. Sci. USA, 81, 6159–6163.
46. Piehler, J., Brecht, A., Giersch, T., Hock, B. &Gauglitz, G. (1997). Assessment of affinity constantsby rapid solid phase detection of equilibrium bind-ing in a flow system. J. Immunol. Methods, 201,189–206.
47. Axelrod, D., Koppel, D. E., Schlessinger, J., Elson, E.& Webb, W. W. (1976). Mobility measurement byanalysis of fluorescence photobleaching recoverykinetics. Biophys. J. 16, 1055–1069.
Edited by I. Wilson
(Received 26 January 2004; received in revised form 14 May 2004; accepted 17 May 2004)
318 Type I Interferon Receptor Assembling