Embed Size (px)
Citation preview

Lifestyle Segments, Social Marketing, and Hard-to-Survey Populations:
Understanding Participation in the 2015 Census Test
Mary H. Mulry, Nancy Bates and Matt Virgile1 U.S. Census Bureau, Washington, DC 20233
Abstract Both the 2000 and 2010 U.S. Censuses included a robust social marketing campaign that experts believe helped stem the tide of declining public self-response. As the 2020 U.S. Census approaches, the preparations include tests of new methodologies for enumeration that have the potential to reduce cost and improve quality. In parallel, the research includes formulating methods for the 2020 Census communications campaign that will aid the effectiveness of the enumeration operations. The 2015 Census Test in Savannah, GA included tests of Internet and mail response modes and of online delivery of social marketing communications focused on persuading the public to respond by Internet and mail. Merging data from the 2015 Census Test with third-party lifestyle segments and the Census Bureau’s new Low Response Score produces a dataset suitable for studying relationships between census response, Low Response Scores, and lifestyle segments. This paper uses the merged dataset to examine whether lifestyle segments can provide insight to hard-to-survey populations, their response behavior, and interactions with social marketing communications. Key Words: communications campaign, Low Response Score, 2020 Census
1. Introduction Social marketing campaigns have been part of the U.S. Census since 1950 when the Census Bureau began a partnership with the Advertising Council, a pro bono group of advertising agencies that create marketing campaigns for non-profit causes. The 2000 Census was the first to invest hundreds of millions of dollars for a paid advertising campaign. The budgeted mail response rate in 2000 was 61 percent but, in fact, a mail response rate of 67 percent was achieved. Experts believe the paid campaign played a large role in this success. The 2000 campaign convinced managers to repeat such a paid campaign in the 2010 Census, and the 2020 Census will likewise leverage a communication program that will include paid advertising. Unlike the 2010 Census, the 2020 Census will include the Internet as a mode of self-response. The 2020 Census also will allow for self-response without the requirement that households have access to a Census-assigned unique address identifier. This “Non-ID response” means that anyone with Internet access can self-respond on behalf of their
1 This report is released to inform interested parties and encourage discussion of work in progress. The views expressed on statistical, methodological, and operational issues are those of the authors and not necessarily those of the U.S. Census Bureau.
678

household. In fact, the agency currently is planning for a 63.5 percent self-response rate of which 47 percent is predicted to come from Internet response, 11 percent by mail and 5 percent by telephone (Blumerman et al. 2015, p. 12). The innovations of Internet response and non-ID response have implications for the communications campaign. With the expansion of the use of digital media in advertising in recent years, the census web response option means that digital ads can bring respondents directly to the Census form with one simple click. Combined with a non-ID response option, this click-to-complete functionality may help increase self-response among certain hard-to-survey populations. Recent studies suggest the smart phone ownership gap has closed between whites and racial and ethnic minorities in the U.S. In surveys conducted during 2016, the Pew Research Center (2017) found that 77 percent of whites owned smartphones compared to 72 percent of Blacks and 78 percent of Hispanics. Additionally, 12 percent reported their phone as their only access to the Internet, and this behavior was particularly prevalent among young adults, non-whites, low income, and low education populations with the highest being 27 percent for those who did not graduate from high school (Pew Research Center, 2017). In this paper, we test the application of a commercial marketing database as a means for planning the 2020 communications campaign. For over 40 years, the Census Bureau has partnered with the mapping and spatial analytics software company ESRI to develop products for the Decennial, Economic, Demographic and Population divisions of the agency. Here, we use ESRI’s geographic and lifestyle population segmentation known as Tapestry™, which is available at several geographic levels. This segmentation at the tract level is used in conjunction with a new Census Bureau metric (the Low Response Score or LRS) to retroactively analyze data from the 2015 Census Test in the Savannah, Georgia Direct Market Area (DMA). The 2015 test included a comprehensive social marketing campaign including the use of paid television, radio, print and digital advertising. Our primary research question is the following: Can lifestyle segments provide insight into hard-to-survey populations, their response behavior, and interactions with social marketing communications?
2. Data and Segmentation Our strategy for obtaining answers to the research questions involves partitioning the 2015 Savannah Test Census site by the Tapestry segments and then merging the Test Census self-response results and LRSs. With this dataset, we are able to explore whether the segments reveal a relationship between propensity to self-respond and hard-to-count status as indicated by the LRS. This relationship is of interest because LRS is available nationwide and the Savannah Census Test is the only current source of census self-response data in a setting similar to plans for the 2020 Census in that the Internet response option is available in the presence of a communications campaign. In addition, partitioning the 2015 Savannah Census Test data by segment enables us to examine whether the segments display patterns in the respondents’ choices for self-response. The unit of analysis in our study is the segment, which is a level that a communications campaign would find useful for planning messages and media purchases. This section discusses how we organize the data by segment. Section 3 discusses the implementation of the 2015 Savannah Census Test.
679

2.1 2010 Audience Segmentation and ESRI Tapestry Segments
For the 2010 Census communications campaign, the Census Bureau developed a geographic audience segmentation strategy (Bates and Mulry 2011). Eight population segments were identified, each according to propensity for self-response. Segments were developed using cluster analysis and twelve socio-economic, demographic, and housing variables known to correlate with hard-to-count areas. When developing the segments, the agency relied on internal data sources from the 2000 Census and American Community Surveys conducted after the 2000 Census. The ESRI Tapestry segmentation is an external third-party database used to market goods and services. The segmentation integrates geographic and demographic data from multiple Big Data sources to classify neighborhoods in a manner that provides insight about consumer purchasing patterns, housing characteristics, and socioeconomic characteristics. The methodology for forming the segments uses cluster analysis and data mining and is updated annually. Our research used the 2015 version to correspond with the timing of the 2015 Census Test. The data sources for recent versions of the Tapestry segmentation include the 2010 Census, the American Community Survey, Experian’s ConsumerView database (2017), and the Survey of the American Consumer from GfK MRI (ESRI 2015). While Tapestry segments are primarily used for consumer marketing purposes, their distinguishing characteristics seem intuitively applicable to the Census social marketing campaign directed at encouraging census response. For example, each segment is scored along a race and ethnicity diversity index, income and net worth, age by sex distributions, and neighborhood and socioeconomic traits. These descriptions include household compositions, vacancy rates, housing structures, employment indices, government program participation rates, financial well-being, media consumption habits, and Internet usage. Additionally, the segments are distinguished along more psychographical constructs including attitudes regarding household gender roles and reliance on faith-based organizations – important variables when crafting communication messaging. The ESRI segmentation has three nested levels, which provide flexibility to the user. The 67 Tapestry segments aggregate to 14 LifeMode groups based on lifestyle and life stage. Further aggregation into six urbanization groups reflects area features such as population density and size of city (ESRI 2015). Detailed descriptions of the Tapestry segments, including the LifeMode to which they belong, may be found at http://downloads.esri.com/ESRI_CONTENT_DOC/DBL/US/TAPESTRY/TAPESTRY_FLIERS_ALL_0914.PDF. Tapestry segments are available at different levels of geography including DMA, county, tract and block-groups. For purposes of our paper, we use segments assigned at the Census tract level and concentrate primarily on the lowest segmentation level (the 67 segments). Housing units in the 2015 Savannah Census Test were assigned to segments based on the tract of their address. With this approach, all the housing units in a tract are in the same segment. Although the exact formulation of the ESRI Tapestry segments is proprietary, ESRI’s chief demographer Lynn Wombold said in a personal communication (05/04/2017) that Census and survey response rates did not figure into the development of the Tapestry segments. Therefore, confounding should not be a problem when using the ESRI segments to study census response. The formation of the segments does use some variables that previous
680

studies have shown to be correlated with response, such as tenure, income, and education, which had the potential of being an advantage in our research (Bates and Mulry, 2011).
2.2 Planning Database and LRS Recently, the Census Bureau developed a hard-to-survey metric known as the Low Response Score, or LRS (Erdman and Bates, 2017). The score is simply a geographical area’s fitted value from a regression model predicting the area’s mail return rate from the 2010 Census. In all, 25 predictor variables were used as input to develop the LRS2. A high LRS suggests that an area will have a low level of self-response and may require additional resources by Census Bureau Partnership Specialists, local officials, community advocates, and city planners. The LRS is publicly available at both the Census tract and block-group level on the Census Bureau’s Planning Database (https://www.census.gov/research/data/planning_database/). For our study, housing units were assigned the LRS associated with the tract of their address. For each segment, we calculated the mean LRS over all the addresses comprising the segment. In effect, the mean LRS is the weighted average of the LRS for the tracts in the segment where the weight for a tract is determined by the proportion of the segment’s housing unit population that is in the tract. 2.3 2015 Census Test Participation Rates Our primary outcome variable of interest is the participation rate for segments. Simply stated, the participation rate is the number of completed test questionnaires (mail, Internet and telephone response combined) divided by the number of households receiving Census mail pieces minus the number of addresses indicated as Undeliverable As Addressed (UAA) after the first mailing. The definition of the participation rate follows:
.
The calculation of the participation rate for a segment pooled all the addresses in the segment. Similar to the mean LRS, the participation rate may be viewed as a weighted sum of the participation rates for the tracts in the segment where the weights are the proportion of the segment’s population in the tract. The U.S. Postal Service (USPS) indicated that the first mail piece received a UAA for 20.9%3 of the housing units in the Savannah Test Site. Often a UAA means the housing unit is vacant, but that is not necessarily the case as found in the 2015 Census Test in Maricopa, AZ, which included a Nonresponse Followup and a subsequent Evaluation Followup (Mulry et al. 2016; see Table 7). There are other reasons for the assignment of a UAA, such as the address on the mail piece has an error; the person at the address refuses
2 The 25 variables included % age 5-17; % age 18-24; % not High School graduate; % below poverty; % female headed households, no husband; mean number persons per household; % related child under age 6; % moved in last year; % renter occupied; % vacant houses; % Black; % married family households; median household income; median house value; % Hispanic; population density; % non-Hispanic White; % age 65+; % males; % college graduates; % moved in last 5 years; % single family units; % single person households; % age 25-44; % age 45-64. 3 The two segments with the highest percentages of housing units with UAAs on the first mailing were City Lights and Rural Resort Dwellers with 73.8% and 66.6%, respectively. The range for the other segments was 2.7% for Home Improvement to 38.1% for Rural Bypasses.
681

the mail, or the mailbox is full. The 2015 Savannah Test did not have a Nonresponse Followup operation that would have determined whether these housing units were occupied on Census Day.
3 The Savannah Census Test The 2015 Census Test in the Savannah, Georgia DMA varied the exposure to different communications campaign elements by household with the goal to garner insights on effective digital advertising. The test included a variety of communication elements to mimic a census communications environment. These elements included partnership activities, an earned media campaign, and a traditional paid media campaign (i.e., broadcast and cable television, radio, print, and out-of-home). In addition, an extensive digital advertising effort explored using different spending levels and targeted digital advertising to reach traditionally hard-to-count populations. Census Day for the 2015 Census Test was April 1, 2015 and self-responses were accepted by Internet, mail, and telephone so that the conditions were as similar as possible to the 2020 Census, including the Census Day of April 1, 2020. Since the focus was on self-response, the test did not include Nonresponse Followup or some of the other operations that will be part of the 2020 Census.
3.1 Two goals: Non-ID response and Digital Advertising The 2015 Census Test in Savannah marked several firsts. It was the first time the Census Bureau used communications and paid advertising to not only raise awareness but also drive direct response to the online data collection instrument, by which respondents could complete the questionnaire with or without having a preassigned Census ID (i.e., non-ID response). This test census was also the first opportunity—since the Census Bureau began introducing the mailout/mailback approach in the 1960s, which it more fully adopted in the 1970s—for some households to participate without receiving any mailed materials by responding to a digital advertisement (Vines et al. 2017).
3.2 The Mailout Panels The 2015 Census Test included 439,918 housing units in the Savannah DMA. The DMA included 17 counties in Georgia and 3 in South Carolina. A sample of 90,000 addresses received mailings that encouraged self-response to the census and were partitioned into three panels, each a subsample that received a different mail strategy (Mathews and Rothhaas, 2015). The sample selection procedure initially divided the tracts, and therefore the addresses, into nine strata defined by residential Internet penetration based on 2013 Federal Communications Commission (FCC) broadband data and the Census Bureau’s LRS. The selection of the 90,000 addresses used a systematic sampling scheme with a random start within each stratum. Each stratum was sorted by tract, then block group, block, and assigned address number. The sampling rate within the nine strata were chosen to assure that the distribution of the nine strata within the 90,000 addresses was the same as the distribution across the U.S. Next, the random selection of addresses for the three panels also assured each had a distribution across the nine strata that was comparable to the distribution across the 90,000 addresses. The process assigned the 1st address to the 1st panel, the 2nd address to the 2nd panel, the 3rd address to the 3rd panel and repeating the assignments throughout the file. The comparability of the three panels was important for the comparison of the effectiveness of the mail strategies. There was no sampling of group quarters. For our retrospective analyses, we have combined all three panels since panel assignment was random across the 90,000 addresses. Essentially, we are assuming that differences in self-response due to the mail strategies would affect all subgroups and in
682

particular, all ESRI Tapestry segments in a comparable manner. The preservation the U.S. distribution within the 40 Tapestry segments found in 90,000 addresses was not part of the design, which may be considered a limitation of the study. Each panel of addresses was assigned to one of three self-response contact strategies described below. Table 1 has the mailing contact strategies, the sample sizes for each treatment, and the dates of communications sent to the sample addresses. 1. “Notify Me” Pre-registration Mailing Panel. The addresses in this panel first received a pre-notice postcard inviting them to visit the pre-registration website to sign up to receive a notification when it was time to respond to the test census. Pre-registrants could choose to be notified by text or email. The Census Bureau sent pre-registered households as many as three notifications about the test census via their chosen medium. If there was no self-response after the third notification, a paper questionnaire was sent. Sample households in the Pre-registration mailing panel that did not preregister were sent ID panel mail materials, which are described later. 2. ID Mailing Panel. The first contact to the addresses in this panel was a letter along with an instruction card on how to respond online using the assigned Census ID. This strategy of initially directing respondents to the Internet is known as the Internet First. After the initial contact letter, sample addresses received as many as two additional reminder postcards in the mail. If there was no self-response from the addresses, a paper questionnaire was sent. Recipients still had the option of responding without the preassigned Census ID. 3. Non-ID Mailing Panel. This panel was designed to test the Census Bureau’s automated matching and geocoding processes for cases without a preassigned, unique Census ID. The addresses in this mailing panel received standard Internet Push mail materials, but they were not provided a Census ID. Instead, respondents provided their address as part of the self-response process. After the initial contact letter, sample addresses received as many as two more reminder postcards by mail. If there was no self-response, a paper questionnaire was sent (Vines et al. 2017).
Table 1: 2015 Census Test Mail Contact Panels Mail Panel
Sample Size
Pre-Notice (Feb 23)
Contact 1 (March 23)
Contact 2 (April 1)
Contact 3 (April 8)
Contact 4 (April 15/16)
“Notify Me” preregistration
30,000 Postcard invite to register
Choice of email or text*
Choice of email or text*
Choice of email or text*
Mail questionnaire
ID 30,000 N/A Letter Postcard Postcard Mail questionnaire
Non-ID 30,000 N/A Letter (no ID)
Postcard (no ID)
Postcard (no ID)
Mail questionnaire
*Pre-registrants were sent their choice of email or text messages. Otherwise, addresses in the Pre-registration Panel that did not preregister were sent mail materials identical to the ID panel.
683
The overall participation rate for the three panels in the 2015 Savannah Census Test site was 61.0 percent. The Non-ID panel had a 58.1 percent participation rate while the ID panel was 61.2 percent and the Pre-registration panel was 60.2 percent (Vines et al., 2017 p. 50-51). The participation rate of the Non-ID panel was 3.1 percent (S.E.=0.4) lower than the participation rate in the ID panel with a p-value < 0.05, which was statistically significant. On the other hand, the difference between the participation rates in the ID panel and the Pre-registration panel, which was 1.0 percent (S.E.=0.4) had a p-value < 0.05 and therefore, was not statistically significant.
4. Results 4.1 LRS, Tapestry Segments, and Self Response The 90,000 addresses in the Savannah Census Test site are covered by 40 of the 67 Tapestry segments. For the 40 segments, the correlation between the participation rate and the mean LRS is -0.91, which indicates a strong negative association between the LRS and propensity to self-respond. To further explore the relationship between the participation rate and the mean LRS within segments, we fit a regression model. Figure 1 shows the regression model of the participation rate on the mean LRS with 40 of the segments represented in the Savannah test site, which has an R2 of 0.836. Table 2 shows that the intercept of 97.6 (S.E. = 2.97) and coefficient of -0.017 (S.E.=0.002) have p-values < 0.001, all indicating a good fit. The negative coefficient is in the appropriate direction because a higher LRS indicates areas with lower self-response rates.
Note: number of segments = 40; R2 = 0.836.
684

Table 2. Regression Model of Participation Rate on Mean LRS in Segments
Coefficients Standard Error t Stat P-value
Intercept 97.60 2.97 32.89 1.59E-29
Mean LRS -1.78 0.13 13.92 1.67E-16 n=40; R2 = 0.836.
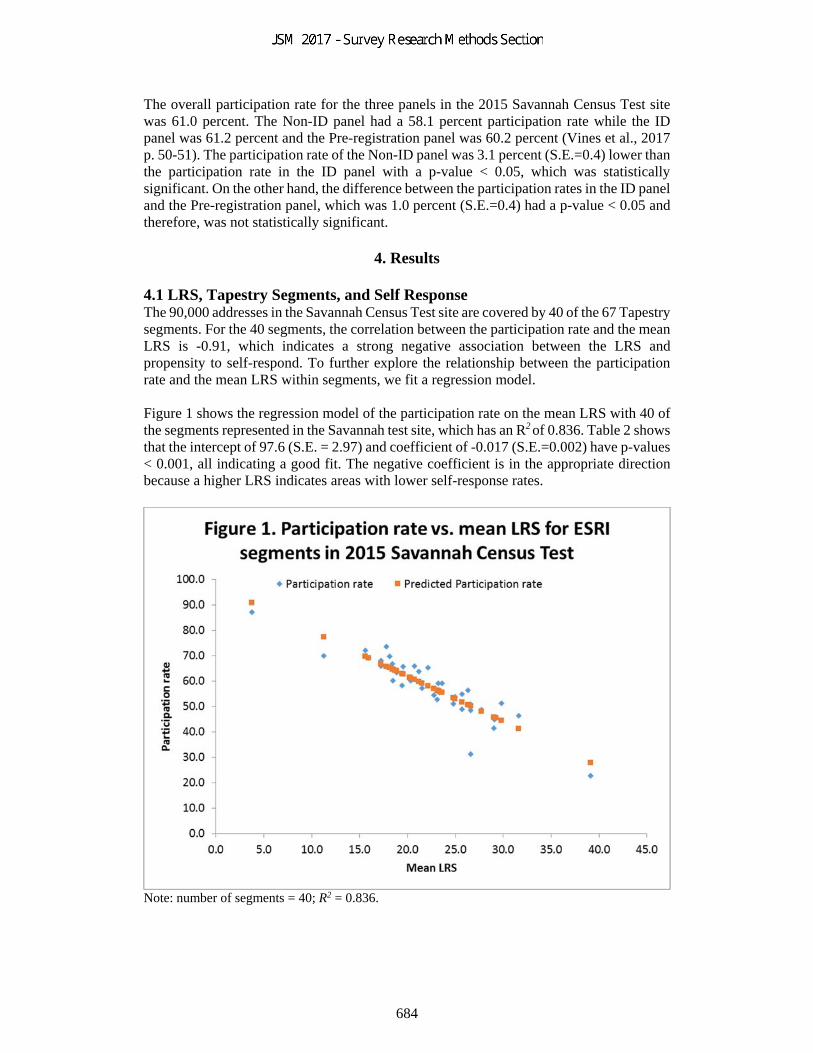
One caveat about the regression model is that the data were collected at the household level, not at the segment level. When the data is collected at one level and then aggregated to a different level for a regression analysis, the underlying assumption that each unit was selected at random is not met, which may result in the p-values being misestimated. This result suggests that among the Tapestry segments, most of the variance in the 2015 Test Census participation rates (83.6 percent) can be explained by the single LRS variable. This is a significant result that implies the LRS does a good job of predicting self-response when the Internet mode is added to mail and telephones modes even though the LRS was developed using only the combination of mail and telephone self-response data. Although this result uses only data from the Savannah Test site, there is potential for many applications since the LRS is available nationwide. Table 3 shows the participation rate and mean LRS for the 40 Tapestry Segments within the 11 LifeModes present in the Savannah Test site. Table 3 shows the segments grouped by LifeMode to make a crosswalk between segments and LifeModes possible for data shown by LifeMode in Section 4.4. The six segments with the lowest participation rates ranging from 22.7% to 46.5% have mean LRS scores ranging from 26.6 to 39.0. The six segments with the highest participation rates ranging from 69.2% to 87.3% have mean LRS scores below or equal to 18.1. Below are descriptions of the six ESRI segments with the lowest participation rates. These ESRI segments all have some of the characteristics that have been associated with populations that are hard-to-survey, such as high mobility, renters, single-person households, low education, poverty, and limited fluency in English. Dorms to Diplomas - LifeMode: Scholars and Patriots; Participation Rate: 22.7%.
ESRI: This segment is the youngest with half of the population 20 to 24 years of age living in a mix of on-campus and off-campus housing that caters to young renters. They are the first online generation, having grown up using computers, the Internet, cell phones, and MP3 players.
City Lights– LifeMode: Middle Ground; Participation Rate: 31.3%.
ESRI: This segment lies in urban areas and is composed of half renters and half owners with half of the homes being single-family or townhomes. The population is diverse with 63% white, 25% Hispanic, 11% black, and 12% Asian and Pacific Islanders. Households include families, both married couples and single parents, and singles. Many residents have completed some college or a degree.
685
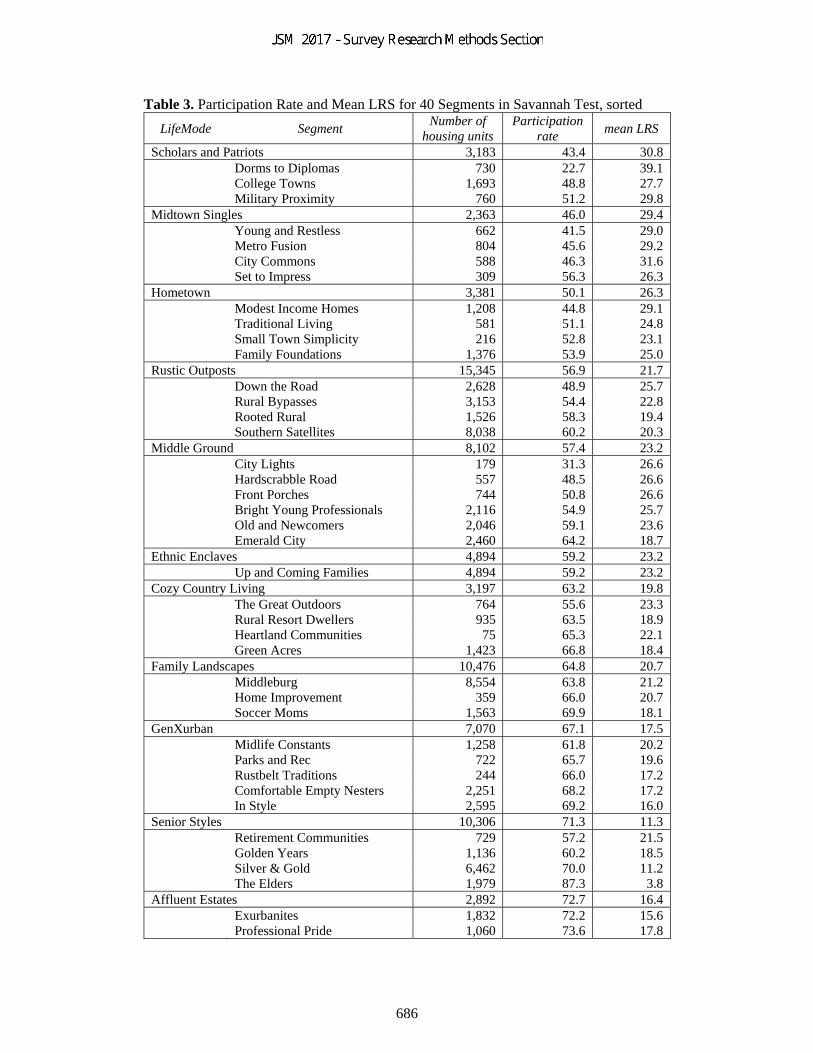
Table 3. Participation Rate and Mean LRS for 40 Segments in Savannah Test, sorted
LifeMode Segment Number of
housing units Participation
rate mean LRS
Scholars and Patriots 3,183 43.4 30.8 Dorms to Diplomas 730 22.7 39.1 College Towns 1,693 48.8 27.7 Military Proximity 760 51.2 29.8 Midtown Singles 2,363 46.0 29.4 Young and Restless 662 41.5 29.0 Metro Fusion 804 45.6 29.2 City Commons 588 46.3 31.6 Set to Impress 309 56.3 26.3 Hometown 3,381 50.1 26.3 Modest Income Homes 1,208 44.8 29.1 Traditional Living 581 51.1 24.8 Small Town Simplicity 216 52.8 23.1 Family Foundations 1,376 53.9 25.0 Rustic Outposts 15,345 56.9 21.7 Down the Road 2,628 48.9 25.7 Rural Bypasses 3,153 54.4 22.8 Rooted Rural 1,526 58.3 19.4 Southern Satellites 8,038 60.2 20.3 Middle Ground 8,102 57.4 23.2 City Lights 179 31.3 26.6 Hardscrabble Road 557 48.5 26.6 Front Porches 744 50.8 26.6 Bright Young Professionals 2,116 54.9 25.7 Old and Newcomers 2,046 59.1 23.6 Emerald City 2,460 64.2 18.7 Ethnic Enclaves 4,894 59.2 23.2 Up and Coming Families 4,894 59.2 23.2 Cozy Country Living 3,197 63.2 19.8 The Great Outdoors 764 55.6 23.3 Rural Resort Dwellers 935 63.5 18.9 Heartland Communities 75 65.3 22.1 Green Acres 1,423 66.8 18.4 Family Landscapes 10,476 64.8 20.7 Middleburg 8,554 63.8 21.2 Home Improvement 359 66.0 20.7 Soccer Moms 1,563 69.9 18.1 GenXurban 7,070 67.1 17.5 Midlife Constants 1,258 61.8 20.2 Parks and Rec 722 65.7 19.6 Rustbelt Traditions 244 66.0 17.2 Comfortable Empty Nesters 2,251 68.2 17.2 In Style 2,595 69.2 16.0 Senior Styles 10,306 71.3 11.3 Retirement Communities 729 57.2 21.5 Golden Years 1,136 60.2 18.5 Silver & Gold 6,462 70.0 11.2 The Elders 1,979 87.3 3.8 Affluent Estates 2,892 72.7 16.4 Exurbanites 1,832 72.2 15.6 Professional Pride 1,060 73.6 17.8
686

Young and Restless– LifeMode: Midtown Singles; Participation Rate 41.5%
ESRI: This market is the one of the youngest with half of the population under 35 years of age with a median age of 29.4. As one of the top 5 renter markets, the residents primarily live in single-person households and are highly mobile, beginning careers and changing residents frequently.
Modest Income Homes – LifeMode: Hometown; Participation Rate: 44.8%. ESRI: In this market, many residents are caregivers to their elderly family members. Social Security and public assistance income are required to support these single-parent and multigenerational families. About one-in-three households in this segment are living in poverty.
Metro Fusion – LifeMode: Midtown Singles; Participation Rate 45.6%ESRI: This is a diverse market with 30% black, 34% Hispanic, and 20% foreign born. Many residents do not speak English fluently. Three-quarters of this highly mobile population are renters and over 60% of the housing units are in multi-unit structures. Single-parents head about 25% of the households and another 25% are single-person households.
City Commons – LifeMode: Midtown Singles; Participation Rate 46.5%
ESRI: This market is primarily composed of single-parent and single-person households living within large, metro cities. Single-parents, primarily female, head these young households. Nearly one-third of the householders did not graduate from high school and the unemployment rate is very high at about 24%. Most receive income from wages or salaries, but nearly 25% receive income from Social Security and public assistance.
The combination of the regression results and the tendency of the lowest participation rates to correspond to the highest mean LRS scores and vice versa indicate that the LRS is a good predictor of participation rate in the 2015 Savannah Census Test. The results provide a positive answer to our primary research question by indicating that the Tapestry segments do provide insight to the hard-to-count populations and their response behavior. The design and implementation of the 2015 Savannah Test communications campaign did not use the Tapestry segments, but the following analyses provide additional insight on the interactions with social marketing communications by segment. 4.2 Response Mode The Tapestry segments appear to capture some variation in choices for self-response mode. Figure 2 shows the percentage responding by web, mail, and telephone of those who responded in each of the 40 segments when sorted by percentage that were web responses. Overall, 69% of the respondents submitted their census questionnaire through the web while 19% chose mail and 12% chose the telephone. Examining the six segments with the lowest participation rates, four were below average in web responses while one was average and the other was above average. Two segments among the six with the lowest participation rates were the least likely to select the web for submitting their responses with 54% of City Commons and 53% of Modest Income Homes submitted by web. The Young and Restless Segment was about average with 70% choosing
687

the web as mode of response. Dorms to Diplomas, which had the lowest participation rate, had the 5th highest web response rate at 77%. With one exception, the eight segments with the lowest prevalence of web response are in the LifeModes Rustic Outposts and Hometown. All four of the segments in the Rustic Outposts are among the eight lowest with percentages choosing the web for self-response ranging from 57.0% to 59.7%. The LifeMode Hometown includes Modest Incomes Homes with the lowest web self-response rate of 53% and two others within the eight lowest web rates, Small Town Simplicity at 57.9% and Family Foundations at 59.7%. The other segment in LifeMode Hometown is Traditional Living, which also has a below-average web self-response rate of 65.7%. On the other end of the scale, the LifeMode Scholars and Patriots and the LifeMode Affluent Estates have four of the five segments with the highest rates of web response. The LifeMode Scholars & Patriots includes the segment Military Proximity with highest percentage of response via the web at 85.5% and the segment Dorms and Diplomas with the fifth highest percentage at 77.2%. The other segment in LifeMode Scholars and Patriots is College Towns, which has a percentage of response via the web that is about average at 70.1%. The LifeMode Affluent Estates contains two segments, Professional Pride with the second highest percentage of response via the web at 79.9% and Exurbanites with the fourth highest at 77.5%. The segment Soccer Moms has the third highest self-response rate at 79.9% and is in the LifeMode Family Landscapes, which also contains the segments Home Improvement and Middleberg where the percentage responses using the web is 73.1% and 71.5%, respectively. Figure 2 suggests that segments with high proportions of older populations had a tendency also to over-represent telephone responses (e.g., The Elders and Golden Years). This likely reflects a lower comfort level with Internet response, particularly under an implementation method that promotes Internet response at the first contact, followed later by a mailed questionnaire. 4.3 Source of Web Responses The 2015 Census Test used several communications vehicles to present different Uniform Resource Locators (URLs) for use in responding via the Internet. These included URLs in traditional advertisements (e.g., radio, television and print ads), mailed materials, and digital advertisements (with click-to-complete embedded links). Each communication vehicle contained a different URL, which enabled us to parse out the sources most effective in motivating and enabling a census response. The large majority of the web responses used the URL that appeared in the census mailed materials. Overall, 83.7% of the web respondents used the URL in mailed or pre-registration materials, 10.3% clicked through the URL that appeared in traditional advertisements, 5.8% clicked through a URL appearing in a digital advertisement, and the remaining 0.2% used a URL provided in another source, such as a partnership event. Table 4 shows the distribution of the 30,391 responses across the URLs used by web respondents by the broader ESRI LifeMode groupings. The percentage of responses that used the URL provided in mail and pre-registration materials was always larger than the other sources in each segment. Percentage response using the URL provided in mail and pre-registration material ranged from 70.7% in the Hometown LifeMode to 88.5% in the Senior Styles LifeMode. While mail materials drove the majority of web responses, it is
688

noteworthy that several LifeModes with low participation rates had some of the highest Internet uptake from traditional advertisements (e.g., Hometown and Midtown Singles). Table 4. Uniform Resource Locator (URL) of Entry Used by Web Responses in the 2015
Savannah Census Test by ESRI LifeMode Group
URL Used for Web Response
LifeMode group Row Percent Census
Mail Traditional
Ads Digital
Ads Other
Row
Pct/Count Col pct
Affluent Estates 84.1 10.6 5.2 0.1 100.0
1,658 5.5
Cozy Country Living 81.2 10.3 8.2 0.3 100.0
1,476 4.9
Ethnic Enclaves 85.1 9.7 5.1 0.1 100.0
2,255 7.4
Family Landscapes 82.4 10.2 7.2 0.2 100.0
4,977 16.4
GenXurban 84.5 9.7 5.7 0.2 100.0
3,429 11.3
Hometown 70.7 21.5 7.5 0.3 100
1,001 3.3
Middle Ground 82.2 11.2 6.2 0.4 100.0
3,314 10.9
Midtown Singles 76.7 16.1 7.2 0.0 100.0
696 2.3
Rustic Outposts 83.1 10.6 5.9 0.3 100.0
5,195 17.1
Scholars and Patriots 87.2 7.8 4.7 0.3 100.0
1,055 3.5
Senior Styles 88.5 7.5 3.8 0.2 100.0
5,335 17.6
Total 83.7 10.3 5.8 0.2 100.0
Percent/Count 25,432 3,119 1,766 74 30,391 100.0
5. Discussion
Our paper leverages a database not commonly applied in survey methodology, namely a commercial marketing segmentation known as Tapestry. Using these geographic segments and the new metric designed to locate areas less likely to self-respond, we re-analyzed data from the 2015 Census Test. The main goal of the research was to test whether Tapestry segments capture meaningful LRS and self-response variations and if so, whether the segments might be applied for purposes of planning the 2020 Census communication campaign.
689

In fact, we found a great deal of variation in LRS’s between segments – the largest difference in mean LRS between segments was 13 and the correlation between mean segment LRS and participation rates was -0.91. Using Tapestry segments as the unit of analysis in a regression model, we were able to explain 83.6 percent of the variance in the 2015 Census Test participation rates using only the mean LRS as a predictor. This strongly suggests that (1) the LRS is a good metric to predict Census self-response at the tract level, even with the addition of the Internet as a response mode, and (2) the Tapestry segments could be useful when planning the 2020 communications campaign.
For example, the Scholars and Patriots LifeMode group had the lowest participation rate in the 2015 Census Test. This group contains college and military populations that share many traits due to the transitional nature of this group. This group represents 1.5 percent of U.S. households and are highly mobile having recently moved to attend school or serve in the military. This is the youngest group, with a majority in the 15 to 24-year-old range. The group skews renters with roommates in nonfamily households who live in apartments and hold part-time jobs. ESRI describes this group as “Millennials tethered to their phones and electronic devices, spending over five hours online every day tweeting, blogging, and consuming media.”
Within LifeMode groups, we can drill down to individual segments to obtain even more nuanced and granular understanding that can be used in developing messages and their delivery tailored to individual segments. For example, the College Town segment (within the Scholars and Patriots LifeMode) had a 48.8% participation rate, lower that the average 61% participation rate. ESRI describes the College Town segment as heavily influenced by celebrity endorsements and trends in magazines. This segment believes that things done online are easier than in-person. As such, the Census Bureau should consider developing messages delivered by young celebrities via magazines and social media. The availability of web-based self-response should also figure prominently into this messaging since 70% of the responses were submitted via the web.
In contrast, the Hometown LifeMode group also had below-average participation rates in the test, but is comprised of a very different population from the Scholars and Patriots. This group contains those who grow up and stay close to home with close-knit urban communities of young singles (many with children). Religion is the cornerstone of many of these communities. The largest segment in this group, Family Foundations, had a below-average participation rate of 53.9%. The Family Foundations segment contains households where more than half have either attended college or obtained a degree but one-third have only finished high school. Over one-third of households currently receive Social Security benefits; more than a quarter draw income from retirement accounts. For this segment, the communications campaign would do well to partner with local religious leaders and community groups that cater to retirees and families with young children. Since 23.6% of the self-responses were submitted by mail, which was higher than the overall average of 19.3%, the community groups can be made aware that their residents may be more comfortable with mail response than web response. These and other defining characteristics of the segments can greatly inform decisions associated with the communications campaign.
The analyses also provided some insight into variations among source of Internet responses. Did respondents submit questionnaires from the direct mail pieces that contained the URL, or from URLs contained in more traditional ad or from digital ads?
690

Over all segments, the direct mail pieces drove most of the web traffic. However, traditional advertisements such as television and radio drove a disproportionately high percentage of the web responses in a few segments. Having prior information on these nuanced differences between segments can greatly aid in media buys, planning, and resource allocation. In the future, we plan to expand our results from the single 2015 Census Test in Savannah more globally to the larger communication campaign being designed for 2020. In addition, we are exploring whether the ESRI segmentation would be helpful in other applications, such as small area estimation of census coverage error.
References Bates, N. and Mulry, M. H. 2011. Using a Geographic Segmentation to Understand,
Predict, and Plan for Census and Survey Mail Nonresponse. Journal of Official Statistics. 27(4). 601–618. http://www.jos.nu/articles/abstract.asp?article=274601 (accessed July 2017).
Blumerman, L., Bishop, D., Moffett, E., Bentley, M., Boone, T., and Chapin, M. 2015. The 2020 Census Operational Plan. 2020 Census Program Management Review. October 6, 2015. Washington, DC:U.S. Census Bureau. https://www2.census.gov/census_2020/pmr_materials/2015-10-06/3%202020%20census%20op%20plan%2010_6_2015%20v1%20final.pdf (accessed July 2017).
Erdman, C. and Bates, N. 2017. The Low Response Score: A Metric to Locate, Predict, and Manage Hard-to-Survey Populations. Public Opinion Quarterly. 81 (1). 144-156. DOI: https://doi.org/10.1093/poq/nfw040
ESRI. 2015. Tapestry Segmentation: Methodology. Redlands, CA:ESRI. Available at: http://downloads.esri.com/esri_content_doc/dbl/us/J9941Tapestry_Segmentation_Methodology.pdf (accessed July 2017).
Experian Marketing Services. 2017. ConsumerView. New York:New York. http://www.google.com/url?sa=t&rct=j&q=&esrc=s&source=web&cd=1&cad=rja&uact=8&ved=0ahUKEwiRr8C-gc3VAhWCJCYKHZVkAGwQFggmMAA&url=http%3A%2F%2Fwww.experian.com%2Fmarketing-services%2Ftargeting%2Fdata-driven-marketing%2Fconsumer-view-data.html&usg=AFQjCNGCVMgCwQPZYxVBxIM-bg_xwkNlPg (accessed August 2017).
Matthews, K. and Rothhaas, C. 2015. Sample Design Specifications for the 2015 Census Savannah Site Test. DSSD 2020 Decennial Census R&T Memorandum Series #E-05. Washington, DC:U.S. Census Bureau.
Mulry, M. H., Mule, T., and Clark, B. 2016. Using the 2015 Census Test Evaluation Follow-up to Compare the Nonresponse Follow-up with Administrative Record. In JSM Proceedings, Survey Research Methods Section, American Statistical Association. Alexandria, VA: American Statistical Association. 503-516. http://ww2.amstat.org/sections/srms/Proceedings/y2016/files/389527.pdf (accessed July 2017).
Pew Research Center. 2017. Mobile Fact Sheet. Dated January 12, 2017. Washington, DC:Pew Research Center. Available at: http://www.pewinternet.org/fact-sheet/mobile/ (accessed July 2017).
U.S. Census Bureau. 2017. Savannah Area Test Site. Washington, DC: U.S Census Bureau. https://www.census.gov/programs-surveys/decennial-census/2020-census/research-testing/testing-activities/2015-census-tests/savannah.html (accessed July 2017).
Vines, M., Bates, N., Virgile, M., Walejko, G., Hagedorn, S., McCaffrey, K., and Otmany, J. 2017. 2020 Census Research and Testing: 2015 Test of Digital Advertising and Other Communications in the Savannah DMA. 2020 Census Program Internal Memorandum Series: 2017.14.8. May 17, 2017.
691
15
0
10
20
30
40
50
60
70
80
90
100
Figure 2. Percent of responses by mode for Tapestry segmentsin 2015 Savannah Census Test (sorted by percent web)
Web mean web Mail mean mail Phone mean phone
692