Embed Size (px)
Citation preview
Transportation Transportation Safety Initiatives Safety Initiatives
in Phoenixin Phoenix
Kerry Wilcoxon, PEKerry Wilcoxon, PEStreet Transportation DepartmentStreet Transportation Department
Lifesavers ConferenceLifesavers ConferenceMarch 27, 2011March 27, 2011
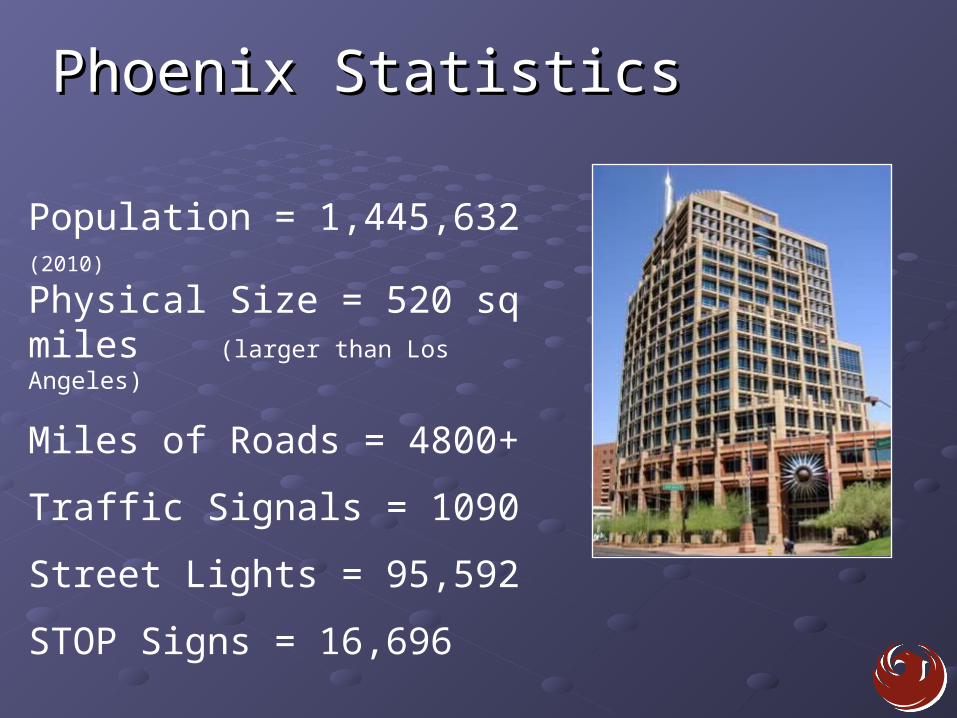
Phoenix StatisticsPhoenix Statistics
Population = 1,445,632 (2010)
Physical Size = 520 sq miles (larger than Los Angeles)
Miles of Roads = 4800+
Traffic Signals = 1090
Street Lights = 95,592
STOP Signs = 16,696
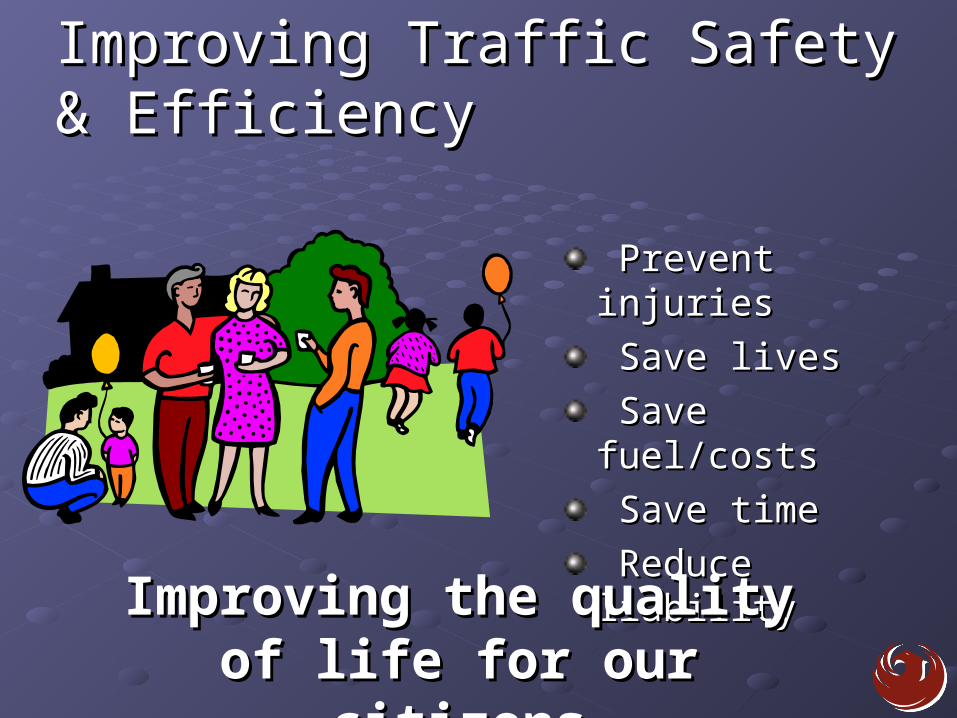
Improving Traffic Safety & Improving Traffic Safety & EfficiencyEfficiency
Prevent injuriesPrevent injuries
Save livesSave lives
Save fuel/costsSave fuel/costs
Save timeSave time
Reduce liabilityReduce liability
Improving the quality Improving the quality of life for our citizensof life for our citizens
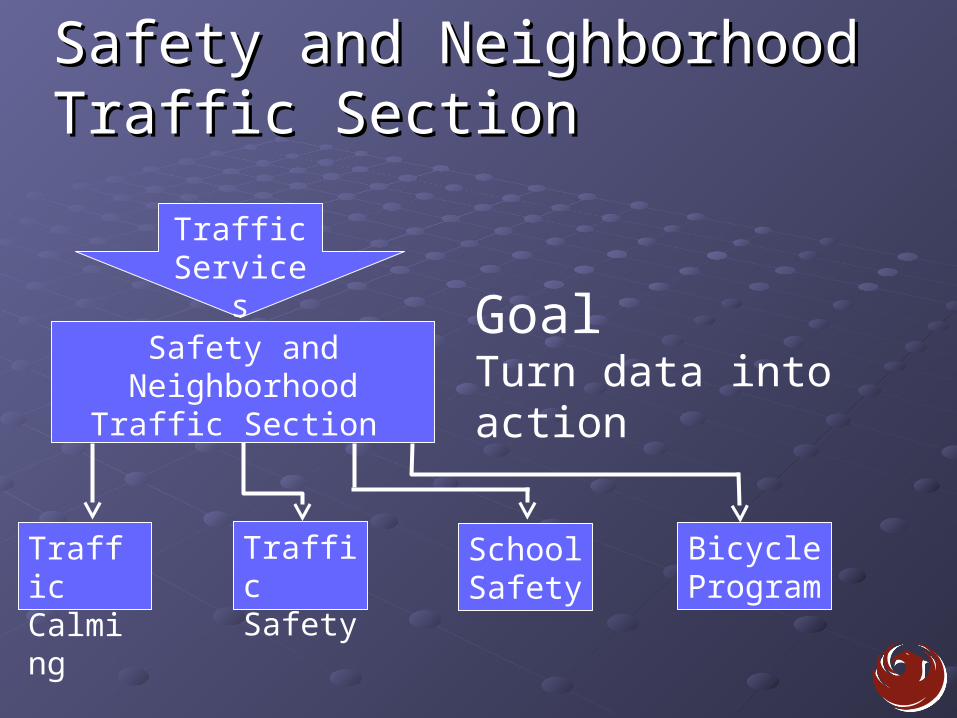
Safety and Neighborhood Safety and Neighborhood Traffic SectionTraffic Section
Traffic Services
Safety and Neighborhood Traffic
Section
Traffic Calming
Traffic Safety
Bicycle Program
School Safety
GoalTurn data into action
Transportation Safety Transportation Safety Initiatives in PhoenixInitiatives in Phoenix
Combating trendsCombating trends
Data Sources – Police Reports & Data Sources – Police Reports & RecordsRecords
Annual Traffic Collision SummaryAnnual Traffic Collision Summary
Reverse LanesReverse Lanes
Traffic CalmingTraffic Calming
Pedestrian Safety AuditsPedestrian Safety Audits
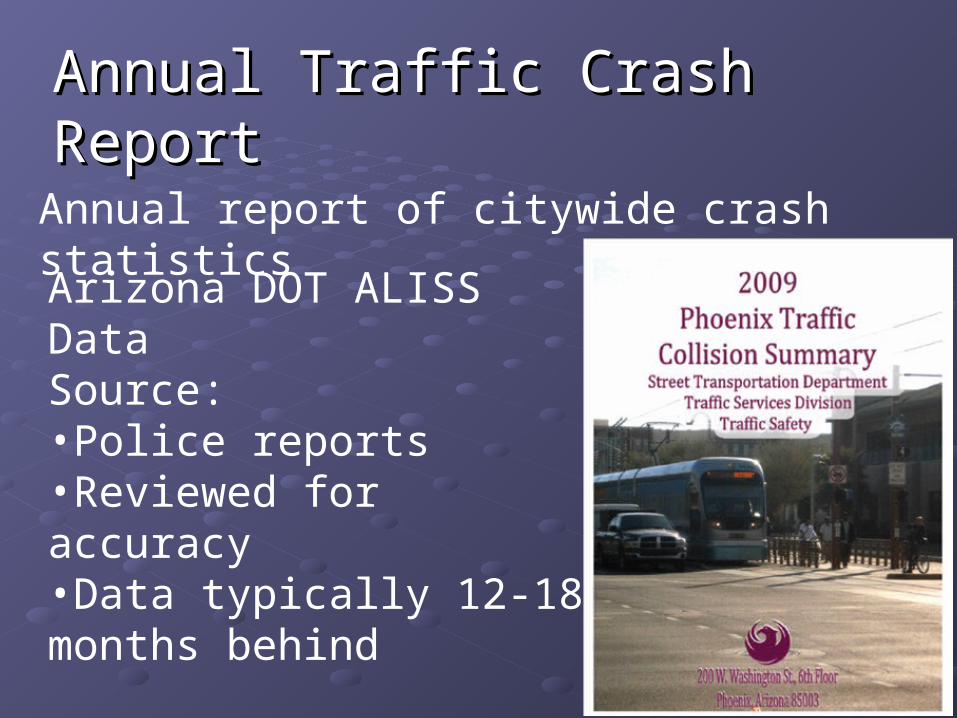
Annual Traffic Crash ReportAnnual Traffic Crash Report
Annual report of citywide crash statisticsArizona DOT ALISS Data Source: •Police reports•Reviewed for accuracy•Data typically 12-18 months behind
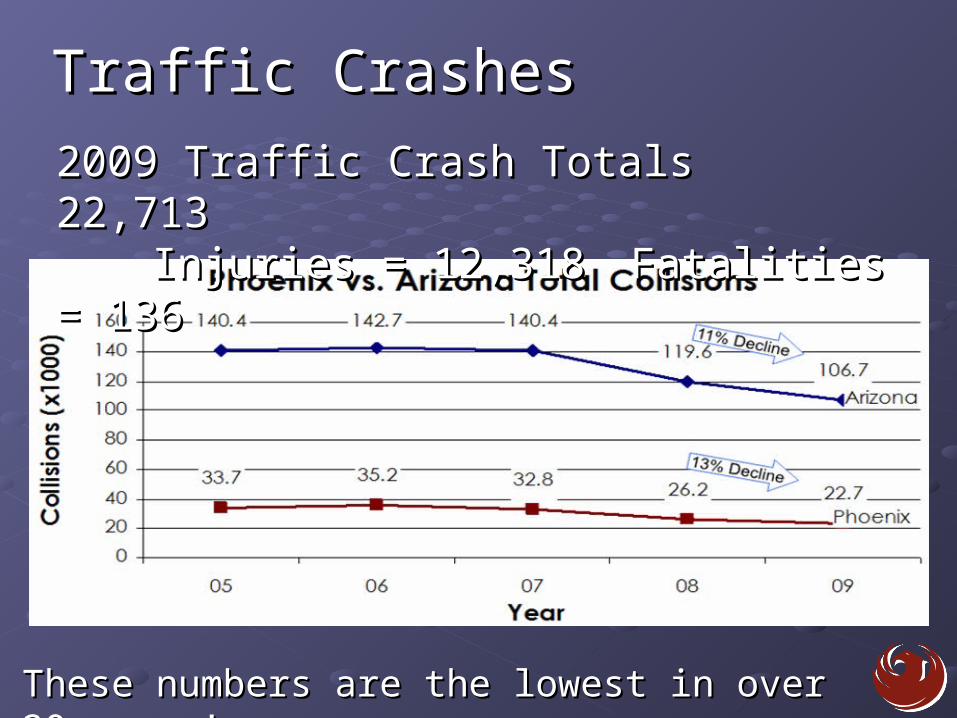
Traffic CrashesTraffic Crashes
2009 Traffic Crash Totals 22,713 2009 Traffic Crash Totals 22,713 Injuries = 12,318 Injuries = 12,318 Fatalities = 136Fatalities = 136
These numbers are the lowest in over 20 These numbers are the lowest in over 20 years!years!
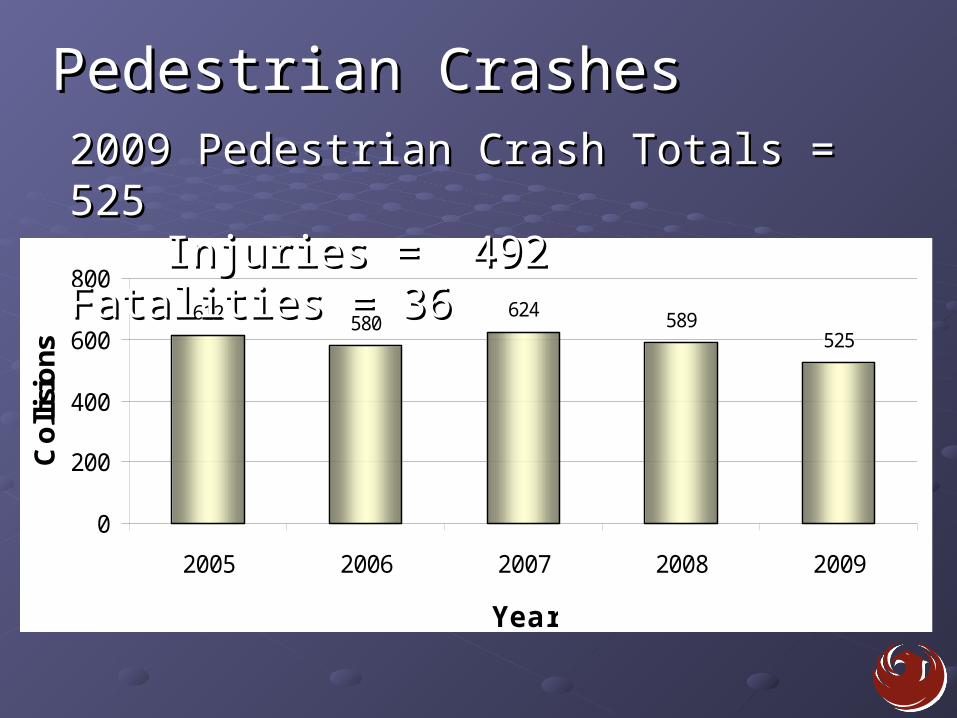
Pedestrian CrashesPedestrian Crashes
612 580624 589
525
0
200
400
600
800
2005 2006 2007 2008 2009
Year
Colli
sions
2009 Pedestrian Crash Totals = 5252009 Pedestrian Crash Totals = 525Injuries = 492 Injuries = 492 Fatalities = 36Fatalities = 36
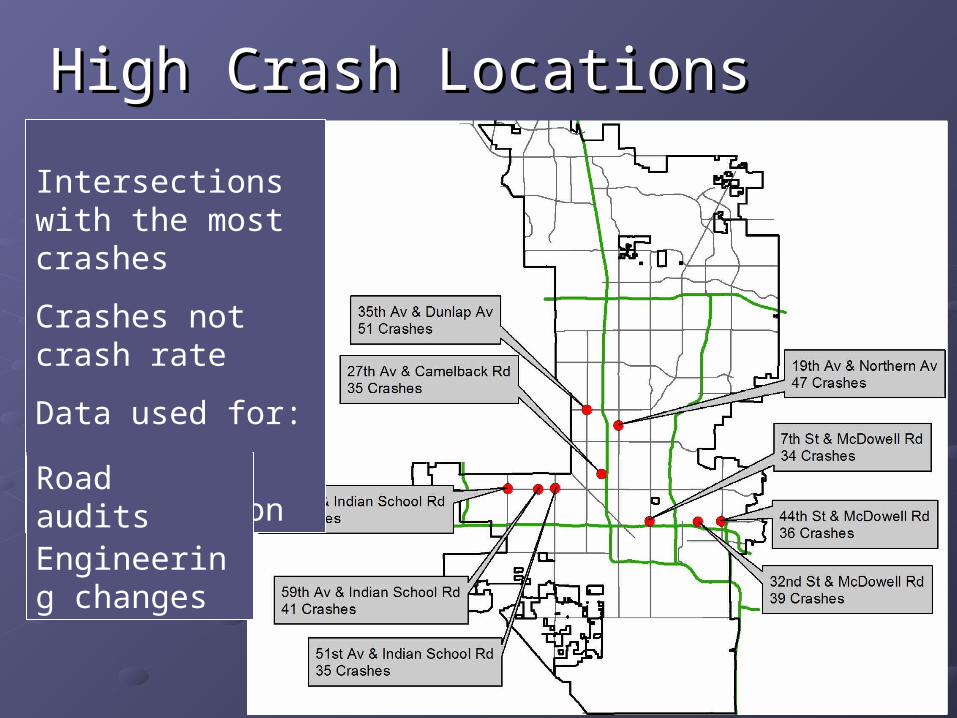
High Crash LocationsHigh Crash Locations
Intersections with the most crashes
Crashes not crash rate
Data used for:
Grant justificationRoad auditsEngineering changes
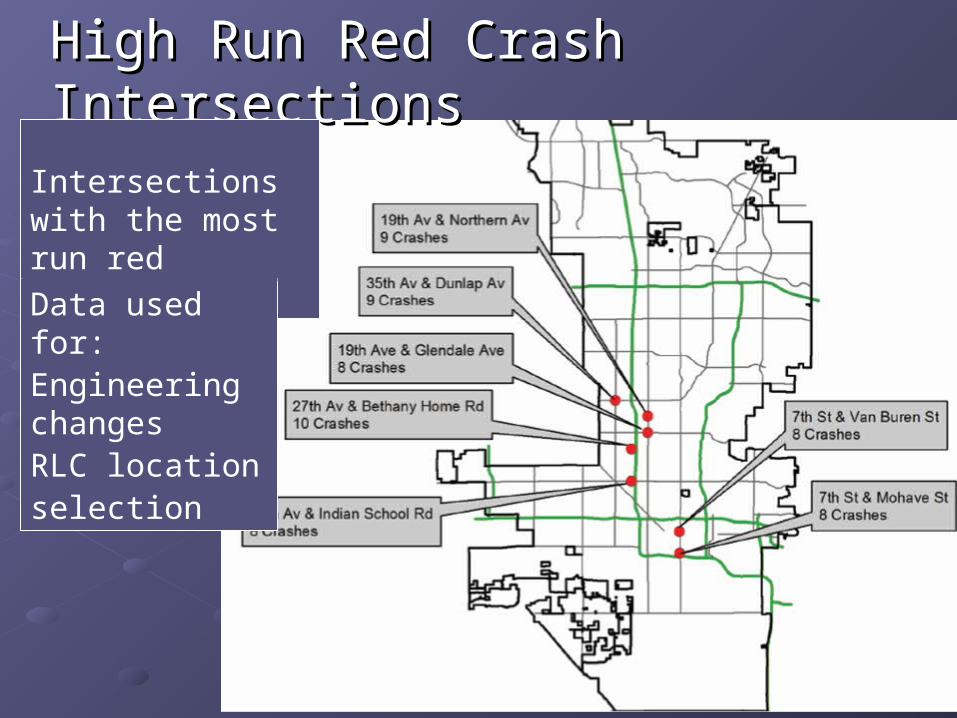
High Run Red Crash High Run Red Crash IntersectionsIntersections
Intersections with the most run red crashesData used for: Engineering changesRLC locationselection
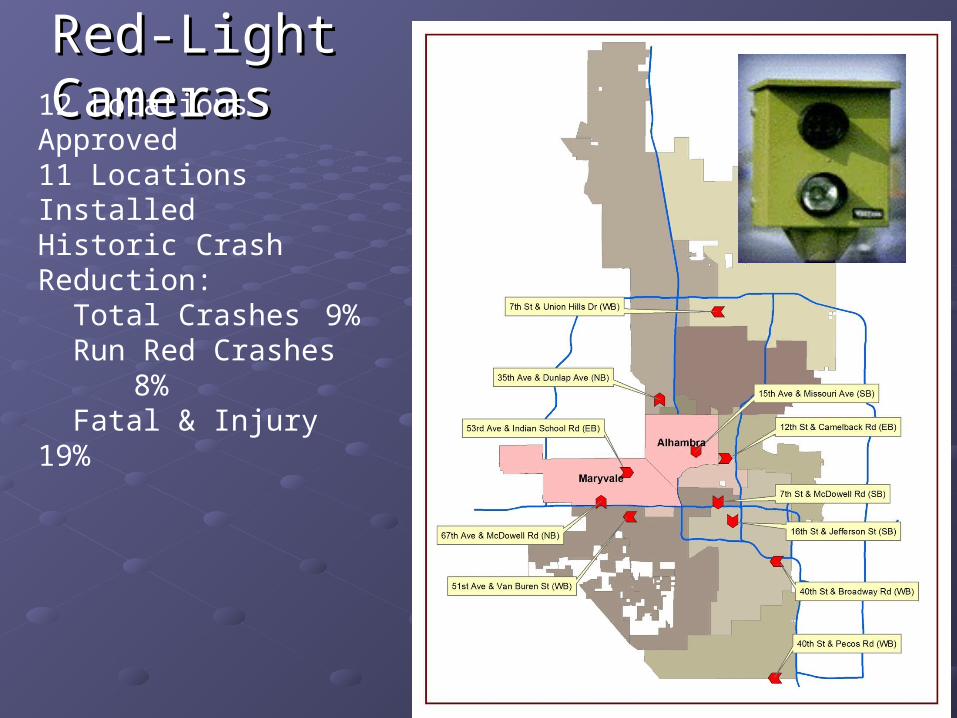
Red-Light Red-Light CamerasCameras
12 Locations Approved11 Locations InstalledHistoric Crash Reduction: Total Crashes 9% Run Red Crashes 8% Fatal & Injury 19%
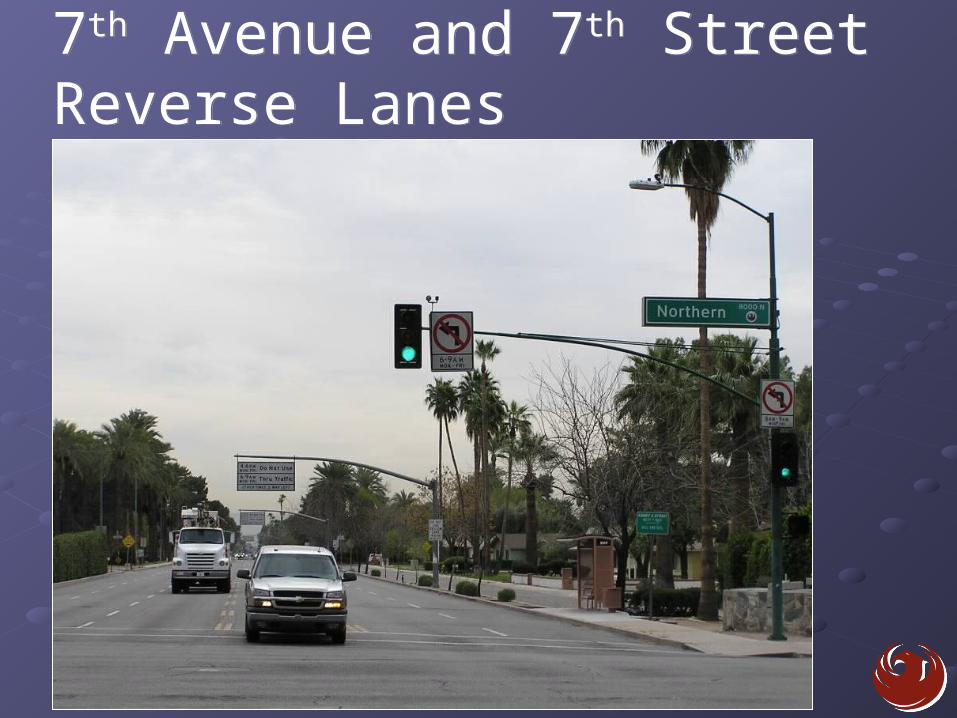
7th Avenue and 7th Street Reverse Lanes7th Avenue and 7th Street Reverse Lanes
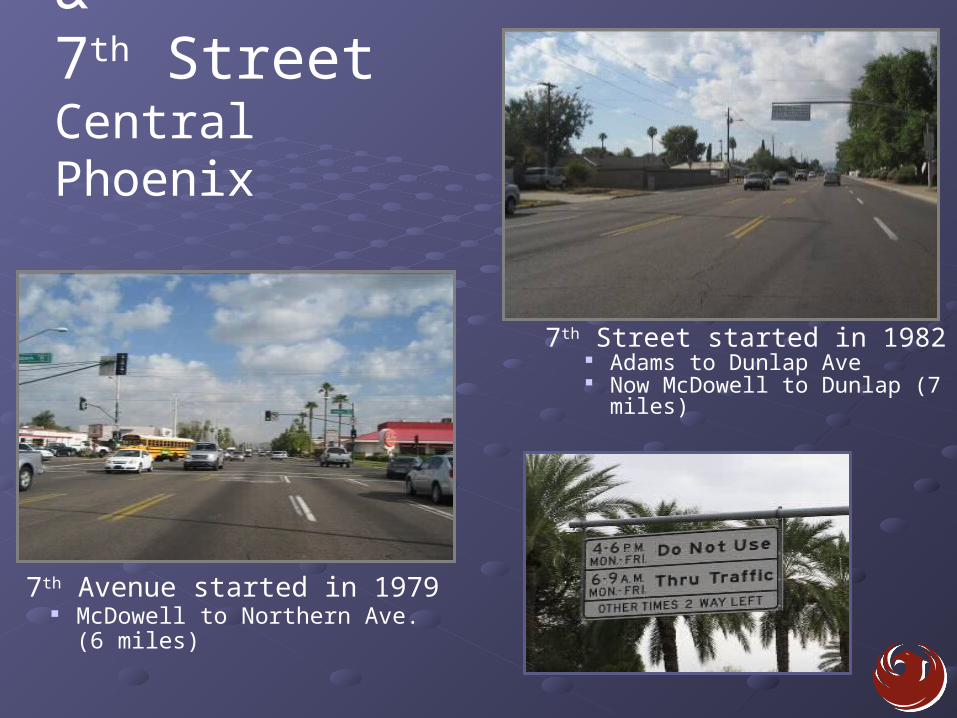
7th Street started in 1982 Adams to Dunlap Ave Now McDowell to
Dunlap (7 miles)
7th Avenue &7th Street Central Phoenix
7th Avenue started in 1979 McDowell to Northern Ave.
(6 miles)

³7TH AVE
³7TH ST
Without Reverse Lanes3 Lanes NB each street650 Vehicles/Hour/Lane
Without Reverse Lanes2 Lanes SB each street650 Vehicles/Hour/Lane
7T
H S
T
SR
51
7T
H A
VE
19
TH
AV
E
16
TH
ST1
5T
H A
VE
12
TH
ST
CE
NT
RA
L A
VE
27
TH
AV
E
3R
D S
T
THOMAS RD
OSBORN RD
20
TH
ST
VAN BUREN ST
BL
AC
K C
AN
YO
N F
WY
(I-
17
)
MC DOWELL RD
OAK ST
GLENDALE AVE
DUNLAP AVE
NORTHERN AVE
INDIAN SCHOOL RD
PAPAGO FWY (I-10)
MARYLAND AVE
BETHANY HOME RD
PEORIA AVE
23
RD
AV
E
BUTLER DR
ROOSEVELT ST
3R
D A
VE
ADAMS ST
25
TH
AV
E
CAVE CR
EEK R
D
18
TH
ST
2N
D S
T
BUTLER DR
2N
D S
T
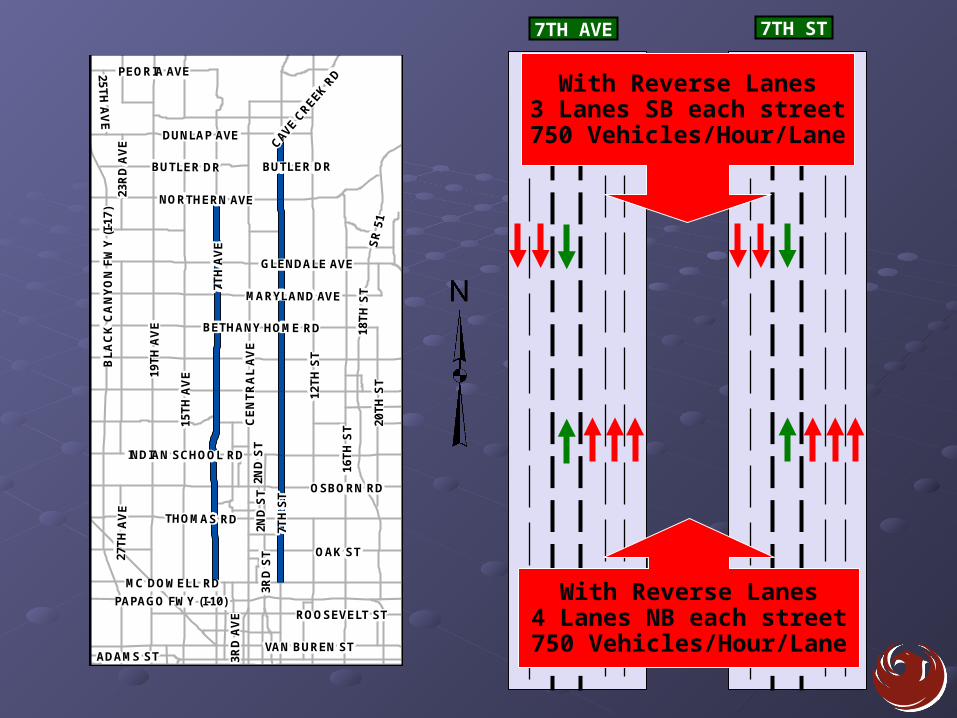
³7TH AVE
³7TH ST
With Reverse Lanes4 Lanes NB each street750 Vehicles/Hour/Lane
With Reverse Lanes3 Lanes SB each street750 Vehicles/Hour/Lane
7T
H S
T
SR
51
7T
H A
VE
19
TH
AV
E
16
TH
ST1
5T
H A
VE
12
TH
ST
CE
NT
RA
L A
VE
27
TH
AV
E
3R
D S
T
THOMAS RD
OSBORN RD
20
TH
ST
VAN BUREN ST
BL
AC
K C
AN
YO
N F
WY
(I-
17
)
MC DOWELL RD
OAK ST
GLENDALE AVE
DUNLAP AVE
NORTHERN AVE
INDIAN SCHOOL RD
PAPAGO FWY (I-10)
MARYLAND AVE
BETHANY HOME RD
PEORIA AVE
23
RD
AV
E
BUTLER DR
ROOSEVELT ST
3R
D A
VE
ADAMS ST
25
TH
AV
E
CAVE CR
EEK R
D
18
TH
ST
2N
D S
T
BUTLER DR
2N
D S
T
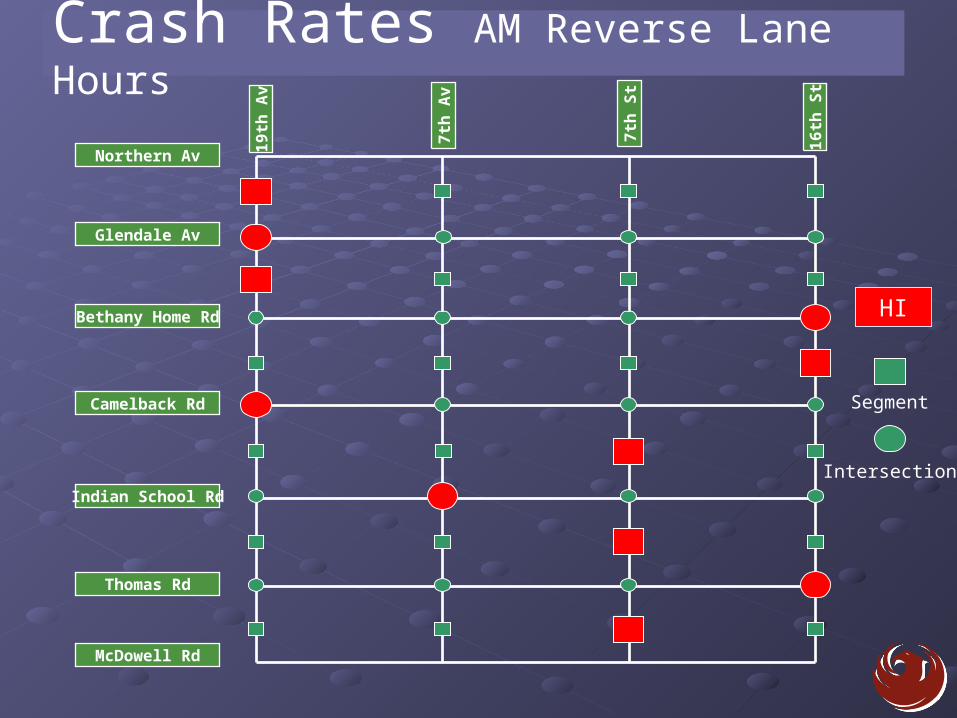
Crash Rates AM Reverse Lane Hours
Northern Av
Glendale Av
Bethany Home Rd
Camelback Rd
Indian School Rd
Thomas Rd
McDowell Rd
16th
St
7th
St
7th
Av
19th
Av
HI
Segment
Intersection
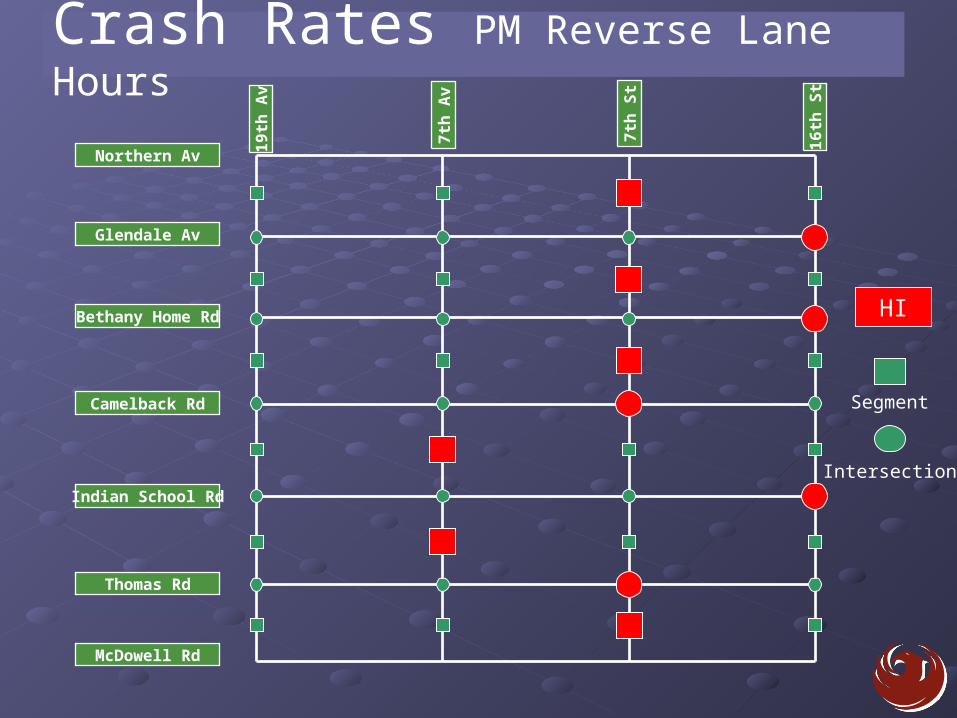
Northern Av
Glendale Av
Bethany Home Rd
Camelback Rd
Indian School Rd
Thomas Rd
McDowell Rd
16th
St
7th
St
7th
Av
19th
Av
HI
Segment
Intersection
Crash Rates PM Reverse Lane Hours
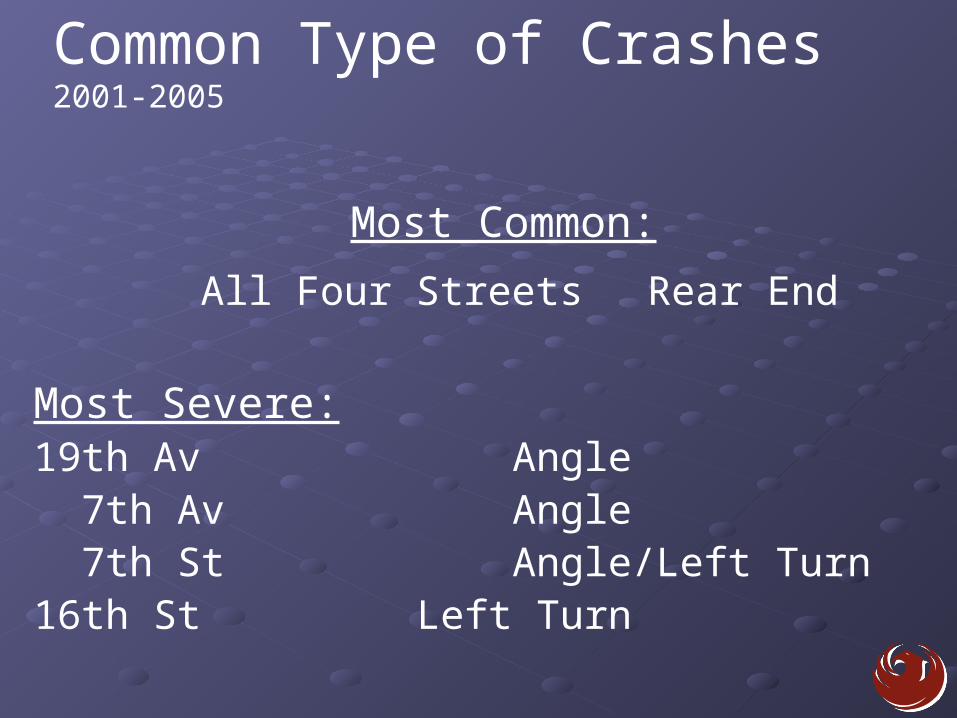
Common Type of Crashes2001-2005
Most Common:
All Four Streets Rear End
Most Severe:19th Av Angle 7th Av Angle 7th St Angle/Left Turn16th St Left Turn
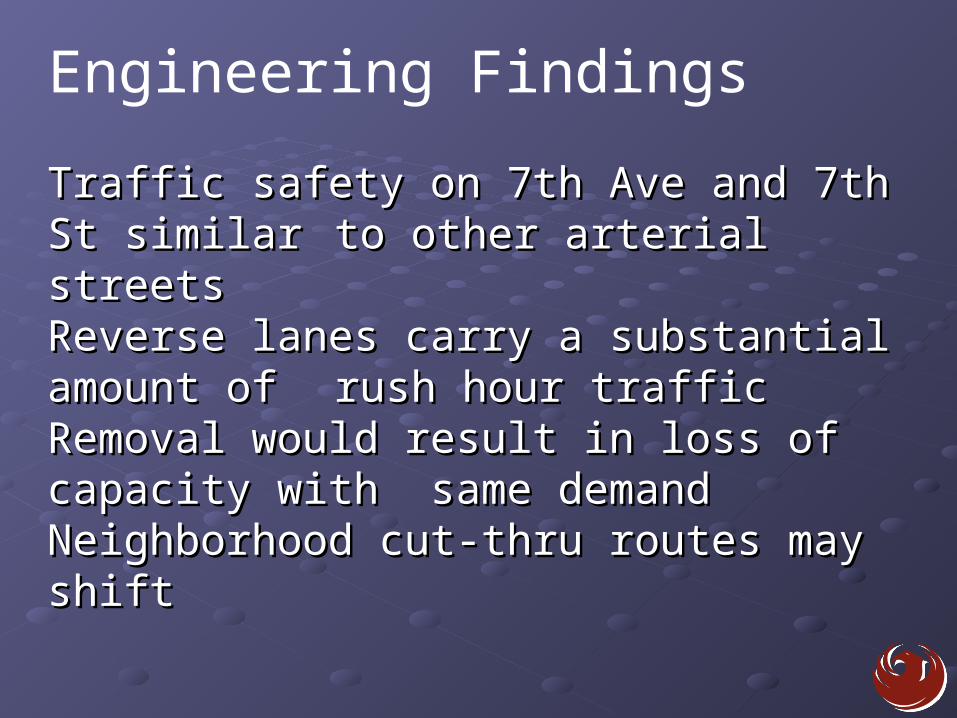
Engineering Findings
Traffic safety on 7th Ave and 7th St Traffic safety on 7th Ave and 7th St similar similar to other arterial streetsto other arterial streetsReverse lanes carry a substantial amount Reverse lanes carry a substantial amount of of rush hour trafficrush hour trafficRemoval would result in loss of capacity Removal would result in loss of capacity with with same demandsame demandNeighborhood cut-thru routes may shiftNeighborhood cut-thru routes may shift
Quality of Life Findings
Central Neighborhoods:Central Neighborhoods:Generally in favor of removing reverse lanes
Many felt: Reverse lanes inhibit accessLanes are unsafe and signs are
confusing
Northern Neighborhoods:Northern Neighborhoods:Generally in favor of keeping reverse lanes
Many felt: Lanes are safe and reduce travel
timeReverse lane signs are
understandable
City Council Action
Form citizen Ad hoc Task Force to work with City staff to review all available studies conducted on the reverse lane issue, consider new alternatives and, through consensus, bring forth written recommendations to the City Council
Task Force Recommendations
If reverse lanes remain, the task force recommends that the City should:
Improve reverse lane signingIncluding time-of-operation lights/beacons
Increase enforcement Implement new education campaign Explore school crossing opportunities and new
bus bays Explore additional left turn opportunities at
some signalized intersections Estimated cost of changes $4-6,000,000
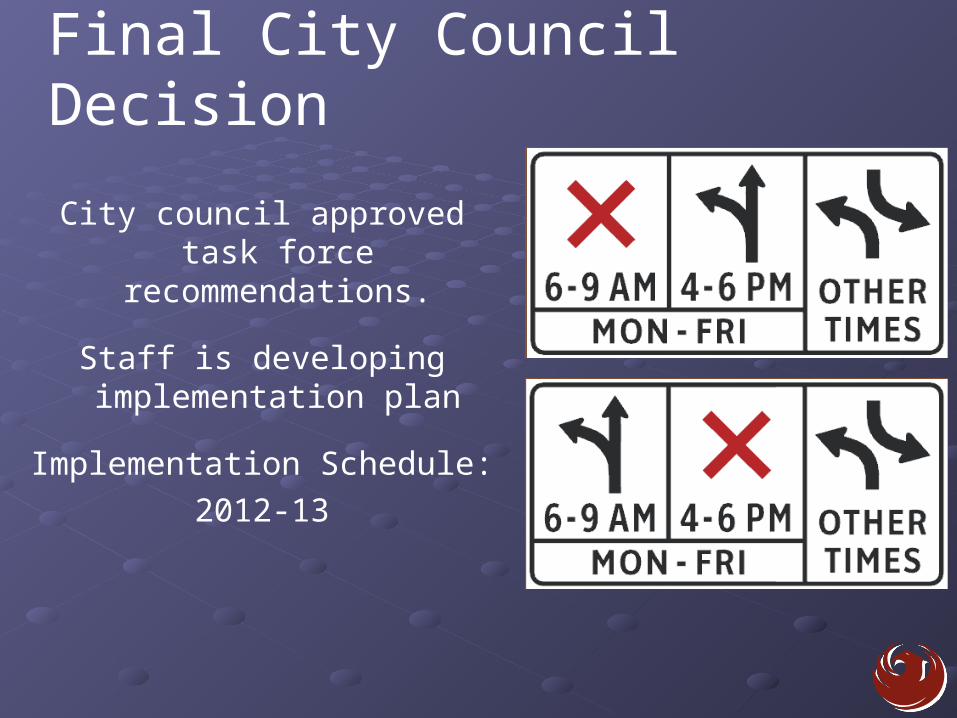
Final City Council Decision
City council approved task force recommendations.
Staff is developing implementation plan
Implementation Schedule: 2012-13
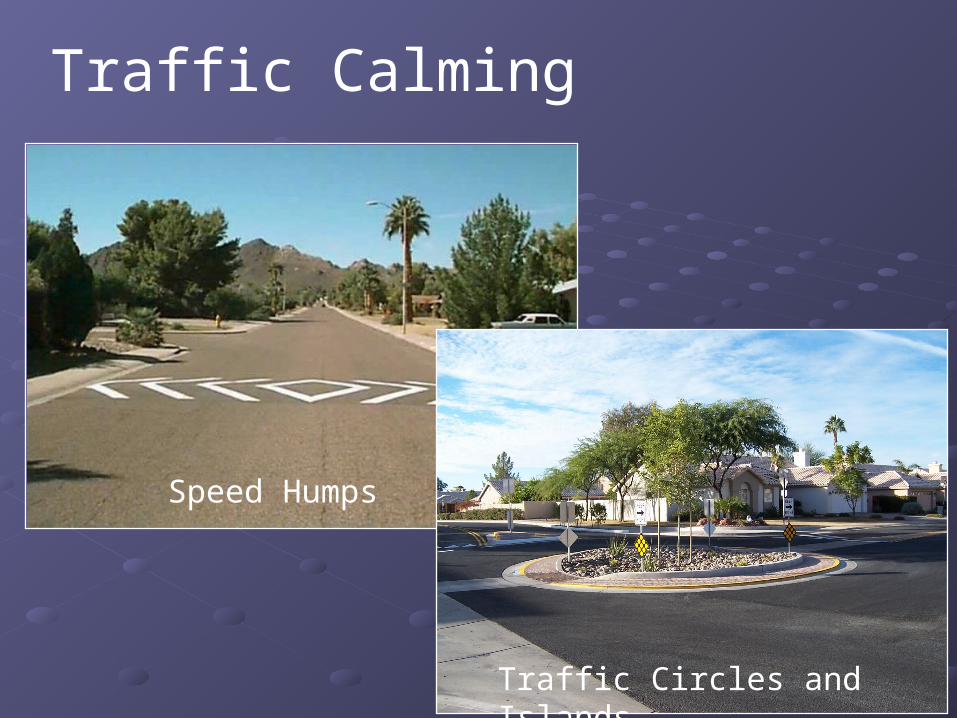
Traffic Calming
Speed Humps
Traffic Circles and Islands
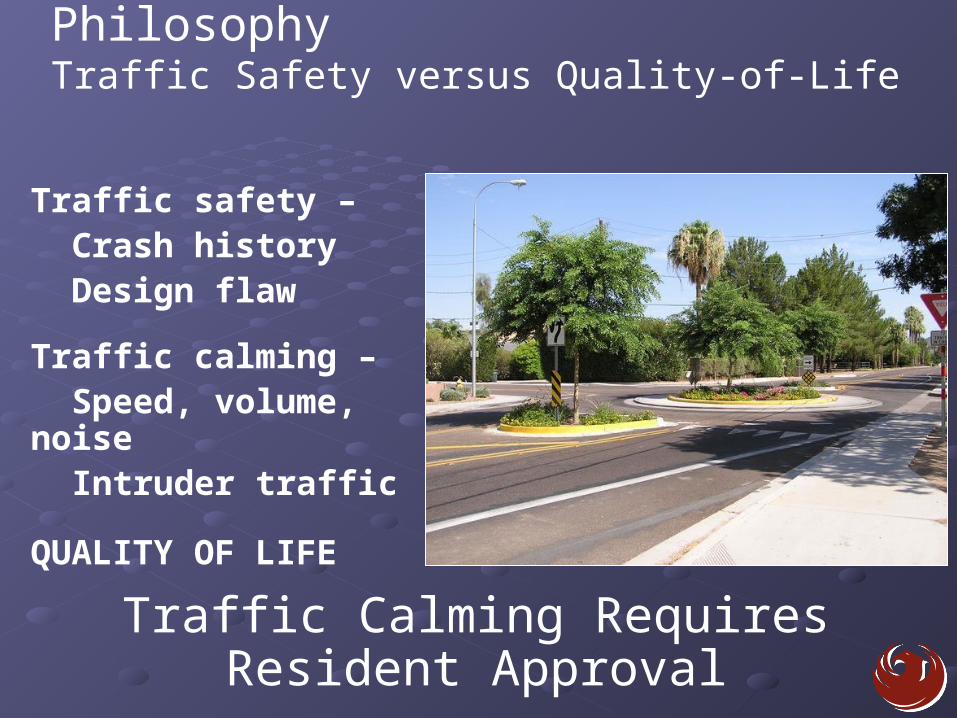
PhilosophyTraffic Safety versus Quality-of-Life
Traffic safety – Crash history Design flaw
Traffic calming – Speed, volume, noise Intruder traffic
QUALITY OF LIFE
Traffic Calming Requires Resident Approval
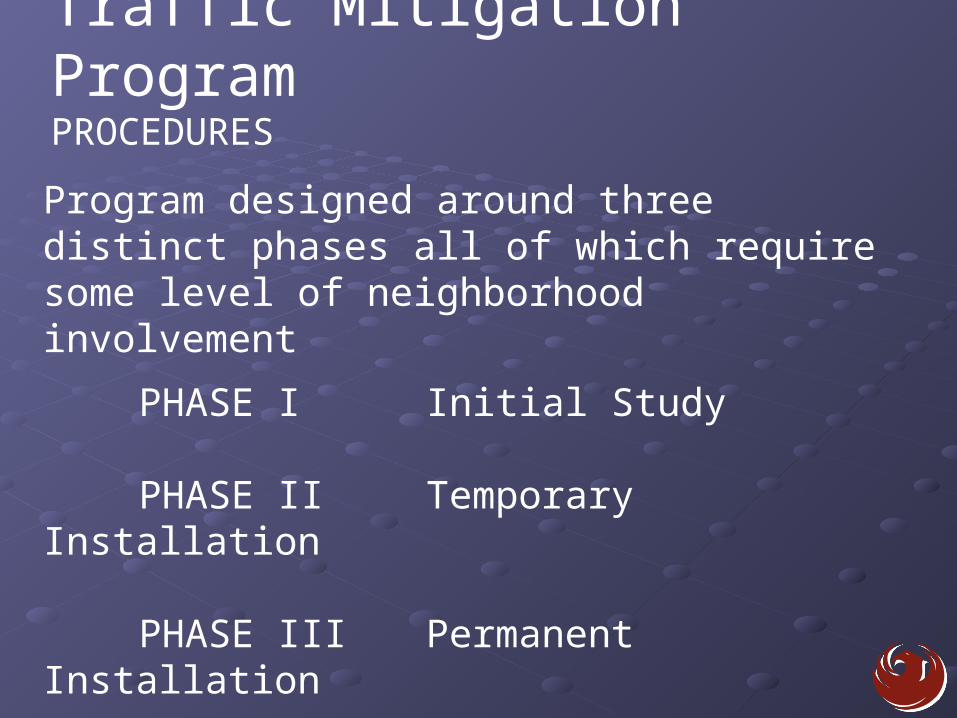
Traffic Mitigation ProgramPROCEDURES
Program designed around three distinct phases all of which require some level of neighborhood involvement
PHASE I Initial Study
PHASE II Temporary Installation
PHASE III Permanent Installation
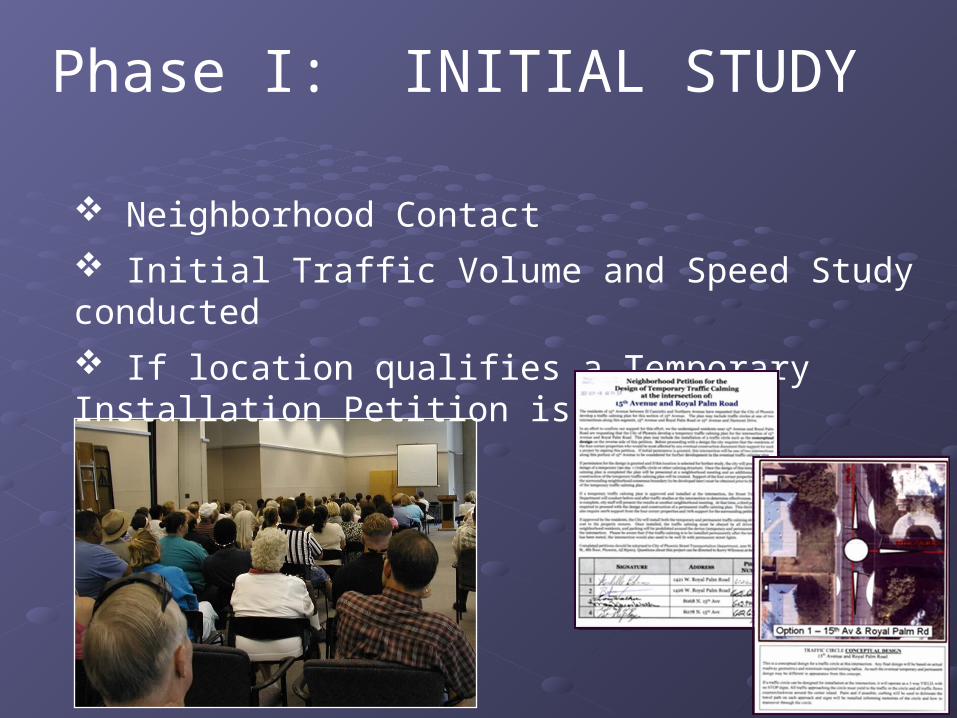
Phase I: INITIAL STUDY
Neighborhood Contact Initial Traffic Volume and Speed Study conducted If location qualifies a Temporary Installation Petition is developed
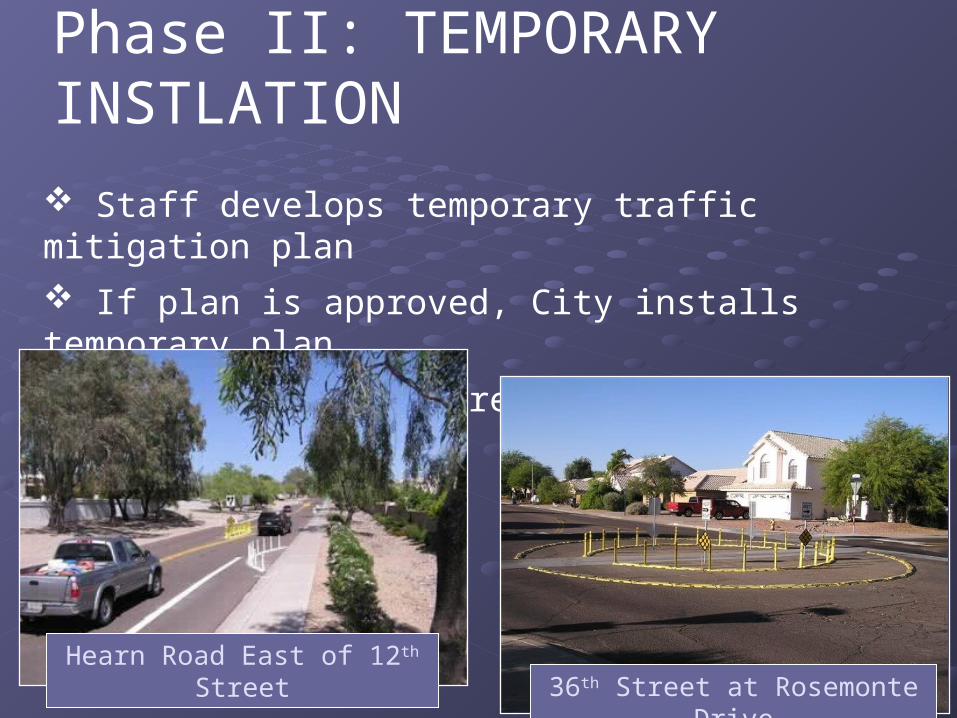
Phase II: TEMPORARY INSTLATION
Staff develops temporary traffic mitigation plan If plan is approved, City installs temporary plan Traffic patterns are studied
36th Street at Rosemonte DriveHearn Road East of 12th Street
Phase III: PERMANENT INSTALLATION
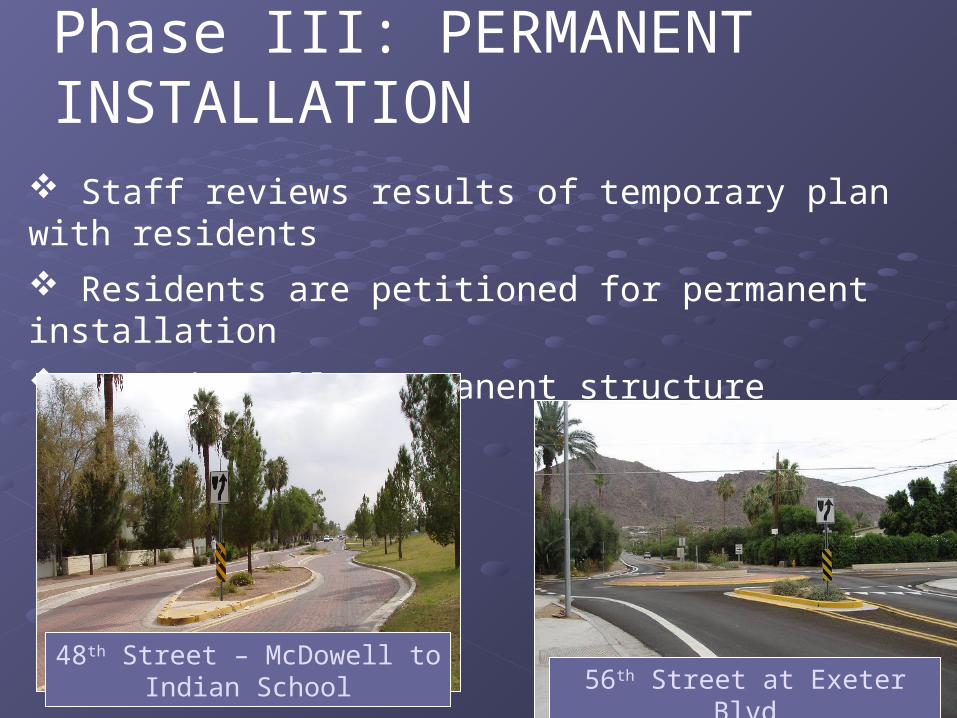
Staff reviews results of temporary plan with residents Residents are petitioned for permanent installation City installs permanent structure
48th Street – McDowell to Indian School 56th Street at Exeter Blvd
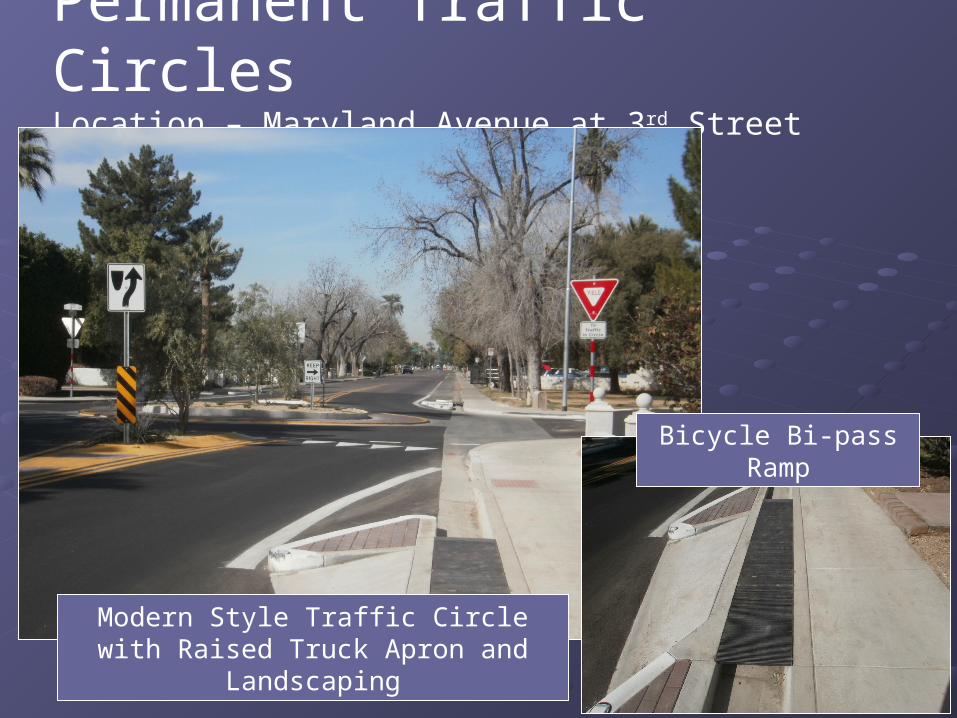
Permanent Traffic CirclesLocation – Maryland Avenue at 3rd Street
Bicycle Bi-pass Ramp
Modern Style Traffic Circle with Raised Truck Apron and
Landscaping
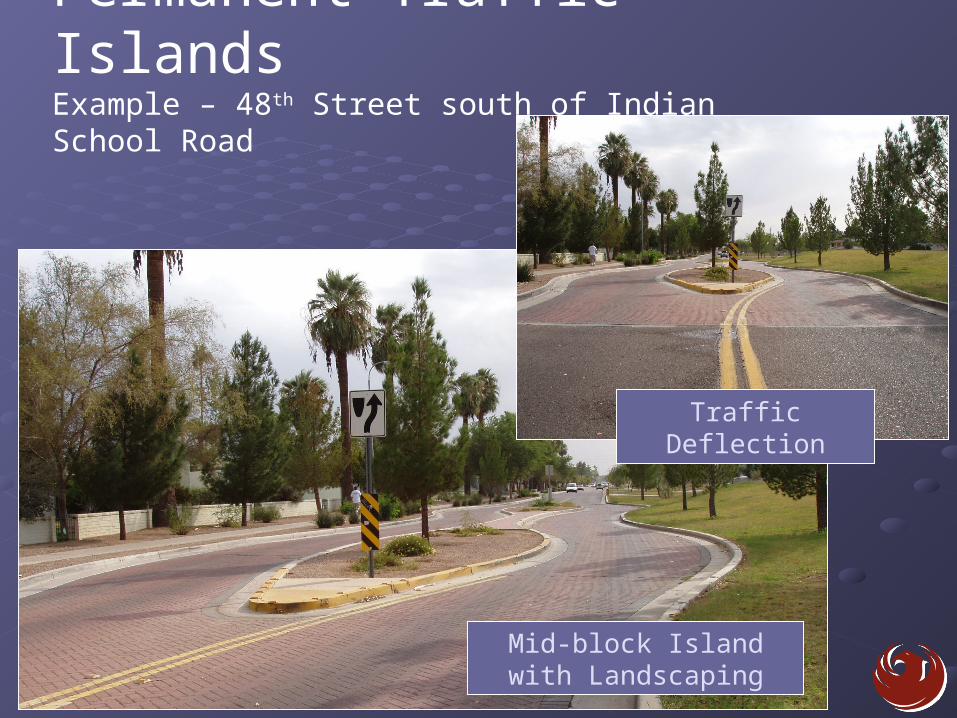
Permanent Traffic Islands Example – 48th Street south of Indian School Road
Mid-block Island with Landscaping
Traffic Deflection
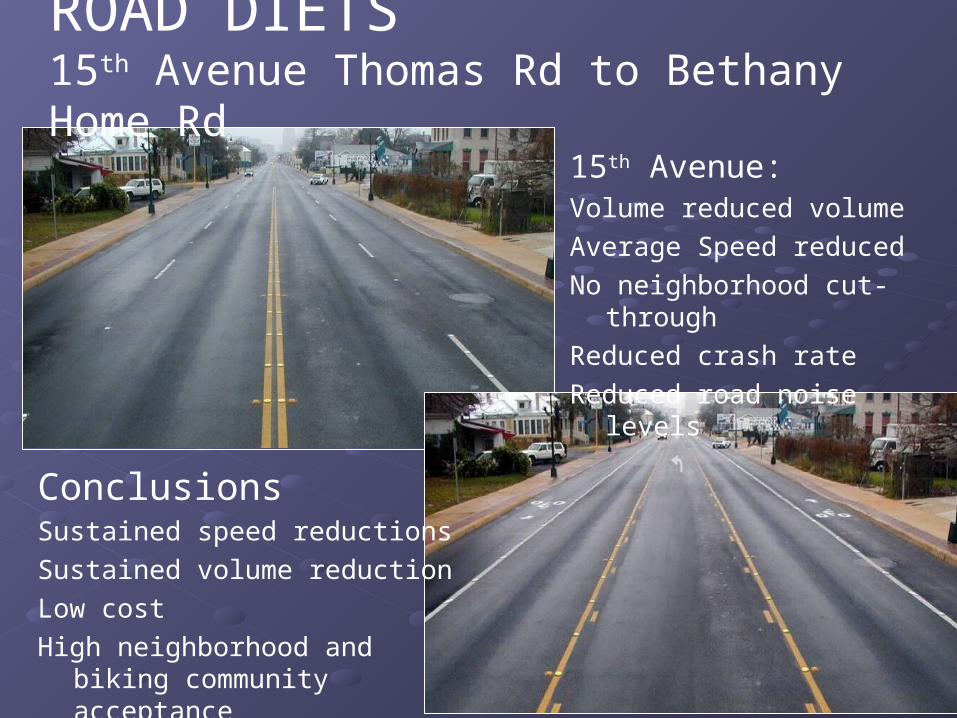
ROAD DIETS15th Avenue Thomas Rd to Bethany Home Rd
15th Avenue:Volume reduced volumeAverage Speed reducedNo neighborhood cut-
through Reduced crash rateReduced road noise levels
ConclusionsSustained speed reductionsSustained volume reductionLow cost High neighborhood and biking
community acceptance
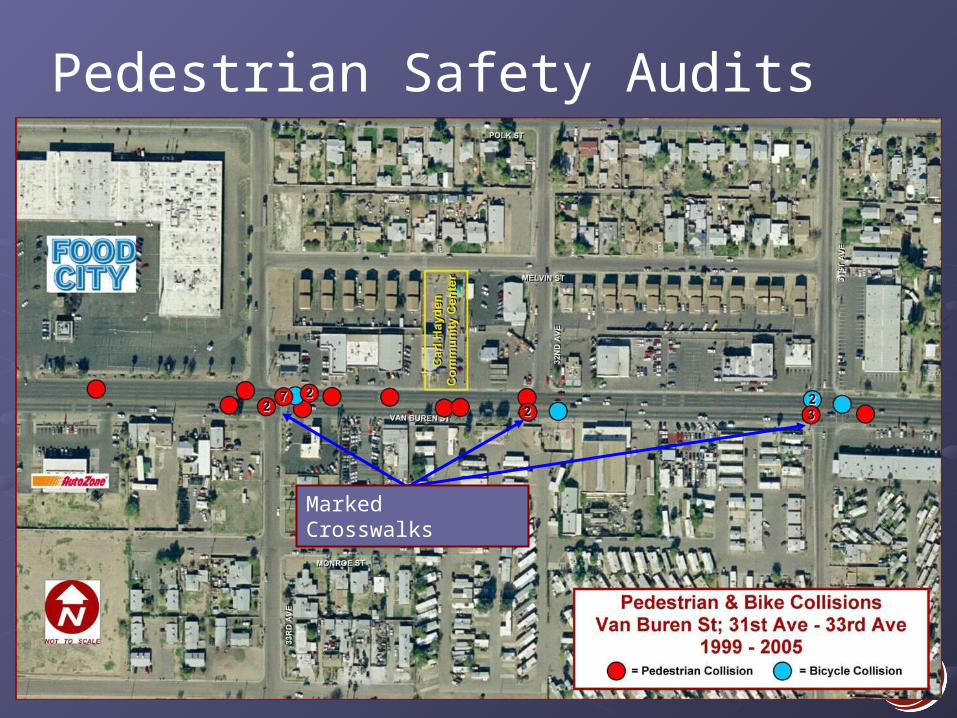
Pedestrian Safety Audits
Marked Crosswalks
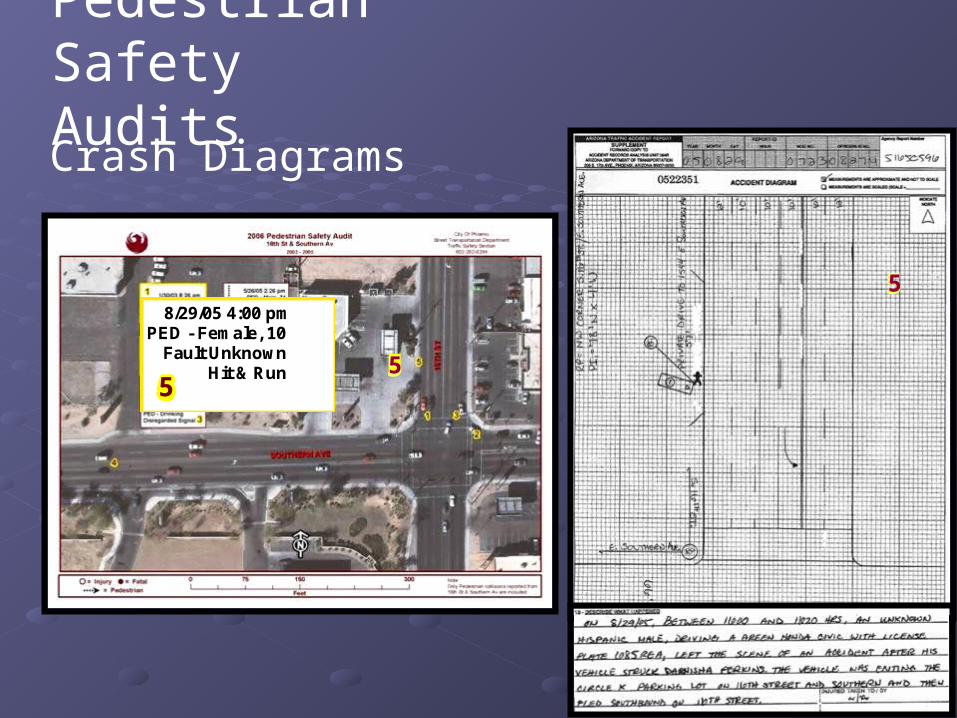
Crash Diagrams
55
5
8/29/05 4:00 pmPED - Female, 10
Fault UnknownHit & Run
Pedestrian Safety Audits
55
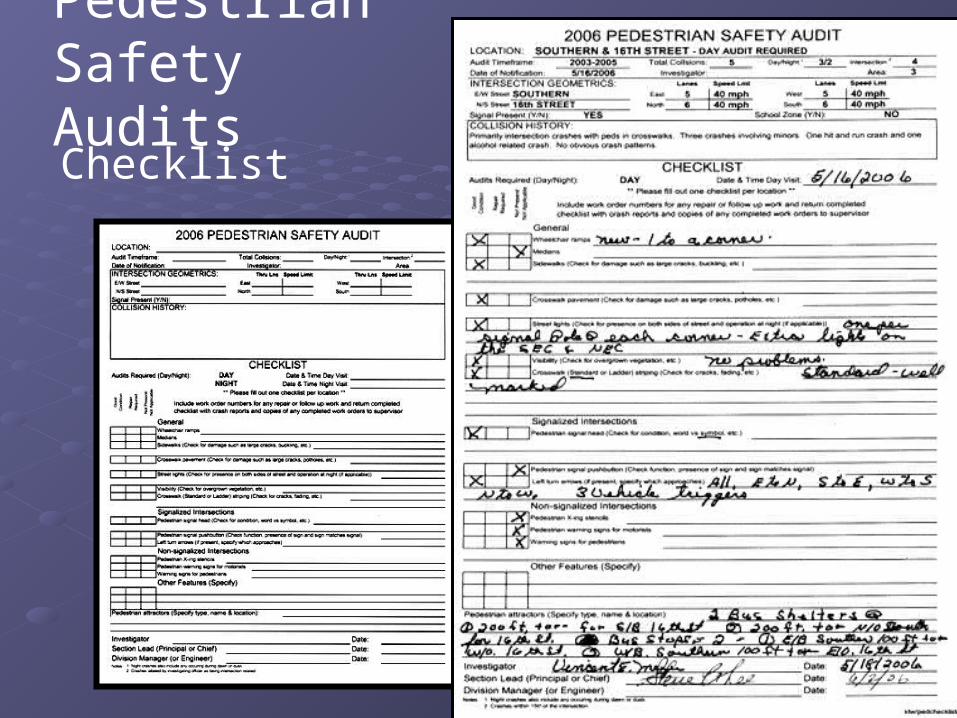
Checklist
Pedestrian Safety Audits
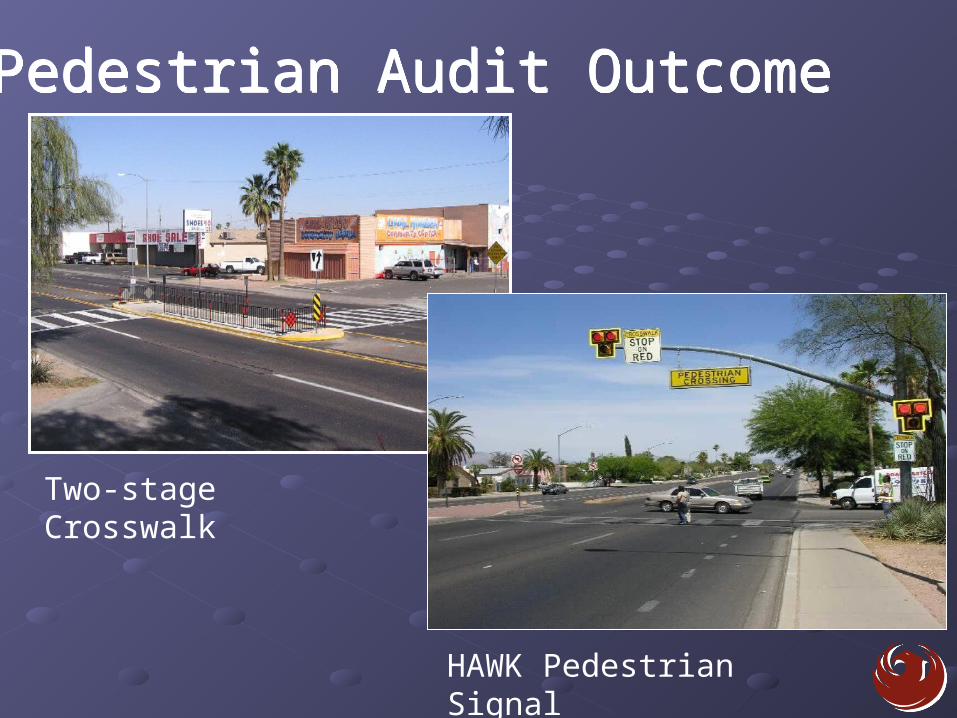
Pedestrian Audit OutcomePedestrian Audit Outcome
Two-stage Crosswalk
HAWK Pedestrian Signal
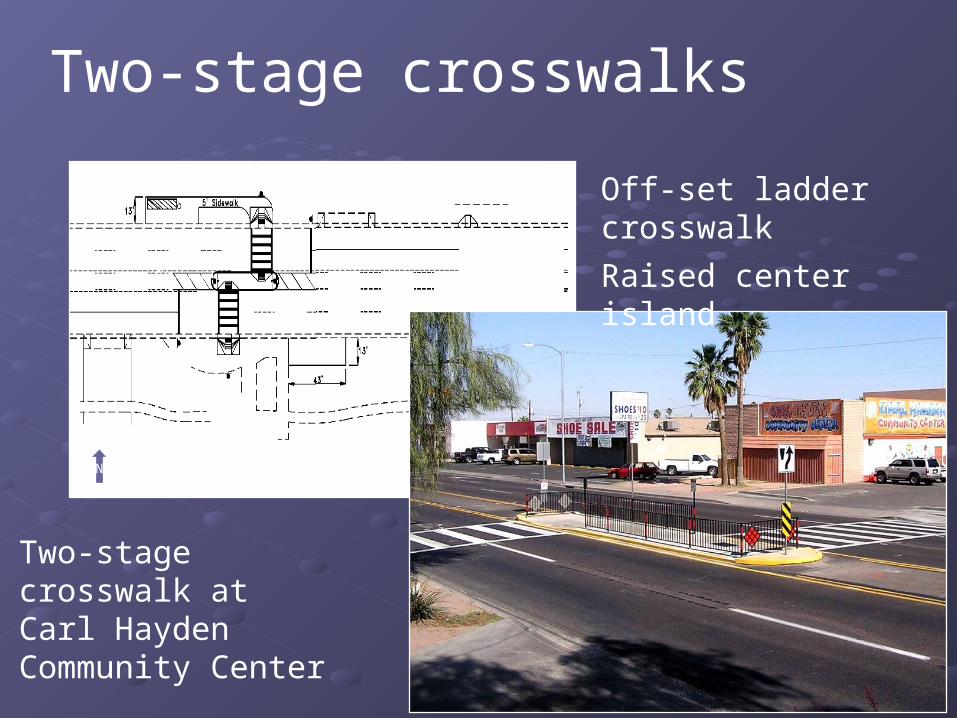
Two-stage crosswalks
Buckeye Rd
13th
St
N
Off-set ladder crosswalk
Raised center island
Two-stage crosswalk at Carl Hayden Community Center
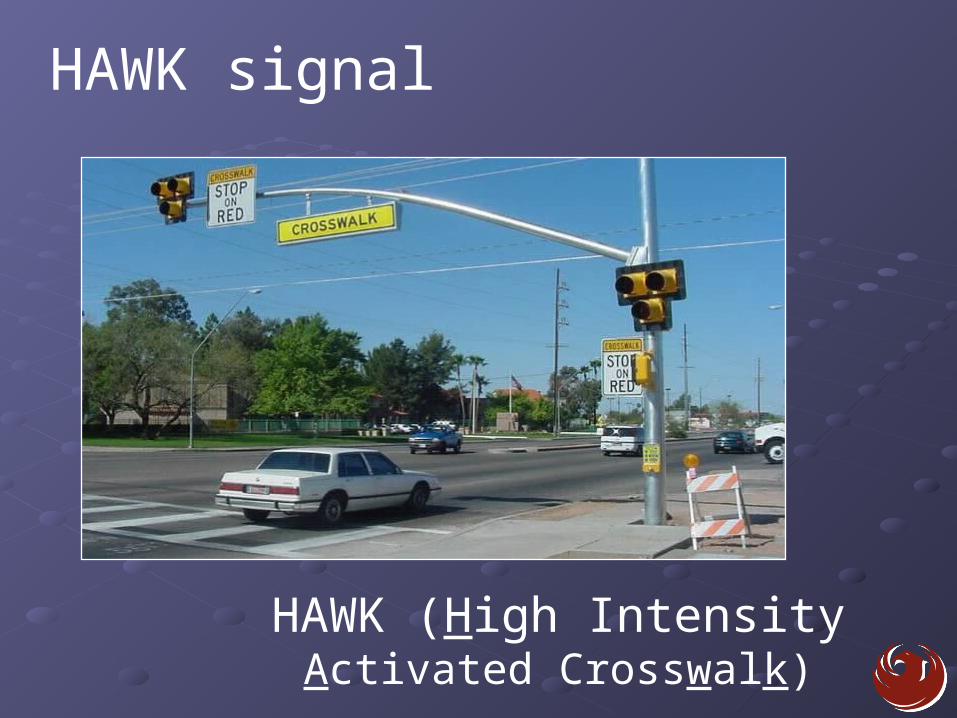
HAWK (High Intensity Activated Crosswalk)
HAWK signal
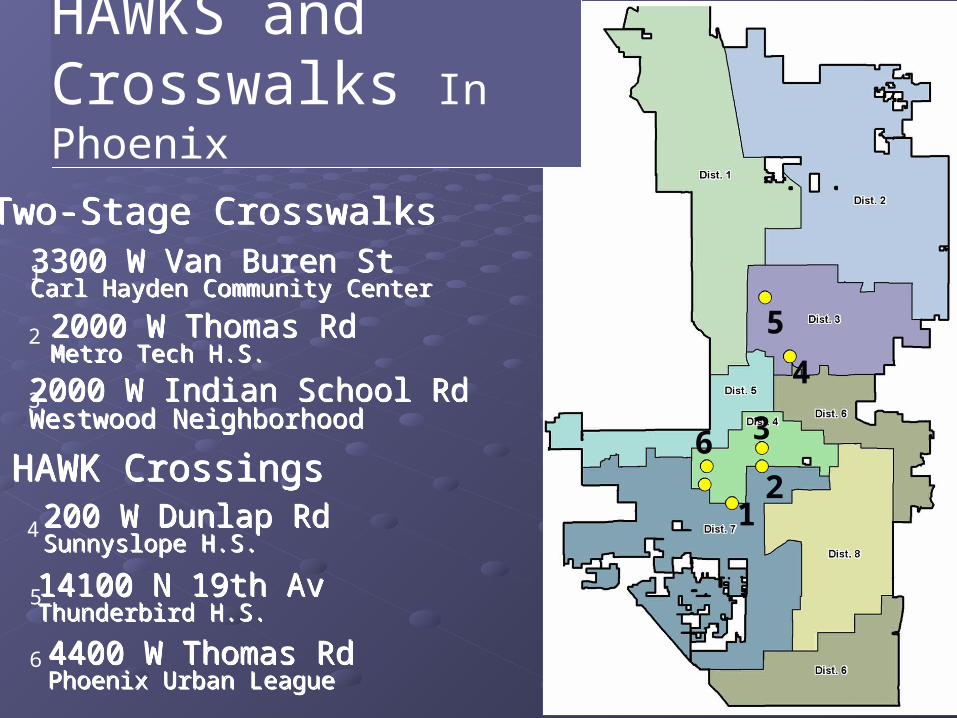
14100 N 19th AvThunderbird H.S.14100 N 19th AvThunderbird H.S.
4400 W Thomas RdPhoenix Urban League4400 W Thomas RdPhoenix Urban League
2000 W Thomas RdMetro Tech H.S.2000 W Thomas RdMetro Tech H.S.
3300 W Van Buren StCarl Hayden Community Center3300 W Van Buren StCarl Hayden Community Center
Two-Stage CrosswalksTwo-Stage Crosswalks
200 W Dunlap RdSunnyslope H.S.200 W Dunlap RdSunnyslope H.S.
2000 W Indian School RdWestwood Neighborhood2000 W Indian School RdWestwood Neighborhood
HAWK CrossingsHAWK Crossings
1
4
6
2
5
3
2
4
3
1
6
5
HAWKS and Crosswalks In Phoenix
HAWKS and Crosswalks In Phoenix
Questions?Questions?Kerry WilcoxonKerry WilcoxonStreet Transportation – Safety and Street Transportation – Safety and
Neighborhood Traffic SectionNeighborhood Traffic [email protected]


![aPres 20150315 LifeSavers ColAvd [Read-Only]](https://img.pdfslide.us/doc/110x75/620c75044e9ca3785c63e8f4/apres-20150315-lifesavers-colavd-read-only.jpg)