Embed Size (px)
Citation preview
TAPESTRYSEGMENTATION
TM
esri.com/tapestry
Households: 1,824,900
Average Household Size: 3.19
Median Age: 32.5
Median Household Income: $50,900
LifeMode Group: Ethnic Enclaves
American Dreamers
WHO ARE WE?Located throughout the South and West, most American Dreamers residents own their own homes, primarily single-family housing—farther out of the city, where housing is more affordable. Median household income is slightly below average (Index 91). The majority of households include younger married-couple families with children and, frequently, grandparents. Diversity is high; many residents are foreign born, of Hispanic origin. Hard work and sacrifice have improved their economic circumstance as they pursue a better life for themselves and their family. Spending is focused more on the members of the household than the home. Entertainment includes multiple televisions, movie rentals, and video games at home or visits to theme parks and zoos. This market is connected and adept at accessing what they want from the Internet.
OUR NEIGHBORHOOD• American Dreamers residents are family-centric and diverse. Most are married couples with children of all ages or single parents; multigenerational homes are common (Index 201).
• Average household size is higher at 3.19 (Index 123).
• Residents tend to live further out from urban centers—more affordable single-family homes and more elbow room.
• Tenure is slightly above average with 64% owner occupancy; primarily single-family homes with more mortgages (Index 114) and slightly higher monthly costs (Index 115).
• Three quarters of all housing were built since 1970.
• Many neighborhoods are located in the urban periphery of the largest metropolitan areas across the South and West.
• Most households have one or two vehicles available and a longer commute to work.
SOCIOECONOMIC TRAITS• While nearly 17% have earned a college degree, the majority, or 63%, hold a high school diploma only or spent some time at a college or university.
• Unemployment is higher at 7.4% (Index 136); labor force participation is also higher at 66%.
• Most American Dreamers residents derive income from wages or salaries, but the rate of poverty is a bit higher in this market (Index 116).
• They tend to spend money carefully and focus more on necessities.
• They are captivated by new technology, particularly feature-rich smartphones.
• Connected: They use the Internet primarily for socializing but also for convenience, like paying bills online.
Note: The Index represents the ratio of the segment rate to the US rate multiplied by 100. Consumer preferences are estimated from data by GfK MRI.
7C
85+80–8475–7970–7465–6960–6455–5950–5445–4940–4435–3930–3425–2920–2415–1910–14
5–9<5
8% 4% 0 4% 8%
Male Female
Median Household Income
Median Net Worth
$56,100
$93,300
$50,900
$59,400
$0 $100,000 $200,000 $300,000 $400,000 $500,000 $600,000
EsriMedianHHIncome
EsriMedianNetWorth
Series2 Series1
$56,100
$93,300
$50,900
$59,400
$0 $100,000 $200,000 $300,000 $400,000 $500,000 $600,000
EsriMedianHHIncome
EsriMedianNetWorth
Series2 Series1
Housing
Food
Apparel & Services
Transportation
Health Care
Entertainment & Recreation
Education
Pensions & Social Security
Other
0.0% 0.5% 1.0% 1.5% 2.0% 2.5% 3.0% 3.5% 4.0% 4.5% 5.0%
MaleAge0-4
MaleAge5-9
MaleAge10-14
MaleAge15-19
MaleAge20-24
MaleAge25-29
MaleAge30-34
MaleAge35-39
MaleAge40-44
MaleAge45-49
MaleAge50-54
MaleAge55-59
MaleAge60-64
MaleAge65-69
MaleAge70-74
MaleAge75-79
MaleAge80-84
MaleAge85+
AgebySex- Male
Series2 Series1
0.0% 0.5% 1.0% 1.5% 2.0% 2.5% 3.0% 3.5% 4.0% 4.5%
FemaleAge0-4
FemaleAge5-9
FemaleAge10-14
FemaleAge15-19
FemaleAge20-24
FemaleAge25-29
FemaleAge30-34
FemaleAge35-39
FemaleAge40-44
FemaleAge45-49
FemaleAge50-54
FemaleAge55-59
FemaleAge60-64
FemaleAge65-69
FemaleAge70-74
FemaleAge75-79
FemaleAge80-84
FemaleAge85+
ChartTitle
Series2 Series1
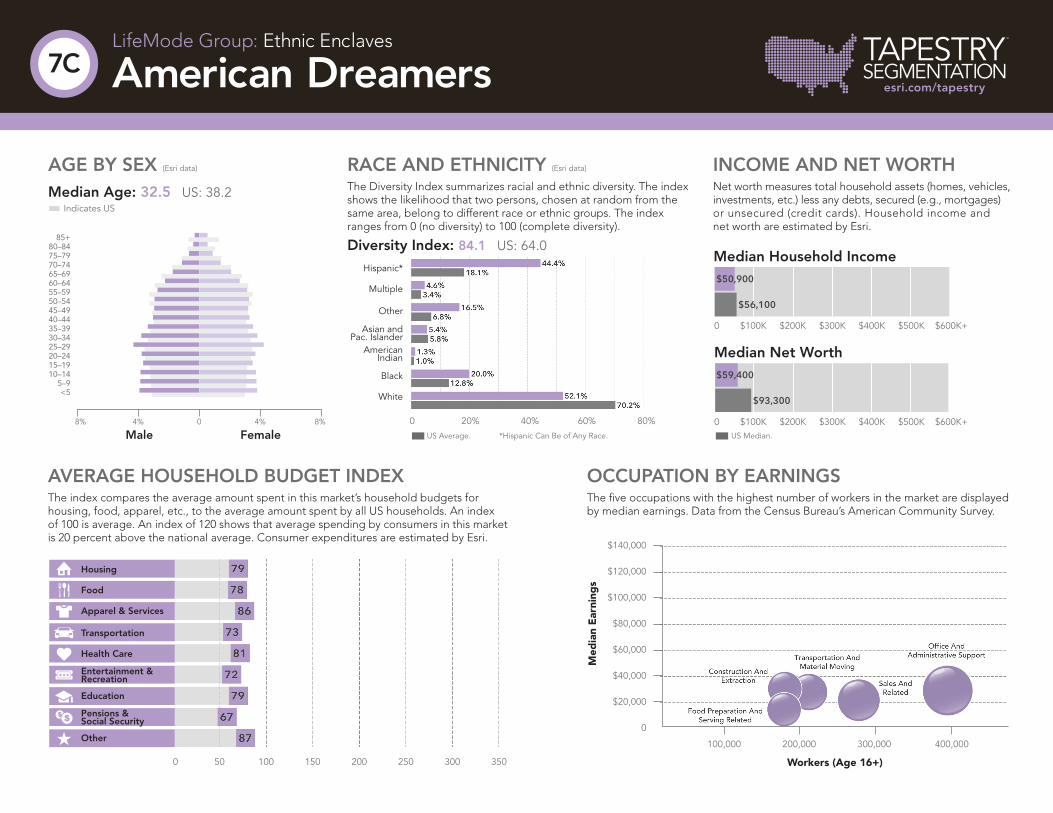
INCOME AND NET WORTHNet worth measures total household assets (homes, vehicles, investments, etc.) less any debts, secured (e.g., mortgages) or unsecured (credit cards). Household income and net worth are estimated by Esri.
OCCUPATION BY EARNINGSThe five occupations with the highest number of workers in the market are displayed by median earnings. Data from the Census Bureau’s American Community Survey.
AVERAGE HOUSEHOLD BUDGET INDEXThe index compares the average amount spent in this market’s household budgets for housing, food, apparel, etc., to the average amount spent by all US households. An index of 100 is average. An index of 120 shows that average spending by consumers in this market is 20 percent above the national average. Consumer expenditures are estimated by Esri.
AGE BY SEX (Esri data)
Median Age: 32.5 US: 38.2 Indicates US
RACE AND ETHNICITY (Esri data)
The Diversity Index summarizes racial and ethnic diversity. The index shows the likelihood that two persons, chosen at random from the same area, belong to different race or ethnic groups. The index ranges from 0 (no diversity) to 100 (complete diversity).
Diversity Index: 84.1 US: 64.0
Hispanic*
Multiple
Other
Asian and Pac. Islander
American Indian
Black
White
$140,000
$120,000
$100,000
$80,000
$60,000
$40,000
$20,000
0
100,000 2 200,000 6 300,000 400,000
*Hispanic Can Be of Any Race.
0 20% 40% 60% 80%
0 50 100 150 200 250 300 350
0 $100K $200K $300K $400K $500K $600K+
0 $100K $200K $300K $400K $500K $600K+US Average. US Median.
Med
ian
Ear
ning
s
Workers (Age 16+)
TAPESTRYSEGMENTATION
TM
esri.com/tapestry
LifeMode Group: Ethnic Enclaves
American Dreamers7C
Own63.7%
Rent36.3%
ChartTitle
Own Rent
HomeOwnershipUS Percentage:
62.7% Own 37.3% Rent
Population
Population Growth (Annual %)
Population Density (Persons per sq. mile)
350
350
350
0
0
0
900,000
-0.5%
0
11,000,000
3.0%
25,000
5,856,600
1.0%
1000
Wealth Index
Socioeconomic Status Index
Housing Affordability Index
55
85
16848
TAPESTRYSEGMENTATION
TM
esri.com/tapestry
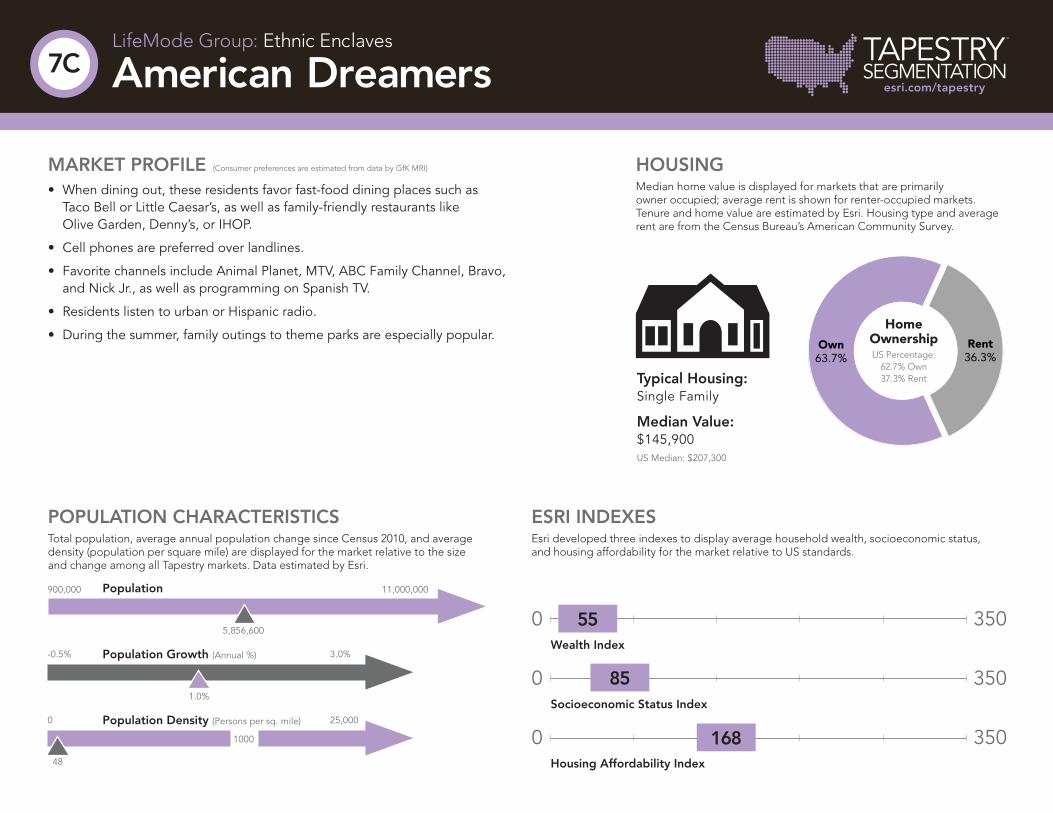
MARKET PROFILE (Consumer preferences are estimated from data by GfK MRI)
• When dining out, these residents favor fast-food dining places such as Taco Bell or Little Caesar’s, as well as family-friendly restaurants like Olive Garden, Denny’s, or IHOP.
• Cell phones are preferred over landlines.
• Favorite channels include Animal Planet, MTV, ABC Family Channel, Bravo, and Nick Jr., as well as programming on Spanish TV.
• Residents listen to urban or Hispanic radio.
• During the summer, family outings to theme parks are especially popular.
ESRI INDEXESEsri developed three indexes to display average household wealth, socioeconomic status, and housing affordability for the market relative to US standards.
POPULATION CHARACTERISTICSTotal population, average annual population change since Census 2010, and average density (population per square mile) are displayed for the market relative to the size and change among all Tapestry markets. Data estimated by Esri.
LifeMode Group: Ethnic Enclaves
American Dreamers7C
HOUSINGMedian home value is displayed for markets that are primarily owner occupied; average rent is shown for renter-occupied markets. Tenure and home value are estimated by Esri. Housing type and average rent are from the Census Bureau’s American Community Survey.
Typical Housing:Single Family
Median Value:$145,900US Median: $207,300
High
Low
TAPESTRYSEGMENTATION
TM
esri.com/tapestry
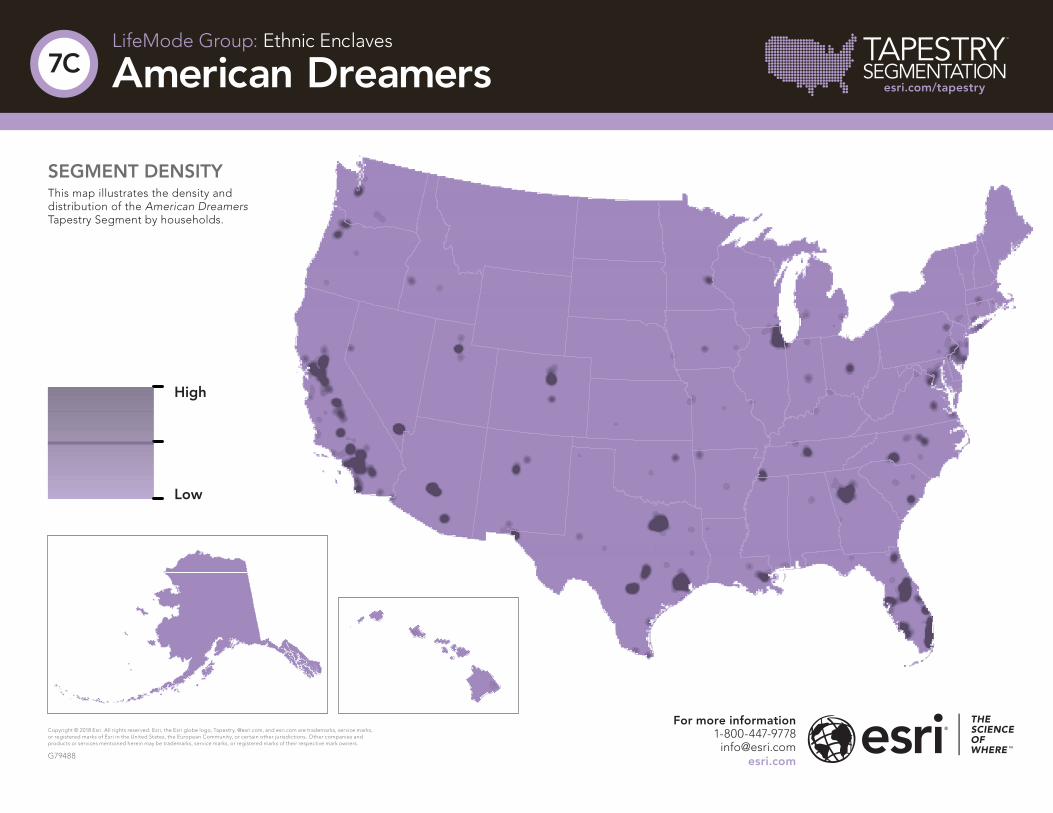
SEGMENT DENSITYThis map illustrates the density and distribution of the American Dreamers Tapestry Segment by households.
LifeMode Group: Ethnic Enclaves
American Dreamers7C
For more information1-800-447-9778
Copyright © 2018 Esri. All rights reserved. Esri, the Esri globe logo, Tapestry, @esri.com, and esri.com are trademarks, service marks, or registered marks of Esri in the United States, the European Community, or certain other jurisdictions. Other companies and products or services mentioned herein may be trademarks, service marks, or registered marks of their respective mark owners.
G79488