Embed Size (px)
Citation preview

Lifecourse Epidemiology:Relevance for Studying Health Disparities in Cognitive Aging
Maria GlymourFriday Harbor Psychometrics Workshop
June 12, 2012

2Friday Harbor Psychometrics Workshop 2010
Acknowledgements
• Funded in part by Grant R13AG030995-01A1 from the National Institute on Aging
• The views expressed in written conference materials or publications and by speakers and moderators do not necessarily reflect the official policies of the Department of Health and Human Services; nor does mention by trade names, commercial practices, or organizations imply endorsement by the U.S. Government.

3
Organization
• Motivating questions in lifecourse epidemiology
• Causation vs statistical association
• Drawing and using DAGs
• Biases of special concern in studying racial disparities and cognitive aging– Survivor bias
– Baseline adjustment
– Adjusting for mediators

4
Organization
• Motivating questions in lifecourse epidemiology
• Causation vs statistical association
• Drawing and using DAGs
• Biases of special concern in studying racial disparities and cognitive aging– Survivor bias
– Baseline adjustment
– Adjusting for mediators

5
Epidemiology is a core tool in public health
• We want to improve health– Basic knowledge about how things work help improve health but is not
the fundamental motivation
• Our questions always come down to something like
“Would changing some exposure/treatment X improve some health outcome Y?”
– Caveats: Some people ask strictly clinical prediction questions like “How likely is this person with characteristic X to keel over in the next few years?”, to either warn the person or take aggressive preventive action.
– Some people focus on surveillance (“Y is much more common in recent years.”) but that is usually to motivate us to do something to reduce the incidence of Y.

6
Lifecourse Epidemiology
• Is the study of how exposures at one point in life (fetal development, early childhood, adolescence, early adulthood) influence health outcomes much later in life.
• Basic models:– Immediate risk: lightning strikes.
– Cumulative risk: you overeat every day and you become more and more obese
– Critical/sensitive period: exposure matters most at a critical developmental period (e.g.,: learning birdsong, or becoming a smoker)
– Trajectory models: any specific levels of exposure would be fine, but it’s a big problem to change (e.g.,: altitude sickness (??))

7
Why do we care?
• Understanding this helps establish when you can intervene to prevent disease development.
• For cerebrovascular disease, some risk is probably incurred very early in life, although we do not know if this is because– learned behavioral patterns (smoking initiation typically in teens)
– a trajectory that later exposes you to risk (poor school poor diet diabetes/poor medical care), or
– physiologic changes that are already causing physiologic damage in early life (vascular development, hypertension, obesity).
• Regardless, early exposures can increase risk of physiologic event of acute stroke much later in life.
• For AD? Very strong evidence that education affects performance on tests of memory and EF.

8
Why do we care?
• We want to know “if we• Increased education
• Taught a 2nd language
• Gave more money
• Provided a more interesting job
Would this person (people) have lower risk of cognitive decline?
• We want to plan an intervention that will improve outcomes.

9
Why do we care?
• Some “exposures” we do not imagine intervening to change (e.g., race, sex, geography)– we are primarily interested in what mediates the association so we can intervene on the mediating pathway:
• How to intervene if: Female sex fertility time away from work lower salary
vs
Female sex sexual harassment time away from work lower salary

10
Social Exposures Become Physically Embedded Across the Lifecourse
• Krieger calls this “embodiment”: something outside the body – how other people treat you, the school you attend, the work you do, the place you live, the kinds of medical care you get, who you marry, who you have sex with, – gets inside the body and changes your risk of disease.
• Link and Phelan identify “fundamental” causes of disease as factors that enable you to command health promoting resources no matter what health threats you may face – whether tuberculosis or myocardial infarction.
• What does race affect? What does education affect?– These factors are so profound they affect almost every aspect of life from
before you are born until the day of your death and they pattern almost every health outcome.

11
Organization
• Motivating questions in lifecourse epidemiology
• Causation vs statistical association
• Drawing and using DAGs
• Biases of special concern in studying racial disparities and cognitive aging– Survivor bias
– Baseline adjustment
– Adjusting for mediators

12
Causal Inference
Very commonly, we wish to know about causal relations…
If we changed X, would Y also change?
But we observe only statistical associations…
People with high values of X also have high values of Y.

13
Statistical versus Causal Language
Statistical claims:
• X and Y are correlated
• X predicts Y
• X predicts Y conditional on (adjusting for or stratifying on) Z
• The prevalence of Y among those with X is twice as high as the prevalence of Y among those without X.
Causal claims:
• X causes Y
• X affects Y
• X increases (or decreases) Y
• X induces Z, which induces Y
14
Counterfactuals or Potential Outcomes
• Everyone has a well-defined outcome value (Y), under all possible values of the exposure (X), but we only get to observe one of the possible outcomes.
• X is a cause of Y if the value of Y would have been different under different values of X.
• X can be a cause of Y even if it is neither necessary nor sufficient to produce Y.
• Extend to a population: – X is a cause of Y if X is a cause of Y for some people in the population or
– X is a cause of Y if Y has different probability distributions under different values of X

15
Counterfactuals or Potential Outcomes
What is the effect of living in poverty while aged 23-30 (X) on risk of developing AD before age 75 (Y)?
• If Earnest lives in poverty, he will develop AD before age 75.
– YX=1=1
• If he doesn’t live in poverty, he will not get AD before age 75.
– YX=0=0
Earnest actually does live in poverty (graduate school? Starving writer?) and he actually does develop AD. We never get to see what would have happened to him if he’d taken that Wall Street job right out of college and avoided poverty.
This is the fundamental problem of causal inference.

16
Estimating counterfactual values from observed values
Instead we observe the diabetes status of Francis, who’s a lot like Earnest but avoided poverty. Francis did not develop AD. We assume that Francis and Earnest are “exchangeable”, and conclude that Earnest developed AD because of his poverty.
We observe the statistical association between poverty and AD, and hope that the AD outcomes of people who were not impoverished represent the outcomes people who were impoverished would have had if they hadn’t been poor.
“Confounding is present if our substitute imperfectly represents what our target would have been like under the counterfactual condition.”
– Maldonado and Greenland (2002)

17
Inferring Causation from Association
“Confounding is present if our substitute imperfectly represents what our target would have been like under the counterfactual condition.”
– Maldonado and Greenland (2002)

18
Statistical Independence vs Statistical Association
• If knowing the value of X gives you no information about the value of Y, then we say X and Y are statistically independent
• If knowing the value of X gives you some information about the value of Y, we say X and Y are statistically dependent or associated
• If knowing the value of X and C gives you some information about the value of Y, we say X and Y are statistically dependent conditional on C.

19
Inferring Causation From Association
Statistical association between two variables X and Y may be due to:
1. Random fluctuation2. X caused Y3. Y caused X4. X and Y share a common cause5. The statistical association was induced by
conditioning on a common effect of X and Y (as in selection bias).

20
How we can use this
• Eliminating four of these explanations is usually the goal of a causal analysis.
• Knowing these five sources of statistical association helps identify the (set of) causal structure(s) that could have generated the observed statistical associations.
• We are always trying to go backwards from a set of observed (conditional) statistical associations to the unobserved causal structure that generated those associations.

21
Organization
• Motivating questions in lifecourse epidemiology
• Causation vs statistical association
• Drawing and using DAGs
• Biases of special concern in studying racial disparities and cognitive aging– Survivor bias
– Baseline adjustment
– Adjusting for mediators
22
Causal Directed Acyclic Graphs
X Y
U
A
A Y
U
X
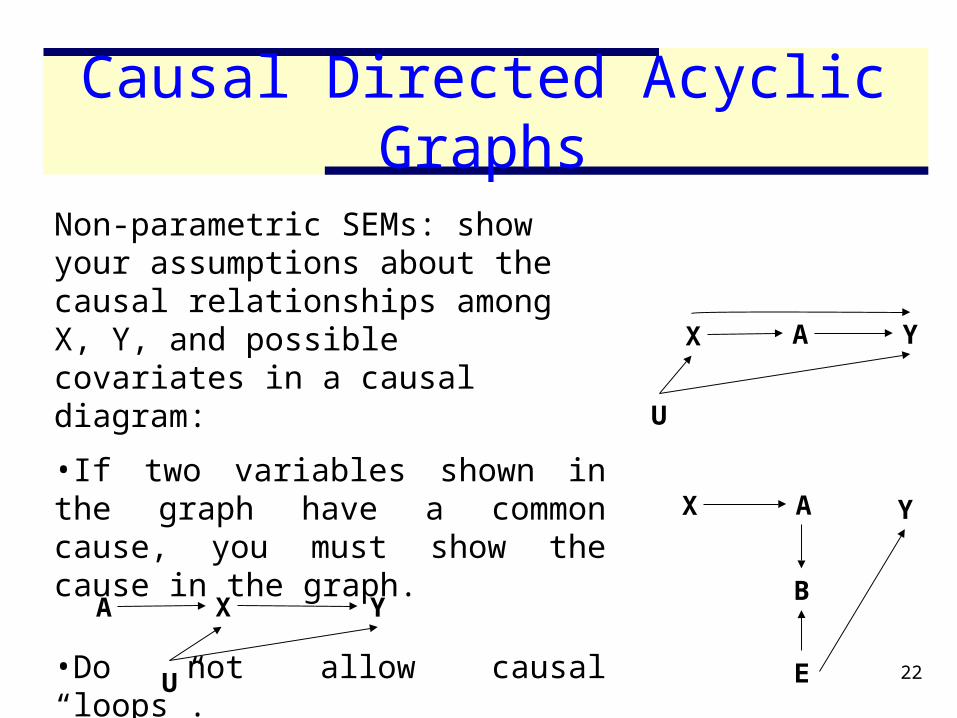
Non-parametric SEMs: show your assumptions about the causal relationships among X, Y, and possible covariates in a causal diagram:
•If two variables shown in the graph have a common cause, you must show the cause in the graph.
•Do not allow causal “loops”.A Y
B
X
E

23
Terminology• Descendants
• The direct or indirect effects of a variable
• Paths• A sequence of lines (edges) between two variables, regardless
of direction of arrows• Not retracing any line segments or going through the same
variable twice
• Colliders• Common effect of two variables in a path: where the arrows
‘collide’.• The two causes must both be “on the path”.• Any variable on a path that is not a collider is a “non-collider”.
• Conditioning• Examining the distribution of one variable within levels of
another• Regression adjustment, stratification, restriction

24
Colliders vs Non-Colliders
B
C
A
Colliders: common effects Non-Colliders: common causes (=confounders)
Or mediators
B
C
A
B CA

25
D-separation• The assumptions shown in a causal diagram imply that a
variable X will be independent of a variable Y, after conditioning on a set of variables {Z} if every path between X and Y is blocked by {Z}.
• {Z} blocks a path if and only if either:1. The path contains a non-collider that is in {Z} , or2. The path contains a collider which is not in {Z} ,
and no descendent of the collider is in {Z} .
• If there is an unblocked path linking X and Y, then X and Y will typically be statistically dependent (unless there is a perfectly offsetting balance between two paths).

26
D-separation: intuition
• There may be many reasons that two variables are associated (some confounding, some mediated causation etc).
• Adjusting for a confounder of the two variables blocks that source of association between two variables
• Adjusting for a mediator between the two variables blocks that source of association between two variables
• Adjusting for a common effect of the two variables creates an association between the two variables

27
Recap
Two variables X and Y will generally be associated if:
1. X causes Y or Y causes X• Exceptions?
2. X and Y share a common cause• Exceptions?
3. You have conditioned on a common effect of X and Y.

28
Conditioning on a Collider
If two variables are statistically independent, but have a common effect, then, within levels of this effect, they will be statistically dependent.
Really.
Usually.
29
A collider anecdote
Some tall people are fast, and some are slow.Some short people are fast, and some are slow.Knowing that somebody in the general population is
short does not give you information about whether they are fast or slow.
NBA ball players must be either very tall, or very fast.
If you know an NBA ball player is short… what do you know about his speed?

30
A collider anecdote
I throw a party, and I only invite people who are either very rich or very funny.
You come to my party (you are very funny) and get stuck talking to the most boring person you have ever met.
Is he rich?

31
A Collider Illustration
• X~N(0,1)
• Y~N(0,1)
• e~N(0,1)
• Z=X+Y+e
• n=100

32
A Collider Illustration
• X~N(0,1)
• Y~N(0,1)
• e~N(0,1)
• Z=X+Y+e
• n=100
In this simulation, –X has no effect on Y–Y has no effect on X–They share no common causes
Unconditionally, X and Y are independent

33
A Collider Illustration
-2-1
01
2x
-3 -2 -1 0 1 2y
Scatter X , Y
-2-1
01
2x
-4 -2 0 2 4z
Scatter X , Z

34
A Collider Illustration
-2-1
01
2x
-2 -1 0 1 2Residuals
Scatter X , residual (Y|Z) . reg y xCoef. Std. Err. t P>|t|
x | .0204 .1113 0.18 0.854cons | -.0064 .10153 -0.06 0.950
. reg y x zCoef. Std. Err. t P>|t|
x | -.5046 .1042 -4.84 0.000 z | .5217 .0609 8.57 0.000Cons | -.0219 .0770 -0.28 0.777

35
Collider Bias and Nihilism
• Once you recognize the potential for collider bias, you may see it everywhere.
• Or at least… the possibility of collider bias
• Collider bias is often small (try inducing it in a simulated data set)
• Among the many reasons your data and analytic tools are completely inadequate to answer your most interesting research questions, collider bias may not even be in the top 3.
• But on occasion, it can be critical, especially if the associations of the parents with the collider are very strong.
36
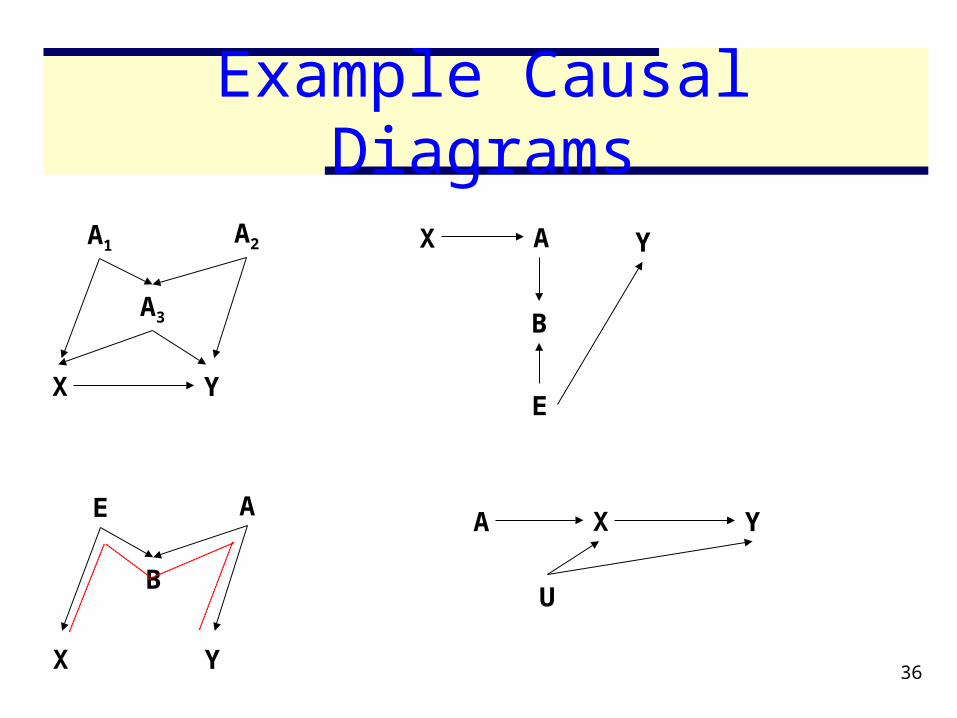
Example Causal Diagrams
X Y
U
A
X Y
B
E A
X Y
A3
A1 A2 A Y
B
X
E

37
Organization
• Motivating questions in lifecourse epidemiology• Causation vs statistical association• Drawing and using DAGs
• Biases of special concern in studying racial disparities and cognitive aging– Confounding
– Survivor bias
– Baseline adjustment
– Adjusting for mediators

38
Confounding
Education Memory
Depression
–Education“confounds” the association between Depression and memory.–Conditioning on education would be sufficient to identify the effect of depression on memory

39
Confounding
Education Income
Depression
–Education“confounds” the association between Depression and mortality.–Conditioning on either education or income would be sufficient to identify the effect of depression on Memory
Memory

40
Survival to age 65 Dementia
Education
Some gene
– Imagine studying education and dementia in EPESE data.– Education completed ~age 25, affects survival to age 65.– EPESE enrollment ~age 65
A DAG for Selection/Survivor Bias

41
Survival to age 65 Dementia
Education
Some gene
Here, we assume education has no effect on dementia.
Would it be statistically associated with dementia among EPESE enrollees?
A DAG for Selection Bias

42
Survival to age 65 Dementia
Education
Some gene
Yes.
A DAG for Selection Bias
43
Y Y*
X
U
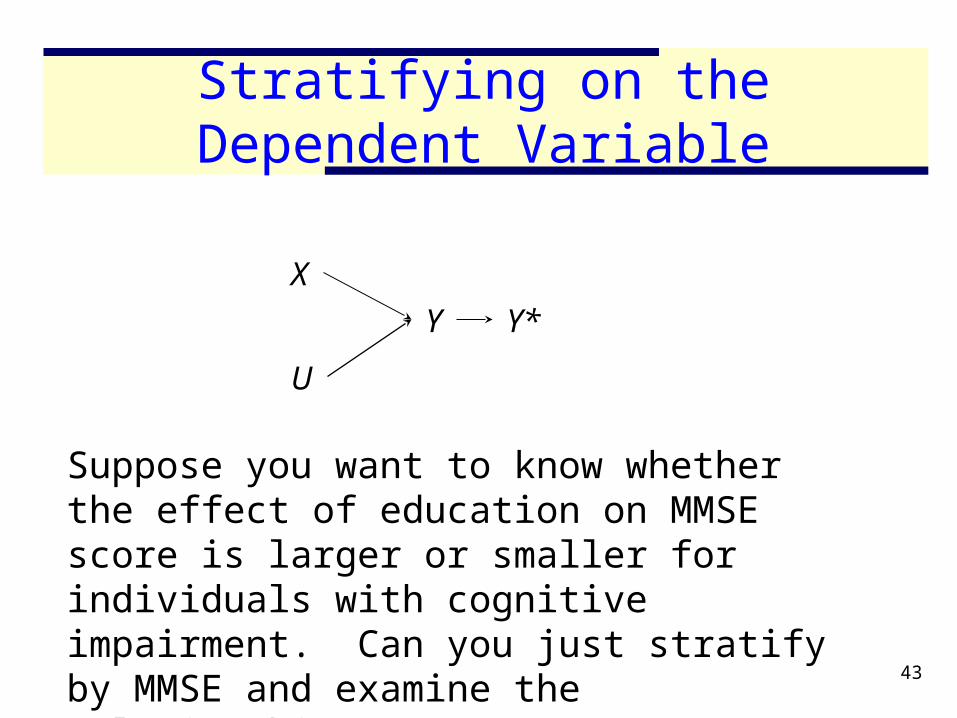
Stratifying on the Dependent Variable
Suppose you want to know whether the effect of education on MMSE score is larger or smaller for individuals with cognitive impairment. Can you just stratify by MMSE and examine the relationship?

44
Why would you condition on a collider?
Some “colliders” are not optional:
• Survival
• Diagnosis with a disease
• Selection into a study
• Providing complete data

45
Can you quantify the bias?
• Must make assumptions about the magnitude and direction of each causal association
• This is not specified in the DAG, the DAG only tells you conditional dependence/independence.
• Often the bias is small, but not always.
• Often the bias is negative.

46
Unreliable Measures
Depression Memory
CESD1
1

47
Unreliable Measures
Depression Memory
CESD1
1
Unemployment

48
Unreliable Measures in Analyses of Change
X C1 Change in C1
Y1
1
U
Y2- Y1

49
Estimating Direct Effects
Standard decomposition of
direct/indirect effects:
E(Y)=0+1*Race
E(Y)=0+1*Race+2*Educ
Total effect= 1
Direct effect=1
Indirect effect=1-1
Educ YRace

50
Educ YRace
Nutrition
Estimating Direct Effects
Problems if:
-Unmeasured confounding of Educ and Y
-Race and Educ interact to effect Y
-Imperfect measurement of Educ
-(Non-linear models)
Standard decomposition of
direct/indirect effects:
E(Y)=0+1*Race
E(Y)=0+1*Race+2*Educ
Total effect= 1
Direct effect=1
Indirect effect=1-1

51
END

52
Confounding
Education Memory
Depression
Childhood Cognitive
Skills

53
Confounding
Education Memory
Depression
Childhood Cognitive
Skills
Neurodegenerative Disease
Memory Change


![[Clark Glymour] the Mind's Arrows Bayes Nets and (BookZZ.org)](https://img.pdfslide.us/doc/110x75/55cf8f37550346703b9a0df2/clark-glymour-the-minds-arrows-bayes-nets-and-bookzzorg.jpg)