Embed Size (px)
Citation preview
LIFE SAVING VICTORIAVICTORIAN DROWNING REPORT 2015/16
Methods 3
Our Performance 4
CEO’s Report 6
Who is Drowning? 8
When, Where, What 12
Risk Factors 16
Coronial Recommendations 17
Snapshot Murray River Drowning 2005/6 to 2014/15 19
Drowning Profiles by Victorian Statistical Areas, 2005/6 to 2014/15 20
Victorian Water Safety Industry 26
References 26
ACKNOWLEDGEMENTS
Life Saving Victoria gratefully acknowledges the assistance of the following organisations in the production of the Victorian Drowning Report:• Ambulance Victoria• Belgravia Leisure• Coroners Prevention Unit, Coroners Court of Victoria• Emergency Management Victoria, Department of Justice and Regulation• Department of Health and Human Services• National Coroners Information System• Royal Life Saving Society - Australia• Surf Life Saving Australia• Victorian Injury Surveillance Unit• YMCA Victoria
SUGGESTED CITATION
Life Saving Victoria. (2016). Victorian Drowning Report 2015/16. Life Saving Victoria: Melbourne.
COMPILED BY:
Dr Bernadette Matthews, Rhiannon Birch and Robert Andronaco – Life Saving Victoria
Dr Bernadette Matthews is Principal Research Associate for Life Saving Victoria. Bernadette specialises in aquatic injury prevention research, from epidemiology of fatal and non-fatal drowning, injuries at public swimming pools and patrolled beaches, aquatic safety signage recognition and recall, through to evaluation of education programs and major public awareness campaigns. Bernadette has a background in health science, completing her doctoral thesis in 2004.
Rhiannon Birch is the Project Coordinator – Risk and Research for Life Saving Victoria. Rhiannon assists in the planning and coordination of LSV’s research on injury prevention and water safety issues, including inland waterways drowning prevention, the water competency of children and older adults in Victoria, public pool safety, multicultural programs and international drowning prevention research. Rhiannon holds a Bachelor of Environmental Science and Graduate Diploma in Education.
Robert Andronaco is the Risk and Spatial Analyst Specialist at Life Saving Victoria. In his role he focuses on quantifying drowning risk and assisting land managers in mitigating assessed risks specific to recreational drowning and injury. Robert uses both traditional statistical approaches and spatial statistical analysis approaches to quantify drowning risks. Robert holds a Masters in Sport and Recreation Management and a Post Graduate Diploma in Risk Management. He is a current PhD candidate at RMIT in the School of Mathematics and Geospatial Science.
CONT
ENTS
Life Saving Victoria Victorian Drowning Report 2015/16 / 2
MET
HODS
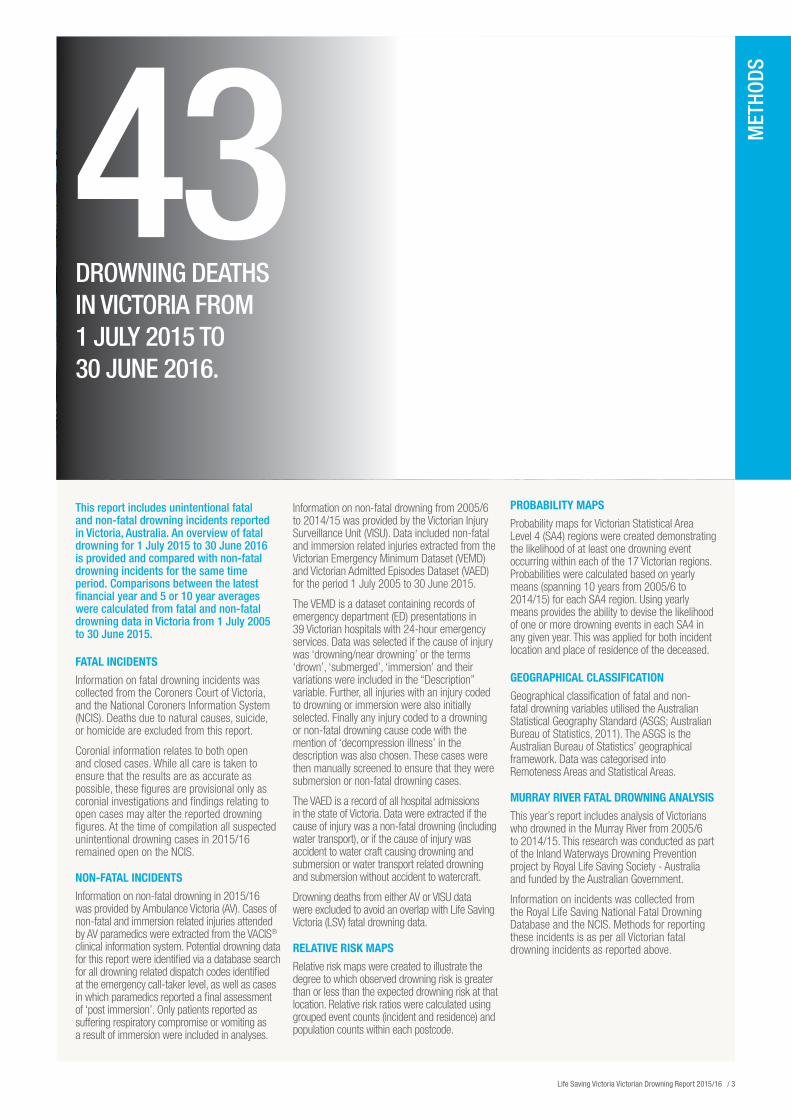
This report includes unintentional fatal and non-fatal drowning incidents reported in Victoria, Australia. An overview of fatal drowning for 1 July 2015 to 30 June 2016 is provided and compared with non-fatal drowning incidents for the same time period. Comparisons between the latest financial year and 5 or 10 year averages were calculated from fatal and non-fatal drowning data in Victoria from 1 July 2005 to 30 June 2015.
FATAL INCIDENTS
Information on fatal drowning incidents was collected from the Coroners Court of Victoria, and the National Coroners Information System (NCIS). Deaths due to natural causes, suicide, or homicide are excluded from this report.
Coronial information relates to both open and closed cases. While all care is taken to ensure that the results are as accurate as possible, these figures are provisional only as coronial investigations and findings relating to open cases may alter the reported drowning figures. At the time of compilation all suspected unintentional drowning cases in 2015/16 remained open on the NCIS.
NON-FATAL INCIDENTS
Information on non-fatal drowning in 2015/16 was provided by Ambulance Victoria (AV). Cases of non-fatal and immersion related injuries attended by AV paramedics were extracted from the VACIS® clinical information system. Potential drowning data for this report were identified via a database search for all drowning related dispatch codes identified at the emergency call-taker level, as well as cases in which paramedics reported a final assessment of ‘post immersion’. Only patients reported as suffering respiratory compromise or vomiting as a result of immersion were included in analyses.
Information on non-fatal drowning from 2005/6 to 2014/15 was provided by the Victorian Injury Surveillance Unit (VISU). Data included non-fatal and immersion related injuries extracted from the Victorian Emergency Minimum Dataset (VEMD) and Victorian Admitted Episodes Dataset (VAED) for the period 1 July 2005 to 30 June 2015.
The VEMD is a dataset containing records of emergency department (ED) presentations in 39 Victorian hospitals with 24-hour emergency services. Data was selected if the cause of injury was ‘drowning/near drowning’ or the terms ‘drown’, ‘submerged’, ‘immersion’ and their variations were included in the “Description” variable. Further, all injuries with an injury coded to drowning or immersion were also initially selected. Finally any injury coded to a drowning or non-fatal drowning cause code with the mention of ‘decompression illness’ in the description was also chosen. These cases were then manually screened to ensure that they were submersion or non-fatal drowning cases.
The VAED is a record of all hospital admissions in the state of Victoria. Data were extracted if the cause of injury was a non-fatal drowning (including water transport), or if the cause of injury was accident to water craft causing drowning and submersion or water transport related drowning and submersion without accident to watercraft.
Drowning deaths from either AV or VISU data were excluded to avoid an overlap with Life Saving Victoria (LSV) fatal drowning data.
RELATIVE RISK MAPS
Relative risk maps were created to illustrate the degree to which observed drowning risk is greater than or less than the expected drowning risk at that location. Relative risk ratios were calculated using grouped event counts (incident and residence) and population counts within each postcode.
PROBABILITY MAPS
Probability maps for Victorian Statistical Area Level 4 (SA4) regions were created demonstrating the likelihood of at least one drowning event occurring within each of the 17 Victorian regions. Probabilities were calculated based on yearly means (spanning 10 years from 2005/6 to 2014/15) for each SA4 region. Using yearly means provides the ability to devise the likelihood of one or more drowning events in each SA4 in any given year. This was applied for both incident location and place of residence of the deceased.
GEOGRAPHICAL CLASSIFICATION
Geographical classification of fatal and non-fatal drowning variables utilised the Australian Statistical Geography Standard (ASGS; Australian Bureau of Statistics, 2011). The ASGS is the Australian Bureau of Statistics’ geographical framework. Data was categorised into Remoteness Areas and Statistical Areas.
MURRAY RIVER FATAL DROWNING ANALYSIS
This year’s report includes analysis of Victorians who drowned in the Murray River from 2005/6 to 2014/15. This research was conducted as part of the Inland Waterways Drowning Prevention project by Royal Life Saving Society - Australia and funded by the Australian Government.
Information on incidents was collected from the Royal Life Saving National Fatal Drowning Database and the NCIS. Methods for reporting these incidents is as per all Victorian fatal drowning incidents as reported above.
43DROWNING DEATHS IN VICTORIA FROM 1 JULY 2015 TO 30 JUNE 2016.
Life Saving Victoria Victorian Drowning Report 2015/16 / 3
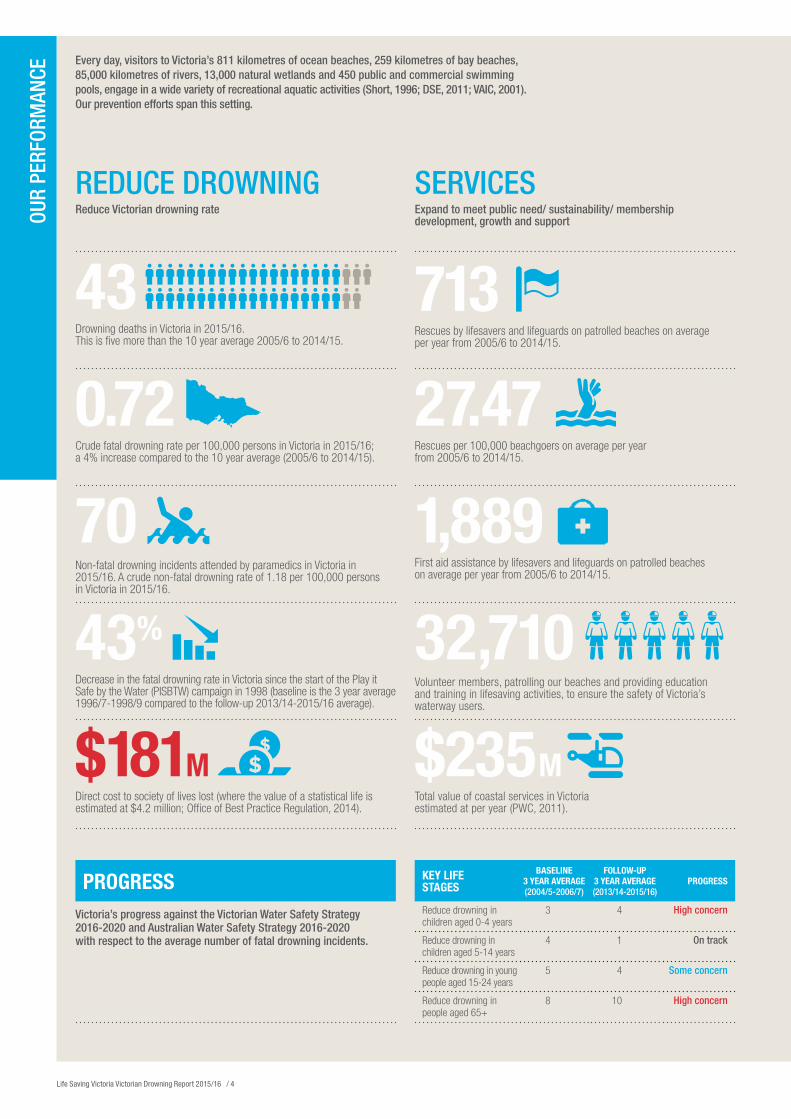
PROGRESSVictoria’s progress against the Victorian Water Safety Strategy 2016-2020 and Australian Water Safety Strategy 2016-2020 with respect to the average number of fatal drowning incidents.
KEY LIFE STAGES
BASELINE 3 YEAR AVERAGE (2004/5-2006/7)
FOLLOW-UP 3 YEAR AVERAGE (2013/14-2015/16)
PROGRESS
Reduce drowning in children aged 0-4 years
3 4 High concern
Reduce drowning in children aged 5-14 years
4 1 On track
Reduce drowning in young people aged 15-24 years
5 4 Some concern
Reduce drowning in people aged 65+
8 10 High concern
REDUCE DROWNINGReduce Victorian drowning rate
SERVICES Expand to meet public need/ sustainability/ membership development, growth and support
43 Drowning deaths in Victoria in 2015/16. This is five more than the 10 year average 2005/6 to 2014/15.
713 Rescues by lifesavers and lifeguards on patrolled beaches on average per year from 2005/6 to 2014/15.
0.72 Crude fatal drowning rate per 100,000 persons in Victoria in 2015/16; a 4% increase compared to the 10 year average (2005/6 to 2014/15).
27.47Rescues per 100,000 beachgoers on average per year from 2005/6 to 2014/15.
70 Non-fatal drowning incidents attended by paramedics in Victoria in 2015/16. A crude non-fatal drowning rate of 1.18 per 100,000 persons in Victoria in 2015/16.
1,889First aid assistance by lifesavers and lifeguards on patrolled beaches on average per year from 2005/6 to 2014/15.
43% Decrease in the fatal drowning rate in Victoria since the start of the Play it Safe by the Water (PISBTW) campaign in 1998 (baseline is the 3 year average 1996/7-1998/9 compared to the follow-up 2013/14-2015/16 average).
32,710 Volunteer members, patrolling our beaches and providing education and training in lifesaving activities, to ensure the safety of Victoria’s waterway users.
$181M
Direct cost to society of lives lost (where the value of a statistical life is estimated at $4.2 million; Office of Best Practice Regulation, 2014).
$235M Total value of coastal services in Victoria estimated at per year (PWC, 2011).
Every day, visitors to Victoria’s 811 kilometres of ocean beaches, 259 kilometres of bay beaches, 85,000 kilometres of rivers, 13,000 natural wetlands and 450 public and commercial swimming pools, engage in a wide variety of recreational aquatic activities (Short, 1996; DSE, 2011; VAIC, 2001). Our prevention efforts span this setting.
OUR
PERF
ORM
ANCE
Life Saving Victoria Victorian Drowning Report 2015/16 / 4
HIGH RISK LOCATIONS
BASELINE 3 YEAR AVERAGE (2004/5-2006/7)
FOLLOW-UP 3 YEAR AVERAGE (2013/14-2015/16)
PROGRESS
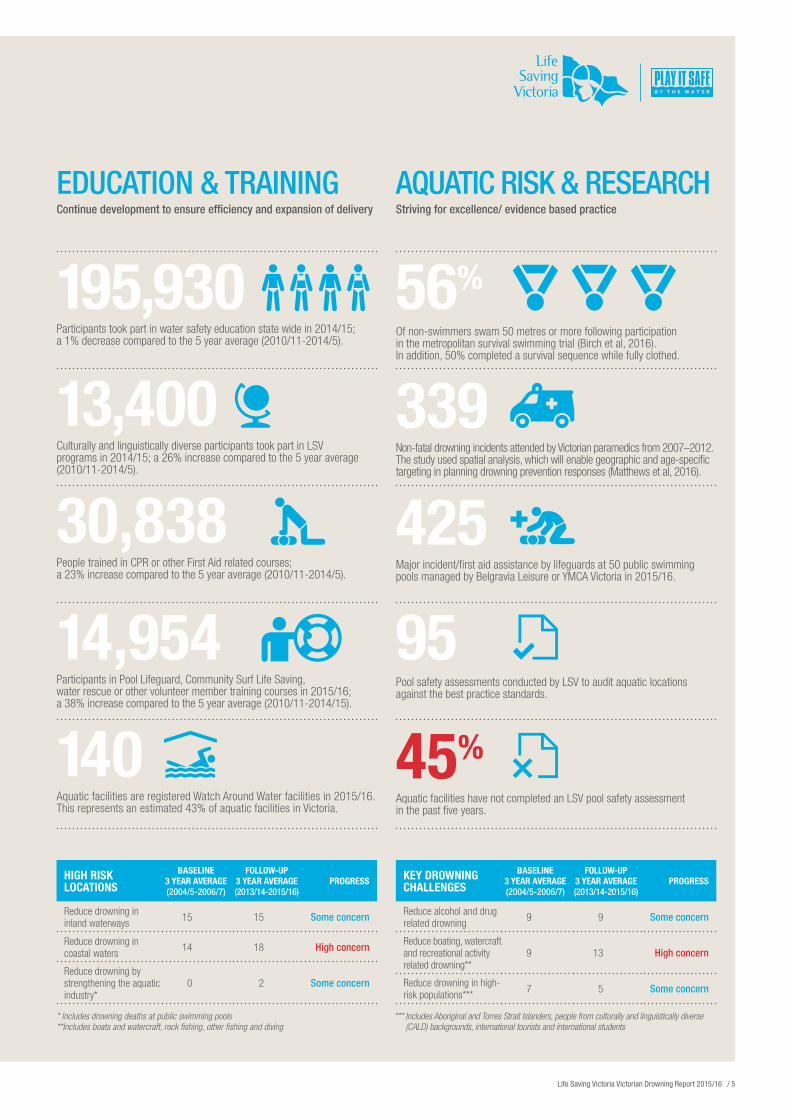
Reduce drowning in inland waterways 15 15 Some concern
Reduce drowning in coastal waters 14 18 High concern
Reduce drowning by strengthening the aquatic industry*
0 2 Some concern
KEY DROWNING CHALLENGES
BASELINE 3 YEAR AVERAGE (2004/5-2006/7)
FOLLOW-UP 3 YEAR AVERAGE (2013/14-2015/16)
PROGRESS
Reduce alcohol and drug related drowning 9 9 Some concern
Reduce boating, watercraft and recreational activity related drowning**
9 13 High concern
Reduce drowning in high-risk populations*** 7 5 Some concern
* Includes drowning deaths at public swimming pools**Includes boats and watercraft, rock fishing, other fishing and diving
*** Includes Aboriginal and Torres Strait Islanders, people from culturally and linguistically diverse (CALD) backgrounds, international tourists and international students
REDUCE DROWNINGReduce Victorian drowning rate
SERVICES Expand to meet public need/ sustainability/ membership development, growth and support
43 Drowning deaths in Victoria in 2015/16. This is five more than the 10 year average 2005/6 to 2014/15.
713 Rescues by lifesavers and lifeguards on patrolled beaches on average per year from 2005/6 to 2014/15.
0.72 Crude fatal drowning rate per 100,000 persons in Victoria in 2015/16; a 4% increase compared to the 10 year average (2005/6 to 2014/15).
27.47Rescues per 100,000 beachgoers on average per year from 2005/6 to 2014/15.
70 Non-fatal drowning incidents attended by paramedics in Victoria in 2015/16. A crude non-fatal drowning rate of 1.18 per 100,000 persons in Victoria in 2015/16.
1,889First aid assistance by lifesavers and lifeguards on patrolled beaches on average per year from 2005/6 to 2014/15.
43% Decrease in the fatal drowning rate in Victoria since the start of the Play it Safe by the Water (PISBTW) campaign in 1998 (baseline is the 3 year average 1996/7-1998/9 compared to the follow-up 2013/14-2015/16 average).
32,710 Volunteer members, patrolling our beaches and providing education and training in lifesaving activities, to ensure the safety of Victoria’s waterway users.
$181M
Direct cost to society of lives lost (where the value of a statistical life is estimated at $4.2 million; Office of Best Practice Regulation, 2014).
$235M Total value of coastal services in Victoria estimated at per year (PWC, 2011).
EDUCATION & TRAININGContinue development to ensure efficiency and expansion of delivery
AQUATIC RISK & RESEARCH Striving for excellence/ evidence based practice
195,930 Participants took part in water safety education state wide in 2014/15; a 1% decrease compared to the 5 year average (2010/11-2014/5).
56% Of non-swimmers swam 50 metres or more following participation in the metropolitan survival swimming trial (Birch et al, 2016). In addition, 50% completed a survival sequence while fully clothed.
13,400Culturally and linguistically diverse participants took part in LSV programs in 2014/15; a 26% increase compared to the 5 year average (2010/11-2014/5).
339 Non-fatal drowning incidents attended by Victorian paramedics from 2007–2012. The study used spatial analysis, which will enable geographic and age-specific targeting in planning drowning prevention responses (Matthews et al, 2016).
30,838People trained in CPR or other First Aid related courses; a 23% increase compared to the 5 year average (2010/11-2014/5).
425 Major incident/first aid assistance by lifeguards at 50 public swimming pools managed by Belgravia Leisure or YMCA Victoria in 2015/16.
14,954Participants in Pool Lifeguard, Community Surf Life Saving, water rescue or other volunteer member training courses in 2015/16; a 38% increase compared to the 5 year average (2010/11-2014/15).
95 Pool safety assessments conducted by LSV to audit aquatic locations against the best practice standards.
140Aquatic facilities are registered Watch Around Water facilities in 2015/16. This represents an estimated 43% of aquatic facilities in Victoria.
45% Aquatic facilities have not completed an LSV pool safety assessment in the past five years.
Life Saving Victoria Victorian Drowning Report 2015/16 / 5
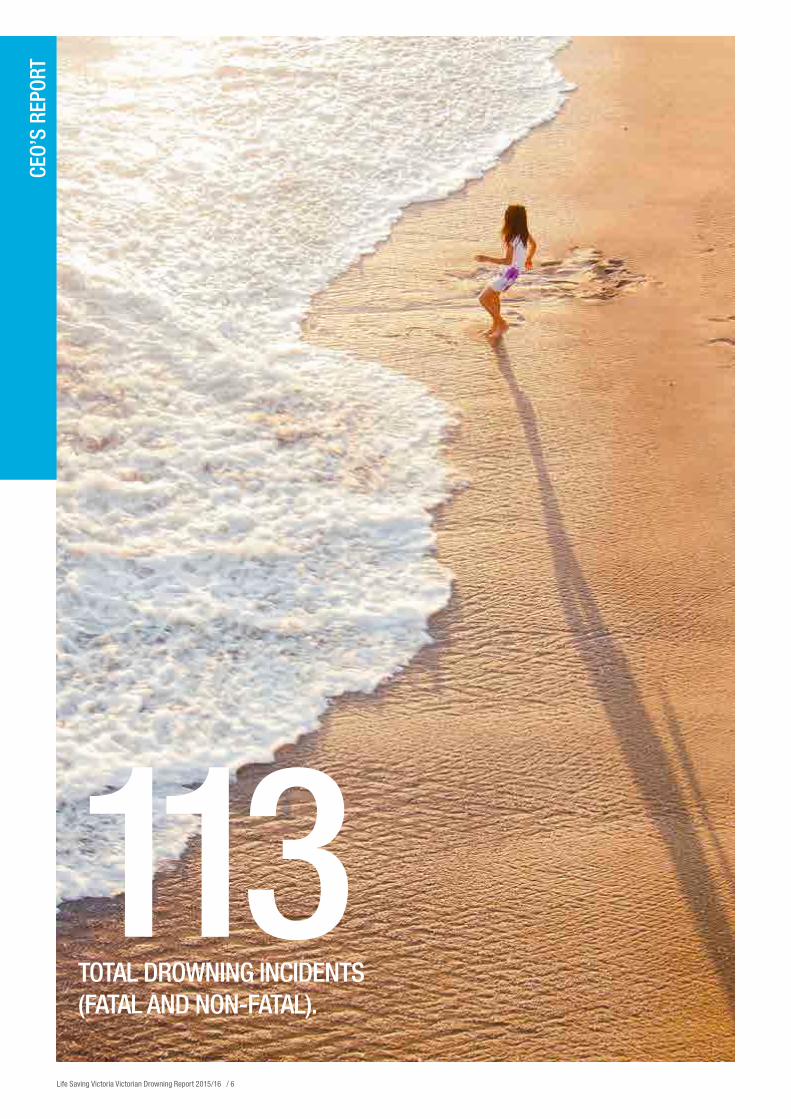
113TOTAL DROWNING INCIDENTS (FATAL AND NON-FATAL).
CEO’
S RE
PORT
Life Saving Victoria Victorian Drowning Report 2015/16 / 6
Reporting on drowning incidents in Victoria provides a stark, annual reminder to us all not to become complacent about water safety. The analysis of drowning incidents within this report helps us to identify both ongoing and emerging drowning trends, so we can best target our prevention efforts for all Victorians to enjoy our waterways safely.
This year there were 43 drowning deaths on Victorian waterways. When we also include non-fatal drowning incidents, this figure rises to a total of 113. Over the previous decade there were 701 hospital admissions, with an average of 70 hospital admissions for non-fatal drowning per year. There were also 740 Emergency Department (ED) presentations, with an average of 74 ED presentations for non-fatal drowning per year. It seems this is often the forgotten consequence, however injuries and disabilities as well as ongoing emotional and psychological trauma, as a result of non-fatal drowning can have a very different lifelong impact. This will be addressed in a new child water safety public awareness campaign, to be launched in the coming months.
Some of the key drowning trends in 2015/16 include:
A 33% increase in the fatal drowning rate of females, compared to the 10 year average. Despite this, males remain much more likely to drown, accounting for 72% of all drowning victims in 2015/16.
A 40% increase in the fatal drowning rate of those aged 65 years and over. This area will also be addressed with a new public awareness campaign, to commence in December 2016.
An 8% increase in the fatal drowning rate of children aged 0-4 years in 2015/16, compared with the 10 year average.
People not wearing lifejackets while boating; of the 8 drowning deaths in boating incidents during 2015/16 the majority of victims were not wearing a lifejacket. Over the past decade, 80% of people who drowned in boating incidents were not wearing a lifejacket.
Alcohol continues to be a common factor in drowning, representing 23% of the drowning toll each year.
A 32% increase in drowning deaths occurring in coastal waterways. This highlights the lack of understanding that many beachgoers and waterway users still have about coastal conditions.
The top three activities that people were doing prior to drowning were swimming/paddling/wading (26%, 11), followed by boating (19%, 8), and walking/playing near water (14%, 6).
Across many of these incidents, we have seen a continued theme of unintentional water entry, including slips, trips and falls. In fact, in 2015/16, this accounted for almost 40% of all drowning deaths. This is similar to the past decade, in which unintentional water entry was a factor in an average of 36% of all drowning deaths.
This factor makes the need for survival swimming skills all the more important. The aim of survival swimming is to prepare a child for unexpected entry into deep, open water, including basic skills enabling them to swim to a point of safety, or to float, scull or tread water until help arrives. We believe that every child should have the opportunity to learn vital survival swimming skills, regardless of location, physical capability, cultural background and socio-economic circumstances and thus we will continue to work together with government to work towards this goal.
This year also marks the release of the Victorian Water Safety Strategy 2016-2020. This strategy was developed by key aquatic industry stakeholders in consultation with related government departments, to provide an overarching approach to drowning prevention and water safety in Victoria.
When we consider the impact drowning has on loved ones, families, friends and communities, we are reminded that every drowning death is one too many. We look forward to working with you in our shared responsibility toward drowning prevention.
Nigel Taylor ESM CEO
“ WHEN WE CONSIDER THE IMPACT DROWNING HAS ON LOVED ONES, FAMILIES, FRIENDS AND COMMUNITIES, WE ARE REMINDED THAT EVERY DROWNING DEATH IS ONE TOO MANY.”
“ ALCOHOL CONTINUES TO BE A COMMON FACTOR IN DROWNING, REPRESENTING 23% OF THE DROWNING TOLL EACH YEAR.”
Life Saving Victoria Victorian Drowning Report 2015/16 / 7
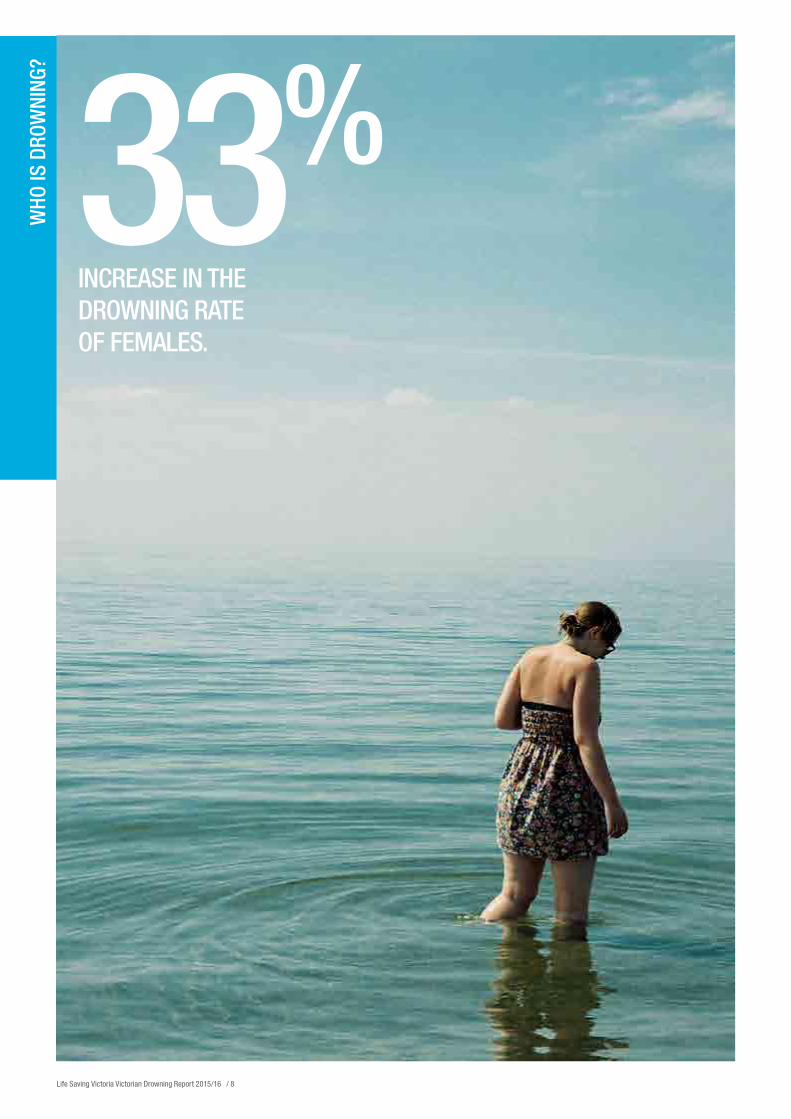
33% INCREASE IN THE DROWNING RATE OF FEMALES.
WHO
IS D
ROW
NING
?
Life Saving Victoria Victorian Drowning Report 2015/16 / 8
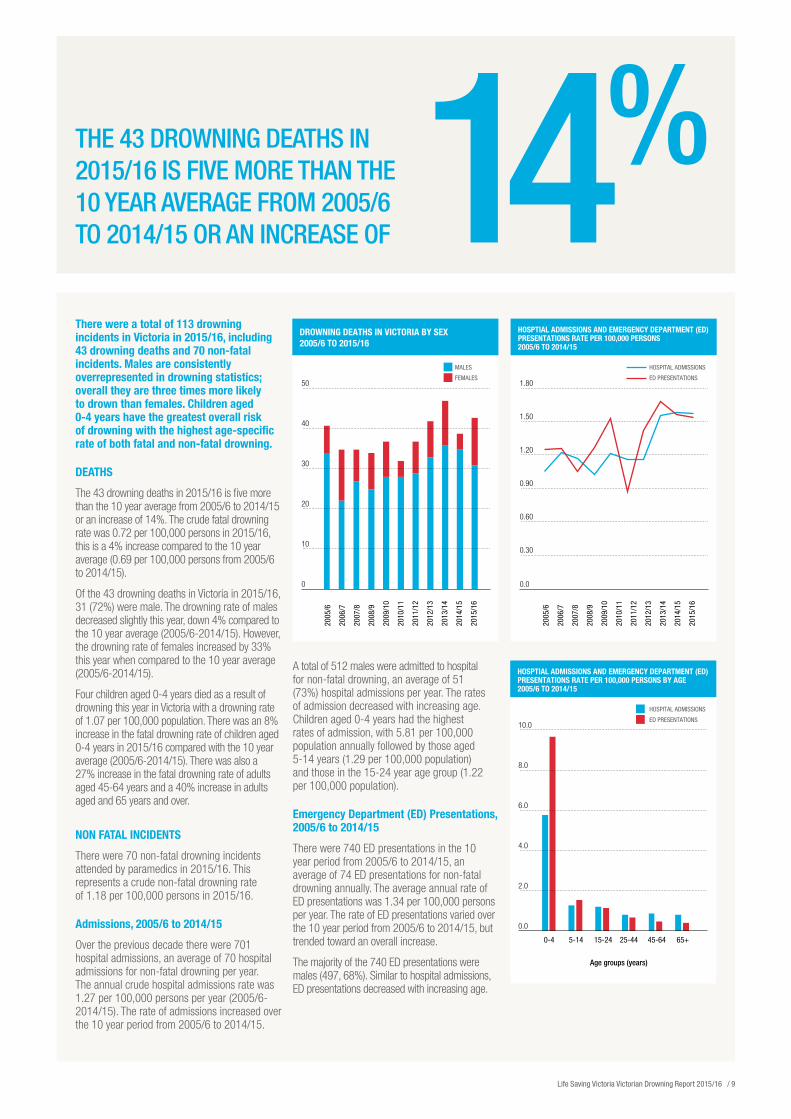
There were a total of 113 drowning incidents in Victoria in 2015/16, including 43 drowning deaths and 70 non-fatal incidents. Males are consistently overrepresented in drowning statistics; overall they are three times more likely to drown than females. Children aged 0-4 years have the greatest overall risk of drowning with the highest age-specific rate of both fatal and non-fatal drowning.
DEATHS
The 43 drowning deaths in 2015/16 is five more than the 10 year average from 2005/6 to 2014/15 or an increase of 14%. The crude fatal drowning rate was 0.72 per 100,000 persons in 2015/16, this is a 4% increase compared to the 10 year average (0.69 per 100,000 persons from 2005/6 to 2014/15).
Of the 43 drowning deaths in Victoria in 2015/16, 31 (72%) were male. The drowning rate of males decreased slightly this year, down 4% compared to the 10 year average (2005/6-2014/15). However, the drowning rate of females increased by 33% this year when compared to the 10 year average (2005/6-2014/15).
Four children aged 0-4 years died as a result of drowning this year in Victoria with a drowning rate of 1.07 per 100,000 population. There was an 8% increase in the fatal drowning rate of children aged 0-4 years in 2015/16 compared with the 10 year average (2005/6-2014/15). There was also a 27% increase in the fatal drowning rate of adults aged 45-64 years and a 40% increase in adults aged and 65 years and over.
NON FATAL INCIDENTS
There were 70 non-fatal drowning incidents attended by paramedics in 2015/16. This represents a crude non-fatal drowning rate of 1.18 per 100,000 persons in 2015/16.
Admissions, 2005/6 to 2014/15
Over the previous decade there were 701 hospital admissions, an average of 70 hospital admissions for non-fatal drowning per year. The annual crude hospital admissions rate was 1.27 per 100,000 persons per year (2005/6-2014/15). The rate of admissions increased over the 10 year period from 2005/6 to 2014/15.
A total of 512 males were admitted to hospital for non-fatal drowning, an average of 51 (73%) hospital admissions per year. The rates of admission decreased with increasing age. Children aged 0-4 years had the highest rates of admission, with 5.81 per 100,000 population annually followed by those aged 5-14 years (1.29 per 100,000 population) and those in the 15-24 year age group (1.22 per 100,000 population).
Emergency Department (ED) Presentations, 2005/6 to 2014/15
There were 740 ED presentations in the 10 year period from 2005/6 to 2014/15, an average of 74 ED presentations for non-fatal drowning annually. The average annual rate of ED presentations was 1.34 per 100,000 persons per year. The rate of ED presentations varied over the 10 year period from 2005/6 to 2014/15, but trended toward an overall increase.
The majority of the 740 ED presentations were males (497, 68%). Similar to hospital admissions, ED presentations decreased with increasing age.
THE 43 DROWNING DEATHS IN 2015/16 IS FIVE MORE THAN THE 10 YEAR AVERAGE FROM 2005/6 TO 2014/15 OR AN INCREASE OF 14%
Life Saving Victoria Victorian Drowning Report 2015/16 / 9
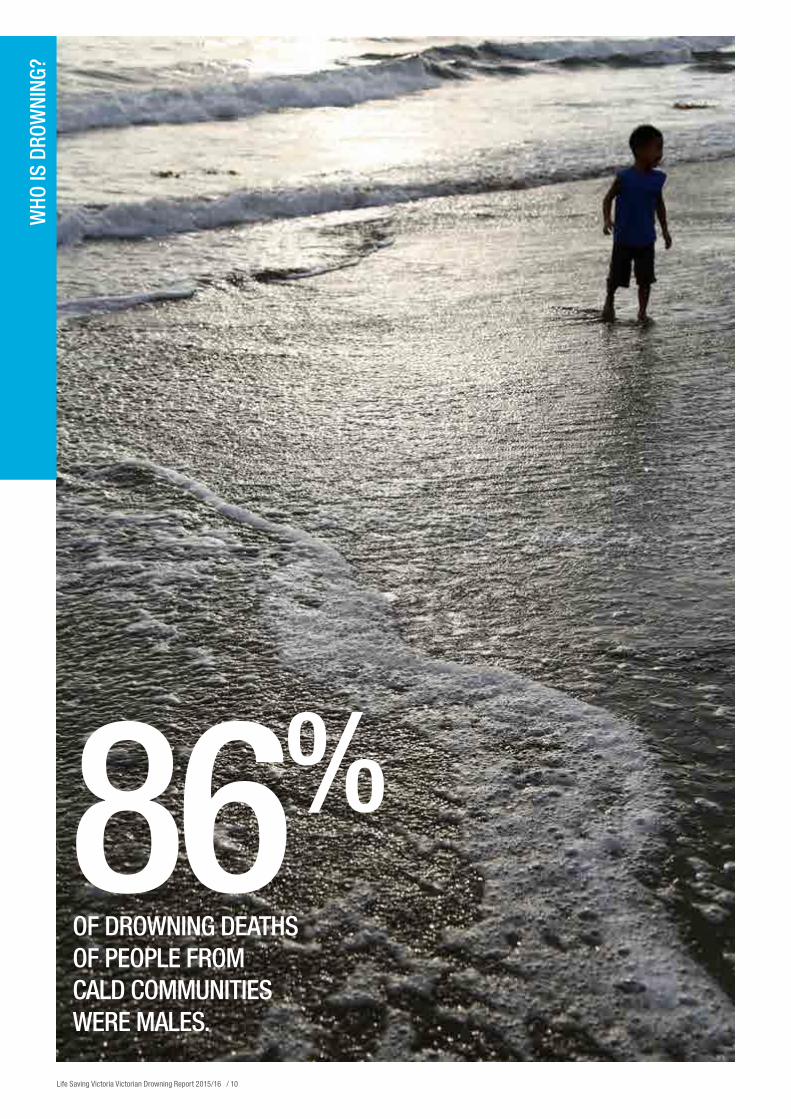
86% OF DROWNING DEATHS OF PEOPLE FROM CALD COMMUNITIES WERE MALES.
WHO
IS D
ROW
NING
?
Life Saving Victoria Victorian Drowning Report 2015/16 / 10
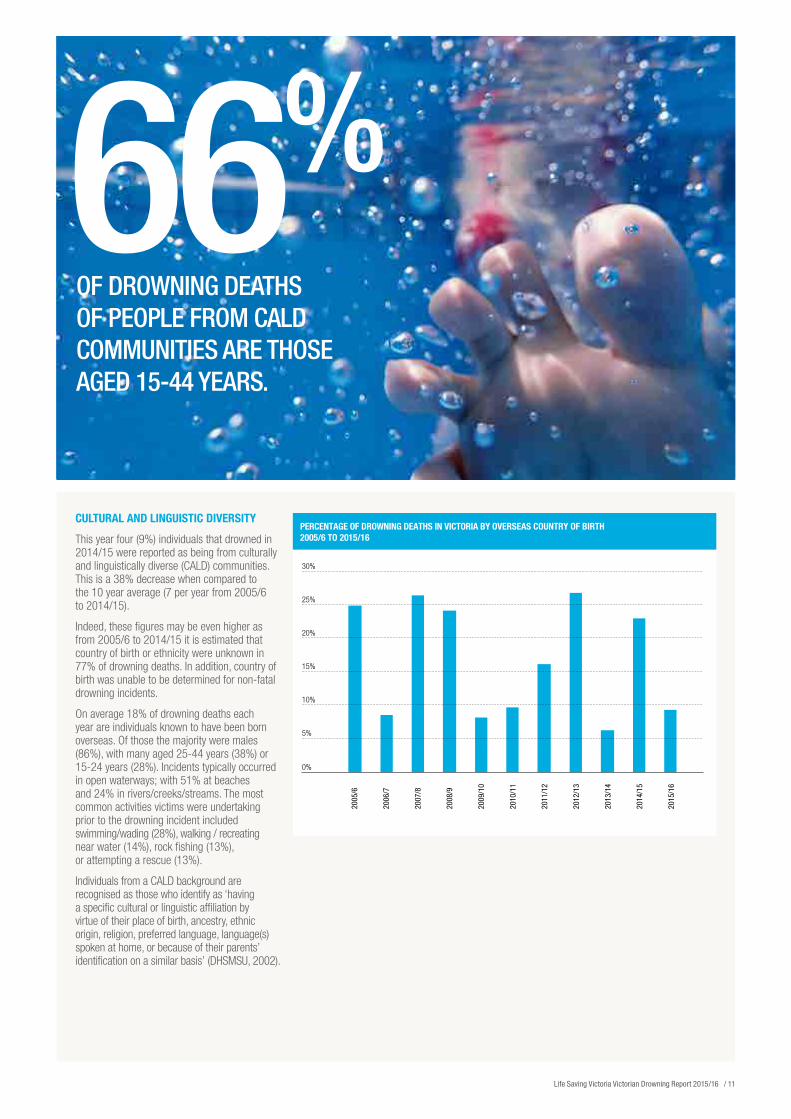
CULTURAL AND LINGUISTIC DIVERSITY
This year four (9%) individuals that drowned in 2014/15 were reported as being from culturally and linguistically diverse (CALD) communities. This is a 38% decrease when compared to the 10 year average (7 per year from 2005/6 to 2014/15).
Indeed, these figures may be even higher as from 2005/6 to 2014/15 it is estimated that country of birth or ethnicity were unknown in 77% of drowning deaths. In addition, country of birth was unable to be determined for non-fatal drowning incidents.
On average 18% of drowning deaths each year are individuals known to have been born overseas. Of those the majority were males (86%), with many aged 25-44 years (38%) or 15-24 years (28%). Incidents typically occurred in open waterways; with 51% at beaches and 24% in rivers/creeks/streams. The most common activities victims were undertaking prior to the drowning incident included swimming/wading (28%), walking / recreating near water (14%), rock fishing (13%), or attempting a rescue (13%).
Individuals from a CALD background are recognised as those who identify as ‘having a specific cultural or linguistic affiliation by virtue of their place of birth, ancestry, ethnic origin, religion, preferred language, language(s) spoken at home, or because of their parents’ identification on a similar basis’ (DHSMSU, 2002).
66% OF DROWNING DEATHS OF PEOPLE FROM CALD COMMUNITIES ARE THOSE AGED 15-44 YEARS.
Life Saving Victoria Victorian Drowning Report 2015/16 / 11
WHE
N, W
HERE
, WHA
T
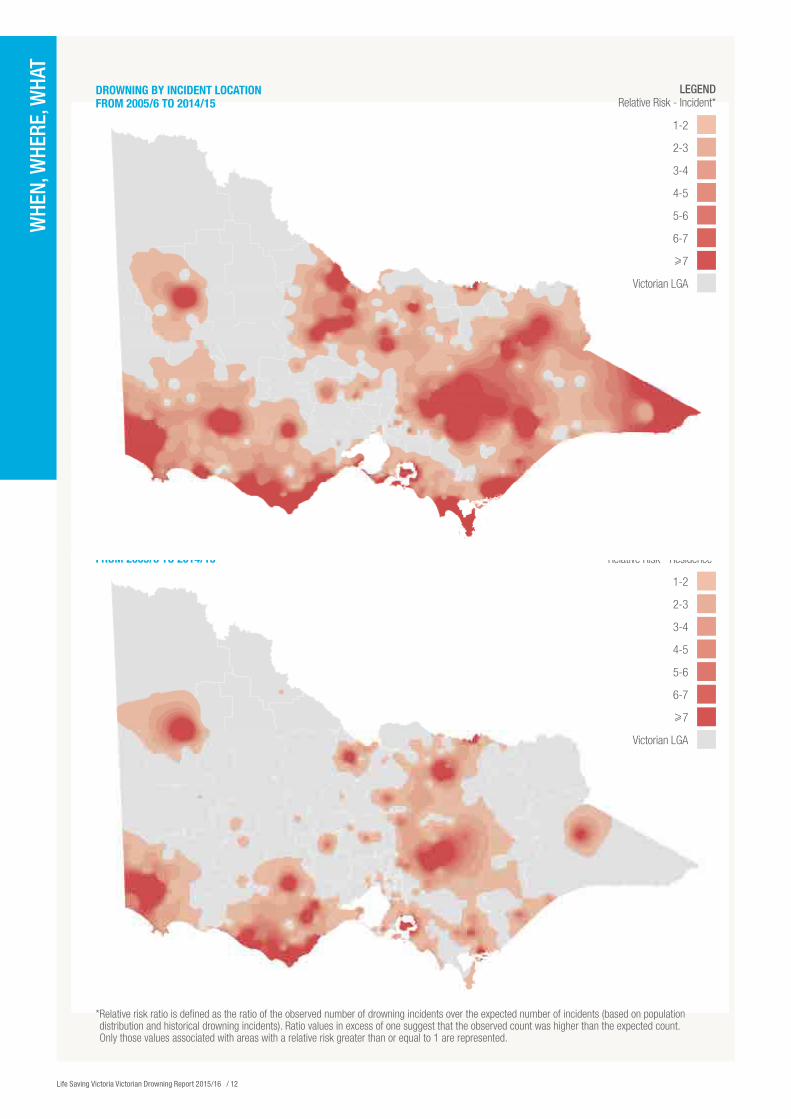
DROWNING BY PLACE OF RESIDENCE FROM 2005/6 TO 2014/15
1-2
2-3
3-4
4-5
5-6
6-7
Victorian LGA
LEGENDRelative Risk - Residence*
DROWNING BY INCIDENT LOCATION
FROM 2005/6 TO 2014/15
1-2
2-3
3-4
4-5
5-6
6-7
Victorian LGA
LEGENDRelative Risk - Incident*
* Relative risk ratio is defined as the ratio of the observed number of drowning incidents over the expected number of incidents (based on population distribution and historical drowning incidents). Ratio values in excess of one suggest that the observed count was higher than the expected count. Only those values associated with areas with a relative risk greater than or equal to 1 are represented.
Life Saving Victoria Victorian Drowning Report 2015/16 / 12
64% INCREASE IN THE FATAL DROWNING RATE OF THOSE RESIDING IN REGIONAL AREAS.
Life Saving Victoria Victorian Drowning Report 2015/16 / 13
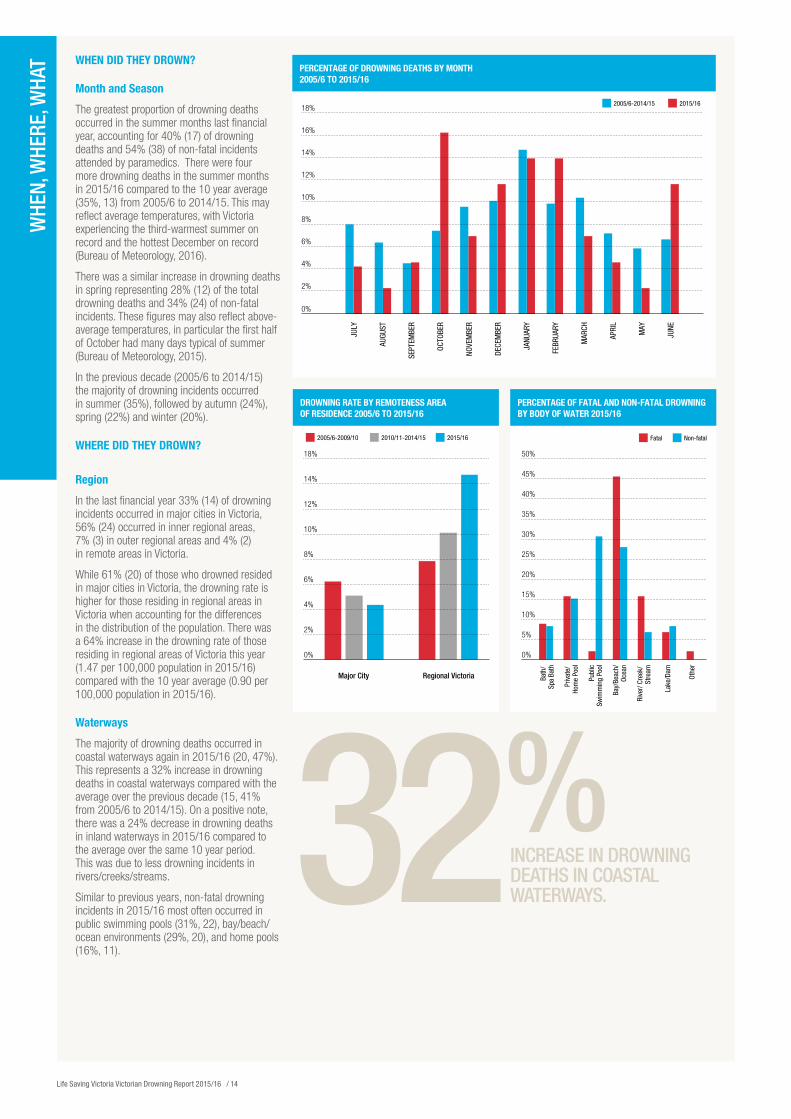
WHEN DID THEY DROWN?
Month and Season
The greatest proportion of drowning deaths occurred in the summer months last financial year, accounting for 40% (17) of drowning deaths and 54% (38) of non-fatal incidents attended by paramedics. There were four more drowning deaths in the summer months in 2015/16 compared to the 10 year average (35%, 13) from 2005/6 to 2014/15. This may reflect average temperatures, with Victoria experiencing the third-warmest summer on record and the hottest December on record (Bureau of Meteorology, 2016).
There was a similar increase in drowning deaths in spring representing 28% (12) of the total drowning deaths and 34% (24) of non-fatal incidents. These figures may also reflect above-average temperatures, in particular the first half of October had many days typical of summer (Bureau of Meteorology, 2015).
In the previous decade (2005/6 to 2014/15) the majority of drowning incidents occurred in summer (35%), followed by autumn (24%), spring (22%) and winter (20%).
WHERE DID THEY DROWN?
Region
In the last financial year 33% (14) of drowning incidents occurred in major cities in Victoria, 56% (24) occurred in inner regional areas, 7% (3) in outer regional areas and 4% (2) in remote areas in Victoria.
While 61% (20) of those who drowned resided in major cities in Victoria, the drowning rate is higher for those residing in regional areas in Victoria when accounting for the differences in the distribution of the population. There was a 64% increase in the drowning rate of those residing in regional areas of Victoria this year (1.47 per 100,000 population in 2015/16) compared with the 10 year average (0.90 per 100,000 population in 2015/16).
Waterways
The majority of drowning deaths occurred in coastal waterways again in 2015/16 (20, 47%). This represents a 32% increase in drowning deaths in coastal waterways compared with the average over the previous decade (15, 41% from 2005/6 to 2014/15). On a positive note, there was a 24% decrease in drowning deaths in inland waterways in 2015/16 compared to the average over the same 10 year period. This was due to less drowning incidents in rivers/creeks/streams.
Similar to previous years, non-fatal drowning incidents in 2015/16 most often occurred in public swimming pools (31%, 22), bay/beach/ocean environments (29%, 20), and home pools (16%, 11).
32% INCREASE IN DROWNING DEATHS IN COASTAL WATERWAYS.
WHE
N, W
HERE
, WHA
T
Life Saving Victoria Victorian Drowning Report 2015/16 / 14
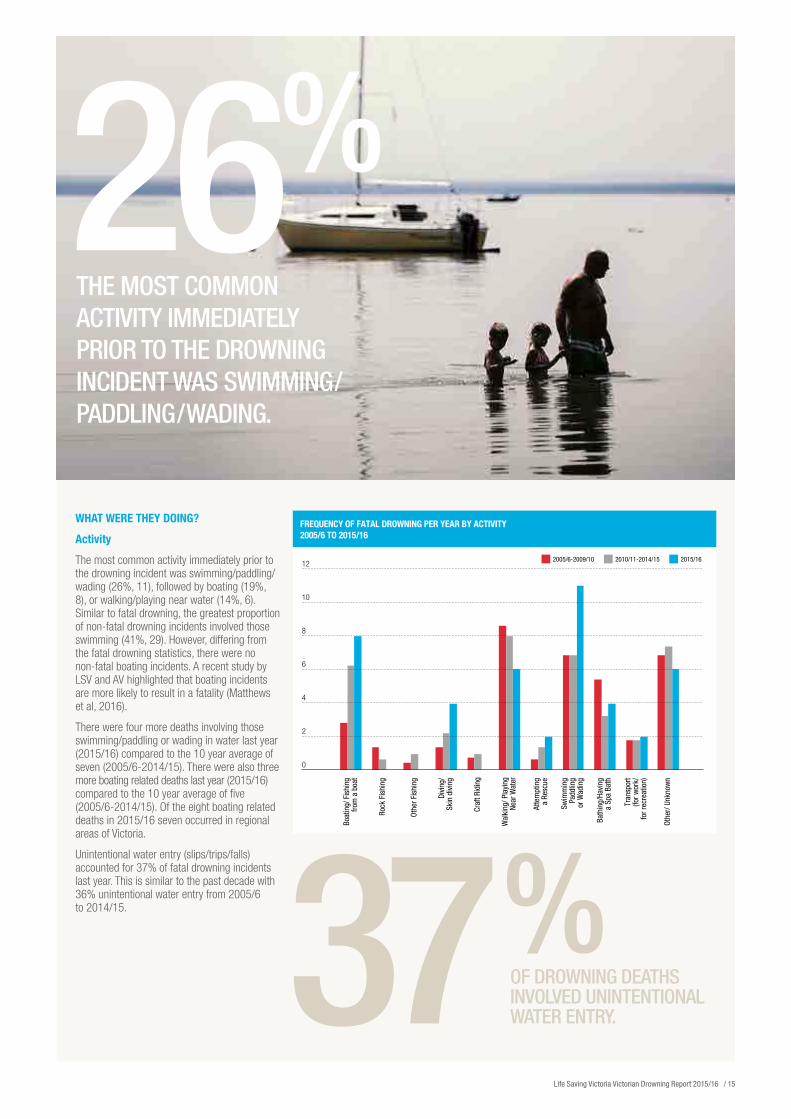
WHAT WERE THEY DOING?
Activity
The most common activity immediately prior to the drowning incident was swimming/paddling/wading (26%, 11), followed by boating (19%, 8), or walking/playing near water (14%, 6). Similar to fatal drowning, the greatest proportion of non-fatal drowning incidents involved those swimming (41%, 29). However, differing from the fatal drowning statistics, there were no non-fatal boating incidents. A recent study by LSV and AV highlighted that boating incidents are more likely to result in a fatality (Matthews et al, 2016).
There were four more deaths involving those swimming/paddling or wading in water last year (2015/16) compared to the 10 year average of seven (2005/6-2014/15). There were also three more boating related deaths last year (2015/16) compared to the 10 year average of five (2005/6-2014/15). Of the eight boating related deaths in 2015/16 seven occurred in regional areas of Victoria.
Unintentional water entry (slips/trips/falls) accounted for 37% of fatal drowning incidents last year. This is similar to the past decade with 36% unintentional water entry from 2005/6 to 2014/15.
26% THE MOST COMMON ACTIVITY IMMEDIATELY PRIOR TO THE DROWNING INCIDENT WAS SWIMMING/PADDLING/WADING.
37% OF DROWNING DEATHS INVOLVED UNINTENTIONAL WATER ENTRY.
Life Saving Victoria Victorian Drowning Report 2015/16 / 15
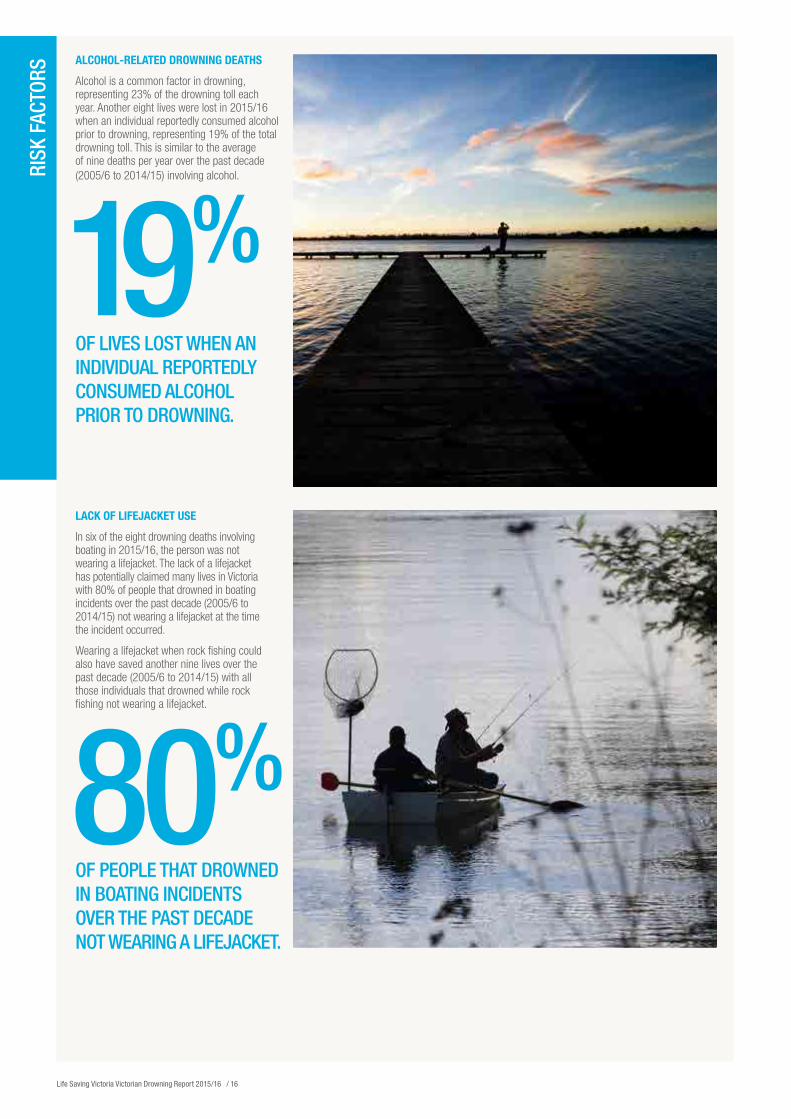
ALCOHOL-RELATED DROWNING DEATHS
Alcohol is a common factor in drowning, representing 23% of the drowning toll each year. Another eight lives were lost in 2015/16 when an individual reportedly consumed alcohol prior to drowning, representing 19% of the total drowning toll. This is similar to the average of nine deaths per year over the past decade (2005/6 to 2014/15) involving alcohol.
LACK OF LIFEJACKET USE
In six of the eight drowning deaths involving boating in 2015/16, the person was not wearing a lifejacket. The lack of a lifejacket has potentially claimed many lives in Victoria with 80% of people that drowned in boating incidents over the past decade (2005/6 to 2014/15) not wearing a lifejacket at the time the incident occurred.
Wearing a lifejacket when rock fishing could also have saved another nine lives over the past decade (2005/6 to 2014/15) with all those individuals that drowned while rock fishing not wearing a lifejacket.
19% OF LIVES LOST WHEN AN INDIVIDUAL REPORTEDLY CONSUMED ALCOHOL PRIOR TO DROWNING.
80% OF PEOPLE THAT DROWNED IN BOATING INCIDENTS OVER THE PAST DECADE NOT WEARING A LIFEJACKET.
RISK
FAC
TORS
Life Saving Victoria Victorian Drowning Report 2015/16 / 16
CORO
NIAL
REC
OMM
ENDA
TION
S
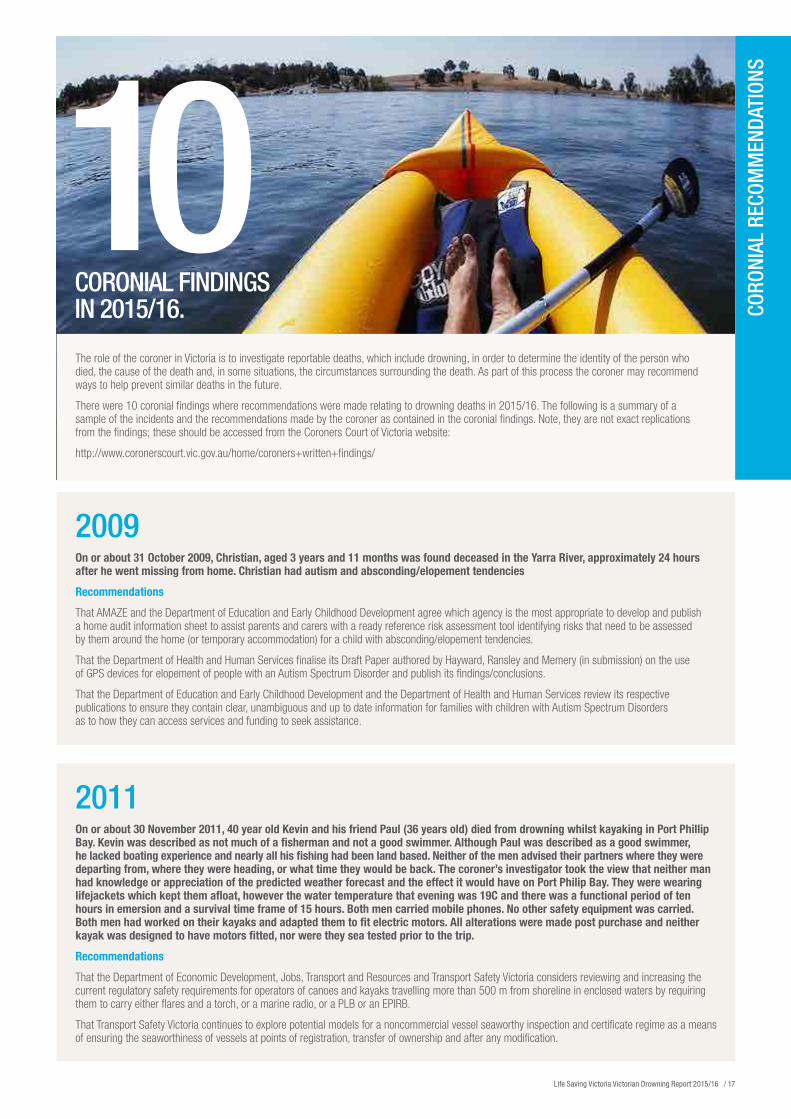
10 CORONIAL FINDINGS IN 2015/16.
The role of the coroner in Victoria is to investigate reportable deaths, which include drowning, in order to determine the identity of the person who died, the cause of the death and, in some situations, the circumstances surrounding the death. As part of this process the coroner may recommend ways to help prevent similar deaths in the future.
There were 10 coronial findings where recommendations were made relating to drowning deaths in 2015/16. The following is a summary of a sample of the incidents and the recommendations made by the coroner as contained in the coronial findings. Note, they are not exact replications from the findings; these should be accessed from the Coroners Court of Victoria website:
http://www.coronerscourt.vic.gov.au/home/coroners+written+findings/
2009On or about 31 October 2009, Christian, aged 3 years and 11 months was found deceased in the Yarra River, approximately 24 hours after he went missing from home. Christian had autism and absconding/elopement tendencies
Recommendations
That AMAZE and the Department of Education and Early Childhood Development agree which agency is the most appropriate to develop and publish a home audit information sheet to assist parents and carers with a ready reference risk assessment tool identifying risks that need to be assessed by them around the home (or temporary accommodation) for a child with absconding/elopement tendencies.
That the Department of Health and Human Services finalise its Draft Paper authored by Hayward, Ransley and Memery (in submission) on the use of GPS devices for elopement of people with an Autism Spectrum Disorder and publish its findings/conclusions.
That the Department of Education and Early Childhood Development and the Department of Health and Human Services review its respective publications to ensure they contain clear, unambiguous and up to date information for families with children with Autism Spectrum Disorders as to how they can access services and funding to seek assistance.
2011On or about 30 November 2011, 40 year old Kevin and his friend Paul (36 years old) died from drowning whilst kayaking in Port Phillip Bay. Kevin was described as not much of a fisherman and not a good swimmer. Although Paul was described as a good swimmer, he lacked boating experience and nearly all his fishing had been land based. Neither of the men advised their partners where they were departing from, where they were heading, or what time they would be back. The coroner’s investigator took the view that neither man had knowledge or appreciation of the predicted weather forecast and the effect it would have on Port Philip Bay. They were wearing lifejackets which kept them afloat, however the water temperature that evening was 19C and there was a functional period of ten hours in emersion and a survival time frame of 15 hours. Both men carried mobile phones. No other safety equipment was carried. Both men had worked on their kayaks and adapted them to fit electric motors. All alterations were made post purchase and neither kayak was designed to have motors fitted, nor were they sea tested prior to the trip.
Recommendations
That the Department of Economic Development, Jobs, Transport and Resources and Transport Safety Victoria considers reviewing and increasing the current regulatory safety requirements for operators of canoes and kayaks travelling more than 500 m from shoreline in enclosed waters by requiring them to carry either flares and a torch, or a marine radio, or a PLB or an EPIRB.
That Transport Safety Victoria continues to explore potential models for a non commercial vessel seaworthy inspection and certificate regime as a means of ensuring the seaworthiness of vessels at points of registration, transfer of ownership and after any modification.
Life Saving Victoria Victorian Drowning Report 2015/16 / 17
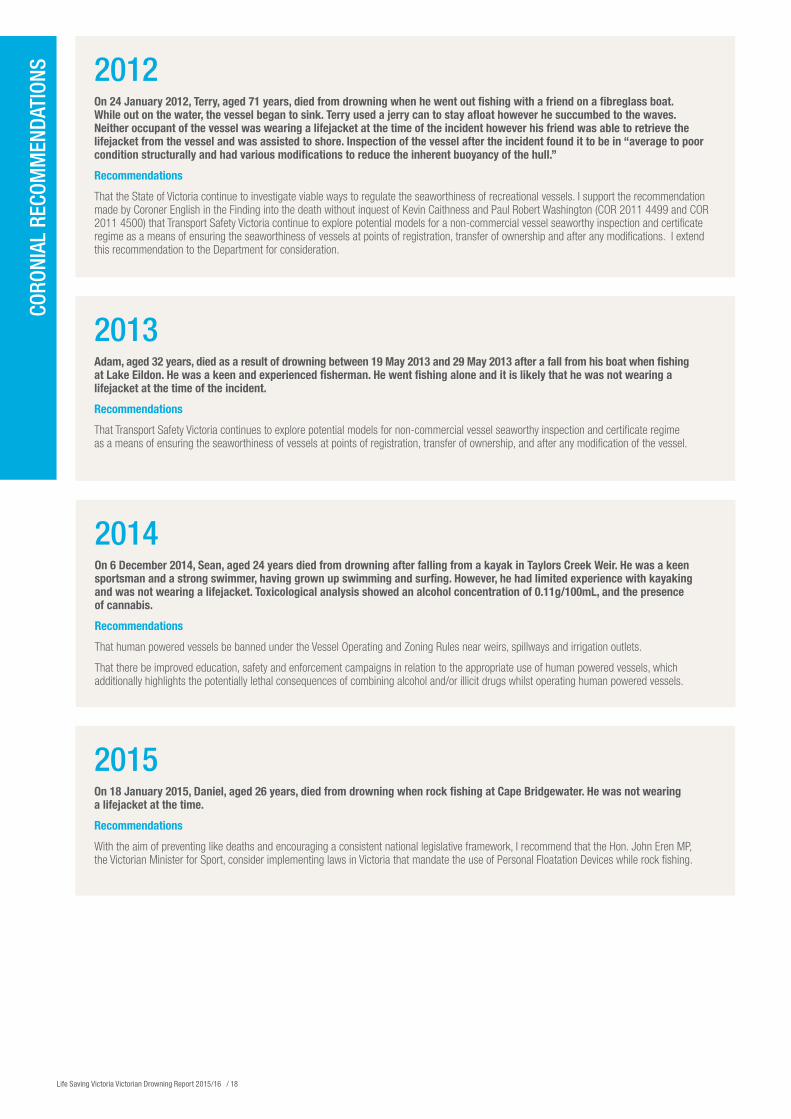
2012On 24 January 2012, Terry, aged 71 years, died from drowning when he went out fishing with a friend on a fibreglass boat. While out on the water, the vessel began to sink. Terry used a jerry can to stay afloat however he succumbed to the waves. Neither occupant of the vessel was wearing a lifejacket at the time of the incident however his friend was able to retrieve the lifejacket from the vessel and was assisted to shore. Inspection of the vessel after the incident found it to be in “average to poor condition structurally and had various modifications to reduce the inherent buoyancy of the hull.”
Recommendations
That the State of Victoria continue to investigate viable ways to regulate the seaworthiness of recreational vessels. I support the recommendation made by Coroner English in the Finding into the death without inquest of Kevin Caithness and Paul Robert Washington (COR 2011 4499 and COR 2011 4500) that Transport Safety Victoria continue to explore potential models for a non-commercial vessel seaworthy inspection and certificate regime as a means of ensuring the seaworthiness of vessels at points of registration, transfer of ownership and after any modifications. I extend this recommendation to the Department for consideration.
2013Adam, aged 32 years, died as a result of drowning between 19 May 2013 and 29 May 2013 after a fall from his boat when fishing at Lake Eildon. He was a keen and experienced fisherman. He went fishing alone and it is likely that he was not wearing a lifejacket at the time of the incident.
Recommendations
That Transport Safety Victoria continues to explore potential models for non-commercial vessel seaworthy inspection and certificate regime as a means of ensuring the seaworthiness of vessels at points of registration, transfer of ownership, and after any modification of the vessel.
2014On 6 December 2014, Sean, aged 24 years died from drowning after falling from a kayak in Taylors Creek Weir. He was a keen sportsman and a strong swimmer, having grown up swimming and surfing. However, he had limited experience with kayaking and was not wearing a lifejacket. Toxicological analysis showed an alcohol concentration of 0.11g/100mL, and the presence of cannabis.
Recommendations
That human powered vessels be banned under the Vessel Operating and Zoning Rules near weirs, spillways and irrigation outlets.
That there be improved education, safety and enforcement campaigns in relation to the appropriate use of human powered vessels, which additionally highlights the potentially lethal consequences of combining alcohol and/or illicit drugs whilst operating human powered vessels.
2015On 18 January 2015, Daniel, aged 26 years, died from drowning when rock fishing at Cape Bridgewater. He was not wearing a lifejacket at the time.
Recommendations
With the aim of preventing like deaths and encouraging a consistent national legislative framework, I recommend that the Hon. John Eren MP, the Victorian Minister for Sport, consider implementing laws in Victoria that mandate the use of Personal Floatation Devices while rock fishing.
CORO
NIAL
REC
OMM
ENDA
TION
S
Life Saving Victoria Victorian Drowning Report 2015/16 / 18
SNAP
SHOT
MUR
RAY
RIVE
R DR
OWNI
NG 2
005/
6 TO
201
4/15
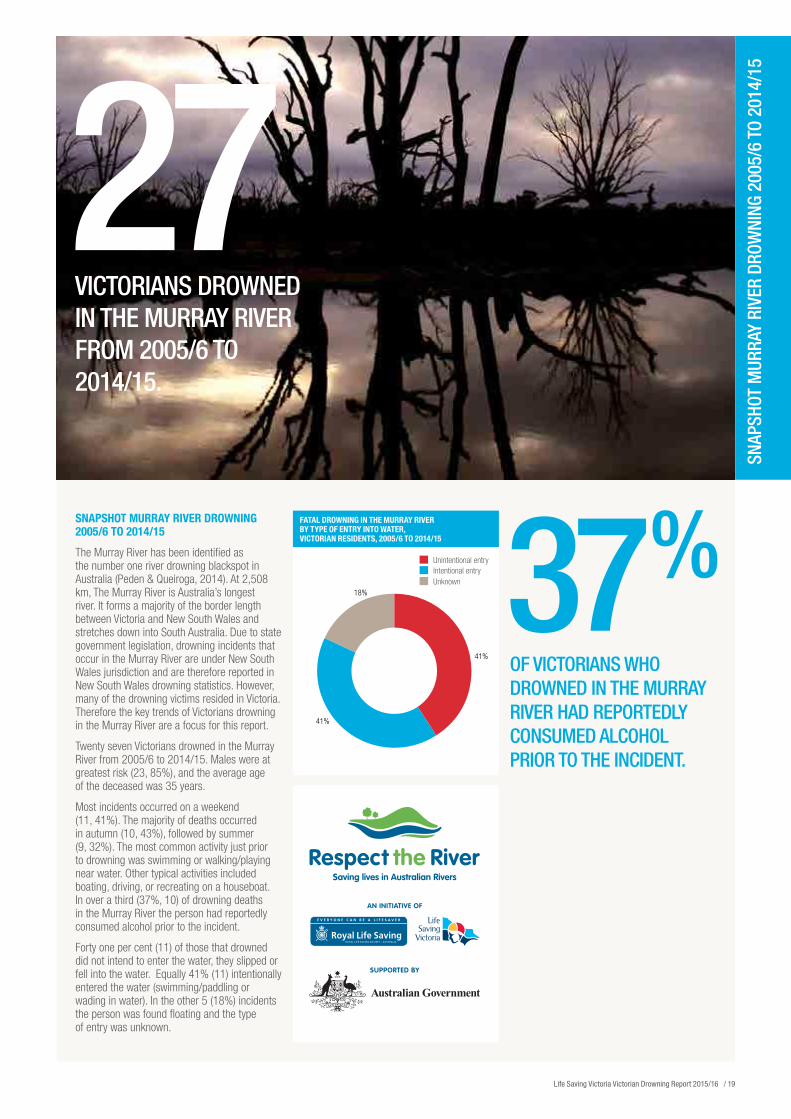
27VICTORIANS DROWNED IN THE MURRAY RIVER FROM 2005/6 TO 2014/15.
SNAPSHOT MURRAY RIVER DROWNING 2005/6 TO 2014/15
The Murray River has been identified as the number one river drowning blackspot in Australia (Peden & Queiroga, 2014). At 2,508 km, The Murray River is Australia’s longest river. It forms a majority of the border length between Victoria and New South Wales and stretches down into South Australia. Due to state government legislation, drowning incidents that occur in the Murray River are under New South Wales jurisdiction and are therefore reported in New South Wales drowning statistics. However, many of the drowning victims resided in Victoria. Therefore the key trends of Victorians drowning in the Murray River are a focus for this report.
Twenty seven Victorians drowned in the Murray River from 2005/6 to 2014/15. Males were at greatest risk (23, 85%), and the average age of the deceased was 35 years.
Most incidents occurred on a weekend (11, 41%). The majority of deaths occurred in autumn (10, 43%), followed by summer (9, 32%). The most common activity just prior to drowning was swimming or walking/playing near water. Other typical activities included boating, driving, or recreating on a houseboat. In over a third (37%, 10) of drowning deaths in the Murray River the person had reportedly consumed alcohol prior to the incident.
Forty one per cent (11) of those that drowned did not intend to enter the water, they slipped or fell into the water. Equally 41% (11) intentionally entered the water (swimming/paddling or wading in water). In the other 5 (18%) incidents the person was found floating and the type of entry was unknown.
37% OF VICTORIANS WHO DROWNED IN THE MURRAY RIVER HAD REPORTEDLY CONSUMED ALCOHOL PRIOR TO THE INCIDENT.
FATAL DROWNING IN THE MURRAY RIVER BY TYPE OF ENTRY INTO WATER, VICTORIAN RESIDENTS, 2005/6 TO 2014/15
Intentional entryUnintentional entry
Unknown18%
41%
41%
Life Saving Victoria Victorian Drowning Report 2015/16 / 19
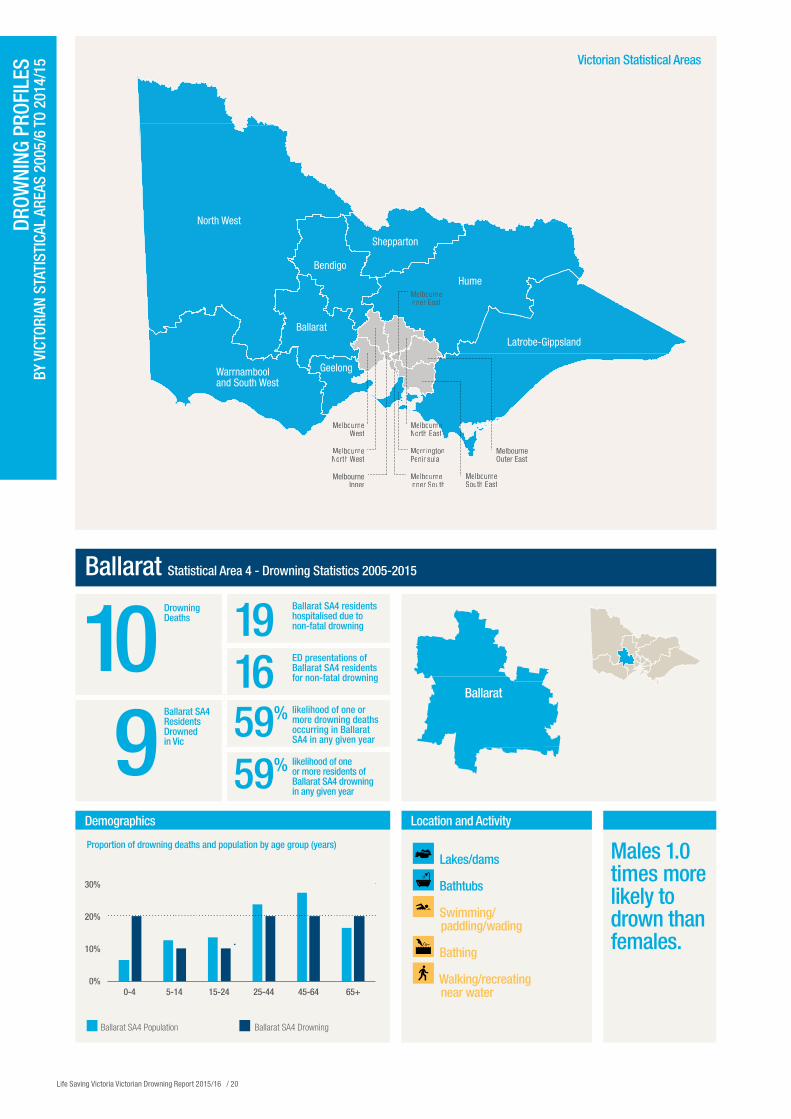
Ballarat Statistical Area 4 - Drowning Statistics 2005-2015
Proportion of drowning deaths and population by age group (years)
Ballarat SA4 Population Ballarat SA4 Drowning
30%
20%
10%
0%0-4 5-14 15-24 25-44 45-64 65+
Demographics
Ballarat
Victorian Statistical Areas
DROW
NING
PRO
FILE
S BY
VIC
TORI
AN S
TATI
STIC
AL A
REAS
200
5/6
TO 2
014/
15
10Drowning Deaths 19 Ballarat SA4 residents
hospitalised due to non-fatal drowning
16 ED presentations of Ballarat SA4 residents for non-fatal drowning
9Ballarat SA4 Residents Drowned in Vic
59% likelihood of one or more drowning deaths occurring in Ballarat SA4 in any given year
59% likelihood of one or more residents of Ballarat SA4 drowning in any given year
Lakes/dams
Bathtubs
Swimming/ paddling/wading
Bathing
Walking/recreating near water
Location and Activity
Males 1.0 times more likely to drown than females.
Life Saving Victoria Victorian Drowning Report 2015/16 / 20
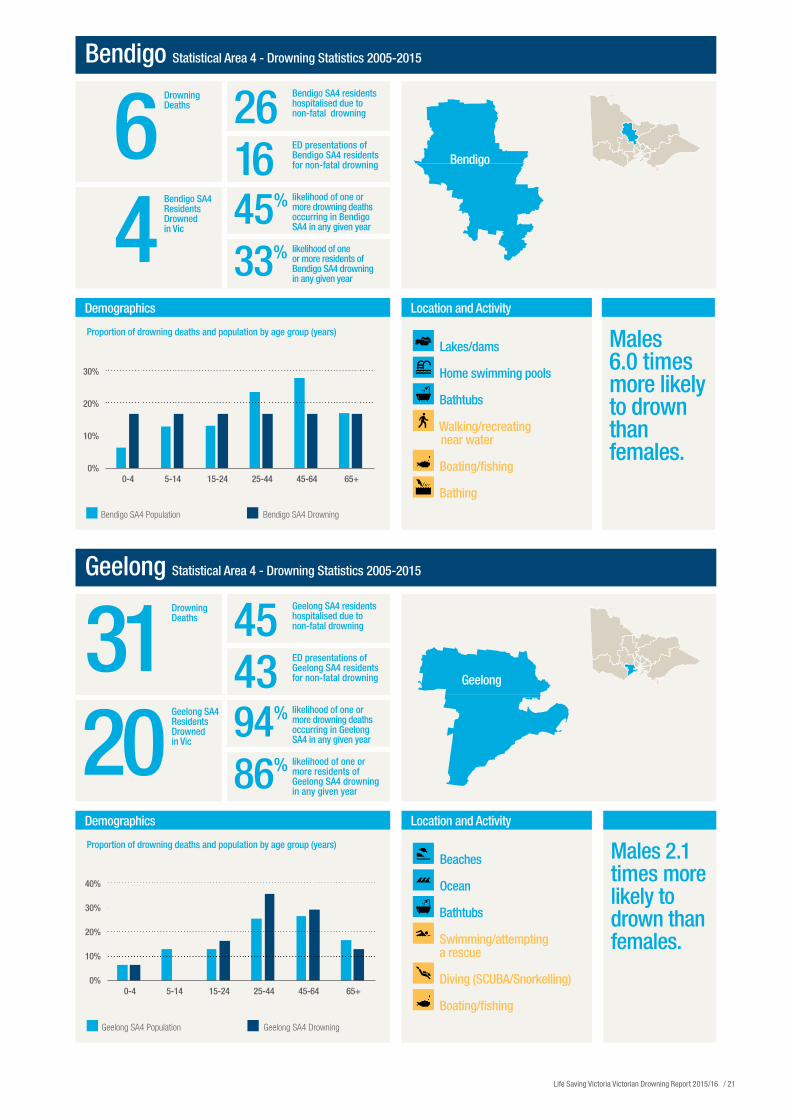
Geelong Statistical Area 4 - Drowning Statistics 2005-2015
Bendigo Statistical Area 4 - Drowning Statistics 2005-2015
Proportion of drowning deaths and population by age group (years)
Proportion of drowning deaths and population by age group (years)
Demographics
Demographics
Beaches
Ocean
Bathtubs
Swimming/attempting a rescue
Diving (SCUBA/Snorkelling)
Boating/fishing
Location and Activity
Lakes/dams
Home swimming pools
Bathtubs
Walking/recreating near water
Boating/fishing
Bathing
Location and Activity
Males 2.1 times more likely to drown than females.
Males 6.0 times more likely to drown than females.
Bendigo SA4 Population Bendigo SA4 Drowning
30%
20%
10%
0%0-4 5-14 15-24 25-44 45-64 65+
Bendigo
Geelong
Geelong SA4 Population Geelong SA4 Drowning
40%
30%
20%
10%
0%0-4 5-14 15-24 25-44 45-64 65+
6Drowning Deaths 26 Bendigo SA4 residents
hospitalised due to non-fatal drowning
16 ED presentations of Bendigo SA4 residents for non-fatal drowning
4Bendigo SA4 Residents Drowned in Vic
45% likelihood of one or more drowning deaths occurring in Bendigo SA4 in any given year
33% likelihood of one or more residents of Bendigo SA4 drowning in any given year
31Drowning Deaths 45 Geelong SA4 residents
hospitalised due to non-fatal drowning
43 ED presentations of Geelong SA4 residents for non-fatal drowning
20Geelong SA4 Residents Drowned in Vic
94% likelihood of one or more drowning deaths occurring in Geelong SA4 in any given year
86% likelihood of one or more residents of Geelong SA4 drowning in any given year
Life Saving Victoria Victorian Drowning Report 2015/16 / 21
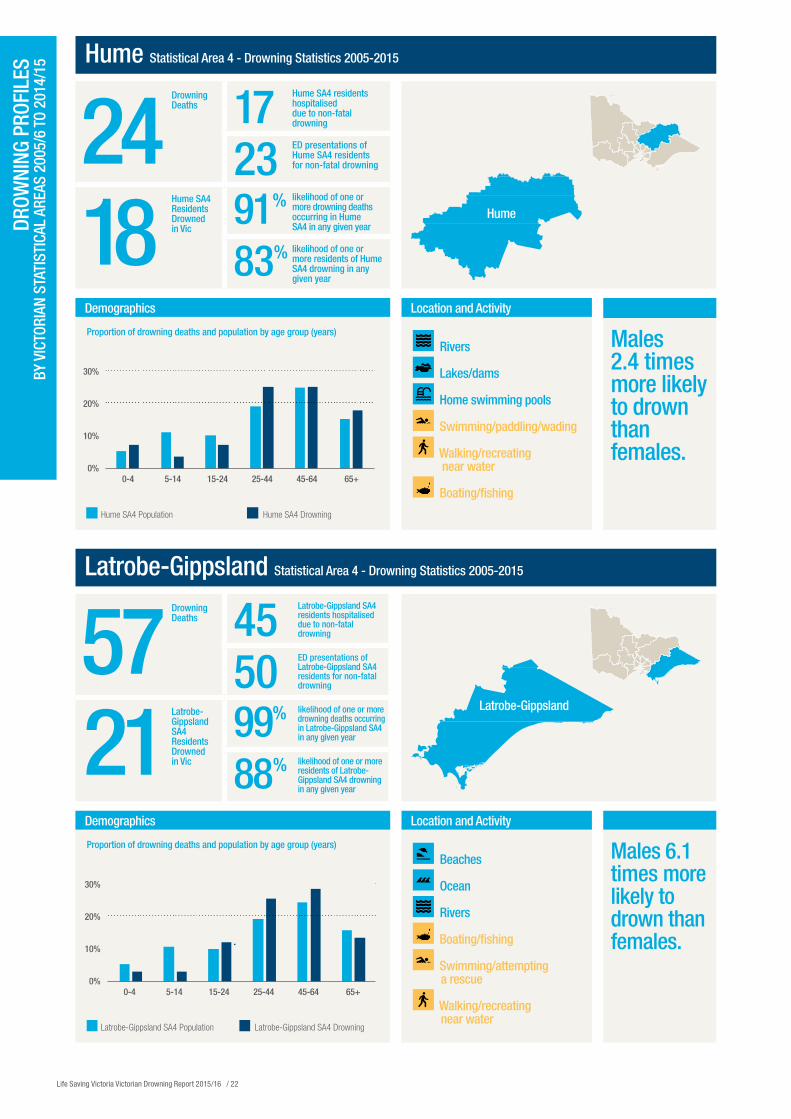
Latrobe-Gippsland Statistical Area 4 - Drowning Statistics 2005-2015
Hume Statistical Area 4 - Drowning Statistics 2005-2015
Proportion of drowning deaths and population by age group (years)
Proportion of drowning deaths and population by age group (years)
Latrobe-Gippsland SA4 Population Latrobe-Gippsland SA4 Drowning
30%
20%
10%
0%0-4 5-14 15-24 25-44 45-64 65+
Demographics
Demographics
DROW
NING
PRO
FILE
S BY
VIC
TORI
AN S
TATI
STIC
AL A
REAS
200
5/6
TO 2
014/
15
57Drowning Deaths 45 Latrobe-Gippsland SA4
residents hospitalised due to non-fatal drowning
50 ED presentations of Latrobe-Gippsland SA4 residents for non-fatal drowning
21Latrobe-Gippsland SA4 Residents Drowned in Vic
99% likelihood of one or more drowning deaths occurring in Latrobe-Gippsland SA4 in any given year
88% likelihood of one or more residents of Latrobe-Gippsland SA4 drowning in any given year
Beaches
Ocean
Rivers
Boating/fishing
Swimming/attempting a rescue
Walking/recreating near water
Location and Activity
Rivers
Lakes/dams
Home swimming pools
Swimming/paddling/wading
Walking/recreating near water
Boating/fishing
Location and Activity
Males 6.1 times more likely to drown than females.
Males 2.4 times more likely to drown than females.
Hume SA4 Population Hume SA4 Drowning
30%
20%
10%
0%0-4 5-14 15-24 25-44 45-64 65+
24Drowning Deaths 17 Hume SA4 residents
hospitalised due to non-fatal drowning
23 ED presentations of Hume SA4 residents for non-fatal drowning
18Hume SA4 Residents Drowned in Vic
91% likelihood of one or more drowning deaths occurring in Hume SA4 in any given year
83% likelihood of one or more residents of Hume SA4 drowning in any given year
Hume
Latrobe-Gippsland
Life Saving Victoria Victorian Drowning Report 2015/16 / 22
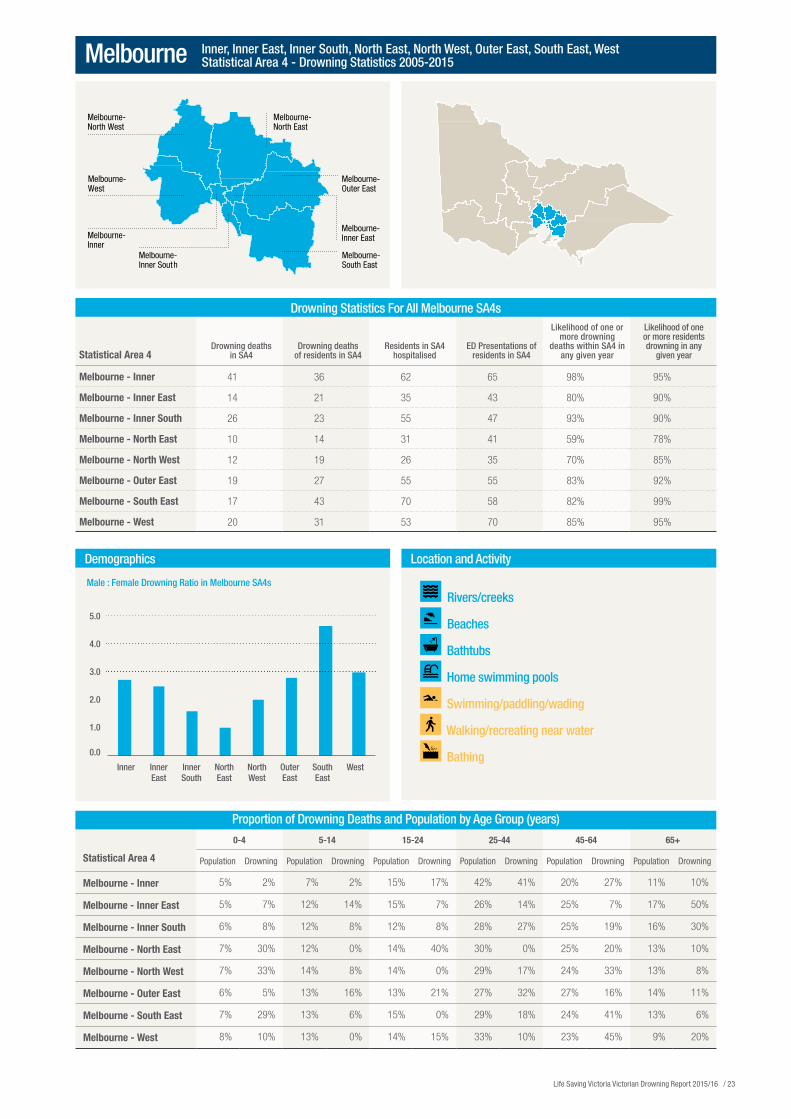
Proportion of Drowning Deaths and Population by Age Group (years)
0-4 5-14 15-24 25-44 45-64 65+
Statistical Area 4 Population Drowning Population Drowning Population Drowning Population Drowning Population Drowning Population Drowning
Melbourne - Inner 5% 2% 7% 2% 15% 17% 42% 41% 20% 27% 11% 10%
Melbourne - Inner East 5% 7% 12% 14% 15% 7% 26% 14% 25% 7% 17% 50%
Melbourne - Inner South 6% 8% 12% 8% 12% 8% 28% 27% 25% 19% 16% 30%
Melbourne - North East 7% 30% 12% 0% 14% 40% 30% 0% 25% 20% 13% 10%
Melbourne - North West 7% 33% 14% 8% 14% 0% 29% 17% 24% 33% 13% 8%
Melbourne - Outer East 6% 5% 13% 16% 13% 21% 27% 32% 27% 16% 14% 11%
Melbourne - South East 7% 29% 13% 6% 15% 0% 29% 18% 24% 41% 13% 6%
Melbourne - West 8% 10% 13% 0% 14% 15% 33% 10% 23% 45% 9% 20%
Melbourne-North West
Melbourne-North East
Melbourne-Outer East
Melbourne-Inner
Melbourne-West
Melbourne-Inner South
Melbourne-Inner East
Melbourne-South East
Male : Female Drowning Ratio in Melbourne SA4s
Demographics
Rivers/creeks
Beaches
Bathtubs
Home swimming pools
Swimming/paddling/wading
Walking/recreating near water
Bathing
Location and Activity
5.0
4.0
3.0
2.0
1.0
0.0
Inner Inner East
Inner South
North East
North West
Outer East
South East
West
Melbourne Inner, Inner East, Inner South, North East, North West, Outer East, South East, West Statistical Area 4 - Drowning Statistics 2005-2015
Drowning Statistics For All Melbourne SA4s
Statistical Area 4Drowning deaths
in SA4Drowning deaths
of residents in SA4Residents in SA4
hospitalisedED Presentations of
residents in SA4
Likelihood of one or more drowning
deaths within SA4 in any given year
Likelihood of one or more residents drowning in any
given year
Melbourne - Inner 41 36 62 65 98% 95%
Melbourne - Inner East 14 21 35 43 80% 90%
Melbourne - Inner South 26 23 55 47 93% 90%
Melbourne - North East 10 14 31 41 59% 78%
Melbourne - North West 12 19 26 35 70% 85%
Melbourne - Outer East 19 27 55 55 83% 92%
Melbourne - South East 17 43 70 58 82% 99%
Melbourne - West 20 31 53 70 85% 95%
Life Saving Victoria Victorian Drowning Report 2015/16 / 23
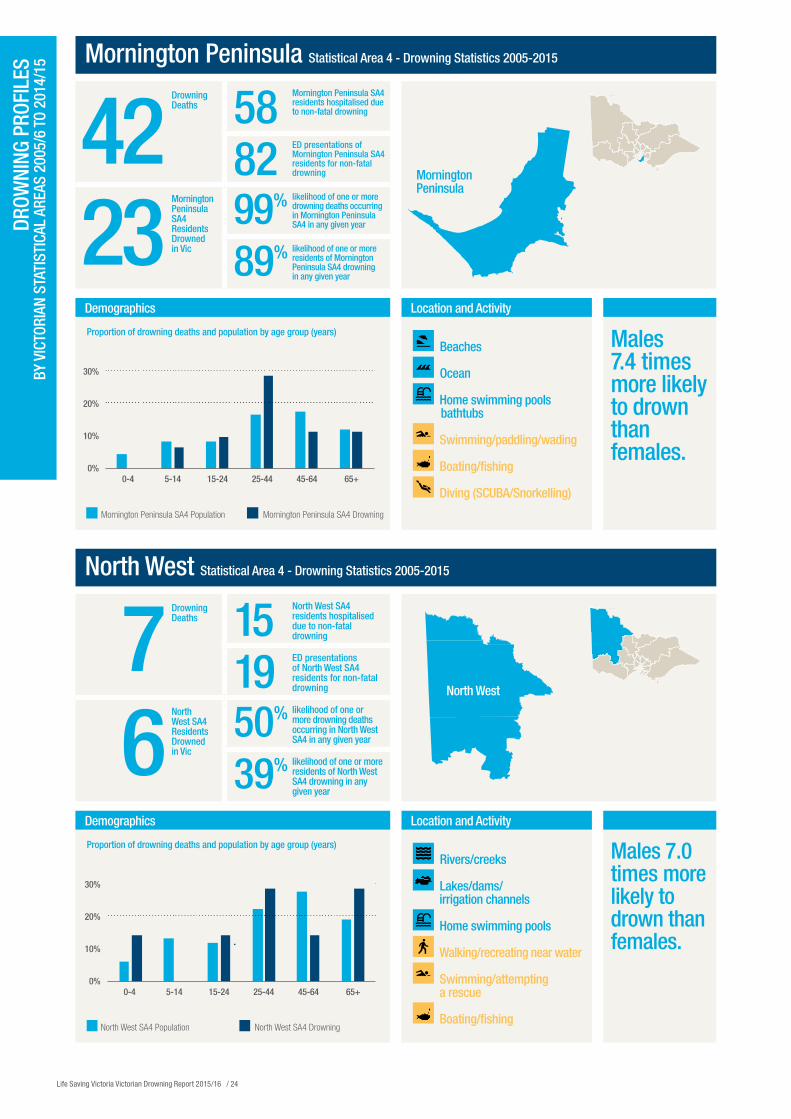
North West Statistical Area 4 - Drowning Statistics 2005-2015
Mornington Peninsula Statistical Area 4 - Drowning Statistics 2005-2015
Proportion of drowning deaths and population by age group (years)
Proportion of drowning deaths and population by age group (years)
North West SA4 Population North West SA4 Drowning
30%
20%
10%
0%0-4 5-14 15-24 25-44 45-64 65+
Demographics
Demographics
DROW
NING
PRO
FILE
S BY
VIC
TORI
AN S
TATI
STIC
AL A
REAS
200
5/6
TO 2
014/
15
7Drowning Deaths 15 North West SA4
residents hospitalised due to non-fatal drowning
19 ED presentations of North West SA4 residents for non-fatal drowning
6North West SA4 Residents Drowned in Vic
50% likelihood of one or more drowning deaths occurring in North West SA4 in any given year
39% likelihood of one or more residents of North West SA4 drowning in any given year
Rivers/creeks
Lakes/dams/ irrigation channels
Home swimming pools
Walking/recreating near water
Swimming/attempting a rescue
Boating/fishing
Location and Activity
Beaches
Ocean
Home swimming pools bathtubs
Swimming/paddling/wading
Boating/fishing
Diving (SCUBA/Snorkelling)
Location and Activity
Males 7.0 times more likely to drown than females.
Males 7.4 times more likely to drown than females.
Mornington Peninsula SA4 Population Mornington Peninsula SA4 Drowning
30%
20%
10%
0%0-4 5-14 15-24 25-44 45-64 65+
42Drowning Deaths 58 Mornington Peninsula SA4
residents hospitalised due to non-fatal drowning
82 ED presentations of Mornington Peninsula SA4 residents for non-fatal drowning
23Mornington Peninsula SA4 Residents Drowned in Vic
99% likelihood of one or more drowning deaths occurring in Mornington Peninsula SA4 in any given year
89% likelihood of one or more residents of Mornington Peninsula SA4 drowning in any given year
Mornington Peninsula
North West
Life Saving Victoria Victorian Drowning Report 2015/16 / 24
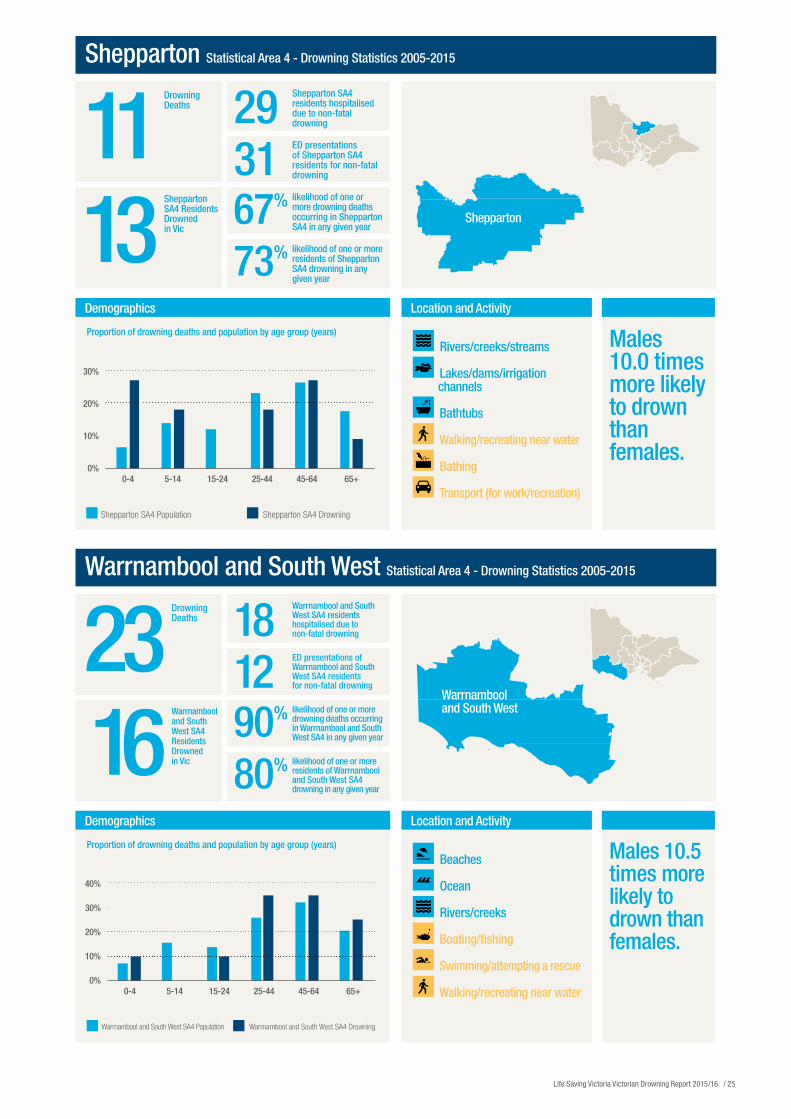
Warrnambool and South West Statistical Area 4 - Drowning Statistics 2005-2015
Shepparton Statistical Area 4 - Drowning Statistics 2005-2015
Proportion of drowning deaths and population by age group (years)
Proportion of drowning deaths and population by age group (years)
Demographics
Demographics
Beaches
Ocean
Rivers/creeks
Boating/fishing
Swimming/attempting a rescue
Walking/recreating near water
Location and Activity
Rivers/creeks/streams
Lakes/dams/irrigation channels
Bathtubs
Walking/recreating near water
Bathing
Transport (for work/recreation)
Location and Activity
Males 10.5 times more likely to drown than females.
Males 10.0 times more likely to drown than females.
Shepparton SA4 Population Shepparton SA4 Drowning
30%
20%
10%
0%0-4 5-14 15-24 25-44 45-64 65+
Warrnambool and South West SA4 Population Warrnambool and South West SA4 Drowning
40%
30%
20%
10%
0%0-4 5-14 15-24 25-44 45-64 65+
11Drowning Deaths 29 Shepparton SA4
residents hospitalised due to non-fatal drowning
31 ED presentations of Shepparton SA4 residents for non-fatal drowning
13Shepparton SA4 Residents Drowned in Vic
67% likelihood of one or more drowning deaths occurring in Shepparton SA4 in any given year
73% likelihood of one or more residents of Shepparton SA4 drowning in any given year
23Drowning Deaths 18 Warrnambool and South
West SA4 residents hospitalised due to non-fatal drowning
12 ED presentations of Warrnambool and South West SA4 residents for non-fatal drowning
16Warrnambool and South West SA4 Residents Drowned in Vic
90% likelihood of one or more drowning deaths occurring in Warrnambool and South West SA4 in any given year
80% likelihood of one or more residents of Warrnambool and South West SA4 drowning in any given year
Shepparton
Warrnambool and South West
Life Saving Victoria Victorian Drowning Report 2015/16 / 25
AGENCY
Life Saving Victoria
Aquatics & Recreation Victoria
Australian Sailing
Australian Volunteer Coast Guard
AUSTSWIM
Belgravia Leisure
Boating Industry Association
Canoeing Victoria
Coroners Prevention Unit
Kidsafe Victoria
Surfing Victoria
Swimming Pool and Spa Association of Victoria
Swimming Victoria
Victorian Municipal Building Surveyors Group
Victorian Recreational Fishing
YMCA Victoria
GOVERNMENT ENTITIES
Country Fire Authority
Department of Education and Training
Department of Environment, Land, Water & Planning
Department of Justice and Regulation
Emergency Management Victoria
Emergency Services Telecommunications Authority
Municipal Association of Victoria
Parks Victoria
Royal Children’s Hospital Safety Centre
Transport Safety Victoria
Tourism Victoria
Victoria Police
Victorian Building Authority
Victorian Multicultural Commission
Victorian Coastal Council
REFERENCES
Australian Bureau of Statistics. (2011). Australian Standard Geographical Classification (ASGC), July 2011. Cat. No. 1216.0. Australian Bureau of Statistics: Canberra.
Australian Bureau of Statistics. (2014). Australian Demographic Statistics, Mar 2015. Cat. No. 3101.0, Australian Bureau of Statistics: Canberra.
Australian Water Safety Council. (2016). Australian Water Safety Strategy 2016-20. Australian Water safety Council: Sydney.
Birch, R., Matthews, B., Petrass, L. and Blitvich, J. (2016). A pilot study evaluating a Before School Survival Swimming Program. Life Saving Victoria: Melbourne.
Bureau of Meteorology. (2015). Seasonal Climate Summary for Victoria: Victoria in spring 2015. http://www.bom.gov.au/climate/current/season/vic/archive/201511.summary.shtml
Bureau of Meteorology. (2016). Seasonal Climate Summary for Victoria: Victoria in summer 2015-16. http://www.bom.gov.au/climate/current/season/vic/archive/201602.summary.shtml
Department of Human Services Multicultural Strategy Unit. (2002). Cited in Department of Human Services (2004), Cultural and Linguistic Diversity Strategy: Planning and Delivering Culturally Appropriate Supports for People with a Disability, Their Families and Carers. Department of Human Services: Melbourne.
Department of Sustainability and Environment. (2011). My Victorian Waterway: Personal Connections with Rivers, Estuaries and Wetlands in Victoria. Victorian Department of Sustainability and Environment: Melbourne.
Matthews, B. L., Andrew, E., Andronaco, R., Cox, S., & Smith, K. (2016). Epidemiology of fatal and non-fatal drowning patients attended by paramedics in Victoria, Australia. International Journal of Injury Control and Safety Promotion, DOI: 10.1080/17457300.2016.1175479
Office of Best Practice Regulation. (2014). Best Practice Regulation Guidance Note Value of statistical life. Department of the Prime Minister and Cabinet: Canberra.
Peden, A. & Queiroga, A. C. (2014). Drowning deaths in Australian rivers, creeks and streams: A 10 year analysis. Royal Life Saving Society – Australia: Sydney.
PricewaterhouseCoopers. (2011). What is the Economic Contribution of Surf Life Saving in Australia. PricewaterhouseCoopers International Limited: Australia.
Short, A. (1996). Beaches of the Victorian Coast & Port Phillip Bay: A guide to their nature, characteristics, surf and safety. University of NSW: Sydney
Victorian Aquatic Industry Council. (2001). Victorian Aquatic Industry Basic Facts: Strategic Advice 2001, Sport and Recreation Victoria. Victorian Aquatic Industry Council: Melbourne.
Victorian Water Safety Assembly. (2016). Victorian Water Safety Strategy 2016-2020. Victorian Water Safety Assembly: Melbourne.
VICT
ORIA
N W
ATER
SAF
ETY
INDU
STRY
Life Saving Victoria Victorian Drowning Report 2015/16 / 26
“ THE ANALYSIS OF DROWNING INCIDENTS WITHIN THIS REPORT HELPS US TO IDENTIFY BOTH ONGOING AND EMERGING DROWNING TRENDS, SO WE CAN BEST TARGET OUR PREVENTION EFFORTS FOR ALL VICTORIANS TO ENJOY OUR WATERWAYS SAFELY.” Nigel Taylor Chief Executive Officer, Life Saving Victoria
Life Saving Victoria Victorian Drowning Report 2015/16 / 27
Life Saving Victoria
200 The Boulevard Port Melbourne VIC 3207PO Box 353 South Melbourne DC VIC 3205
Tel (03) 9676 6900Fax (03) 9681 [email protected]