Embed Size (px)
Citation preview
Prepared: Population Health Team Counties Manukau Health
Life Expectancy, Leading Causes of Death and Amenable Mortality
in Counties Manukau. 2015 update
Wing Cheuk Chan, Dean Papa, Doone Winnard
Disclaimer Information within the report may be freely used provided the source is acknowledged. Every effort has been made to ensure that the information in this report is correct. Counties Manukau Health and the authors will not accept any responsibility for information which is incorrect, or any actions taken as a result of the information in this report. Published in September 2016 By Counties Manukau Health Private Bag 94052 South Auckland Mail Centre Manukau City New Zealand Suggested citation: Chan WC, Papa D, Winnard D (2016) Life expectancy, leading causes of death and amendable mortality in Counties Manukau. 2015 update. Auckland: Counties Manukau Health.
Counties Manukau Health 3
Summary The overall life expectancy at birth in Counties Manukau (CM) was 81.7 years in 2015. The improvement of
1.9 years in life expectancy from 2006 to 2015 was similar to the national average (1.8 years) over the same
time period. However, the rate of improvement in overall CM life expectancy in the last three years
appears to be more modest compared to the improvement in the earlier years.
There was an increase in life expectancy of 3.8 and 1.9 years for Maaori and Pacific people respectively
from 2006 to 2015 compared to an improvement of life expectancy of 1.6 years in the Non-Maaori, Non-
Pacific group.
In 2015, the gap of life expectancy between Maaori (LE=74.8) and the Non-Maaori, Non-Pacific group in
Counties Manukau (LE=84.0) was 9 years. The gap between Pacific (LE=76.6) and Non-Maaori, Non-Pacific
was 7 years.
According to the recently published Global Burden of Disease Study, the rate of improvement in New
Zealand for both life expectancy and healthy life expectancy from 1990 to 2013 is one of the fastest in the
developed world. Consistent with many most developed countries, New Zealanders are living longer in
healthy life years, but also living longer in unhealthy life years.
Cancer and Cardiovascular disease (particularly heart attacks and stroke) along with chronic obstructive
pulmonary disease and diabetes continue to be leading causes of death in Counties Manukau in 2013 (the
latest year with cause of death data available). Amendable mortality, which is one of the Ministry of Health
new national System Level Measures, currently accounts for about 23% of total deaths in Counties
Manukau. Actions to reduce smoking prevalence, hazardous use of alcohol and the prevention and
management of cardiovascular risk factors including diabetes are key areas to reduce amenable mortality,
narrow life expectancy gaps in the medium to long term, and advance the goal of healthy life years gain.
Introduction
In July 2015, the Counties Manukau District Health Board signed off a new strategy for Counties Manukau
Health (CM Health), “Healthy Together” that commits to the strategic goal:
“Together, the Counties Manukau health system will work with others to achieve equity in key
health indicators for Maaori, Pacific and communities with health disparities by 2020.”
The intent is that people live longer healthier lives in our communities and there is a commitment to
measure the impact we have on healthy life years every year.
In addition, amenable mortality rates will be one of four system level measures (SLMs) to be implemented
nationally from 1 July 2016 to measure the performance of the whole of health system at a district level.
This report provides an update on life expectancy at birth for the Counties Manukau population (normally
generated annually), along with a baseline for healthy life years and amenable mortality to inform actions
to impact our Healthy Together health equity goal and the amenable mortality national SLM.
Counties Manukau Health 4
Methods
Life expectancy at birth in 2015 refers to the average number of years that a new born child is expected to
live, if they are born now and experience the 2015 age specific mortality rates over the rest of their life.
This update is based on the 2015 provisional mortality data supplied by the Ministry of Health. As in
previous years, at the time of data extract (in this instance April 2016), the number of infant deaths in 2014
and 2015 were not considered to be complete. The shortfall in infant deaths because of late registration
means when those deaths are registered and included in next year’s data, it is expected to decrease life
expectancy estimates in the latest year by about 0.2-0.3 years, based on the degree of late registration
historically. Therefore, the latest 2015 life expectancy estimate may be a slight overestimate and should be
interpreted as part of a longer term trend. It also means the trend figures here may differ slightly from
previous reports.
The life expectancy estimates are calculated based on date of death in a calendar year rather than based on
year of registration of death. The life expectancy estimates in this report are calculated using Chiang II (life
table) methodology up to 85+ year age bands, similar to the methods used by Statistics New Zealand.
Computation of healthy life expectancy is relatively complex. How ‘healthy’ life is defined is obviously a
value judgement and will differ between people. Technical definitions are available for the methods used in
the Global Burden of Disease (GBD) study which estimates healthy life years;1 these methods essentially
draw on groups of people rating quality of life in various states of ill-health. Direct estimates for healthy life
years are not available at a DHB level. For this report estimates from the Global Burden of Disease study for
New Zealand 2 are used as indicative and applied to the CM population, recognising there will be a variety
of factors that may challenge the assumptions made in doing so.
In relation to equity, the future GBD results are expected to have Maaori and non-Maaori results but not
specific results for other ethnic groups in New Zealand, and estimates of healthy life years only at total
population level. It is important and more productive to continue efforts to examine equity by looking at
morbidity and mortality by ethnicity to explore drivers for ill-health, along with
whaanau and community strengths that contribute to health.
This can identify areas that can be addressed to accelerate gains for Maaori and Pacific peoples and those
living in areas of higher socioeconomic deprivation, where current inequities are concentrated.
Counties Manukau Health 5
Results Life Expectancy
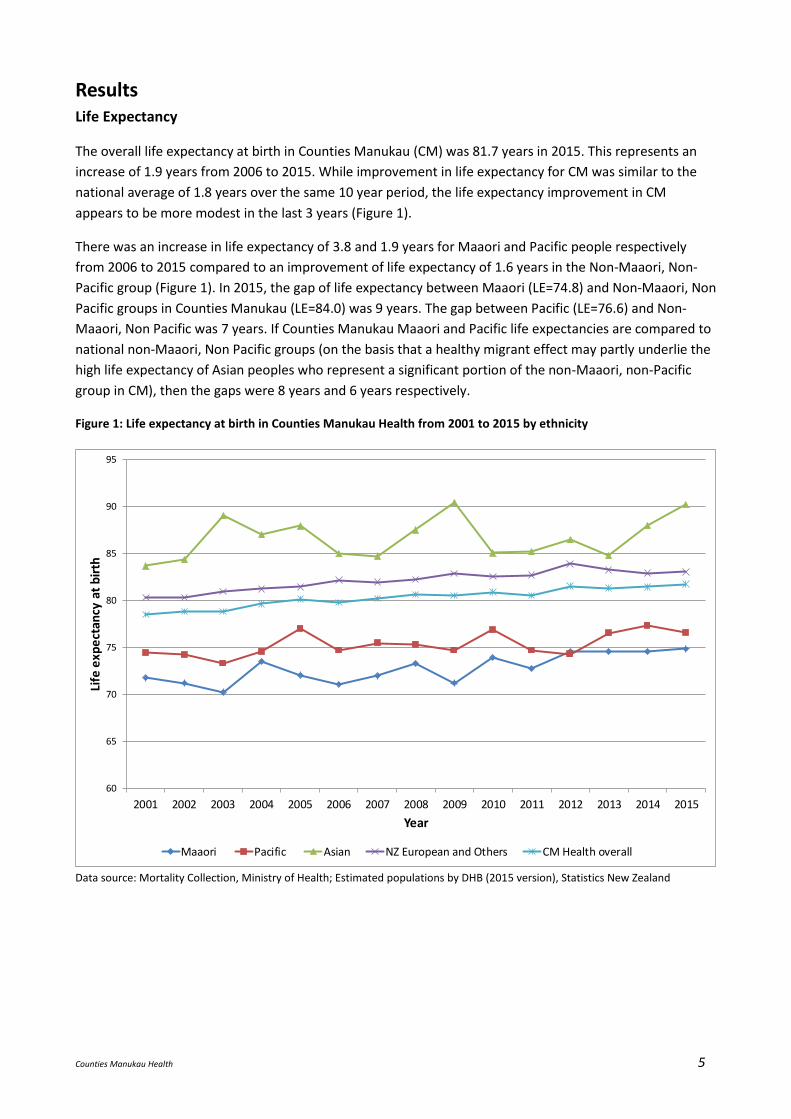
The overall life expectancy at birth in Counties Manukau (CM) was 81.7 years in 2015. This represents an
increase of 1.9 years from 2006 to 2015. While improvement in life expectancy for CM was similar to the
national average of 1.8 years over the same 10 year period, the life expectancy improvement in CM
appears to be more modest in the last 3 years (Figure 1).
There was an increase in life expectancy of 3.8 and 1.9 years for Maaori and Pacific people respectively
from 2006 to 2015 compared to an improvement of life expectancy of 1.6 years in the Non-Maaori, Non-
Pacific group (Figure 1). In 2015, the gap of life expectancy between Maaori (LE=74.8) and Non-Maaori, Non
Pacific groups in Counties Manukau (LE=84.0) was 9 years. The gap between Pacific (LE=76.6) and Non-
Maaori, Non Pacific was 7 years. If Counties Manukau Maaori and Pacific life expectancies are compared to
national non-Maaori, Non Pacific groups (on the basis that a healthy migrant effect may partly underlie the
high life expectancy of Asian peoples who represent a significant portion of the non-Maaori, non-Pacific
group in CM), then the gaps were 8 years and 6 years respectively.
Figure 1: Life expectancy at birth in Counties Manukau Health from 2001 to 2015 by ethnicity
60
65
70
75
80
85
90
95
2001 2002 2003 2004 2005 2006 2007 2008 2009 2010 2011 2012 2013 2014 2015
Life
exp
ect
ancy
at
bir
th
Year
Maaori Pacific Asian NZ European and Others CM Health overall
Data source: Mortality Collection, Ministry of Health; Estimated populations by DHB (2015 version), Statistics New Zealand
Counties Manukau Health 6
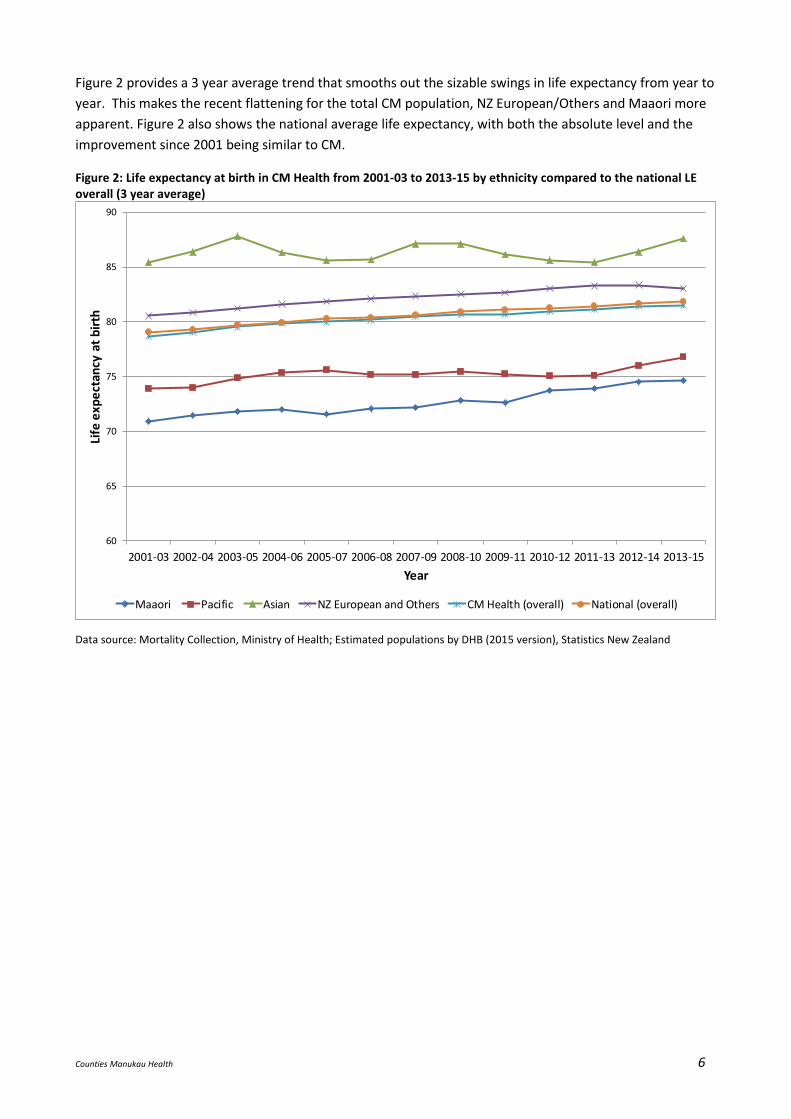
Figure 2 provides a 3 year average trend that smooths out the sizable swings in life expectancy from year to
year. This makes the recent flattening for the total CM population, NZ European/Others and Maaori more
apparent. Figure 2 also shows the national average life expectancy, with both the absolute level and the
improvement since 2001 being similar to CM.
Figure 2: Life expectancy at birth in CM Health from 2001-03 to 2013-15 by ethnicity compared to the national LE overall (3 year average)
60
65
70
75
80
85
90
2001-03 2002-04 2003-05 2004-06 2005-07 2006-08 2007-09 2008-10 2009-11 2010-12 2011-13 2012-14 2013-15
Life
exp
ect
ancy
at
bir
th
Year
Maaori Pacific Asian NZ European and Others CM Health (overall) National (overall)
Data source: Mortality Collection, Ministry of Health; Estimated populations by DHB (2015 version), Statistics New Zealand
Counties Manukau Health 7
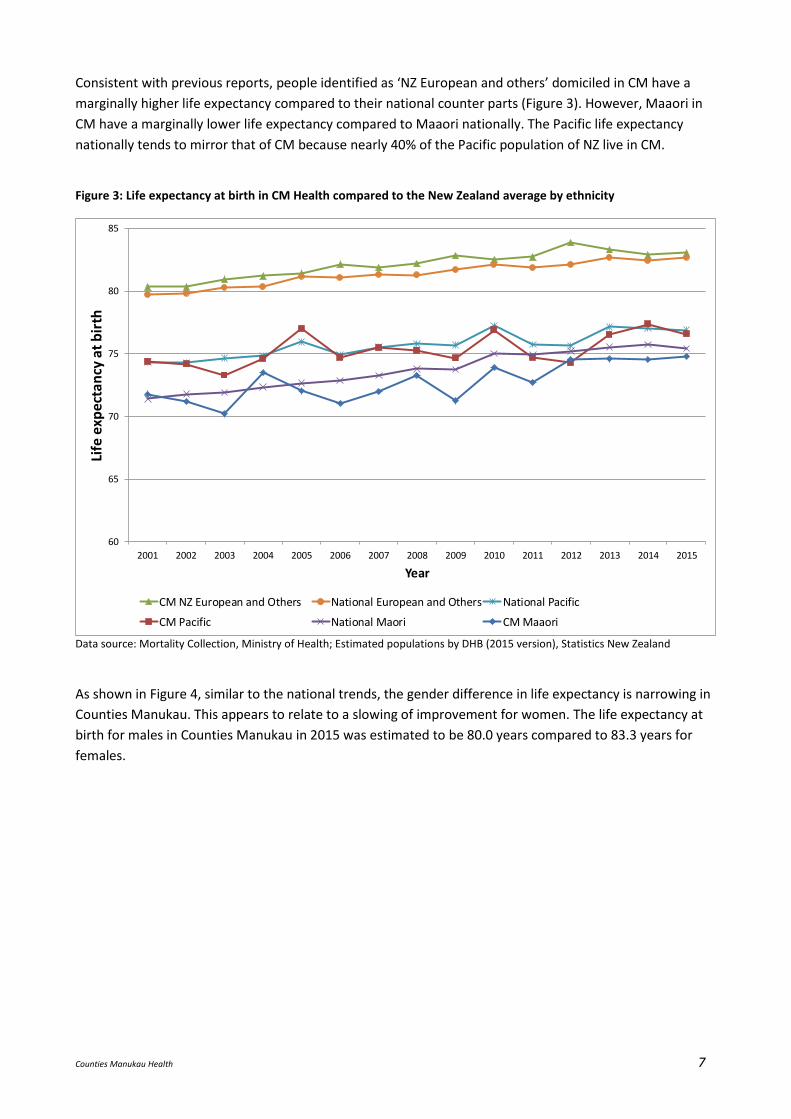
Consistent with previous reports, people identified as ‘NZ European and others’ domiciled in CM have a
marginally higher life expectancy compared to their national counter parts (Figure 3). However, Maaori in
CM have a marginally lower life expectancy compared to Maaori nationally. The Pacific life expectancy
nationally tends to mirror that of CM because nearly 40% of the Pacific population of NZ live in CM.
Figure 3: Life expectancy at birth in CM Health compared to the New Zealand average by ethnicity
60
65
70
75
80
85
2001 2002 2003 2004 2005 2006 2007 2008 2009 2010 2011 2012 2013 2014 2015
Life
exp
ect
ancy
at
bir
th
Year
CM NZ European and Others National European and Others National Pacific
CM Pacific National Maori CM Maaori
Data source: Mortality Collection, Ministry of Health; Estimated populations by DHB (2015 version), Statistics New Zealand
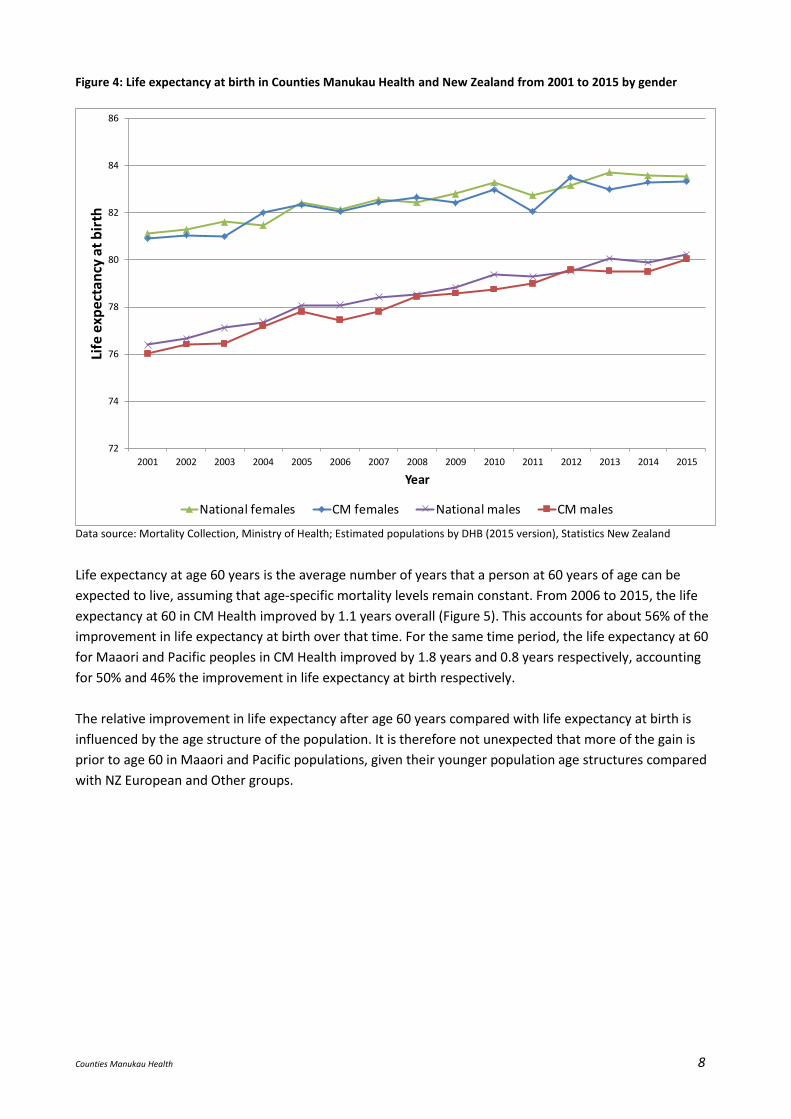
As shown in Figure 4, similar to the national trends, the gender difference in life expectancy is narrowing in
Counties Manukau. This appears to relate to a slowing of improvement for women. The life expectancy at
birth for males in Counties Manukau in 2015 was estimated to be 80.0 years compared to 83.3 years for
females.
Counties Manukau Health 8
Figure 4: Life expectancy at birth in Counties Manukau Health and New Zealand from 2001 to 2015 by gender
72
74
76
78
80
82
84
86
2001 2002 2003 2004 2005 2006 2007 2008 2009 2010 2011 2012 2013 2014 2015
Life
exp
ect
ancy
at
bir
th
Year
National females CM females National males CM males
Data source: Mortality Collection, Ministry of Health; Estimated populations by DHB (2015 version), Statistics New Zealand
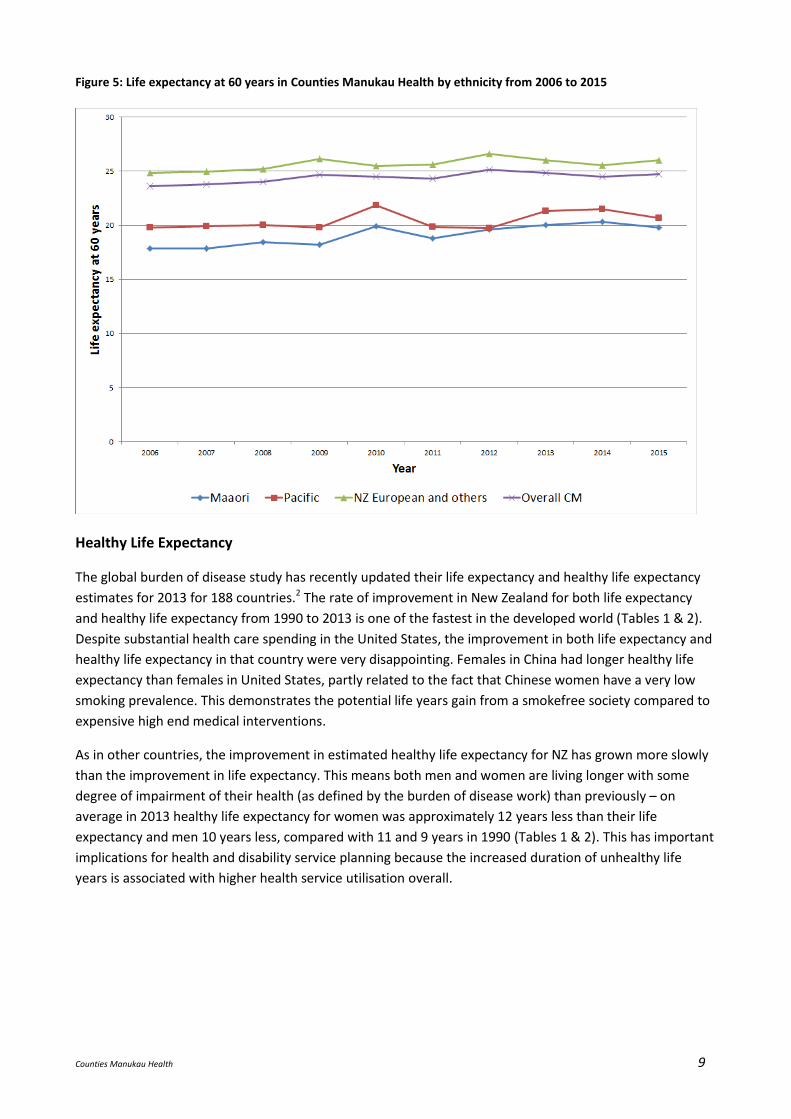
Life expectancy at age 60 years is the average number of years that a person at 60 years of age can be
expected to live, assuming that age-specific mortality levels remain constant. From 2006 to 2015, the life
expectancy at 60 in CM Health improved by 1.1 years overall (Figure 5). This accounts for about 56% of the
improvement in life expectancy at birth over that time. For the same time period, the life expectancy at 60
for Maaori and Pacific peoples in CM Health improved by 1.8 years and 0.8 years respectively, accounting
for 50% and 46% the improvement in life expectancy at birth respectively.
The relative improvement in life expectancy after age 60 years compared with life expectancy at birth is
influenced by the age structure of the population. It is therefore not unexpected that more of the gain is
prior to age 60 in Maaori and Pacific populations, given their younger population age structures compared
with NZ European and Other groups.
Counties Manukau Health 9
Figure 5: Life expectancy at 60 years in Counties Manukau Health by ethnicity from 2006 to 2015
Healthy Life Expectancy
The global burden of disease study has recently updated their life expectancy and healthy life expectancy
estimates for 2013 for 188 countries.2 The rate of improvement in New Zealand for both life expectancy
and healthy life expectancy from 1990 to 2013 is one of the fastest in the developed world (Tables 1 & 2).
Despite substantial health care spending in the United States, the improvement in both life expectancy and
healthy life expectancy in that country were very disappointing. Females in China had longer healthy life
expectancy than females in United States, partly related to the fact that Chinese women have a very low
smoking prevalence. This demonstrates the potential life years gain from a smokefree society compared to
expensive high end medical interventions.
As in other countries, the improvement in estimated healthy life expectancy for NZ has grown more slowly
than the improvement in life expectancy. This means both men and women are living longer with some
degree of impairment of their health (as defined by the burden of disease work) than previously – on
average in 2013 healthy life expectancy for women was approximately 12 years less than their life
expectancy and men 10 years less, compared with 11 and 9 years in 1990 (Tables 1 & 2). This has important
implications for health and disability service planning because the increased duration of unhealthy life
years is associated with higher health service utilisation overall.
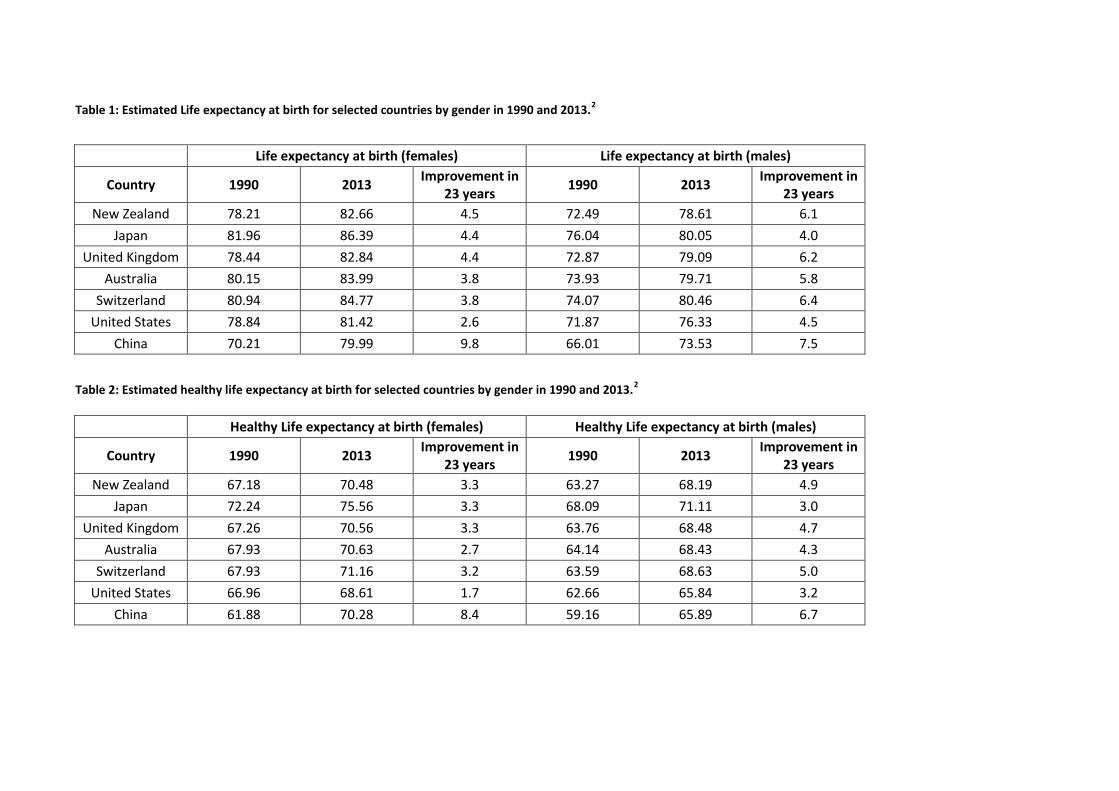
Table 1: Estimated Life expectancy at birth for selected countries by gender in 1990 and 2013.2
Life expectancy at birth (females) Life expectancy at birth (males)
Country 1990 2013 Improvement in
23 years 1990 2013
Improvement in 23 years
New Zealand 78.21 82.66 4.5 72.49 78.61 6.1
Japan 81.96 86.39 4.4 76.04 80.05 4.0
United Kingdom 78.44 82.84 4.4 72.87 79.09 6.2
Australia 80.15 83.99 3.8 73.93 79.71 5.8
Switzerland 80.94 84.77 3.8 74.07 80.46 6.4
United States 78.84 81.42 2.6 71.87 76.33 4.5
China 70.21 79.99 9.8 66.01 73.53 7.5
Table 2: Estimated healthy life expectancy at birth for selected countries by gender in 1990 and 2013.2
Healthy Life expectancy at birth (females) Healthy Life expectancy at birth (males)
Country 1990 2013 Improvement in
23 years 1990 2013
Improvement in 23 years
New Zealand 67.18 70.48 3.3 63.27 68.19 4.9
Japan 72.24 75.56 3.3 68.09 71.11 3.0
United Kingdom 67.26 70.56 3.3 63.76 68.48 4.7
Australia 67.93 70.63 2.7 64.14 68.43 4.3
Switzerland 67.93 71.16 3.2 63.59 68.63 5.0
United States 66.96 68.61 1.7 62.66 65.84 3.2
China 61.88 70.28 8.4 59.16 65.89 6.7
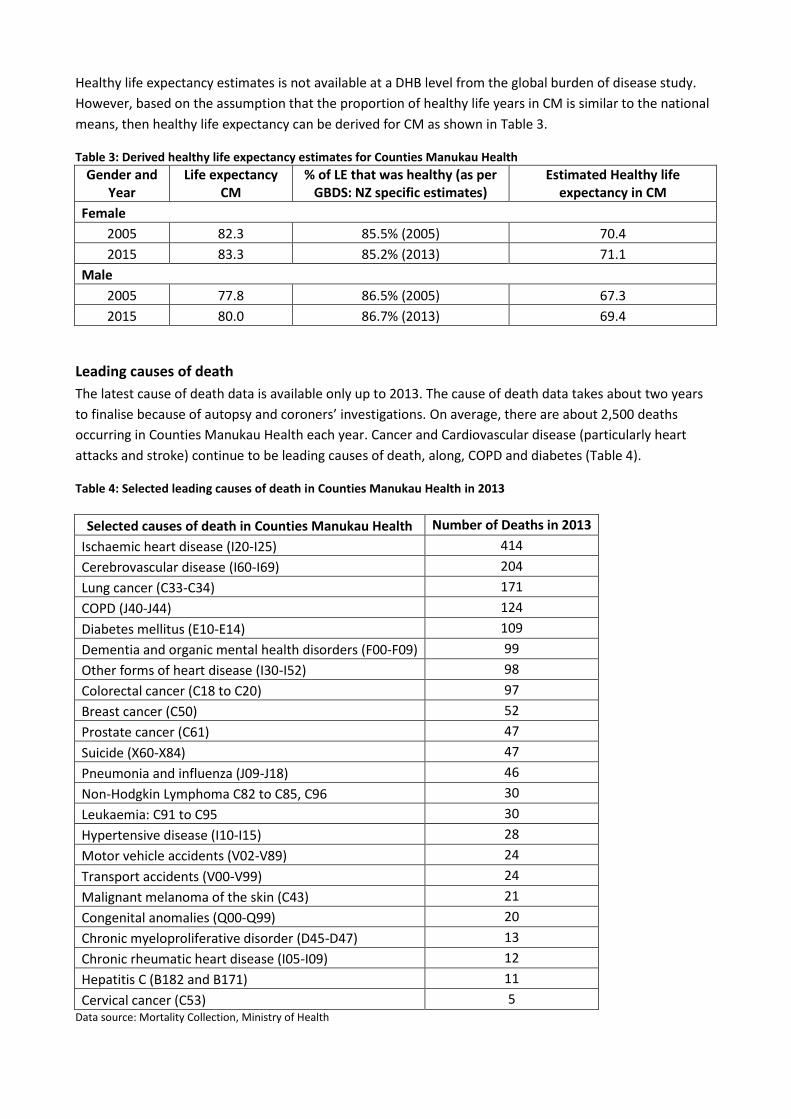
Healthy life expectancy estimates is not available at a DHB level from the global burden of disease study.
However, based on the assumption that the proportion of healthy life years in CM is similar to the national
means, then healthy life expectancy can be derived for CM as shown in Table 3.
Table 3: Derived healthy life expectancy estimates for Counties Manukau Health
Gender and Year
Life expectancy CM
% of LE that was healthy (as per GBDS: NZ specific estimates)
Estimated Healthy life expectancy in CM
Female
2005 82.3 85.5% (2005) 70.4
2015 83.3 85.2% (2013) 71.1
Male
2005 77.8 86.5% (2005) 67.3
2015 80.0 86.7% (2013) 69.4
Leading causes of death
The latest cause of death data is available only up to 2013. The cause of death data takes about two years
to finalise because of autopsy and coroners’ investigations. On average, there are about 2,500 deaths
occurring in Counties Manukau Health each year. Cancer and Cardiovascular disease (particularly heart
attacks and stroke) continue to be leading causes of death, along, COPD and diabetes (Table 4).
Table 4: Selected leading causes of death in Counties Manukau Health in 2013
Selected causes of death in Counties Manukau Health Number of Deaths in 2013
Ischaemic heart disease (I20-I25) 414
Cerebrovascular disease (I60-I69) 204
Lung cancer (C33-C34) 171
COPD (J40-J44) 124
Diabetes mellitus (E10-E14) 109
Dementia and organic mental health disorders (F00-F09) 99
Other forms of heart disease (I30-I52) 98
Colorectal cancer (C18 to C20) 97
Breast cancer (C50) 52
Prostate cancer (C61) 47
Suicide (X60-X84) 47
Pneumonia and influenza (J09-J18) 46
Non-Hodgkin Lymphoma C82 to C85, C96 30
Leukaemia: C91 to C95 30
Hypertensive disease (I10-I15) 28
Motor vehicle accidents (V02-V89) 24
Transport accidents (V00-V99) 24
Malignant melanoma of the skin (C43) 21
Congenital anomalies (Q00-Q99) 20
Chronic myeloproliferative disorder (D45-D47) 13
Chronic rheumatic heart disease (I05-I09) 12
Hepatitis C (B182 and B171) 11
Cervical cancer (C53) 5 Data source: Mortality Collection, Ministry of Health
Counties Manukau Health 12
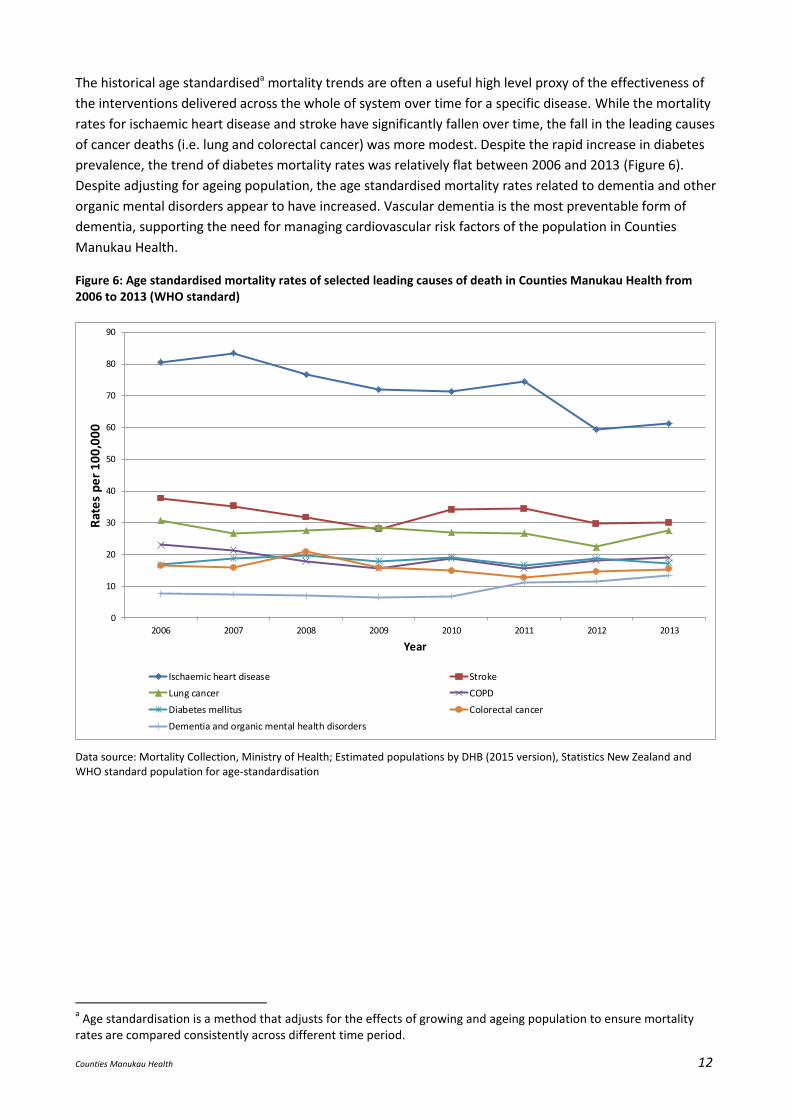
The historical age standardiseda mortality trends are often a useful high level proxy of the effectiveness of
the interventions delivered across the whole of system over time for a specific disease. While the mortality
rates for ischaemic heart disease and stroke have significantly fallen over time, the fall in the leading causes
of cancer deaths (i.e. lung and colorectal cancer) was more modest. Despite the rapid increase in diabetes
prevalence, the trend of diabetes mortality rates was relatively flat between 2006 and 2013 (Figure 6).
Despite adjusting for ageing population, the age standardised mortality rates related to dementia and other
organic mental disorders appear to have increased. Vascular dementia is the most preventable form of
dementia, supporting the need for managing cardiovascular risk factors of the population in Counties
Manukau Health.
Figure 6: Age standardised mortality rates of selected leading causes of death in Counties Manukau Health from 2006 to 2013 (WHO standard)
0
10
20
30
40
50
60
70
80
90
2006 2007 2008 2009 2010 2011 2012 2013
Rat
es
pe
r 1
00
,00
0
Year
Ischaemic heart disease Stroke
Lung cancer COPD
Diabetes mellitus Colorectal cancer
Dementia and organic mental health disorders
Data source: Mortality Collection, Ministry of Health; Estimated populations by DHB (2015 version), Statistics New Zealand and WHO standard population for age-standardisation
a Age standardisation is a method that adjusts for the effects of growing and ageing population to ensure mortality
rates are compared consistently across different time period.
Counties Manukau Health 13
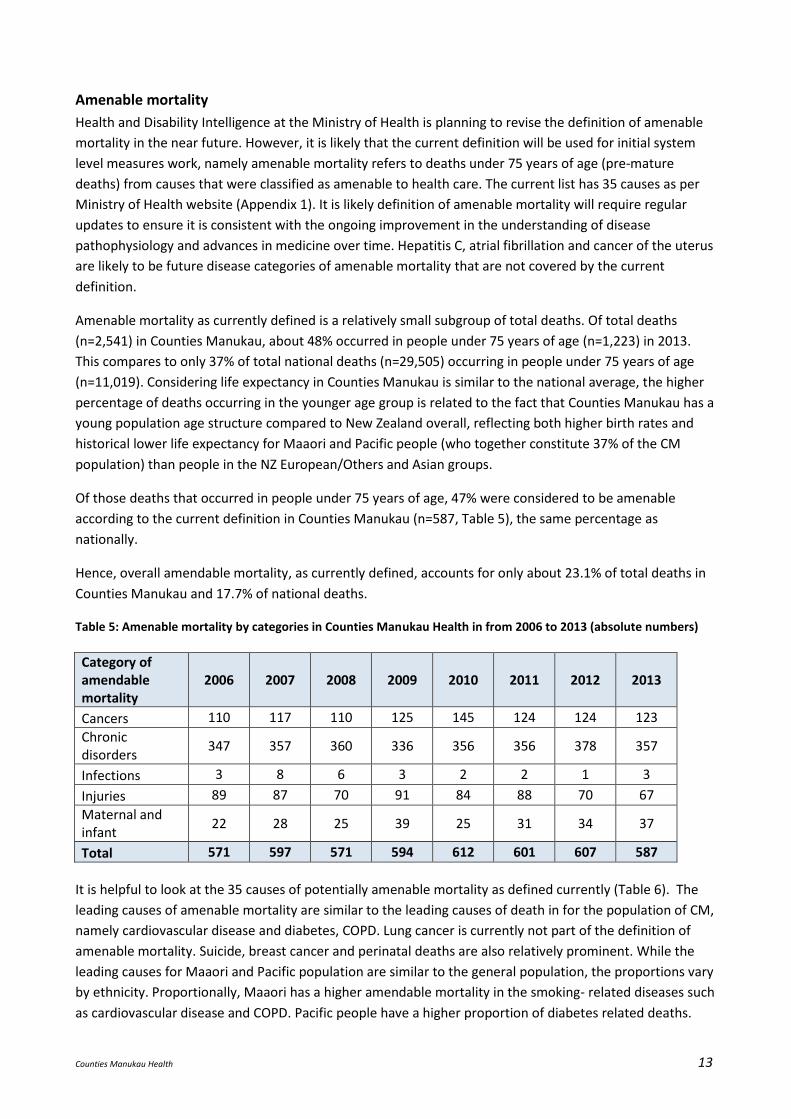
Amenable mortality
Health and Disability Intelligence at the Ministry of Health is planning to revise the definition of amenable
mortality in the near future. However, it is likely that the current definition will be used for initial system
level measures work, namely amenable mortality refers to deaths under 75 years of age (pre-mature
deaths) from causes that were classified as amenable to health care. The current list has 35 causes as per
Ministry of Health website (Appendix 1). It is likely definition of amenable mortality will require regular
updates to ensure it is consistent with the ongoing improvement in the understanding of disease
pathophysiology and advances in medicine over time. Hepatitis C, atrial fibrillation and cancer of the uterus
are likely to be future disease categories of amenable mortality that are not covered by the current
definition.
Amenable mortality as currently defined is a relatively small subgroup of total deaths. Of total deaths
(n=2,541) in Counties Manukau, about 48% occurred in people under 75 years of age (n=1,223) in 2013.
This compares to only 37% of total national deaths (n=29,505) occurring in people under 75 years of age
(n=11,019). Considering life expectancy in Counties Manukau is similar to the national average, the higher
percentage of deaths occurring in the younger age group is related to the fact that Counties Manukau has a
young population age structure compared to New Zealand overall, reflecting both higher birth rates and
historical lower life expectancy for Maaori and Pacific people (who together constitute 37% of the CM
population) than people in the NZ European/Others and Asian groups.
Of those deaths that occurred in people under 75 years of age, 47% were considered to be amenable
according to the current definition in Counties Manukau (n=587, Table 5), the same percentage as
nationally.
Hence, overall amendable mortality, as currently defined, accounts for only about 23.1% of total deaths in
Counties Manukau and 17.7% of national deaths.
Table 5: Amenable mortality by categories in Counties Manukau Health in from 2006 to 2013 (absolute numbers)
Category of amendable mortality
2006 2007 2008 2009 2010 2011 2012 2013
Cancers 110 117 110 125 145 124 124 123
Chronic disorders
347 357 360 336 356 356 378 357
Infections 3 8 6 3 2 2 1 3
Injuries 89 87 70 91 84 88 70 67
Maternal and infant
22 28 25 39 25 31 34 37
Total 571 597 571 594 612 601 607 587
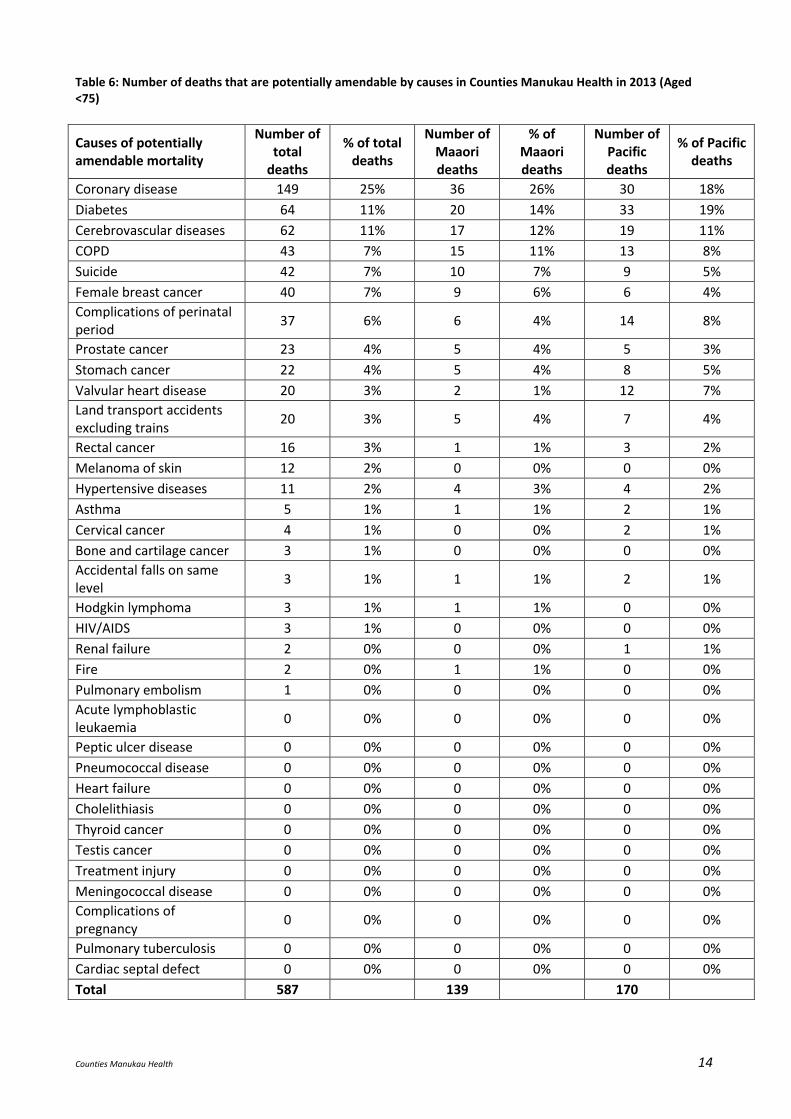
It is helpful to look at the 35 causes of potentially amenable mortality as defined currently (Table 6). The
leading causes of amenable mortality are similar to the leading causes of death in for the population of CM,
namely cardiovascular disease and diabetes, COPD. Lung cancer is currently not part of the definition of
amenable mortality. Suicide, breast cancer and perinatal deaths are also relatively prominent. While the
leading causes for Maaori and Pacific population are similar to the general population, the proportions vary
by ethnicity. Proportionally, Maaori has a higher amendable mortality in the smoking- related diseases such
as cardiovascular disease and COPD. Pacific people have a higher proportion of diabetes related deaths.
Counties Manukau Health 14
Table 6: Number of deaths that are potentially amendable by causes in Counties Manukau Health in 2013 (Aged <75)
Causes of potentially amendable mortality
Number of total
deaths
% of total deaths
Number of Maaori deaths
% of Maaori deaths
Number of Pacific deaths
% of Pacific deaths
Coronary disease 149 25% 36 26% 30 18%
Diabetes 64 11% 20 14% 33 19%
Cerebrovascular diseases 62 11% 17 12% 19 11%
COPD 43 7% 15 11% 13 8%
Suicide 42 7% 10 7% 9 5%
Female breast cancer 40 7% 9 6% 6 4%
Complications of perinatal period
37 6% 6 4% 14 8%
Prostate cancer 23 4% 5 4% 5 3%
Stomach cancer 22 4% 5 4% 8 5%
Valvular heart disease 20 3% 2 1% 12 7%
Land transport accidents excluding trains
20 3% 5 4% 7 4%
Rectal cancer 16 3% 1 1% 3 2%
Melanoma of skin 12 2% 0 0% 0 0%
Hypertensive diseases 11 2% 4 3% 4 2%
Asthma 5 1% 1 1% 2 1%
Cervical cancer 4 1% 0 0% 2 1%
Bone and cartilage cancer 3 1% 0 0% 0 0%
Accidental falls on same level
3 1% 1 1% 2 1%
Hodgkin lymphoma 3 1% 1 1% 0 0%
HIV/AIDS 3 1% 0 0% 0 0%
Renal failure 2 0% 0 0% 1 1%
Fire 2 0% 1 1% 0 0%
Pulmonary embolism 1 0% 0 0% 0 0%
Acute lymphoblastic leukaemia
0 0% 0 0% 0 0%
Peptic ulcer disease 0 0% 0 0% 0 0%
Pneumococcal disease 0 0% 0 0% 0 0%
Heart failure 0 0% 0 0% 0 0%
Cholelithiasis 0 0% 0 0% 0 0%
Thyroid cancer 0 0% 0 0% 0 0%
Testis cancer 0 0% 0 0% 0 0%
Treatment injury 0 0% 0 0% 0 0%
Meningococcal disease 0 0% 0 0% 0 0%
Complications of pregnancy
0 0% 0 0% 0 0%
Pulmonary tuberculosis 0 0% 0 0% 0 0%
Cardiac septal defect 0 0% 0 0% 0 0%
Total 587 139 170
Counties Manukau Health 15
Other important equity considerations There are some key areas of ill-health that have limited visibility when considering life expectancy and
mortality, which are based on data about death. The New Zealand Burden of Disease study estimates that
non-fatal outcomes (YLDs, Years Lived with Disability) now account for almost 50% of all health lost by the
New Zealand population, and this proportion is likely to increase3. In particular, substantial components of
YLD come from
mental health and addiction disorders – depression, anxiety, alcohol & drug use,
musculoskeletal and chronic pain disorders including low-back pain, neck pain, and osteoarthritis,
neurologic disorders – e.g. dementia, Parkinson’s,
reproductive disorders for women of reproductive age, and
for children, complications of premature birth and birth defects.
Ill-health caused by diabetes, including diabetic foot, neuropathy, retinopathy, amputation, and chronic
kidney disease is also important.
Discussion and Recommendations Recent flatting of life expectancy trends will pose a challenge for Counties Manuaku Health to meet its
target of 500,000 healthy life years gain by 2020. Gain in both life expectancy and proportion of life lived in
good health are important for healthy life years.
Actions to reduce smoking prevalence, and the prevention and management of cardiovascular risk factors
including diabetes are key areas to reduce amenable mortality, narrow life expectancy gaps in the medium
to long term, and advance the goal of healthy life years gain.
Interventions aiming to reduce smoking prevalence remain one of the main areas to focus to improve life
expectancy, particularly for Maaori, since Maaori have a higher proportion of amendable mortality in the
smoking related diseases. Recently, the NZ central government budget announced there will be a 10%
increase in tobacco tax per year till 2020. While increasing tobacco taxes as seen as one of the important
tools to reduce smoking prevalence, there is concern about the impact on those who are severely addicted
and/or chose to continue to smoke, and their families and whaanau. It is important for CM health to
promote the range of smoking cessation support across the whole of health system and in our communities
to limit the potential financial distress that the increase of tobacco tax might have on people who smoke
and their families and whaanau. Acknowledging that some people who smoke may require a number of
quit attempts before being successful to quit long term, evaluation of longer term outcomes from
interventions and the provision of ongoing support as required are important considerations. This is
particularly important for interventions that have shown early promising results but there is uncertainty in
regard to benefits being sustained over long term.4
Diabetes and hypertension management are part of managing CVD risk and important in their own right in
relation to other diabetes complications such as renal disease. Pacific people in CM have the highest
prevalence of diabetes in CM, and the highest proportion of people with diabetes who have evidence of
poor diabetes control. Exploring some of the unexplained treatment gaps by undertaking clinical audits
across a number of clinically actionable indicators in diabetes and CVD are likely to lead to improvement of
care. The clinical actionable indicators are indicators where improvements in specific clinical actions are
strongly associated with improvement in health outcomes. In order to optimise health gains for all of
Counties Manukau Health 16
populations, improvements in some of the clinical indicators should aim to go beyond ‘equity’ for indicators
where there is room of all population groups to further improve in the care that they receive (e.g. triple
therapy for those with existing CVD).
Reducing alcohol related harm, recently identified as a priority area to support progress in addressing
health equity for the CM Health population over the next five years, will also contribute to addressing
suicide and breast cancer as important causes of amenable mortality. Given the contribution of alcohol use
to mental health and substance use disorders which are leading causes of health loss, reducing alcohol
related harm will also contribute significantly to improving healthy life years. Actions to impact perinatal
mortality have been previously reviewed and summarised for the CM population, and factored into the
implementation plan for the CM Health Maternity Review (2012).
While there are a number of specific national, regional, and local targets that a DHB is obligated to meet, it
is critical not to lose visibility of the ultimate goals of improving population health and health equity (which
are linked to the goal of gain in healthy life years), and people’s experience across the system. Many
indicators and targets are often intermediate process measures, which can be helpful to facilitate service
planning and quality improvements in areas that a DHB may wish to focus on. However, in the process of
meeting the certain indicators, inadvertent adverse consequences can sometimes occur, and they should
be actively mitigated. Consideration of the entire intervention pathway and patients’ journey as part of
service planning and evaluation can be helpful to avoid ‘hitting the target and missing the point’. More
specific actions that may advance healthy life years gain in a sustainable manner are listed in Appendix 2.
However, the most cost effective interventions to address some of the adverse risk factor trends that
impact on amenable mortality and both healthy and total life expectancy, such as increasing obesity
prevalence, may lie outside the health sector. Hence working with intersectoral partners to address wider
social and environmental influences on health as well as economic determinants of health is important to
complement and enhance interventions implemented by the health sector.
Counties Manukau Health 17
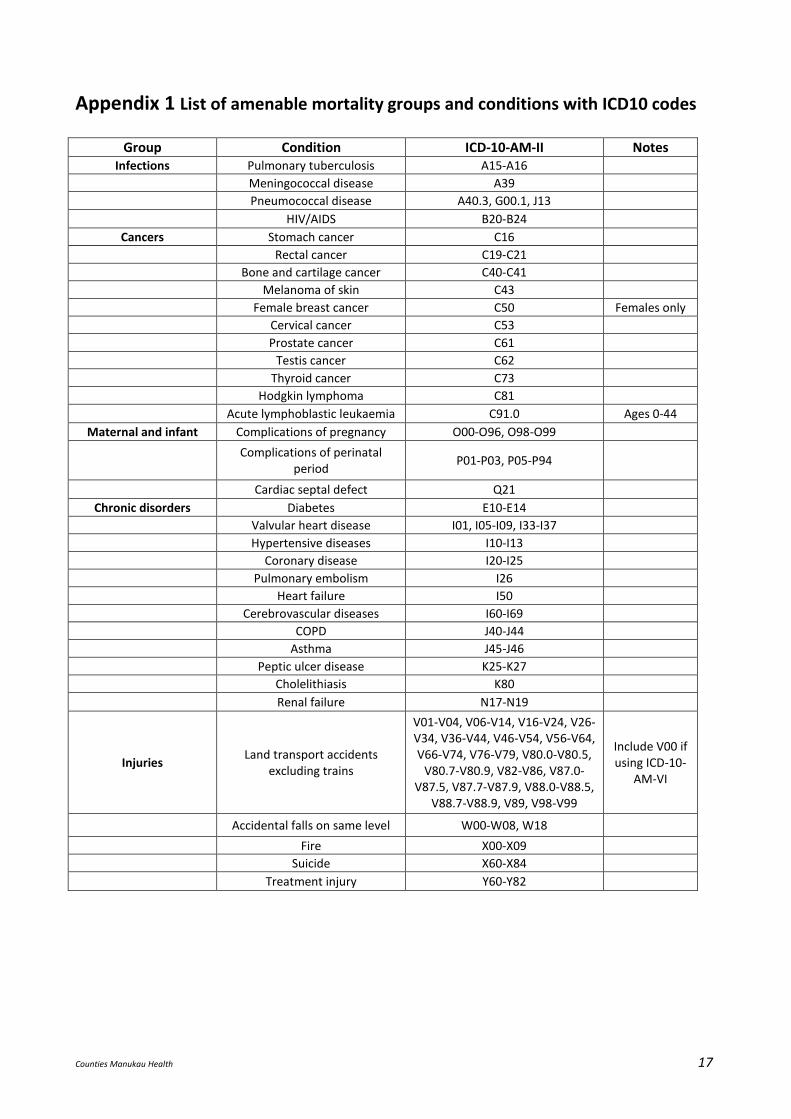
Appendix 1 List of amenable mortality groups and conditions with ICD10 codes
Group Condition ICD-10-AM-II Notes Infections Pulmonary tuberculosis A15-A16
Meningococcal disease A39
Pneumococcal disease A40.3, G00.1, J13
HIV/AIDS B20-B24
Cancers Stomach cancer C16
Rectal cancer C19-C21
Bone and cartilage cancer C40-C41
Melanoma of skin C43
Female breast cancer C50 Females only
Cervical cancer C53
Prostate cancer C61
Testis cancer C62
Thyroid cancer C73
Hodgkin lymphoma C81
Acute lymphoblastic leukaemia C91.0 Ages 0-44
Maternal and infant Complications of pregnancy O00-O96, O98-O99
Complications of perinatal
period P01-P03, P05-P94
Cardiac septal defect Q21
Chronic disorders Diabetes E10-E14
Valvular heart disease I01, I05-I09, I33-I37
Hypertensive diseases I10-I13
Coronary disease I20-I25
Pulmonary embolism I26
Heart failure I50
Cerebrovascular diseases I60-I69
COPD J40-J44
Asthma J45-J46
Peptic ulcer disease K25-K27
Cholelithiasis K80
Renal failure N17-N19
Injuries Land transport accidents
excluding trains
V01-V04, V06-V14, V16-V24, V26-V34, V36-V44, V46-V54, V56-V64, V66-V74, V76-V79, V80.0-V80.5,
V80.7-V80.9, V82-V86, V87.0-V87.5, V87.7-V87.9, V88.0-V88.5,
V88.7-V88.9, V89, V98-V99
Include V00 if using ICD-10-
AM-VI
Accidental falls on same level W00-W08, W18
Fire X00-X09
Suicide X60-X84
Treatment injury Y60-Y82
Counties Manukau Health 18
Appendix 2: In order to have a sustainable health system, it is important to have an optimal mix of preventive and
treatment services, equitably distributed, to improve population healthy life expectancy over the short as
well as the medium to long term.
Going forward specific actions may include
1. Increasing awareness and developing ways to prevent over diagnosis and over treatment. Potential
areas to explore include screening detected overdiagnosis, ‘incidentalomas’ (things found during
investigation for an unrelated condition), excessively widened clinical definitions of disease states.5
2. Development of clinically endorsed and affordable intervention thresholds to safe-guard against
inappropriate demand and ensure unmet needs are better defined and met.
3. Better support to enable proven interventions to be delivered at a higher quality and coverage, e.g.
management of CVD risk factors, diabetes, management of gout to prevent acute attacks, prevention
of asthma attacks.
4. Clinical leadership to support quality improvement (setting expected standards of care and sharing the
successful delivery models between providers).
5. The need for a strong equity focus, by actively considering subgroups who may be missing out on
eligible services or interventions.
6. Consideration of people’s experience and the whole patient journey. Acknowledgement of common co-
morbidities, and the potential to provide clinical appointments covering a number of clinical actions
systematically at the same time. This has implications for IT support, workforce and models of care.
7. Consideration of ways to reduce the potential barriers of care along the patient journey, such as co-
payment and high health literacy demands. Addressing health literacy demands includes addressing the
complexity of navigating the health system, and helping people to understand risk factors and diseases
and how they might manage those in the context of their own lives. This is about all providers across
the CM Health system working to become ‘health literate organisations’.
8. Understanding and actively applying evidence and information in the New Zealand context. Policies and
decisions should ideally be evidence-based and supported by local health information. Assumptions
should be actively validated. Claims of benefits from business cases should be evaluated. Conflicts of
interest need to be actively managed, particularly in decision making and resource allocation areas.
9. Systematic prioritisation processes that would enable explicit comparison between different trade-offs
including the right balance of services from prevention to end of life care. There must be a mandate to
disinvest from ineffective services, policies, or unnecessarily administration layers.
References 1. Salomon JA, Haagsma JA, Davis A, et al. Disability weights for the Global Burden of Disease 2013 study. Lancet Glob Health 2015; 3(11): e712-23. 2. Murray CJ, Barber RM, Foreman KJ, et al. Global, regional, and national disability-adjusted life years (DALYs) for 306 diseases and injuries and healthy life expectancy (HALE) for 188 countries, 1990-2013: quantifying the epidemiological transition. Lancet 2015; 386(10009): 2145-91. 3. Ministry of Health. Health Loss in New Zealand: A report from the New Zealand Burden of Diseases, Injuries and Risk Factors Study, 2006–2016. Wellington: Ministry of Health; 2013. 4. Aveyard P, Bauld L. Incentives for promoting smoking cessation: What we still do not know. Cochrane Database Syst Rev 2011; (8): ED000027. 5. Moynihan R, Doust J, Henry D. Preventing overdiagnosis: how to stop harming the healthy. BMJ 2012; 344: e3502.


![CLASSIFICATION OF ACTIONS OF DISCRETE AMENABLE …popa/clofactions11.pdf · Introduction. In ([C1]) A.Connes classified the amenable semifinite factors ... for subfactors in [P9,10]](https://img.pdfslide.us/doc/110x75/5fdb126a4da2f92aff6043b3/classification-of-actions-of-discrete-amenable-popa-introduction-in-c1.jpg)