Embed Size (px)
Citation preview
173F. Meslé and J. Vallin, Mortality and Causes of Death in 20th-Century Ukraine, Demographic Research Monographs, DOI 10.1007/978-94-007-2433-4_11, © Springer Science+Business Media B.V. 2012
Here we shall start by assessing the impact of each major group of causes on the overall change in life expectancy 1 observed between 1965 and 2006. However, this overview conceals trends that contrast somewhat over time because of fl uctuations in life expectancy. Therefore we should go on to examine the sequential cumula-tion of annual gains and losses that lead to this overall result. Finally, mortality trends do not carry the same weight in life expectancy in all age groups, though in different ways for different causes. The chapter will conclude with a general survey of this issue.
11.1 Breakdown of Change in Life Expectancy Between 1965 and 2006
From 1965 to 2006, life expectancy for Ukrainian males fell from 67.6 to 62.2 years, representing a total loss of 5.4 years, while Ukrainian females lost 0.9 years’ life expectancy, going from 74.6 to 73.7 years. In Russia, over the same period, males lost 3.9 years and females 0.3 (Table 11.1 ). In contrast, a gain of 9.7 years for males and 9.4 years for females was observed in France. However, as 2006 cause-of-death statistics are not yet available for France, the analyses that follow will end a year
F. Meslé (*) • J. Vallin Institut National d’Études Démographiques , Bd. Davout 133 , 75980 Paris Cedex 20 , France e-mail: [email protected] ; [email protected]
S. Pyrozhkov Institute for Demography and Social Studies, Bd. Panasa Myrnogo 26, 01011 Kyiv, Ukraine e-mail: [email protected]
Chapter 11 Impact of Major Groups of Causes on Life Expectancy Trends
France Meslé , Jacques Vallin , and Serhii Pyrozhkov
1 Using, as before, Evgeni Andreev’s method ( 1982 ) .
174 F. Meslé et al.
earlier for that country, and we shall have to confi ne ourselves to arguments based on the life expectancy gains made between 1965 and 2005 (9.4 years for males and 9.1 years for females). Nevertheless, the differences are so great that the comparison remains entirely relevant.
Despite this radical divergence in life expectancies between France and the two countries of the former USSR, two groups of causes have contributed to the rise almost everywhere. Firstly, although the trend in mortality from infectious diseases had an almost neutral impact on Ukrainian male life expectancy (−0.09 years), its decline signifi cantly increased the life expectancy of Russian males (+ 0.25) and, even more so, French males (+ 0.37); while on the female side, the fall in mortality from infectious diseases meant almost as great a gain for Ukrainian females (0.17 years) as for French females, but a much more substantial one for Russian females (0.32 years) (Table 11.1 and Fig. 11.1 ). But secondly, and above all, the reduction in diseases of the respiratory system meant a gain of almost one full year’s life expectancy for Ukrainian males and 0.7 years for Russian males (almost as much as for French males – 0.9 years), and more still for females: 1.2 years for Ukrainian females and 1.0 for Russian females, both more than for French females (0.9)
In addition, for females, the reduction in two other groups of causes had favourable effects on life expectancy in Ukraine and in Russia, even though gains there were much smaller than in France. These were declines in deaths from neoplasms, which led to a gain of 0.1 years for Ukrainian females and 0.5 for Russians, as against 0.8 for French females, and in deaths from “other diseases”, which meant a very small gain for Ukrainian females (0.04), but a much larger one for Russians (0.6), as against 1.7 years for French females.
On the other hand, trends in mortality from the three remaining major groups of causes (diseases of the circulatory system, diseases of the digestive system and deaths from injury and poisoning) infl icted heavy losses in both Ukraine and Russia,
Table 11.1 Contributions of seven major groups of causes to gains or losses in life expectancy at birth between 1965 and 2006 in Ukraine and Russia, and between 1965 and 2005 in France
Groups of causes
Males Females
Ukraine Russia France Ukraine Russia France
Life expectancy in 2006 (2005 for France)
62.2 60.1 76.9 73.7 72.1 83.8
Life expectancy in 1965 67.6 64.0 67.5 74.6 73.7 74.7
Gains or losses Infectious diseases −0.09 0.25 0.37 0.17 0.32 0.19 Neoplasms −0.15 0.36 0.46 0.12 0.48 0.84 Diseases of the circulatory system −3.59 −3.25 3.59 −1.74 −1.61 4.18 Diseases of the respiratory system 0.96 0.68 0.85 1.21 0.96 0.88 Diseases of the digestive system −0.76 −0.42 0.85 −0.36 −0.30 0.59 Other diseases −0.19 0.52 1.96 0.04 0.59 1.69 Deaths from injury and poisoning −1.59 −1.99 1.32 −0.38 −0.72 0.73 Total −5.41 −3.85 9.42 −0.92 −0.29 9.11
17511 Impact of Major Groups of Causes on Life Expectancy Trends
whereas they led to large gains in France. The most glaringly obvious contrast relates to diseases of the circulatory system. Trends in mortality from this group of causes alone meant the loss of 3.6 years’ life expectancy for Ukrainian males and 3.3 for Russian males, whereas they led to a gain of 3.6 years for French males. The situation was little different for females: although Ukrainian females and Russian females lost less (−1.7 and –1.6 years respectively), French females gained more (+4.2 years). So, in total, the gap between Ukraine and France in trends in mortality from diseases of the circulatory system widened by 7.2 years for males and 5.9 years for females (and the gap between Russia and France increased almost as much, by 6.9 years for males and 5.8 years for females).
Fig. 11.1 Contributions of seven major groups of causes to gains or losses in life expectancy at birth from 1965 until 2006 in Ukraine and Russia, and until 2005 in France
176 F. Meslé et al.
For males, the second major factor in the divergence between Ukraine or Russia and France was, as one might expect, that of deaths from injury and poisoning, where contrasting trends meant the loss of 1.6 years’ life expectancy for Ukrainian males and 2.0 for Russian males but a gain of 1.3 years for French males. Among females, the trend in deaths from injury and poisoning produced hardly any greater effect than the trend in diseases of the digestive system in Ukraine, where, for these two groups of causes, the divergence resulted more from improvements in France (+ 0.7 for deaths from injury and poisoning, + 0.6 for diseases of the digestive sys-tem) than from losses for Ukrainian females (−0.4 for each of these two groups of causes). However, Russian females were more affected than Ukrainian females by losses due to deaths from injury and poisoning (−0.7 years, which was almost the same as the gain made by French females from the reduction in such deaths there). In total, for males, the gap between trends in deaths from injury and poisoning in France and Ukraine widened by 2.9 years, less than it did between France and Russia (3.2); the same was also true, at a lower level, for females (1.1 years in Ukraine, 1.3 years in Russia). Trends in diseases of the digestive system contributed to this gap by 1.7 years for Ukrainian males, 1.3 for Russian males, 1.0 for Ukrainian females and 0.9 for Russian females.
So, although over the whole period 1965–2006, net losses in life expectancy in Ukraine (5.4 years for males, 0.9 for females) were much higher than those in Russia (3.9 and 0.3 respectively), this was essentially because, in total, Ukraine lost a little more than Russia through the effects of diseases of the circulatory and respiratory sys-tems, while cancers and “other diseases” had negative effects in Ukraine and positive ones in Russia. Whereas in Russia almost all the losses just came down to the effects of diseases of the circulatory system and deaths from injury and poisoning, there were other causes that played a negative role in Ukraine (even though, in contrast, some of these played a positive role in Russia). As for the total gap between Ukrainian males and French males (14.8 years), this was much more due to French gains (+9.4) than to Ukrainian losses (−5.4); and this is even more true for the gap between Russian males and French males. The phenomenon is even more glaring for females: 90% of Ukraine’s total 10-year gap is explained by the advance in French life expectancy, while 97% of Russia’s gap (9.4 years) is explained by the French advance.
11.2 Cumulative Impact
However, this overview of the period 1965–2006 does not take into account the fl uctuations observed since the 1980s, which have had a heavy infl uence on losses in life expectancy. By cumulating losses and gains since 1965, we can better appre-ciate the way in which, year on year, they have led to the results that we have just outlined. However, depending on the starting-point chosen, the view obtained can be very different. In order to take this into account, we shall fi rst explain the cumula-tion from 1965 and then make a second analysis, limited to the data from the most recent period.
17711 Impact of Major Groups of Causes on Life Expectancy Trends
11.2.1 Since 1965
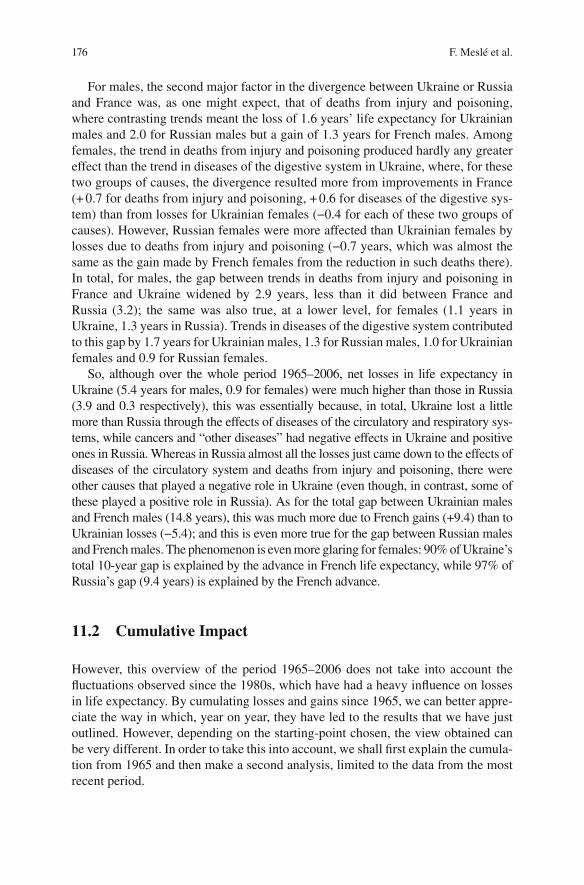
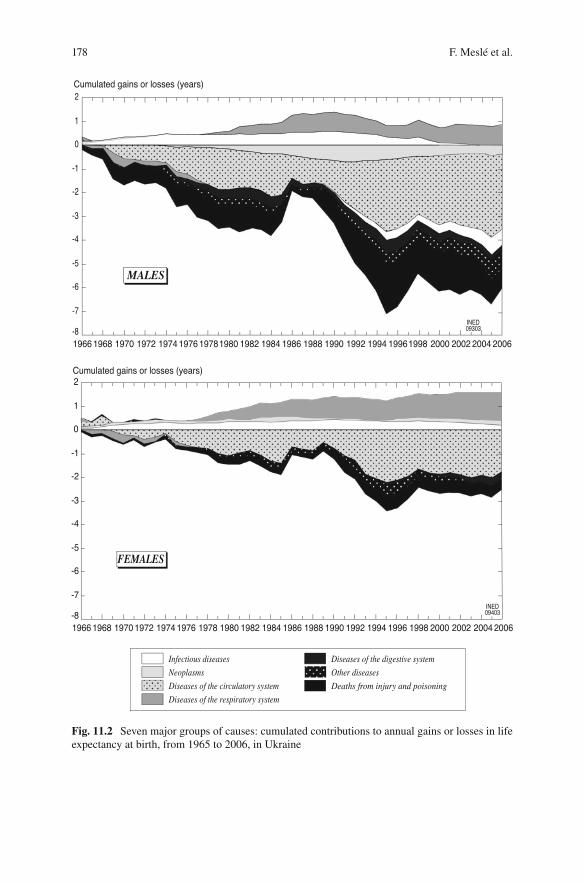
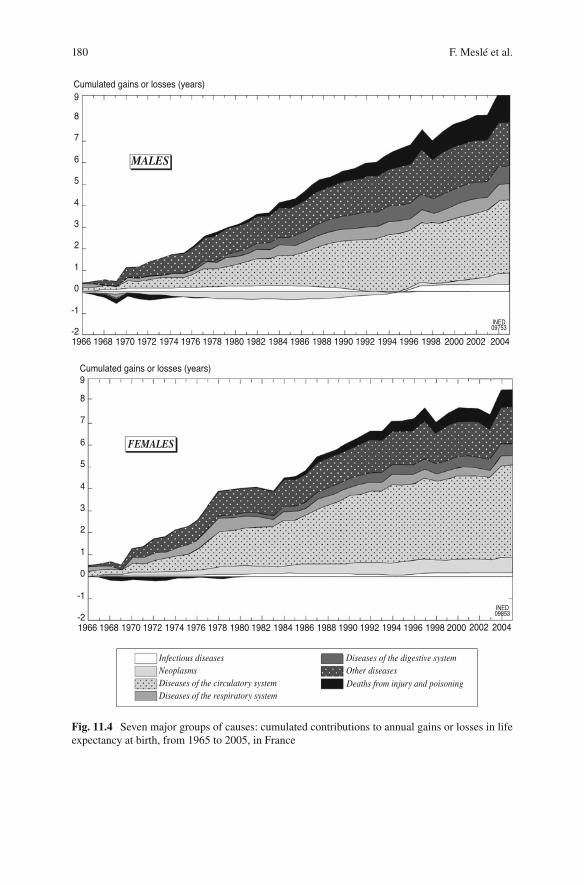
In the three fi gures that follow (Figs. 11.2 , 11.3 , and 11.4 ), we can see how gains or losses in life expectancy gradually accumulated over the course of time from 1965 (up to 2006 for Ukraine and Russia, up to 2005 for France). Each of these fi gures traces the history of one of the three countries, distinguishing between the sexes. In order to draw these fi gures, we calculated, for each calendar year, the contributions of different groups of causes to the change in life expectancy by comparison with the preceding year. Then, for each group of causes, we cumulated these annual con-tributions from 1965 to 2006 (2005 for France). Finally, in order to illustrate the results satisfactorily, we cumulated the causes producing the losses and the causes producing the gains separately at each stage in summing the years gained or lost.
In Ukraine, gains in life expectancy due to the reduction in infectious diseases took place mainly at the start of the period, up to about the mid-1970s. After that date, they added nothing more to the cumulated total and even, from the early 1990s, gave way to regressive movements that sequentially and drastically reduced the benefi ts of the past until, by the end of the period, these had been totally cancelled out. Gains in life expectancy due to the reduction in respiratory diseases are much more recent, since at the start of the period (up to around the late 1970s) the trend in this group of causes was even such as to produce losses. From the early 1980s, these losses were wiped out, and the cumulated total eventually became positive, reaching a maximum with Gorbachev’s anti-alcohol campaign. But this benefi cial trend was thrown somewhat into reverse, at least for males, in the following years, because of the fresh upsurge in diseases of the respiratory system over the course of the 1990s, and it did not recover until the 2000s.
Overall, we know that all the other groups of causes contributed to the reduction in life expectancy among males. Here we can see that the cumulative effects over time have always been negative, even though most of them fl uctuated strongly in the 1980s and 1990s. Cancer has played a somewhat different role from the other groups of causes, in so far as the trend in its cumulative effect was very regular, reaching a maximum in the early 1990s and at least seeming to have regressed slightly since then because of an observed reduction in mortality from cancer. The development over time of the cumulative effects of worsening mortality from diseases of the circulatory system has been spectacular. It also fl uctuated strongly as a result of the anti-alcohol campaign and then the 1992–1994 socio-economic crisis, but here we see that neither Gorbachev’s post-1985 anti-alcohol campaign nor (in fact, even less) the post-1994 recovery from crisis was able to wipe out the earlier losses, far from it. The effect of deaths from injury and poisoning has been just as spectacular, but more subject to the vagaries of the last two decades than the effect of diseases of the circulatory system. In 1986, in particular, the negative effects that had accumu-lated before the anti-alcohol campaign were almost entirely wiped out. In 1988, the reduction in cumulative losses from external causes was also more signifi cant than for diseases of the circulatory system, even though the outcome remained very neg-ative. Compared to the drastic reduction in male life expectancy brought about by
178 F. Meslé et al.
Fig. 11.2 Seven major groups of causes: cumulated contributions to annual gains or losses in life expectancy at birth, from 1965 to 2006, in Ukraine
17911 Impact of Major Groups of Causes on Life Expectancy Trends
Fig. 11.3 Seven major groups of causes: cumulated contributions to annual gains or losses in life expectancy at birth, from 1965 to 2006, in Russia
180 F. Meslé et al.
Fig. 11.4 Seven major groups of causes: cumulated contributions to annual gains or losses in life expectancy at birth, from 1965 to 2005, in France
18111 Impact of Major Groups of Causes on Life Expectancy Trends
these two major factors, the effects of diseases of the digestive system and of “other diseases” seem fairly marginal. However, in contrast to the situation that we will see for Russia, they were far from negligible. It must also be noted that the anti-alcohol campaign cancelled out almost all the earlier cumulative effects for digestive diseases (as it did for deaths from injury and poisoning), whereas it had much less infl uence on other diseases.
The principal contrast between males and females here stems from the fact that mortality from diseases of the circulatory system was very broadly, throughout the whole period, the dominant factor in accumulated losses in female life expectancy. This was mainly because alcoholism was less signifi cant, which explains why the cumulative losses appear much less sensitive than male losses to the fl uctuations of the last two decades.
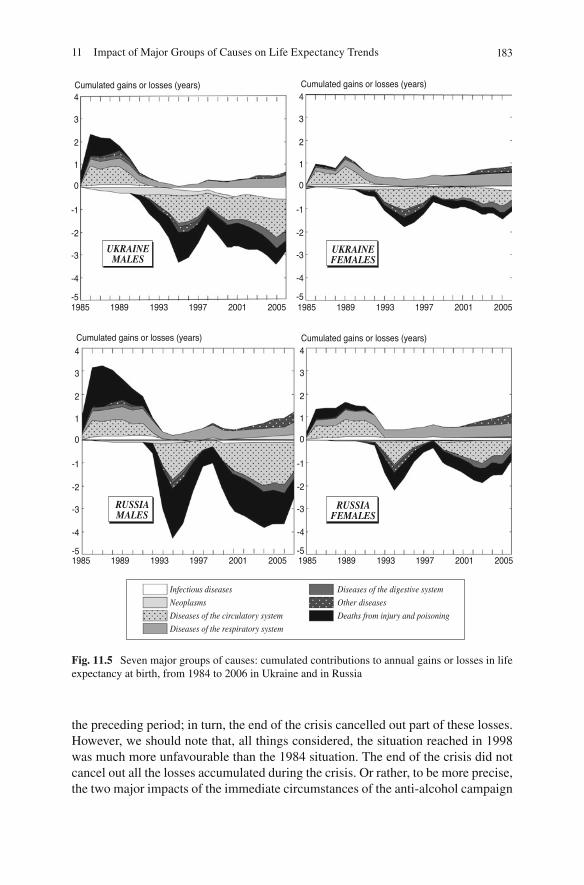
The trend in cumulated losses in life expectancy observed in Russia is fairly comparable to the Ukraine trend (Fig. 11.3 ). In fact, it is only in very recent years that cause-specifi c mortality in Russia has moved fairly sharply away from the Ukrainian pattern, under the impact of very recent improvements from which Ukraine has not benefi ted. As for the rest, what is most notable is the much more acute nature of the fl uctuations in the 1980s and 1990s. The effects of both Gorbachev’s anti-alcohol campaign and the 1992–1994 economic and social crisis were much more marked there. This was in large part due to the fact that the place occupied by deaths from injury and poisoning in the structure of mortality in Russia is bigger than the one it occupies in mortality in Ukraine; however, it also relates to the fact that the particular effect of the two events was much more incisive in Russia than in Ukraine. Firstly, the 1985 anti-alcohol campaign not only led to the total obliteration of losses for women, but, as far as men were concerned, went even beyond that: it created a cumulative positive effect of deaths from injury and poison-ing for some years. Secondly, the 1992–1994 crisis was so harsh that it drastically reduced (far more than in Ukraine) the favourable effects that had previously accu-mulated, while increasing the toll of negative effects more abruptly. Conversely, the effect of the end of the crisis was itself more sudden.
Unlike the picture we have seen for Ukraine, the effects of diseases of the digestive system in Russia were almost nil until the 2000s, and those of “other diseases” were even somewhat positive (an advantage that has become particularly pronounced over very recent years). Since the beginning, the dominant infl uence of diseases of the circulatory system and deaths from injury and poisoning in the decline in life expectancy has been constantly more overwhelming in Russia than in Ukraine, especially during the period of serious decline. And it may very well be that the impression of a reversal in the situation, suggested by the years 2004–2006, is once again only spurious good news.
With Fig. 11.4 , which gives the equivalent pattern for France (up to and including 2005), we see just how far, throughout this period, Ukraine (like Russia) followed a radically opposite path to that of Western countries. In France, almost every cause had a positive impact on life expectancy throughout the whole period. Only neo-plasms for males and deaths from injury and poisoning for both sexes had a negative impact for a certain period of time, although we should also make it clear that the

182 F. Meslé et al.
negative impact of deaths from injury and poisoning was visible only at the start of the period and, from the 1970s, gave way to a fairly signifi cant cumulative positive effect. It was also from this period onwards that the reduction in mortality from diseases of the digestive system (including cirrhosis of the liver) contributed very signifi cantly to the increase in life expectancy. As far as male mortality from neo-plasms was concerned, its decline from the 1980s onwards completely cancelled out the earlier cumulative losses. Thus, deaths from injury and poisoning, cirrhosis of the liver, malignant lung cancer in males and so on, together constitute a major source of divergence between Ukraine or Russia and France, since France, unlike the other two countries, succeeded not only in stemming the rise in these ‘man-made’ diseases but also in obtaining a large reduction in them, with positive conse-quences for life expectancy. But, of course, the chief source of divergence relates to the trend in diseases of the circulatory system, which, in contrast to what has hap-pened in Ukraine and in Russia, has continuously produced massive life expectancy gains in France. While France, like most Western countries, managed to achieve a stunning revolution in its circulatory disease situation, Ukraine, like Russia, was mired in the long-term crisis that had begun in the 1960s. Finally, we should also note the constant large decline in mortality from “other diseases” in France. The years of life gained in this way relate to a fairly piecemeal combination of favourable factors, of which the two main elements were the decline in infant mortality from causes other than infections, which led to a gain of almost 1 year’s life expectancy for both sexes, and the general improvement in health of people aged over 60.
11.2.2 Since 1984
This representation of the cumulative effects of cause-specifi c mortality trends on life expectancy obviously depends a great deal on the date from which the sum is calculated and on the length of the period observed. In order to give a better account of the trends specifi c to the major fl uctuations of the 1980s and 1990s, we made a cumulation for Russia and Ukraine, limited to the years 1984–2006 (Fig. 11.5 ).
This new representation enables us to illustrate much more clearly the mirror effects that were successively produced by the anti-alcohol campaign and the 1992–1994 socio-economic crisis. The symmetry observed between the causes involved in improving life expectancy after 1984 and those involved in the subsequent dete-rioration is particularly obvious for males. Apart from diseases of the respiratory system, whose cumulative effect remained constantly positive throughout the whole period, there was a fi rst phase in both Ukraine and Russia (1985–1990) when deaths from injury and poisoning and from diseases of the circulatory system were the primary large-scale contributors to a rise in life expectancy under the impact of the anti-alcohol campaign. There was then a gradual reversal of these gains as the cam-paign was relaxed, followed by a second phase in which, under the impact of the economic and social crisis, deaths from injury and poisoning and from diseases of the circulatory system led to losses that were dramatically higher than the gains of
18311 Impact of Major Groups of Causes on Life Expectancy Trends
the preceding period; in turn, the end of the crisis cancelled out part of these losses. However, we should note that, all things considered, the situation reached in 1998 was much more unfavourable than the 1984 situation. The end of the crisis did not cancel out all the losses accumulated during the crisis. Or rather, to be more precise, the two major impacts of the immediate circumstances of the anti-alcohol campaign
Fig. 11.5 Seven major groups of causes: cumulated contributions to annual gains or losses in life expectancy at birth, from 1984 to 2006 in Ukraine and in Russia
184 F. Meslé et al.
and the 1992–1994 crisis did not alter the trend towards long-term decline, since, in the fi nal analysis, life expectancy ended at a lower level than at the starting-point. Are we seeing the same trend with the relapse of the years 1999–2005 (1999–2003 in Russia)? In fact, the onset of this relapse (in 1999–2000) was more abrupt than the pre-1984 trend had been on average, and therefore it was also attributable to the immediate circumstances. This might have been partly a case of the emergence of AIDS, especially in Ukraine, where we see that infectious diseases had a much stronger negative impact in those 2 years; but it also related, especially in Russia, to the very strong fresh upsurge in deaths from injury and poisoning and from diseases of the circulatory system. But the fact remains that decline in the years 2001–2005 (2001–2003 in Russia) again came fairly close to the slower pre-1984 rate of long-term decline. In Ukraine, however, 2006 marked a return to improvement, although it is obviously much too soon to view this as the long-awaited, sustainable reversal of a trend. Even for Russia, where an improvement has emerged since 2003, it would be unwise to assert this.
In any case, Fig. 11.5 confi rms that the two main differences between Ukraine and Russia are, fi rstly, that the fl uctuations observed since the mid-1980s have been much more acute in Russia, although more dominated by diseases of the circulatory system and deaths from injury and poisoning than in Ukraine, and, secondly, that this was the case even during the 1992–1994 economic and social crisis, when the impact of other causes, though not insignifi cant, was less in Russia than in Ukraine. On the other hand, it is too soon to say whether the greater improvement observed in very recent years in Russia is or is not the starting-point of a considerable divergence between the two countries.
11.3 Life Expectancy and Cause-Specifi c Mortality by Age
Cross-analysis by cause and age will enable us to learn more about the nature of gains and losses in life expectancy. After a quick glance at the whole period 1965–2006, we shall analyse the recent fl uctuations in more detail.
11.3.1 Analysis of Overall Losses for the Period 1965–2006
Figure 11.6 breaks down the gains and losses in life expectancy observed in Ukraine and Russia for the whole period 1965–2006, according to age and group of causes, and the results are compared with those observed in France for the period 1965–2005 (Annex XIII on the Website ( http://www.demogr.mpg.de/books/drm/009 or http://extras.springer.com/ )).
The Ukrainian and Russian patterns are obviously very similar, especially when they are contrasted with the French one, as here. In both Ukraine and Russia, all the groups of causes (apart from infectious and respiratory diseases) contributed to losses in life expectancy at almost all ages over 15, but the heaviest losses, especially for
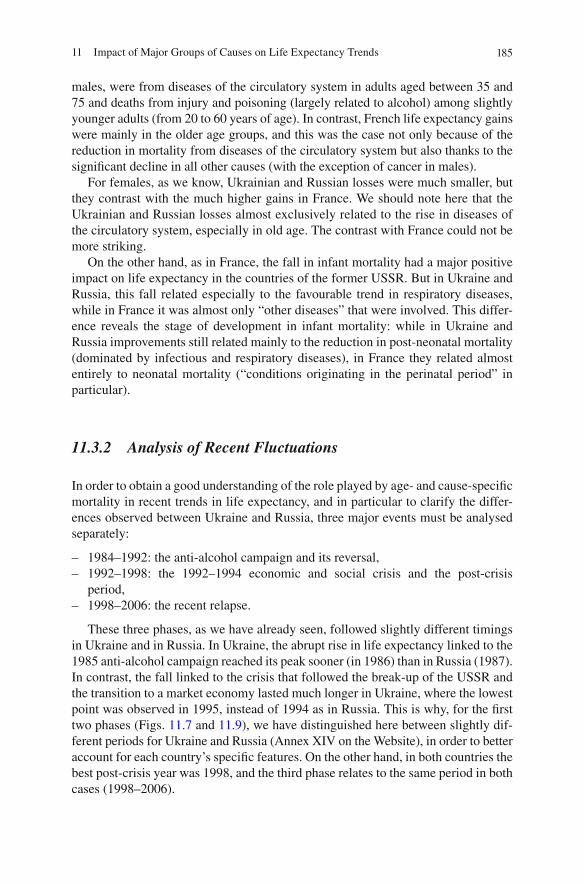
18511 Impact of Major Groups of Causes on Life Expectancy Trends
males, were from diseases of the circulatory system in adults aged between 35 and 75 and deaths from injury and poisoning (largely related to alcohol) among slightly younger adults (from 20 to 60 years of age). In contrast, French life expectancy gains were mainly in the older age groups, and this was the case not only because of the reduction in mortality from diseases of the circulatory system but also thanks to the signifi cant decline in all other causes (with the exception of cancer in males).
For females, as we know, Ukrainian and Russian losses were much smaller, but they contrast with the much higher gains in France. We should note here that the Ukrainian and Russian losses almost exclusively related to the rise in diseases of the circulatory system, especially in old age. The contrast with France could not be more striking.
On the other hand, as in France, the fall in infant mortality had a major positive impact on life expectancy in the countries of the former USSR. But in Ukraine and Russia, this fall related especially to the favourable trend in respiratory diseases, while in France it was almost only “other diseases” that were involved. This differ-ence reveals the stage of development in infant mortality: while in Ukraine and Russia improvements still related mainly to the reduction in post-neonatal mortality (dominated by infectious and respiratory diseases), in France they related almost entirely to neonatal mortality (“conditions originating in the perinatal period” in particular).
11.3.2 Analysis of Recent Fluctuations
In order to obtain a good understanding of the role played by age- and cause-specifi c mortality in recent trends in life expectancy, and in particular to clarify the differ-ences observed between Ukraine and Russia, three major events must be analysed separately:
1984–1992: the anti-alcohol campaign and its reversal, – 1992–1998: the 1992–1994 economic and social crisis and the post-crisis –period, 1998–2006: the recent relapse. –
These three phases, as we have already seen, followed slightly different timings in Ukraine and in Russia. In Ukraine, the abrupt rise in life expectancy linked to the 1985 anti-alcohol campaign reached its peak sooner (in 1986) than in Russia (1987). In contrast, the fall linked to the crisis that followed the break-up of the USSR and the transition to a market economy lasted much longer in Ukraine, where the lowest point was observed in 1995, instead of 1994 as in Russia. This is why, for the fi rst two phases (Figs. 11.7 and 11.9 ), we have distinguished here between slightly dif-ferent periods for Ukraine and Russia (Annex XIV on the Website), in order to better account for each country’s specifi c features. On the other hand, in both countries the best post-crisis year was 1998, and the third phase relates to the same period in both cases (1998–2006).
186 F. Meslé et al.
Fig. 11.6 Contributions of mortality trends by age and major group of causes to gains and losses in life expectancy at birth between 1965 and 2006 in Ukraine and Russia and between 1965 and 2005 in France
18711 Impact of Major Groups of Causes on Life Expectancy Trends
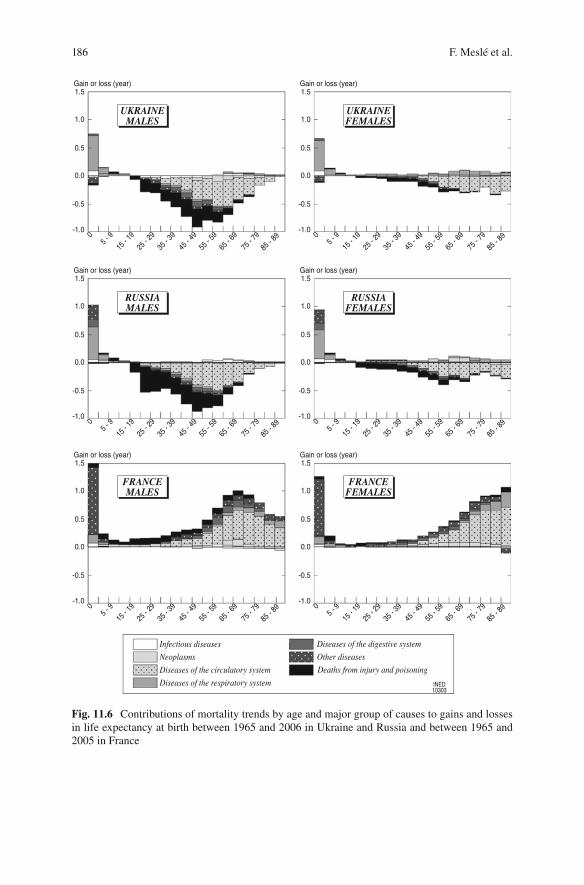
11.3.2.1 The Anti-alcohol Campaign and Its Reversal (1984–1992)
Firstly, the gain in life expectancy in Ukraine (1984–1986) and in Russia (1984–1987) was mainly due to the reduction in deaths from injury and poisoning among young adults (25–60), directly linked, as we know, to the decline in alcoholism (Shkolnikov and Nemtsov 1997 ) and, incidentally, to the decline in diseases of the circulatory sys-tem, which was closely related to the reduction in alcohol consumption. In this con-nection we should mention that the campaign involved a reduction in the state-controlled production and sale of alcohol, an increase in the price of alcoholic drinks, a restric-tion on private distilling, and the development of specialized medical services. However, all these measures were just a fl ash in the pan, since they were quickly abandoned. We can see that they were probably less draconian in Ukraine than in Russia: if the gains they brought about in Ukraine (Fig. 11.7 ) were smaller, this is above all because the effect of the decline in deaths from injury and poisoning was much less among younger adults (aged up to 50), while, in contrast, the fall in mor-tality from diseases of the circulatory system had a little more impact there.
The second change (the fall in life expectancy observed in Ukraine from 1986 to 1992 and in Russia from 1987 to 1992) fi tted a pattern of age- and cause-specifi c losses that was highly symmetrical to that of the gains in the preceding period. This is because it was dominated by the re-emerging of deaths from injury and poisoning among young adults, reinforced by an increase in mortality from diseases of the circulatory system after anti-alcohol campaign was abandoned. Here again, the effect of mortality from injury and poisoning among young adults was much more pronounced in Russia than in Ukraine, while in contrast, the effect of diseases of the circulatory system in the older adult age groups was more pronounced in Ukraine than in Russia. So the effects of Gorbachev’s anti-alcohol campaign, like the effects of the subsequent relaxation of the measures, differed signifi cantly between Ukraine and Russia. Yet these differences in no way result from our use of a different timing division here. It might be thought that the greater effect of deaths from injury and poisoning in Russia in the fi rst period is due at least in part to the fact that this period was longer in Russia (3 years) than in Ukraine (2 years). But this is not the case: not only was the reverse recorded for diseases of the circulatory system over the same period, but also (and especially) the negative effect of deaths from injury and poisoning during the second period (which in this instance was shorter in Russia) was greater in Russia than in Ukraine. In fact, the timing difference is itself a consequence of the different repercussions in Ukraine and in Russia of the immediate health situation linked to the anti-alcohol campaign.
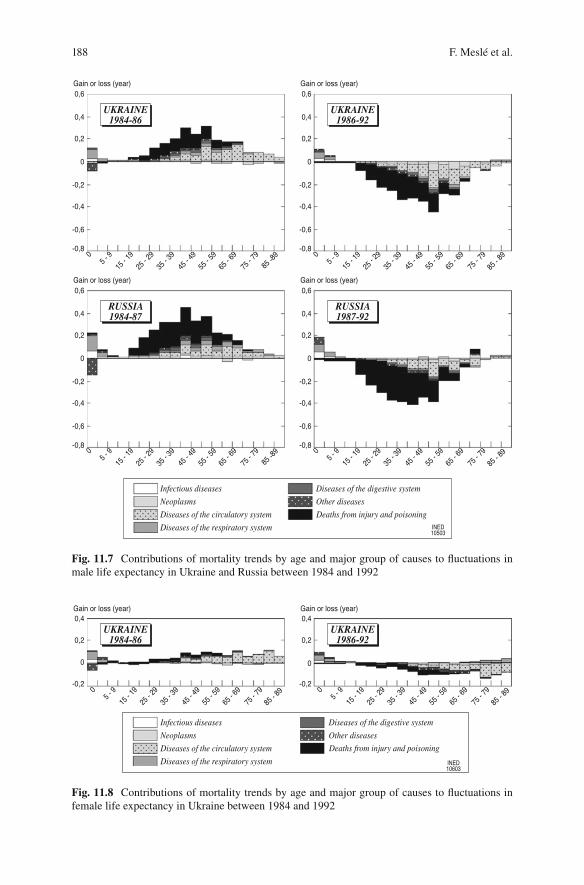
This fi rst large fl uctuation, resulting from the anti-alcohol campaign, did much less to disrupt female mortality than male. Figure 11.8 , constructed on the same scale as Fig. 11.7 , provides a striking illustration of this. Even though the same upheavals as for males can still be observed leading in the same direction for females, they result in only modest effects. The anti-alcohol policy also had con-sequences for females, but these were much smaller and somewhat different in nature, since they were almost entirely concentrated on diseases of the circulatory system. It did not seem to be helpful to compare the Ukrainian results to the Russian results, which are very little different.
188 F. Meslé et al.
Fig. 11.7 Contributions of mortality trends by age and major group of causes to fl uctuations in male life expectancy in Ukraine and Russia between 1984 and 1992
Fig. 11.8 Contributions of mortality trends by age and major group of causes to fl uctuations in female life expectancy in Ukraine between 1984 and 1992
18911 Impact of Major Groups of Causes on Life Expectancy Trends
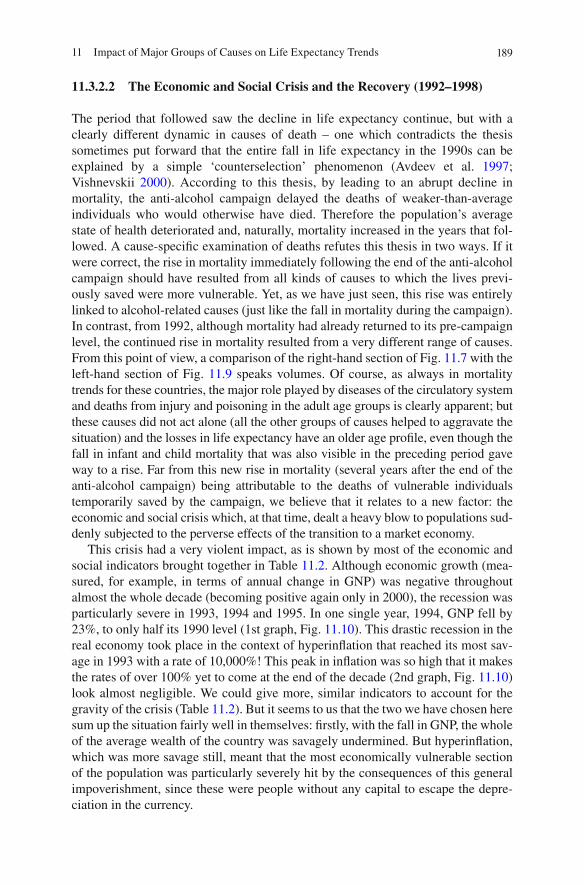
11.3.2.2 The Economic and Social Crisis and the Recovery (1992–1998)
The period that followed saw the decline in life expectancy continue, but with a clearly different dynamic in causes of death – one which contradicts the thesis sometimes put forward that the entire fall in life expectancy in the 1990s can be explained by a simple ‘counterselection’ phenomenon (Avdeev et al. 1997 ; Vishnevskii 2000 ) . According to this thesis, by leading to an abrupt decline in mortality, the anti-alcohol campaign delayed the deaths of weaker-than-average individuals who would otherwise have died. Therefore the population’s average state of health deteriorated and, naturally, mortality increased in the years that fol-lowed. A cause-specifi c examination of deaths refutes this thesis in two ways. If it were correct, the rise in mortality immediately following the end of the anti-alcohol campaign should have resulted from all kinds of causes to which the lives previ-ously saved were more vulnerable. Yet, as we have just seen, this rise was entirely linked to alcohol-related causes (just like the fall in mortality during the campaign). In contrast, from 1992, although mortality had already returned to its pre-campaign level, the continued rise in mortality resulted from a very different range of causes. From this point of view, a comparison of the right-hand section of Fig. 11.7 with the left-hand section of Fig. 11.9 speaks volumes. Of course, as always in mortality trends for these countries, the major role played by diseases of the circulatory system and deaths from injury and poisoning in the adult age groups is clearly apparent; but these causes did not act alone (all the other groups of causes helped to aggravate the situation) and the losses in life expectancy have an older age profi le, even though the fall in infant and child mortality that was also visible in the preceding period gave way to a rise. Far from this new rise in mortality (several years after the end of the anti-alcohol campaign) being attributable to the deaths of vulnerable individuals temporarily saved by the campaign, we believe that it relates to a new factor: the economic and social crisis which, at that time, dealt a heavy blow to populations sud-denly subjected to the perverse effects of the transition to a market economy.
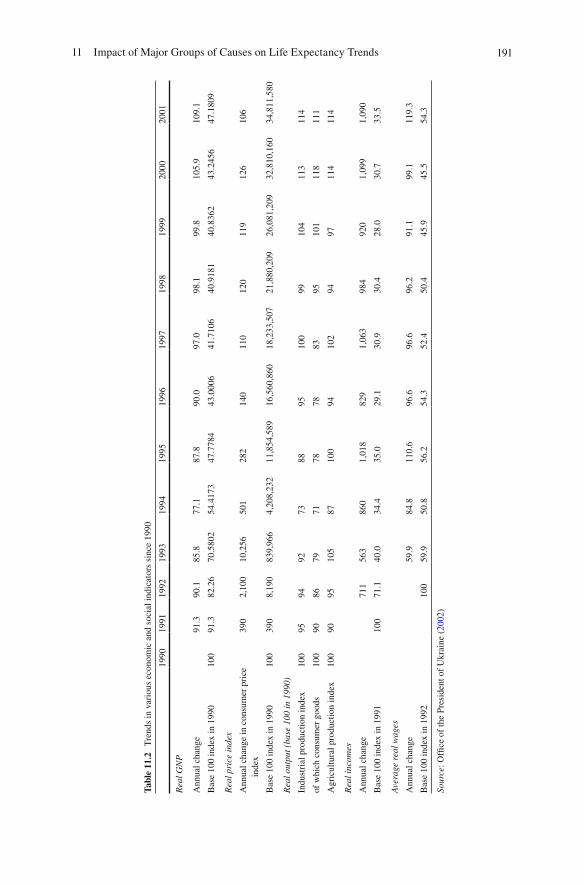
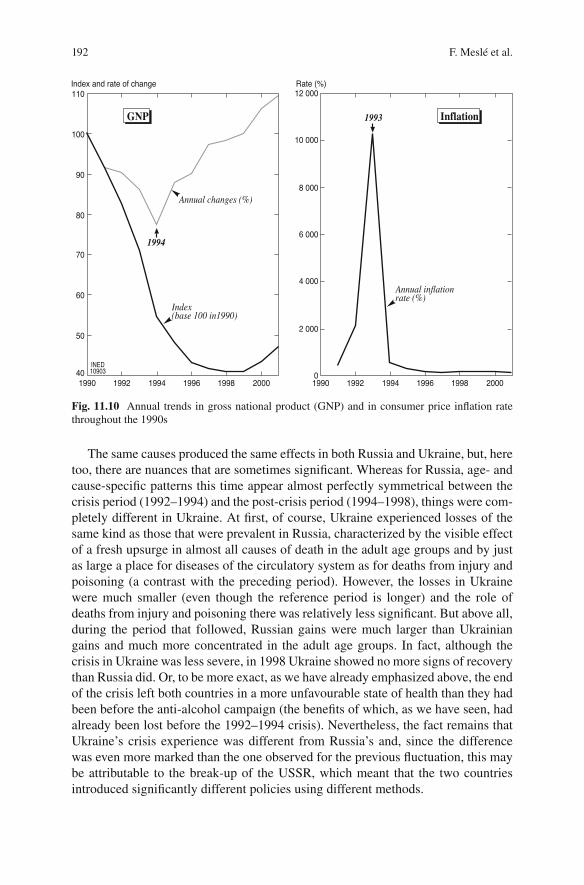
This crisis had a very violent impact, as is shown by most of the economic and social indicators brought together in Table 11.2 . Although economic growth (mea-sured, for example, in terms of annual change in GNP) was negative throughout almost the whole decade (becoming positive again only in 2000), the recession was particularly severe in 1993, 1994 and 1995. In one single year, 1994, GNP fell by 23%, to only half its 1990 level (1st graph, Fig. 11.10 ). This drastic recession in the real economy took place in the context of hyperinfl ation that reached its most sav-age in 1993 with a rate of 10,000%! This peak in infl ation was so high that it makes the rates of over 100% yet to come at the end of the decade (2nd graph, Fig. 11.10 ) look almost negligible. We could give more, similar indicators to account for the gravity of the crisis (Table 11.2 ). But it seems to us that the two we have chosen here sum up the situation fairly well in themselves: fi rstly, with the fall in GNP, the whole of the average wealth of the country was savagely undermined. But hyperinfl ation, which was more savage still, meant that the most economically vulnerable section of the population was particularly severely hit by the consequences of this general impoverishment, since these were people without any capital to escape the depre-ciation in the currency.
190 F. Meslé et al.
Given the sad state of the health services, it is hard to imagine that such a crisis would not have consequences for chances of survival; it is also easy to understand why the further fall in life expectancy following the abandonment of the anti-alcohol campaign accelerated in the early 1990s until it reached a much lower level than that of the pre-campaign period, in fact, a lower level than would have resulted from extrapolation of the early 1980s’ trends.
After 1995, economic decline continued for a few more years, but at a very reduced pace, just as hyperinfl ation at 10,000% very quickly gave way to much less outrageous rates. Fairly quickly too, after the crisis had passed, the populations involved found the resources to adapt to circumstances, doing more to safeguard their chances of survival. So life expectancy was able to start rising again.
Fig. 11.9 Contributions of mortality trends by age and major group of causes to fl uctuations in male life expectancy in Ukraine and Russia between 1992 and 1998
19111 Impact of Major Groups of Causes on Life Expectancy Trends
Tabl
e 11
.2
Tre
nds
in v
ario
us e
cono
mic
and
soc
ial i
ndic
ator
s si
nce
1990
1990
19
91
1992
19
93
1994
19
95
1996
19
97
1998
19
99
2000
20
01
Rea
l GN
P
Ann
ual c
hang
e 91
.3
90.1
85
.8
77.1
87
.8
90.0
97
.0
98.1
99
.8
105.
9 10
9.1
Bas
e 10
0 in
dex
in 1
990
100
91.3
82
.26
70.5
802
54.4
173
47.7
784
43.0
006
41.7
106
40.9
181
40.8
362
43.2
456
47.1
809
Rea
l pri
ce in
dex
Ann
ual c
hang
e in
con
sum
er p
rice
in
dex
390
2,10
0 10
,256
50
1 28
2 14
0 11
0 12
0 11
9 12
6 10
6
Bas
e 10
0 in
dex
in 1
990
100
390
8,19
0 83
9,96
6 4,
208,
232
11,8
54,5
89
16,5
60,8
60
18,2
33,5
07
21,8
80,2
09
26,0
81,2
09
32,8
10,1
60
34,8
11,5
80
Rea
l out
put (
base
100
in 1
990)
Indu
stri
al p
rodu
ctio
n in
dex
100
95
94
92
73
88
95
100
99
104
113
114
of w
hich
con
sum
er g
oods
10
0 90
86
79
71
78
78
83
95
10
1 11
8 11
1
Agr
icul
tura
l pro
duct
ion
inde
x 10
0 90
95
10
5 87
10
0 94
10
2 94
97
11
4 11
4
Rea
l inc
omes
Ann
ual c
hang
e 71
1 56
3 86
0 1,
018
829
1,06
3 98
4 92
0 1,
099
1,09
0
Bas
e 10
0 in
dex
in 1
991
100
71.1
40
.0
34.4
35
.0
29.1
30
.9
30.4
28
.0
30.7
33
.5
Ave
rage
rea
l wag
es
Ann
ual c
hang
e 59
.9
84.8
11
0.6
96.6
96
.6
96.2
91
.1
99.1
11
9.3
Bas
e 10
0 in
dex
in 1
992
100
59.9
50
.8
56.2
54
.3
52.4
50
.4
45.9
45
.5
54.3
Sour
ce: O
ffi c
e of
the
Pres
iden
t of
Ukr
aine
( 20
02 )
192 F. Meslé et al.
The same causes produced the same effects in both Russia and Ukraine, but, here too, there are nuances that are sometimes signifi cant. Whereas for Russia, age- and cause-specifi c patterns this time appear almost perfectly symmetrical between the crisis period (1992–1994) and the post-crisis period (1994–1998), things were com-pletely different in Ukraine. At fi rst, of course, Ukraine experienced losses of the same kind as those that were prevalent in Russia, characterized by the visible effect of a fresh upsurge in almost all causes of death in the adult age groups and by just as large a place for diseases of the circulatory system as for deaths from injury and poisoning (a contrast with the preceding period). However, the losses in Ukraine were much smaller (even though the reference period is longer) and the role of deaths from injury and poisoning there was relatively less signifi cant. But above all, during the period that followed, Russian gains were much larger than Ukrainian gains and much more concentrated in the adult age groups. In fact, although the crisis in Ukraine was less severe, in 1998 Ukraine showed no more signs of recovery than Russia did. Or, to be more exact, as we have already emphasized above, the end of the crisis left both countries in a more unfavourable state of health than they had been before the anti-alcohol campaign (the benefi ts of which, as we have seen, had already been lost before the 1992–1994 crisis). Nevertheless, the fact remains that Ukraine’s crisis experience was different from Russia’s and, since the difference was even more marked than the one observed for the previous fl uctuation, this may be attributable to the break-up of the USSR, which meant that the two countries introduced signifi cantly different policies using different methods.
Fig. 11.10 Annual trends in gross national product (GNP) and in consumer price infl ation rate throughout the 1990s
19311 Impact of Major Groups of Causes on Life Expectancy Trends
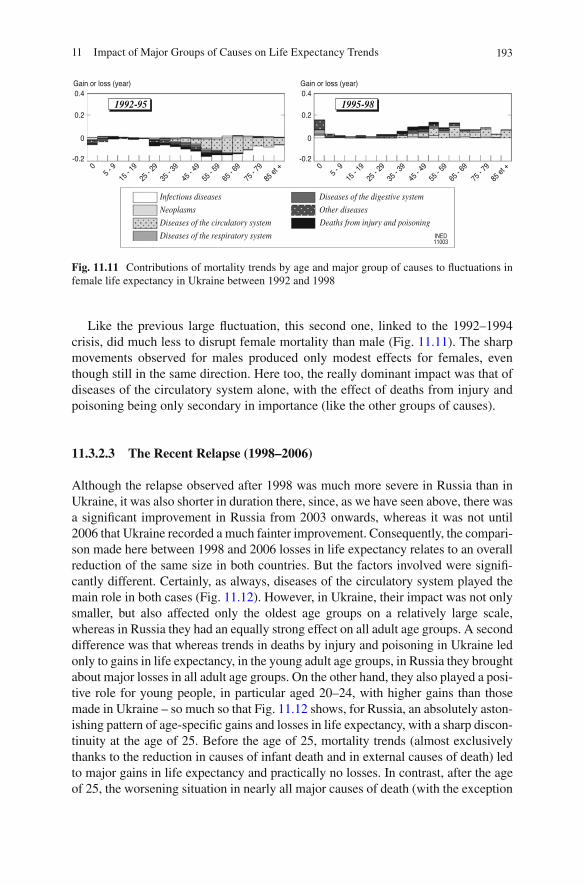
Like the previous large fl uctuation, this second one, linked to the 1992–1994 crisis, did much less to disrupt female mortality than male (Fig. 11.11 ). The sharp movements observed for males produced only modest effects for females, even though still in the same direction. Here too, the really dominant impact was that of diseases of the circulatory system alone, with the effect of deaths from injury and poisoning being only secondary in importance (like the other groups of causes).
11.3.2.3 The Recent Relapse (1998–2006)
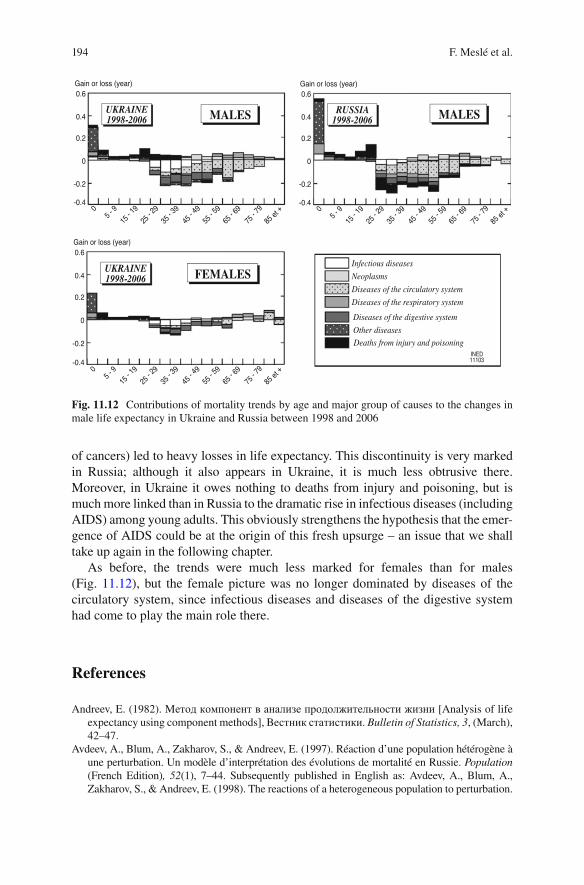
Although the relapse observed after 1998 was much more severe in Russia than in Ukraine, it was also shorter in duration there, since, as we have seen above, there was a signifi cant improvement in Russia from 2003 onwards, whereas it was not until 2006 that Ukraine recorded a much fainter improvement. Consequently, the compari-son made here between 1998 and 2006 losses in life expectancy relates to an overall reduction of the same size in both countries. But the factors involved were signifi -cantly different. Certainly, as always, diseases of the circulatory system played the main role in both cases (Fig. 11.12 ). However, in Ukraine, their impact was not only smaller, but also affected only the oldest age groups on a relatively large scale, whereas in Russia they had an equally strong effect on all adult age groups. A second difference was that whereas trends in deaths by injury and poisoning in Ukraine led only to gains in life expectancy, in the young adult age groups, in Russia they brought about major losses in all adult age groups. On the other hand, they also played a posi-tive role for young people, in particular aged 20–24, with higher gains than those made in Ukraine – so much so that Fig. 11.12 shows, for Russia, an absolutely aston-ishing pattern of age-specifi c gains and losses in life expectancy, with a sharp discon-tinuity at the age of 25. Before the age of 25, mortality trends (almost exclusively thanks to the reduction in causes of infant death and in external causes of death) led to major gains in life expectancy and practically no losses. In contrast, after the age of 25, the worsening situation in nearly all major causes of death (with the exception
Fig. 11.11 Contributions of mortality trends by age and major group of causes to fl uctuations in female life expectancy in Ukraine between 1992 and 1998
194 F. Meslé et al.
of cancers) led to heavy losses in life expectancy. This discontinuity is very marked in Russia; although it also appears in Ukraine, it is much less obtrusive there. Moreover, in Ukraine it owes nothing to deaths from injury and poisoning, but is much more linked than in Russia to the dramatic rise in infectious diseases (including AIDS) among young adults. This obviously strengthens the hypothesis that the emer-gence of AIDS could be at the origin of this fresh upsurge – an issue that we shall take up again in the following chapter.
As before, the trends were much less marked for females than for males (Fig. 11.12 ), but the female picture was no longer dominated by diseases of the circulatory system, since infectious diseases and diseases of the digestive system had come to play the main role there.
References
Andreev, E. (1982). Meтoд кoмпoнeнт в aнaлизe пpoдoлжитeльнocти жизни [Analysis of life expectancy using component methods], Becтник cтaтиcтики. Bulletin of Statistics, 3 , (March), 42–47.
Avdeev, A., Blum, A., Zakharov, S., & Andreev, E. (1997). Réaction d’une population hétérogène à une perturbation. Un modèle d’interprétation des évolutions de mortalité en Russie. Population (French Edition) , 52 (1), 7–44. Subsequently published in English as: Avdeev, A., Blum, A., Zakharov, S., & Andreev, E. (1998). The reactions of a heterogeneous population to perturbation.
Fig. 11.12 Contributions of mortality trends by age and major group of causes to the changes in male life expectancy in Ukraine and Russia between 1998 and 2006
19511 Impact of Major Groups of Causes on Life Expectancy Trends
An interpretative model of mortality trends in Russia. Population: An English Selection , 10 (2), 267–302.
Offi ce of the President of Ukraine. (2002). Пocлaння Пpeзидeнтa Укpaiни дo Bepxoвнoi Paди Укpaiни « Пpo внутpiшнє i зoвнiшнє cтaнoвищe Укpaiни у 2001 poцi» [Report of the President of Ukraine to the Ukrainian Parliament on Ukraine’s domestic and foreign affairs in 2001] (412 p.). Kiev: Ukrainian National Information Centre.
Shkolnikov, V. M., & Nemtsov, A. (1997). The anti-alcohol campaign and variations in Russian mortality. In J. L. Bobadilla, C. A. Costello, & F. Mitchell (Eds.), Premature death in the New Independent States (pp. 239–261, 404 p.). Washington, DC: National Academy Press.
Vishnevskii, A. G. (2000). Пoдъeм cмepтнocти в 90-e гoды: фaкт или apтeфaкт? [The increase in mortality during the 1990s: Fact or artefact?]. Haceлeниe и oбщecтвo [Population and Society], 45 (May), 1–4.