Embed Size (px)
Citation preview
LIFE CYCLE INVENTORY OF THREE SINGLE-SERVING SOFT DRINK CONTAINERS
Revised Peer Reviewed Final Report
Prepared for
PET Resin Association
By
Franklin Associates, A Division of ERG Prairie Village, KS
August, 2009
CLIENTS\PETRA\KC102196.doc 08.14.09 3692.00.001.001
ii
PREFACE
The report that follows is a Life Cycle Inventory (LCI) of three single-serving soft drink containers. Funding for this project was provided by the PET Resin Association (PETRA).
At Franklin Associates, the project was managed by Melissa Huff, who served as primary life cycle analyst in modeling, development of report, analyzing results, and responding to peer review comments. Anne Marie Molen provided assistance inputting data into tables. Beverly Sauer provided quality assurance review of the report.
Franklin Associates gratefully acknowledges significant contributions to this project by Ralph Vasami of PETRA. His efforts added significantly to the quality of the report. The project was peer reviewed by an expert panel consisting of Beth Quay, independent consultant, Dr. Greg Keoleian of the University of Michigan Center for Sustainable Systems, and Dr. David Allen of the University of Texas Center for Energy and Environmental Resources. The revisions made in response to the peer review panel’s insightful comments added greatly to the quality and credibility of this final report.
This study was conducted for PETRA by Franklin Associates as an independent contractor. The findings and conclusions presented in this report are strictly those of Franklin Associates. Franklin Associates makes no statements nor supports any conclusions other than those presented in this report. August 14, 2009
CLIENTS\PETRA\KC102196.doc 08.14.09 3692.00.001.001
iii
Table of Contents
EXECUTIVE SUMMARY – LIFE CYCLE INVENTORY OF THREE SOFT DRINK CONTAINERS.................................................................................................................................ES-1
INTRODUCTION....................................................................................................................... ES-1 LCI METHODOLOGY............................................................................................................... ES-1 GOALS OF THE STUDY ........................................................................................................... ES-1 SYSTEMS STUDIED ................................................................................................................. ES-2 SCOPE AND BOUNDARIES ..................................................................................................... ES-3 LIMITATIONS AND ASSUMPTIONS....................................................................................... ES-4 LCI RESULTS ............................................................................................................................ ES-4
Energy ...................................................................................................................................... ES-5 Solid Waste............................................................................................................................... ES-7 Greenhouse Gas Emissions........................................................................................................ ES-9
LCI CONCLUSIONS................................................................................................................ ES-11 CHAPTER 1 – SYSTEM DESCRIPTIONS AND LCI ASSUMPTIONS..........................................1-1
INTRODUCTION..........................................................................................................................1-1 Systems Studied ...........................................................................................................................1-1 Functional Unit ............................................................................................................................1-2 Scope and Boundaries ..................................................................................................................1-3 Limitations and Assumptions........................................................................................................1-3
CHAPTER 2 – LCI RESULTS AND CONCLUSIONS FOR SINGLE-SERVING SOFT DRINK CONTAINER SYSTEMS......................................................................................................2-1
INTRODUCTION..........................................................................................................................2-1 ENERGY .......................................................................................................................................2-1
Energy of Material Resource ........................................................................................................2-2 Process Energy.............................................................................................................................2-3 Transportation Energy..................................................................................................................2-3 Energy Profile ..............................................................................................................................2-3 Energy Recovery from Waste Combustion....................................................................................2-4
SOLID WASTE .............................................................................................................................2-5 Solid Waste by Weight.................................................................................................................2-6 Solid Waste by Volume................................................................................................................2-7
ENVIRONMENTAL EMISSIONS.................................................................................................2-8 Atmospheric Emissions ................................................................................................................2-9 Waterborne Emissions................................................................................................................2-10
CONCLUSIONS..........................................................................................................................2-16 APPENDIX A – STUDY APPROACH AND METHODOLOGY.....................................................A-1
INTRODUCTION.........................................................................................................................A-1 GOALS OF THE STUDY .............................................................................................................A-1 STUDY SCOPE ............................................................................................................................A-2
Functional Unit ...........................................................................................................................A-2 System Boundaries......................................................................................................................A-2 Description of Data Categories ....................................................................................................A-3 Inclusion of Inputs and Outputs ...................................................................................................A-7
CLIENTS\PETRA\KC102196.doc 08.14.09 3692.00.001.001
iv
DATA...........................................................................................................................................A-7 Process Data................................................................................................................................A-7 Fuel Data ....................................................................................................................................A-9 Data Quality Goals for This Study ...............................................................................................A-9 Data Accuracy...........................................................................................................................A-10
METHODOLOGY ......................................................................................................................A-11 Coproduct Credit.......................................................................................................................A-11 Energy of Material Resource .....................................................................................................A-12 Recycling..................................................................................................................................A-14 Greenhouse Gas Accounting......................................................................................................A-15
GENERAL DECISIONS.............................................................................................................A-16 Geographic Scope .....................................................................................................................A-16 Precombustion Energy and Emissions........................................................................................A-16 Electricity Fuel Profile ..............................................................................................................A-17 System Components Not Included .............................................................................................A-17
APPENDIX B – CONSIDERATIONS FOR INTERPRETATION OF DATA AND RESULTS ..... B-1 INTRODUCTION......................................................................................................................... B-1 STATISTICAL CONSIDERATIONS............................................................................................ B-1 CONCLUSIONS........................................................................................................................... B-4
APPENDIX C – RECYCLING THEORY AND METHODOLOGY ...............................................C-1 INTRODUCTION......................................................................................................................... C-1
Recycling Theory........................................................................................................................ C-1 Application of Recycling Theory................................................................................................. C-5
APPENDIX D – SUMMARY TABLE ...............................................................................................D-1 ADDENDUM 1 – LCI OF 12-OUNCE SOFT DRINK CONTAINERS....................................... AD1-1
INTRODUCTION.................................................................................................................... AD1-1 Systems Studied ..................................................................................................................... AD1-1 Functional Unit ...................................................................................................................... AD1-2 Scope and Boundaries ............................................................................................................ AD1-2 Limitations and Assumptions.................................................................................................. AD1-3
RESULTS ................................................................................................................................ AD1-4 Energy by Category................................................................................................................ AD1-4 Energy Profile ........................................................................................................................ AD1-6 Energy Recovery from Waste Combustion.............................................................................. AD1-7 Solid Waste............................................................................................................................ AD1-9 Environmental Emissions ..................................................................................................... AD1-11
ADDENDUM 1 CONCLUSIONS .......................................................................................... AD1-20 ADDENDUM 2 – PEER REVIEW ............................................................................................... AD2-1
CLIENTS\PETRA\KC102196.doc 08.14.09 3692.00.001.001
v
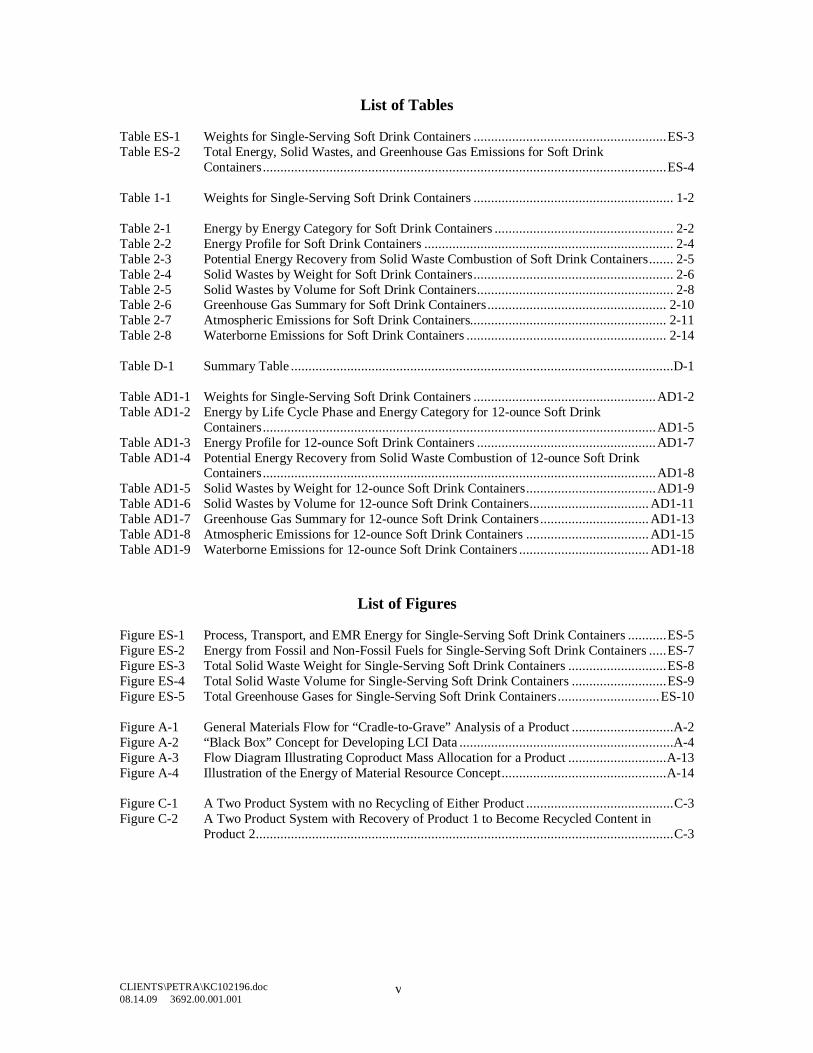
List of Tables Table ES-1 Weights for Single-Serving Soft Drink Containers .......................................................ES-3 Table ES-2 Total Energy, Solid Wastes, and Greenhouse Gas Emissions for Soft Drink
Containers...................................................................................................................ES-4 Table 1-1 Weights for Single-Serving Soft Drink Containers ......................................................... 1-2 Table 2-1 Energy by Energy Category for Soft Drink Containers ................................................... 2-2 Table 2-2 Energy Profile for Soft Drink Containers ....................................................................... 2-4 Table 2-3 Potential Energy Recovery from Solid Waste Combustion of Soft Drink Containers....... 2-5 Table 2-4 Solid Wastes by Weight for Soft Drink Containers......................................................... 2-6 Table 2-5 Solid Wastes by Volume for Soft Drink Containers........................................................ 2-8 Table 2-6 Greenhouse Gas Summary for Soft Drink Containers................................................... 2-10 Table 2-7 Atmospheric Emissions for Soft Drink Containers........................................................ 2-11 Table 2-8 Waterborne Emissions for Soft Drink Containers ......................................................... 2-14 Table D-1 Summary Table .............................................................................................................D-1 Table AD1-1 Weights for Single-Serving Soft Drink Containers ....................................................AD1-2 Table AD1-2 Energy by Life Cycle Phase and Energy Category for 12-ounce Soft Drink
Containers................................................................................................................AD1-5 Table AD1-3 Energy Profile for 12-ounce Soft Drink Containers ...................................................AD1-7 Table AD1-4 Potential Energy Recovery from Solid Waste Combustion of 12-ounce Soft Drink
Containers................................................................................................................AD1-8 Table AD1-5 Solid Wastes by Weight for 12-ounce Soft Drink Containers.....................................AD1-9 Table AD1-6 Solid Wastes by Volume for 12-ounce Soft Drink Containers.................................. AD1-11 Table AD1-7 Greenhouse Gas Summary for 12-ounce Soft Drink Containers............................... AD1-13 Table AD1-8 Atmospheric Emissions for 12-ounce Soft Drink Containers ................................... AD1-15 Table AD1-9 Waterborne Emissions for 12-ounce Soft Drink Containers ..................................... AD1-18
List of Figures Figure ES-1 Process, Transport, and EMR Energy for Single-Serving Soft Drink Containers ...........ES-5 Figure ES-2 Energy from Fossil and Non-Fossil Fuels for Single-Serving Soft Drink Containers .....ES-7 Figure ES-3 Total Solid Waste Weight for Single-Serving Soft Drink Containers ............................ES-8 Figure ES-4 Total Solid Waste Volume for Single-Serving Soft Drink Containers ...........................ES-9 Figure ES-5 Total Greenhouse Gases for Single-Serving Soft Drink Containers.............................ES-10 Figure A-1 General Materials Flow for “Cradle-to-Grave” Analysis of a Product .............................A-2 Figure A-2 “Black Box” Concept for Developing LCI Data .............................................................A-4 Figure A-3 Flow Diagram Illustrating Coproduct Mass Allocation for a Product ............................A-13 Figure A-4 Illustration of the Energy of Material Resource Concept...............................................A-14 Figure C-1 A Two Product System with no Recycling of Either Product ..........................................C-3 Figure C-2 A Two Product System with Recovery of Product 1 to Become Recycled Content in
Product 2.......................................................................................................................C-3
Executive Summary Life Cycle Inventory of Three Soft Drink Containers
CLIENTS\PETRA\KC102196.doc 08.14.09 3692.00.001.001
ES-1
EXECUTIVE SUMMARY LIFE CYCLE INVENTORY OF THREE SOFT DRINK CONTAINERS
INTRODUCTION A Life Cycle Inventory (LCI) quantifies the resource use (materials and energy) and environmental emissions associated with the life cycle of specific products. The purpose of this study is to evaluate the resource use, solid wastes, and greenhouse gas emissions associated with common containers used for non-refillable single-serving soft drinks.
This LCI was performed for the PET Resin Association (PETRA). The purpose of this study is to compare the life cycle burdens of single-serving containers used for soft drinks. PETRA will use the results of this study to evaluate the environmental footprint of the PET bottle and alternative containers. It is possible that PETRA will also use the results of this study as a defense against any broad untrue statements made by producers, trade organizations or environmental groups affiliated with alternative soft drink containers.
The member companies of PETRA are the key audience of this LCI. However, it is possible that PETRA will share the results of this LCI with media outlets or members of the public with specific questions about the environmental profile of soft drink containers. A peer review is included in the final addendum to this report. LCI METHODOLOGY
The methodology used for goal and scope definition and inventory analysis in this study is consistent with the methodology for Life Cycle Inventory (LCI) as described in the ISO 14040 and 14044 Standard documents. A life cycle inventory quantifies the energy consumption and environmental emissions for a given product based on the study scope and boundaries established. This LCI is a cradle-to-grave analysis, covering steps from raw material extraction through container disposal.
This study generally follows the above standards for LCI. However, in order to address PETRA’s immediate concerns, energy, solid waste, and greenhouse gas emissions are the only environmental burdens included in this executive summary. GOALS OF THE STUDY
The principal goal of this study is to evaluate the environmental footprint of the PET bottle and alternative containers used for soft drinks. It is possible that PETRA will also use the results of this study as a defense against any broad untrue statements made by producers, trade organizations or environmental groups affiliated with the alternative soft drink containers.
Executive Summary Life Cycle Inventory of Three Soft Drink Containers
CLIENTS\PETRA\KC102196.doc 08.14.09 3692.00.001.001
ES-2
SYSTEMS STUDIED
This LCI evaluates three common non-refillable single-serving container systems used for soft drinks:
1. 12-ounce aluminum can 2. 8-ounce glass bottle 3. 20-ounce PET bottle
Water bottles are not included in this report.
A functional unit is the basis of comparison of an LCI. The functional unit of this analysis is the primary packaging of 100,000 ounces of soft drink. This basis was chosen because the containers of this analysis hold different volumes of soft drinks, but are all considered a single-serving. All results are expressed on the basis of this functional unit.
Using volume as the functional unit may cause confusion when considering the weight of each container system on the basis. Although the aluminum can itself weighs less than half the weight of the PET bottle with cap and label on a per unit basis, the total weight of the aluminum can system on the volume basis is only 20 percent less than the total weight of the PET bottle system. This is due to the different volumes of the container. To package 100,000 ounces of soft drink, the analysis considers the production of 8,333 aluminum cans, 12,500 glass bottles, and 5,000 PET bottles. The full report includes an addendum providing an LCI analysis of these same three container types except that each holds 12-ounces of soft drink. In this case, the basis of the analysis is 10,000 soft drink containers. At the time this analysis was proposed to PETRA, the focus was on commonly available consumer sizes of single-serving soft drinks in three types of containers. Once the results of the analysis were available, PETRA speculated about the results if all containers were the same size. The results for an analysis of three 12-ounce single-serving soft drink containers are provided in Addendum 1 in this report. All results shown in tables and figures in this Executive Summary are reported on a basis of 100,000 ounces of soft drink, not the Addendum basis of 10,000 soft drink containers. Any differences in conclusions are expressed in this Executive Summary.
The closures and labels on the soft drink containers are included in this analysis. The aluminum can includes no separate closure or label. The lacquers and inks, as well as printing process, on the containers are not included in the analysis. The glass bottle has a steel pry-off closure with no label. The foremost commonly available soft drink in a glass bottle was in the 8-ounce contour glass bottle. No plastic closures were available on glass bottles in the Kansas City marketplace. The PET bottles have polypropylene screw caps with a polypropylene label.
Executive Summary Life Cycle Inventory of Three Soft Drink Containers
CLIENTS\PETRA\KC102196.doc 08.14.09 3692.00.001.001
ES-3
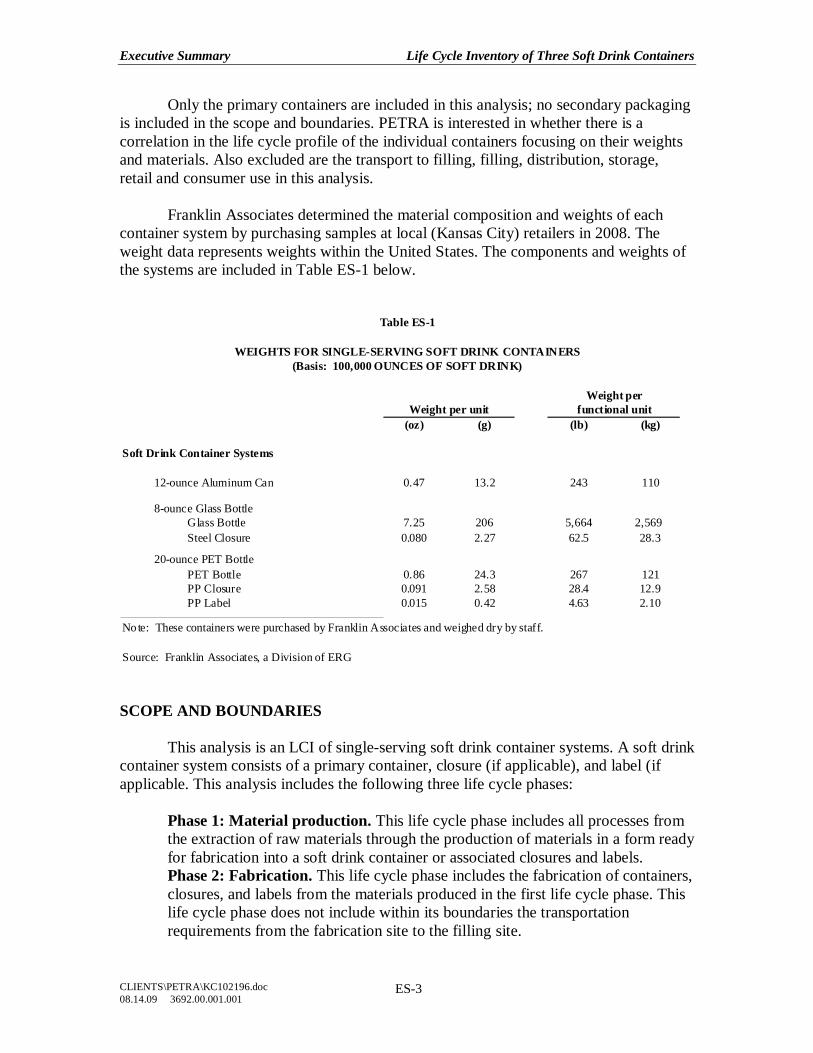
Only the primary containers are included in this analysis; no secondary packaging is included in the scope and boundaries. PETRA is interested in whether there is a correlation in the life cycle profile of the individual containers focusing on their weights and materials. Also excluded are the transport to filling, filling, distribution, storage, retail and consumer use in this analysis.
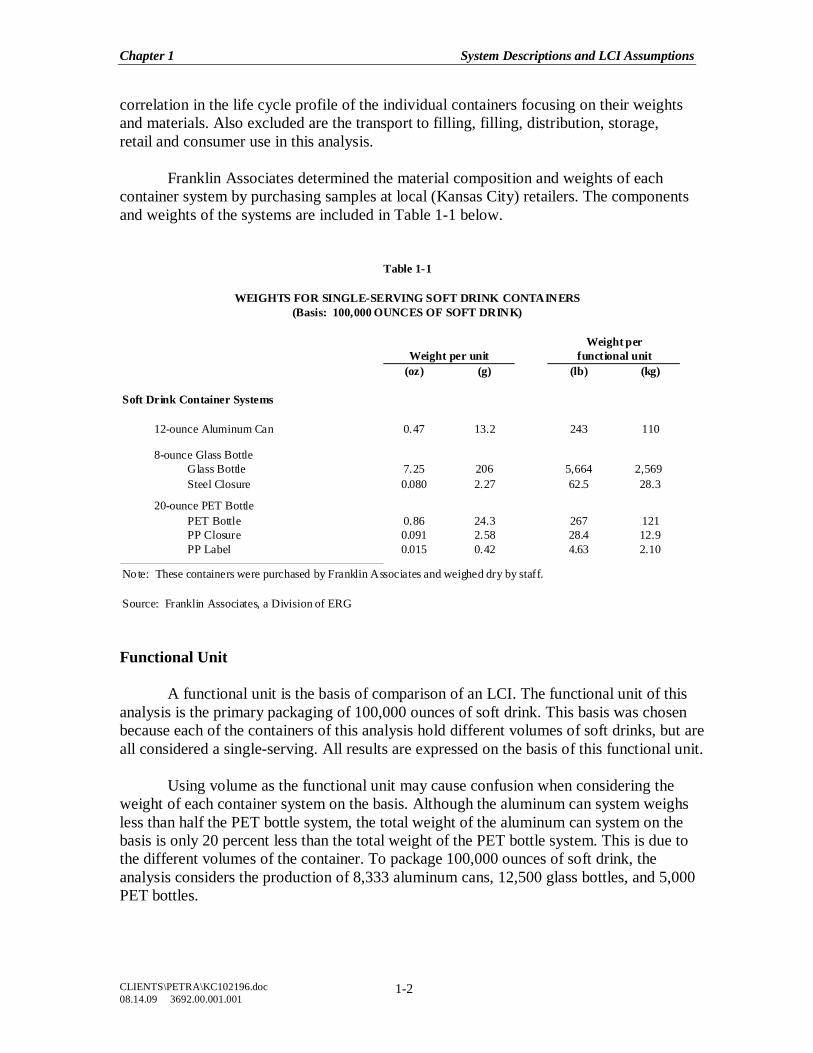
Franklin Associates determined the material composition and weights of each container system by purchasing samples at local (Kansas City) retailers in 2008. The weight data represents weights within the United States. The components and weights of the systems are included in Table ES-1 below.
Weight perfunctional unit
(oz) (g) (lb) (kg)
Soft Drink Container Systems
12-ounce Aluminum Can 0.47 13.2 243 110
8-ounce Glass BottleGlass Bottle 7.25 206 5,664 2,569Steel Closure 0.080 2.27 62.5 28.3
20-ounce PET BottlePET Bottle 0.86 24.3 267 121PP Closure 0.091 2.58 28.4 12.9PP Label 0.015 0.42 4.63 2.10
Source: Franklin Associates, a Division of ERG
Note: These containers were purchased by Franklin Associates and weighed dry by staff.
Table ES-1
WEIGHTS FOR SINGLE-SERVING SOFT DRINK CONTAINERS(Basis: 100,000 OUNCES OF SOFT DRINK)
Weight per unit
SCOPE AND BOUNDARIES
This analysis is an LCI of single-serving soft drink container systems. A soft drink container system consists of a primary container, closure (if applicable), and label (if applicable. This analysis includes the following three life cycle phases: Phase 1: Material production. This life cycle phase includes all processes from
the extraction of raw materials through the production of materials in a form ready for fabrication into a soft drink container or associated closures and labels.
Phase 2: Fabrication. This life cycle phase includes the fabrication of containers, closures, and labels from the materials produced in the first life cycle phase. This life cycle phase does not include within its boundaries the transportation requirements from the fabrication site to the filling site.
Executive Summary Life Cycle Inventory of Three Soft Drink Containers
CLIENTS\PETRA\KC102196.doc 08.14.09 3692.00.001.001
ES-4
Phase 3: Disposal and recycling. This life cycle phase includes the current U. S. recycling scenarios for the disposal of postconsumer materials. The disposal of postconsumer material includes the energy requirements for transporting materials to a landfill or waste-to-energy incinerator, the operation of heavy equipment at a landfill site, and the energy recovered by an incinerator; this analysis does not include incinerator emissions or the emissions from long-term landfill activity.
LIMITATIONS AND ASSUMPTIONS The limitations and key assumptions of this analysis are discussed in detail in Chapter 1.
Most processes for the life cycles of the container systems occur in the United States. Data for the aluminum and plastics materials are from the US LCI database (www.nrel.gov/lci). Data for the glass and steel materials are from Franklin Associates private database including private data from industry.
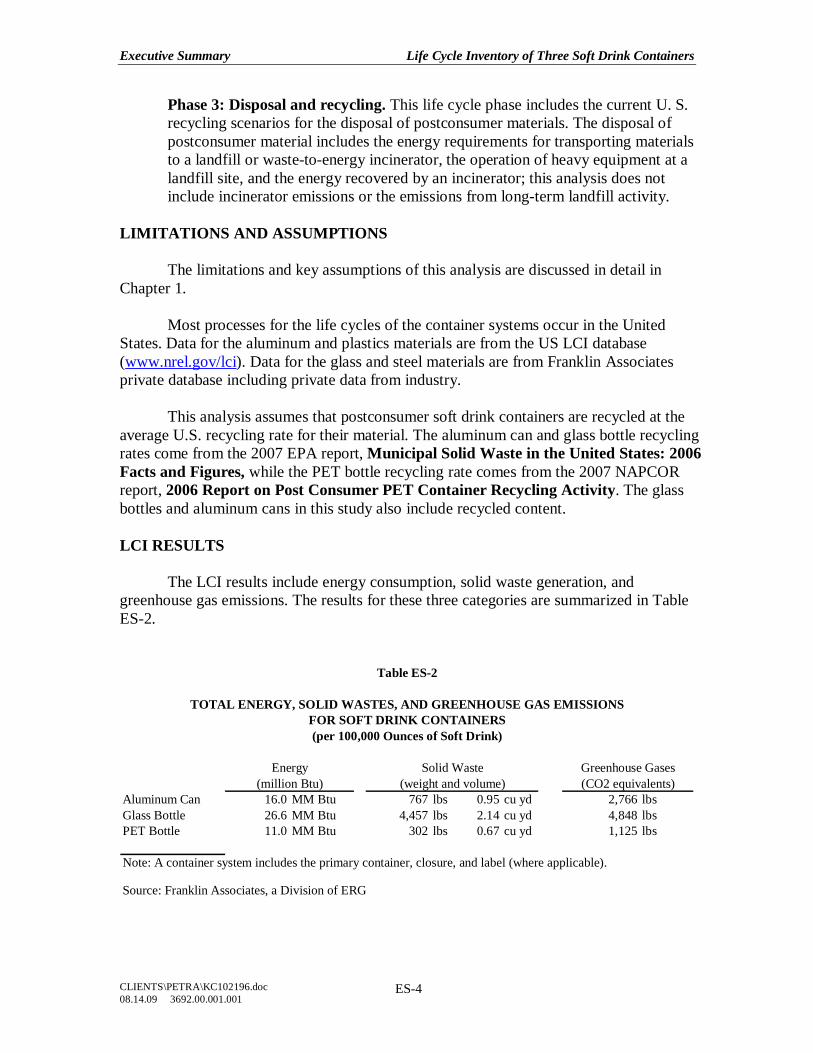
This analysis assumes that postconsumer soft drink containers are recycled at the average U.S. recycling rate for their material. The aluminum can and glass bottle recycling rates come from the 2007 EPA report, Municipal Solid Waste in the United States: 2006 Facts and Figures, while the PET bottle recycling rate comes from the 2007 NAPCOR report, 2006 Report on Post Consumer PET Container Recycling Activity. The glass bottles and aluminum cans in this study also include recycled content. LCI RESULTS The LCI results include energy consumption, solid waste generation, and greenhouse gas emissions. The results for these three categories are summarized in Table ES-2.
Aluminum Can 16.0 MM Btu 767 lbs 0.95 cu yd 2,766 lbsGlass Bottle 26.6 MM Btu 4,457 lbs 2.14 cu yd 4,848 lbsPET Bottle 11.0 MM Btu 302 lbs 0.67 cu yd 1,125 lbs
Note: A container system includes the primary container, closure, and label (where applicable).
Source: Franklin Associates, a Division of ERG
Table ES-2
FOR SOFT DRINK CONTAINERS(per 100,000 Ounces of Soft Drink)
Greenhouse Gases(CO2 equivalents)
TOTAL ENERGY, SOLID WASTES, AND GREENHOUSE GAS EMISSIONS
(million Btu)Energy Solid Waste
(weight and volume)
Executive Summary Life Cycle Inventory of Three Soft Drink Containers
CLIENTS\PETRA\KC102196.doc 08.14.09 3692.00.001.001
ES-5
In some cases, the environmental burdens of container systems are closely related to system weight. For example, the glass bottle is the heaviest system of this analysis and has the highest total energy, solid waste, and greenhouse gas emissions of this analysis. However, this correlation does not always hold true. The aluminum can is the lightest system of this analysis, but still has a higher amount of total energy, solid waste, and greenhouse gas emissions than the PET bottle system. The relatively high energy requirements of the aluminum can are due to the high amount of energy needed to smelt the aluminum and make the aluminum sheet. The LCI results for energy, solid waste, and greenhouse gas emissions are discussed in more detail in the following sections. Energy
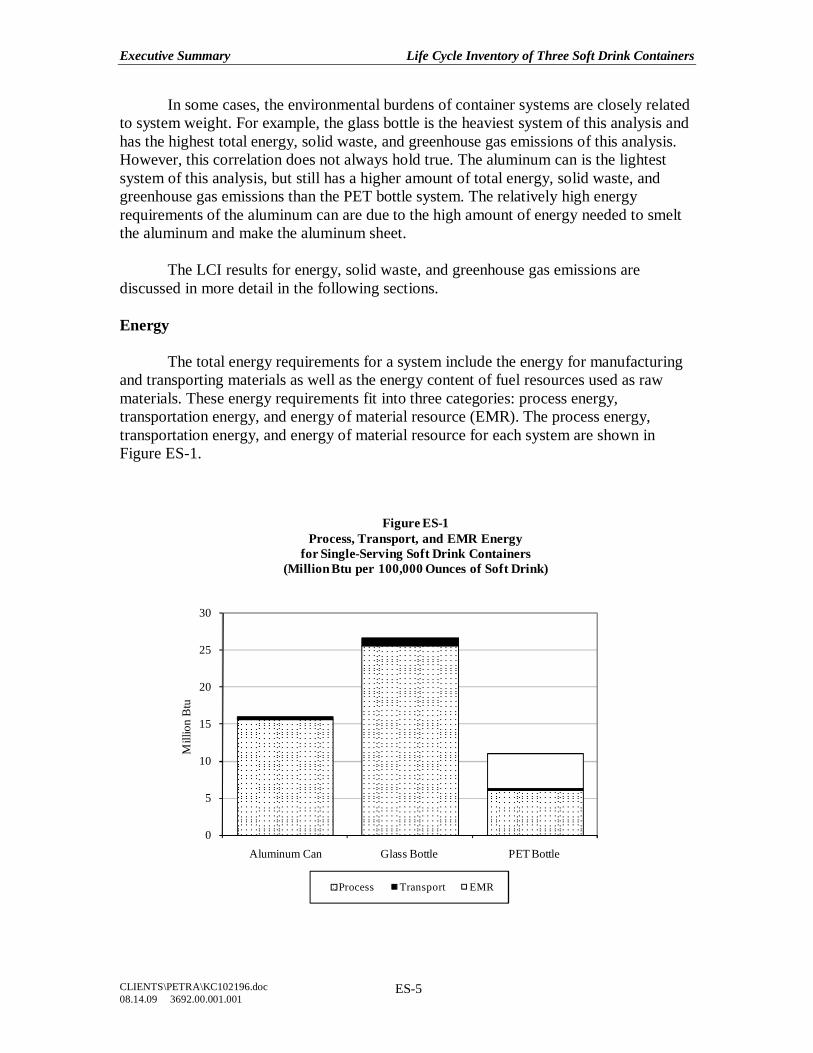
The total energy requirements for a system include the energy for manufacturing and transporting materials as well as the energy content of fuel resources used as raw materials. These energy requirements fit into three categories: process energy, transportation energy, and energy of material resource (EMR). The process energy, transportation energy, and energy of material resource for each system are shown in Figure ES-1.
0
5
10
15
20
25
30
Aluminum Can Glass Bottle PET Bottle
Mill
ion
Btu
Figure ES-1 Process, Transport, and EMR Energy
for Single-Serving Soft Drink Containers (Million Btu per 100,000 Ounces of Soft Drink)
Process Transport EMR
Executive Summary Life Cycle Inventory of Three Soft Drink Containers
CLIENTS\PETRA\KC102196.doc 08.14.09 3692.00.001.001
ES-6
Process energy includes all energy used to extract and process raw materials into usable forms, manufacture the container systems, and manage postconsumer materials. For material disposal, process energy includes diesel fuel used to run landfill equipment. Process energy accounts for the majority of energy for the aluminum can and glass bottle systems. Process energy accounts for approximately half the energy of the PET bottle system.
Transportation energy is the energy required to transport materials between each step in a life cycle. Examples of the transportation steps included in this analysis include crude oil to refineries, resin pellets to fabricators, mined bauxite to alumina producers, and soda ash to glass factories. Transportation energy results do not include transport to filling or distribution of the filled container.
Transportation comprises less than 5 percent of the total energy for all soft drink container systems. The glass system requires the highest amount of transportation energy due to its heavy weight. The aluminum cans require a higher amount of transportation energy than the PET bottles due to the longer distances the bauxite and alumina must travel to reach the United States.
Energy of material resource (EMR) is an energy category that represents the use of petroleum, natural gas, or coal for the production of materials instead of for combustion as fuels.
Only the PET and PP resin are derived from petroleum and natural gas, and thus the plastic bottle system is the only system that includes an EMR. The aluminum and glass containers and the steel cap are not derived from petroleum and natural gas and thus are given no EMR.
A partial amount of the EMR from the PET bottle system can be recovered if combustion with energy recovery is used for waste management. When the weights and heating values of the PET bottle system are factored with solid waste combustion practices in the United States, the energy recovery is 5.5 percent of total energy required to produce the system (see Table 2-3).
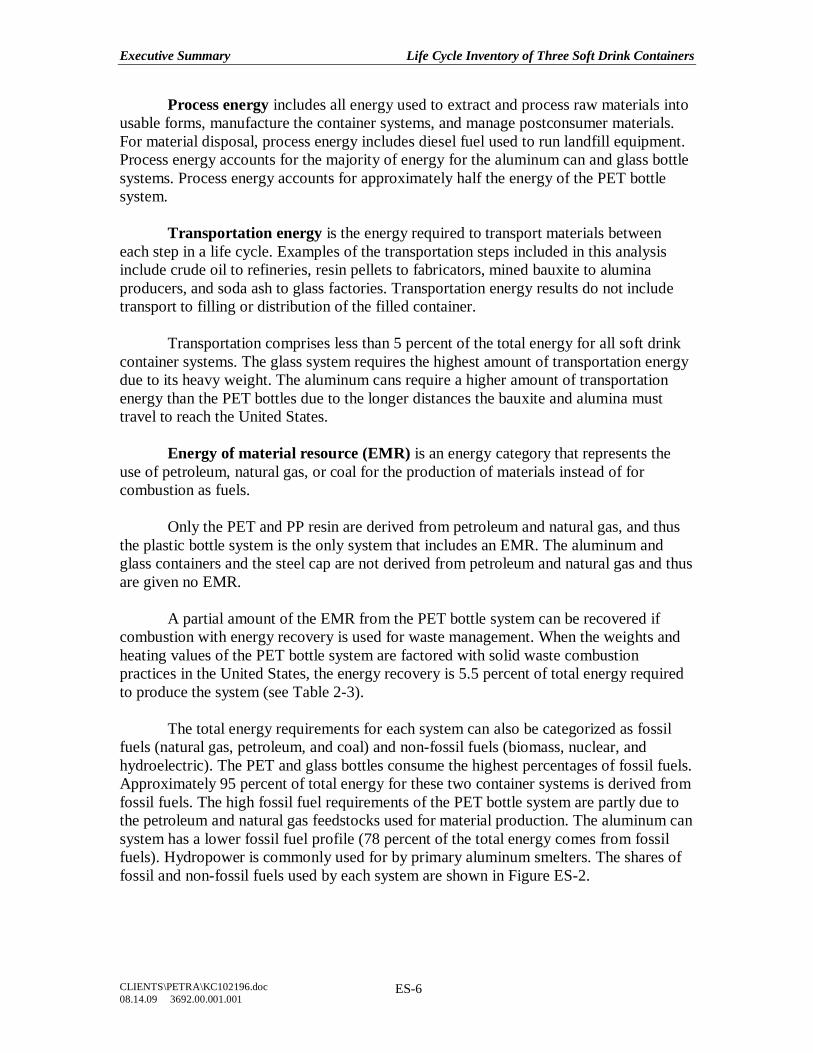
The total energy requirements for each system can also be categorized as fossil fuels (natural gas, petroleum, and coal) and non-fossil fuels (biomass, nuclear, and hydroelectric). The PET and glass bottles consume the highest percentages of fossil fuels. Approximately 95 percent of total energy for these two container systems is derived from fossil fuels. The high fossil fuel requirements of the PET bottle system are partly due to the petroleum and natural gas feedstocks used for material production. The aluminum can system has a lower fossil fuel profile (78 percent of the total energy comes from fossil fuels). Hydropower is commonly used for by primary aluminum smelters. The shares of fossil and non-fossil fuels used by each system are shown in Figure ES-2.
Executive Summary Life Cycle Inventory of Three Soft Drink Containers
CLIENTS\PETRA\KC102196.doc 08.14.09 3692.00.001.001
ES-7
0
5
10
15
20
25
30
Aluminum Can Glass Bottle PET Bottle
Mill
ion
Btu
Figure ES-2 Energy from Fossil and Non-Fossil Fuels for Single-Serving Soft Drink Containers
(Million Btu per 100,000 Ounces of Soft Drink)
Fossil Non-Fossil
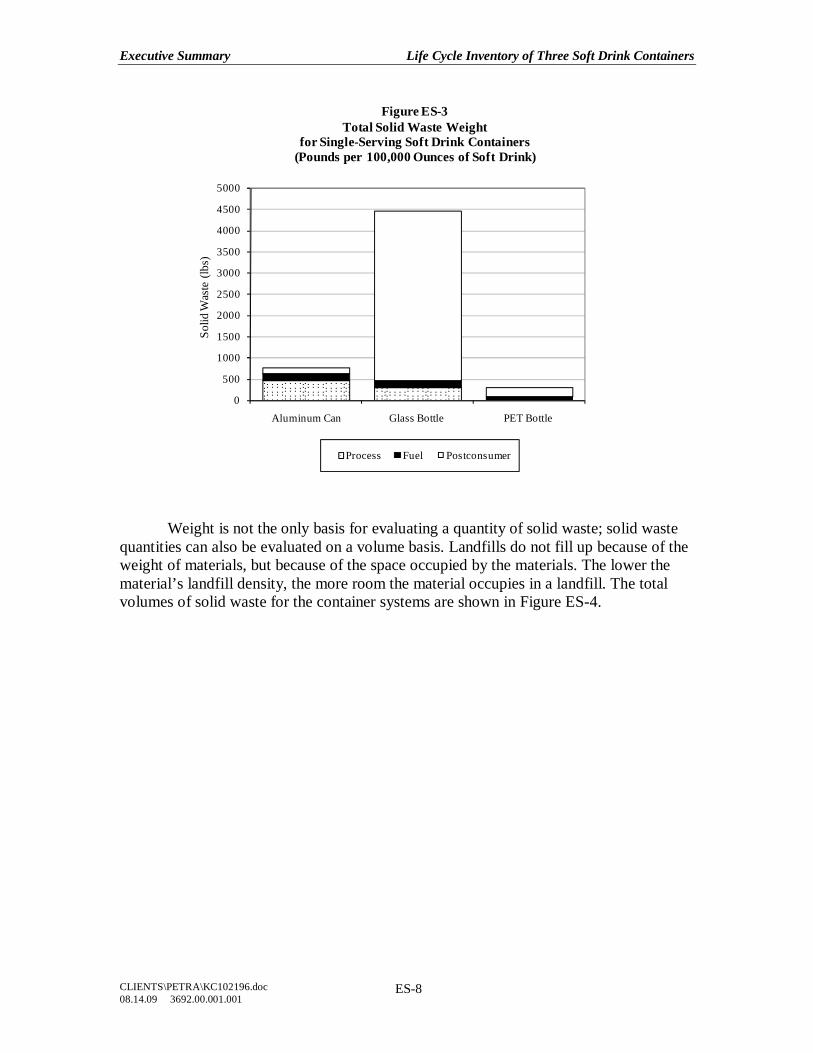
Solid Waste Solid waste is categorized into process wastes, fuel-related wastes, and postconsumer wastes. Process wastes are the solid wastes generated by the various processes throughout the life cycle of the container systems. Fuel-related wastes are the wastes from the production and combustion of fuels used for energy and transportation. Together, process wastes and fuel-related wastes are reported as industrial solid waste. Postconsumer wastes are the wastes discarded by the final users of the product.
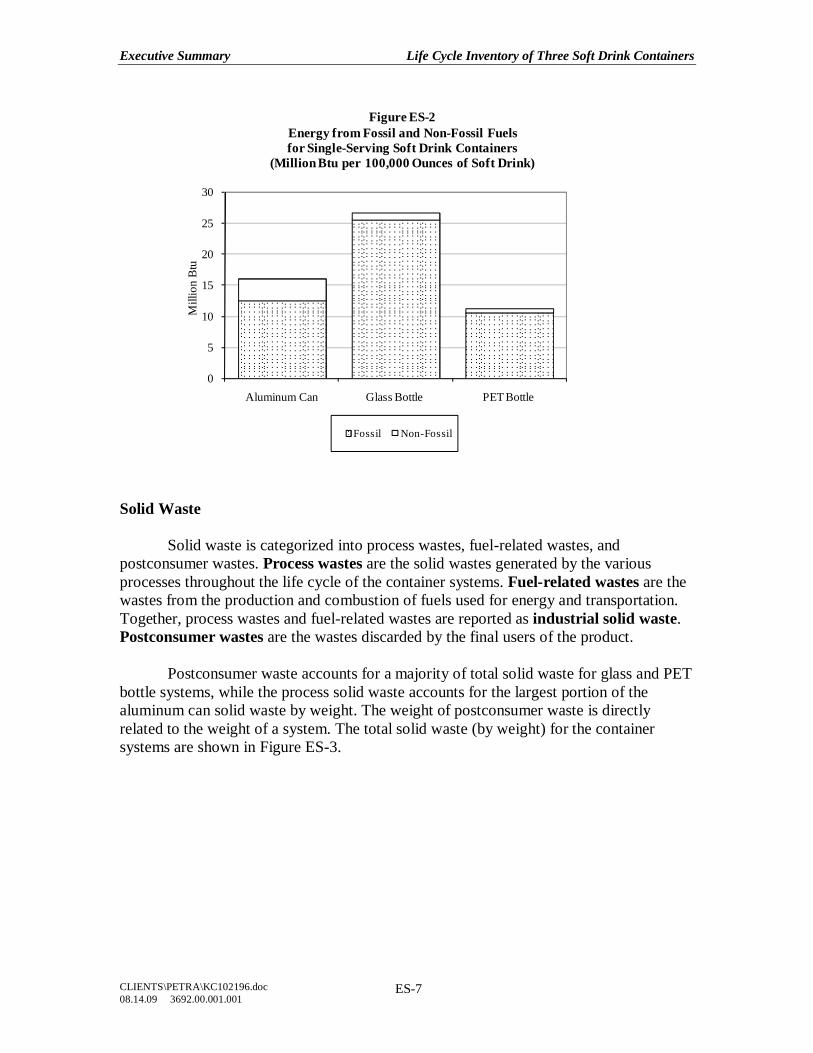
Postconsumer waste accounts for a majority of total solid waste for glass and PET bottle systems, while the process solid waste accounts for the largest portion of the aluminum can solid waste by weight. The weight of postconsumer waste is directly related to the weight of a system. The total solid waste (by weight) for the container systems are shown in Figure ES-3.
Executive Summary Life Cycle Inventory of Three Soft Drink Containers
CLIENTS\PETRA\KC102196.doc 08.14.09 3692.00.001.001
ES-8
0
500
1000
1500
2000
2500
3000
3500
4000
4500
5000
Aluminum Can Glass Bottle PET Bottle
Solid
Was
te (
lbs)
Figure ES-3 Total Solid Waste Weight
for Single-Serving Soft Drink Containers (Pounds per 100,000 Ounces of Soft Drink)
Process Fuel Postconsumer
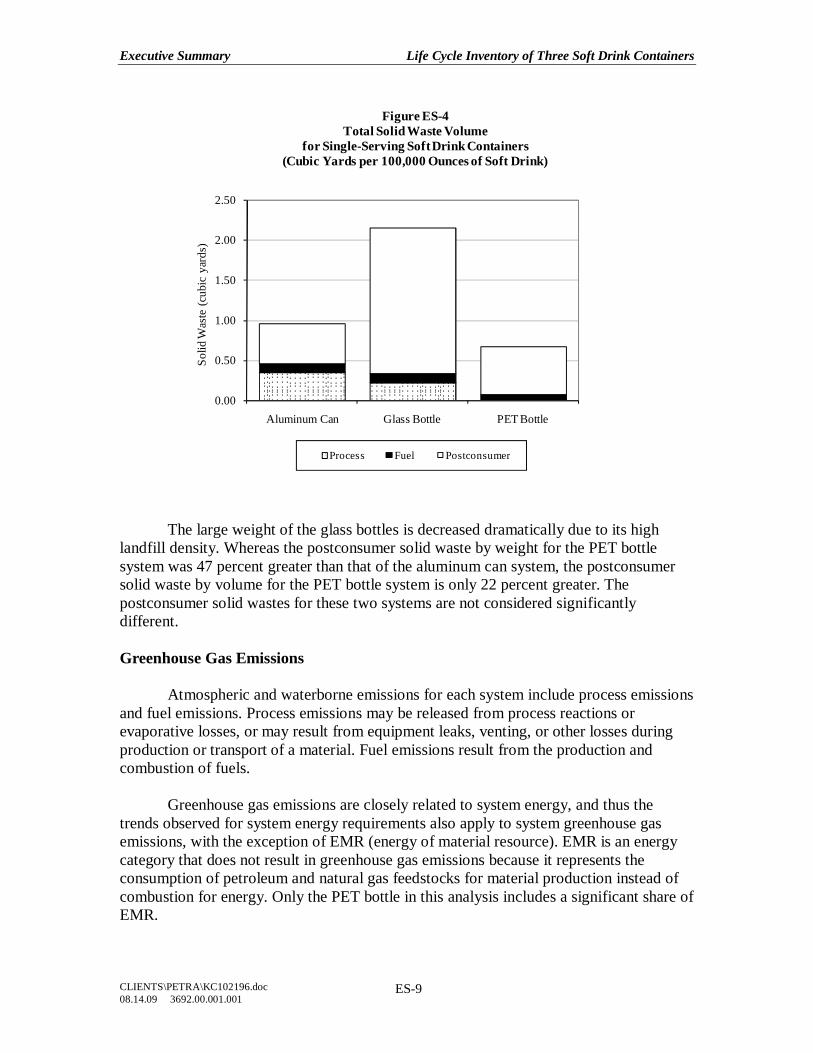
Weight is not the only basis for evaluating a quantity of solid waste; solid waste quantities can also be evaluated on a volume basis. Landfills do not fill up because of the weight of materials, but because of the space occupied by the materials. The lower the material’s landfill density, the more room the material occupies in a landfill. The total volumes of solid waste for the container systems are shown in Figure ES-4.
Executive Summary Life Cycle Inventory of Three Soft Drink Containers
CLIENTS\PETRA\KC102196.doc 08.14.09 3692.00.001.001
ES-9
0.00
0.50
1.00
1.50
2.00
2.50
Aluminum Can Glass Bottle PET Bottle
Solid
Was
te (
cubi
c ya
rds)
Figure ES-4 Total Solid Waste Volume
for Single-Serving Soft Drink Containers (Cubic Yards per 100,000 Ounces of Soft Drink)
Process Fuel Postconsumer
The large weight of the glass bottles is decreased dramatically due to its high landfill density. Whereas the postconsumer solid waste by weight for the PET bottle system was 47 percent greater than that of the aluminum can system, the postconsumer solid waste by volume for the PET bottle system is only 22 percent greater. The postconsumer solid wastes for these two systems are not considered significantly different. Greenhouse Gas Emissions Atmospheric and waterborne emissions for each system include process emissions and fuel emissions. Process emissions may be released from process reactions or evaporative losses, or may result from equipment leaks, venting, or other losses during production or transport of a material. Fuel emissions result from the production and combustion of fuels.
Greenhouse gas emissions are closely related to system energy, and thus the trends observed for system energy requirements also apply to system greenhouse gas emissions, with the exception of EMR (energy of material resource). EMR is an energy category that does not result in greenhouse gas emissions because it represents the consumption of petroleum and natural gas feedstocks for material production instead of combustion for energy. Only the PET bottle in this analysis includes a significant share of EMR.
Executive Summary Life Cycle Inventory of Three Soft Drink Containers
CLIENTS\PETRA\KC102196.doc 08.14.09 3692.00.001.001
ES-10
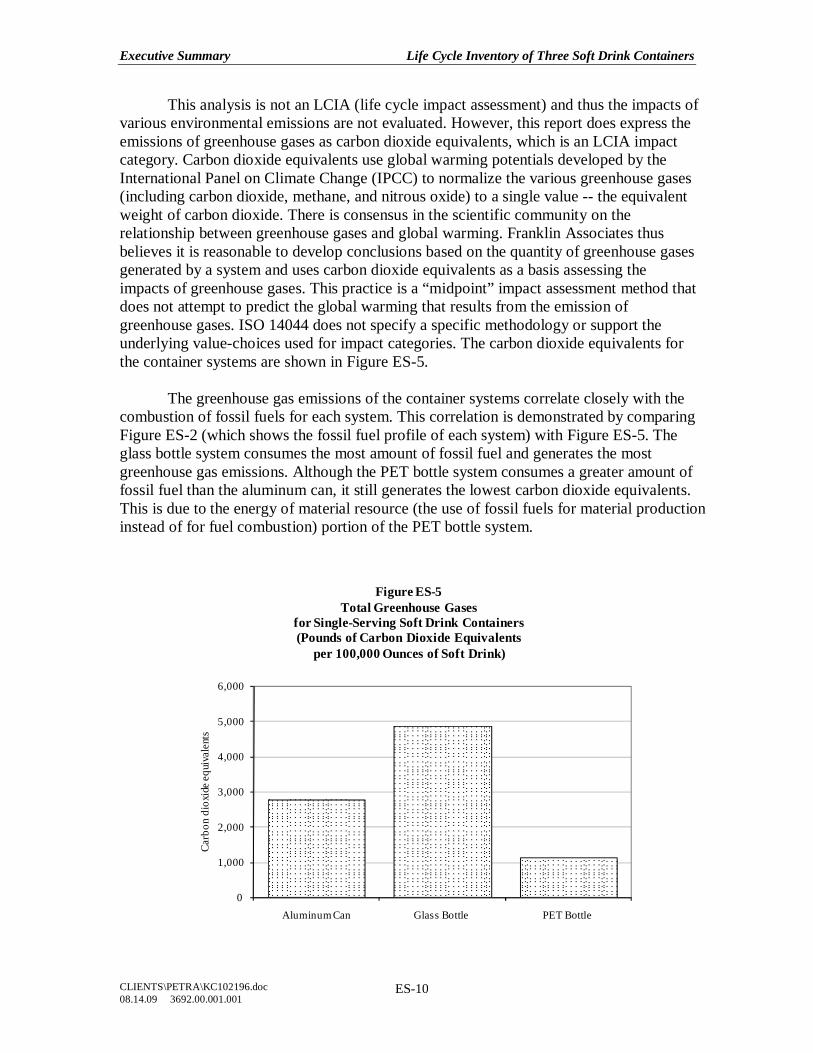
This analysis is not an LCIA (life cycle impact assessment) and thus the impacts of various environmental emissions are not evaluated. However, this report does express the emissions of greenhouse gases as carbon dioxide equivalents, which is an LCIA impact category. Carbon dioxide equivalents use global warming potentials developed by the International Panel on Climate Change (IPCC) to normalize the various greenhouse gases (including carbon dioxide, methane, and nitrous oxide) to a single value -- the equivalent weight of carbon dioxide. There is consensus in the scientific community on the relationship between greenhouse gases and global warming. Franklin Associates thus believes it is reasonable to develop conclusions based on the quantity of greenhouse gases generated by a system and uses carbon dioxide equivalents as a basis assessing the impacts of greenhouse gases. This practice is a “midpoint” impact assessment method that does not attempt to predict the global warming that results from the emission of greenhouse gases. ISO 14044 does not specify a specific methodology or support the underlying value-choices used for impact categories. The carbon dioxide equivalents for the container systems are shown in Figure ES-5. The greenhouse gas emissions of the container systems correlate closely with the combustion of fossil fuels for each system. This correlation is demonstrated by comparing Figure ES-2 (which shows the fossil fuel profile of each system) with Figure ES-5. The glass bottle system consumes the most amount of fossil fuel and generates the most greenhouse gas emissions. Although the PET bottle system consumes a greater amount of fossil fuel than the aluminum can, it still generates the lowest carbon dioxide equivalents. This is due to the energy of material resource (the use of fossil fuels for material production instead of for fuel combustion) portion of the PET bottle system.
0
1,000
2,000
3,000
4,000
5,000
6,000
Aluminum Can Glass Bottle PET Bottle
Carb
on d
ioxi
de eq
uiva
lent
s
Figure ES-5 Total Greenhouse Gases
for Single-Serving Soft Drink Containers (Pounds of Carbon Dioxide Equivalents
per 100,000 Ounces of Soft Drink)
Executive Summary Life Cycle Inventory of Three Soft Drink Containers
CLIENTS\PETRA\KC102196.doc 08.14.09 3692.00.001.001
ES-11
LCI CONCLUSIONS
Franklin Associates’ policy is to consider product system totals for energy and weight of postconsumer solid waste weight to be different if there is at least a 10% difference in the totals. Otherwise, the difference is considered to be insignificant. For the air and waterborne emissions (including greenhouse gases), industrial solid waste, and postconsumer solid waste volume, the 25% rule should be applied. A detailed discussion of these ranges is provided in Appendix B of this report. This LCI determined the energy consumption, solid waste generation, and greenhouse gas emissions associated with three types of containers used for soft drinks. The conclusions of the LCI are as follows:
• There is a correlation between system weight and environmental burdens in the case of the glass system, which is the heaviest. This system requires the most energy and produces the most solid waste and greenhouse gases. However, this correlation does not hold up for the aluminum can, which is the lightest, but still requires more energy and produces more solid waste and greenhouse gases than the PET bottle.
• The majority of total energy for all systems occurs during the first two life cycle phases (cradle-to material and container fabrication).
• Although the aluminum can system is the lightest, the amount of energy required for smelting and sheet production offsets its weight advantage, and so the PET bottle system requires the lowest total energy.
• The aluminum can system has a lower fossil fuel profile (78 percent of the total energy comes from fossil fuels). Hydropower is commonly used for by primary aluminum smelters.
• The percentage of fossil fuel consumption is higher for the PET bottle system because plastics production uses petroleum and natural gas as raw materials.
• The glass produces the highest amount of total solid waste by both weight and volume; while the PET produces the lowest amount of total solid waste by both weight and volume.
• Even including the recycled content in the aluminum and glass systems, the weight of postconsumer waste is directly related to the weight of a container system.
• The conclusions for postconsumer solid waste are different when expressed on a volume basis instead of a weight basis. The large weight of the glass bottles is decreased dramatically due to its high landfill density, but still uses the greatest amount of landfill space. However, due to the landfill densities of the aluminum and PET, the postconsumer solid waste for the aluminum and PET systems are not considered significantly different by volume.
Executive Summary Life Cycle Inventory of Three Soft Drink Containers
CLIENTS\PETRA\KC102196.doc 08.14.09 3692.00.001.001
ES-12
• Greenhouse gas emissions are closely related to fossil fuel combustion and thus the LCI conclusions for energy also apply to greenhouse gas emissions.

Chapter 1 System Descriptions and LCI Assumptions
CLIENTS\PETRA\KC102196.doc 08.14.09 3692.00.001.001
1-1
CHAPTER 1 SYSTEM DESCRIPTIONS AND LCI ASSUMPTIONS
INTRODUCTION
An LCI (life cycle inventory) quantifies the resource use (energy and material consumption) and environmental emissions associated with the life cycles of specific products. The purpose of this study is to use LCI to evaluate the energy and material use, solid wastes, and atmospheric and waterborne emissions associated with common containers used for single-serving soft drinks.
The purpose of this study is to compare the life cycle burdens of single-serving containers used for soft drinks. PETRA will use the results of this study to evaluate the environmental footprint of the PET bottle and alternative containers. It is possible that PETRA will also use the results of this study as a defense against any broad untrue statements made by producers, trade organizations or environmental groups affiliated with the alternative soft drink containers.
The member companies of PETRA are the key audience of this LCI. However, it is possible that PETRA will share the results of this LCI with media outlets or members of the public with specific questions about the environmental profile of soft drink containers. Franklin Associates advises PETRA to consider a peer review for this report if they decide to make the report publicly available. Systems Studied
This LCI evaluates three common non-refillable container systems used for soft drinks:
1. 12-ounce aluminum can 2. 8-ounce glass bottle 3. 20-ounce PET bottle
Water bottles are not included in this study.
The closures and labels used by the containers are included in this analysis. The aluminum can includes no separate closure or label. The lacquers and inks, as well as printing process, on the containers are not included in the analysis. The glass bottle has a steel pry-off closure with no label. The foremost commonly available soft drink in a glass bottle was in the 8-ounce contour glass bottle. No plastic closures were available on glass bottles in the Kansas City marketplace. The PET bottles have polypropylene screw caps with a polypropylene label.
Only the primary containers are included in this analysis; no secondary packaging is included in the scope and boundaries. PETRA is interested in whether there is a
Chapter 1 System Descriptions and LCI Assumptions
CLIENTS\PETRA\KC102196.doc 08.14.09 3692.00.001.001
1-2
correlation in the life cycle profile of the individual containers focusing on their weights and materials. Also excluded are the transport to filling, filling, distribution, storage, retail and consumer use in this analysis.
Franklin Associates determined the material composition and weights of each container system by purchasing samples at local (Kansas City) retailers. The components and weights of the systems are included in Table 1-1 below.
Weight perfunctional unit
(oz) (g) (lb) (kg)
Soft Drink Container Systems
12-ounce Aluminum Can 0.47 13.2 243 110
8-ounce Glass BottleGlass Bottle 7.25 206 5,664 2,569Steel Closure 0.080 2.27 62.5 28.3
20-ounce PET BottlePET Bottle 0.86 24.3 267 121PP Closure 0.091 2.58 28.4 12.9PP Label 0.015 0.42 4.63 2.10
Source: Franklin Associates, a Division of ERG
Note: These containers were purchased by Franklin Associates and weighed dry by staff.
Table 1-1
WEIGHTS FOR SINGLE-SERVING SOFT DRINK CONTAINERS(Basis: 100,000 OUNCES OF SOFT DRINK)
Weight per unit
Functional Unit
A functional unit is the basis of comparison of an LCI. The functional unit of this analysis is the primary packaging of 100,000 ounces of soft drink. This basis was chosen because each of the containers of this analysis hold different volumes of soft drinks, but are all considered a single-serving. All results are expressed on the basis of this functional unit.
Using volume as the functional unit may cause confusion when considering the weight of each container system on the basis. Although the aluminum can system weighs less than half the PET bottle system, the total weight of the aluminum can system on the basis is only 20 percent less than the total weight of the PET bottle system. This is due to the different volumes of the container. To package 100,000 ounces of soft drink, the analysis considers the production of 8,333 aluminum cans, 12,500 glass bottles, and 5,000 PET bottles.
Chapter 1 System Descriptions and LCI Assumptions
CLIENTS\PETRA\KC102196.doc 08.14.09 3692.00.001.001
1-3
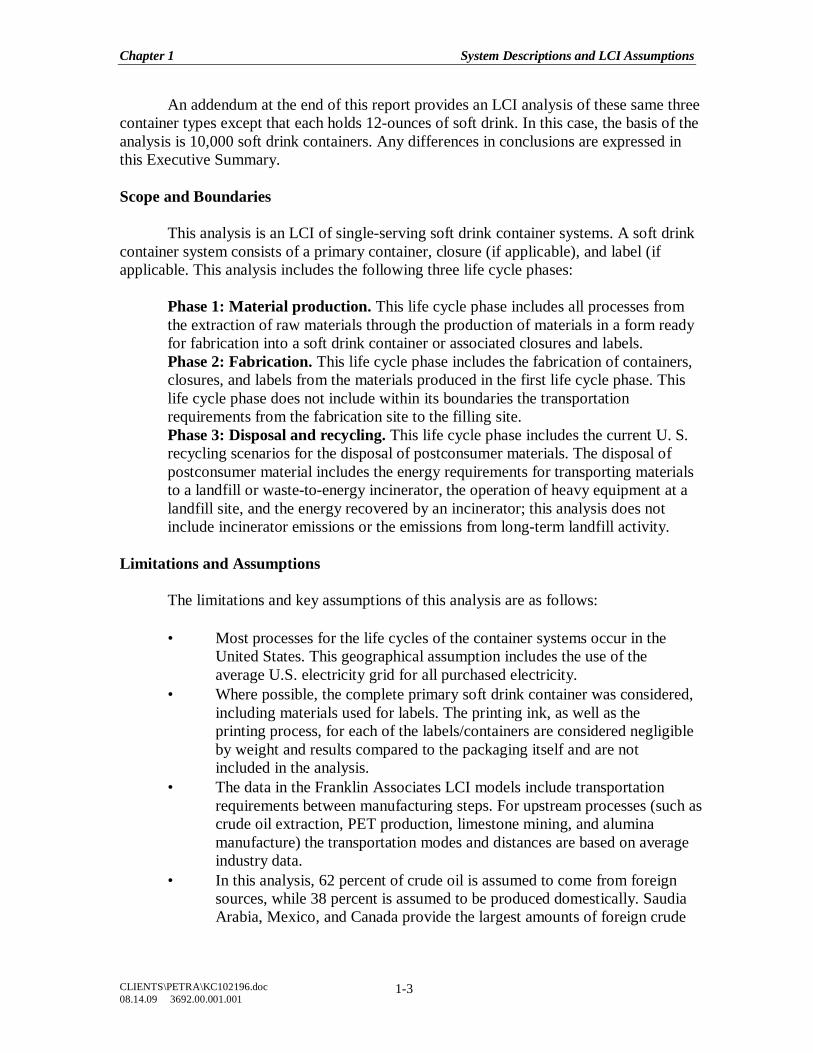
An addendum at the end of this report provides an LCI analysis of these same three container types except that each holds 12-ounces of soft drink. In this case, the basis of the analysis is 10,000 soft drink containers. Any differences in conclusions are expressed in this Executive Summary. Scope and Boundaries
This analysis is an LCI of single-serving soft drink container systems. A soft drink container system consists of a primary container, closure (if applicable), and label (if applicable. This analysis includes the following three life cycle phases: Phase 1: Material production. This life cycle phase includes all processes from
the extraction of raw materials through the production of materials in a form ready for fabrication into a soft drink container or associated closures and labels.
Phase 2: Fabrication. This life cycle phase includes the fabrication of containers, closures, and labels from the materials produced in the first life cycle phase. This life cycle phase does not include within its boundaries the transportation requirements from the fabrication site to the filling site.
Phase 3: Disposal and recycling. This life cycle phase includes the current U. S. recycling scenarios for the disposal of postconsumer materials. The disposal of postconsumer material includes the energy requirements for transporting materials to a landfill or waste-to-energy incinerator, the operation of heavy equipment at a landfill site, and the energy recovered by an incinerator; this analysis does not include incinerator emissions or the emissions from long-term landfill activity.
Limitations and Assumptions The limitations and key assumptions of this analysis are as follows:
• Most processes for the life cycles of the container systems occur in the United States. This geographical assumption includes the use of the average U.S. electricity grid for all purchased electricity.
• Where possible, the complete primary soft drink container was considered, including materials used for labels. The printing ink, as well as the printing process, for each of the labels/containers are considered negligible by weight and results compared to the packaging itself and are not included in the analysis.
• The data in the Franklin Associates LCI models include transportation requirements between manufacturing steps. For upstream processes (such as crude oil extraction, PET production, limestone mining, and alumina manufacture) the transportation modes and distances are based on average industry data.
• In this analysis, 62 percent of crude oil is assumed to come from foreign sources, while 38 percent is assumed to be produced domestically. Saudia Arabia, Mexico, and Canada provide the largest amounts of foreign crude
Chapter 1 System Descriptions and LCI Assumptions
CLIENTS\PETRA\KC102196.doc 08.14.09 3692.00.001.001
1-4
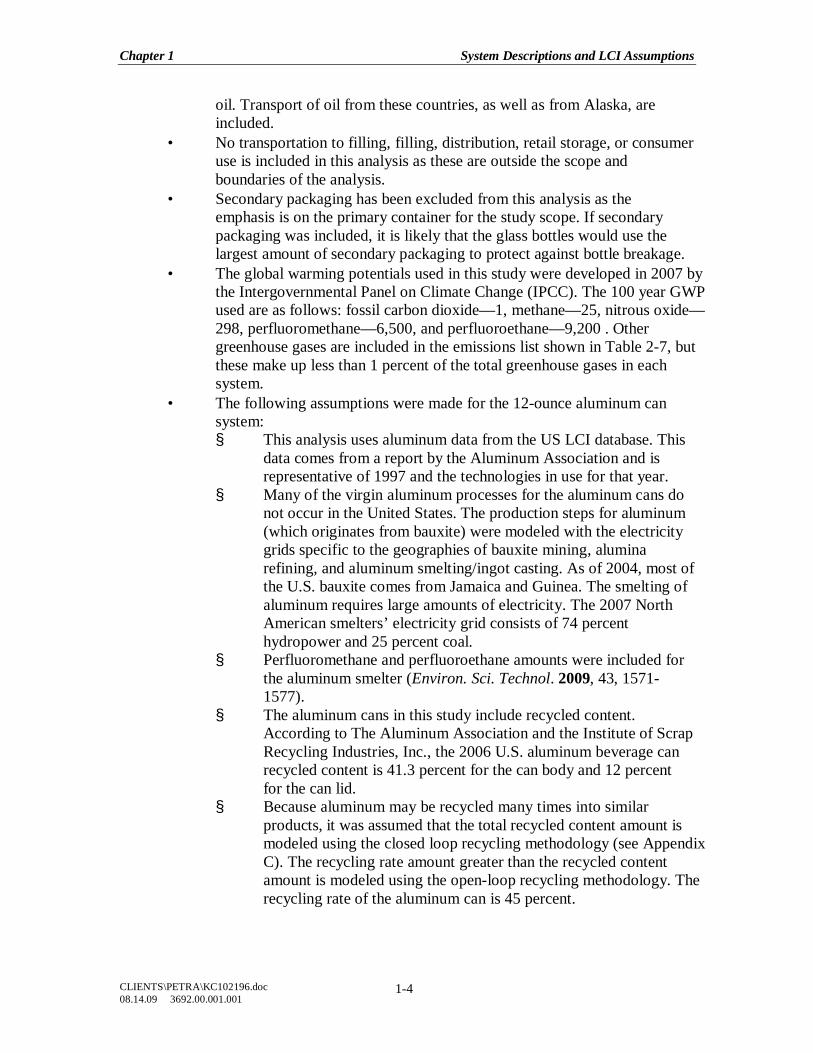
oil. Transport of oil from these countries, as well as from Alaska, are included.
• No transportation to filling, filling, distribution, retail storage, or consumer use is included in this analysis as these are outside the scope and boundaries of the analysis.
• Secondary packaging has been excluded from this analysis as the emphasis is on the primary container for the study scope. If secondary packaging was included, it is likely that the glass bottles would use the largest amount of secondary packaging to protect against bottle breakage.
• The global warming potentials used in this study were developed in 2007 by the Intergovernmental Panel on Climate Change (IPCC). The 100 year GWP used are as follows: fossil carbon dioxide—1, methane—25, nitrous oxide—298, perfluoromethane—6,500, and perfluoroethane—9,200 . Other greenhouse gases are included in the emissions list shown in Table 2-7, but these make up less than 1 percent of the total greenhouse gases in each system.
• The following assumptions were made for the 12-ounce aluminum can system: § This analysis uses aluminum data from the US LCI database. This
data comes from a report by the Aluminum Association and is representative of 1997 and the technologies in use for that year.
§ Many of the virgin aluminum processes for the aluminum cans do not occur in the United States. The production steps for aluminum (which originates from bauxite) were modeled with the electricity grids specific to the geographies of bauxite mining, alumina refining, and aluminum smelting/ingot casting. As of 2004, most of the U.S. bauxite comes from Jamaica and Guinea. The smelting of aluminum requires large amounts of electricity. The 2007 North American smelters’ electricity grid consists of 74 percent hydropower and 25 percent coal.
§ Perfluoromethane and perfluoroethane amounts were included for the aluminum smelter (Environ. Sci. Technol. 2009, 43, 1571-1577).
§ The aluminum cans in this study include recycled content. According to The Aluminum Association and the Institute of Scrap Recycling Industries, Inc., the 2006 U.S. aluminum beverage can recycled content is 41.3 percent for the can body and 12 percent for the can lid.
§ Because aluminum may be recycled many times into similar products, it was assumed that the total recycled content amount is modeled using the closed loop recycling methodology (see Appendix C). The recycling rate amount greater than the recycled content amount is modeled using the open-loop recycling methodology. The recycling rate of the aluminum can is 45 percent.
Chapter 1 System Descriptions and LCI Assumptions
CLIENTS\PETRA\KC102196.doc 08.14.09 3692.00.001.001
1-5
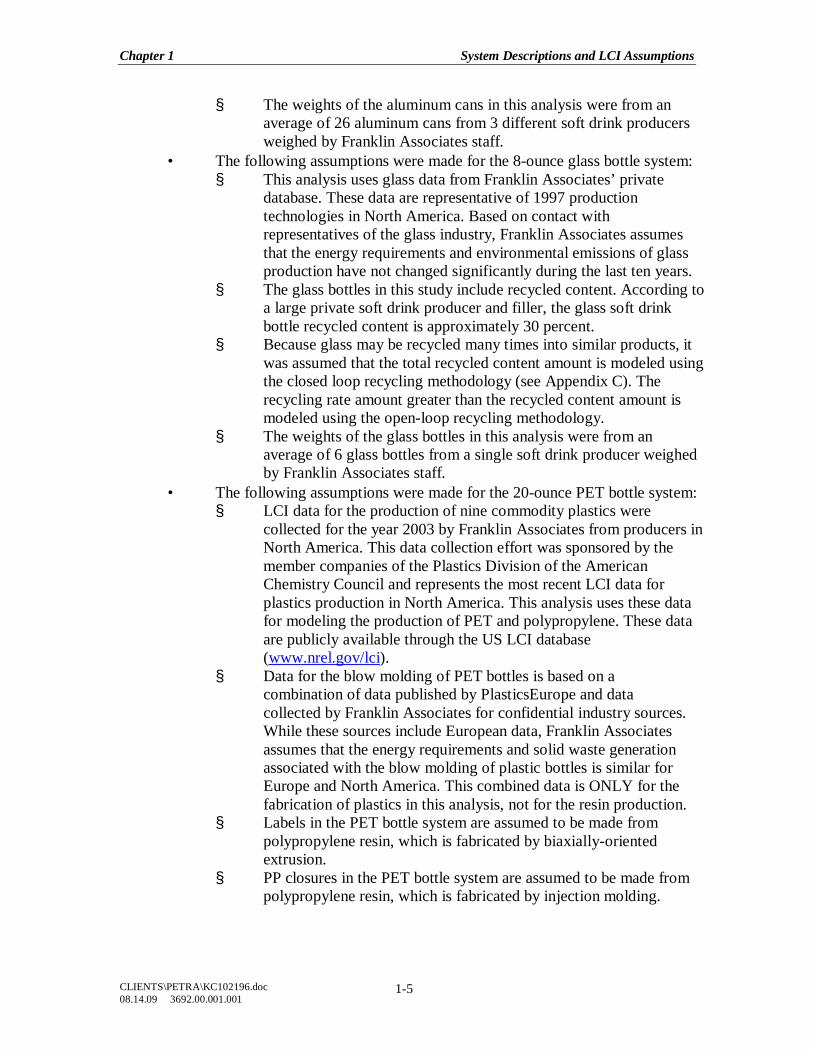
§ The weights of the aluminum cans in this analysis were from an average of 26 aluminum cans from 3 different soft drink producers weighed by Franklin Associates staff.
• The following assumptions were made for the 8-ounce glass bottle system: § This analysis uses glass data from Franklin Associates’ private
database. These data are representative of 1997 production technologies in North America. Based on contact with representatives of the glass industry, Franklin Associates assumes that the energy requirements and environmental emissions of glass production have not changed significantly during the last ten years.
§ The glass bottles in this study include recycled content. According to a large private soft drink producer and filler, the glass soft drink bottle recycled content is approximately 30 percent.
§ Because glass may be recycled many times into similar products, it was assumed that the total recycled content amount is modeled using the closed loop recycling methodology (see Appendix C). The recycling rate amount greater than the recycled content amount is modeled using the open-loop recycling methodology.
§ The weights of the glass bottles in this analysis were from an average of 6 glass bottles from a single soft drink producer weighed by Franklin Associates staff.
• The following assumptions were made for the 20-ounce PET bottle system: § LCI data for the production of nine commodity plastics were
collected for the year 2003 by Franklin Associates from producers in North America. This data collection effort was sponsored by the member companies of the Plastics Division of the American Chemistry Council and represents the most recent LCI data for plastics production in North America. This analysis uses these data for modeling the production of PET and polypropylene. These data are publicly available through the US LCI database (www.nrel.gov/lci).
§ Data for the blow molding of PET bottles is based on a combination of data published by PlasticsEurope and data collected by Franklin Associates for confidential industry sources. While these sources include European data, Franklin Associates assumes that the energy requirements and solid waste generation associated with the blow molding of plastic bottles is similar for Europe and North America. This combined data is ONLY for the fabrication of plastics in this analysis, not for the resin production.
§ Labels in the PET bottle system are assumed to be made from polypropylene resin, which is fabricated by biaxially-oriented extrusion.
§ PP closures in the PET bottle system are assumed to be made from polypropylene resin, which is fabricated by injection molding.
Chapter 1 System Descriptions and LCI Assumptions
CLIENTS\PETRA\KC102196.doc 08.14.09 3692.00.001.001
1-6
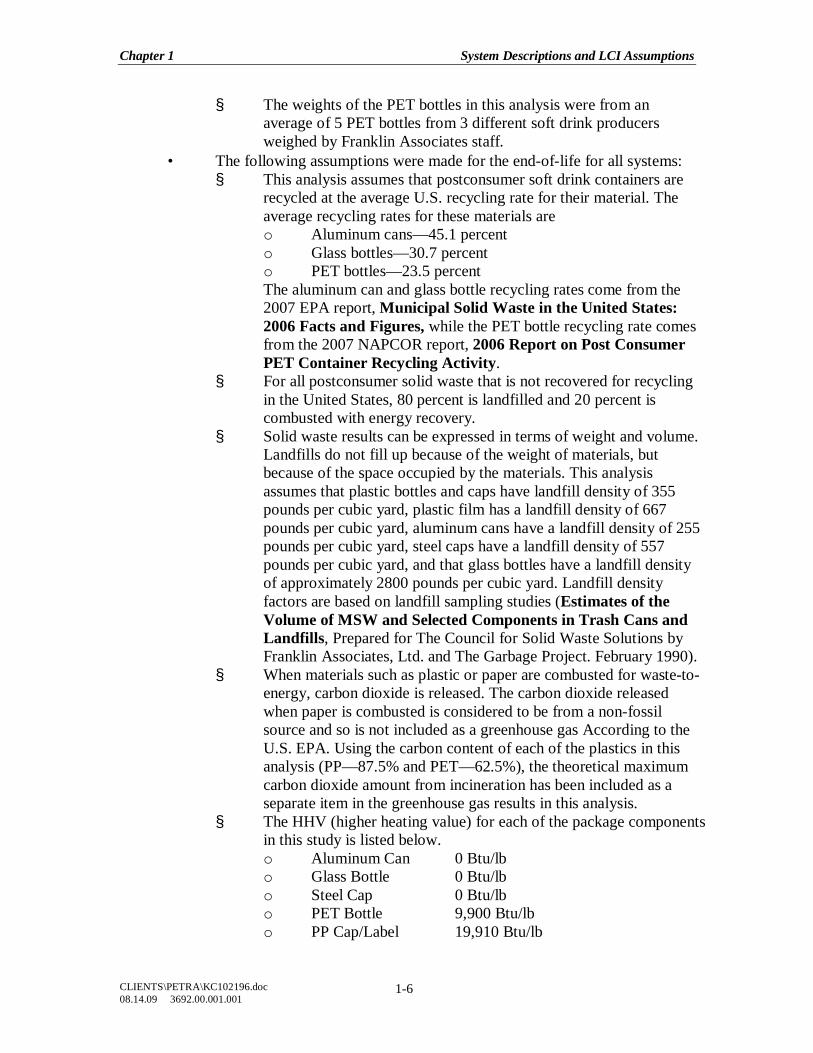
§ The weights of the PET bottles in this analysis were from an average of 5 PET bottles from 3 different soft drink producers weighed by Franklin Associates staff.
• The following assumptions were made for the end-of-life for all systems: § This analysis assumes that postconsumer soft drink containers are
recycled at the average U.S. recycling rate for their material. The average recycling rates for these materials are o Aluminum cans—45.1 percent o Glass bottles—30.7 percent o PET bottles—23.5 percent The aluminum can and glass bottle recycling rates come from the 2007 EPA report, Municipal Solid Waste in the United States: 2006 Facts and Figures, while the PET bottle recycling rate comes from the 2007 NAPCOR report, 2006 Report on Post Consumer PET Container Recycling Activity.
§ For all postconsumer solid waste that is not recovered for recycling in the United States, 80 percent is landfilled and 20 percent is combusted with energy recovery.
§ Solid waste results can be expressed in terms of weight and volume. Landfills do not fill up because of the weight of materials, but because of the space occupied by the materials. This analysis assumes that plastic bottles and caps have landfill density of 355 pounds per cubic yard, plastic film has a landfill density of 667 pounds per cubic yard, aluminum cans have a landfill density of 255 pounds per cubic yard, steel caps have a landfill density of 557 pounds per cubic yard, and that glass bottles have a landfill density of approximately 2800 pounds per cubic yard. Landfill density factors are based on landfill sampling studies (Estimates of the Volume of MSW and Selected Components in Trash Cans and Landfills, Prepared for The Council for Solid Waste Solutions by Franklin Associates, Ltd. and The Garbage Project. February 1990).
§ When materials such as plastic or paper are combusted for waste-to-energy, carbon dioxide is released. The carbon dioxide released when paper is combusted is considered to be from a non-fossil source and so is not included as a greenhouse gas According to the U.S. EPA. Using the carbon content of each of the plastics in this analysis (PP—87.5% and PET—62.5%), the theoretical maximum carbon dioxide amount from incineration has been included as a separate item in the greenhouse gas results in this analysis.
§ The HHV (higher heating value) for each of the package components in this study is listed below. o Aluminum Can 0 Btu/lb o Glass Bottle 0 Btu/lb o Steel Cap 0 Btu/lb o PET Bottle 9,900 Btu/lb o PP Cap/Label 19,910 Btu/lb
Chapter2 LCI Results and Conclusions for Single-Serving Soft Drink Container Systems
CLIENTS\PETRA\KC102196.doc 08.14.09 3692.00.001.001
2-1
CHAPTER 2 LCI RESULTS AND CONCLUSIONS FOR
SINGLE-SERVING SOFT DRINK CONTAINER SYSTEMS INTRODUCTION
An LCI (life cycle inventory) quantifies the resource use (energy and material consumption) and environmental emissions associated with the life cycles of specific products. The purpose of this study is to use LCI to evaluate the energy and material use, solid wastes, and atmospheric and waterborne emissions associated with common containers used for soft drinks. Three types of containers were modeled, including a PET bottle, an aluminum can, and a glass bottle. As discussed in Chapter 1, the functional unit of this study is the primary packaging of 100,000 ounces of soft drink due to the differing volumes of the single-serving containers, and thus all results in this chapter are expressed on this basis.
Franklin Associates’ policy is to consider product system totals for energy and weight of postconsumer solid waste weight to be different if there is at least a 10% difference in the totals. Otherwise, the difference is considered to be insignificant. For the air and waterborne emissions (including greenhouse gases), industrial solid waste, and postconsumer solid waste volume, the 25% rule should be applied. A detailed discussion of these ranges is provided in Appendix B of this report. The following sections discuss the categories of energy consumption, solid waste generation, and environmental emissions in detail. ENERGY
The total energy requirements for each system include the energy for manufacturing and transporting materials at each life cycle phase, as well as the energy content of fuel resources used as raw materials. In some cases, the environmental burdens of container systems are closely related to system weight. For example, the glass bottle is the heaviest system of this analysis and has the highest total energy of this analysis. However, this correlation does not always hold true. The aluminum can is the lightest system of this analysis, but still has a higher amount of total energy than the PET bottle system. The relatively high energy requirements of the aluminum can are due to the high amount of energy needed to smelt the aluminum and make the aluminum sheet.
Three energy categories are defined in this study: process energy, transport energy, and energy of material resource. Table 2-1 shows the LCI results according to these three energy categories.
Chapter2 LCI Results and Conclusions for Single-Serving Soft Drink Container Systems
CLIENTS\PETRA\KC102196.doc 08.14.09 3692.00.001.001
2-2
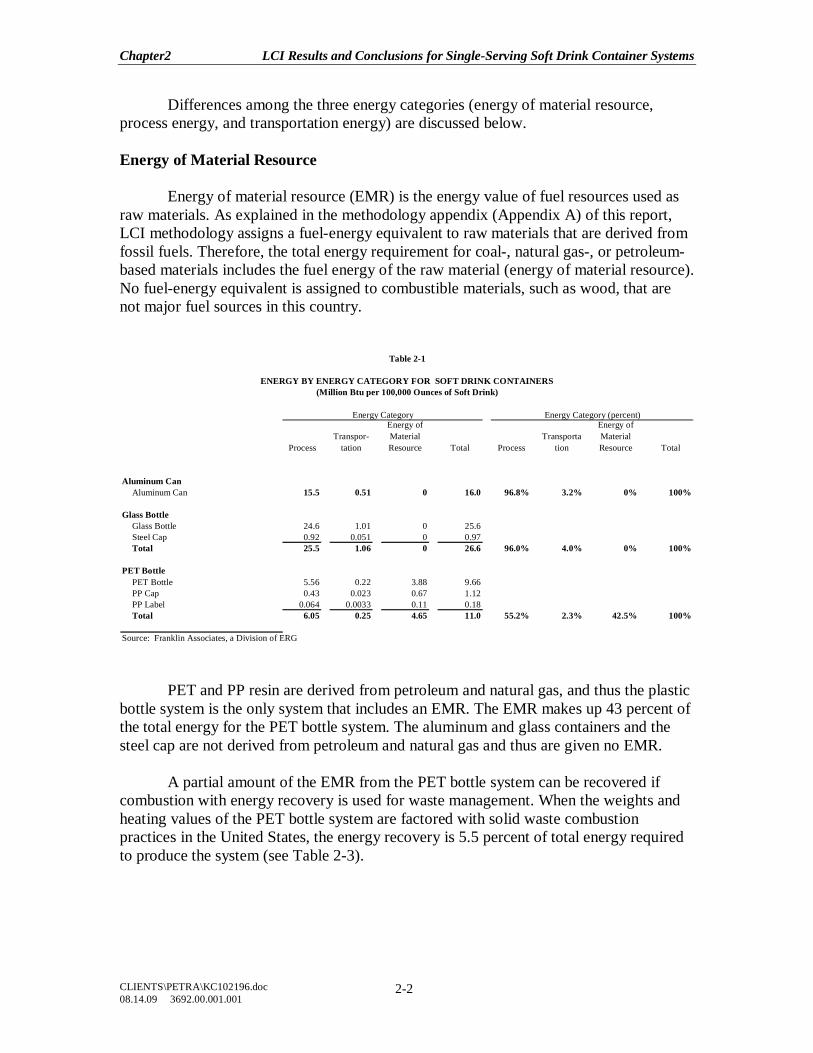
Differences among the three energy categories (energy of material resource, process energy, and transportation energy) are discussed below. Energy of Material Resource
Energy of material resource (EMR) is the energy value of fuel resources used as raw materials. As explained in the methodology appendix (Appendix A) of this report, LCI methodology assigns a fuel-energy equivalent to raw materials that are derived from fossil fuels. Therefore, the total energy requirement for coal-, natural gas-, or petroleum-based materials includes the fuel energy of the raw material (energy of material resource). No fuel-energy equivalent is assigned to combustible materials, such as wood, that are not major fuel sources in this country.
ProcessTranspor-
tation
Energy of Material Resource Total Process
Transportation
Energy of Material Resource Total
Aluminum CanAluminum Can 15.5 0.51 0 16.0 96.8% 3.2% 0% 100%
Glass BottleGlass Bottle 24.6 1.01 0 25.6Steel Cap 0.92 0.051 0 0.97Total 25.5 1.06 0 26.6 96.0% 4.0% 0% 100%
PET BottlePET Bottle 5.56 0.22 3.88 9.66PP Cap 0.43 0.023 0.67 1.12PP Label 0.064 0.0033 0.11 0.18Total 6.05 0.25 4.65 11.0 55.2% 2.3% 42.5% 100%
Source: Franklin Associates, a Division of ERG
Table 2-1
ENERGY BY ENERGY CATEGORY FOR SOFT DRINK CONTAINERS(Million Btu per 100,000 Ounces of Soft Drink)
Energy Category Energy Category (percent)
PET and PP resin are derived from petroleum and natural gas, and thus the plastic bottle system is the only system that includes an EMR. The EMR makes up 43 percent of the total energy for the PET bottle system. The aluminum and glass containers and the steel cap are not derived from petroleum and natural gas and thus are given no EMR.
A partial amount of the EMR from the PET bottle system can be recovered if combustion with energy recovery is used for waste management. When the weights and heating values of the PET bottle system are factored with solid waste combustion practices in the United States, the energy recovery is 5.5 percent of total energy required to produce the system (see Table 2-3).
Chapter2 LCI Results and Conclusions for Single-Serving Soft Drink Container Systems
CLIENTS\PETRA\KC102196.doc 08.14.09 3692.00.001.001
2-3
Process Energy
Process energy includes all energy used to extract and process raw materials into usable forms, manufacture the container systems, and manage postconsumer materials. Process energy accounts for more than 95 percent of the total energy for the aluminum and glass container systems. Process energy accounts for more than half the energy of the PET bottle systems; this system has a high share of energy of material resource. The glass bottle system requires the greatest amount of process energy, while the PET bottle requires the least amount of process energy compared to the alternative systems. Transportation Energy
Transportation energy is the energy to transport materials among all processes from cradle to grave. Examples of the transportation steps included in this analysis include crude oil to refineries, resin pellets to fabricators, mined bauxite to alumina producers, and soda ash to glass factories. Transportation energy results do not include transport to filling or distribution of the filled container.
Transportation comprises less than 5 percent of the total energy for all soft drink container systems. Note that if distribution and transport of the containers to filler were included this energy amount would be a greater percentage of the systems. The glass system requires the highest amount of transportation energy due to its heavy weight. The aluminum cans require a higher amount of transportation energy than the PET bottles due to the longer distances the bauxite and alumina must travel to reach the United States. Energy Profile
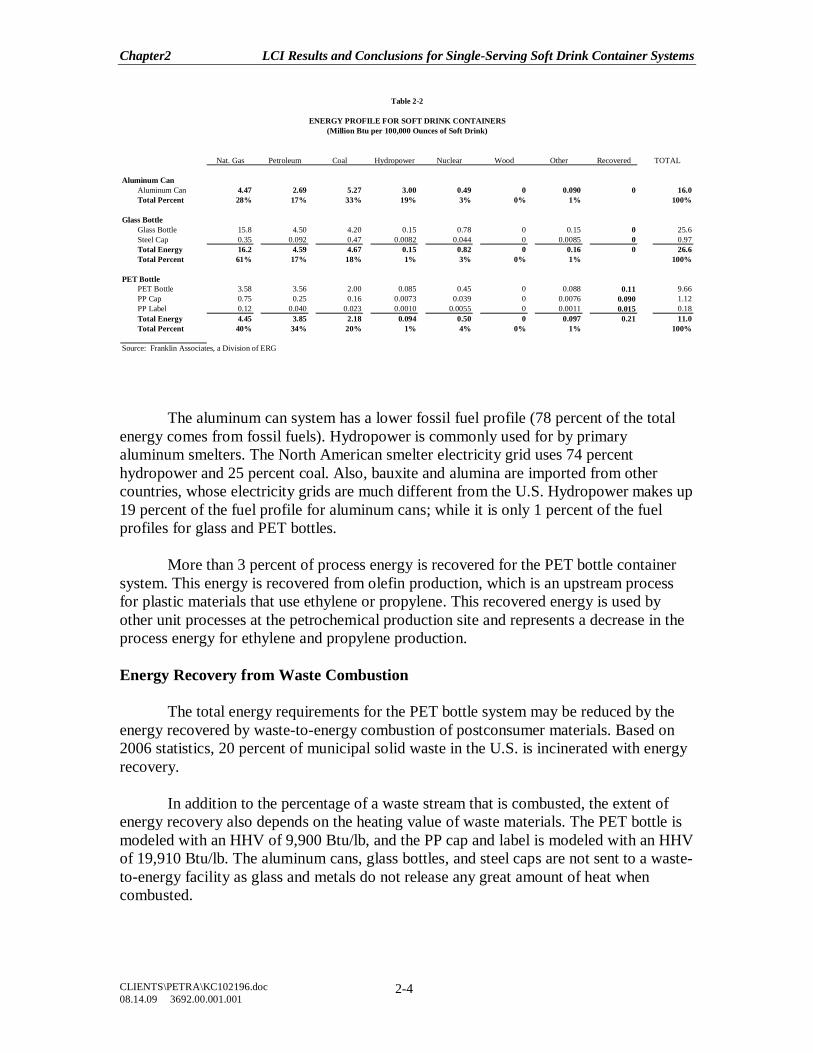
The total energy requirements for each system can also be categorized by the fuels from which energy is derived. Energy sources include fossil fuels (natural gas, petroleum, and coal) and non-fossil fuels. Non-fossil fuels include nuclear energy, hydroelectric energy, and energy produced from biomass or other alternatives. Table 2-2 shows the fuel profiles for the container systems.
The PET and glass bottles consume the highest percentages of fossil fuels. Approximately 95 percent of total energy for these two container systems is derived from fossil fuels. The high fossil fuel requirements of the PET bottle system are partly due to the petroleum and natural gas feedstocks used for material production. The fossil fuels from the glass bottle system come from the fuels used in the mining of virgin raw materials for the glass as well as the natural gas used to produce the glass.
Chapter2 LCI Results and Conclusions for Single-Serving Soft Drink Container Systems
CLIENTS\PETRA\KC102196.doc 08.14.09 3692.00.001.001
2-4
Nat. Gas Petroleum Coal Hydropower Nuclear Wood Other Recovered TOTAL
Aluminum CanAluminum Can 4.47 2.69 5.27 3.00 0.49 0 0.090 0 16.0Total Percent 28% 17% 33% 19% 3% 0% 1% 100%
Glass BottleGlass Bottle 15.8 4.50 4.20 0.15 0.78 0 0.15 0 25.6Steel Cap 0.35 0.092 0.47 0.0082 0.044 0 0.0085 0 0.97Total Energy 16.2 4.59 4.67 0.15 0.82 0 0.16 0 26.6Total Percent 61% 17% 18% 1% 3% 0% 1% 100%
PET BottlePET Bottle 3.58 3.56 2.00 0.085 0.45 0 0.088 0.11 9.66PP Cap 0.75 0.25 0.16 0.0073 0.039 0 0.0076 0.090 1.12PP Label 0.12 0.040 0.023 0.0010 0.0055 0 0.0011 0.015 0.18Total Energy 4.45 3.85 2.18 0.094 0.50 0 0.097 0.21 11.0Total Percent 40% 34% 20% 1% 4% 0% 1% 100%
Source: Franklin Associates, a Division of ERG
Table 2-2
ENERGY PROFILE FOR SOFT DRINK CONTAINERS(Million Btu per 100,000 Ounces of Soft Drink)
The aluminum can system has a lower fossil fuel profile (78 percent of the total energy comes from fossil fuels). Hydropower is commonly used for by primary aluminum smelters. The North American smelter electricity grid uses 74 percent hydropower and 25 percent coal. Also, bauxite and alumina are imported from other countries, whose electricity grids are much different from the U.S. Hydropower makes up 19 percent of the fuel profile for aluminum cans; while it is only 1 percent of the fuel profiles for glass and PET bottles.
More than 3 percent of process energy is recovered for the PET bottle container system. This energy is recovered from olefin production, which is an upstream process for plastic materials that use ethylene or propylene. This recovered energy is used by other unit processes at the petrochemical production site and represents a decrease in the process energy for ethylene and propylene production. Energy Recovery from Waste Combustion
The total energy requirements for the PET bottle system may be reduced by the energy recovered by waste-to-energy combustion of postconsumer materials. Based on 2006 statistics, 20 percent of municipal solid waste in the U.S. is incinerated with energy recovery.
In addition to the percentage of a waste stream that is combusted, the extent of energy recovery also depends on the heating value of waste materials. The PET bottle is modeled with an HHV of 9,900 Btu/lb, and the PP cap and label is modeled with an HHV of 19,910 Btu/lb. The aluminum cans, glass bottles, and steel caps are not sent to a waste-to-energy facility as glass and metals do not release any great amount of heat when combusted.
Chapter2 LCI Results and Conclusions for Single-Serving Soft Drink Container Systems
CLIENTS\PETRA\KC102196.doc 08.14.09 3692.00.001.001
2-5
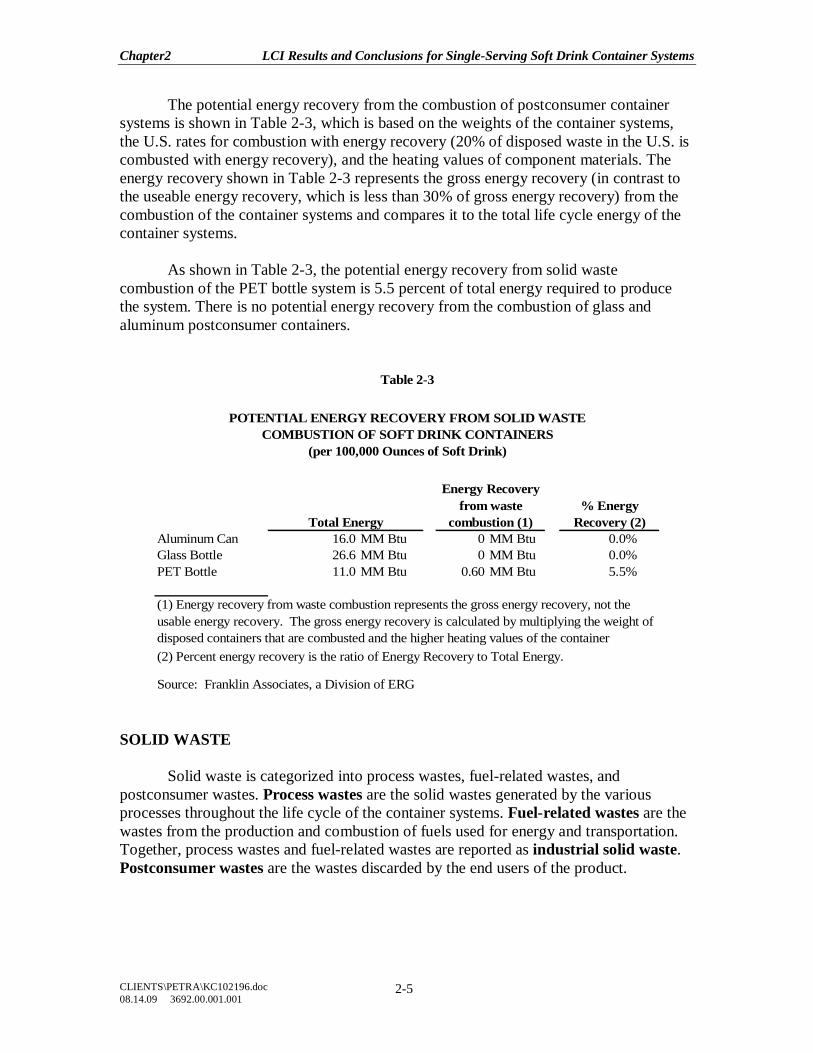
The potential energy recovery from the combustion of postconsumer container systems is shown in Table 2-3, which is based on the weights of the container systems, the U.S. rates for combustion with energy recovery (20% of disposed waste in the U.S. is combusted with energy recovery), and the heating values of component materials. The energy recovery shown in Table 2-3 represents the gross energy recovery (in contrast to the useable energy recovery, which is less than 30% of gross energy recovery) from the combustion of the container systems and compares it to the total life cycle energy of the container systems.
As shown in Table 2-3, the potential energy recovery from solid waste combustion of the PET bottle system is 5.5 percent of total energy required to produce the system. There is no potential energy recovery from the combustion of glass and aluminum postconsumer containers.
Aluminum Can 16.0 MM Btu 0 MM Btu 0.0%Glass Bottle 26.6 MM Btu 0 MM Btu 0.0%PET Bottle 11.0 MM Btu 0.60 MM Btu 5.5%
Source: Franklin Associates, a Division of ERG
(2) Percent energy recovery is the ratio of Energy Recovery to Total Energy.
(1) Energy recovery from waste combustion represents the gross energy recovery, not the usable energy recovery. The gross energy recovery is calculated by multiplying the weight of disposed containers that are combusted and the higher heating values of the container
% Energy Recovery (2)
Table 2-3
POTENTIAL ENERGY RECOVERY FROM SOLID WASTE COMBUSTION OF SOFT DRINK CONTAINERS
(per 100,000 Ounces of Soft Drink)
Total Energy
Energy Recovery from waste
combustion (1)
SOLID WASTE Solid waste is categorized into process wastes, fuel-related wastes, and postconsumer wastes. Process wastes are the solid wastes generated by the various processes throughout the life cycle of the container systems. Fuel-related wastes are the wastes from the production and combustion of fuels used for energy and transportation. Together, process wastes and fuel-related wastes are reported as industrial solid waste. Postconsumer wastes are the wastes discarded by the end users of the product.
Chapter2 LCI Results and Conclusions for Single-Serving Soft Drink Container Systems
CLIENTS\PETRA\KC102196.doc 08.14.09 3692.00.001.001
2-6
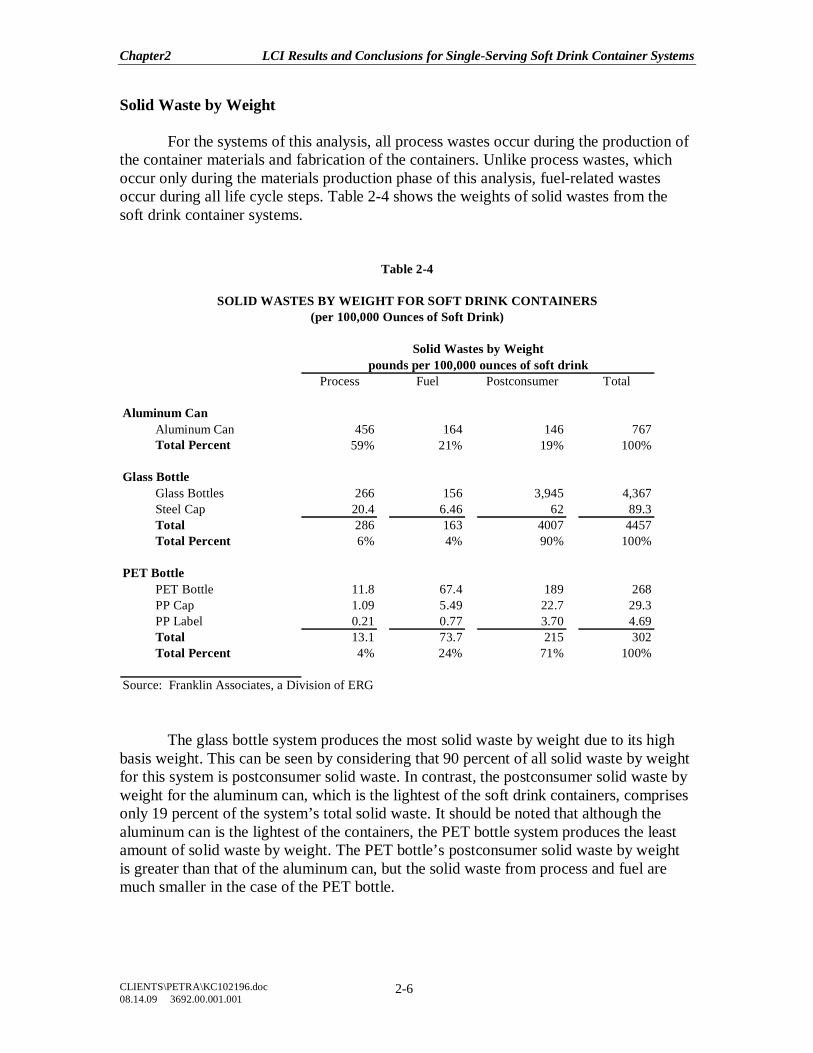
Solid Waste by Weight For the systems of this analysis, all process wastes occur during the production of the container materials and fabrication of the containers. Unlike process wastes, which occur only during the materials production phase of this analysis, fuel-related wastes occur during all life cycle steps. Table 2-4 shows the weights of solid wastes from the soft drink container systems.
Process Fuel Postconsumer Total
Aluminum CanAluminum Can 456 164 146 767Total Percent 59% 21% 19% 100%
Glass BottleGlass Bottles 266 156 3,945 4,367Steel Cap 20.4 6.46 62 89.3Total 286 163 4007 4457Total Percent 6% 4% 90% 100%
PET BottlePET Bottle 11.8 67.4 189 268PP Cap 1.09 5.49 22.7 29.3PP Label 0.21 0.77 3.70 4.69Total 13.1 73.7 215 302Total Percent 4% 24% 71% 100%
Source: Franklin Associates, a Division of ERG
Table 2-4
SOLID WASTES BY WEIGHT FOR SOFT DRINK CONTAINERS
pounds per 100,000 ounces of soft drinkSolid Wastes by Weight
(per 100,000 Ounces of Soft Drink)
The glass bottle system produces the most solid waste by weight due to its high basis weight. This can be seen by considering that 90 percent of all solid waste by weight for this system is postconsumer solid waste. In contrast, the postconsumer solid waste by weight for the aluminum can, which is the lightest of the soft drink containers, comprises only 19 percent of the system’s total solid waste. It should be noted that although the aluminum can is the lightest of the containers, the PET bottle system produces the least amount of solid waste by weight. The PET bottle’s postconsumer solid waste by weight is greater than that of the aluminum can, but the solid waste from process and fuel are much smaller in the case of the PET bottle.
Chapter2 LCI Results and Conclusions for Single-Serving Soft Drink Container Systems
CLIENTS\PETRA\KC102196.doc 08.14.09 3692.00.001.001
2-7
Solid Waste by Volume
Landfills fill up because of volume, not weight. While weight is the conventional measure of waste, landfill volume is more relevant to the environmental concerns of land use. The problem is the difficulty in deriving accurate landfill volume factors. However, Franklin Associates has developed a set of landfill density factors for different materials based upon an extensive sampling by the University of Arizona1. It should be noted that compaction rates and landfill moisture will vary by landfill, which may affect the volumes. While these factors are considered to be only estimates, their use helps add valuable perspective. Volume factors are estimated to be accurate to +/- 25 percent. This means that waste volume values must differ by at least 25 percent in order to be interpreted as a significant difference.
Landfill density factors are used to convert weights of solid waste into volumes. Materials with a high landfill density occupy less landfill volume than equal weights of materials with lower landfill densities. A constant factor (1,350 pounds per cubic yard) was used to convert industrial wastes (both process- and fuel-related wastes) from a weight basis to a volume basis. Thus, the discussion on the relative weights of process wastes also applies to the relative volumes of process wastes, and the discussion on the relative weights of fuel wastes also applies to the relative volumes of fuel wastes.
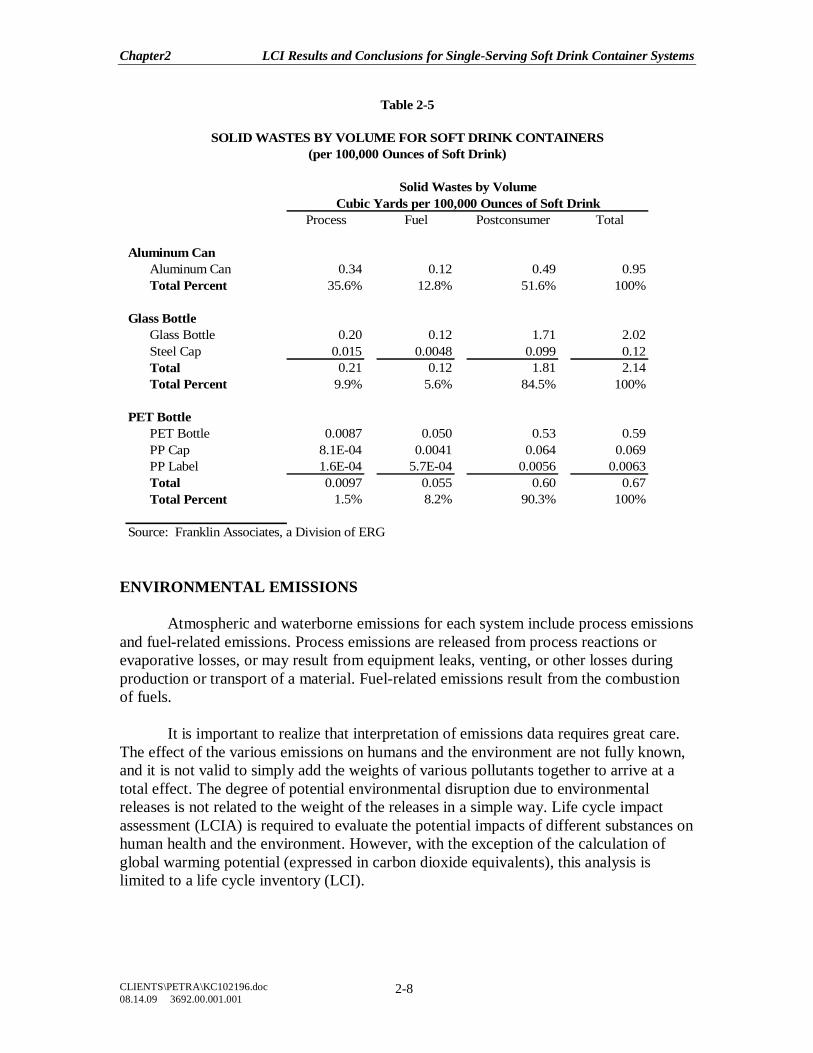
Table 2-5 shows the solid wastes by volume for each container system. The volumes of industrial and postconsumer solid wastes were calculated by multiplying the weights in Table 2-4 by the landfill density factor for each container system.
The greatest variation between the weight and volume of solid waste occurs in the category of postconsumer wastes, because different materials have different landfill densities. When the solid waste is expressed on a volume basis instead of a weight basis, the results for the glass bottle system are much closer to the results for the other two systems; this is due to the relatively high landfill density of glass. Whereas the postconsumer solid waste by weight for the PET bottle system was 47 percent greater than that of the aluminum can system, the postconsumer solid waste by volume for the PET bottle system is only 22 percent greater. The postconsumer solid wastes for these two systems are not considered significantly different. However, due to the high process solid waste of the aluminum cans, the total solid waste by volume for the PET bottle system is less than that of the aluminum can system.
1 Estimates of the Volume of MSW and Selected Components in Trash Cans and Landfills. Franklin
Associates, Ltd., Prairie Village, KS and The Garbage Project, Tucson, Arizona. February, 1990.
Chapter2 LCI Results and Conclusions for Single-Serving Soft Drink Container Systems
CLIENTS\PETRA\KC102196.doc 08.14.09 3692.00.001.001
2-8
Process Fuel Postconsumer Total
Aluminum CanAluminum Can 0.34 0.12 0.49 0.95Total Percent 35.6% 12.8% 51.6% 100%
Glass Bottle Glass Bottle 0.20 0.12 1.71 2.02Steel Cap 0.015 0.0048 0.099 0.12Total 0.21 0.12 1.81 2.14Total Percent 9.9% 5.6% 84.5% 100%
PET BottlePET Bottle 0.0087 0.050 0.53 0.59PP Cap 8.1E-04 0.0041 0.064 0.069PP Label 1.6E-04 5.7E-04 0.0056 0.0063Total 0.0097 0.055 0.60 0.67Total Percent 1.5% 8.2% 90.3% 100%
Source: Franklin Associates, a Division of ERG
Table 2-5
SOLID WASTES BY VOLUME FOR SOFT DRINK CONTAINERS
Cubic Yards per 100,000 Ounces of Soft DrinkSolid Wastes by Volume
(per 100,000 Ounces of Soft Drink)
ENVIRONMENTAL EMISSIONS Atmospheric and waterborne emissions for each system include process emissions and fuel-related emissions. Process emissions are released from process reactions or evaporative losses, or may result from equipment leaks, venting, or other losses during production or transport of a material. Fuel-related emissions result from the combustion of fuels. It is important to realize that interpretation of emissions data requires great care. The effect of the various emissions on humans and the environment are not fully known, and it is not valid to simply add the weights of various pollutants together to arrive at a total effect. The degree of potential environmental disruption due to environmental releases is not related to the weight of the releases in a simple way. Life cycle impact assessment (LCIA) is required to evaluate the potential impacts of different substances on human health and the environment. However, with the exception of the calculation of global warming potential (expressed in carbon dioxide equivalents), this analysis is limited to a life cycle inventory (LCI).
Chapter2 LCI Results and Conclusions for Single-Serving Soft Drink Container Systems
CLIENTS\PETRA\KC102196.doc 08.14.09 3692.00.001.001
2-9
If the weight of atmospheric emissions (including greenhouse gases) or waterborne emissions of a system is 25 percent different from another, it can be concluded that the difference is significant. Percent difference is defined as the difference between two values divided by the average of the two values. (See Appendix B for an explanation of these uncertainty ranges.) Atmospheric Emissions
The predominant atmospheric emissions for the container systems include greenhouse gases (carbon dioxide, methane, and nitrous oxide), volatile organic compounds (VOC), sulfur oxides, particulates, and other organic compounds. Some of these emissions (such as other organics, volatile organic compounds, or particulates) do not represent a distinct chemical species, but rather a general category of compounds with similar properties.
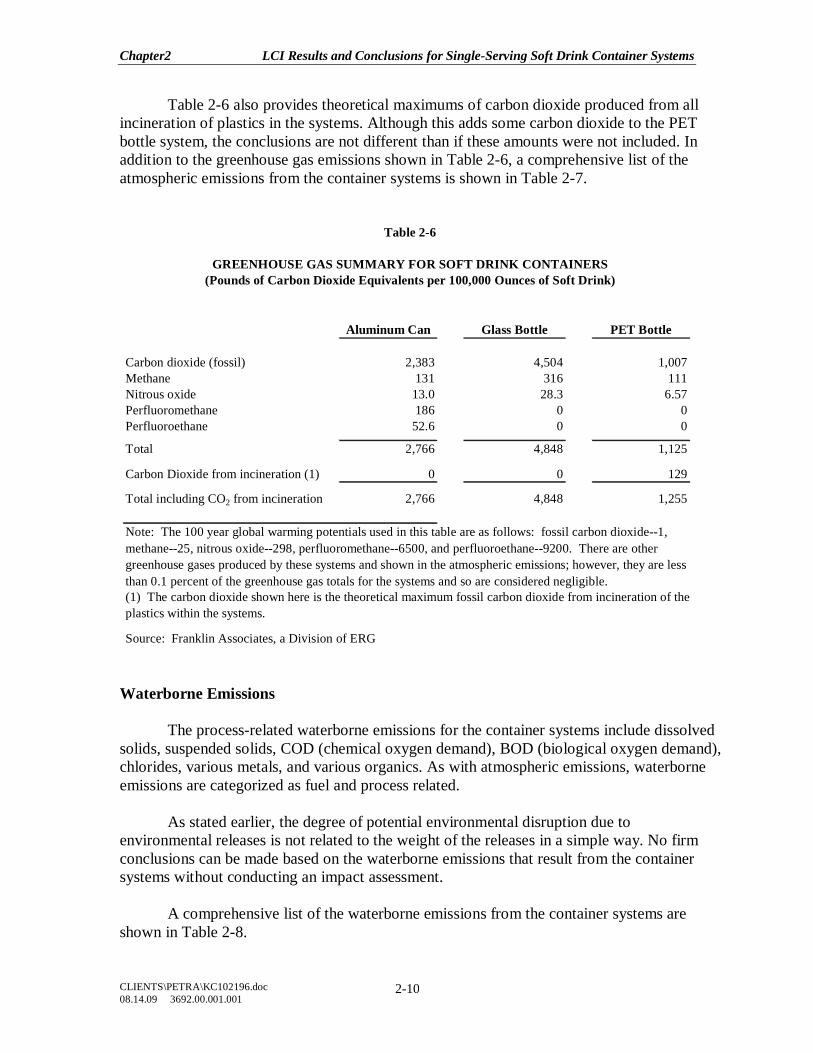
Fuel combustion atmospheric emissions are directly related to the energy requirements of the container systems and the profile of fuels used for energy. Thus, the same conclusions that were discussed in the energy section of this chapter can be applied to the atmospheric emissions from fuel combustion. An exception is energy of material resource (EMR). EMR is a measure of the energy content of fuel resources used as raw materials and represents a significant portion of total energy requirements for plastic materials but does not have associated fuel combustion emissions. Table 2-6 shows the greenhouse gases released by the soft drink container systems. The greenhouse gas emissions shown in these tables are multiplied by global warming potentials developed by the IPCC (Intergovernmental Panel on Climate Change). The global warming potentials are based on a 100-year time frame and represent the heat trapping capacity of the gases relative to an equal weight of carbon dioxide. This practice is a “midpoint” impact assessment method that does not attempt to predict the global warming that results from the emission of greenhouse gases. ISO 14044 does not specify a specific methodology or support the underlying value-choices used for impact categories.
The carbon dioxide emissions from combustion of biomass waste are not included in the calculation of greenhouse gas emissions. By EPA convention, carbon dioxide released by wood combustion is considered part of the natural carbon cycle. In other words, when wood is burned, carbon dioxide consumed by the tree during its growth cycle is returned to the atmosphere, so there is no net increase in atmospheric carbon dioxide.
The results in Table 2-6 are consistent with the energy results of this study. The glass bottle system consumes the most amount of fossil fuel and generates the most greenhouse gas emissions. Although the PET bottle system consumes a greater amount of fossil fuel than the aluminum can, it still generates the lowest carbon dioxide equivalents. This is due to the energy of material resource (the use of fossil fuels for material production instead of for fuel combustion) portion of the PET bottle system.
Chapter2 LCI Results and Conclusions for Single-Serving Soft Drink Container Systems
CLIENTS\PETRA\KC102196.doc 08.14.09 3692.00.001.001
2-10
Table 2-6 also provides theoretical maximums of carbon dioxide produced from all incineration of plastics in the systems. Although this adds some carbon dioxide to the PET bottle system, the conclusions are not different than if these amounts were not included. In addition to the greenhouse gas emissions shown in Table 2-6, a comprehensive list of the atmospheric emissions from the container systems is shown in Table 2-7.
Aluminum Can Glass Bottle PET Bottle
Carbon dioxide (fossil) 2,383 4,504 1,007Methane 131 316 111Nitrous oxide 13.0 28.3 6.57Perfluoromethane 186 0 0Perfluoroethane 52.6 0 0
Total 2,766 4,848 1,125
Carbon Dioxide from incineration (1) 0 0 129
Total including CO2 from incineration 2,766 4,848 1,255
Source: Franklin Associates, a Division of ERG
(1) The carbon dioxide shown here is the theoretical maximum fossil carbon dioxide from incineration of the plastics within the systems.
Table 2-6
GREENHOUSE GAS SUMMARY FOR SOFT DRINK CONTAINERS(Pounds of Carbon Dioxide Equivalents per 100,000 Ounces of Soft Drink)
Note: The 100 year global warming potentials used in this table are as follows: fossil carbon dioxide--1, methane--25, nitrous oxide--298, perfluoromethane--6500, and perfluoroethane--9200. There are other greenhouse gases produced by these systems and shown in the atmospheric emissions; however, they are less than 0.1 percent of the greenhouse gas totals for the systems and so are considered negligible.
Waterborne Emissions
The process-related waterborne emissions for the container systems include dissolved solids, suspended solids, COD (chemical oxygen demand), BOD (biological oxygen demand), chlorides, various metals, and various organics. As with atmospheric emissions, waterborne emissions are categorized as fuel and process related.
As stated earlier, the degree of potential environmental disruption due to environmental releases is not related to the weight of the releases in a simple way. No firm conclusions can be made based on the waterborne emissions that result from the container systems without conducting an impact assessment.
A comprehensive list of the waterborne emissions from the container systems are shown in Table 2-8.
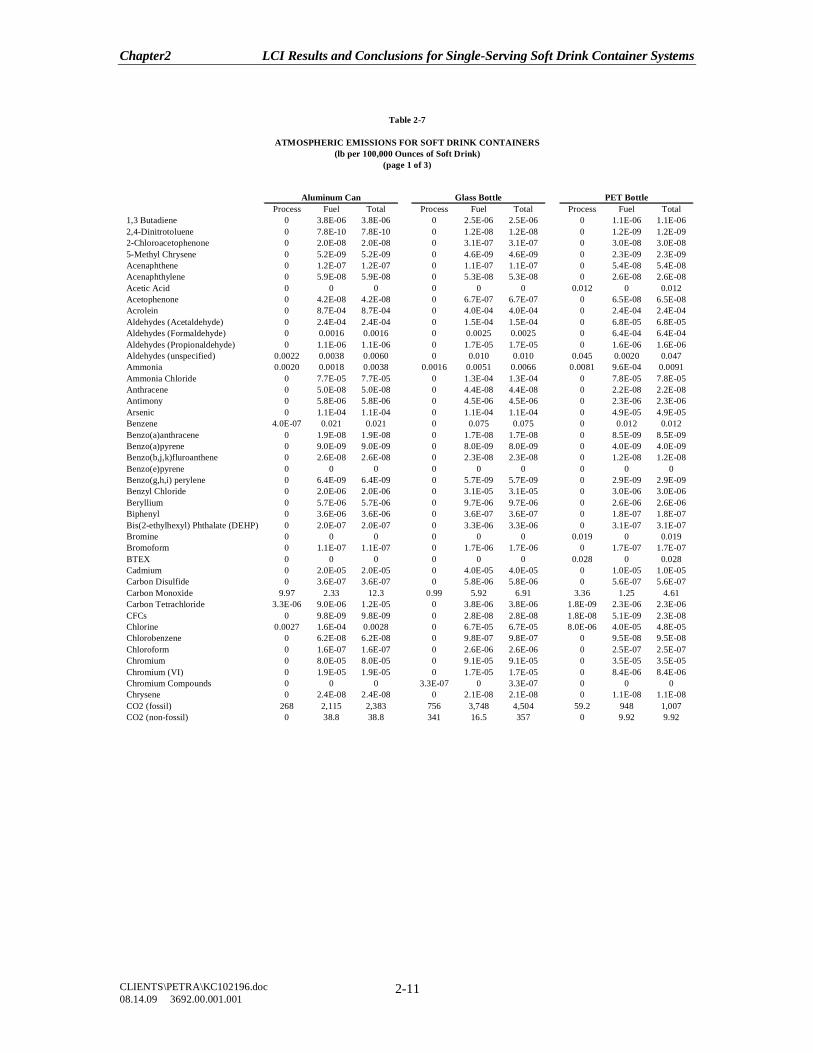
Chapter2 LCI Results and Conclusions for Single-Serving Soft Drink Container Systems
CLIENTS\PETRA\KC102196.doc 08.14.09 3692.00.001.001
2-11
Process Fuel Total Process Fuel Total Process Fuel Total1,3 Butadiene 0 3.8E-06 3.8E-06 0 2.5E-06 2.5E-06 0 1.1E-06 1.1E-062,4-Dinitrotoluene 0 7.8E-10 7.8E-10 0 1.2E-08 1.2E-08 0 1.2E-09 1.2E-092-Chloroacetophenone 0 2.0E-08 2.0E-08 0 3.1E-07 3.1E-07 0 3.0E-08 3.0E-085-Methyl Chrysene 0 5.2E-09 5.2E-09 0 4.6E-09 4.6E-09 0 2.3E-09 2.3E-09Acenaphthene 0 1.2E-07 1.2E-07 0 1.1E-07 1.1E-07 0 5.4E-08 5.4E-08Acenaphthylene 0 5.9E-08 5.9E-08 0 5.3E-08 5.3E-08 0 2.6E-08 2.6E-08Acetic Acid 0 0 0 0 0 0 0.012 0 0.012Acetophenone 0 4.2E-08 4.2E-08 0 6.7E-07 6.7E-07 0 6.5E-08 6.5E-08Acrolein 0 8.7E-04 8.7E-04 0 4.0E-04 4.0E-04 0 2.4E-04 2.4E-04Aldehydes (Acetaldehyde) 0 2.4E-04 2.4E-04 0 1.5E-04 1.5E-04 0 6.8E-05 6.8E-05Aldehydes (Formaldehyde) 0 0.0016 0.0016 0 0.0025 0.0025 0 6.4E-04 6.4E-04Aldehydes (Propionaldehyde) 0 1.1E-06 1.1E-06 0 1.7E-05 1.7E-05 0 1.6E-06 1.6E-06Aldehydes (unspecified) 0.0022 0.0038 0.0060 0 0.010 0.010 0.045 0.0020 0.047Ammonia 0.0020 0.0018 0.0038 0.0016 0.0051 0.0066 0.0081 9.6E-04 0.0091Ammonia Chloride 0 7.7E-05 7.7E-05 0 1.3E-04 1.3E-04 0 7.8E-05 7.8E-05Anthracene 0 5.0E-08 5.0E-08 0 4.4E-08 4.4E-08 0 2.2E-08 2.2E-08Antimony 0 5.8E-06 5.8E-06 0 4.5E-06 4.5E-06 0 2.3E-06 2.3E-06Arsenic 0 1.1E-04 1.1E-04 0 1.1E-04 1.1E-04 0 4.9E-05 4.9E-05Benzene 4.0E-07 0.021 0.021 0 0.075 0.075 0 0.012 0.012Benzo(a)anthracene 0 1.9E-08 1.9E-08 0 1.7E-08 1.7E-08 0 8.5E-09 8.5E-09Benzo(a)pyrene 0 9.0E-09 9.0E-09 0 8.0E-09 8.0E-09 0 4.0E-09 4.0E-09Benzo(b,j,k)fluroanthene 0 2.6E-08 2.6E-08 0 2.3E-08 2.3E-08 0 1.2E-08 1.2E-08Benzo(e)pyrene 0 0 0 0 0 0 0 0 0Benzo(g,h,i) perylene 0 6.4E-09 6.4E-09 0 5.7E-09 5.7E-09 0 2.9E-09 2.9E-09Benzyl Chloride 0 2.0E-06 2.0E-06 0 3.1E-05 3.1E-05 0 3.0E-06 3.0E-06Beryllium 0 5.7E-06 5.7E-06 0 9.7E-06 9.7E-06 0 2.6E-06 2.6E-06Biphenyl 0 3.6E-06 3.6E-06 0 3.6E-07 3.6E-07 0 1.8E-07 1.8E-07Bis(2-ethylhexyl) Phthalate (DEHP) 0 2.0E-07 2.0E-07 0 3.3E-06 3.3E-06 0 3.1E-07 3.1E-07Bromine 0 0 0 0 0 0 0.019 0 0.019Bromoform 0 1.1E-07 1.1E-07 0 1.7E-06 1.7E-06 0 1.7E-07 1.7E-07BTEX 0 0 0 0 0 0 0.028 0 0.028Cadmium 0 2.0E-05 2.0E-05 0 4.0E-05 4.0E-05 0 1.0E-05 1.0E-05Carbon Disulfide 0 3.6E-07 3.6E-07 0 5.8E-06 5.8E-06 0 5.6E-07 5.6E-07Carbon Monoxide 9.97 2.33 12.3 0.99 5.92 6.91 3.36 1.25 4.61Carbon Tetrachloride 3.3E-06 9.0E-06 1.2E-05 0 3.8E-06 3.8E-06 1.8E-09 2.3E-06 2.3E-06CFCs 0 9.8E-09 9.8E-09 0 2.8E-08 2.8E-08 1.8E-08 5.1E-09 2.3E-08Chlorine 0.0027 1.6E-04 0.0028 0 6.7E-05 6.7E-05 8.0E-06 4.0E-05 4.8E-05Chlorobenzene 0 6.2E-08 6.2E-08 0 9.8E-07 9.8E-07 0 9.5E-08 9.5E-08Chloroform 0 1.6E-07 1.6E-07 0 2.6E-06 2.6E-06 0 2.5E-07 2.5E-07Chromium 0 8.0E-05 8.0E-05 0 9.1E-05 9.1E-05 0 3.5E-05 3.5E-05Chromium (VI) 0 1.9E-05 1.9E-05 0 1.7E-05 1.7E-05 0 8.4E-06 8.4E-06Chromium Compounds 0 0 0 3.3E-07 0 3.3E-07 0 0 0Chrysene 0 2.4E-08 2.4E-08 0 2.1E-08 2.1E-08 0 1.1E-08 1.1E-08CO2 (fossil) 268 2,115 2,383 756 3,748 4,504 59.2 948 1,007CO2 (non-fossil) 0 38.8 38.8 341 16.5 357 0 9.92 9.92
Table 2-7
ATMOSPHERIC EMISSIONS FOR SOFT DRINK CONTAINERS(lb per 100,000 Ounces of Soft Drink)
(page 1 of 3)
Aluminum Can Glass Bottle PET Bottle
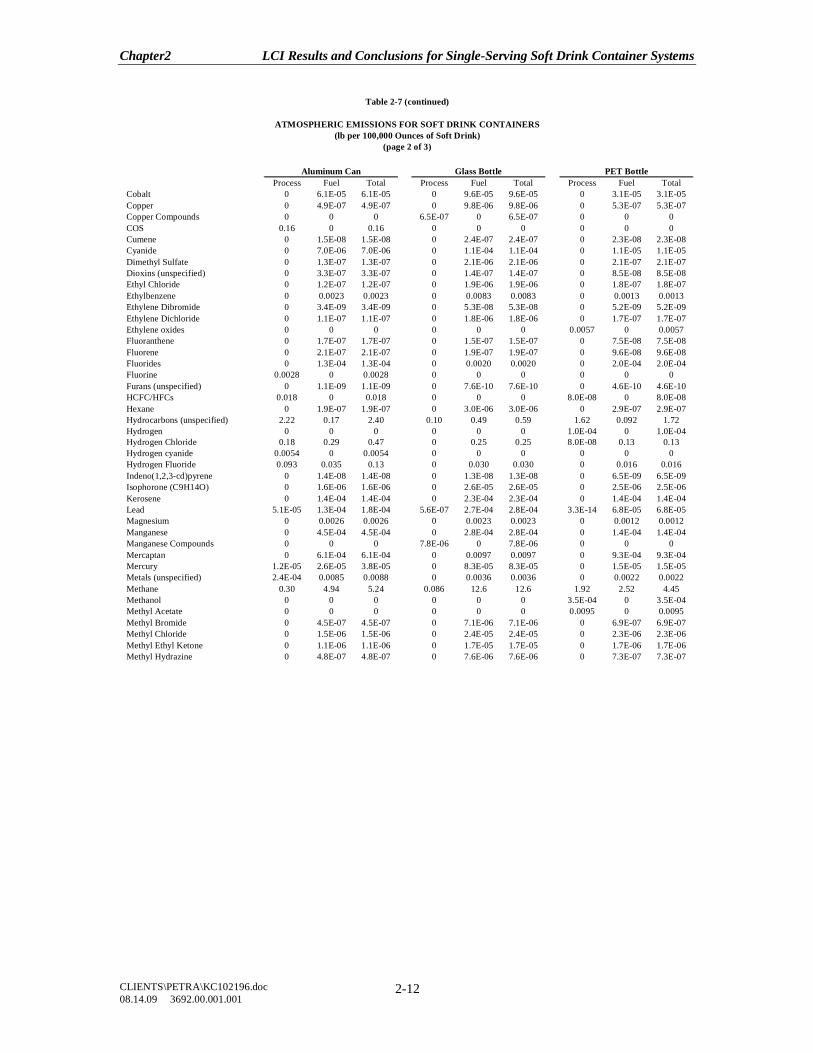
Chapter2 LCI Results and Conclusions for Single-Serving Soft Drink Container Systems
CLIENTS\PETRA\KC102196.doc 08.14.09 3692.00.001.001
2-12
Process Fuel Total Process Fuel Total Process Fuel TotalCobalt 0 6.1E-05 6.1E-05 0 9.6E-05 9.6E-05 0 3.1E-05 3.1E-05Copper 0 4.9E-07 4.9E-07 0 9.8E-06 9.8E-06 0 5.3E-07 5.3E-07Copper Compounds 0 0 0 6.5E-07 0 6.5E-07 0 0 0COS 0.16 0 0.16 0 0 0 0 0 0Cumene 0 1.5E-08 1.5E-08 0 2.4E-07 2.4E-07 0 2.3E-08 2.3E-08Cyanide 0 7.0E-06 7.0E-06 0 1.1E-04 1.1E-04 0 1.1E-05 1.1E-05Dimethyl Sulfate 0 1.3E-07 1.3E-07 0 2.1E-06 2.1E-06 0 2.1E-07 2.1E-07Dioxins (unspecified) 0 3.3E-07 3.3E-07 0 1.4E-07 1.4E-07 0 8.5E-08 8.5E-08Ethyl Chloride 0 1.2E-07 1.2E-07 0 1.9E-06 1.9E-06 0 1.8E-07 1.8E-07Ethylbenzene 0 0.0023 0.0023 0 0.0083 0.0083 0 0.0013 0.0013Ethylene Dibromide 0 3.4E-09 3.4E-09 0 5.3E-08 5.3E-08 0 5.2E-09 5.2E-09Ethylene Dichloride 0 1.1E-07 1.1E-07 0 1.8E-06 1.8E-06 0 1.7E-07 1.7E-07Ethylene oxides 0 0 0 0 0 0 0.0057 0 0.0057Fluoranthene 0 1.7E-07 1.7E-07 0 1.5E-07 1.5E-07 0 7.5E-08 7.5E-08Fluorene 0 2.1E-07 2.1E-07 0 1.9E-07 1.9E-07 0 9.6E-08 9.6E-08Fluorides 0 1.3E-04 1.3E-04 0 0.0020 0.0020 0 2.0E-04 2.0E-04Fluorine 0.0028 0 0.0028 0 0 0 0 0 0Furans (unspecified) 0 1.1E-09 1.1E-09 0 7.6E-10 7.6E-10 0 4.6E-10 4.6E-10HCFC/HFCs 0.018 0 0.018 0 0 0 8.0E-08 0 8.0E-08Hexane 0 1.9E-07 1.9E-07 0 3.0E-06 3.0E-06 0 2.9E-07 2.9E-07Hydrocarbons (unspecified) 2.22 0.17 2.40 0.10 0.49 0.59 1.62 0.092 1.72Hydrogen 0 0 0 0 0 0 1.0E-04 0 1.0E-04Hydrogen Chloride 0.18 0.29 0.47 0 0.25 0.25 8.0E-08 0.13 0.13Hydrogen cyanide 0.0054 0 0.0054 0 0 0 0 0 0Hydrogen Fluoride 0.093 0.035 0.13 0 0.030 0.030 0 0.016 0.016Indeno(1,2,3-cd)pyrene 0 1.4E-08 1.4E-08 0 1.3E-08 1.3E-08 0 6.5E-09 6.5E-09Isophorone (C9H14O) 0 1.6E-06 1.6E-06 0 2.6E-05 2.6E-05 0 2.5E-06 2.5E-06Kerosene 0 1.4E-04 1.4E-04 0 2.3E-04 2.3E-04 0 1.4E-04 1.4E-04Lead 5.1E-05 1.3E-04 1.8E-04 5.6E-07 2.7E-04 2.8E-04 3.3E-14 6.8E-05 6.8E-05Magnesium 0 0.0026 0.0026 0 0.0023 0.0023 0 0.0012 0.0012Manganese 0 4.5E-04 4.5E-04 0 2.8E-04 2.8E-04 0 1.4E-04 1.4E-04Manganese Compounds 0 0 0 7.8E-06 0 7.8E-06 0 0 0Mercaptan 0 6.1E-04 6.1E-04 0 0.0097 0.0097 0 9.3E-04 9.3E-04Mercury 1.2E-05 2.6E-05 3.8E-05 0 8.3E-05 8.3E-05 0 1.5E-05 1.5E-05Metals (unspecified) 2.4E-04 0.0085 0.0088 0 0.0036 0.0036 0 0.0022 0.0022Methane 0.30 4.94 5.24 0.086 12.6 12.6 1.92 2.52 4.45Methanol 0 0 0 0 0 0 3.5E-04 0 3.5E-04Methyl Acetate 0 0 0 0 0 0 0.0095 0 0.0095Methyl Bromide 0 4.5E-07 4.5E-07 0 7.1E-06 7.1E-06 0 6.9E-07 6.9E-07Methyl Chloride 0 1.5E-06 1.5E-06 0 2.4E-05 2.4E-05 0 2.3E-06 2.3E-06Methyl Ethyl Ketone 0 1.1E-06 1.1E-06 0 1.7E-05 1.7E-05 0 1.7E-06 1.7E-06Methyl Hydrazine 0 4.8E-07 4.8E-07 0 7.6E-06 7.6E-06 0 7.3E-07 7.3E-07
Table 2-7 (continued)
Aluminum Can
ATMOSPHERIC EMISSIONS FOR SOFT DRINK CONTAINERS(lb per 100,000 Ounces of Soft Drink)
(page 2 of 3)
Glass Bottle PET Bottle
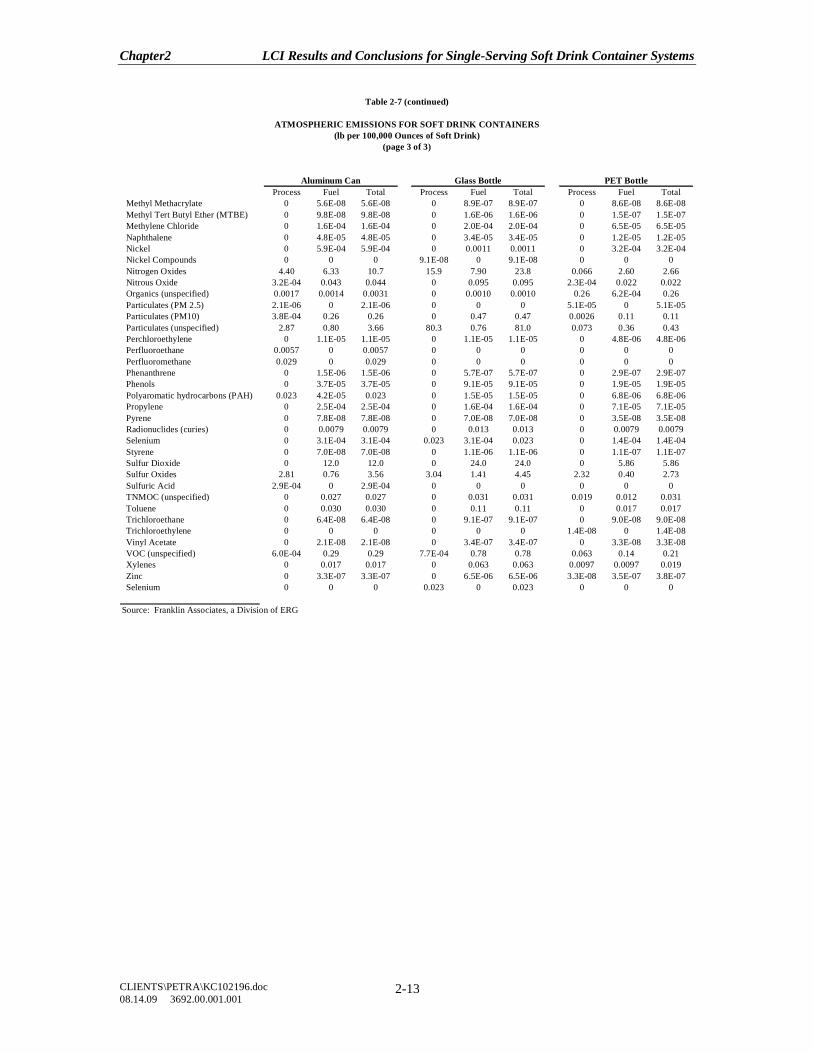
Chapter2 LCI Results and Conclusions for Single-Serving Soft Drink Container Systems
CLIENTS\PETRA\KC102196.doc 08.14.09 3692.00.001.001
2-13
Process Fuel Total Process Fuel Total Process Fuel TotalMethyl Methacrylate 0 5.6E-08 5.6E-08 0 8.9E-07 8.9E-07 0 8.6E-08 8.6E-08Methyl Tert Butyl Ether (MTBE) 0 9.8E-08 9.8E-08 0 1.6E-06 1.6E-06 0 1.5E-07 1.5E-07Methylene Chloride 0 1.6E-04 1.6E-04 0 2.0E-04 2.0E-04 0 6.5E-05 6.5E-05Naphthalene 0 4.8E-05 4.8E-05 0 3.4E-05 3.4E-05 0 1.2E-05 1.2E-05Nickel 0 5.9E-04 5.9E-04 0 0.0011 0.0011 0 3.2E-04 3.2E-04Nickel Compounds 0 0 0 9.1E-08 0 9.1E-08 0 0 0Nitrogen Oxides 4.40 6.33 10.7 15.9 7.90 23.8 0.066 2.60 2.66Nitrous Oxide 3.2E-04 0.043 0.044 0 0.095 0.095 2.3E-04 0.022 0.022Organics (unspecified) 0.0017 0.0014 0.0031 0 0.0010 0.0010 0.26 6.2E-04 0.26Particulates (PM 2.5) 2.1E-06 0 2.1E-06 0 0 0 5.1E-05 0 5.1E-05Particulates (PM10) 3.8E-04 0.26 0.26 0 0.47 0.47 0.0026 0.11 0.11Particulates (unspecified) 2.87 0.80 3.66 80.3 0.76 81.0 0.073 0.36 0.43Perchloroethylene 0 1.1E-05 1.1E-05 0 1.1E-05 1.1E-05 0 4.8E-06 4.8E-06Perfluoroethane 0.0057 0 0.0057 0 0 0 0 0 0Perfluoromethane 0.029 0 0.029 0 0 0 0 0 0Phenanthrene 0 1.5E-06 1.5E-06 0 5.7E-07 5.7E-07 0 2.9E-07 2.9E-07Phenols 0 3.7E-05 3.7E-05 0 9.1E-05 9.1E-05 0 1.9E-05 1.9E-05Polyaromatic hydrocarbons (PAH) 0.023 4.2E-05 0.023 0 1.5E-05 1.5E-05 0 6.8E-06 6.8E-06Propylene 0 2.5E-04 2.5E-04 0 1.6E-04 1.6E-04 0 7.1E-05 7.1E-05Pyrene 0 7.8E-08 7.8E-08 0 7.0E-08 7.0E-08 0 3.5E-08 3.5E-08Radionuclides (curies) 0 0.0079 0.0079 0 0.013 0.013 0 0.0079 0.0079Selenium 0 3.1E-04 3.1E-04 0.023 3.1E-04 0.023 0 1.4E-04 1.4E-04Styrene 0 7.0E-08 7.0E-08 0 1.1E-06 1.1E-06 0 1.1E-07 1.1E-07Sulfur Dioxide 0 12.0 12.0 0 24.0 24.0 0 5.86 5.86Sulfur Oxides 2.81 0.76 3.56 3.04 1.41 4.45 2.32 0.40 2.73Sulfuric Acid 2.9E-04 0 2.9E-04 0 0 0 0 0 0TNMOC (unspecified) 0 0.027 0.027 0 0.031 0.031 0.019 0.012 0.031Toluene 0 0.030 0.030 0 0.11 0.11 0 0.017 0.017Trichloroethane 0 6.4E-08 6.4E-08 0 9.1E-07 9.1E-07 0 9.0E-08 9.0E-08Trichloroethylene 0 0 0 0 0 0 1.4E-08 0 1.4E-08Vinyl Acetate 0 2.1E-08 2.1E-08 0 3.4E-07 3.4E-07 0 3.3E-08 3.3E-08VOC (unspecified) 6.0E-04 0.29 0.29 7.7E-04 0.78 0.78 0.063 0.14 0.21Xylenes 0 0.017 0.017 0 0.063 0.063 0.0097 0.0097 0.019Zinc 0 3.3E-07 3.3E-07 0 6.5E-06 6.5E-06 3.3E-08 3.5E-07 3.8E-07Selenium 0 0 0 0.023 0 0.023 0 0 0
Source: Franklin Associates, a Division of ERG
Table 2-7 (continued)
ATMOSPHERIC EMISSIONS FOR SOFT DRINK CONTAINERS
(page 3 of 3)
Aluminum Can Glass Bottle PET Bottle
(lb per 100,000 Ounces of Soft Drink)
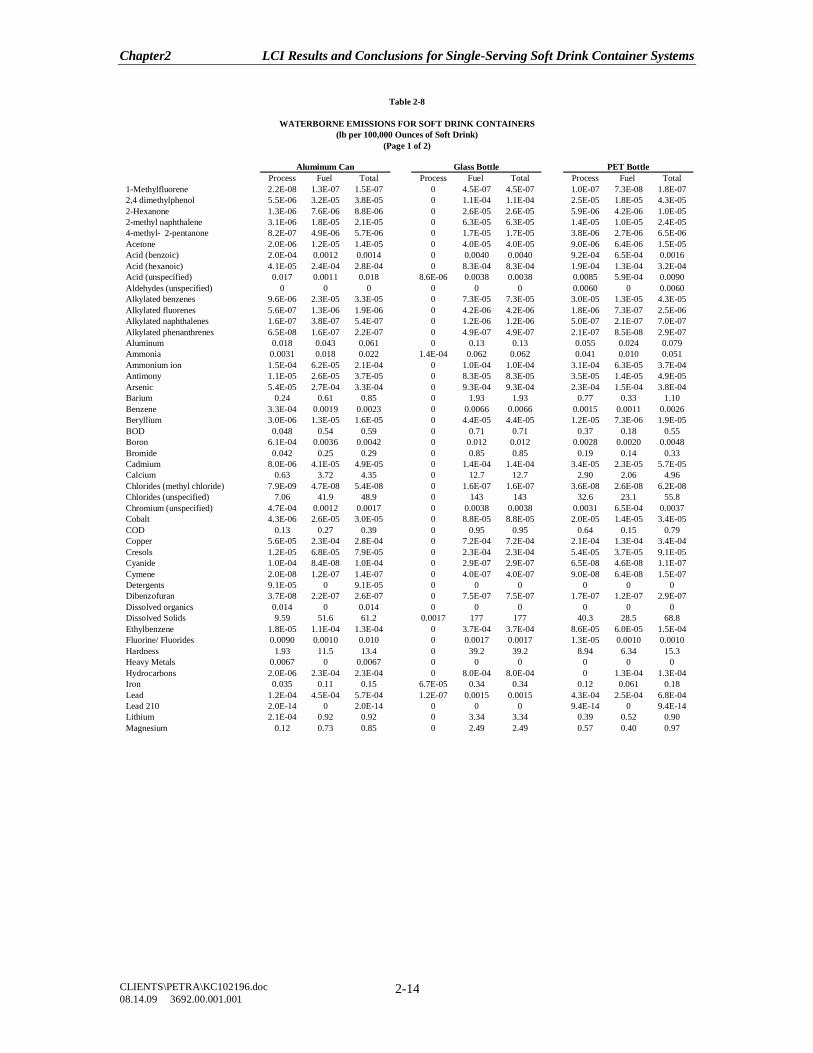
Chapter2 LCI Results and Conclusions for Single-Serving Soft Drink Container Systems
CLIENTS\PETRA\KC102196.doc 08.14.09 3692.00.001.001
2-14
Process Fuel Total Process Fuel Total Process Fuel Total1-Methylfluorene 2.2E-08 1.3E-07 1.5E-07 0 4.5E-07 4.5E-07 1.0E-07 7.3E-08 1.8E-072,4 dimethylphenol 5.5E-06 3.2E-05 3.8E-05 0 1.1E-04 1.1E-04 2.5E-05 1.8E-05 4.3E-052-Hexanone 1.3E-06 7.6E-06 8.8E-06 0 2.6E-05 2.6E-05 5.9E-06 4.2E-06 1.0E-052-methyl naphthalene 3.1E-06 1.8E-05 2.1E-05 0 6.3E-05 6.3E-05 1.4E-05 1.0E-05 2.4E-054-methyl- 2-pentanone 8.2E-07 4.9E-06 5.7E-06 0 1.7E-05 1.7E-05 3.8E-06 2.7E-06 6.5E-06Acetone 2.0E-06 1.2E-05 1.4E-05 0 4.0E-05 4.0E-05 9.0E-06 6.4E-06 1.5E-05Acid (benzoic) 2.0E-04 0.0012 0.0014 0 0.0040 0.0040 9.2E-04 6.5E-04 0.0016Acid (hexanoic) 4.1E-05 2.4E-04 2.8E-04 0 8.3E-04 8.3E-04 1.9E-04 1.3E-04 3.2E-04Acid (unspecified) 0.017 0.0011 0.018 8.6E-06 0.0038 0.0038 0.0085 5.9E-04 0.0090Aldehydes (unspecified) 0 0 0 0 0 0 0.0060 0 0.0060Alkylated benzenes 9.6E-06 2.3E-05 3.3E-05 0 7.3E-05 7.3E-05 3.0E-05 1.3E-05 4.3E-05Alkylated fluorenes 5.6E-07 1.3E-06 1.9E-06 0 4.2E-06 4.2E-06 1.8E-06 7.3E-07 2.5E-06Alkylated naphthalenes 1.6E-07 3.8E-07 5.4E-07 0 1.2E-06 1.2E-06 5.0E-07 2.1E-07 7.0E-07Alkylated phenanthrenes 6.5E-08 1.6E-07 2.2E-07 0 4.9E-07 4.9E-07 2.1E-07 8.5E-08 2.9E-07Aluminum 0.018 0.043 0.061 0 0.13 0.13 0.055 0.024 0.079Ammonia 0.0031 0.018 0.022 1.4E-04 0.062 0.062 0.041 0.010 0.051Ammonium ion 1.5E-04 6.2E-05 2.1E-04 0 1.0E-04 1.0E-04 3.1E-04 6.3E-05 3.7E-04Antimony 1.1E-05 2.6E-05 3.7E-05 0 8.3E-05 8.3E-05 3.5E-05 1.4E-05 4.9E-05Arsenic 5.4E-05 2.7E-04 3.3E-04 0 9.3E-04 9.3E-04 2.3E-04 1.5E-04 3.8E-04Barium 0.24 0.61 0.85 0 1.93 1.93 0.77 0.33 1.10Benzene 3.3E-04 0.0019 0.0023 0 0.0066 0.0066 0.0015 0.0011 0.0026Beryllium 3.0E-06 1.3E-05 1.6E-05 0 4.4E-05 4.4E-05 1.2E-05 7.3E-06 1.9E-05BOD 0.048 0.54 0.59 0 0.71 0.71 0.37 0.18 0.55Boron 6.1E-04 0.0036 0.0042 0 0.012 0.012 0.0028 0.0020 0.0048Bromide 0.042 0.25 0.29 0 0.85 0.85 0.19 0.14 0.33Cadmium 8.0E-06 4.1E-05 4.9E-05 0 1.4E-04 1.4E-04 3.4E-05 2.3E-05 5.7E-05Calcium 0.63 3.72 4.35 0 12.7 12.7 2.90 2.06 4.96Chlorides (methyl chloride) 7.9E-09 4.7E-08 5.4E-08 0 1.6E-07 1.6E-07 3.6E-08 2.6E-08 6.2E-08Chlorides (unspecified) 7.06 41.9 48.9 0 143 143 32.6 23.1 55.8Chromium (unspecified) 4.7E-04 0.0012 0.0017 0 0.0038 0.0038 0.0031 6.5E-04 0.0037Cobalt 4.3E-06 2.6E-05 3.0E-05 0 8.8E-05 8.8E-05 2.0E-05 1.4E-05 3.4E-05COD 0.13 0.27 0.39 0 0.95 0.95 0.64 0.15 0.79Copper 5.6E-05 2.3E-04 2.8E-04 0 7.2E-04 7.2E-04 2.1E-04 1.3E-04 3.4E-04Cresols 1.2E-05 6.8E-05 7.9E-05 0 2.3E-04 2.3E-04 5.4E-05 3.7E-05 9.1E-05Cyanide 1.0E-04 8.4E-08 1.0E-04 0 2.9E-07 2.9E-07 6.5E-08 4.6E-08 1.1E-07Cymene 2.0E-08 1.2E-07 1.4E-07 0 4.0E-07 4.0E-07 9.0E-08 6.4E-08 1.5E-07Detergents 9.1E-05 0 9.1E-05 0 0 0 0 0 0Dibenzofuran 3.7E-08 2.2E-07 2.6E-07 0 7.5E-07 7.5E-07 1.7E-07 1.2E-07 2.9E-07Dissolved organics 0.014 0 0.014 0 0 0 0 0 0Dissolved Solids 9.59 51.6 61.2 0.0017 177 177 40.3 28.5 68.8Ethylbenzene 1.8E-05 1.1E-04 1.3E-04 0 3.7E-04 3.7E-04 8.6E-05 6.0E-05 1.5E-04Fluorine/ Fluorides 0.0090 0.0010 0.010 0 0.0017 0.0017 1.3E-05 0.0010 0.0010Hardness 1.93 11.5 13.4 0 39.2 39.2 8.94 6.34 15.3Heavy Metals 0.0067 0 0.0067 0 0 0 0 0 0Hydrocarbons 2.0E-06 2.3E-04 2.3E-04 0 8.0E-04 8.0E-04 0 1.3E-04 1.3E-04Iron 0.035 0.11 0.15 6.7E-05 0.34 0.34 0.12 0.061 0.18Lead 1.2E-04 4.5E-04 5.7E-04 1.2E-07 0.0015 0.0015 4.3E-04 2.5E-04 6.8E-04Lead 210 2.0E-14 0 2.0E-14 0 0 0 9.4E-14 0 9.4E-14Lithium 2.1E-04 0.92 0.92 0 3.34 3.34 0.39 0.52 0.90Magnesium 0.12 0.73 0.85 0 2.49 2.49 0.57 0.40 0.97
Table 2-8
WATERBORNE EMISSIONS FOR SOFT DRINK CONTAINERS
Aluminum Can Glass Bottle PET Bottle
(lb per 100,000 Ounces of Soft Drink)(Page 1 of 2)
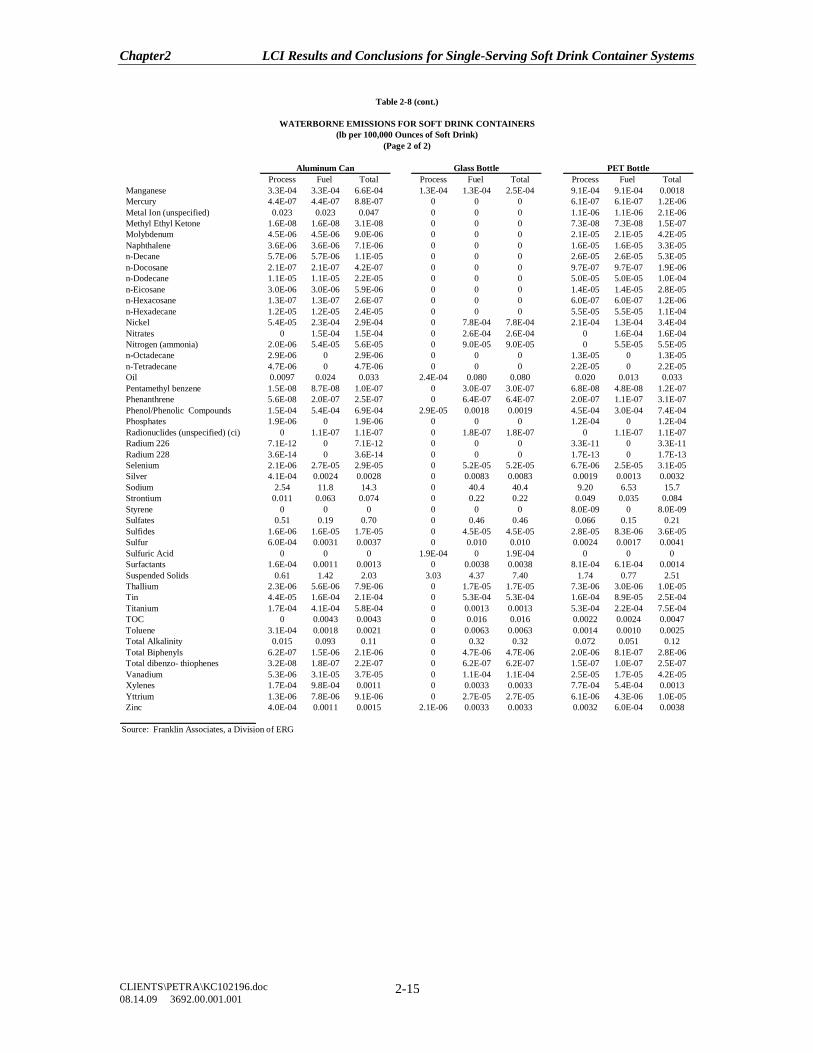
Chapter2 LCI Results and Conclusions for Single-Serving Soft Drink Container Systems
CLIENTS\PETRA\KC102196.doc 08.14.09 3692.00.001.001
2-15
Process Fuel Total Process Fuel Total Process Fuel TotalManganese 3.3E-04 3.3E-04 6.6E-04 1.3E-04 1.3E-04 2.5E-04 9.1E-04 9.1E-04 0.0018Mercury 4.4E-07 4.4E-07 8.8E-07 0 0 0 6.1E-07 6.1E-07 1.2E-06Metal Ion (unspecified) 0.023 0.023 0.047 0 0 0 1.1E-06 1.1E-06 2.1E-06Methyl Ethyl Ketone 1.6E-08 1.6E-08 3.1E-08 0 0 0 7.3E-08 7.3E-08 1.5E-07Molybdenum 4.5E-06 4.5E-06 9.0E-06 0 0 0 2.1E-05 2.1E-05 4.2E-05Naphthalene 3.6E-06 3.6E-06 7.1E-06 0 0 0 1.6E-05 1.6E-05 3.3E-05n-Decane 5.7E-06 5.7E-06 1.1E-05 0 0 0 2.6E-05 2.6E-05 5.3E-05n-Docosane 2.1E-07 2.1E-07 4.2E-07 0 0 0 9.7E-07 9.7E-07 1.9E-06n-Dodecane 1.1E-05 1.1E-05 2.2E-05 0 0 0 5.0E-05 5.0E-05 1.0E-04n-Eicosane 3.0E-06 3.0E-06 5.9E-06 0 0 0 1.4E-05 1.4E-05 2.8E-05n-Hexacosane 1.3E-07 1.3E-07 2.6E-07 0 0 0 6.0E-07 6.0E-07 1.2E-06n-Hexadecane 1.2E-05 1.2E-05 2.4E-05 0 0 0 5.5E-05 5.5E-05 1.1E-04Nickel 5.4E-05 2.3E-04 2.9E-04 0 7.8E-04 7.8E-04 2.1E-04 1.3E-04 3.4E-04Nitrates 0 1.5E-04 1.5E-04 0 2.6E-04 2.6E-04 0 1.6E-04 1.6E-04Nitrogen (ammonia) 2.0E-06 5.4E-05 5.6E-05 0 9.0E-05 9.0E-05 0 5.5E-05 5.5E-05n-Octadecane 2.9E-06 0 2.9E-06 0 0 0 1.3E-05 0 1.3E-05n-Tetradecane 4.7E-06 0 4.7E-06 0 0 0 2.2E-05 0 2.2E-05Oil 0.0097 0.024 0.033 2.4E-04 0.080 0.080 0.020 0.013 0.033Pentamethyl benzene 1.5E-08 8.7E-08 1.0E-07 0 3.0E-07 3.0E-07 6.8E-08 4.8E-08 1.2E-07Phenanthrene 5.6E-08 2.0E-07 2.5E-07 0 6.4E-07 6.4E-07 2.0E-07 1.1E-07 3.1E-07Phenol/Phenolic Compounds 1.5E-04 5.4E-04 6.9E-04 2.9E-05 0.0018 0.0019 4.5E-04 3.0E-04 7.4E-04Phosphates 1.9E-06 0 1.9E-06 0 0 0 1.2E-04 0 1.2E-04Radionuclides (unspecified) (ci) 0 1.1E-07 1.1E-07 0 1.8E-07 1.8E-07 0 1.1E-07 1.1E-07Radium 226 7.1E-12 0 7.1E-12 0 0 0 3.3E-11 0 3.3E-11Radium 228 3.6E-14 0 3.6E-14 0 0 0 1.7E-13 0 1.7E-13Selenium 2.1E-06 2.7E-05 2.9E-05 0 5.2E-05 5.2E-05 6.7E-06 2.5E-05 3.1E-05Silver 4.1E-04 0.0024 0.0028 0 0.0083 0.0083 0.0019 0.0013 0.0032Sodium 2.54 11.8 14.3 0 40.4 40.4 9.20 6.53 15.7Strontium 0.011 0.063 0.074 0 0.22 0.22 0.049 0.035 0.084Styrene 0 0 0 0 0 0 8.0E-09 0 8.0E-09Sulfates 0.51 0.19 0.70 0 0.46 0.46 0.066 0.15 0.21Sulfides 1.6E-06 1.6E-05 1.7E-05 0 4.5E-05 4.5E-05 2.8E-05 8.3E-06 3.6E-05Sulfur 6.0E-04 0.0031 0.0037 0 0.010 0.010 0.0024 0.0017 0.0041Sulfuric Acid 0 0 0 1.9E-04 0 1.9E-04 0 0 0Surfactants 1.6E-04 0.0011 0.0013 0 0.0038 0.0038 8.1E-04 6.1E-04 0.0014Suspended Solids 0.61 1.42 2.03 3.03 4.37 7.40 1.74 0.77 2.51Thallium 2.3E-06 5.6E-06 7.9E-06 0 1.7E-05 1.7E-05 7.3E-06 3.0E-06 1.0E-05Tin 4.4E-05 1.6E-04 2.1E-04 0 5.3E-04 5.3E-04 1.6E-04 8.9E-05 2.5E-04Titanium 1.7E-04 4.1E-04 5.8E-04 0 0.0013 0.0013 5.3E-04 2.2E-04 7.5E-04TOC 0 0.0043 0.0043 0 0.016 0.016 0.0022 0.0024 0.0047Toluene 3.1E-04 0.0018 0.0021 0 0.0063 0.0063 0.0014 0.0010 0.0025Total Alkalinity 0.015 0.093 0.11 0 0.32 0.32 0.072 0.051 0.12Total Biphenyls 6.2E-07 1.5E-06 2.1E-06 0 4.7E-06 4.7E-06 2.0E-06 8.1E-07 2.8E-06Total dibenzo- thiophenes 3.2E-08 1.8E-07 2.2E-07 0 6.2E-07 6.2E-07 1.5E-07 1.0E-07 2.5E-07Vanadium 5.3E-06 3.1E-05 3.7E-05 0 1.1E-04 1.1E-04 2.5E-05 1.7E-05 4.2E-05Xylenes 1.7E-04 9.8E-04 0.0011 0 0.0033 0.0033 7.7E-04 5.4E-04 0.0013Yttrium 1.3E-06 7.8E-06 9.1E-06 0 2.7E-05 2.7E-05 6.1E-06 4.3E-06 1.0E-05Zinc 4.0E-04 0.0011 0.0015 2.1E-06 0.0033 0.0033 0.0032 6.0E-04 0.0038
Source: Franklin Associates, a Division of ERG
WATERBORNE EMISSIONS FOR SOFT DRINK CONTAINERS
PET BottleGlass BottleAluminum Can
(lb per 100,000 Ounces of Soft Drink)(Page 2 of 2)
Table 2-8 (cont.)
Chapter2 LCI Results and Conclusions for Single-Serving Soft Drink Container Systems
CLIENTS\PETRA\KC102196.doc 08.14.09 3692.00.001.001
2-16
CONCLUSIONS This LCI determined the energy consumption, solid waste generation, and greenhouse gas emissions from three types of containers used for soft drinks. Conclusions within each of these categories are summarized below.
• There is a correlation between system weight and environmental burdens in the case of the glass system, which is the heaviest. This system requires the most energy and produces the most solid waste and greenhouse gases. However, this correlation does not hold up for the aluminum can, which is the lightest, but still requires more energy and produces more solid waste and greenhouse gases than the PET bottle.
• The majority of total energy for all systems occurs during the first two life cycle phases (cradle-to material and container fabrication).
• Although the aluminum can system is the lightest, the amount of energy required for smelting and sheet production countermands its weight advantage, and so the PET bottle system requires the lowest total energy.
• The aluminum can system has a lower fossil fuel profile (78 percent of the total energy comes from fossil fuels). Hydropower is commonly used for by primary aluminum smelters.
• The percentage of fossil fuel consumption is higher for the PET bottle system because plastics production uses petroleum and natural gas as raw materials.
• The glass produces the highest amount of total solid waste by both weight and volume; while the PET produces the lowest amount of total solid waste by both weight and volume.
• Even including the recycled content in the aluminum and glass systems, the weight of postconsumer waste is directly related to the weight of a container system.
• The conclusions for postconsumer solid waste are different when expressed on a volume basis instead of a weight basis. When the solid waste is expressed on a volume basis instead of a weight basis, the results for the glass bottle system are much closer to the results for the other two systems; this is due to the relatively high landfill density of glass. The glass system still uses the greatest amount of landfill space. However, due to the landfill densities of the aluminum and PET, the postconsumer solid waste for the aluminum and PET systems are not considered significantly different by volume.
• Greenhouse gas emissions are closely related to fossil fuel combustion and thus the LCI conclusions for energy also apply to greenhouse gas emissions.
Appendix A Study Approach and Methodology
CLIENTS\PETRA\KC102196.doc 08.14.09 3692.00.001.001
A-1
APPENDIX A STUDY APPROACH AND METHODOLOGY
INTRODUCTION The life cycle inventory presented in this study quantifies the total energy requirements, energy sources, atmospheric pollutants, waterborne pollutants, and solid waste resulting from the production of soft drink container systems. The methodology used for goal and scope definition and inventory analysis in this study is consistent with the methodology for Life Cycle Inventory (LCI)2 as described by the ISO 14040 and 14044 Standard documents, which were updated in 2006. This analysis is not an impact assessment. It does not attempt to determine the fate of emissions, or the relative risk to humans or to the environment due to emissions from the systems. In addition, no judgments are made as to the merit of obtaining natural resources from various sources. A life cycle inventory quantifies the energy consumption and environmental emissions (i.e., atmospheric emissions, waterborne wastes, and solid wastes) for a given product based upon the study scope and boundaries established. Figure A-1 illustrates the general approach used in an LCI analysis. This LCI is a cradle-to-grave analysis, covering steps from raw material extraction through container disposal. The information from this type of analysis can be used as the basis for further study of the potential improvement of resource use and environmental emissions associated with the product. It can also pinpoint areas (e.g., material components or processes) where changes would be most beneficial in terms of reduced energy use or environmental emissions. GOALS OF THE STUDY
The principal goal of this study is to evaluate the environmental footprint of the PET bottle and alternative containers used for soft drinks. It is likely that PETRA will also use the results of this study as a defense for possible defamatory statements made by producers, trade organizations or environmental groups affiliated with the alternative soft drink containers.
2 SETAC. 1991. A Technical Framework for Life-Cycle Assessment. Workshop report from the Smugglers
Notch, Vermont, USA, workshop held August 18-23, 1990.
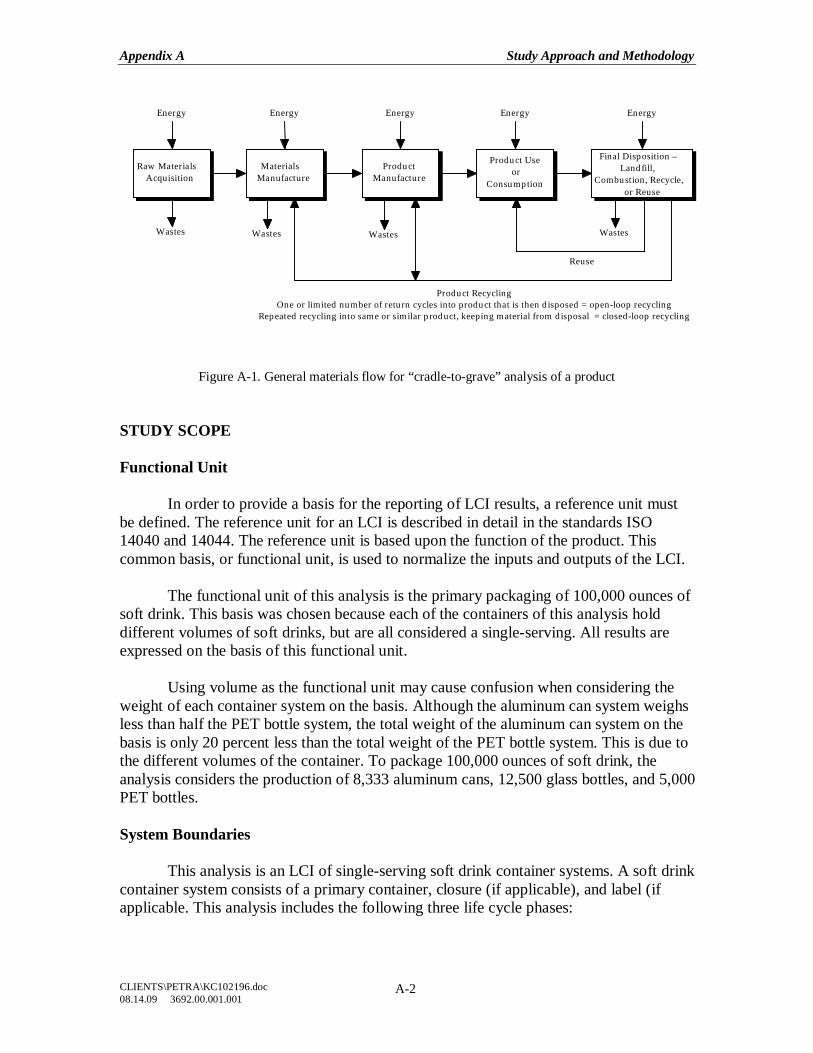
Appendix A Study Approach and Methodology
CLIENTS\PETRA\KC102196.doc 08.14.09 3692.00.001.001
A-2
Final Disposition – Landfill,
Combustion, Recycle, or Reuse
Raw Materials Acquisition
Materials Manufacture
Product Manufacture
Product Use or
Consumption
Energy Energy Energy Energy Energy
Wastes Wastes Wastes Wastes
Reuse
Product Recycling One or limited number of return cycles into product that is then disposed = open-loop recycling
Repeated recycling into same or similar product, keeping material from disposal = closed-loop recycling
Figure A-1. General materials flow for “cradle-to-grave” analysis of a product
STUDY SCOPE Functional Unit
In order to provide a basis for the reporting of LCI results, a reference unit must be defined. The reference unit for an LCI is described in detail in the standards ISO 14040 and 14044. The reference unit is based upon the function of the product. This common basis, or functional unit, is used to normalize the inputs and outputs of the LCI.
The functional unit of this analysis is the primary packaging of 100,000 ounces of soft drink. This basis was chosen because each of the containers of this analysis hold different volumes of soft drinks, but are all considered a single-serving. All results are expressed on the basis of this functional unit.
Using volume as the functional unit may cause confusion when considering the weight of each container system on the basis. Although the aluminum can system weighs less than half the PET bottle system, the total weight of the aluminum can system on the basis is only 20 percent less than the total weight of the PET bottle system. This is due to the different volumes of the container. To package 100,000 ounces of soft drink, the analysis considers the production of 8,333 aluminum cans, 12,500 glass bottles, and 5,000 PET bottles. System Boundaries
This analysis is an LCI of single-serving soft drink container systems. A soft drink container system consists of a primary container, closure (if applicable), and label (if applicable. This analysis includes the following three life cycle phases:
Appendix A Study Approach and Methodology
CLIENTS\PETRA\KC102196.doc 08.14.09 3692.00.001.001
A-3
Phase 1: Material production. This life cycle phase includes all processes from the extraction of raw materials through the production of materials in a form ready for fabrication into a soft drink container or associated closures and labels.
Phase 2: Fabrication. This life cycle phase includes the fabrication of containers, closures, and labels from the materials produced in the first life cycle phase. This life cycle phase does not include within its boundaries the transportation requirements from the fabrication site to the filling site.
Phase 3: Disposal and recycling. This life cycle phase includes the current U. S. recycling scenarios for the disposal of postconsumer materials. The disposal of postconsumer material includes the energy requirements for transporting materials to a landfill or waste-to-energy incinerator, the operation of heavy equipment at a landfill site, and the energy recovered by an incinerator; this analysis does not include incinerator emissions or the emissions from long-term landfill activity.
Description of Data Categories
Key elements of the LCI methodology include the resource inventory (raw materials and energy), emissions inventory (atmospheric, waterborne, and solid waste), and disposal practices.
Figure A-2 illustrates the basic approach to data development for each major process in an LCI analysis. This approach provides the essential building blocks of data used to construct a complete resource and environmental emissions inventory profile for the entire life cycle of a product. Using this approach, each individual process included in the study is examined as a closed system, or “black box”, by fully accounting for all resource inputs and process outputs associated with that particular process. Resource inputs accounted for in the LCI include raw materials and energy use, while process outputs accounted for include products manufactured and environmental emissions to land, air, and water.
Material Requirements. Once the LCI study boundaries have been defined and the individual processes identified, a material balance is performed for each individual process. This analysis identifies and quantifies the input raw materials required per standard unit of output, such as 1,000 pounds, for each individual process included in the LCI. The purpose of the material balance is to determine the appropriate weighting factors used in calculating the total energy requirements and environmental emissions associated with the systems studied. Energy requirements and environmental emissions are determined and expressed in terms of the standard unit of output.
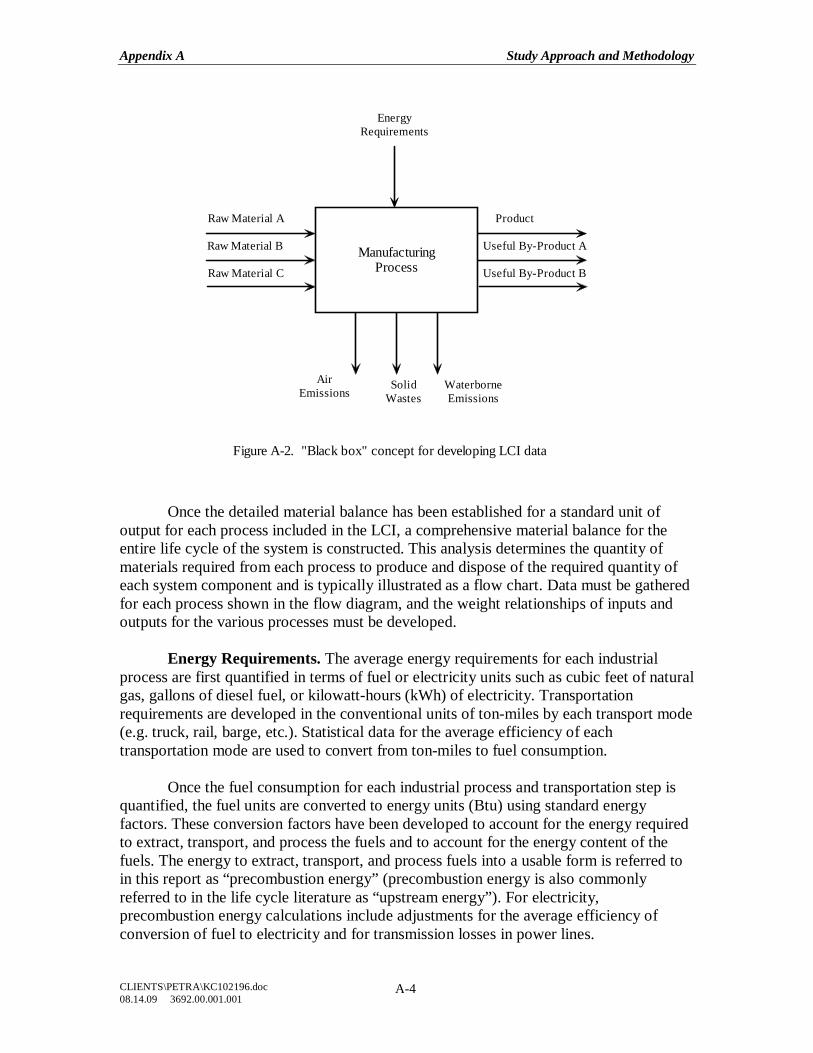
Appendix A Study Approach and Methodology
CLIENTS\PETRA\KC102196.doc 08.14.09 3692.00.001.001
A-4
Once the detailed material balance has been established for a standard unit of output for each process included in the LCI, a comprehensive material balance for the entire life cycle of the system is constructed. This analysis determines the quantity of materials required from each process to produce and dispose of the required quantity of each system component and is typically illustrated as a flow chart. Data must be gathered for each process shown in the flow diagram, and the weight relationships of inputs and outputs for the various processes must be developed.
Energy Requirements. The average energy requirements for each industrial process are first quantified in terms of fuel or electricity units such as cubic feet of natural gas, gallons of diesel fuel, or kilowatt-hours (kWh) of electricity. Transportation requirements are developed in the conventional units of ton-miles by each transport mode (e.g. truck, rail, barge, etc.). Statistical data for the average efficiency of each transportation mode are used to convert from ton-miles to fuel consumption.
Once the fuel consumption for each industrial process and transportation step is quantified, the fuel units are converted to energy units (Btu) using standard energy factors. These conversion factors have been developed to account for the energy required to extract, transport, and process the fuels and to account for the energy content of the fuels. The energy to extract, transport, and process fuels into a usable form is referred to in this report as “precombustion energy” (precombustion energy is also commonly referred to in the life cycle literature as “upstream energy”). For electricity, precombustion energy calculations include adjustments for the average efficiency of conversion of fuel to electricity and for transmission losses in power lines.
ManufacturingProcess
EnergyRequirements
AirEmissions
SolidWastes
WaterborneEmissions
Raw Material A
Raw Material B
Raw Material C
Product
Useful By-Product A
Useful By-Product B
Figure A-2. "Black box" concept for developing LCI data
Appendix A Study Approach and Methodology
CLIENTS\PETRA\KC102196.doc 08.14.09 3692.00.001.001
A-5
The LCI methodology assigns raw materials that are derived from fossil fuels
with their fuel-energy equivalent. Therefore, the total energy requirement for coal, natural gas, or petroleum-based raw materials includes the fuel energy of the material (called energy of material resource or inherent energy). No fuel-energy equivalent is assigned to combustible materials, such as wood, that are not major fuel sources in the United States. For example, in an LCI of paperboard, the calorific value of the wood fiber that is used to make the paperboard would not be included in the energy analysis.
The Btu values for fuels and electricity consumed in each industrial process are summed and categorized into an energy profile according to the six major energy sources listed below:
• Natural gas • Petroleum • Coal • Hydropower • Nuclear • Wood-derived
Also included in the systems energy profile are the Btu values for all transportation
steps and all fossil fuel-derived raw materials. An additional electricity generation category “Other” includes the portion of electricity generated from sources such as wind and solar power. Environmental Emissions. Environmental emissions include air pollutants, solid wastes, and waterborne wastes. Through various data sources identified later in this appendix, every effort is made to obtain actual industry data. Emission standards are often used as a guide when operating data are not available. It is not uncommon for data provided by some individual plants to be more complete than that submitted by others. Other factors, such as the measuring and reporting methods used, also affect the quality of air and waterborne emissions data. This makes comparison of the air and waterborne emissions between the systems more difficult. Comparisons of LCA databases have shown that airborne and waterborne pollutant emissions for a particular material production inventory can easily vary by 200 percent. Energy and solid waste values are generally more agreeable between databases. The best use of the detailed air and waterborne emissions data at this point in time is for internal improvement. A close look at the reason for certain air or waterborne pollutants within each system may identify areas where process or material changes could reduce emissions.
Substances may be reported in speciated or unspeciated form, depending on the compositional information available. General categories such as “Acid” and “Metal Ion” are used to report unspeciated data. Emissions are reported only in the most descriptive single category applicable; speciated data are not reported again in the broadly applicable
Appendix A Study Approach and Methodology
CLIENTS\PETRA\KC102196.doc 08.14.09 3692.00.001.001
A-6
unspeciated category. For example, emissions reported as “HCl” are not additionally reported under the category “Acid,” nor are emissions reported as “Chromium” additionally reported under “Metal Ion.”
The scope of this analysis is to identify what wastes are generated through a cradle-to-grave analysis of the system being examined. No attempt has been made to determine the relative environmental effects of these pollutants. Atmospheric Emissions. These emissions include carbon dioxide and all other substances classified as air pollutants. Emissions are reported as pounds of pollutant per functional unit. The amounts reported represent actual discharges into the atmosphere after existing emission control devices. The emissions associated with the combustion of fuel for process or transportation energy as well as the process emissions are included in the analysis. Some of the most commonly reported atmospheric emissions are particulates, nitrogen oxides, hydrocarbons, sulfur oxides, and carbon monoxide. In one case, the evaluation of greenhouse gas emissions, this study applies the LCI results to LCIA (life cycle impact assessment). Global warming potentials (GWP) are used to normalize various greenhouse gas emissions to the basis of carbon dioxide equivalents. The use of global warming potentials is a standard LCIA practice. Waterborne Wastes. As with atmospheric emissions, waterborne wastes include all substances classified as pollutants. Waterborne wastes are reported as pounds of pollutant per functional unit. The values reported are the average quantity of pollutants still present in the wastewater stream after wastewater treatment and represent discharges into receiving waters. Some of the most commonly reported waterborne wastes are biochemical oxygen demand (BOD), chemical oxygen demand (COD), suspended solids, dissolved solids, iron, chromium, acid, and ammonia. Solid Wastes. This category includes solid wastes generated from all sources that are landfilled or disposed in some other way. This also includes materials that are burned to ash at combustion facilities. It does not include materials that are recycled or coproducts. When a product is evaluated on an environmental basis, attention is often focused on postconsumer wastes. Industrial wastes generated during the manufacture of the product are sometimes overlooked. Industrial solid wastes include wastewater treatment sludges, solids collected in air pollution control devices, trim or waste materials from manufacturing operations that are not recycled, fuel combustion residues such as the ash generated by burning coal or wood, and mineral extraction wastes. Waste materials that are left on-site or diverted from landfill and returned to the land without treatment (e.g., overburden returned to mine site, forest residues left in the forest to decompose) are not reported as wastes.
Appendix A Study Approach and Methodology
CLIENTS\PETRA\KC102196.doc 08.14.09 3692.00.001.001
A-7
Inclusion of Inputs and Outputs Franklin Associates commonly uses a mass basis to decide if materials should be included in an analysis; however, it is recognized that use of mass exclusion criteria could result in oversight of minor constituents that are highly toxic. Before the decision is made to exclude a material from the study based on its mass, the analyst evaluates the likelihood of significant energy, solid waste, or emissions burdens associated with the material. Any material less than one percent of the mass in the system is generally considered negligible if its contributions are estimated to be negligible, based on the information available to the analyst. In some cases materials that have small mass but potentially significant burdens may have to be excluded from the study because of the unavailability of LCI data, particularly for proprietary or chemically complex substances; in such cases, the exclusions are specifically noted in the study limitations. Further discussion on this topic specific to this study can be found later in this chapter in the section System Components Not Included, subsection Miscellaneous Materials and Additives. DATA The accuracy of the study is only as good as the quality of input data. The development of methodology for the collection of data is essential to obtaining quality data. Careful adherence to that methodology determines not only data quality but also objectivity. Franklin Associates has developed a methodology for incorporating data quality and uncertainty into LCI calculations. Data quality and uncertainty are discussed in more detail at the end of this section. Data necessary for conducting this analysis are separated into two categories: process-related data and fuel-related data. Process Data Methodology for Collection/Verification. The process of gathering data is an iterative one. The data-gathering process for each system begins with a literature search to identify raw materials and processes necessary to produce the final product. The search is then extended to identify the raw materials and processes used to produce these raw materials. In this way, a flow diagram is systematically constructed to represent the production pathway of each system. Each process identified during the construction of the flow diagram is then researched to identify potential industry sources for data. Each source for process data is contacted and worksheets are provided to assist in gathering the necessary process data for their product. Each worksheet is accompanied by a description of the process boundaries.
Appendix A Study Approach and Methodology
CLIENTS\PETRA\KC102196.doc 08.14.09 3692.00.001.001
A-8
Upon receipt of the completed worksheets, the data are evaluated for completeness and reviewed for any material inputs that are additions or changes to the flow diagrams. In this way, the flow diagram is revised to represent current industrial practices. Data suppliers are then contacted again to discuss the data, process technology, waste treatment, identify coproducts, and any assumptions necessary to understand the data and boundaries. After each dataset has been completed and verified, the datasets for each process are aggregated into a single set of data for that process. The method of aggregation for each process is determined on a case-by-case basis. For example, if more than one process technology is involved, market shares for these processes are used to create a weighted average. In this way, a representative set of data can be estimated from a limited number of data sources. The provided process dataset and assumptions are then documented and returned with the aggregated data to each data supplier for their review. At times, the scope or budget of an analysis do not allow for primary data collection. In this case, secondary data sources are used. These sources may be other LCI databases, government documents, or literature sources. Confidentiality. Potential suppliers of data often consider the data requested in the worksheets proprietary. The method used to collect and review data provides each supplier the opportunity to review the aggregated average data calculated from all data supplied by industry. This allows each supplier to verify that their company’s data are not being published and that the averaged data are not aggregated in such a way that individual company data can be calculated or identified. Objectivity. Each unit process is researched independently of all other processes. No calculations are performed to link processes together with the production of their raw materials until after data gathering and review are complete. The procedure of providing the aggregated data and documentation to suppliers and other industry experts provides several opportunities to review the individual data sets without affecting the objectivity of the research. This process serves as an external expert review of each process. Also, because these data are reviewed individually, assumptions are reviewed based on their relevance to the process rather than their effect on the overall outcome of the study. Data Sources. The glass and steel process data sets used in this study were drawn from Franklin Associates’ U.S. LCI database, which was developed using the data collection and review process described above. The plastics and aluminum process data was taken from the US LCI Database. Data for the fabrication of plastic bottle, cap and label were based on a combination of data published by PlasticsEurope and data collected by Franklin Associates for confidential industry sources. While these sources include European data, Franklin Associates assumes that the energy requirements and solid waste generation associated with the blow molding of plastic bottles is similar for Europe and North America.
Appendix A Study Approach and Methodology
CLIENTS\PETRA\KC102196.doc 08.14.09 3692.00.001.001
A-9
Fuel Data When fuels are used for process or transportation energy, there are energy and emissions associated with the production and delivery of the fuels as well as the energy and emissions released when the fuels are burned. Before each fuel is usable, it must be mined, as in the case of coal or uranium, or extracted from the earth in some manner. Further processing is often necessary before the fuel is usable. For example, coal is crushed or pulverized and sometimes cleaned. Crude oil is refined to produce fuel oils, and “wet” natural gas is processed to produce natural gas liquids for fuel or feedstock. To distinguish between environmental emissions from the combustion of fuels and emissions associated with the production of fuels, different terms are used to describe the different emissions. The combustion products of fuels are defined as “combustion data.” Energy consumption and emissions that result from the mining, refining, and transportation of fuels are defined as “precombustion data.” Precombustion data and combustion data together are referred to as “fuel-related data.” Fuel-related data are developed for fuels that are burned directly in industrial furnaces, boilers, and transport vehicles. Fuel-related data are also developed for the production of electricity. These data are assembled into a database from which the energy requirements and environmental emissions for the production and combustion of process fuels are calculated. Energy data are developed in the form of units of each primary fuel required per unit of each fuel type. For electricity production, International Energy Agency statistical records provided data for the amount of fuel required to produce electricity from each fuel source and the total amount of electricity generated from petroleum, natural gas, coal, nuclear, hydropower, and other (solar, geothermal, etc.). Literature sources and U.S. federal government statistical records provided data for the emissions resulting from the combustion of fuels in utility boilers, industrial boilers, stationary equipment such as pumps and compressors, and transportation equipment. Because electricity is required to produce primary fuels, which are in turn used to generate electricity, a circular loop is created. Iteration techniques are utilized to resolve this loop. In 2003, Franklin Associates updated their fuels and energy database for inclusion in the U.S. LCI database. With the exception of the electricity fuel sources and generation, this U.S. fuels and energy database is used in this analysis. Data Quality Goals for This Study
ISO standards 14040 and 14044 detail various aspects of data quality and data quality analysis. These ISO Standards state: “Descriptions of data quality are important to understand the reliability of the study results and properly interpret the outcome of the study.” These ISO Standards list three critical data quality requirements: time-related coverage, geographical coverage, and technology coverage. Additional data quality
Appendix A Study Approach and Methodology
CLIENTS\PETRA\KC102196.doc 08.14.09 3692.00.001.001
A-10
descriptors that should be considered include whether primary or secondary data were used and whether the data were measured, calculated, or estimated.
The data quality goal for this study is to use the best available and most representative data for the materials used and processes performed in terms of time, geographic, and technology coverage.
All fuel data were reviewed and updated in 2003 for the United States. Electricity fuel sources and generation meet all the data quality goals. Data Accuracy An important issue to consider when using LCI study results is the reliability of the data. In a complex study with literally thousands of numeric entries, the accuracy of the data and how it affects conclusions is truly a complex subject, and one that does not lend itself to standard error analysis techniques. Techniques such as Monte Carlo analysis can be used to study uncertainty, but the greatest challenge is the lack of uncertainty data or probability distributions for key parameters, which are often only available as single point estimates. However, the reliability of the study can be assessed in other ways. A key question is whether the LCI profiles are accurate and study conclusions are correct. It is important that the environmental profiles accurately reflect the relative magnitude of energy requirements and other environmental burdens for the various materials analyzed.
The accuracy of an environmental profile depends on the accuracy of the numbers that are combined to arrive at that conclusion. Because of the many processes required to produce soft drink containers, many numbers in the LCI are added together for a total numeric result. Each number by itself may contribute little to the total, so the accuracy of each number by itself has a small effect on the overall accuracy of the total. There is no widely accepted analytical method for assessing the accuracy of each number to any degree of confidence. There are several other important points with regard to data accuracy. Each number generally contributes a small part to the total value, so a large error in one data point does not necessarily create a problem. For process steps that make a larger than average contribution to the total, special care is taken with the data quality. It is assumed that with careful scrutiny of the data, any errors will be random. That is, some numbers will be a little high due to errors, and some will be slightly low, but in the summing process these random high and low errors will offset each other to some extent. There is another dimension to the reliability of the data. Certain numbers do not stand alone, but rather affect several numbers in the system. An example is the amount of a raw material required for a process. This number will affect every step in the production sequence prior to the process. Errors such as this that propagate throughout the system are more significant in steps that are closest to the end of the production sequence. For
Appendix A Study Approach and Methodology
CLIENTS\PETRA\KC102196.doc 08.14.09 3692.00.001.001
A-11
example, changing the weight of an input to the fabrication of a container changes the amounts of the inputs to that process, and so on back to the quantities of raw materials.
In summary, for the particular data sources used and for the specific methodology described in this report, the results of this report are believed to be as accurate and reasonable as possible. METHODOLOGY
There is general consensus among life cycle practitioners on the fundamental methodology for performing LCIs, as described in ISO Standards 14040 and 14044, and the series of documents developed under the leadership of SETAC in Europe and the U.S3. For some specific aspects of life cycle inventory, however, there is more than one methodological approach that may be used. These areas include: the method used to allocate energy requirements and environmental releases among more than one useful product produced by a process; the method used to account for the energy contained in material feedstocks; recycling of materials; and greenhouse gas accounting. LCI practitioners vary to some extent in their approaches to these issues. The following sections describe the approach to each issue used in this study and the justification for the approach used. Coproduct Credit One unique feature of life cycle inventories is that the quantification of inputs and outputs are related to a specific amount of product from a process. However, controversy in LCI studies often occurs because it is sometimes difficult or impossible to identify which inputs and outputs are associated with one of multiple products from a process. The practice of allocating inputs and outputs among multiple products from a process is often referred to as “coproduct credit”4 or “partitioning”5.
Coproduct credit is done out of necessity when raw materials and emissions cannot be directly attributed to one of several product outputs from a system. It has long been recognized that the practice of giving coproduct credit is less desirable than being able to identify which inputs lead to particular outputs.
3 SETAC. 1993. Guidelines for Life-Cycle Assessment: A “Code of Practice.” 1st ed. Workshop report from the
Sesimbra, Portugal, workshop held March 31 through April 3, 1993. 4 Hunt, Robert G., Sellers, Jere D., and Franklin, William E. Resource and Environmental Profile Analysis: A
Life Cycle Environmental Assessment for Products and Procedures. Environmental Impact Assessment Review. 1992; 12:245-269.
5 Boustead, Ian. Eco-balance Methodology for Commodity Thermoplastics. A report for The Centre for Plastics in the Environment (PWMI). Brussels, Belgium. December, 1992.
Appendix A Study Approach and Methodology
CLIENTS\PETRA\KC102196.doc 08.14.09 3692.00.001.001
A-12
It is possible to divide a larger process into sub-processes. To use this approach, data must be available for sub-processes. In many cases, this may not be possible either due to the nature of the process or to less detailed data. Eventually, a sub-process will be reached where it is necessary to allocate energy and emissions among multiple products based on some calculated ratio. The method of calculating this ratio is subject to much discussion among LCA researchers, and various methods of calculating this ratio are discussed in literature.6,7,8,9,10 Where allocation of energy and emissions among multiple products based on a calculated ratio is necessary in this study, the ratio is calculated based on the relative mass outputs of products, which is the most common approach by experienced practitioners. Figure A-3 illustrates the concept of coproduct allocation on a mass basis. Energy of Material Resource For some raw materials, such as petroleum, natural gas, and coal, the amount consumed in all applications as fuel far exceeds the amount consumed as raw materials (feedstock) for products. The primary use of these materials is for energy. The total amount of these materials can be viewed as an energy pool or reserve. This concept is illustrated in Figure A-4. The use of a certain amount of these materials as feedstocks for products, rather than as fuels, removes that amount of material from the energy pool, thereby reducing the amount of energy available for consumption. This use of available energy as feedstock is called the “energy of material resource” and is included in the inventory. The energy of material resource represents the amount the energy pool is reduced by the consumption of fuel materials as raw materials in products and is quantified in energy units. The energy of material resource is the energy content of the fuel materials input as raw materials or feedstocks. The energy of material resource assigned to a material is not the energy value of the final product, but is the energy value of the raw material at the point of extraction from its natural environment. For fossil fuels, this definition is straightforward. For instance, petroleum is extracted in the form of crude oil. Therefore, the energy of material resource for petroleum is the higher heating value of crude oil.
6 Hunt, Robert G., Sellers, Jere D., and Franklin, William E. Resource and Environmental Profile Analysis: A
Life Cycle Environmental Assessment for Products and Procedures. Environmental Impact Assessment Review. 1992; 12:245-269.
7 Boustead, Ian. Eco-balance Methodology for Commodity Thermoplastics. A report for The Centre for Plastics in the Environment (PWMI). Brussels, Belgium. December, 1992.
8 SETAC. 1993. Guidelines for Life-Cycle Assessment: A “Code of Practice.” 1st ed. Workshop report from the Sesimbra, Portugal, workshop held March 31 through April 3, 1993.
9 Life-Cycle Assessment: Inventory Guidelines and Principles. Risk Reduction Engineering Laboratory, Office of Research and Development, United States Environmental Protection Agency. EPA/600/R-92/245. February, 1993.
10 Product Life Cycle Assessment–Principles and Methodology. Nord 1992:9. ISBN 92 9120 012 3.
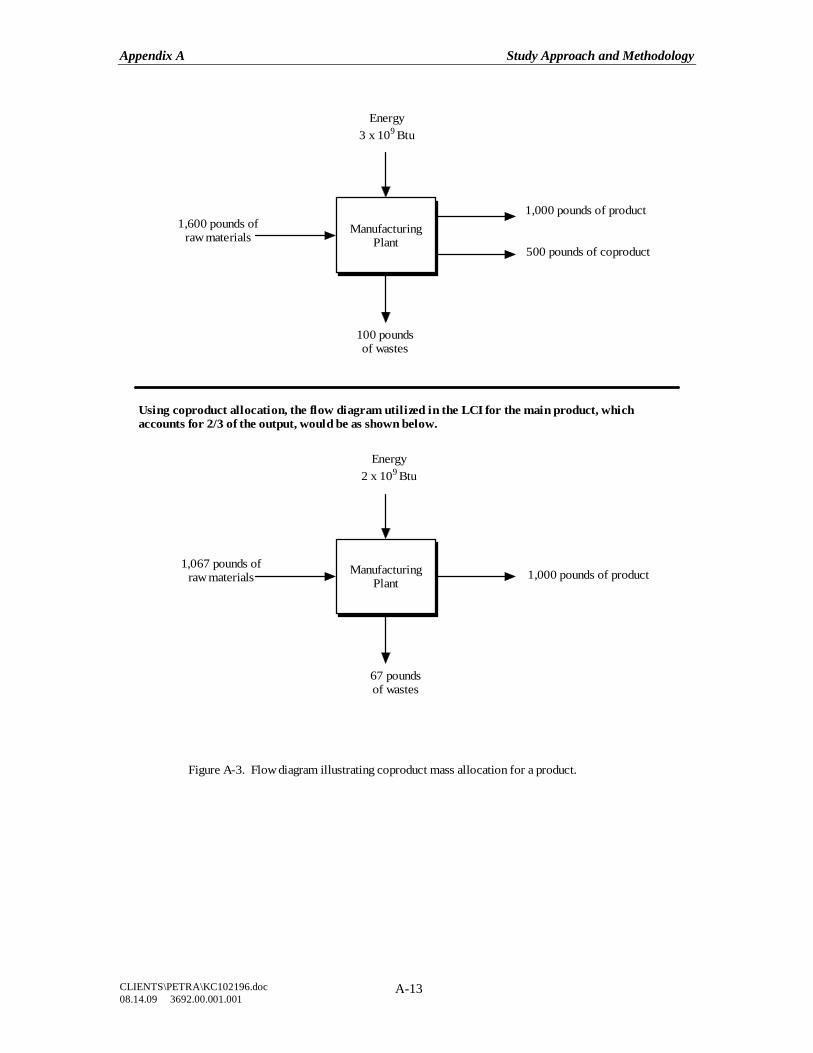
Appendix A Study Approach and Methodology
CLIENTS\PETRA\KC102196.doc 08.14.09 3692.00.001.001
A-13
ManufacturingPlant
ManufacturingPlant
1,600 pounds ofraw materials
Energy3 x 109 Btu
1,000 pounds of product
500 pounds of coproduct
100 poundsof wastes
Energy2 x 109 Btu
1,067 pounds ofraw materials 1,000 pounds of product
67 poundsof wastes
Figure A-3. Flow diagram illustrating coproduct mass allocation for a product.
Using coproduct allocation, the flow diagram utilized in the LCI for the main product, whichaccounts for 2/3 of the output, would be as shown below.
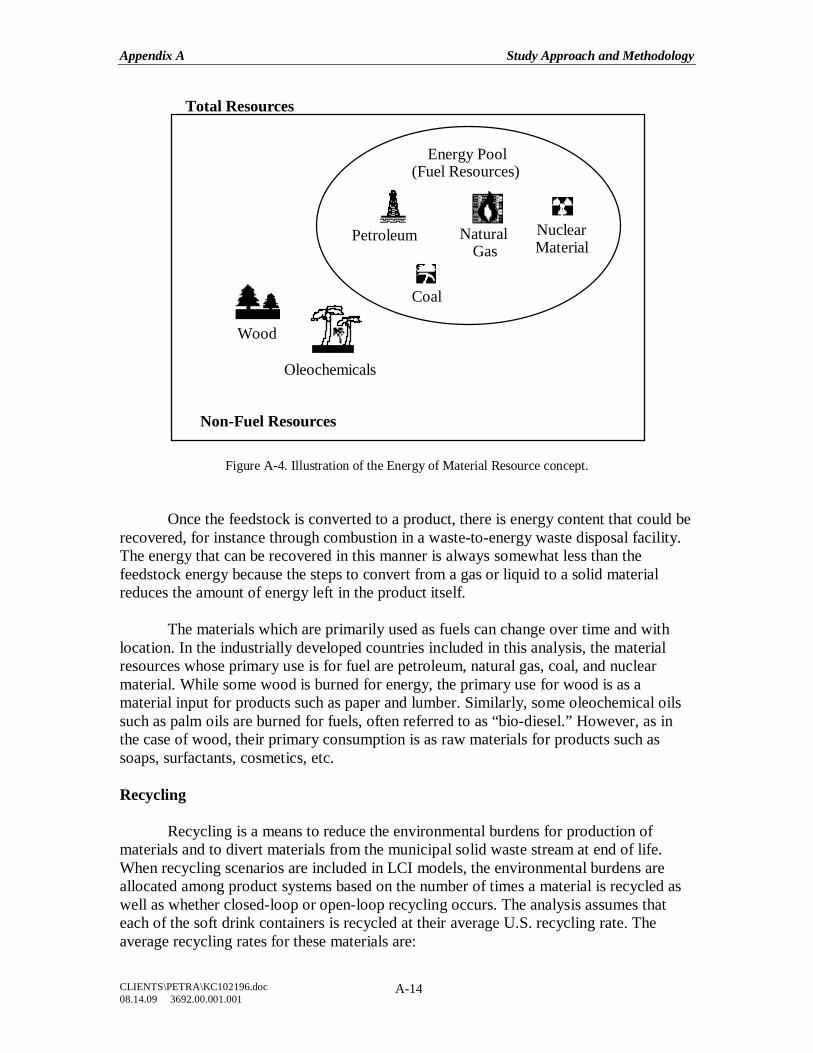
Appendix A Study Approach and Methodology
CLIENTS\PETRA\KC102196.doc 08.14.09 3692.00.001.001
A-14
Wood
Oleochemicals
Nuclear Material
Petroleum
Coal
Natural Gas
Energy Pool (Fuel Resources)
Non-Fuel Resources
Total Resources
Figure A-4. Illustration of the Energy of Material Resource concept. Once the feedstock is converted to a product, there is energy content that could be recovered, for instance through combustion in a waste-to-energy waste disposal facility. The energy that can be recovered in this manner is always somewhat less than the feedstock energy because the steps to convert from a gas or liquid to a solid material reduces the amount of energy left in the product itself. The materials which are primarily used as fuels can change over time and with location. In the industrially developed countries included in this analysis, the material resources whose primary use is for fuel are petroleum, natural gas, coal, and nuclear material. While some wood is burned for energy, the primary use for wood is as a material input for products such as paper and lumber. Similarly, some oleochemical oils such as palm oils are burned for fuels, often referred to as “bio-diesel.” However, as in the case of wood, their primary consumption is as raw materials for products such as soaps, surfactants, cosmetics, etc. Recycling Recycling is a means to reduce the environmental burdens for production of materials and to divert materials from the municipal solid waste stream at end of life. When recycling scenarios are included in LCI models, the environmental burdens are allocated among product systems based on the number of times a material is recycled as well as whether closed-loop or open-loop recycling occurs. The analysis assumes that each of the soft drink containers is recycled at their average U.S. recycling rate. The average recycling rates for these materials are:
Appendix A Study Approach and Methodology
CLIENTS\PETRA\KC102196.doc 08.14.09 3692.00.001.001
A-15
• Aluminum cans—45.1 percent • Glass bottles—30.7 percent • PET bottles—23.5 percent
The aluminum can and glass bottle recycling rates come from the 2007 EPA report, Municipal Solid Waste in the United States: 2006 Facts and Figures, while the PET bottle recycling rate comes from the 2007 NAPCOR report, 2006 Report on Post Consumer PET Container Recycling Activity.
The glass bottles and aluminum cans in this study include recycled content. According to The Aluminum Association and the Institute of Scrap Recycling Industries, Inc., the 2006 U.S. aluminum beverage can recycled content is 41.3 percent. According to a large private soft drink producer and filler, the glass soft drink bottle recycled content is approximately 30 percent.
Because aluminum and glass commodities may be recycled many times into similar products, it was assumed that the total recycled content amount is modeled using the closed loop recycling methodology (see Appendix C). The recycling rate amount greater than the recycled content amount is modeled using the open-loop recycling methodology. Greenhouse Gas Accounting
Emissions that contribute to global warming include carbon dioxide, methane, and nitrous oxide. Carbon dioxide emissions generally dominate life cycle greenhouse gas emission profiles. Although carbon dioxide emissions can come from a variety of life cycle processes, the predominant sources are combustion of fuels for process and transportation energy.
It is recognized that the combustion of postconsumer products in waste-to-energy facilities produces atmospheric and waterborne emissions; however, with the exception of theoretical carbon dioxide, these emissions are not included in this study. Allocating atmospheric and waterborne wastes from municipal combustion facilities to specific product systems is not feasible, due to the variety of materials present in combusted municipal solid waste. Theoretical carbon dioxide emissions from incinerated containers have been calculated based on their carbon content and assuming complete oxidation; however, this may not be an accurate representation of the results of mixed MSW combustion. This analysis does not account for end-of-life carbon sequestration from landfilling materials, nor does it include greenhouse gas emissions from decomposition of materials in landfills.
Appendix A Study Approach and Methodology
CLIENTS\PETRA\KC102196.doc 08.14.09 3692.00.001.001
A-16
GENERAL DECISIONS
Some general decisions are always necessary to limit a study such as this to a reasonable scope. It is important to know what those decisions are. The principal decisions and limitations for this study are discussed in the following sections. Geographic Scope
The systems in this analysis were modeled using Franklin Associates’ proprietary life cycle inventory databases and models. The Franklin Associates databases and models are based on U.S. data.
In the Franklin Associates’ database, there are a few data sets that include processes that occur outside of North America. Data for these processes are generally not available. This is usually only a consideration for the production of oil that is obtained from overseas. In cases such as this, the energy requirements and emissions are assumed to be the same as if the materials originated in North America. Since foreign standards and regulations vary from those in the United States, it is acknowledged that this assumption will likely introduce error. Emissions data for oil production include U.S. data for unflared methane emissions but do not include fossil carbon dioxide emissions from flaring of natural gas. In the U.S. flaring is usually done as a last resort to minimize the global warming impact of methane releases that are unavoidable or are too small to capture economically; however, methane flaring may be practiced to a greater extent in overseas countries. Fuel usage for transportation of materials from overseas locations is included in the study. Precombustion Energy and Emissions
In addition to the energy obtained from combustion of a fuel, energy is required for resource extraction, processing, and transportation to deliver the fuel in the form in which it is used. In this study, this additional energy is called precombustion energy. Precombustion energy refers to all the energy that must be expended to prepare and deliver the primary fuel. Adjustments for losses during transmission, spills, leaks, exploration, and drilling/mining operations are incorporated into the calculation of precombustion energy.
Precombustion environmental emissions (air, waterborne, and solid waste) are also associated with the acquisition, processing, and transportation of the primary fuel. These precombustion emissions are added to the emissions resulting from the burning of the fuels.
Appendix A Study Approach and Methodology
CLIENTS\PETRA\KC102196.doc 08.14.09 3692.00.001.001
A-17
Electricity Fuel Profile
In general, detailed data do not exist on the fuels used to generate the electricity consumed by each industry. However, aluminum is one industry that does track their specific electricity grid. Specific aluminum grids are used for bauxite mining, alumina production, and aluminum smelting/ingot casting. Electricity production and distribution systems in the United States are interlinked and are not easily separated. Users of electricity, in general, cannot specify the fuels used to produce their share of the electric power grid. Electricity generated on-site at a manufacturing facility is represented in the process data by the fuels used to produce it. A portion of on-site generated electricity is sold to the electricity grid. This portion is accounted for in the calculations for the fuel mix in the grid. System Components Not Included
The following components of each system are not included in this study: Capital Equipment. The energy and wastes associated with the manufacture of capital equipment are not included. This includes equipment to manufacture buildings, motor vehicles, and industrial machinery. These types of capital equipment are used to produce large quantities of product output over a useful life of many years. Thus, energy and emissions associated with production of these facilities and equipment generally become negligible when allocated to 1,000-pound product output modules. Space Conditioning. The fuels and power consumed to heat, cool, and light manufacturing establishments are omitted from the calculations in most cases. Space conditioning was not explicitly included in the scope of the study; however, primary LCI unit process data are often based on overall facility utility use and may include some space conditioning data.
For most industries, space conditioning energy is quite low compared to process energy. A possible exception may be processes that are relatively low in energy requirements but occupy large amounts of plant floor space, such as assembly line operations. U.S. Department of Energy data for the industrial sector indicates that non-process energy use including HVAC and lighting accounts for 10 -15 percent of the total end use fuel energy consumption in the case of electricity and natural gas (http://www.eia.doe.gov/emeu/mecs/mecs98/datatables/d98n6_4.htm). A significant amount of the overall industrial HVAC and lighting energy is likely for office areas, cafeteria space, etc. not directly associated with specific unit processes (see Support Personnel Requirements, below), as opposed to HVAC and lighting requirements for the plant floor space associated with specific unit processes.
Appendix A Study Approach and Methodology
CLIENTS\PETRA\KC102196.doc 08.14.09 3692.00.001.001
A-18
Support Personnel Requirements. The energy and wastes associated with research and development, sales, and administrative personnel or related activities have not been included in this study. Similar to space conditioning, energy requirements and related emissions are assumed to be quite small for support personnel activities. Miscellaneous Materials and Additives. Selected materials such as lacquers, inks, or other additives which total less than one percent of the net process inputs are often excluded from the inventory if their contributions are estimated to be negligible. Omitting miscellaneous materials and additives helps keep the scope of the study focused and manageable within budget and time constraints. Emissions from Combustion and Landfilling of Postconsumer Waste. It is recognized that the combustion of postconsumer products in waste-to-energy facilities produces atmospheric and waterborne emissions; however, with the exception of theoretical carbon dioxide, these emissions are not included in this study. Allocating atmospheric and waterborne wastes from municipal combustion facilities to specific product systems is not feasible, due to the variety of materials present in combusted municipal solid waste. Theoretical carbon dioxide emissions from incinerated packaging is calculated based on their carbon content and assuming complete oxidation; however, this may not be an accurate representation of the results of mixed MSW combustion. Therefore, other emissions from incineration of packaging components in mixed MSW are not included in the analysis. Historically, LCI studies have not included emissions from landfilled materials because of a lack of data of suitable quality. Emissions from landfills (particularly greenhouse gas emissions) are potentially important to consider in LCI calculations, but it is premature to report them along with other LCI emissions data until there is general agreement among experts on an acceptable methodology for estimating actual releases. Readers interested in this topic may wish to refer to the report EPA530-R-02-006, Solid Waste Management and Greenhouse Gases: A Life-Cycle Assessment of Emissions and Sinks, 2nd edition, May 2002, available at www.epa.gov. This report presents data on net GHG releases from WTE combustion and landfilling of various products and materials in municipal solid waste. It is beyond the scope of this study to attempt to evaluate the applicability of the EPA GHG methodology and models to the specific packaging components studied in this analysis.
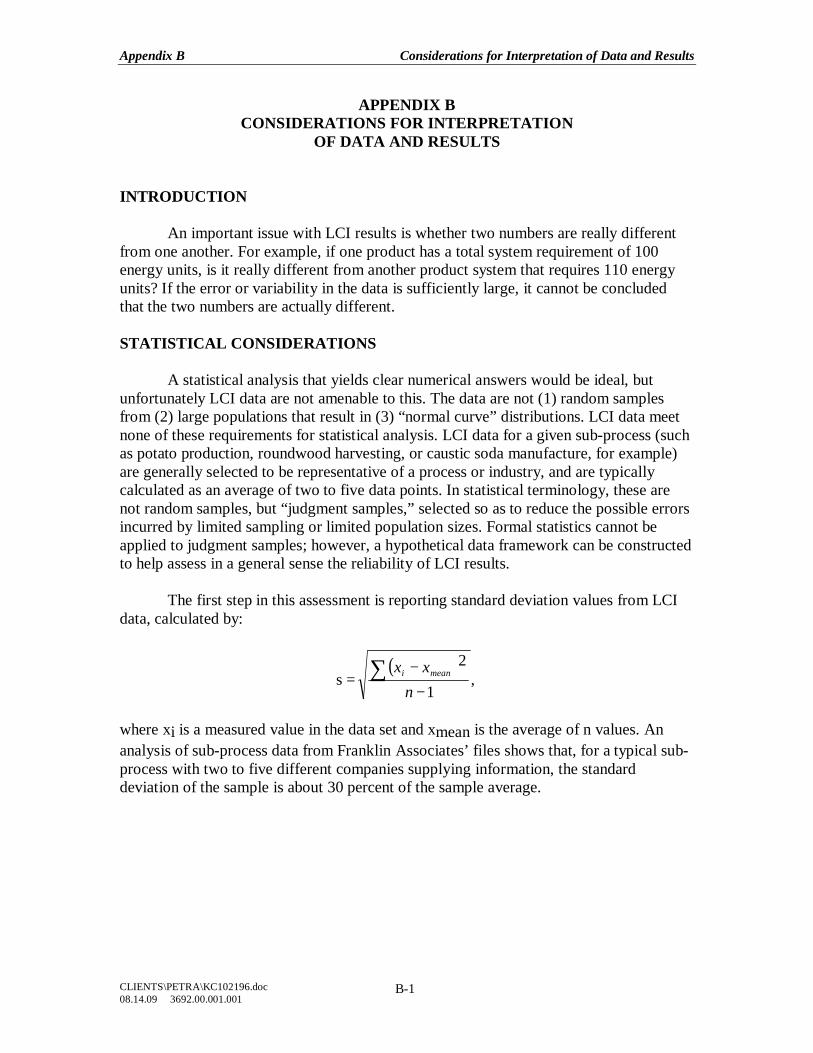
Appendix B Considerations for Interpretation of Data and Results
CLIENTS\PETRA\KC102196.doc 08.14.09 3692.00.001.001
B-1
APPENDIX B CONSIDERATIONS FOR INTERPRETATION
OF DATA AND RESULTS INTRODUCTION An important issue with LCI results is whether two numbers are really different from one another. For example, if one product has a total system requirement of 100 energy units, is it really different from another product system that requires 110 energy units? If the error or variability in the data is sufficiently large, it cannot be concluded that the two numbers are actually different. STATISTICAL CONSIDERATIONS A statistical analysis that yields clear numerical answers would be ideal, but unfortunately LCI data are not amenable to this. The data are not (1) random samples from (2) large populations that result in (3) “normal curve” distributions. LCI data meet none of these requirements for statistical analysis. LCI data for a given sub-process (such as potato production, roundwood harvesting, or caustic soda manufacture, for example) are generally selected to be representative of a process or industry, and are typically calculated as an average of two to five data points. In statistical terminology, these are not random samples, but “judgment samples,” selected so as to reduce the possible errors incurred by limited sampling or limited population sizes. Formal statistics cannot be applied to judgment samples; however, a hypothetical data framework can be constructed to help assess in a general sense the reliability of LCI results. The first step in this assessment is reporting standard deviation values from LCI data, calculated by:
s =( )
,1
2
−
−∑n
xx meani
where xi is a measured value in the data set and xmean is the average of n values. An analysis of sub-process data from Franklin Associates’ files shows that, for a typical sub-process with two to five different companies supplying information, the standard deviation of the sample is about 30 percent of the sample average.
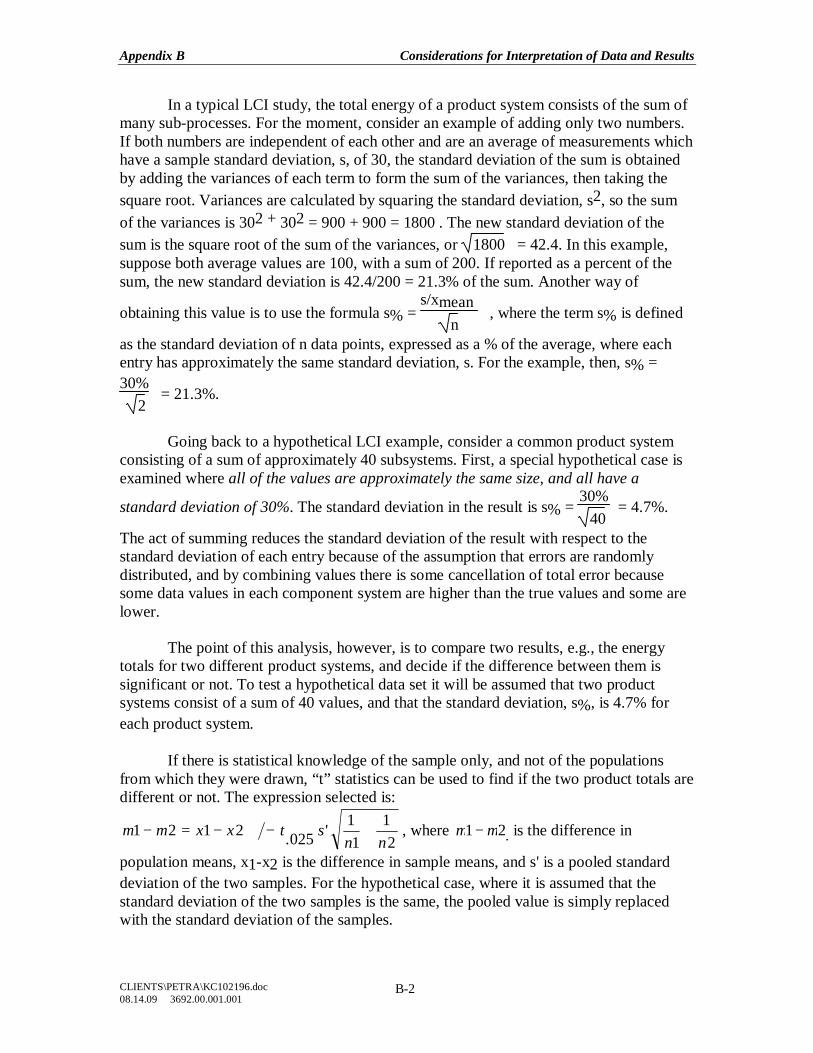
Appendix B Considerations for Interpretation of Data and Results
CLIENTS\PETRA\KC102196.doc 08.14.09 3692.00.001.001
B-2
In a typical LCI study, the total energy of a product system consists of the sum of many sub-processes. For the moment, consider an example of adding only two numbers. If both numbers are independent of each other and are an average of measurements which have a sample standard deviation, s, of 30, the standard deviation of the sum is obtained by adding the variances of each term to form the sum of the variances, then taking the square root. Variances are calculated by squaring the standard deviation, s2, so the sum of the variances is 302 + 302 = 900 + 900 = 1800 . The new standard deviation of the sum is the square root of the sum of the variances, or 1800 = 42.4. In this example, suppose both average values are 100, with a sum of 200. If reported as a percent of the sum, the new standard deviation is 42.4/200 = 21.3% of the sum. Another way of
obtaining this value is to use the formula s% = s/xmean
n , where the term s% is defined
as the standard deviation of n data points, expressed as a % of the average, where each entry has approximately the same standard deviation, s. For the example, then, s% = 30% 2
= 21.3%.
Going back to a hypothetical LCI example, consider a common product system consisting of a sum of approximately 40 subsystems. First, a special hypothetical case is examined where all of the values are approximately the same size, and all have a
standard deviation of 30%. The standard deviation in the result is s% = 30%
40 = 4.7%.
The act of summing reduces the standard deviation of the result with respect to the standard deviation of each entry because of the assumption that errors are randomly distributed, and by combining values there is some cancellation of total error because some data values in each component system are higher than the true values and some are lower. The point of this analysis, however, is to compare two results, e.g., the energy totals for two different product systems, and decide if the difference between them is significant or not. To test a hypothetical data set it will be assumed that two product systems consist of a sum of 40 values, and that the standard deviation, s%, is 4.7% for each product system. If there is statistical knowledge of the sample only, and not of the populations from which they were drawn, “t” statistics can be used to find if the two product totals are different or not. The expression selected is:
21
11'025.2121
nnstxx +−+−=− µµ , where 21 µµ − is the difference in
population means, x1-x2 is the difference in sample means, and s' is a pooled standard deviation of the two samples. For the hypothetical case, where it is assumed that the standard deviation of the two samples is the same, the pooled value is simply replaced with the standard deviation of the samples.
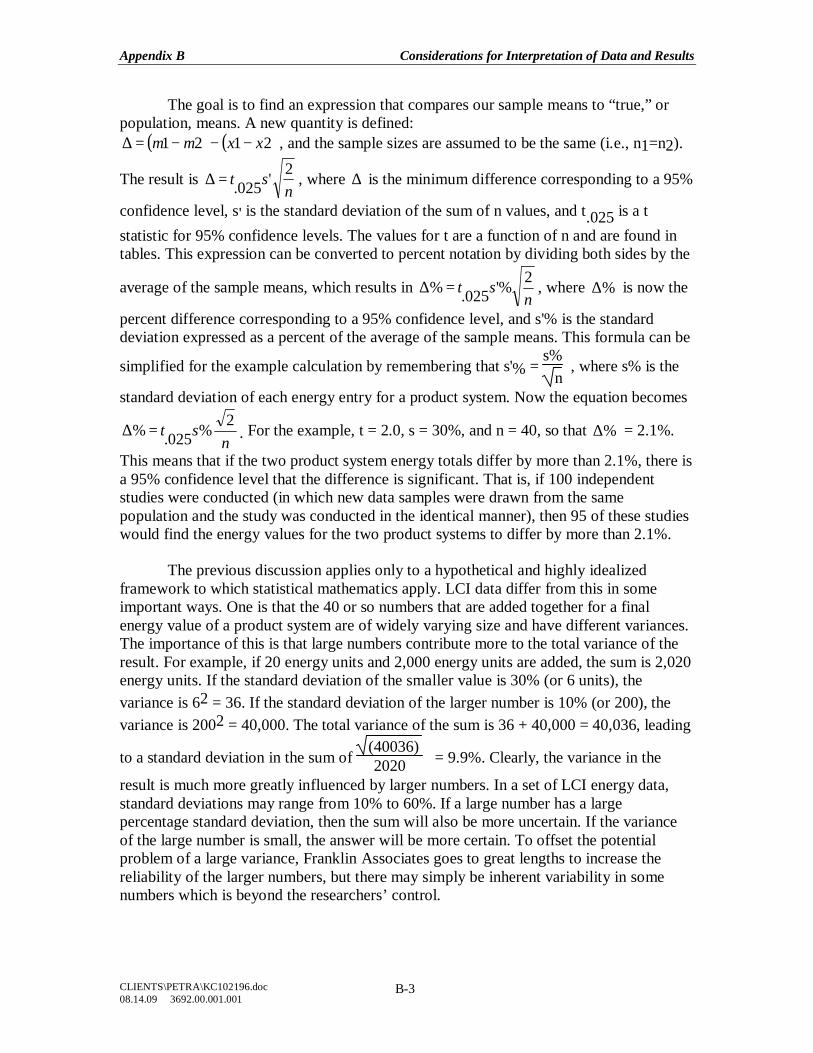
Appendix B Considerations for Interpretation of Data and Results
CLIENTS\PETRA\KC102196.doc 08.14.09 3692.00.001.001
B-3
The goal is to find an expression that compares our sample means to “true,” or population, means. A new quantity is defined:
( ) ( )2121 xx −−−=∆ µµ , and the sample sizes are assumed to be the same (i.e., n1=n2).
The result is n
st 2'025.=∆ , where ∆ is the minimum difference corresponding to a 95%
confidence level, s' is the standard deviation of the sum of n values, and t.025 is a t statistic for 95% confidence levels. The values for t are a function of n and are found in tables. This expression can be converted to percent notation by dividing both sides by the
average of the sample means, which results in n
st 2'%025.% =∆ , where %∆ is now the
percent difference corresponding to a 95% confidence level, and s'% is the standard deviation expressed as a percent of the average of the sample means. This formula can be
simplified for the example calculation by remembering that s'% = s%
n , where s% is the
standard deviation of each energy entry for a product system. Now the equation becomes
nst 2%025.% =∆ . For the example, t = 2.0, s = 30%, and n = 40, so that %∆ = 2.1%.
This means that if the two product system energy totals differ by more than 2.1%, there is a 95% confidence level that the difference is significant. That is, if 100 independent studies were conducted (in which new data samples were drawn from the same population and the study was conducted in the identical manner), then 95 of these studies would find the energy values for the two product systems to differ by more than 2.1%. The previous discussion applies only to a hypothetical and highly idealized framework to which statistical mathematics apply. LCI data differ from this in some important ways. One is that the 40 or so numbers that are added together for a final energy value of a product system are of widely varying size and have different variances. The importance of this is that large numbers contribute more to the total variance of the result. For example, if 20 energy units and 2,000 energy units are added, the sum is 2,020 energy units. If the standard deviation of the smaller value is 30% (or 6 units), the variance is 62 = 36. If the standard deviation of the larger number is 10% (or 200), the variance is 2002 = 40,000. The total variance of the sum is 36 + 40,000 = 40,036, leading
to a standard deviation in the sum of (40036) 2020 = 9.9%. Clearly, the variance in the
result is much more greatly influenced by larger numbers. In a set of LCI energy data, standard deviations may range from 10% to 60%. If a large number has a large percentage standard deviation, then the sum will also be more uncertain. If the variance of the large number is small, the answer will be more certain. To offset the potential problem of a large variance, Franklin Associates goes to great lengths to increase the reliability of the larger numbers, but there may simply be inherent variability in some numbers which is beyond the researchers’ control.
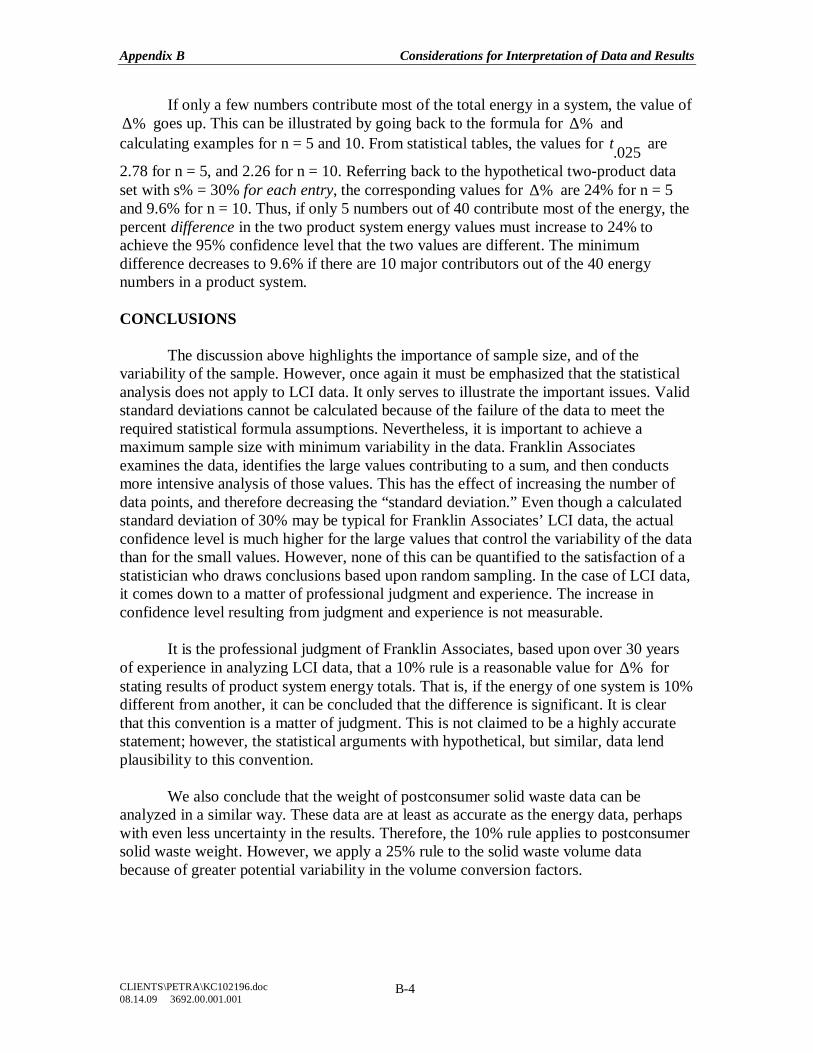
Appendix B Considerations for Interpretation of Data and Results
CLIENTS\PETRA\KC102196.doc 08.14.09 3692.00.001.001
B-4
If only a few numbers contribute most of the total energy in a system, the value of %∆ goes up. This can be illustrated by going back to the formula for %∆ and
calculating examples for n = 5 and 10. From statistical tables, the values for 025.t are
2.78 for n = 5, and 2.26 for n = 10. Referring back to the hypothetical two-product data set with s% = 30% for each entry, the corresponding values for %∆ are 24% for n = 5 and 9.6% for n = 10. Thus, if only 5 numbers out of 40 contribute most of the energy, the percent difference in the two product system energy values must increase to 24% to achieve the 95% confidence level that the two values are different. The minimum difference decreases to 9.6% if there are 10 major contributors out of the 40 energy numbers in a product system. CONCLUSIONS The discussion above highlights the importance of sample size, and of the variability of the sample. However, once again it must be emphasized that the statistical analysis does not apply to LCI data. It only serves to illustrate the important issues. Valid standard deviations cannot be calculated because of the failure of the data to meet the required statistical formula assumptions. Nevertheless, it is important to achieve a maximum sample size with minimum variability in the data. Franklin Associates examines the data, identifies the large values contributing to a sum, and then conducts more intensive analysis of those values. This has the effect of increasing the number of data points, and therefore decreasing the “standard deviation.” Even though a calculated standard deviation of 30% may be typical for Franklin Associates’ LCI data, the actual confidence level is much higher for the large values that control the variability of the data than for the small values. However, none of this can be quantified to the satisfaction of a statistician who draws conclusions based upon random sampling. In the case of LCI data, it comes down to a matter of professional judgment and experience. The increase in confidence level resulting from judgment and experience is not measurable. It is the professional judgment of Franklin Associates, based upon over 30 years of experience in analyzing LCI data, that a 10% rule is a reasonable value for %∆ for stating results of product system energy totals. That is, if the energy of one system is 10% different from another, it can be concluded that the difference is significant. It is clear that this convention is a matter of judgment. This is not claimed to be a highly accurate statement; however, the statistical arguments with hypothetical, but similar, data lend plausibility to this convention. We also conclude that the weight of postconsumer solid waste data can be analyzed in a similar way. These data are at least as accurate as the energy data, perhaps with even less uncertainty in the results. Therefore, the 10% rule applies to postconsumer solid waste weight. However, we apply a 25% rule to the solid waste volume data because of greater potential variability in the volume conversion factors.
Appendix B Considerations for Interpretation of Data and Results
CLIENTS\PETRA\KC102196.doc 08.14.09 3692.00.001.001
B-5
Air and water pollution and industrial solid waste data are not included in the 10% rule. Their variability is much higher. Data reported by similar plants may differ by a factor of two, or even a factor of ten or higher in some cases. Standard deviations may be as high as 150%, although 75% is typical. This translates to a hypothetical standard deviation in a final result of 12%, or a difference of at least 25% being required for a 95% confidence of two totals being different if 10 subsystems are major contributors to the final results. However, this rule applies only to single emission categories, and cannot be extended to general statements about environmental emissions resulting from a single product system. The interpretation of environmental emission data is further complicated by the fact that not all plants report the same emission categories, and that there is not an accepted method of evaluating the relative importance of various emissions. It is the intent of this appendix to convey an explanation of Franklin Associates’ 10% and 25% rules and establish their plausibility. Franklin Associates’ policy is to consider product system totals for energy and weight of postconsumer solid waste weight to be different if there is at least a 10% difference in the totals. Otherwise, the difference is considered to be insignificant. In the detailed tables of this report there are many specific pollutant categories that are variable between systems. For the air and waterborne emissions, industrial solid waste, and postconsumer solid waste volume, the 25% rule should be applied. The formula used to calculate the difference between two systems is:
% Diff =
x-y
x+y2
X 100,
where x and y are the summed totals of energy or waste for two product systems. The denominator of this expression is the average of the two values.
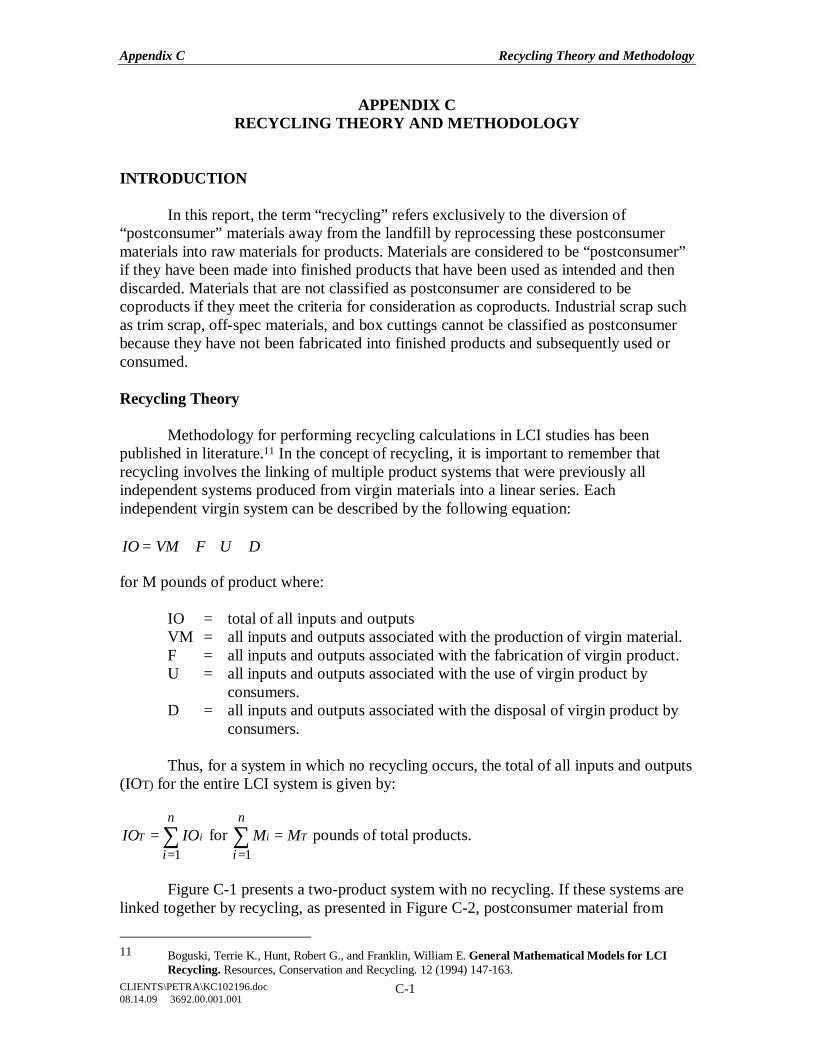
Appendix C Recycling Theory and Methodology
CLIENTS\PETRA\KC102196.doc 08.14.09 3692.00.001.001
C-1
APPENDIX C RECYCLING THEORY AND METHODOLOGY
INTRODUCTION In this report, the term “recycling” refers exclusively to the diversion of “postconsumer” materials away from the landfill by reprocessing these postconsumer materials into raw materials for products. Materials are considered to be “postconsumer” if they have been made into finished products that have been used as intended and then discarded. Materials that are not classified as postconsumer are considered to be coproducts if they meet the criteria for consideration as coproducts. Industrial scrap such as trim scrap, off-spec materials, and box cuttings cannot be classified as postconsumer because they have not been fabricated into finished products and subsequently used or consumed. Recycling Theory
Methodology for performing recycling calculations in LCI studies has been published in literature.11 In the concept of recycling, it is important to remember that recycling involves the linking of multiple product systems that were previously all independent systems produced from virgin materials into a linear series. Each independent virgin system can be described by the following equation: IO = VM + F + U + D for M pounds of product where: IO = total of all inputs and outputs VM = all inputs and outputs associated with the production of virgin material. F = all inputs and outputs associated with the fabrication of virgin product. U = all inputs and outputs associated with the use of virgin product by
consumers. D = all inputs and outputs associated with the disposal of virgin product by
consumers. Thus, for a system in which no recycling occurs, the total of all inputs and outputs (IOT) for the entire LCI system is given by:
IOT = IOi
i=1
n∑ for Mi
i =1
n∑ = MT pounds of total products.
Figure C-1 presents a two-product system with no recycling. If these systems are linked together by recycling, as presented in Figure C-2, postconsumer material from
11 Boguski, Terrie K., Hunt, Robert G., and Franklin, William E. General Mathematical Models for LCI
Recycling. Resources, Conservation and Recycling. 12 (1994) 147-163.
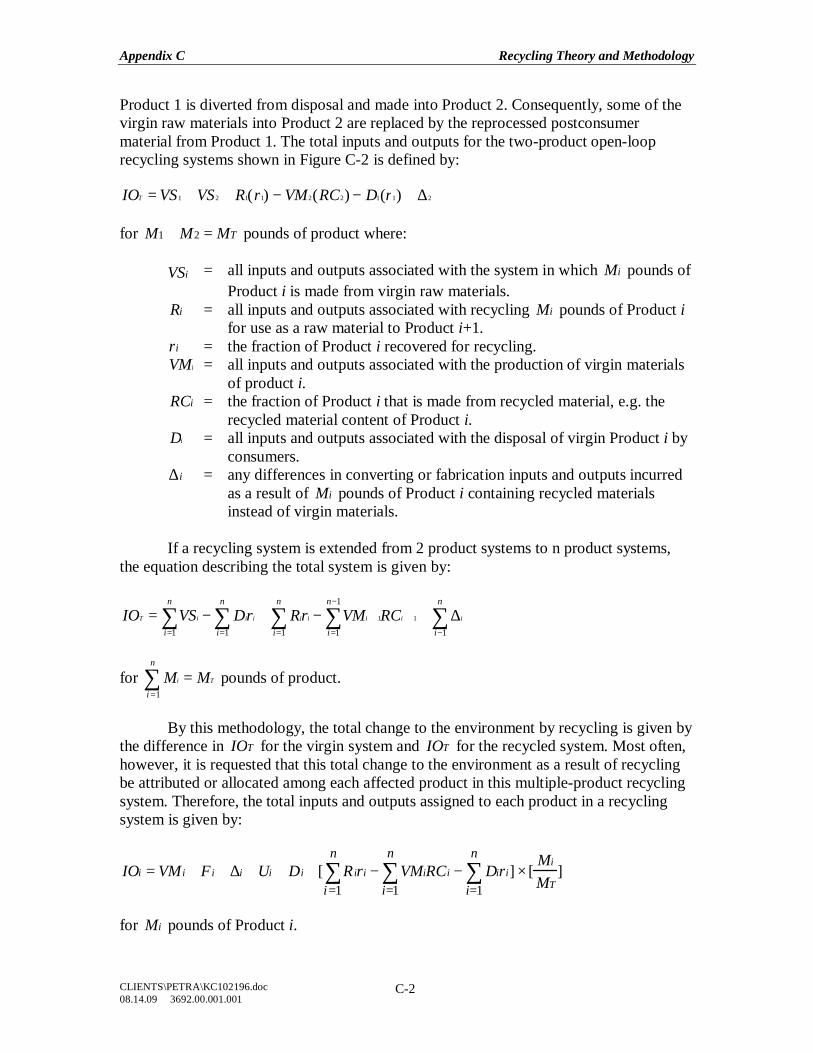
Appendix C Recycling Theory and Methodology
CLIENTS\PETRA\KC102196.doc 08.14.09 3692.00.001.001
C-2
Product 1 is diverted from disposal and made into Product 2. Consequently, some of the virgin raw materials into Product 2 are replaced by the reprocessed postconsumer material from Product 1. The total inputs and outputs for the two-product open-loop recycling systems shown in Figure C-2 is defined by: IOT = VS1 + VS2 + R1(r1) − VM2(RC2) − D1(r1) + ∆2 for M1 + M2 = MT pounds of product where:
VSi = all inputs and outputs associated with the system in which Mi pounds of Product i is made from virgin raw materials.
Ri = all inputs and outputs associated with recycling Mi pounds of Product i for use as a raw material to Product i+1.
ri = the fraction of Product i recovered for recycling. VMi = all inputs and outputs associated with the production of virgin materials
of product i. RCi = the fraction of Product i that is made from recycled material, e.g. the
recycled material content of Product i. Di = all inputs and outputs associated with the disposal of virgin Product i by
consumers. ∆i = any differences in converting or fabrication inputs and outputs incurred
as a result of Mi pounds of Product i containing recycled materials instead of virgin materials.
If a recycling system is extended from 2 product systems to n product systems, the equation describing the total system is given by:
∑∑∑∑∑−
−
====
∆+−+−= ++
n
i
n
i
n
i
n
i
n
iiiiiiiiiT RCVMrRrDVSIO
1
1
111111
for Mi
i =1
n
∑ = MT pounds of product.
By this methodology, the total change to the environment by recycling is given by the difference in IOT for the virgin system and IOT for the recycled system. Most often, however, it is requested that this total change to the environment as a result of recycling be attributed or allocated among each affected product in this multiple-product recycling system. Therefore, the total inputs and outputs assigned to each product in a recycling system is given by:
IOi = VM i + F i + ∆i + Ui + Di + [ R iri − VMiRCi − Diri] × [Mi
MT]
i=1
n∑
i=1
n∑
i=1
n∑
for Mi pounds of Product i.
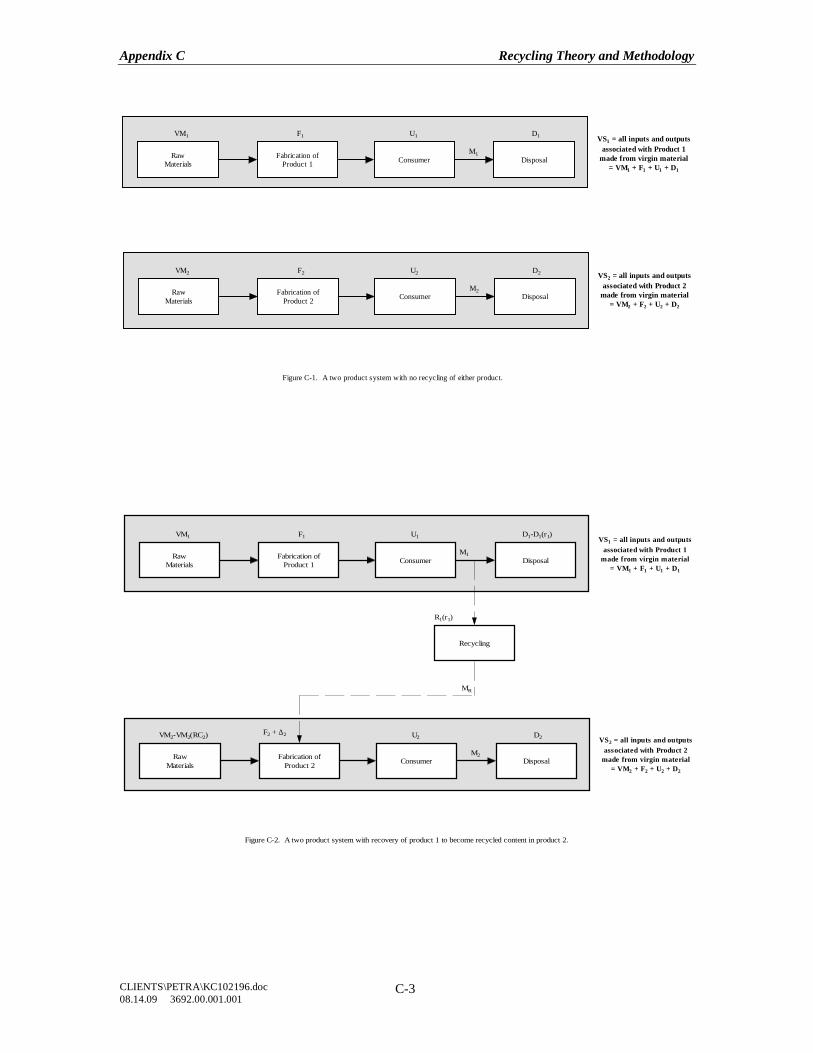
Appendix C Recycling Theory and Methodology
CLIENTS\PETRA\KC102196.doc 08.14.09 3692.00.001.001
C-3
VS1 = all inputs and outputsassociated with Product 1
made from virgin material= VM1 + F1 + U1 + D1
RawMaterials
Fabrication ofProduct 1 Consumer Disposal
VM1 F1 U1
M1
D1
VS2 = all inputs and outputsassociated with Product 2
made from virgin material= VM2 + F2 + U2 + D2
RawMaterials
Fabrication ofProduct 2 Consumer Disposal
VM2 F2 U2
M2
D2
Figure C-1. A two product system with no recycling of either product.
VS1 = all inputs and outputsassociated with Product 1
made from virgin material= VM1 + F1 + U1 + D1
RawMaterials
Fabrication ofProduct 1 Consumer Disposal
VM1 F1 U1
M1
D1-D1(r1)
VS2 = all inputs and outputsassociated with Product 2
made from virgin material= VM2 + F2 + U2 + D2
RawMaterials
Fabrication ofProduct 2 Consumer Disposal
VM2-VM2(RC2) F2 + ∆2 U2
M2
D2
Figure C-2. A two product system with recovery of product 1 to become recycled content in product 2.
Recycling
R1(r1)
MR
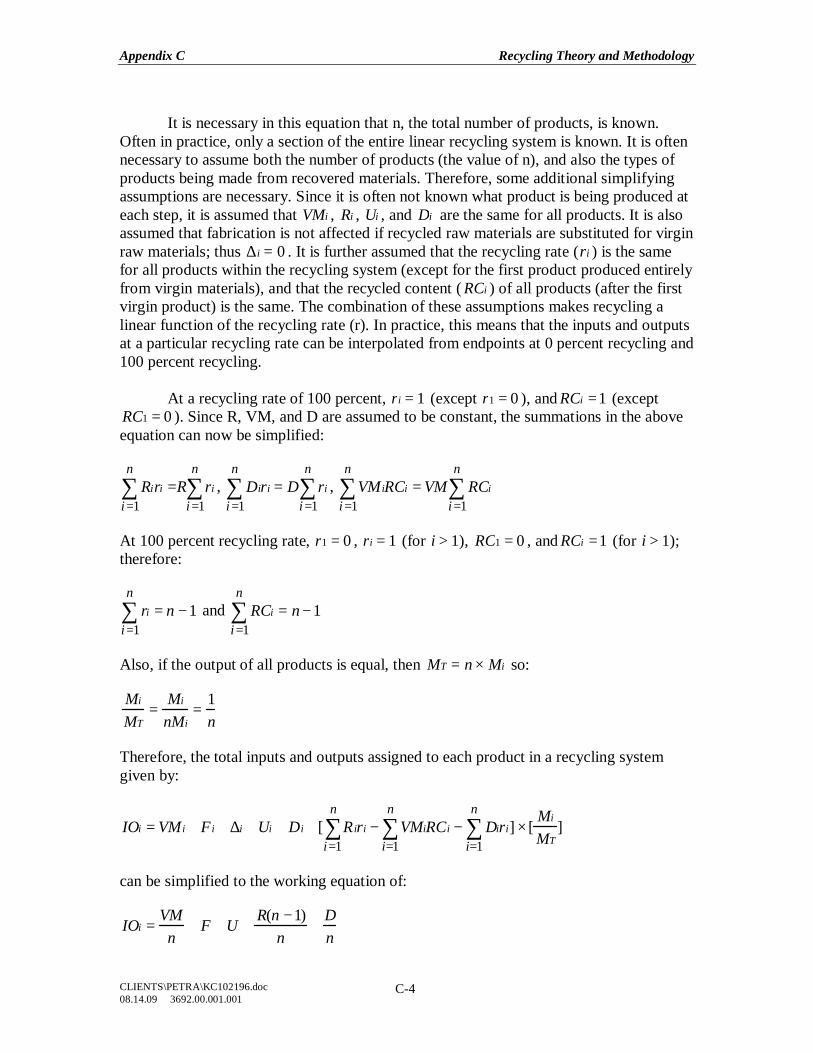
Appendix C Recycling Theory and Methodology
CLIENTS\PETRA\KC102196.doc 08.14.09 3692.00.001.001
C-4
It is necessary in this equation that n, the total number of products, is known. Often in practice, only a section of the entire linear recycling system is known. It is often necessary to assume both the number of products (the value of n), and also the types of products being made from recovered materials. Therefore, some additional simplifying assumptions are necessary. Since it is often not known what product is being produced at each step, it is assumed that VMi , Ri , Ui , and Di are the same for all products. It is also assumed that fabrication is not affected if recycled raw materials are substituted for virgin raw materials; thus ∆i = 0 . It is further assumed that the recycling rate (ri ) is the same for all products within the recycling system (except for the first product produced entirely from virgin materials), and that the recycled content ( RCi ) of all products (after the first virgin product) is the same. The combination of these assumptions makes recycling a linear function of the recycling rate (r). In practice, this means that the inputs and outputs at a particular recycling rate can be interpolated from endpoints at 0 percent recycling and 100 percent recycling. At a recycling rate of 100 percent, ri = 1 (except r1 = 0 ), and RCi =1 (except RC1 = 0 ). Since R, VM, and D are assumed to be constant, the summations in the above equation can now be simplified:
Riri =i =1
n∑ R ri
i =1
n∑ , Diri
i =1
n∑ = D ri
i =1
n∑ , VM iRCi
i =1
n∑ = VM RCi
i =1
n∑
At 100 percent recycling rate, r1 = 0 , ri = 1 (for i > 1), RC1 = 0 , and RCi =1 (for i > 1); therefore:
ri
i =1
n∑ = n − 1 and RCi
i =1
n∑ = n − 1
Also, if the output of all products is equal, then MT = n × Mi so: Mi
MT=
Mi
nMi=
1n
Therefore, the total inputs and outputs assigned to each product in a recycling system given by:
IOi = VM i + F i + ∆i + Ui + Di + [ R iri − VMiRCi − Diri] × [Mi
MT]
i=1
n∑
i=1
n∑
i=1
n∑
can be simplified to the working equation of:
IOi =VMn
+ F + U +R(n −1)
n+
Dn
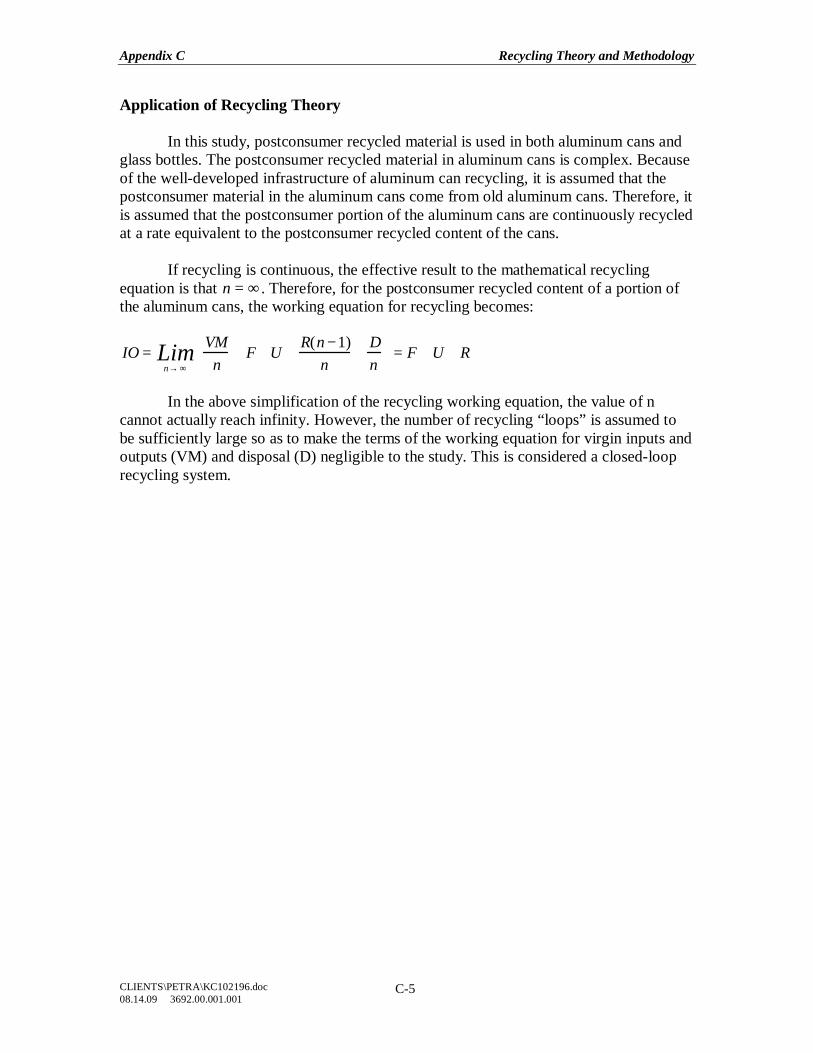
Appendix C Recycling Theory and Methodology
CLIENTS\PETRA\KC102196.doc 08.14.09 3692.00.001.001
C-5
Application of Recycling Theory
In this study, postconsumer recycled material is used in both aluminum cans and glass bottles. The postconsumer recycled material in aluminum cans is complex. Because of the well-developed infrastructure of aluminum can recycling, it is assumed that the postconsumer material in the aluminum cans come from old aluminum cans. Therefore, it is assumed that the postconsumer portion of the aluminum cans are continuously recycled at a rate equivalent to the postconsumer recycled content of the cans. If recycling is continuous, the effective result to the mathematical recycling equation is that n = ∞ . Therefore, for the postconsumer recycled content of a portion of the aluminum cans, the working equation for recycling becomes:
IO =n→ ∞
Lim VMn
+ F + U +R(n −1)
n+
Dn
= F + U + R
In the above simplification of the recycling working equation, the value of n cannot actually reach infinity. However, the number of recycling “loops” is assumed to be sufficiently large so as to make the terms of the working equation for virgin inputs and outputs (VM) and disposal (D) negligible to the study. This is considered a closed-loop recycling system.
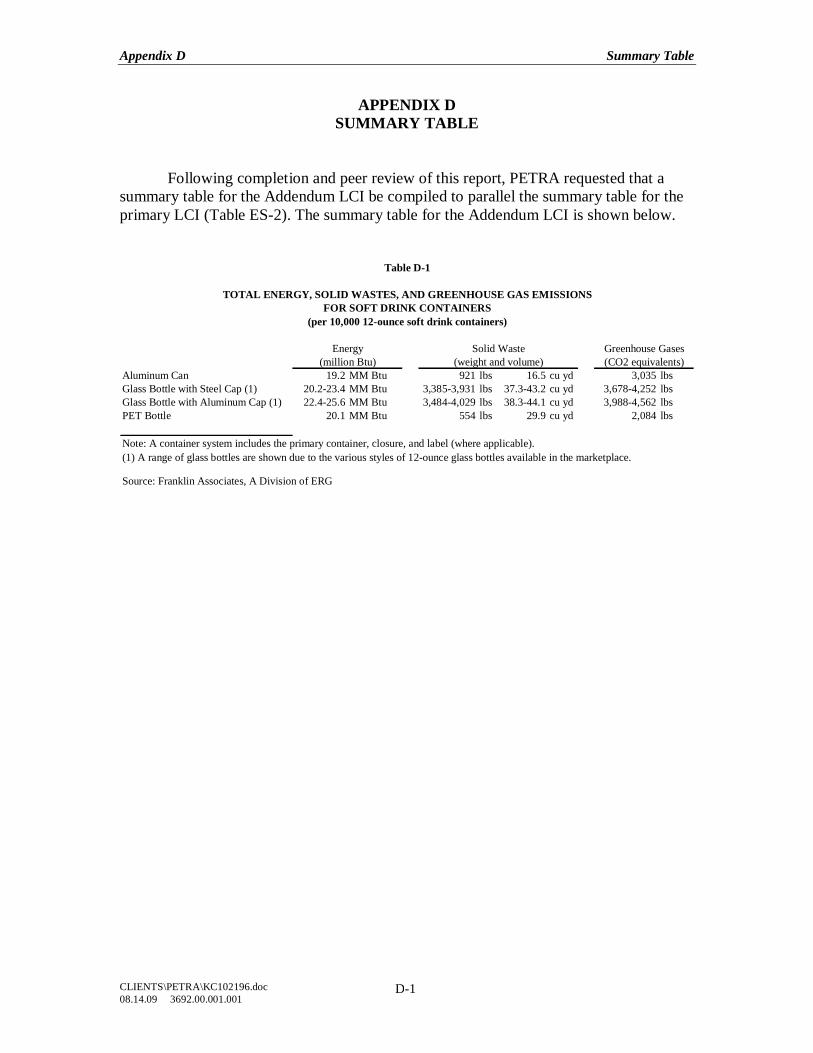
Appendix D Summary Table
CLIENTS\PETRA\KC102196.doc 08.14.09 3692.00.001.001
D-1
APPENDIX D SUMMARY TABLE
Following completion and peer review of this report, PETRA requested that a summary table for the Addendum LCI be compiled to parallel the summary table for the primary LCI (Table ES-2). The summary table for the Addendum LCI is shown below.
Aluminum Can 19.2 MM Btu 921 lbs 16.5 cu yd 3,035 lbsGlass Bottle with Steel Cap (1) 20.2-23.4 MM Btu 3,385-3,931 lbs 37.3-43.2 cu yd 3,678-4,252 lbsGlass Bottle with Aluminum Cap (1) 22.4-25.6 MM Btu 3,484-4,029 lbs 38.3-44.1 cu yd 3,988-4,562 lbsPET Bottle 20.1 MM Btu 554 lbs 29.9 cu yd 2,084 lbs
Note: A container system includes the primary container, closure, and label (where applicable). (1) A range of glass bottles are shown due to the various styles of 12-ounce glass bottles available in the marketplace.
Source: Franklin Associates, A Division of ERG
Energy Solid Waste Greenhouse Gases(million Btu) (weight and volume) (CO2 equivalents)
TOTAL ENERGY, SOLID WASTES, AND GREENHOUSE GAS EMISSIONSFOR SOFT DRINK CONTAINERS
(per 10,000 12-ounce soft drink containers)
Table D-1
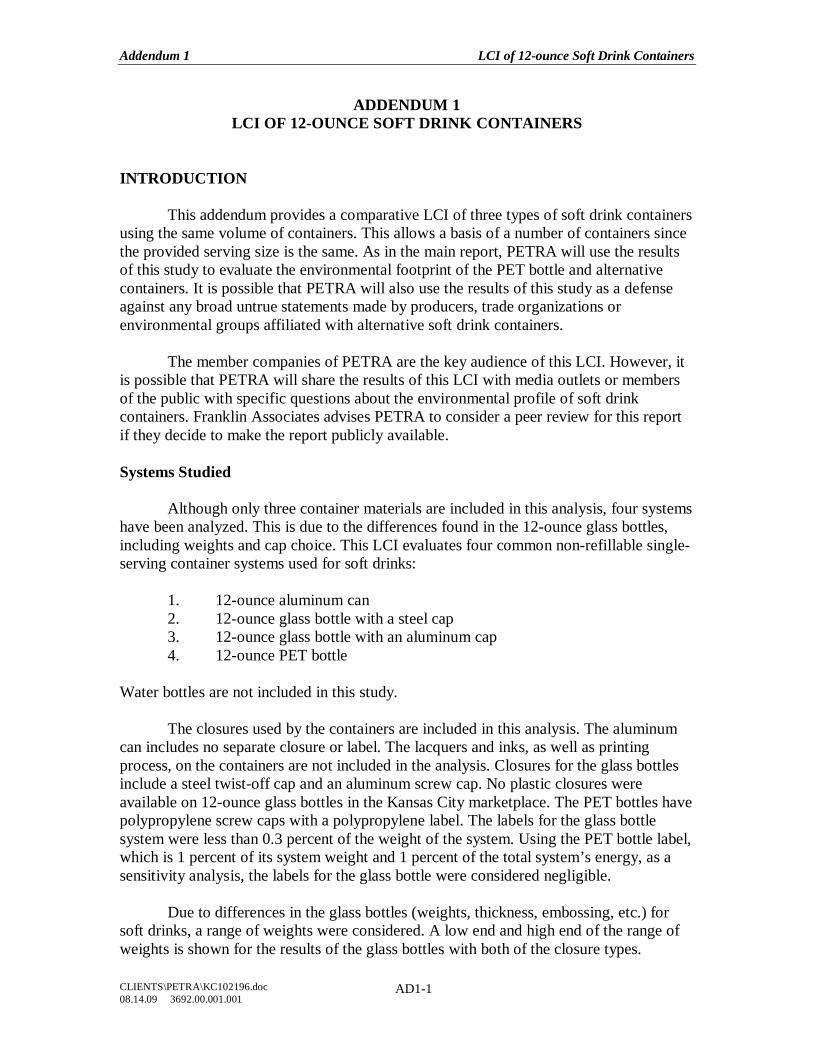
Addendum 1 LCI of 12-ounce Soft Drink Containers
CLIENTS\PETRA\KC102196.doc 08.14.09 3692.00.001.001
AD1-1
ADDENDUM 1 LCI OF 12-OUNCE SOFT DRINK CONTAINERS
INTRODUCTION
This addendum provides a comparative LCI of three types of soft drink containers using the same volume of containers. This allows a basis of a number of containers since the provided serving size is the same. As in the main report, PETRA will use the results of this study to evaluate the environmental footprint of the PET bottle and alternative containers. It is possible that PETRA will also use the results of this study as a defense against any broad untrue statements made by producers, trade organizations or environmental groups affiliated with alternative soft drink containers.
The member companies of PETRA are the key audience of this LCI. However, it is possible that PETRA will share the results of this LCI with media outlets or members of the public with specific questions about the environmental profile of soft drink containers. Franklin Associates advises PETRA to consider a peer review for this report if they decide to make the report publicly available. Systems Studied
Although only three container materials are included in this analysis, four systems have been analyzed. This is due to the differences found in the 12-ounce glass bottles, including weights and cap choice. This LCI evaluates four common non-refillable single-serving container systems used for soft drinks:
1. 12-ounce aluminum can 2. 12-ounce glass bottle with a steel cap 3. 12-ounce glass bottle with an aluminum cap 4. 12-ounce PET bottle
Water bottles are not included in this study.
The closures used by the containers are included in this analysis. The aluminum can includes no separate closure or label. The lacquers and inks, as well as printing process, on the containers are not included in the analysis. Closures for the glass bottles include a steel twist-off cap and an aluminum screw cap. No plastic closures were available on 12-ounce glass bottles in the Kansas City marketplace. The PET bottles have polypropylene screw caps with a polypropylene label. The labels for the glass bottle system were less than 0.3 percent of the weight of the system. Using the PET bottle label, which is 1 percent of its system weight and 1 percent of the total system’s energy, as a sensitivity analysis, the labels for the glass bottle were considered negligible.
Due to differences in the glass bottles (weights, thickness, embossing, etc.) for soft drinks, a range of weights were considered. A low end and high end of the range of weights is shown for the results of the glass bottles with both of the closure types.
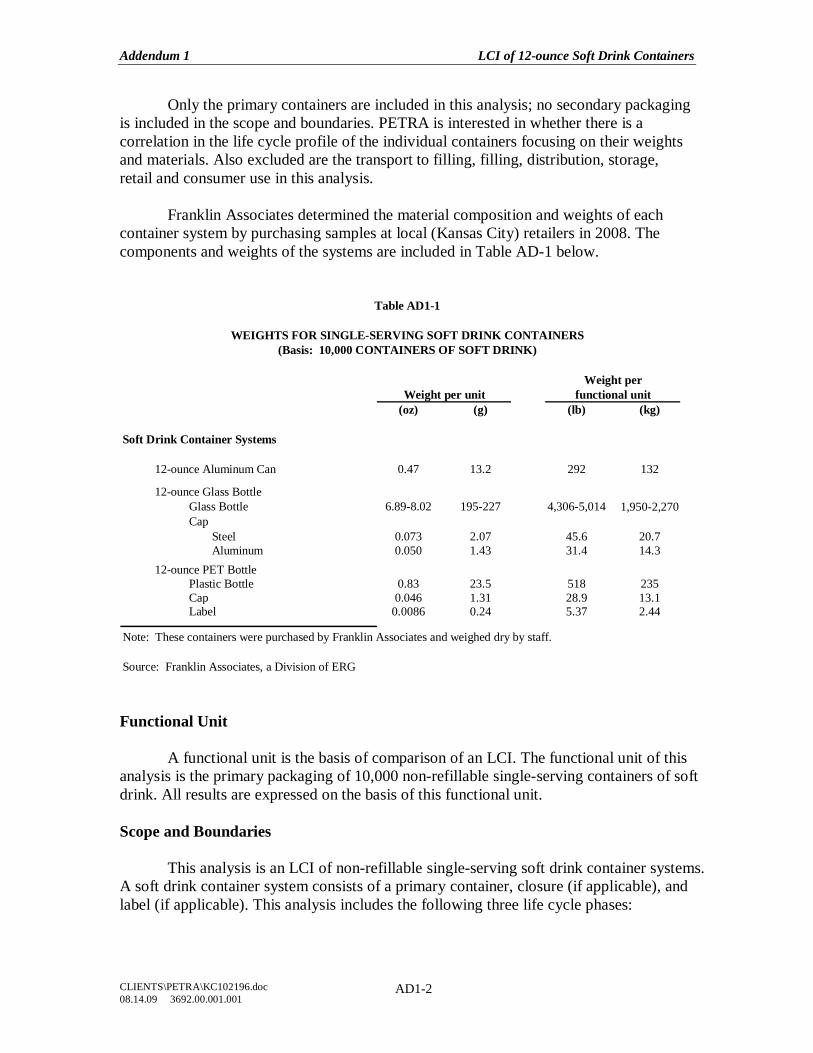
Addendum 1 LCI of 12-ounce Soft Drink Containers
CLIENTS\PETRA\KC102196.doc 08.14.09 3692.00.001.001
AD1-2
Only the primary containers are included in this analysis; no secondary packaging is included in the scope and boundaries. PETRA is interested in whether there is a correlation in the life cycle profile of the individual containers focusing on their weights and materials. Also excluded are the transport to filling, filling, distribution, storage, retail and consumer use in this analysis.
Franklin Associates determined the material composition and weights of each container system by purchasing samples at local (Kansas City) retailers in 2008. The components and weights of the systems are included in Table AD-1 below.
Weight perfunctional unit
(oz) (g) (lb) (kg)
Soft Drink Container Systems
12-ounce Aluminum Can 0.47 13.2 292 132
12-ounce Glass Bottle Glass Bottle 6.89-8.02 195-227 4,306-5,014 1,950-2,270Cap
Steel 0.073 2.07 45.6 20.7Aluminum 0.050 1.43 31.4 14.3
12-ounce PET BottlePlastic Bottle 0.83 23.5 518 235Cap 0.046 1.31 28.9 13.1Label 0.0086 0.24 5.37 2.44
Source: Franklin Associates, a Division of ERG
Note: These containers were purchased by Franklin Associates and weighed dry by staff.
Table AD1-1
WEIGHTS FOR SINGLE-SERVING SOFT DRINK CONTAINERS(Basis: 10,000 CONTAINERS OF SOFT DRINK)
Weight per unit
Functional Unit
A functional unit is the basis of comparison of an LCI. The functional unit of this analysis is the primary packaging of 10,000 non-refillable single-serving containers of soft drink. All results are expressed on the basis of this functional unit. Scope and Boundaries
This analysis is an LCI of non-refillable single-serving soft drink container systems. A soft drink container system consists of a primary container, closure (if applicable), and label (if applicable). This analysis includes the following three life cycle phases:
Addendum 1 LCI of 12-ounce Soft Drink Containers
CLIENTS\PETRA\KC102196.doc 08.14.09 3692.00.001.001
AD1-3
Phase 1: Material production. This life cycle phase includes all processes from the extraction of raw materials through the production of materials in a form ready for fabrication into a soft drink container or associated closures and labels.
Phase 2: Fabrication. This life cycle phase includes the fabrication of containers, closures, and labels from the materials produced in the first life cycle phase. This life cycle phase does not include within its boundaries the transportation requirements from the fabrication site to the filling site, nor the filling of the containers.
Phase 3: Disposal and recycling. This life cycle phase includes the current U. S. recycling scenarios for the disposal of postconsumer materials. The disposal of postconsumer material includes the energy requirements for transporting materials to a landfill or waste-to-energy incinerator, the operation of heavy equipment at a landfill site, and the energy recovered by an incinerator; this analysis does not include incinerator emissions or the emissions from long-term landfill activity.
Limitations and Assumptions The limitations and key assumptions of this analysis are the same as shown in Chapter 1 of the report with the following exceptions:
• A range of weights was used for the glass bottle. Three 12-ounce glass bottle sample types (e.g. bottles by different soft drink manufacturers) were weighed by Franklin Associates staff. Each sample type was unique compared to the others. These sample types are described below: § Thick brown glass bottle with no label and a steel twist-off cap (6
samples), § Clear glass bottle with a small plastic label and an aluminum screw
cap (4 samples), § Clear glass bottle with a coated paper label and a steel twist-off cap
(4 samples). Due to these differences, the range of the glass bottle weights has been modeled, and the two cap types have been shown as separate glass bottle systems in the results. It is assumed that either cap could be used for a glass bottle of any weight in the range.
• System components that comprise less than one percent of total system weight are excluded. This cut-off assumption is based on past LCI studies that demonstrate that materials that comprise less than one percent of system weight have a negligible affect on total LCI results. Examples of these components include the glass bottle label, printing inks and lacquers.
• The aluminum cap used with the glass bottle is assumed to be primary aluminum; this assumption is based on conversations with a private company using a similar aluminum cap. This was verified during peer review by two aluminum closure manufacturers.
• The aluminum can weights used in this analysis are identical to those used in the main report analysis.
Addendum 1 LCI of 12-ounce Soft Drink Containers
CLIENTS\PETRA\KC102196.doc 08.14.09 3692.00.001.001
AD1-4
• The weights of the PET bottles in this analysis were from an average of 16 PET bottles from 2 different soft drink producers and were weighed by Franklin Associates staff.
• Solid waste results can be expressed in terms of weight and volume. Landfills do not fill up because of the weight of materials, but because of the space occupied by the materials. This analysis assumes that plastic bottles and caps have landfill density of 355 pounds per cubic yard, plastic film has a landfill density of 667 pounds per cubic yard, aluminum cans and caps have a landfill density of 255 pounds per cubic yard, steel caps have a landfill density of 557 pounds per cubic yard, and that glass bottles have a landfill density of approximately 2800 pounds per cubic yard. Landfill density factors are based on landfill sampling studies (Estimates of the Volume of MSW and Selected Components in Trash Cans and Landfills, Prepared for The Council for Solid Waste Solutions by Franklin Associates, Ltd. and The Garbage Project. February 1990).
RESULTS
Franklin Associates’ policy is to consider product system totals for energy and weight of postconsumer solid waste weight to be different if there is at least a 10% difference in the totals. Otherwise, the difference is considered to be insignificant. For the air and waterborne emissions (including greenhouse gases), industrial solid waste, and postconsumer solid waste volume, the 25% rule should be applied. A detailed discussion of these ranges is provided in Appendix B of this report. The following sections discuss the categories of energy consumption, solid waste generation, and environmental emissions in detail. Energy by Category
The total energy requirements for each system include the energy for manufacturing and transporting materials at each life cycle phase, as well as the energy content of fuel resources used as raw materials.
Three energy categories are defined in this study: process energy, transport energy, and energy of material resource. Table AD-2 shows the LCI results according to these three energy categories.
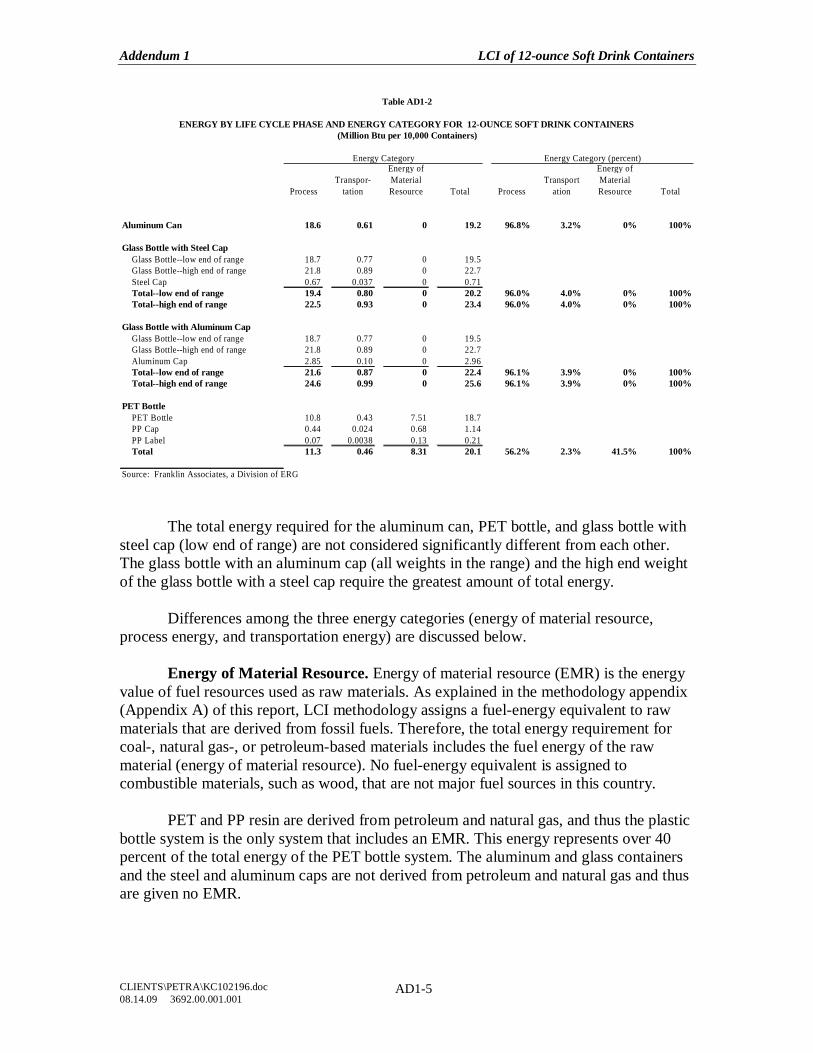
Addendum 1 LCI of 12-ounce Soft Drink Containers
CLIENTS\PETRA\KC102196.doc 08.14.09 3692.00.001.001
AD1-5
ProcessTranspor-
tation
Energy of Material Resource Total Process
Transportation
Energy of Material Resource Total
Aluminum Can 18.6 0.61 0 19.2 96.8% 3.2% 0% 100%
Glass Bottle with Steel CapGlass Bottle--low end of range 18.7 0.77 0 19.5Glass Bottle--high end of range 21.8 0.89 0 22.7Steel Cap 0.67 0.037 0 0.71Total--low end of range 19.4 0.80 0 20.2 96.0% 4.0% 0% 100%Total--high end of range 22.5 0.93 0 23.4 96.0% 4.0% 0% 100%
Glass Bottle with Aluminum CapGlass Bottle--low end of range 18.7 0.77 0 19.5Glass Bottle--high end of range 21.8 0.89 0 22.7Aluminum Cap 2.85 0.10 0 2.96Total--low end of range 21.6 0.87 0 22.4 96.1% 3.9% 0% 100%Total--high end of range 24.6 0.99 0 25.6 96.1% 3.9% 0% 100%
PET BottlePET Bottle 10.8 0.43 7.51 18.7PP Cap 0.44 0.024 0.68 1.14PP Label 0.07 0.0038 0.13 0.21Total 11.3 0.46 8.31 20.1 56.2% 2.3% 41.5% 100%
Source: Franklin Associates, a Division of ERG
Table AD1-2
ENERGY BY LIFE CYCLE PHASE AND ENERGY CATEGORY FOR 12-OUNCE SOFT DRINK CONTAINERS(Million Btu per 10,000 Containers)
Energy Category Energy Category (percent)
The total energy required for the aluminum can, PET bottle, and glass bottle with steel cap (low end of range) are not considered significantly different from each other. The glass bottle with an aluminum cap (all weights in the range) and the high end weight of the glass bottle with a steel cap require the greatest amount of total energy.
Differences among the three energy categories (energy of material resource, process energy, and transportation energy) are discussed below.
Energy of Material Resource. Energy of material resource (EMR) is the energy value of fuel resources used as raw materials. As explained in the methodology appendix (Appendix A) of this report, LCI methodology assigns a fuel-energy equivalent to raw materials that are derived from fossil fuels. Therefore, the total energy requirement for coal-, natural gas-, or petroleum-based materials includes the fuel energy of the raw material (energy of material resource). No fuel-energy equivalent is assigned to combustible materials, such as wood, that are not major fuel sources in this country.
PET and PP resin are derived from petroleum and natural gas, and thus the plastic bottle system is the only system that includes an EMR. This energy represents over 40 percent of the total energy of the PET bottle system. The aluminum and glass containers and the steel and aluminum caps are not derived from petroleum and natural gas and thus are given no EMR.
Addendum 1 LCI of 12-ounce Soft Drink Containers
CLIENTS\PETRA\KC102196.doc 08.14.09 3692.00.001.001
AD1-6
Process Energy. Process energy includes all energy used to extract and process raw materials into usable forms, manufacture the container systems, and manage postconsumer materials. Process energy accounts for more than 95 percent of the total energy for the aluminum and glass container systems. Process energy accounts for more than half the energy of the PET bottle system. The process energy for the PET bottle system is approximately 40 percent less than that of the aluminum can and glass bottle with steel cap (low weight) systems. The PET bottle systems process energy is close to half of that of the remaining glass bottle systems.
Transportation Energy. Transportation energy is the energy to transport materials among all processes from cradle to grave. Examples of the transportation steps included in this analysis include crude oil to refineries, resin pellets to fabricators, mined bauxite to alumina producers, and soda ash to glass factories. Transportation energy does not include transport to filling or distribution of the filled container.
Transportation comprises less than 5 percent of the total energy for all soft drink container systems. Note that if distribution and transport of the containers to filler were included this energy amount would be a greater percentage of the systems. The glass system requires the highest amount of transportation energy due to its heavy weight. The aluminum cans require a higher amount of transportation energy than the PET bottles due to the longer distances the bauxite and alumina must travel to reach the United States. Energy Profile
The total energy requirements for each system can also be categorized by the fuels from which energy is derived. Energy sources include fossil fuels (natural gas, petroleum, and coal) and non-fossil fuels. Non-fossil fuels include nuclear energy, hydroelectric energy, and energy produced from biomass or other alternatives. Table AD-3 shows the fuel profiles for the container systems.
The PET and glass bottles consume the highest percentages of fossil fuels. Approximately 93 to 96 percent of total energy for these two container systems is derived from fossil fuels. The high fossil fuel requirements of the PET bottle system are partly due to the petroleum and natural gas feedstocks used for material production. The fossil fuels from the glass bottle with steel cap system come from the fuels used in the mining of virgin raw materials for the glass as well as the natural gas used to produce the glass. When an aluminum cap is used on the glass bottle instead of a steel cap, the fossil fuels used in the glass bottle system increase as the aluminum cap is assumed to be primary aluminum, which requires a high amount of energy.
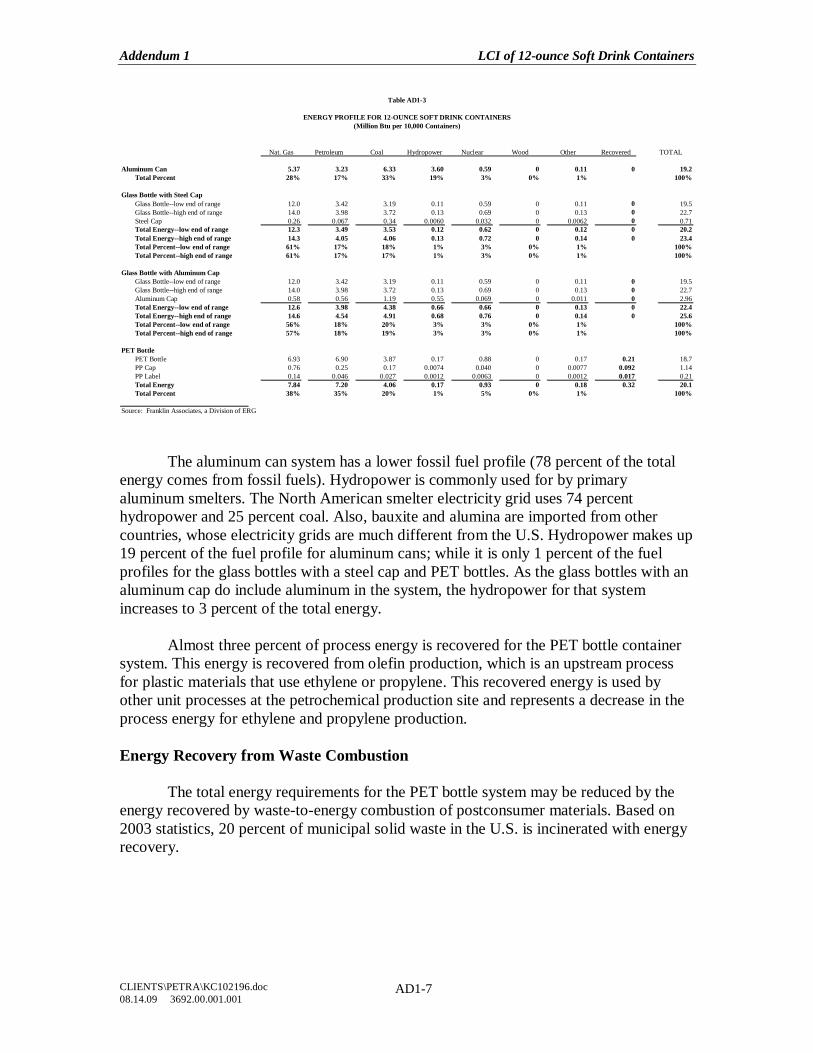
Addendum 1 LCI of 12-ounce Soft Drink Containers
CLIENTS\PETRA\KC102196.doc 08.14.09 3692.00.001.001
AD1-7
Nat. Gas Petroleum Coal Hydropower Nuclear Wood Other Recovered TOTAL
Aluminum Can 5.37 3.23 6.33 3.60 0.59 0 0.11 0 19.2Total Percent 28% 17% 33% 19% 3% 0% 1% 100%
Glass Bottle with Steel CapGlass Bottle--low end of range 12.0 3.42 3.19 0.11 0.59 0 0.11 0 19.5Glass Bottle--high end of range 14.0 3.98 3.72 0.13 0.69 0 0.13 0 22.7Steel Cap 0.26 0.067 0.34 0.0060 0.032 0 0.0062 0 0.71Total Energy--low end of range 12.3 3.49 3.53 0.12 0.62 0 0.12 0 20.2Total Energy--high end of range 14.3 4.05 4.06 0.13 0.72 0 0.14 0 23.4Total Percent--low end of range 61% 17% 18% 1% 3% 0% 1% 100%Total Percent--high end of range 61% 17% 17% 1% 3% 0% 1% 100%
Glass Bottle with Aluminum CapGlass Bottle--low end of range 12.0 3.42 3.19 0.11 0.59 0 0.11 0 19.5Glass Bottle--high end of range 14.0 3.98 3.72 0.13 0.69 0 0.13 0 22.7Aluminum Cap 0.58 0.56 1.19 0.55 0.069 0 0.011 0 2.96Total Energy--low end of range 12.6 3.98 4.38 0.66 0.66 0 0.13 0 22.4Total Energy--high end of range 14.6 4.54 4.91 0.68 0.76 0 0.14 0 25.6Total Percent--low end of range 56% 18% 20% 3% 3% 0% 1% 100%Total Percent--high end of range 57% 18% 19% 3% 3% 0% 1% 100%
PET BottlePET Bottle 6.93 6.90 3.87 0.17 0.88 0 0.17 0.21 18.7PP Cap 0.76 0.25 0.17 0.0074 0.040 0 0.0077 0.092 1.14PP Label 0.14 0.046 0.027 0.0012 0.0063 0 0.0012 0.017 0.21Total Energy 7.84 7.20 4.06 0.17 0.93 0 0.18 0.32 20.1Total Percent 38% 35% 20% 1% 5% 0% 1% 100%
Source: Franklin Associates, a Division of ERG
Table AD1-3
ENERGY PROFILE FOR 12-OUNCE SOFT DRINK CONTAINERS(Million Btu per 10,000 Containers)
The aluminum can system has a lower fossil fuel profile (78 percent of the total energy comes from fossil fuels). Hydropower is commonly used for by primary aluminum smelters. The North American smelter electricity grid uses 74 percent hydropower and 25 percent coal. Also, bauxite and alumina are imported from other countries, whose electricity grids are much different from the U.S. Hydropower makes up 19 percent of the fuel profile for aluminum cans; while it is only 1 percent of the fuel profiles for the glass bottles with a steel cap and PET bottles. As the glass bottles with an aluminum cap do include aluminum in the system, the hydropower for that system increases to 3 percent of the total energy.
Almost three percent of process energy is recovered for the PET bottle container system. This energy is recovered from olefin production, which is an upstream process for plastic materials that use ethylene or propylene. This recovered energy is used by other unit processes at the petrochemical production site and represents a decrease in the process energy for ethylene and propylene production. Energy Recovery from Waste Combustion
The total energy requirements for the PET bottle system may be reduced by the energy recovered by waste-to-energy combustion of postconsumer materials. Based on 2003 statistics, 20 percent of municipal solid waste in the U.S. is incinerated with energy recovery.
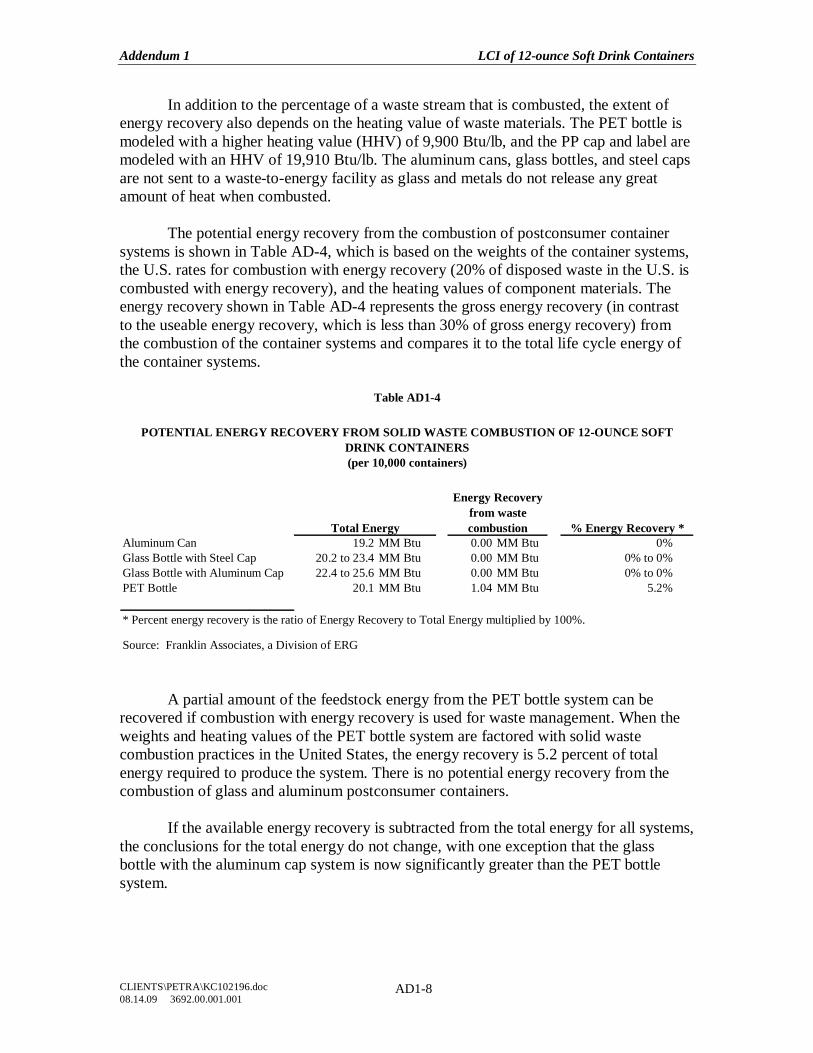
Addendum 1 LCI of 12-ounce Soft Drink Containers
CLIENTS\PETRA\KC102196.doc 08.14.09 3692.00.001.001
AD1-8
In addition to the percentage of a waste stream that is combusted, the extent of energy recovery also depends on the heating value of waste materials. The PET bottle is modeled with a higher heating value (HHV) of 9,900 Btu/lb, and the PP cap and label are modeled with an HHV of 19,910 Btu/lb. The aluminum cans, glass bottles, and steel caps are not sent to a waste-to-energy facility as glass and metals do not release any great amount of heat when combusted.
The potential energy recovery from the combustion of postconsumer container systems is shown in Table AD-4, which is based on the weights of the container systems, the U.S. rates for combustion with energy recovery (20% of disposed waste in the U.S. is combusted with energy recovery), and the heating values of component materials. The energy recovery shown in Table AD-4 represents the gross energy recovery (in contrast to the useable energy recovery, which is less than 30% of gross energy recovery) from the combustion of the container systems and compares it to the total life cycle energy of the container systems.
Aluminum Can 19.2 MM Btu 0.00 MM Btu 0%Glass Bottle with Steel Cap 20.2 to 23.4 MM Btu 0.00 MM Btu 0% to 0%Glass Bottle with Aluminum Cap 22.4 to 25.6 MM Btu 0.00 MM Btu 0% to 0%PET Bottle 20.1 MM Btu 1.04 MM Btu 5.2%
Source: Franklin Associates, a Division of ERG
* Percent energy recovery is the ratio of Energy Recovery to Total Energy multiplied by 100%.
% Energy Recovery *
Table AD1-4
POTENTIAL ENERGY RECOVERY FROM SOLID WASTE COMBUSTION OF 12-OUNCE SOFT DRINK CONTAINERS(per 10,000 containers)
Total Energy
Energy Recovery from waste combustion
A partial amount of the feedstock energy from the PET bottle system can be recovered if combustion with energy recovery is used for waste management. When the weights and heating values of the PET bottle system are factored with solid waste combustion practices in the United States, the energy recovery is 5.2 percent of total energy required to produce the system. There is no potential energy recovery from the combustion of glass and aluminum postconsumer containers.
If the available energy recovery is subtracted from the total energy for all systems, the conclusions for the total energy do not change, with one exception that the glass bottle with the aluminum cap system is now significantly greater than the PET bottle system.
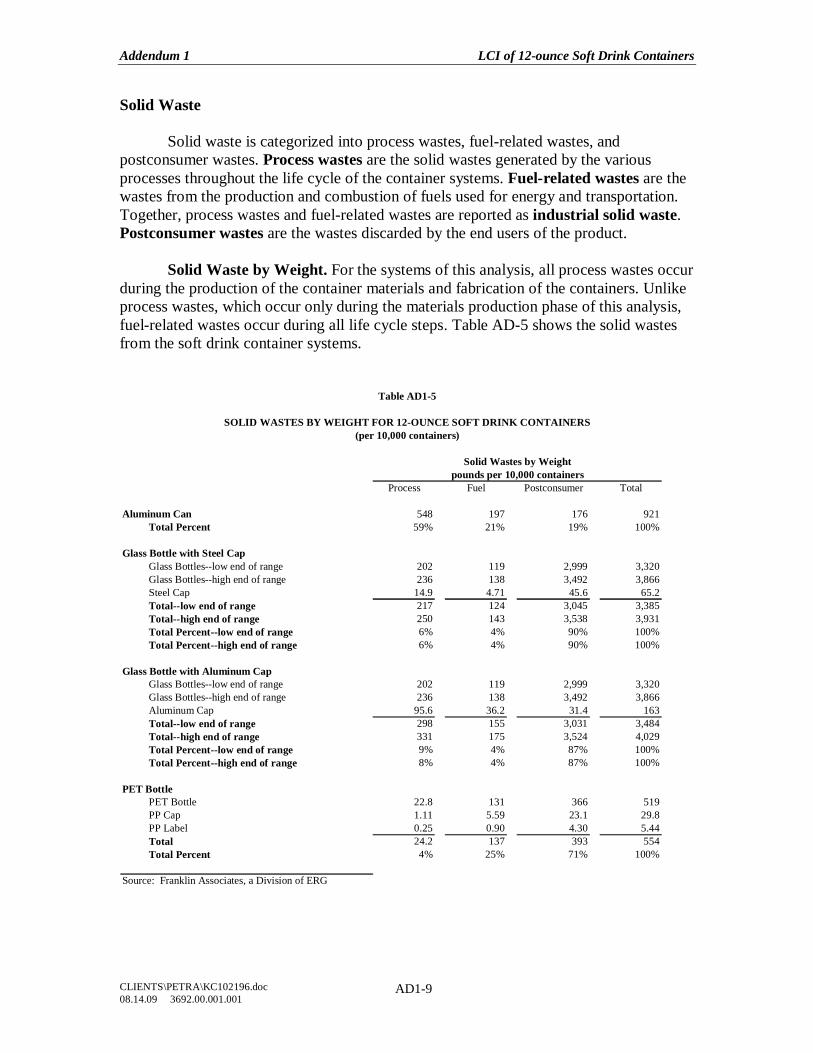
Addendum 1 LCI of 12-ounce Soft Drink Containers
CLIENTS\PETRA\KC102196.doc 08.14.09 3692.00.001.001
AD1-9
Solid Waste Solid waste is categorized into process wastes, fuel-related wastes, and postconsumer wastes. Process wastes are the solid wastes generated by the various processes throughout the life cycle of the container systems. Fuel-related wastes are the wastes from the production and combustion of fuels used for energy and transportation. Together, process wastes and fuel-related wastes are reported as industrial solid waste. Postconsumer wastes are the wastes discarded by the end users of the product.
Solid Waste by Weight. For the systems of this analysis, all process wastes occur during the production of the container materials and fabrication of the containers. Unlike process wastes, which occur only during the materials production phase of this analysis, fuel-related wastes occur during all life cycle steps. Table AD-5 shows the solid wastes from the soft drink container systems.
Process Fuel Postconsumer Total
Aluminum Can 548 197 176 921Total Percent 59% 21% 19% 100%
Glass Bottle with Steel CapGlass Bottles--low end of range 202 119 2,999 3,320Glass Bottles--high end of range 236 138 3,492 3,866Steel Cap 14.9 4.71 45.6 65.2Total--low end of range 217 124 3,045 3,385Total--high end of range 250 143 3,538 3,931Total Percent--low end of range 6% 4% 90% 100%Total Percent--high end of range 6% 4% 90% 100%
Glass Bottle with Aluminum CapGlass Bottles--low end of range 202 119 2,999 3,320Glass Bottles--high end of range 236 138 3,492 3,866Aluminum Cap 95.6 36.2 31.4 163Total--low end of range 298 155 3,031 3,484Total--high end of range 331 175 3,524 4,029Total Percent--low end of range 9% 4% 87% 100%Total Percent--high end of range 8% 4% 87% 100%
PET BottlePET Bottle 22.8 131 366 519PP Cap 1.11 5.59 23.1 29.8PP Label 0.25 0.90 4.30 5.44Total 24.2 137 393 554Total Percent 4% 25% 71% 100%
Source: Franklin Associates, a Division of ERG
Table AD1-5
SOLID WASTES BY WEIGHT FOR 12-OUNCE SOFT DRINK CONTAINERS
pounds per 10,000 containersSolid Wastes by Weight
(per 10,000 containers)
Addendum 1 LCI of 12-ounce Soft Drink Containers
CLIENTS\PETRA\KC102196.doc 08.14.09 3692.00.001.001
AD1-10
The glass bottle systems produce the most solid waste by weight due to the bottle’s heavy weight, whether low or high end of the range. This is apparent from the fact that 87 to 90 percent of all solid waste by weight for these systems is postconsumer solid waste. In contrast, the postconsumer solid waste by weight for the aluminum can, which is the lightest of the soft drink containers, comprises only 19 percent of the system’s total solid waste. It should be noted that although the aluminum can is the lightest of the containers, the PET bottle system produces the least amount of solid waste by weight. The PET bottle’s postconsumer solid waste by weight is greater than that of the aluminum can, but the solid waste from process and fuel are much smaller in the case of the PET bottle.
Solid Waste by Volume. Landfill density factors are used to convert weights of solid waste into volumes. Materials with a high landfill density occupy less landfill volume than equal weights of materials with lower landfill densities. Landfill density factors are based on landfill sampling studies (Estimates of the Volume of MSW and Selected Components in Trash Cans and Landfills, Prepared for The Council for Solid Waste Solutions by Franklin Associates, Ltd. and The Garbage Project. February 1990). A constant factor (1,350 pounds per cubic yard) was used to convert industrial wastes (both process- and fuel-related wastes) from a weight basis to a volume basis. Thus, the discussion on the relative weights of process wastes also applies to the relative volumes of process wastes, and the discussion on the relative weights of fuel wastes also applies to the relative volumes of fuel wastes.
Table AD-6 shows the solid wastes by volume for each container system. The volumes of industrial and postconsumer solid wastes were calculated by multiplying the weights in Table AD-5 by the landfill density factor for each container system.
The greatest variation between the weight and volume of solid waste occurs in the category of postconsumer wastes, because different materials have different landfill densities. When the solid waste is expressed on a volume basis instead of a weight basis, the results for the glass bottle system are much closer to the results for the other two systems; this is due to the relatively high landfill density of glass. Even though the volumes of the glass systems are much closer to that of the other systems, the solid waste by volume for the glass is still the greatest of all of the systems. The aluminum can produces the least amount of solid waste volume, less than half of the volume of the glass systems. The PET bottle system produces 44 percent more solid waste by volume than the aluminum can system; however, the same PET bottle system produces 22 less solid waste by volume than the glass bottle with steel cap system (low end of range).
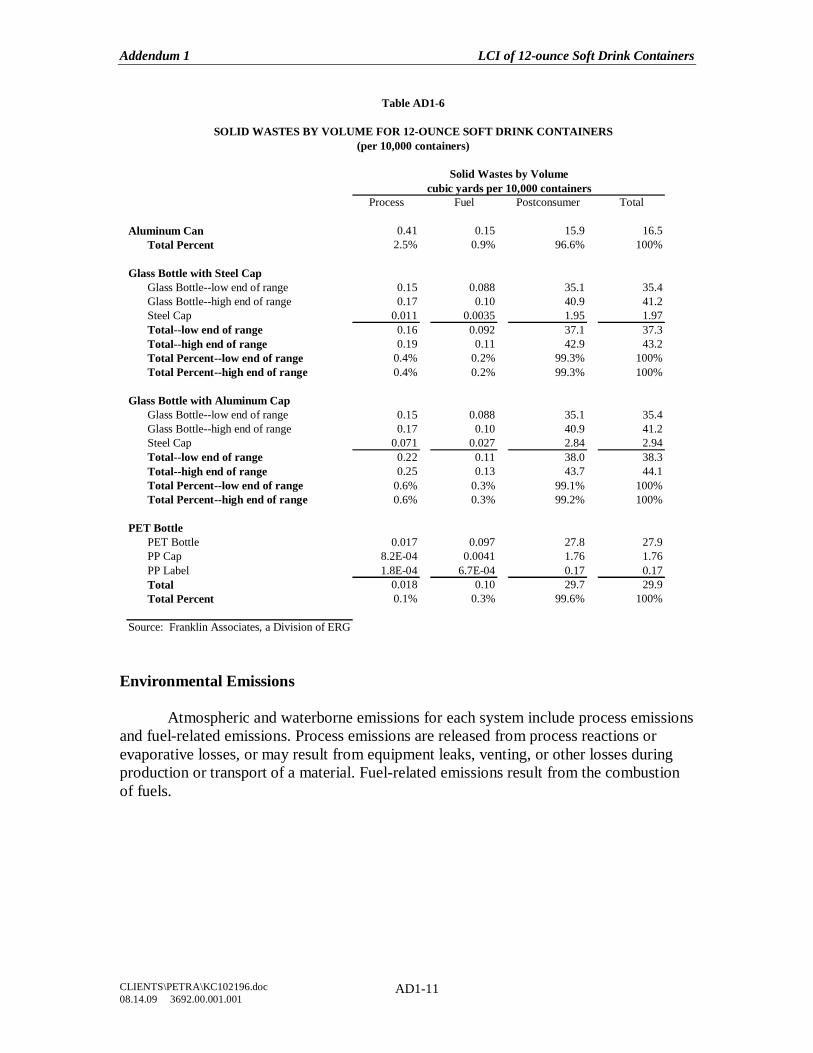
Addendum 1 LCI of 12-ounce Soft Drink Containers
CLIENTS\PETRA\KC102196.doc 08.14.09 3692.00.001.001
AD1-11
Process Fuel Postconsumer Total
Aluminum Can 0.41 0.15 15.9 16.5Total Percent 2.5% 0.9% 96.6% 100%
Glass Bottle with Steel CapGlass Bottle--low end of range 0.15 0.088 35.1 35.4Glass Bottle--high end of range 0.17 0.10 40.9 41.2Steel Cap 0.011 0.0035 1.95 1.97Total--low end of range 0.16 0.092 37.1 37.3Total--high end of range 0.19 0.11 42.9 43.2Total Percent--low end of range 0.4% 0.2% 99.3% 100%Total Percent--high end of range 0.4% 0.2% 99.3% 100%
Glass Bottle with Aluminum CapGlass Bottle--low end of range 0.15 0.088 35.1 35.4Glass Bottle--high end of range 0.17 0.10 40.9 41.2Steel Cap 0.071 0.027 2.84 2.94Total--low end of range 0.22 0.11 38.0 38.3Total--high end of range 0.25 0.13 43.7 44.1Total Percent--low end of range 0.6% 0.3% 99.1% 100%Total Percent--high end of range 0.6% 0.3% 99.2% 100%
PET BottlePET Bottle 0.017 0.097 27.8 27.9PP Cap 8.2E-04 0.0041 1.76 1.76PP Label 1.8E-04 6.7E-04 0.17 0.17Total 0.018 0.10 29.7 29.9Total Percent 0.1% 0.3% 99.6% 100%
Source: Franklin Associates, a Division of ERG
Table AD1-6
SOLID WASTES BY VOLUME FOR 12-OUNCE SOFT DRINK CONTAINERS
cubic yards per 10,000 containersSolid Wastes by Volume
(per 10,000 containers)
Environmental Emissions Atmospheric and waterborne emissions for each system include process emissions and fuel-related emissions. Process emissions are released from process reactions or evaporative losses, or may result from equipment leaks, venting, or other losses during production or transport of a material. Fuel-related emissions result from the combustion of fuels.
Addendum 1 LCI of 12-ounce Soft Drink Containers
CLIENTS\PETRA\KC102196.doc 08.14.09 3692.00.001.001
AD1-12
It is important to realize that interpretation of emissions data requires great care. The effect of the various emissions on humans and the environment are not fully known, and it is not valid to simply add the weights of various pollutants together to arrive at a total effect. The degree of potential environmental disruption due to environmental releases is not related to the weight of the releases in a simple way. Life cycle impact assessment (LCIA) is required to evaluate the potential impacts of different substances on human health and the environment. However, with the exception of the calculation of global warming potential (expressed in carbon dioxide equivalents), this analysis is limited to a life cycle inventory (LCI). If the weight of atmospheric emissions (including greenhouse gases) or waterborne emissions of a system is 25 percent different from another, it can be concluded that the difference is significant. Percent difference is defined as the difference between two values divided by the average of the two values. (See Appendix B for an explanation of these uncertainty ranges.)
Atmospheric Emissions. The predominant atmospheric emissions for the container systems include greenhouse gases (carbon dioxide, methane, and nitrous oxide), volatile organic compounds (VOC), sulfur oxides, particulates, and other organic compounds. Some of these emissions (such as other organics, volatile organic compounds, or particulates) do not represent a distinct chemical species, but rather a general category of compounds with similar properties.
Fuel combustion atmospheric emissions are directly related to the energy requirements of the container systems and the profile of fuels used for energy. Thus, the same conclusions that were discussed in the energy section of this chapter can be applied to the atmospheric emissions from fuel combustion. An exception is energy of material resource (EMR). EMR is a measure of the energy content of fuel resources used as raw materials and represents a significant portion of total energy requirements for plastic materials but does not have associated fuel combustion emissions. Table AD-7 shows the greenhouse gases released by the soft drink container systems. The greenhouse gas emissions shown in these tables are multiplied by global warming potentials developed by the IPCC (Intergovernmental Panel on Climate Change). The global warming potentials are based on a 100-year time frame and represent the heat trapping capacity of the gases relative to an equal weight of carbon dioxide. This practice is a “midpoint” impact assessment method that does not attempt to predict the global warming that results from the emission of greenhouse gases. ISO 14044 does not specify a specific methodology or support the underlying value-choices used for impact categories.
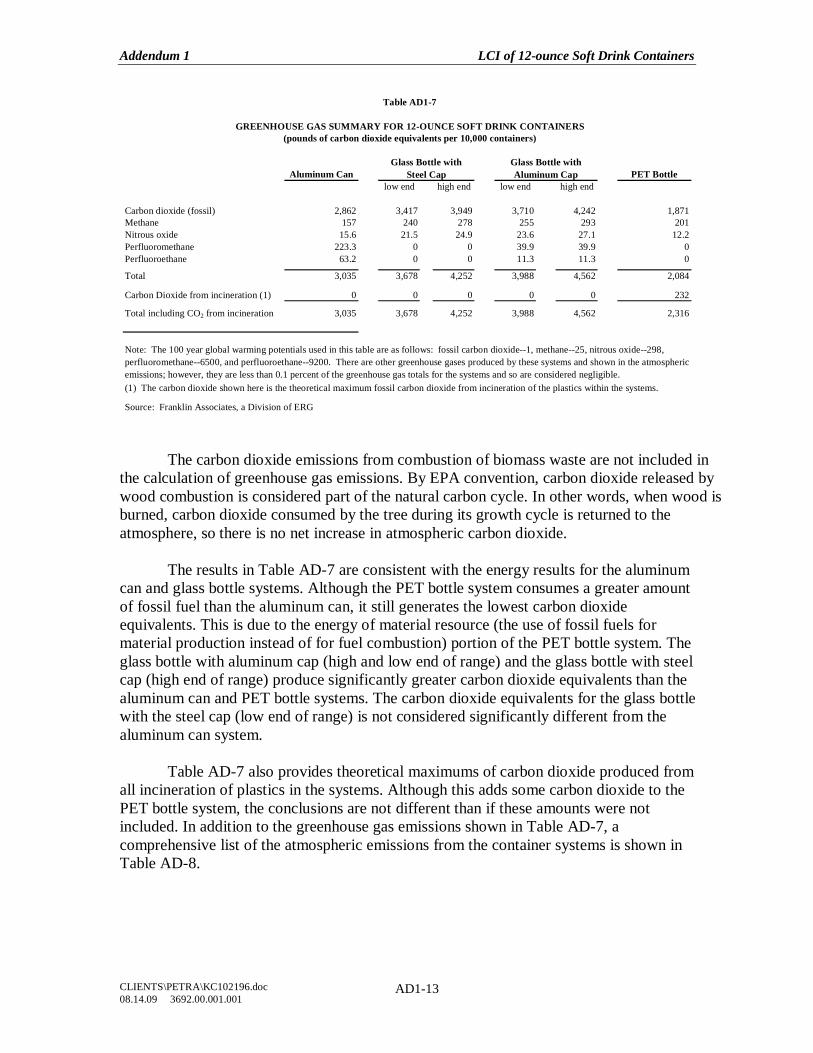
Addendum 1 LCI of 12-ounce Soft Drink Containers
CLIENTS\PETRA\KC102196.doc 08.14.09 3692.00.001.001
AD1-13
Aluminum Can PET Bottlelow end high end low end high end
Carbon dioxide (fossil) 2,862 3,417 3,949 3,710 4,242 1,871Methane 157 240 278 255 293 201Nitrous oxide 15.6 21.5 24.9 23.6 27.1 12.2Perfluoromethane 223.3 0 0 39.9 39.9 0Perfluoroethane 63.2 0 0 11.3 11.3 0
Total 3,035 3,678 4,252 3,988 4,562 2,084
Carbon Dioxide from incineration (1) 0 0 0 0 0 232
Total including CO2 from incineration 3,035 3,678 4,252 3,988 4,562 2,316
Source: Franklin Associates, a Division of ERG
(1) The carbon dioxide shown here is the theoretical maximum fossil carbon dioxide from incineration of the plastics within the systems.
Table AD1-7
GREENHOUSE GAS SUMMARY FOR 12-OUNCE SOFT DRINK CONTAINERS(pounds of carbon dioxide equivalents per 10,000 containers)
Note: The 100 year global warming potentials used in this table are as follows: fossil carbon dioxide--1, methane--25, nitrous oxide--298, perfluoromethane--6500, and perfluoroethane--9200. There are other greenhouse gases produced by these systems and shown in the atmospheric emissions; however, they are less than 0.1 percent of the greenhouse gas totals for the systems and so are considered negligible.
Glass Bottle with Steel Cap
Glass Bottle with Aluminum Cap
The carbon dioxide emissions from combustion of biomass waste are not included in the calculation of greenhouse gas emissions. By EPA convention, carbon dioxide released by wood combustion is considered part of the natural carbon cycle. In other words, when wood is burned, carbon dioxide consumed by the tree during its growth cycle is returned to the atmosphere, so there is no net increase in atmospheric carbon dioxide.
The results in Table AD-7 are consistent with the energy results for the aluminum can and glass bottle systems. Although the PET bottle system consumes a greater amount of fossil fuel than the aluminum can, it still generates the lowest carbon dioxide equivalents. This is due to the energy of material resource (the use of fossil fuels for material production instead of for fuel combustion) portion of the PET bottle system. The glass bottle with aluminum cap (high and low end of range) and the glass bottle with steel cap (high end of range) produce significantly greater carbon dioxide equivalents than the aluminum can and PET bottle systems. The carbon dioxide equivalents for the glass bottle with the steel cap (low end of range) is not considered significantly different from the aluminum can system.
Table AD-7 also provides theoretical maximums of carbon dioxide produced from all incineration of plastics in the systems. Although this adds some carbon dioxide to the PET bottle system, the conclusions are not different than if these amounts were not included. In addition to the greenhouse gas emissions shown in Table AD-7, a comprehensive list of the atmospheric emissions from the container systems is shown in Table AD-8.
Addendum 1 LCI of 12-ounce Soft Drink Containers
CLIENTS\PETRA\KC102196.doc 08.14.09 3692.00.001.001
AD1-14
Waterborne Emissions. The process-related waterborne emissions for the container systems include dissolved solids, suspended solids, COD (chemical oxygen demand), BOD (biological oxygen demand), chlorides, various metals, and various organics. As with atmospheric emissions, waterborne emissions are categorized as fuel and process related.
As stated earlier, the degree of potential environmental disruption due to environmental releases is not related to the weight of the releases in a simple way. No firm conclusions can be made based on the waterborne emissions that result from the container systems without conducting an impact assessment.
A comprehensive list of the waterborne emissions from the container systems are shown in Table AD-9.
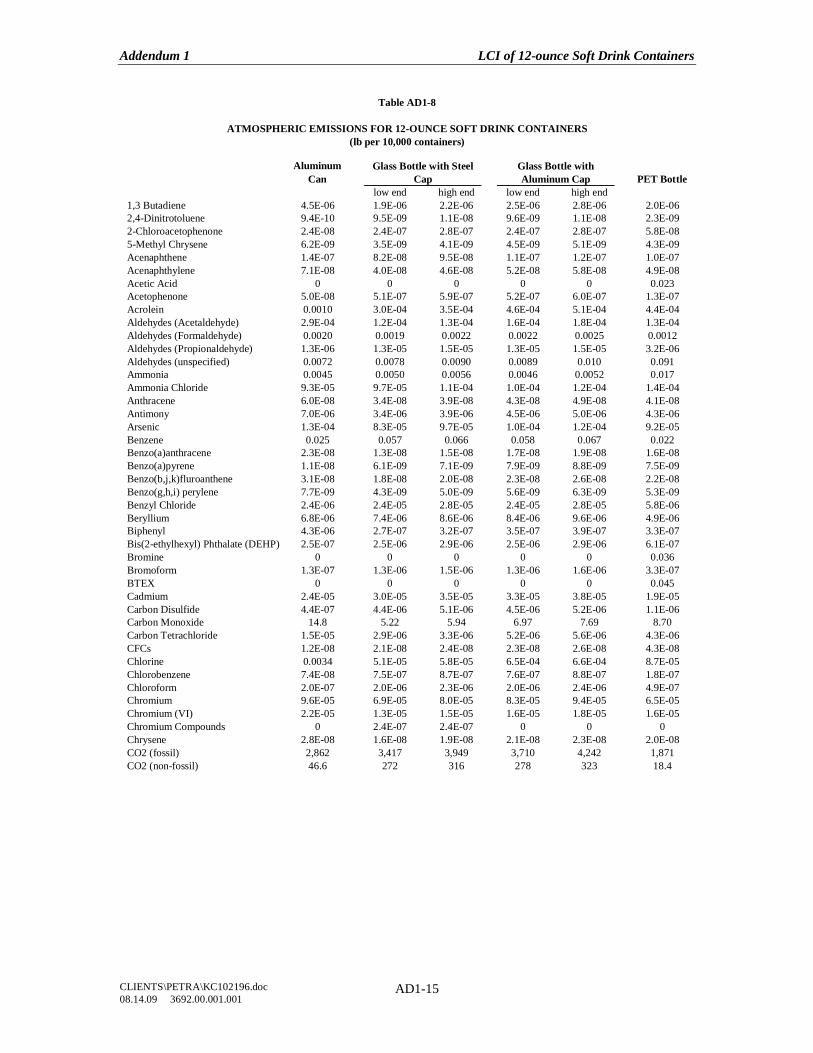
Addendum 1 LCI of 12-ounce Soft Drink Containers
CLIENTS\PETRA\KC102196.doc 08.14.09 3692.00.001.001
AD1-15
Aluminum Can PET Bottle
low end high end low end high end1,3 Butadiene 4.5E-06 1.9E-06 2.2E-06 2.5E-06 2.8E-06 2.0E-062,4-Dinitrotoluene 9.4E-10 9.5E-09 1.1E-08 9.6E-09 1.1E-08 2.3E-092-Chloroacetophenone 2.4E-08 2.4E-07 2.8E-07 2.4E-07 2.8E-07 5.8E-085-Methyl Chrysene 6.2E-09 3.5E-09 4.1E-09 4.5E-09 5.1E-09 4.3E-09Acenaphthene 1.4E-07 8.2E-08 9.5E-08 1.1E-07 1.2E-07 1.0E-07Acenaphthylene 7.1E-08 4.0E-08 4.6E-08 5.2E-08 5.8E-08 4.9E-08Acetic Acid 0 0 0 0 0 0.023Acetophenone 5.0E-08 5.1E-07 5.9E-07 5.2E-07 6.0E-07 1.3E-07Acrolein 0.0010 3.0E-04 3.5E-04 4.6E-04 5.1E-04 4.4E-04Aldehydes (Acetaldehyde) 2.9E-04 1.2E-04 1.3E-04 1.6E-04 1.8E-04 1.3E-04Aldehydes (Formaldehyde) 0.0020 0.0019 0.0022 0.0022 0.0025 0.0012Aldehydes (Propionaldehyde) 1.3E-06 1.3E-05 1.5E-05 1.3E-05 1.5E-05 3.2E-06Aldehydes (unspecified) 0.0072 0.0078 0.0090 0.0089 0.010 0.091Ammonia 0.0045 0.0050 0.0056 0.0046 0.0052 0.017Ammonia Chloride 9.3E-05 9.7E-05 1.1E-04 1.0E-04 1.2E-04 1.4E-04Anthracene 6.0E-08 3.4E-08 3.9E-08 4.3E-08 4.9E-08 4.1E-08Antimony 7.0E-06 3.4E-06 3.9E-06 4.5E-06 5.0E-06 4.3E-06Arsenic 1.3E-04 8.3E-05 9.7E-05 1.0E-04 1.2E-04 9.2E-05Benzene 0.025 0.057 0.066 0.058 0.067 0.022Benzo(a)anthracene 2.3E-08 1.3E-08 1.5E-08 1.7E-08 1.9E-08 1.6E-08Benzo(a)pyrene 1.1E-08 6.1E-09 7.1E-09 7.9E-09 8.8E-09 7.5E-09Benzo(b,j,k)fluroanthene 3.1E-08 1.8E-08 2.0E-08 2.3E-08 2.6E-08 2.2E-08Benzo(g,h,i) perylene 7.7E-09 4.3E-09 5.0E-09 5.6E-09 6.3E-09 5.3E-09Benzyl Chloride 2.4E-06 2.4E-05 2.8E-05 2.4E-05 2.8E-05 5.8E-06Beryllium 6.8E-06 7.4E-06 8.6E-06 8.4E-06 9.6E-06 4.9E-06Biphenyl 4.3E-06 2.7E-07 3.2E-07 3.5E-07 3.9E-07 3.3E-07Bis(2-ethylhexyl) Phthalate (DEHP) 2.5E-07 2.5E-06 2.9E-06 2.5E-06 2.9E-06 6.1E-07Bromine 0 0 0 0 0 0.036Bromoform 1.3E-07 1.3E-06 1.5E-06 1.3E-06 1.6E-06 3.3E-07BTEX 0 0 0 0 0 0.045Cadmium 2.4E-05 3.0E-05 3.5E-05 3.3E-05 3.8E-05 1.9E-05Carbon Disulfide 4.4E-07 4.4E-06 5.1E-06 4.5E-06 5.2E-06 1.1E-06Carbon Monoxide 14.8 5.22 5.94 6.97 7.69 8.70Carbon Tetrachloride 1.5E-05 2.9E-06 3.3E-06 5.2E-06 5.6E-06 4.3E-06CFCs 1.2E-08 2.1E-08 2.4E-08 2.3E-08 2.6E-08 4.3E-08Chlorine 0.0034 5.1E-05 5.8E-05 6.5E-04 6.6E-04 8.7E-05Chlorobenzene 7.4E-08 7.5E-07 8.7E-07 7.6E-07 8.8E-07 1.8E-07Chloroform 2.0E-07 2.0E-06 2.3E-06 2.0E-06 2.4E-06 4.9E-07Chromium 9.6E-05 6.9E-05 8.0E-05 8.3E-05 9.4E-05 6.5E-05Chromium (VI) 2.2E-05 1.3E-05 1.5E-05 1.6E-05 1.8E-05 1.6E-05Chromium Compounds 0 2.4E-07 2.4E-07 0 0 0Chrysene 2.8E-08 1.6E-08 1.9E-08 2.1E-08 2.3E-08 2.0E-08CO2 (fossil) 2,862 3,417 3,949 3,710 4,242 1,871CO2 (non-fossil) 46.6 272 316 278 323 18.4
Glass Bottle with Aluminum Cap
Table AD1-8
ATMOSPHERIC EMISSIONS FOR 12-OUNCE SOFT DRINK CONTAINERS(lb per 10,000 containers)
Glass Bottle with Steel Cap
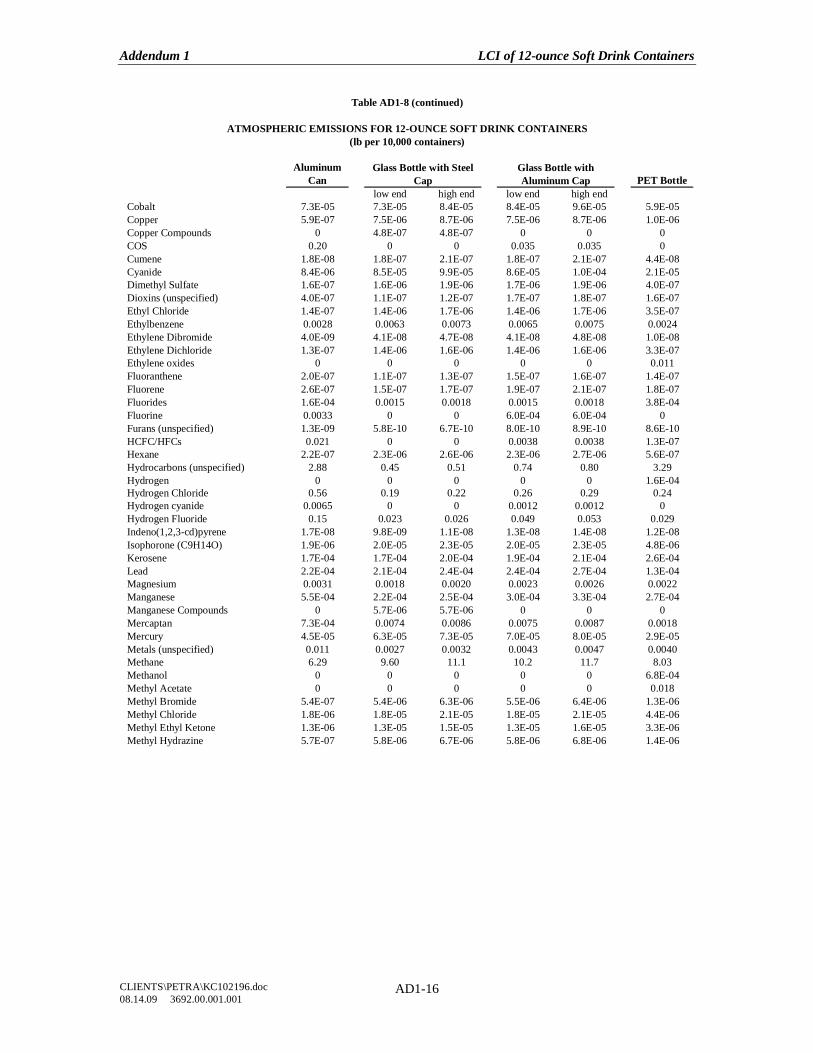
Addendum 1 LCI of 12-ounce Soft Drink Containers
CLIENTS\PETRA\KC102196.doc 08.14.09 3692.00.001.001
AD1-16
Aluminum Can PET Bottle
low end high end low end high endCobalt 7.3E-05 7.3E-05 8.4E-05 8.4E-05 9.6E-05 5.9E-05Copper 5.9E-07 7.5E-06 8.7E-06 7.5E-06 8.7E-06 1.0E-06Copper Compounds 0 4.8E-07 4.8E-07 0 0 0COS 0.20 0 0 0.035 0.035 0Cumene 1.8E-08 1.8E-07 2.1E-07 1.8E-07 2.1E-07 4.4E-08Cyanide 8.4E-06 8.5E-05 9.9E-05 8.6E-05 1.0E-04 2.1E-05Dimethyl Sulfate 1.6E-07 1.6E-06 1.9E-06 1.7E-06 1.9E-06 4.0E-07Dioxins (unspecified) 4.0E-07 1.1E-07 1.2E-07 1.7E-07 1.8E-07 1.6E-07Ethyl Chloride 1.4E-07 1.4E-06 1.7E-06 1.4E-06 1.7E-06 3.5E-07Ethylbenzene 0.0028 0.0063 0.0073 0.0065 0.0075 0.0024Ethylene Dibromide 4.0E-09 4.1E-08 4.7E-08 4.1E-08 4.8E-08 1.0E-08Ethylene Dichloride 1.3E-07 1.4E-06 1.6E-06 1.4E-06 1.6E-06 3.3E-07Ethylene oxides 0 0 0 0 0 0.011Fluoranthene 2.0E-07 1.1E-07 1.3E-07 1.5E-07 1.6E-07 1.4E-07Fluorene 2.6E-07 1.5E-07 1.7E-07 1.9E-07 2.1E-07 1.8E-07Fluorides 1.6E-04 0.0015 0.0018 0.0015 0.0018 3.8E-04Fluorine 0.0033 0 0 6.0E-04 6.0E-04 0Furans (unspecified) 1.3E-09 5.8E-10 6.7E-10 8.0E-10 8.9E-10 8.6E-10HCFC/HFCs 0.021 0 0 0.0038 0.0038 1.3E-07Hexane 2.2E-07 2.3E-06 2.6E-06 2.3E-06 2.7E-06 5.6E-07Hydrocarbons (unspecified) 2.88 0.45 0.51 0.74 0.80 3.29Hydrogen 0 0 0 0 0 1.6E-04Hydrogen Chloride 0.56 0.19 0.22 0.26 0.29 0.24Hydrogen cyanide 0.0065 0 0 0.0012 0.0012 0Hydrogen Fluoride 0.15 0.023 0.026 0.049 0.053 0.029Indeno(1,2,3-cd)pyrene 1.7E-08 9.8E-09 1.1E-08 1.3E-08 1.4E-08 1.2E-08Isophorone (C9H14O) 1.9E-06 2.0E-05 2.3E-05 2.0E-05 2.3E-05 4.8E-06Kerosene 1.7E-04 1.7E-04 2.0E-04 1.9E-04 2.1E-04 2.6E-04Lead 2.2E-04 2.1E-04 2.4E-04 2.4E-04 2.7E-04 1.3E-04Magnesium 0.0031 0.0018 0.0020 0.0023 0.0026 0.0022Manganese 5.5E-04 2.2E-04 2.5E-04 3.0E-04 3.3E-04 2.7E-04Manganese Compounds 0 5.7E-06 5.7E-06 0 0 0Mercaptan 7.3E-04 0.0074 0.0086 0.0075 0.0087 0.0018Mercury 4.5E-05 6.3E-05 7.3E-05 7.0E-05 8.0E-05 2.9E-05Metals (unspecified) 0.011 0.0027 0.0032 0.0043 0.0047 0.0040Methane 6.29 9.60 11.1 10.2 11.7 8.03Methanol 0 0 0 0 0 6.8E-04Methyl Acetate 0 0 0 0 0 0.018Methyl Bromide 5.4E-07 5.4E-06 6.3E-06 5.5E-06 6.4E-06 1.3E-06Methyl Chloride 1.8E-06 1.8E-05 2.1E-05 1.8E-05 2.1E-05 4.4E-06Methyl Ethyl Ketone 1.3E-06 1.3E-05 1.5E-05 1.3E-05 1.6E-05 3.3E-06Methyl Hydrazine 5.7E-07 5.8E-06 6.7E-06 5.8E-06 6.8E-06 1.4E-06
ATMOSPHERIC EMISSIONS FOR 12-OUNCE SOFT DRINK CONTAINERS(lb per 10,000 containers)
Glass Bottle with Steel Cap
Glass Bottle with Aluminum Cap
Table AD1-8 (continued)
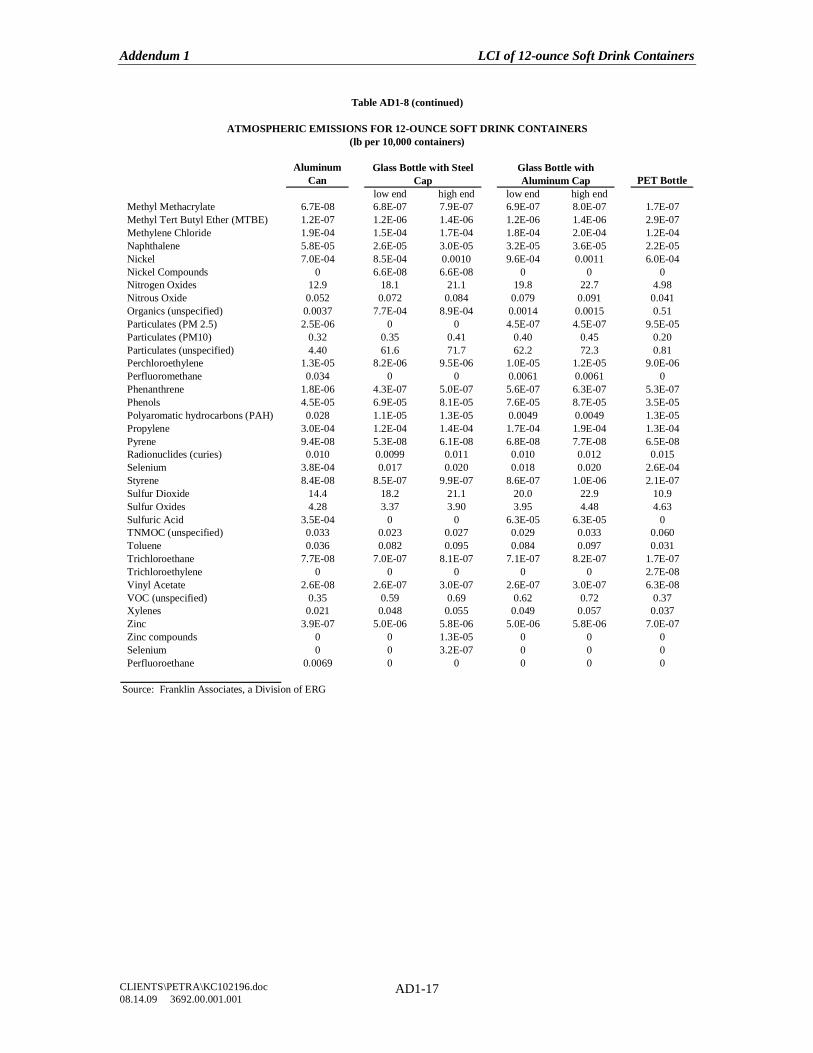
Addendum 1 LCI of 12-ounce Soft Drink Containers
CLIENTS\PETRA\KC102196.doc 08.14.09 3692.00.001.001
AD1-17
Aluminum Can PET Bottle
low end high end low end high endMethyl Methacrylate 6.7E-08 6.8E-07 7.9E-07 6.9E-07 8.0E-07 1.7E-07Methyl Tert Butyl Ether (MTBE) 1.2E-07 1.2E-06 1.4E-06 1.2E-06 1.4E-06 2.9E-07Methylene Chloride 1.9E-04 1.5E-04 1.7E-04 1.8E-04 2.0E-04 1.2E-04Naphthalene 5.8E-05 2.6E-05 3.0E-05 3.2E-05 3.6E-05 2.2E-05Nickel 7.0E-04 8.5E-04 0.0010 9.6E-04 0.0011 6.0E-04Nickel Compounds 0 6.6E-08 6.6E-08 0 0 0Nitrogen Oxides 12.9 18.1 21.1 19.8 22.7 4.98Nitrous Oxide 0.052 0.072 0.084 0.079 0.091 0.041Organics (unspecified) 0.0037 7.7E-04 8.9E-04 0.0014 0.0015 0.51Particulates (PM 2.5) 2.5E-06 0 0 4.5E-07 4.5E-07 9.5E-05Particulates (PM10) 0.32 0.35 0.41 0.40 0.45 0.20Particulates (unspecified) 4.40 61.6 71.7 62.2 72.3 0.81Perchloroethylene 1.3E-05 8.2E-06 9.5E-06 1.0E-05 1.2E-05 9.0E-06Perfluoromethane 0.034 0 0 0.0061 0.0061 0Phenanthrene 1.8E-06 4.3E-07 5.0E-07 5.6E-07 6.3E-07 5.3E-07Phenols 4.5E-05 6.9E-05 8.1E-05 7.6E-05 8.7E-05 3.5E-05Polyaromatic hydrocarbons (PAH) 0.028 1.1E-05 1.3E-05 0.0049 0.0049 1.3E-05Propylene 3.0E-04 1.2E-04 1.4E-04 1.7E-04 1.9E-04 1.3E-04Pyrene 9.4E-08 5.3E-08 6.1E-08 6.8E-08 7.7E-08 6.5E-08Radionuclides (curies) 0.010 0.0099 0.011 0.010 0.012 0.015Selenium 3.8E-04 0.017 0.020 0.018 0.020 2.6E-04Styrene 8.4E-08 8.5E-07 9.9E-07 8.6E-07 1.0E-06 2.1E-07Sulfur Dioxide 14.4 18.2 21.1 20.0 22.9 10.9Sulfur Oxides 4.28 3.37 3.90 3.95 4.48 4.63Sulfuric Acid 3.5E-04 0 0 6.3E-05 6.3E-05 0TNMOC (unspecified) 0.033 0.023 0.027 0.029 0.033 0.060Toluene 0.036 0.082 0.095 0.084 0.097 0.031Trichloroethane 7.7E-08 7.0E-07 8.1E-07 7.1E-07 8.2E-07 1.7E-07Trichloroethylene 0 0 0 0 0 2.7E-08Vinyl Acetate 2.6E-08 2.6E-07 3.0E-07 2.6E-07 3.0E-07 6.3E-08VOC (unspecified) 0.35 0.59 0.69 0.62 0.72 0.37Xylenes 0.021 0.048 0.055 0.049 0.057 0.037Zinc 3.9E-07 5.0E-06 5.8E-06 5.0E-06 5.8E-06 7.0E-07Zinc compounds 0 0 1.3E-05 0 0 0Selenium 0 0 3.2E-07 0 0 0Perfluoroethane 0.0069 0 0 0 0 0
Source: Franklin Associates, a Division of ERG
Table AD1-8 (continued)
ATMOSPHERIC EMISSIONS FOR 12-OUNCE SOFT DRINK CONTAINERS(lb per 10,000 containers)
Glass Bottle with Steel Cap
Glass Bottle with Aluminum Cap
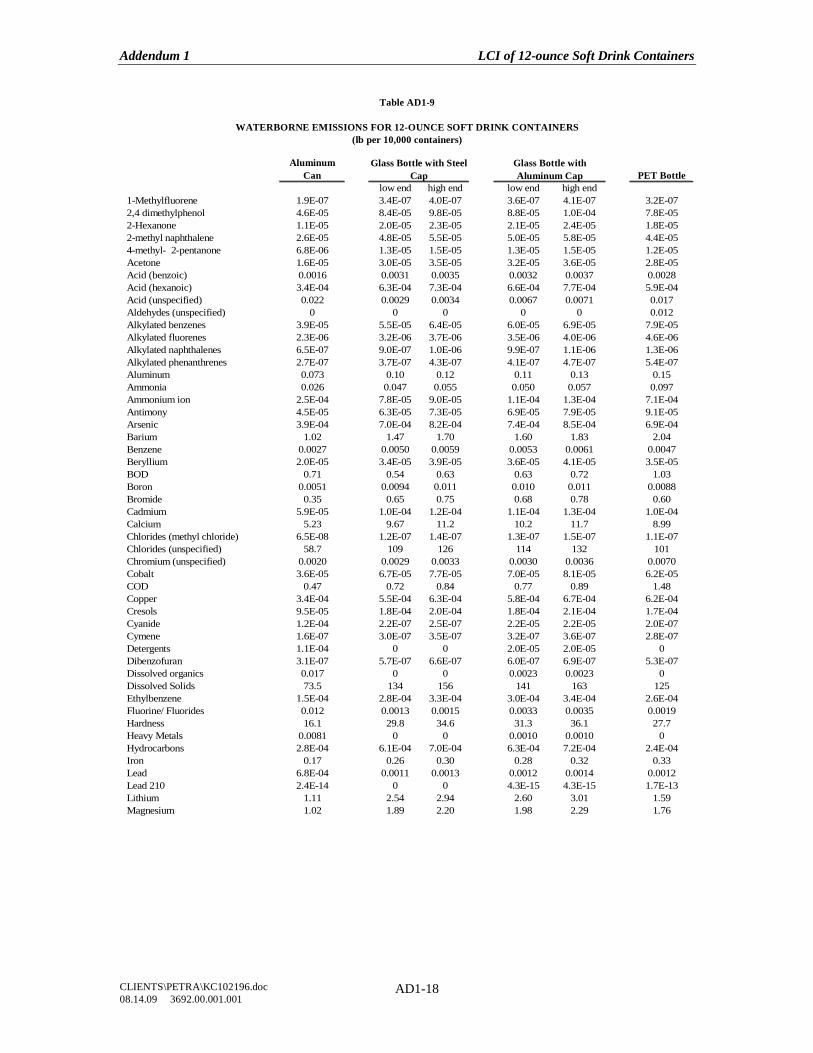
Addendum 1 LCI of 12-ounce Soft Drink Containers
CLIENTS\PETRA\KC102196.doc 08.14.09 3692.00.001.001
AD1-18
Aluminum Can PET Bottle
low end high end low end high end1-Methylfluorene 1.9E-07 3.4E-07 4.0E-07 3.6E-07 4.1E-07 3.2E-072,4 dimethylphenol 4.6E-05 8.4E-05 9.8E-05 8.8E-05 1.0E-04 7.8E-052-Hexanone 1.1E-05 2.0E-05 2.3E-05 2.1E-05 2.4E-05 1.8E-052-methyl naphthalene 2.6E-05 4.8E-05 5.5E-05 5.0E-05 5.8E-05 4.4E-054-methyl- 2-pentanone 6.8E-06 1.3E-05 1.5E-05 1.3E-05 1.5E-05 1.2E-05Acetone 1.6E-05 3.0E-05 3.5E-05 3.2E-05 3.6E-05 2.8E-05Acid (benzoic) 0.0016 0.0031 0.0035 0.0032 0.0037 0.0028Acid (hexanoic) 3.4E-04 6.3E-04 7.3E-04 6.6E-04 7.7E-04 5.9E-04Acid (unspecified) 0.022 0.0029 0.0034 0.0067 0.0071 0.017Aldehydes (unspecified) 0 0 0 0 0 0.012Alkylated benzenes 3.9E-05 5.5E-05 6.4E-05 6.0E-05 6.9E-05 7.9E-05Alkylated fluorenes 2.3E-06 3.2E-06 3.7E-06 3.5E-06 4.0E-06 4.6E-06Alkylated naphthalenes 6.5E-07 9.0E-07 1.0E-06 9.9E-07 1.1E-06 1.3E-06Alkylated phenanthrenes 2.7E-07 3.7E-07 4.3E-07 4.1E-07 4.7E-07 5.4E-07Aluminum 0.073 0.10 0.12 0.11 0.13 0.15Ammonia 0.026 0.047 0.055 0.050 0.057 0.097Ammonium ion 2.5E-04 7.8E-05 9.0E-05 1.1E-04 1.3E-04 7.1E-04Antimony 4.5E-05 6.3E-05 7.3E-05 6.9E-05 7.9E-05 9.1E-05Arsenic 3.9E-04 7.0E-04 8.2E-04 7.4E-04 8.5E-04 6.9E-04Barium 1.02 1.47 1.70 1.60 1.83 2.04Benzene 0.0027 0.0050 0.0059 0.0053 0.0061 0.0047Beryllium 2.0E-05 3.4E-05 3.9E-05 3.6E-05 4.1E-05 3.5E-05BOD 0.71 0.54 0.63 0.63 0.72 1.03Boron 0.0051 0.0094 0.011 0.010 0.011 0.0088Bromide 0.35 0.65 0.75 0.68 0.78 0.60Cadmium 5.9E-05 1.0E-04 1.2E-04 1.1E-04 1.3E-04 1.0E-04Calcium 5.23 9.67 11.2 10.2 11.7 8.99Chlorides (methyl chloride) 6.5E-08 1.2E-07 1.4E-07 1.3E-07 1.5E-07 1.1E-07Chlorides (unspecified) 58.7 109 126 114 132 101Chromium (unspecified) 0.0020 0.0029 0.0033 0.0030 0.0036 0.0070Cobalt 3.6E-05 6.7E-05 7.7E-05 7.0E-05 8.1E-05 6.2E-05COD 0.47 0.72 0.84 0.77 0.89 1.48Copper 3.4E-04 5.5E-04 6.3E-04 5.8E-04 6.7E-04 6.2E-04Cresols 9.5E-05 1.8E-04 2.0E-04 1.8E-04 2.1E-04 1.7E-04Cyanide 1.2E-04 2.2E-07 2.5E-07 2.2E-05 2.2E-05 2.0E-07Cymene 1.6E-07 3.0E-07 3.5E-07 3.2E-07 3.6E-07 2.8E-07Detergents 1.1E-04 0 0 2.0E-05 2.0E-05 0Dibenzofuran 3.1E-07 5.7E-07 6.6E-07 6.0E-07 6.9E-07 5.3E-07Dissolved organics 0.017 0 0 0.0023 0.0023 0Dissolved Solids 73.5 134 156 141 163 125Ethylbenzene 1.5E-04 2.8E-04 3.3E-04 3.0E-04 3.4E-04 2.6E-04Fluorine/ Fluorides 0.012 0.0013 0.0015 0.0033 0.0035 0.0019Hardness 16.1 29.8 34.6 31.3 36.1 27.7Heavy Metals 0.0081 0 0 0.0010 0.0010 0Hydrocarbons 2.8E-04 6.1E-04 7.0E-04 6.3E-04 7.2E-04 2.4E-04Iron 0.17 0.26 0.30 0.28 0.32 0.33Lead 6.8E-04 0.0011 0.0013 0.0012 0.0014 0.0012Lead 210 2.4E-14 0 0 4.3E-15 4.3E-15 1.7E-13Lithium 1.11 2.54 2.94 2.60 3.01 1.59Magnesium 1.02 1.89 2.20 1.98 2.29 1.76
Glass Bottle with Aluminum Cap
Glass Bottle with Steel Cap
Table AD1-9
WATERBORNE EMISSIONS FOR 12-OUNCE SOFT DRINK CONTAINERS(lb per 10,000 containers)

Addendum 1 LCI of 12-ounce Soft Drink Containers
CLIENTS\PETRA\KC102196.doc 08.14.09 3692.00.001.001
AD1-19
Aluminum Can PET Bottle
low end high end low end high endManganese 0.0053 0.0052 0.0060 0.0059 0.0067 0.0054Mercury 1.1E-06 1.1E-06 1.3E-06 1.3E-06 1.5E-06 1.6E-06Metal Ion (unspecified) 0.028 0 0 0.0050 0.0050 2.1E-06Methyl Ethyl Ketone 1.3E-07 2.4E-07 2.8E-07 2.5E-07 2.9E-07 2.3E-07Molybdenum 3.7E-05 6.9E-05 8.0E-05 7.3E-05 8.4E-05 6.4E-05Naphthalene 3.0E-05 5.5E-05 6.4E-05 5.7E-05 6.6E-05 5.1E-05n-Decane 6.8E-06 0 0 1.2E-06 1.2E-06 4.7E-05n-Docosane 2.5E-07 0 0 4.5E-08 4.5E-08 1.7E-06n-Dodecane 1.3E-05 0 0 2.3E-06 2.3E-06 8.9E-05n-Eicosane 3.6E-06 0 0 6.4E-07 6.4E-07 2.4E-05n-Hexacosane 1.6E-07 0 0 2.8E-08 2.8E-08 1.1E-06n-Hexadecane 1.4E-05 0 0 2.5E-06 2.5E-06 9.7E-05Nickel 3.4E-04 5.9E-04 6.9E-04 6.3E-04 7.2E-04 6.2E-04Nitrates 1.8E-04 1.9E-04 2.2E-04 2.1E-04 2.4E-04 2.9E-04Nitrogen (ammonia) 6.7E-05 6.8E-05 7.9E-05 7.2E-05 8.3E-05 1.0E-04n-Octadecane 3.5E-06 0 0 6.2E-07 6.2E-07 2.4E-05n-Tetradecane 5.7E-06 0 0 1.0E-06 1.0E-06 3.9E-05Oil 0.040 0.061 0.070 0.065 0.075 0.059Pentamethyl benzene 1.2E-07 2.3E-07 2.6E-07 2.4E-07 2.7E-07 2.1E-07Phenanthrene 3.0E-07 4.9E-07 5.7E-07 5.2E-07 6.0E-07 5.7E-07Phenol/Phenolic Compounds 8.2E-04 0.0014 0.0016 0.0015 0.0017 0.0013Phosphates 2.2E-06 0 0 4.0E-07 4.0E-07 2.3E-04Radionuclides (unspecified) (ci) 1.3E-07 1.4E-07 1.6E-07 1.5E-07 1.7E-07 2.1E-07Radium 226 8.5E-12 0 0 1.5E-12 1.5E-12 5.8E-11Radium 228 4.3E-14 0 0 7.7E-15 7.7E-15 3.0E-13Selenium 3.5E-05 4.0E-05 4.6E-05 4.2E-05 4.9E-05 5.8E-05Silver 0.0034 0.0063 0.0073 0.0066 0.0076 0.0059Sodium 17.2 30.7 35.6 32.3 37.2 28.5Strontium 0.089 0.16 0.19 0.17 0.20 0.15Styrene 0 0 0 0 0 1.3E-08Sulfates 0.84 0.35 0.40 0.47 0.53 0.39Sulfides 2.1E-05 3.4E-05 3.9E-05 3.7E-05 4.2E-05 6.8E-05Sulfur 0.0044 0.0080 0.0093 0.0084 0.0097 0.0074Sulfuric Acid 0 1.4E-04 1.4E-04 0 0 0Surfactants 0.0015 0.0029 0.0034 0.0030 0.0035 0.0026Suspended Solids 2.44 5.62 6.54 5.93 6.84 4.64Thallium 9.5E-06 1.3E-05 1.5E-05 1.4E-05 1.7E-05 1.9E-05Tin 2.5E-04 4.1E-04 4.7E-04 4.3E-04 5.0E-04 4.6E-04Titanium 6.9E-04 9.7E-04 0.0011 0.0011 0.0012 0.0014TOC 0.0052 0.012 0.014 0.012 0.014 0.0088Toluene 0.0026 0.0048 0.0055 0.0050 0.0058 0.0044Total Alkalinity 0.13 0.24 0.28 0.25 0.29 0.22Total Biphenyls 2.6E-06 3.6E-06 4.1E-06 3.9E-06 4.5E-06 5.1E-06Total dibenzo- thiophenes 2.6E-07 4.7E-07 5.5E-07 5.0E-07 5.8E-07 4.5E-07Vanadium 4.4E-05 8.2E-05 9.5E-05 8.6E-05 9.9E-05 7.6E-05Xylenes 0.0014 0.0025 0.0029 0.0027 0.0031 0.0024Yttrium 1.1E-05 2.0E-05 2.4E-05 2.1E-05 2.5E-05 1.9E-05Zinc 0.0018 0.0025 0.0030 0.0028 0.0032 0.0072
Source: Franklin Associates, a Division of ERG
Table AD1-9 (cont.)
WATERBORNE EMISSIONS FOR 12-OUNCE SOFT DRINK CONTAINERS(lb per 10,000 containers)
Glass Bottle with Steel Cap
Glass Bottle with Aluminum Cap
Addendum 1 LCI of 12-ounce Soft Drink Containers
CLIENTS\PETRA\KC102196.doc 08.14.09 3692.00.001.001
AD1-20
ADDENDUM 1 CONCLUSIONS This LCI determined the energy consumption, solid waste generation, and greenhouse gas emissions from three types of containers used for soft drinks. Conclusions within each of these categories are summarized below.
• The aluminum can, PET bottle, and glass bottle (low end) with a steel cap all require the least amount of total energy in this comparison. Their total energy amounts cannot be considered significantly different.
• The remaining glass bottle systems require the greatest amount of total energy. Their total energy amounts cannot be considered significantly different.
• All aluminum can and glass bottle systems require more process energy than the PET bottle system. The PET bottle system includes an energy of material resource, which makes up 40 percent of its total energy.
• The aluminum can system has a lower fossil fuel profile (78 percent of the total energy comes from fossil fuels). Hydropower is commonly used for by primary aluminum smelters.
• The percentage of fossil fuel consumption is higher for the PET bottle system because plastics production uses petroleum and natural gas as raw materials.
• The glass produces the highest amount of total solid waste by both weight and volume. While the PET produces the lowest amount of total solid waste by weight, the aluminum can produces the lowest amount of solid waste by volume.
• The PET bottle system produces the least amount of carbon dioxide equivalents. Although the carbon dioxide equivalents follow the energy requirements in some cases, plastics include an energy of material resource, which does not have associated carbon dioxide equivalents unless the plastic is combusted at its end-of life.
Addendum 2 Peer Review
CLIENTS\PETRA\KC102196.doc 08.14.09 3692.00.001.001
AD2-1
ADDENDUM 2 PEER REVIEW
The PET Resin Association (PETRA) commissioned a peer review of the LCI of three single-serving soft drink containers. The following comments were provided by a panel of three LCI experts. Franklin Associates’ responses to these comments are shown in italics following the peer reviewers’ comments.
Addendum 2 Peer Review
CLIENTS\PETRA\KC102196.doc 08.14.09 3692.00.001.001
AD2-2
PEER REVIEW
of
LIFE CYCLE INVENTORY OF THREE SINGLE SERVING-SOFT DRINK CONTAINERS
(Report and Partial Appendices)
Prepared for
PET Resin Association (PETRA) and
FRANKLIN ASSOCIATES, A Division of ERG
by
Dr. David Allen University of Texas
Dr. Greg Keoleian
Center for Sustainable Systems University of Michigan
Beth Quay (Chair) Private Consultant
April 23, 2009
Addendum 2 Peer Review
CLIENTS\PETRA\KC102196.doc 08.14.09 3692.00.001.001
AD2-3
SUMMARY At the request of the PET Resin Association (PETRA), a peer review panel reviewed the report and some of the appendices of “Life Cycle Inventory of Three Single-Serving Soft Drink Containers”, an LCI study conducted by the consulting firm of Franklin Associates (FAL), a Division of Eastern Research Group. The study report examines the energy consumption, solid wastes and greenhouse gas emissions associated with delivery of 100,000 ounces of soft drinks through 3 single-serving containers: 12-ounce aluminum cans, 8-ounce glass bottles with steel crown closures, and 20-ounce PET bottles with polypropylene closures. No secondary packaging was included in the LCI. In conformance with ISO 14040, the panel consisted of 3 external experts independent of the study. They reviewed the study against the following six criteria: • Is the methodology consistent with 14040/14041? • Are the objectives, scope, and boundaries of the study clearly identified? • Are the assumptions used clearly identified and reasonable? • Are the sources of data clearly identified and representative? • Is the report complete, consistent, and transparent? • Are the conclusions appropriate based on the data and analysis? In general, the panel found answers to these questions to be, “Yes,” and found the study to meet the high professional standards that life cycle assessment practitioners have come to expect from Franklin Associates. Several important issues and concerns, however, have been identified and are described below. Is the methodology consistent with ISO 14040/14041? For the most part, this LCI is well constructed and developed in accordance with ISO 14040:1997 and 14041:1998. Objectives, scope, and boundaries are identified, as well as most assumptions. However, one requirement of ISO 14040:1997 is the clear definition of the study goal. According to Section 5.1.1 “the goal shall…unambiguously state the intended application; the reasons for carrying out the study; and the intended audience.” This study uses unusual language to define the conditions under which the study might be made public, stating at multiple times in the report that the study might be used “as a defense for possible defamatory statements made by producers, trade organizations, or environmental groups affiliated with the alternative soft drink containers” (e.g., Page ES-1). Does this mean that the study will not be released unless defamatory statements are made? What constitutes a defamatory statement? Given this ambiguity, the panel reviewed the report assuming that it would be publicly released and used to make comparative assertions. The release of this study to the public is unlikely unless broad untrue statements about PET soft drink bottles are made by the competing container affiliations or producers. The word defamatory will be replaced by “broad untrue”.
Addendum 2 Peer Review
CLIENTS\PETRA\KC102196.doc 08.14.09 3692.00.001.001
AD2-4
Are the objectives, scope, and boundaries of the study clearly identified? Objectives, scope, and boundaries are clearly identified and mainly limited to energy, solid waste, and greenhouse gas emissions (GHG). Air (non-GHG) and waterborne pollutant emissions are shown, but no conclusions are drawn from these results. Are the assumptions used clearly identified and reasonable? With some exceptions, the assumptions employed are clearly and carefully described. However, clarification of several issues, reorganization of the presentation of certain conclusions, and consideration of other assumptions would enhance the LCI. • Functional unit
The functional unit chosen for use in the study is the primary packging of 100,000 ounces of beverage. In the base case analysis, 3 different container sizes are used (12-ounce aluminum can; 8-ounce glass bottle and 20-ounce PET bottle). As documented in the Addendum to the report (Section AD), the use of these three different container sizes leads to different conclusions than if equal-sized containers are used. For example, the first, third and final bulleted conclusions on page ES-10 (regarding energy and greenhouse gas emissions) are no longer true if equivalent container sizes are used. This is a significant finding and should be recognized in the main body of the report and the Executive Summary, not relegated to an Addendum.
The functional unit of “the delivery of 100,000 ounces of soft drink” (page 1-2) should also be restated to better reflect the scope of the analysis, which does not include transport to filling, distribution, storage, or retail. “Delivery” implies that these transportation and process steps are included. Also, it is not clear if the soft drink containers studied focused only on carbonated beverages or also included bottled water. The PET bottle wall thickness is considerably less for bottled water. It is noted in the Executive Summary that the use of equal-sized containers changes the first, third, and final bulleted conclusions, and these conclusion changes are explained. The history of the decision to include the equal-sized containers within an Addendum is also now explained in the Executive Summary. The functional unit is now described as “the primary packaging of 100,000 ounces of soft drink.” The Merriam-Webster Dictionary online defines soft drink as “a usually carbonated non-alcoholic beverage.” A few of the glass bottles weighed were non-carbonated drinks, but no water bottles were included. The statement “Water bottles are not included in this study.” will be added to the report.
• Containers Chosen for LCI
Addendum 2 Peer Review
CLIENTS\PETRA\KC102196.doc 08.14.09 3692.00.001.001
AD2-5
Why was an 8-ounce versus a 12- or 16-ounce glass bottle included in this study? Comparing containers of different sizes normally disadvantages a smaller size package— it has more container surface area per ounce delivered than the larger size. How significantly container size can impact LCI results is clearly shown by the Addendum. Addendum tables list results for 10,000 12-ounce containers, or 120,000 ounces of delivered product—20% more product than the 100,000 ounces used as the functional unit in the rest of the study. Therefore, as expected, Table AD-5 in the Addendum lists a 20% increase in solid wastes for the 12-ounce aluminum can versus that shown in Table 2-4. However, reducing PET bottle size from 20 ounces to 12 causes a much greater increase in solid waste, 83%. And, increasing the glass bottle’s size from 8 ounces to 12 actually decreases solid waste almost 12% for the worst case (glass bottle with steel crown) while delivering 20% more product.
The initial study was to be done on commonly available consumer sizes of popular soft drinks for each packaging material. Franklin Associates used the most common size for each soft drink container. Only 8 ounce glass bottles of popular carbonated soft drinks were found in various grocery stores/convenience stores in the Kansas City area. Research revealed that 12-ounce bottles of these types of soft drinks were not common in the U.S., but were more common in Mexico. However, 12-ounce glass bottles of various independent or area-based soft drinks (both carbonated and non-carbonated) were available and were used in the Addendum study. The aluminum cans of soft drinks are rarely found in any size but the 12-ounce can. The PET bottles filled with carbonated soft drinks are more often sold in the 20-ounce size, although they are available in the 12-ounce size. • Secondary Packaging
The soft drink container system is limited to primary packaging and ignores the use of secondary packaging. Since the secondary packaging requirements differ by container material (for example, additional secondary packaging is required to prevent glass breakage), this assumption may influence the conclusions of the study. At a minimum, sensitivity analyses should be performed to assess whether including the impacts of secondary packaging would influence the results of the study.
This analysis focused on primary packaging only due to the interest of the client to directly compare their primary package with similar primary packages. The secondary packaging of these systems was outside the scope of this analysis. This is now stated in the scope and boundaries and the systems studied sections. PETRA is interested in whether there is a correlation in the life cycle profile of the individual containers focusing on their weights and materials. Inclusion of the secondary packaging would obfuscate the answer to this question. We agree that it is likely that the glass container would have a higher amount of secondary packaging, but the glass container already requires the greatest amount of energy and produces the most solid waste and GHG on an equivalent volume basis. Even
Addendum 2 Peer Review
CLIENTS\PETRA\KC102196.doc 08.14.09 3692.00.001.001
AD2-6
based on an equivalent number of containers, the glass container is either equivalent or greater than the other systems for energy, solid waste, and GHG. • Wood Energy of Material Resource (EMR)
In evaluating the Energy of Material Resource the authors do not include biomass based feedstocks (Figure A-4). For the base case LCI, this assumption is likely to have a minor impact on the overall results. However, if secondary packaging is included, wood EMR may become a more significant issue. The addition of a sensitivity analysis on whether wood-based materials are considered in EMR would be a valuable scenario to consider.
Our choice of the EMR convention used in this study is to quantify the depletion of resources that would otherwise be extracted and used as energy resources. On this basis, it is not inconsistent to report actual energy derived from wood (or its products) yet not assign EMR to the energy content of the wood that becomes part of the product. Within the geographic boundaries for this study, forest resources are harvested for use as a material. If not used to produce paperboard, lumber, etc., the trees would be left standing and would not be harvested for fuel; thus, while wood wastes or products are sometimes utilized as an energy source, material use of wood in a product is not considered a diversion from its use as an energy resource. • Other Assumptions
The report should also address the following questions:
Ø The aluminum can GHG emissions seem high. The aluminum can stock contains a high recycled content. If can stock were assumed to be all primary (which is not the actual case): 13.2 g x 10,000 cans x 10.7 kg CO2/kg x 2.2 lb/kg x kg/1000 = 3107 lbs. Table AD-7 reports 3347 lbs total. The panel would expect can stock to be around 40 percent recycled content, which would greatly reduce the GHG intensity.
First, the can body stock is assumed to include 41.3 percent recycled content, while the lid stock is assumed to include 12 percent recycled content. The can is assumed to be recycled at a rate of 45 percent. These assumptions will be included in the report. The greenhouse gas intensity used in the panelist comment (10.7 kg CO2/kg) includes aluminum production only through the smelter. The aluminum must be processed further (ingot casting, sheet rolling, can making) to make aluminum cans. These processes add approximately another 2 kg CO2/kg to the greenhouse gas intensity. If we were to compare the greenhouse gas intensity through smelting only from the Franklin Associates model to the panelist’s given amount, our greenhouse gas intensity is approximately 14.1 kg CO2/kg. Franklin Associates reviewed the differences in these amounts and found that the electricity grid used for smelting was from 2002 and had changed significantly. Therefore, we have updated the electricity grid for smelting to the 2007 results provided in the International Aluminum Institute Statistical Report. We also noted that the PFC
Addendum 2 Peer Review
CLIENTS\PETRA\KC102196.doc 08.14.09 3692.00.001.001
AD2-7
amounts for smelting discussed in a later comment were not included previously and have been added. This has changed the results for the aluminum cans in both the main report and the addendum. When these changes were taken into account, our greenhouse gas intensity through smelting decreased to 12.4 kg CO2/kg.
Ø The authors note, at multiple points (e.g., page 2-1) the thresholds for significant differences in energy, air emissions, water emissions, and solid waste mass and volume; however, no threshold is reported for greenhouse gases.
A statement has been added that gives a threshold (25% difference) for greenhouse gases.
Ø The assumptions regarding the geographical sourcing of crude oil and the corresponding average transport requirements, are not clearly stated (Page 2-3).
A statement has been added in the Limitations and Assumptions section in Chapter 1 about the crude oil sourcing and transportation assumptions.
Ø All of the co-product allocations are done on a mass basis (page A-12); a few select sensitivity analyses that use other allocation methods (e.g., energy allocations for the petroleum refining segments of the LCI) would be a valuable addition to the study.
The request here is very time- and budget-consuming as it would affect the precombustion energy and emissions. Unfortunately there is not enough time or budget to do this type of sensitivity analysis.
Ø It is inconsistent that the LCI includes the energy recovered by an incinerator but does not include incinerator emissions.
Estimated carbon dioxide amounts from incineration are shown in the greenhouse gas summary tables. This is not an LCA and the remaining emissions have not been analyzed as such; therefore, we believe the exclusion of other incineration emissions are not a detriment to this analysis. Are the sources of data clearly identified and representative? The study authors have clearly identified data sources, which appear to be generally reliable. However, panel members have some concerns over the data selected for inclusion in the LCI. • ISO 14040, Section 5.1.2.3 states that “The data quality requirements should
address:
- time-related coverage;
Addendum 2 Peer Review
CLIENTS\PETRA\KC102196.doc 08.14.09 3692.00.001.001
AD2-8
- geographical coverage; - technology coverage; - precision, completeness and representativeness of the data; - consistency and reproducibility of the methods used throughout the LCA; - sources of the data and their representativeness; - uncertainty of the information.”
Where a study is used to support a comparative assertion that is disclosed to the public, the above-mentioned data quality requirements shall be addressed.” Whether all of the requirements in this list have been met is troubling to the panel for several of reasons:
Ø Container weight significantly affects LCI results. Yet the report provides
very little information on several issues:
- Why were these 3 containers chosen for this study? The glass bottle with a steel crown sounds like the contour non-refillable Coca-Cola bottle. No specific bottle description is reported, though it is needed. If the contour bottle is the basis for the 8-ounce glass bottle in the study, it is probably heavier than some other glass bottles just due to its contour shape. In fact, the Addendum discusses a range of glass bottle weights and on page AD-3 even calls one bottle a “thick brown glass bottle”. What bottle was assumed for the primary LCI?
The initial study was to be done on commonly available consumer sizes of popular soft drinks for each packaging material. Franklin Associates used the most common size for each soft drink container. Only 8 ounce glass bottles of popular carbonated soft drinks were found in various grocery stores/convenience stores in the Kansas City area. The panelist is correct that the only 8 ounce glass bottles found were the Coca-Cola contour non-refillable bottle. No other soft drink brands using 8 ounce glass bottles were found in the Kansas City market, nor on the internet. A statement will be added in the System Description section describing the 8 ounce glass bottles.
- Why was the steel crown chosen for the glass bottle studied instead of the more common polypropylene (PP) closure, as used on the PET bottle? The impact of this choice is easily seen in the Addendum. For example, the steel crown adds 65.2 pounds per 10,000 glass containers solid waste compared to 29.8 pounds for the PP closure.
The steel crown was chosen for the 8 ounce glass bottle as it was the only 8 ounce glass bottle found in the Kansas City market. No PP closures were found on any glass bottles used in the soft drink market.
- Why was the PP closure not chosen for the 12-ounce glass bottle in the Addendum? It is the more common type of closure now in use and would have been essentially the same as the one used for the
Addendum 2 Peer Review
CLIENTS\PETRA\KC102196.doc 08.14.09 3692.00.001.001
AD2-9
PET bottle. The PP closure contributed lower energy use (0.21 MMBtu versus 0.71 for the steel crown and 2.96 for the aluminum cap) and lower solid waste by weight (5.44 lb. versus 65.2 for steel and 163 for aluminum). Why was a primary aluminum closure chosen instead of one with recycled content? This assumption should at least be checked with the aluminum closure manufacturer.
Again, no PP closures were found on any glass bottles used in the soft drink market. Franklin Associates staff called two aluminum closure manufactures who verified that the aluminum closures were made from primary aluminum.
- From where were samples collected? US bottlers in different areas of the country source containers from different package manufacturing plants. All manufacturers are trying to lightweight containers to reduce raw material cost. However, some plants may have installed newer manufacturing technology while others have not yet. Package design even varies slightly among container manufacturers.
All samples were collected in the Kansas City area. The panelist is correct that bottles from different areas of the country may have different designs and different weights. Franklin staff performed a sensitivity decreasing the weight of the glass bottle by 20 percent while increasing the weight of the aluminum can and PET bottle by 10 percent. These percent change amounts were a great deal higher than the weight ranges of the samples. These changes in weights did not change any of the main report conclusions and so were not included in the main body of the report. There is much more variation in the 12-ounce glass bottles; however a range of these were already included in Addendum 1.
- How many samples were measured to establish the average container weight? Page AD-3 includes the only reference to sample size—a disturbing 3.
More information on sample sizing has been included in the Limitations and Assumptions section of the report. The lowest number of samples was 5 of the PET bottles for the main report. The three that the panelist is referring to is the number of 12 ounce glass bottle types considered in the Addendum. Actually 4 or 6 samples were used for each of the glass bottle types. The percent difference between the highest and the lowest average weights for the 12-ounce glass bottles was 15 percent, which is why Franklin Associates included a range. As only one type of 8-ounce glass bottle was found, the difference in the weights was quite small.
Ø According to page 1-4, “This analysis uses aluminum (can) data from the US LCI database," which was developed in the early 2000’s, and might have been revised as late as 8/26/08. The same report page states, “This
Addendum 2 Peer Review
CLIENTS\PETRA\KC102196.doc 08.14.09 3692.00.001.001
AD2-10
analysis uses glass data from Franklin Associates’ private database…representative of 1990s production technologies…” But the PET data “represents the most recent LCI data for plastics production in North America,” conducted by FAL for the American Chemistry Council. There is at least a 10-year age difference between data for glass and PET manufacturing. The report further states FAL “assumes that the energy requirements and environmental emissions of glass production have not changed during the last ten years.” What is the basis of this assumption?
The temporal quality of the data will be stated clearly on page 1-4. The actual temporal representation of the data is within 6 years. The glass data represents 1997, the PET data represents 2003, and the aluminum data represents 1997. Each dataset is of excellent quality as they are primary datasets. It is possible that efficiencies within the processes have increased by a small percentage, but no research was performed on this subject. • The study doesn’t provide a description of the material production data in terms
of time period and representativeness of the technology inventoried. This information has been added on page 1-4. • The smelter electricity fuel mix for North American primary aluminum
production is about 70% hydropower and 30% coal. (Environ. Sci. Technol. 2009, 43, 1571–1577) (Note: This study shows a big difference between the North American grid and the smelter grid mix.) The report, however, indicates that “hydropower makes up 15 percent of the fuel profile for aluminum cans”. This major discrepancy would have a major impact on the results. Aluminum emissions would be much lower using the smelter fuel mix reported in Environ. Sci. Technol.
Although the smelter itself (and the ingot as well) does have an electricity grid containing a large percentage of hydropower. Most of the other processes in the production of aluminum do not. Specific electricity grids were used for bauxite mining, alumina production, and aluminum smelting and ingot casting. All other materials and processes used an average U.S. electricity grid. The 15 percent stated includes the energy for all processes in the aluminum can. Franklin Associates had used a 2002 electricity grid for the smelter, which used 64 percent hydropower for North America. When this issue was researched, it was discovered that as of 2007, 74 percent of the North American smelter electricity grid is from hydropower. This did decrease some of the results by a significant amount. This change was made in the models and the results tables throughout the report. • Data on CF4 and C2F6 emissions from aluminum smelting should either be reported,
or sensitivity analyses should be performed to demonstrate that they do not impact greenhouse gas carbon dioxide equivalents. Emissions that contribute to global warming were reported for carbon dioxide, methane, and nitrous oxide. Perfluorocarbon emissions from aluminum production are significant and should be
Addendum 2 Peer Review
CLIENTS\PETRA\KC102196.doc 08.14.09 3692.00.001.001
AD2-11
included. The PFC emissions intensity in North America was 1.12 kgCO2-eq/kg primary aluminum in 2005 and the total GHG emission factor was 10.7 kgCO2-eq/kg primary aluminum. (Environ. Sci. Technol. 2009, 43, 1571–1577).
A small amount of PFCs were shown in the atmospheric emissions tables; however as this specific PFC data was provided by the panelist, Franklin Associates staff researched the article and decided to replace the unknown PFC amount with the specific amounts provided in the article. These can be seen in the greenhouse gas results tables, as well as the atmospheric emissions results tables. Recycling rates have increased slightly from those used in the study. The aluminum can recycling rate reported by EPA in 2007 was 48.6% compared to 45.1% in 2006; PET recycling increased from 23.5% to 24.6% over the same period as reported by NAPCOR. A sensitivity analysis was performed on these increased recycling rates. No conclusions change with the increase of these recycling rates. Is the report complete, consistent, and transparent? The report is complete, consistent, and transparent. The calculations employed were, in general, clearly and carefully described. It should be noted that panel members were not provided comprehensive appendices with more detailed data and descriptions of the material inventories. Therefore, it was somewhat difficult for them to provide a thorough review of the study results. Panel members did have the following comments and questions while reviewing the report: • Three single-serving containers were studied, but the report never states these were
non-refillable containers. This has been included in relevant sections of the report. • “Transportation energy is the energy required to transport materials between each
step in a life cycle. Examples of the transportation steps included in this analysis include crude oil to refineries, resin pellets to fabricators, mined bauxite to alumina producers, and soda ash to glass factories. Transportation comprises less than 5 percent of the total energy for all soft drink container systems.” (Page ES-5). Many transportation steps are not included in the scope, however; so this statement is misleading. Transportation should be relabeled to indicate which steps it includes (transportation through container production and end-of-life stages). Any transportation from container manufacture through consumer use has been excluded from the study (page 1-3).
A statement has been added in sections where transportation results are analyzed.
Addendum 2 Peer Review
CLIENTS\PETRA\KC102196.doc 08.14.09 3692.00.001.001
AD2-12
• It would benefit the report to include FAL’s discussion of statistically significant differences on page 2-1, paragraph 2, in the “Executive Summary” at the beginning of “LCI Conclusions”.
This paragraph has been added to the Executive Summary. • The report states that bauxite is mined in Australia; Jamaica, however, is also a
major producer of bauxite and is much closer. The Mineral Commodities Summaries were used to estimate market share of the imported bauxite and alumina in the U.S. As of 2004, most of the U.S. bauxite does come from Jamaica and Guinea. The report statement has been edited to reflect this fact. • It would be helpful to see energy intensities and greenhouse gas emission factors
for the key materials: aluminum, glass and PET. Sources were indicated but it is difficult to check values. For example, for PET two sources were given—PlasticsEurope and Franklin—so it is difficult to determine these values.
The sources referred to by the panelist are for the data used in the fabrication of the plastic used in this analysis. All resin manufacture in this analysis are from the U.S. plastics database. This has been clarified in the Limitations and Assumptions section of Chapter 1. • The landfill compaction factors chosen can significantly impact the results of the
solid waste volume analyses. Since the 1990 study from which these are taken is almost 20 years old, it would be interesting to see how container light weighting has affected them.
There is the possibility that thinner aluminum can or PET bottle walls may change the compaction factors by a small amount; however, it is unlikely that a small change would affect the solid waste by volume conclusions in this analysis. • On page ES-6, paragraph 3 states “…the energy recovery is 5.5 percent of total
energy.” Since the previous sentences have discussed EMR, the “total energy” of what is confusing.
This statement has been clarified. • On Page A-15, final paragraph, the discussion implies that CO2 emissions from
waste incineration are not included; however, Table 2-6 seems to include these emissions.
This paragraph, as well as the paragraph on page A-18, has been edited to say that the theoretical carbon dioxide emissions have been included in the analysis.
Addendum 2 Peer Review
CLIENTS\PETRA\KC102196.doc 08.14.09 3692.00.001.001
AD2-13
• On Page A-18, it is not clear why there is a discussion of corrugated paper or landfill gas emissions, which are not relevant to this study (unless secondary packaging is added).
These paragraphs have been deleted. • The formula at the bottom of B-1 needs to be corrected from “x1” to “xi”. This error has been corrected. • The formulae throughout Appendix C need to be checked for accuracy. For example,
in the formula at the center of page C-2, it appears “∑VMiRCi” should actually be “ ∑VMi+iRCi+1”, and should be summed not from i=1 to n, but from i=1 to n-1.
The panelist is correct, and this formulation has been edited. • The footnote on page C-1 references a 1994 article, not one “recently” published as
stated in paragraph 2 of the same page. The word “recently” has been deleted. • Recycling methods followed are unclear. The report refers to open and closed
loop recycling, but Appendix C (“Recycling Theory and Methodology”) does not mention closed loop recycling. Page C-5, paragraph 1 talks about recycled material content in corrugated boxes “in this study”. However, secondary packaging was specifically excluded from this study. For aluminum, material production burdens are expected to be determined using primary and secondary material production energy intensities and emission factors. These would then be applied using the recycled content of the cans.
Wording on page C-5 has been edited to reflect the recycling used in this analysis. Are the conclusions appropriate based on the data and analysis? The Executive Summary conclusions are appropriate based on the data and analysis presented—an analysis of differently sized containers which doesn’t include secondary packaging and many distribution/transportation steps. The panel is greatly concerned that the sensitivity analyses in the Addendum are not mentioned in the Executive Summary, and that these analyses contradict some of the study’s findings. These important results should be an integral part of the Executive Summary and body of the report; they should not be relegated to an Addendum. Where conclusions differ in the Addendum analysis, discussion has been added to the Executive Summary explaining these differences and guiding the reader to the appropriate section of the Addendum.
Addendum 2 Peer Review
CLIENTS\PETRA\KC102196.doc 08.14.09 3692.00.001.001
AD2-14
PEER REVIEW PANEL QUALIFICATIONS The panel who performed the peer review of the report Life Cycle Inventory of Three Single-Serving Soft Drink Containers consisted of the following members: Beth Quay, chair, Dr. David T. Allen, and Dr. Greg Keoleian. Their educational backgrounds and professional experience and qualifications are summarized below. Beth H. Quay Ms. Quay, formerly Director of Environmental Technical Affairs for The Coca-Cola Company in Atlanta, Georgia is an owner/manager of a family business, Antique & Surplus Auto Parts. She is also an independent consultant to industry and has chaired five Life Cycle Inventory peer review teams. As chair of peer review teams she reviewed the draft LCI reports and appendices, developed a consensus report for the team, and represented the peer review team on issues raised during the peer review. Ms. Quay’s LCA experience at The Coca-Cola Company included managing and coordinating LCAs of beverage packaging and delivery systems. She participated in the SETAC “Code of Practice” Workshop in Sesimbra, Portugal in 1993, where she chaired the team that developed Chapter 6, “Presentations and Communications.” She also served as a member of the U.S. EPA LCA Peer Review Groups on Impact Analysis and Data Quality and participated in the SETAC Workshop, “A Technical Framework for Life Cycle Assessment,” in Smuggler’s Notch, Vermont in 1990. Ms. Quay’s background at The Coca-Cola Company also included management of environmental issues in company operations worldwide, including evaluation of environmental impacts of proposed packaging designs and development of recycling programs and comprehensive waste management solutions. She represented The Coca-Cola Company at environmental conferences and with industry environmental groups. Ms. Quay has a Bachelor’s Degree in Industrial Engineering (Summa Cum Laude) from Georgia Institute of Technology and has done graduate work in Applied Statistics. David T. Allen Dr. David Allen is the Gertz Regents Professor of Chemical Engineering and the Director of the Center for Energy and Environmental Resources at the University of Texas at Austin. His research interests lie in air quality and pollution prevention. He is the author of six books and over 150 papers in these areas. The quality of his research has been recognized by the National Science Foundation (through the Presidential Young Investigator Award), the AT&T Foundation (through an Industrial Ecology Fellowship), the American Institute of Chemical Engineers (through the Cecil Award for contributions to environmental engineering), and the State of Texas (through the Governor’s Environmental Excellence Award). Dr. Allen was a lead investigator in one of the largest and most successful air quality studies ever undertaken: the Texas Air Quality Study (www.utexas.edu/research/ceer/texaqs). His current research is focused on using the
Addendum 2 Peer Review
CLIENTS\PETRA\KC102196.doc 08.14.09 3692.00.001.001
AD2-15
results from that study to provide a sound scientific basis for air quality management in Texas. In addition, Dr. Allen is actively involved in developing Green Engineering educational materials for the chemical engineering curriculum. His most recent effort is a textbook on design of chemical processes and products, jointly developed with the U.S. EPA. Dr. Allen has extensive experience in LCA and has served on a number of peer review panels of LCIs. He has taught short courses on LCA for government agencies, private companies and in continuing education programs. Dr. Allen received his B.S. degree in Chemical Engineering, with distinction, from Cornell University in 1979. His M.S. and Ph.D. degrees in Chemical Engineering were awarded by the California Institute of Technology in 1981 and 1983. He has held visiting faculty appointments at the California Institute of Technology, the University of California, Santa Barbara, and the Department of Energy. Gregory A. Keoleian, PhD Dr. Keoleian as Co-Director of the Center for Sustainable Systems is directly involved in the primary mission of the Center which is to organize and lead interdisciplinary research and education on the application of life cycle based models and sustainability metrics. He has been involved in teaching and research at the University of Michigan for over 20 years, and has an impressive list of accomplishments in Life Cycle Inventory (LCI)/Life Cycle Assessment (LCA) and related fields. He has been principal investigator on 29 funded research projects totaling over $3 million since 1989. Nine of these projects involved LCI/LCA projects, and the balance are in related areas such as design for the environment, pollution prevention, and industrial ecology. In addition, Dr. Keoleian has authored or co-authored more than 100 articles and papers for professional journals, peer reviewed technical reports, technical papers, plus presentations at conferences and workshops. Finally, he has authored or co-authored books or chapters in books on the subject of Life Cycle Assessment, industrial ecology, and pollution prevention. In short, he has been a leader in the fields of LCA, pollution prevention, and industrial technology. Dr. Keoleian has also been a peer reviewer for a number of LCI/LCA reports. Dr. Keoleian has BS degrees in Chemical Engineering and Chemistry (1980), a MS degree in chemical engineering (1982), and a PhD in Chemical Engineering (1987) all from the University of Michigan.