Embed Size (px)
Citation preview
Sacconi et al. J Infrastruct Preserv Resil (2021) 2:25 https://doi.org/10.1186/s43065-021-00040-3
RESEARCH
Life-cycle cost analysis of bridges subjected to fatigue damageStefano Sacconi, Laura Ierimonti, Ilaria Venanzi* and Filippo Ubertini
Abstract
Life-cycle cost analysis (LCCA) is a decision-making tool particularly useful for the design of bridges as it predicts lifetime expenses and supports the inspections management and the maintenance activities. LCCA allows to consider uncertainties on loads, resistances, degradation and on the numerical modelling and structural response analysis. It also permits to consider different limit states and different types of damage in a unified framework. Among the types of damages that can occur to steel and steel-concrete composite bridges, fatigue is one of the most dangerous ones, as it may lead to sudden and fragile rupture, even at operational traffic levels. In this context, the present paper proposes a framework for LCCA based on the use of the Pacific Earthquake Engineering Research (PEER) equation which is for the first time utilized for fragility and cost analysis of bridges subjected to fatigue, highlighting the pos-sibility of treating the problem of fatigue damage estimation with an approach similar to the one currently adopted for damage induced by other hazards, like earthquake and wind. To this aim, a damage index computed through the Palmgren-Miner’s rule is adopted as engineering demand parameter. The framework is applied to a composite steel-reinforced concrete multi-span roadway bridge by evaluating the fatigue limit state from different traffic load models, i.e. a Technical Code-based model and a model based on results of Weigh in Motion monitoring system. The evolution over time of the probability of failure and the life-cycle costs due to fatigue damage induced by heavy traffic loads are investigated for different probability distributions of the engineering demand parameter and for different fragility models. The comparison between the fatigue failure probabilities and the life-cycle costs obtained with the two traffic models, encourages the adoption of traffic monitoring systems for a correct damage estimation.
Keywords: Life cycle cost analysis, PEER equation, Traffic load, Fatigue damage
© The Author(s) 2021. Open Access This article is licensed under a Creative Commons Attribution 4.0 International License, which permits use, sharing, adaptation, distribution and reproduction in any medium or format, as long as you give appropriate credit to the original author(s) and the source, provide a link to the Creative Commons licence, and indicate if changes were made. The images or other third party material in this article are included in the article’s Creative Commons licence, unless indicated otherwise in a credit line to the material. If material is not included in the article’s Creative Commons licence and your intended use is not permitted by statutory regulation or exceeds the permitted use, you will need to obtain permission directly from the copyright holder. To view a copy of this licence, visit http:// creat iveco mmons. org/ licen ses/ by/4. 0/.
IntroductionThe LCCA is a well-established probabilistic-based procedure in earthquake engineering which has been recently considered in the structural design. It allows to compute, in a probabilistic setting, the total lifetime cost of a specific design solution, accounting for all the possible cost sources like initial costs, repair and main-tenance costs, downtime costs and disposal costs. The main objective is to assist decision makers in correct economic resources allocation according to the best cost-benefit performance criteria considering the phases of
design, construction and management of the building. The basic theory of LCCA with a general formulation for the evaluation of the expected life-cycle is presented in [1]. Although LCCA is a long-used methodology in earthquake engineering [1, 2] and in wind engineering applications [3–5], including design of the main structure and/or auxiliary damping systems [6–8], it is currently spreading for extensive use in bridges, to compliant with real service conditions and account for inspections and maintenance activities [9, 10]. Indeed, a life-cycle cost model for a bridge allows the consideration of the effects of multiple types of hazards, i.e., earthquake, wind, traf-fic, degradation, flood-induced scour, carbonatation, and of different types of limit states, i.e., the ultimate strength for bending and shear, the serviceability limit states of
Open Access
Journal of InfrastructurePreservation and Resilience
*Correspondence: [email protected] of Civil and Environmental Engineering of University of Perugia, Via G. Duranti, 93, 06125 Perugia, Italy
Page 2 of 13Sacconi et al. J Infrastruct Preserv Resil (2021) 2:25
deformation and stresses, the fatigue limit state and aer-oelastic limit states in the case of long-span bridges [11, 12].
In this context, a considerable body of research has been recently devoted to the probabilistic assessment of the life-cycle costs of bridges under various hazards which contribute to damage occurrence. A practical life-cycle cost-based formulation for the optimum design of steel bridges is proposed in [13]. The optimal target reli-ability is explored by comparing the reliability index and the estimated life-cycle cost in [14, 15]. In [16] a fragility-based framework for investigating the serviceability of a bridge in its life-cycle under earthquakes and traffic loads is presented. A resource-constrained project schedul-ing problem (RCPSP) framework to deal with the budget allocation and the adjustment of the bridge’s life-cycle maintenance is proposed in [17]. The challenges in the life-cycle performance of infrastructure systems in terms of their assessment, monitoring, management and main-tenance is investigated in [18] while a model to optimize the maintenance strategies based on structural health monitoring information on highway bridges, including the maintenance cost and monitor cost is proposed in [19]. Comprehensive frameworks for bridge life-cycle per-formance and cost assessment are provided in [20, 21].
Among the types of damage that can produce signifi-cant losses in bridges, fatigue is one of the most impor-tant one, as it may produce fragile rupture to metallic members. For this reason, numerous studies were con-ducted on the fatigue reliability of steel bridges. The influence of environmental effects (temperature) and traffic loads on fatigue behavior of a long-span suspen-sion bridge is investigated in [22]. Different probability density functions of equivalent stress ranges on fatigue reliability are explored in [23] for existing bridges. In [24] the fatigue-related damage of bridges is evaluated accounting for multiple hazards and in [25] a calibra-tion factor is proposed in order to correlate the expected number of cycles to failure to an equivalent value which includes both contributing and non-contributing stress cycles. Additionally, the use of on-site monitoring data is growing attention in order to obtain a more accurate evaluations of fatigue reliability [26–28].
In this context, the objective of the present paper deals with the estimation of the monetary life-cycle loss assess-ment of roadway bridges, carried out in the context of the (Performance Based Design) PBD approach, a prob-abilistic-based approach capable of taking into account different sources of uncertainties such as those related to multiple hazard event occurrence, the structural response, the performance of the monitoring system and so on. Hence, a general and comprehensive methodol-ogy accounting for multiple-hazards and several limit
states, exploiting the PEER convolution integral [29] to compute the probabilities of failure related to life-cycle costs is proposed. In particular, the proposed framework is specified to the case of bridges subjected to fatigue damage. The estimation of fatigue-related probability of failure using the PEER framework is a novelty in the scientific literature and allows to insert the evaluation of fatigue-damage induced costs in a comprehensive and unified framework for life-cycle cost assessment of bridges. Starting from the knowledge of the traffic load model, that can be obtained by Weigh in Motion (WIM) system or by Codes’ prescriptions, the gross vehicles weight (GVW) is assumed as intensity measure (IM) and a fatigue damage index (D) calculated through the Palmgren-Miner’s rule is adopted as engineering demand parameter (EDP). The damage accumulation is evalu-ated by considering the time dependency of the fatigue damage index. The framework is applied to a composite steel-reinforced concrete multi-span roadway bridge by evaluating the fatigue limit state from the traffic loads defined by the Eurocode and obtained through a WIM monitoring system, for different probability distributions of the EDP and for different fragility models.
Fatigue LCCA of bridgesGeneral LCCA methodologyThe general formulation of the expected value of the total cost in the lifetime of a bridge, eventually equipped with a Structural Health Monitoring system (SHM), consider-ing several hazard types and limit states at the same time, can be expressed through the following expression:
where E [.] denotes the expected value operator; Lt is the lifetime of the bridge expressed in years; J is the total number of the considered limit states; S is the total number of analysed sections; H is the total number of the considered hazards; C0 is the initial cost of the bridge that includes the costs for design, testing, construction, terrain purchase, safety burdens. If a SHM system is adopted, like for example a WIM system for traffic load measurement, CSHM,0 is the initial cost of the WIM sys-tem, CSHM,M is the maintenance costs of the WIM sys-tem comprising the annual costs of the recalibration CSHM,m and sensors replacement costs CSHM,r (CSHM,M = CSHM,m+ CSHM,r). E[Cj,s,h] is the expected value of the cost of the j-th limit state being reached in the s-th sec-tion of the bridge and due to the h-th hazard, including cost of damage and repair; Cm is the maintenance cost per year; Ci is the inspection cost per year; r is the dis-count rate.
(1)
E[
C(
Lt)]
= C0 + CSHM,0 +
Lt∑
t=1
[
CSHM,M(t) + Cm(t) + Ci(t)
(1 + r)t+
H∑
h=1
J∑
j=1
S∑
s=1
E[
Cj,s,h(t)]
(1 + r)t
]
Page 3 of 13Sacconi et al. J Infrastruct Preserv Resil (2021) 2:25
By normalizing expected costs in Eq. (1) with respect to the initial cost C0, the following expression can be obtained:
where cSHM,0=CSHM,0/ C0, c,m=Cm/ C0, cm=Cm/ C0, ci=Ci/ C0 and kj,s,h can be defined as follows:
where cj is the failure cost related to the j-th limit state, cr is the repair cost per unit length, P is the probability threshold beyond which the repair cost is required and Pj,s,h is the annual failure probability at year t and at sec-tion s, related to limit state j and to hazard h. Making the hypothesis that the bridge is restored to its original condition after each failure occurrence and that multiple hazards never occur simultaneously, the annual failure probability can be evaluated by using the PEER convolu-tion integral, as follows:
where IM is the intensity measure related to the h-th hazard; EDP is the engineering demand parameter at section s; DS is the damage state associated to the achievement of the j-th limit state; P(DS|EDP) is the fra-gility curve (the complementary cumulative distribution function of DS conditioned to the occurrence of EDP); f(EDP|IM) is the probability density function (PDF) of EDP conditional on IM; f(IM) is the PDF of IM.
It is worth mentioning that the methodology is general and the effect of different mechanisms in which damage accumulates over time or multiple hazards interaction may be included by introducing state-dependent and multi-hazard fragility curves [30, 31].
Failure probability evaluation for bridges subjected to fatigue limit state based on the PEER equationThe PEER approach has been adopted so far for bridges’ damage probability evaluation related to ultimate limit states of bending and shear (due to earthquake, wind and traffic loads) and for deformability limit states (due to traffic loads). The main contribution of the present paper is to extend the PEER approach to the case of fatigue
(2)
c(
Lt
)
= E
[
C(
Lt
)
− C0
C0
]
= cSHM,0 +
Lt∑
t=1
[
cSHM,M(t) + cm(t) + ci(t)
(1 + r)t+
H∑
h=1
J∑
j=1
S∑
s=1
E[
kj,s,h(t)]
(1 + r)t
]
(3)kj,s,h =
⎧
⎪
⎨
⎪
⎩
cjPj,s,h
C0
if Pj,s,h < PcrC0
if Pj,s,h = P
(4)
Pj,s,h =
∫ ∫
P(DS|EDP) f(EDP|IM)f(IM) dEDP dIM
damage probability estimation by means of a general for-mulation. It is hypothesized for simplicity that fatigue occurs on members that do not deteriorate over time due to corrosion. Nonetheless, it is possible the inclusion in the unified framework of the coupled corrosion-fatigue damage phenomena [32, 33].
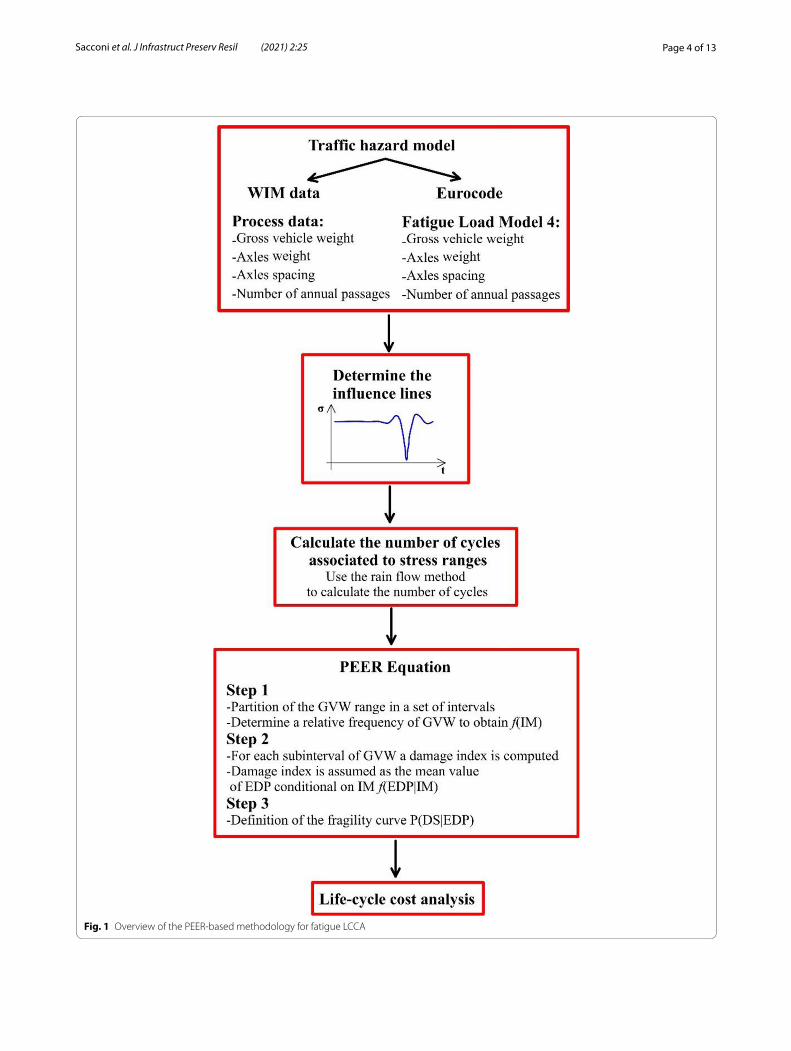
The proposed methodology, schematically represented in Fig. 1, starts from the knowledge of the traffic load model, that can be obtained following two different procedures:
1. using monitoring data obtained from a Weigh-In-Motion (WIM) system capable of detecting the gross vehicle weight, the axles weights and spacings and the number of the vehicles that annually pass through the bridge;
2. exploiting information provided by the National Standards that give the annual traffic composition.
Once known the traffic model, the loading-induced stress time histories are computed by influence lines to obtain the variation of bending moment at a spe-cific cross section of the bridge s and the correspond-ing normal stresses Δσ at the specific point of the cross section where the analyzed fatigue detail is located. Then, using the time histories of stresses at the loca-tions of the fatigue-sensitive structural details, the number of cycles ni associated with the stress range Δσi are determined through the rain flow method [34].
The PEER equation (Eq. 4) is particularized for com-puting fatigue damage probability. To this aim, the gross vehicle weight (GVW) is adopted as intensity measure (IM). The traffic hazard curve, whose first derivative is the f(IM) in the PEER equation, is specific for the ana-lysed bridge and represents the annual relative fre-quency of vehicles passages as a function of the GVW. In the proposed methodology the fatigue damage is modeled according to the Palmgren-Miner’s rule, which is based on the hypothesis that the fatigue damage is equal to the accumulated cycle ratio [35], expressed by:
where ni is the number of cycles associated with the stress range Δσi and Ni is the corresponding cycles to fail-ure obtained from the S-N Wöhler curve [35], D is the damage index assumed as random variable (as EDP) in the PEER equation. The randomness of D allows account-ing for uncertainties on stress cycles computation (and consequently on numbers of stress cycles ni) and num-bers of cycles to failure Ni evaluation.”
Exploiting Eq. (4) it is possible to determine the annual probability of exceeding the fatigue limit state due to
(5)D =∑
i
ni
Ni
Page 4 of 13Sacconi et al. J Infrastruct Preserv Resil (2021) 2:25
Fig. 1 Overview of the PEER-based methodology for fatigue LCCA
Page 5 of 13Sacconi et al. J Infrastruct Preserv Resil (2021) 2:25
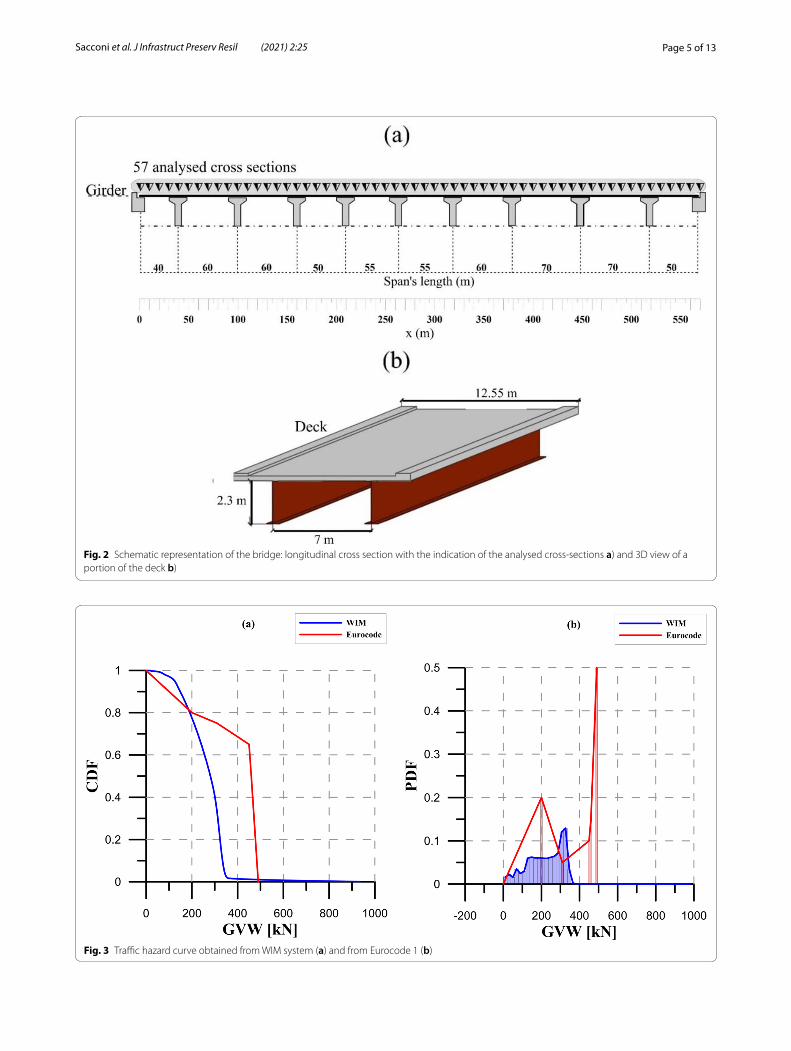
Fig. 2 Schematic representation of the bridge: longitudinal cross section with the indication of the analysed cross-sections a) and 3D view of a portion of the deck b)
Fig. 3 Traffic hazard curve obtained from WIM system (a) and from Eurocode 1 (b)
Page 6 of 13Sacconi et al. J Infrastruct Preserv Resil (2021) 2:25
traffic load. The following steps are carried out for the computation of the PEER equation (Fig. 1):
• partition of the GVW range, available from WIM data or from National Standards, in a set of intervals. Known the annual number of passages correspond-ing to the vehicles comprised in each subinterval, it is possible to determine a relative frequency diagram of GVW which is used to obtain the probability distri-bution of GVW, i.e., f(IM);
• computation, for each k-th subinterval of GVW, of a damage index Dk as the sum of the damage indices of the vehicles belonging to the k-th subinterval, exploit-ing Eq. (5). Dk is assumed as the mean value of the EDP conditional on IM, f(EDP|IM). A probability distribu-tion is associated to EDP, f(EDP|IM), e.g. normal or log-
normal, with mean value equal to Dk and a coefficient of variation (COV) taken from literature. This allows accounting for uncertainties in traffic load model char-acterization and response parameters estimation.
• modification of the probability distribution of EDP over years to account for damage accumulation over time. For each k-th subinterval of GVW, the mean value of D at time ti, is obtained as the sum of Dk(ti-1) and Dk(ti). If the traffic model is constant with time Dk(Lt)=Lt·Dk(t1);
• definition of the fragility curve P(DS|EDP); the fatigue damage occurs when the damage value D (calculated through Eq. (5)) equals its critical value Dcrit:
To account for the random nature of fatigue damage (i.e. the uncertainty on fatigue damage occurrence in
(6)Dcrit − D = 0
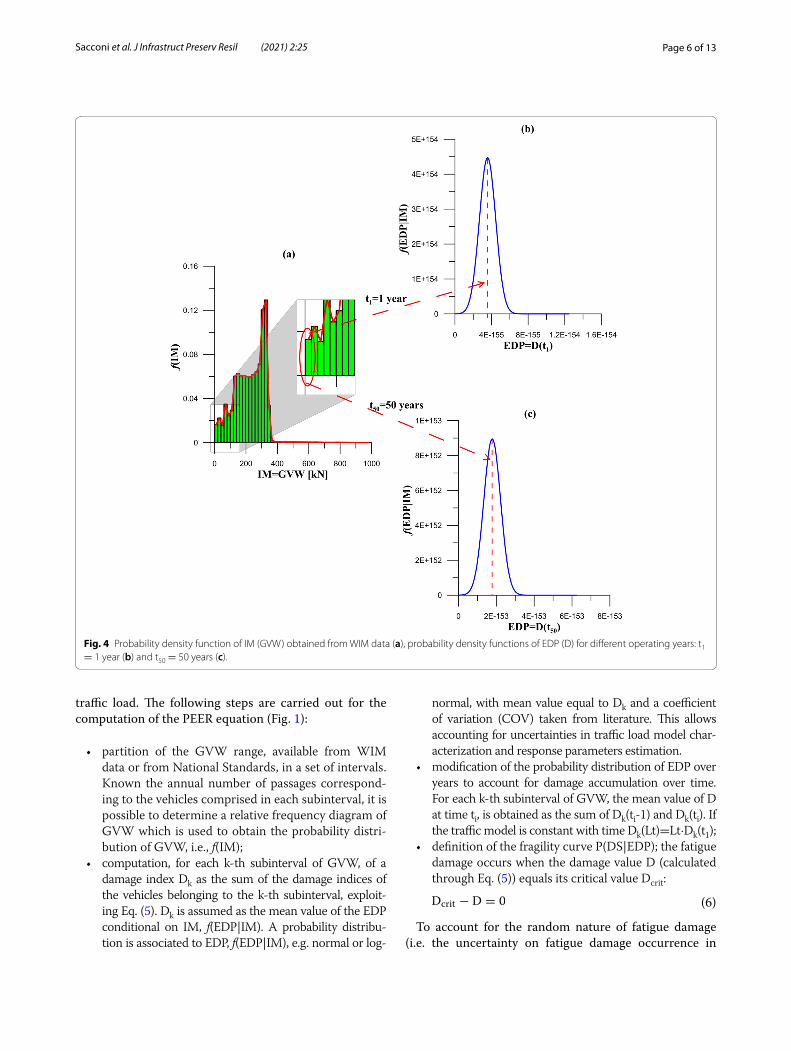
Fig. 4 Probability density function of IM (GVW) obtained from WIM data (a), probability density functions of EDP (D) for different operating years: t1 = 1 year (b) and t50 = 50 years (c).
Page 7 of 13Sacconi et al. J Infrastruct Preserv Resil (2021) 2:25
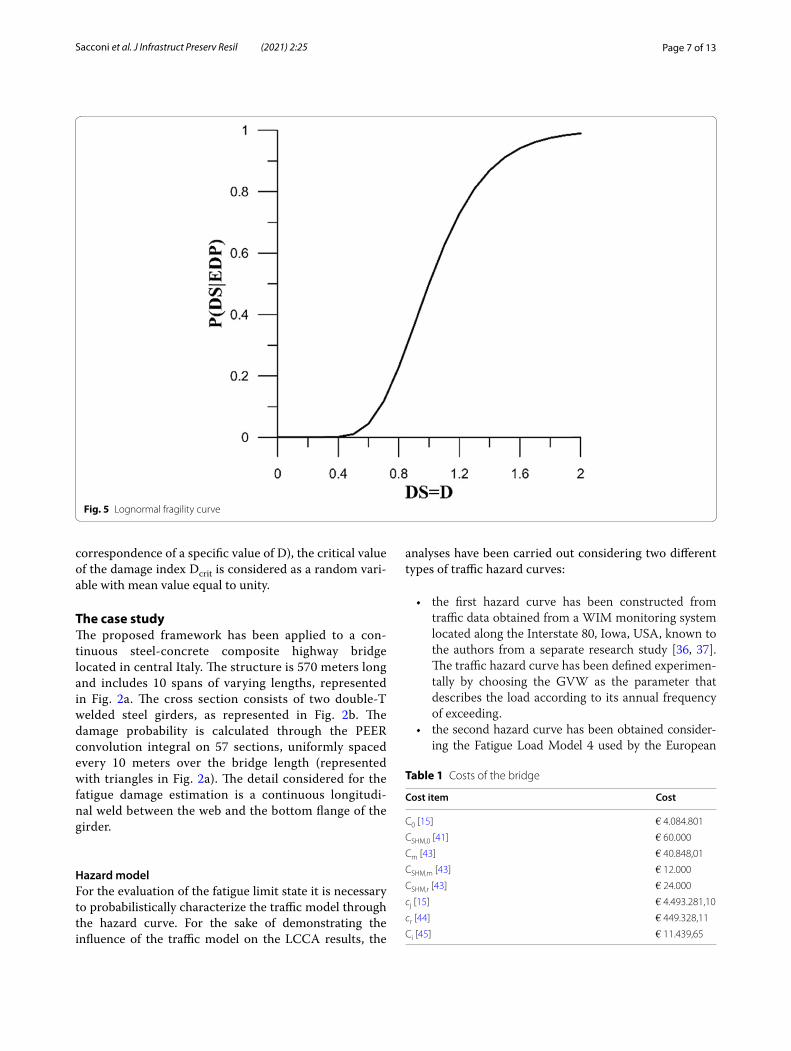
correspondence of a specific value of D), the critical value of the damage index Dcrit is considered as a random vari-able with mean value equal to unity.
The case studyThe proposed framework has been applied to a con-tinuous steel-concrete composite highway bridge located in central Italy. The structure is 570 meters long and includes 10 spans of varying lengths, represented in Fig. 2a. The cross section consists of two double-T welded steel girders, as represented in Fig. 2b. The damage probability is calculated through the PEER convolution integral on 57 sections, uniformly spaced every 10 meters over the bridge length (represented with triangles in Fig. 2a). The detail considered for the fatigue damage estimation is a continuous longitudi-nal weld between the web and the bottom flange of the girder.
Hazard modelFor the evaluation of the fatigue limit state it is necessary to probabilistically characterize the traffic model through the hazard curve. For the sake of demonstrating the influence of the traffic model on the LCCA results, the
analyses have been carried out considering two different types of traffic hazard curves:
• the first hazard curve has been constructed from traffic data obtained from a WIM monitoring system located along the Interstate 80, Iowa, USA, known to the authors from a separate research study [36, 37]. The traffic hazard curve has been defined experimen-tally by choosing the GVW as the parameter that describes the load according to its annual frequency of exceeding.
• the second hazard curve has been obtained consider-ing the Fatigue Load Model 4 used by the European
Fig. 5 Lognormal fragility curve
Table 1 Costs of the bridge
Cost item Cost
C0 [15] € 4.084.801
CSHM,0 [41] € 60.000
Cm [43] € 40.848,01
CSHM,m [43] € 12.000
CSHM,r [43] € 24.000
cj [15] € 4.493.281,10
cr [44] € 449.328,11
Ci [45] € 11.439,65
Page 8 of 13Sacconi et al. J Infrastruct Preserv Resil (2021) 2:25
Technical Standard (Eurocode 1 – Part 2) [38] for the estimation of fatigue damage on bridges. The Euroc-ode provides, for each one of the five vehicles specified in Fatigue Load Model 4 and for a specific type of road, the weight of the single axles and the percentage of the number of passages with respect to the total number of annual passages. The IM is the GVW calculated as the sum of the weights of the individual vehicle axles provided by the Eurocode. The total number of vehi-cles is assumed equal to the one provided by the WIM system, to consider the effect of the sole traffic distri-bution, being equal the traffic intensity.
The traffic hazard curves (Cumulative distribution func-tion, CDF, and probability density function, PDF, of GVW) obtained from WIM system data and from Eurocode 1 are compared in Fig. 3, for the same type of road (highway road). It is visible from the Figures the large difference that can derive from the assumption of different load models.
In the following analyses it is assumed that the annual composition of traffic does not change over time, so the f(IM) is the same for all years. Conversely, the value of the EDP changes over time due to the accumulation of damage.
Fatigue damage assessmentThe calculation of the damage index D is done through Eq. (5), where ni is determined from WIM data in case of use of the monitoring system while ni is defined as a percentage of the total number of vehicle passage in the case of adoption of Eurocode Fatigue Load Model 4. In both cases, in addition to providing information regarding the total weight of the vehicles, the weight distribution of the axles and their spacing are provided. This information is necessary for the determination of the influence line which allows to evaluate the time histories of the internal forces and the corresponding stresses at the analysed sections. The stress ranges are determined by the rainflow method [34] and the corre-sponding cycles to failure obtained from the S-N curve. Without loss of generality the S-N logarithmic curves are taken from Eurocode 3 [39] and are considered as deterministic, since the uncertainty in their evaluation is implicitly considered by assuming the damage index D as a random variable.
Figure 4 illustrates the application of the PEER-based procedure for the computation of fatigue damage prob-ability. Figure 4a shows the probability distribution of IM, f(IM), obtained from WIM data. The Figure high-lights that, for each subinterval in which the f(IM) is subdivided, the probability distribution of the damage index D at the i-th year is computed. The f(EDP|IM) at subsequent years is computed by assuming as mean value of the distribution the sum of the damage indexes accumulated in all the previous years. The damage
Table 2 Inspection costs
Ci Cost
Inspection of bridges and viaducts [45] 15.52 €/m
Inspection of piers [45] 235.75 €/pier
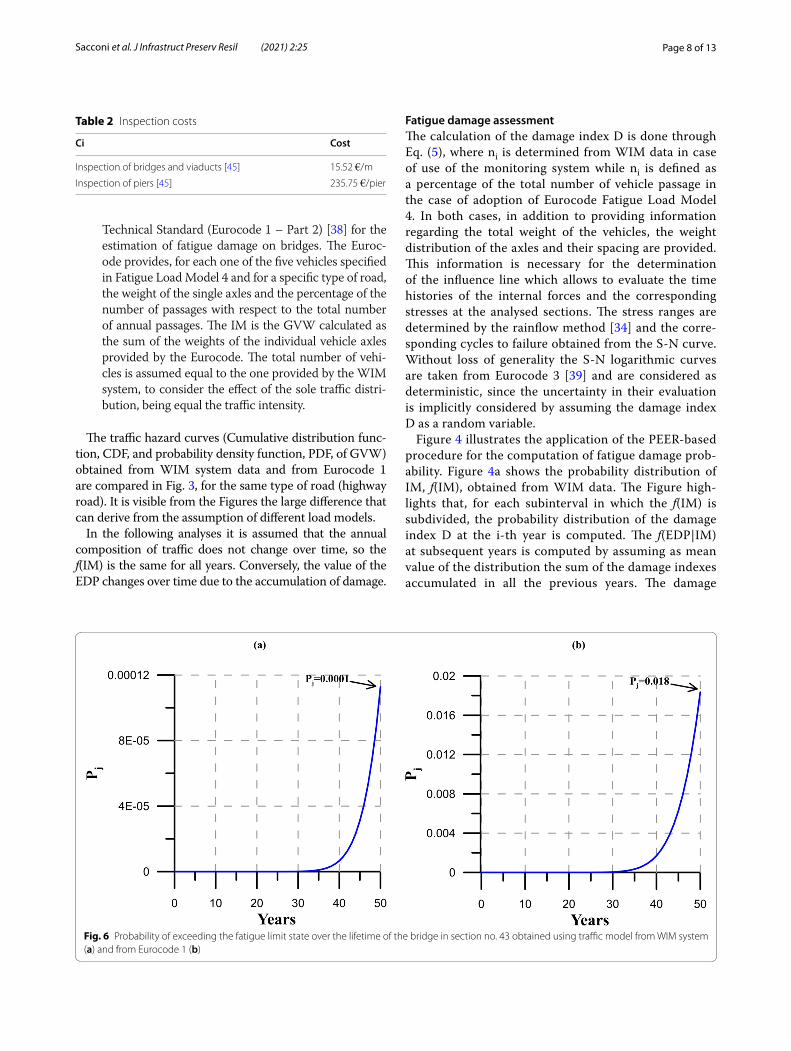
Fig. 6 Probability of exceeding the fatigue limit state over the lifetime of the bridge in section no. 43 obtained using traffic model from WIM system (a) and from Eurocode 1 (b)
Page 9 of 13Sacconi et al. J Infrastruct Preserv Resil (2021) 2:25
index D calculated for each range of GVW is assumed to have a normal distribution with a COV=0.25 [40].
As shown in Fig. 5, the uncertainty assumed on the Palmgren-Miner damage accumulation rule (Dcrit) is assumed to be lognormal distributed with mean 1.0 and COV=0.3 [40].
Life‑cycle cost analysisLCCA is carried out by applying (Eqs. 2 and 3). The initial cost of the bridge C0 is taken from design documenta-tion [15] and the initial cost of the WIM system CSHM,0, including sensors and ancillary works, is assumed equal to € 60.000, based on information provided by produc-ers [41]. The annual maintenance cost of the bridge Cm is considered as the 1% of the initial cost of the bridge [42], while the annual cost of maintenance of the WIM
system CSHM,m is assumed equal to the 20% of the initial cost. It is hypothesized that after 10 years the sensors are replaced and the cost of the new sensors CSHM,r is the 40% of the initial costs [43].
The unit failure cost cj (Eq. 3), can be computed as a percentage ν of the initial cost C0 [15], as follows:
The coefficient ν is assumed equal to 1.1 to account for demolition and disposal costs [15]. The repair cost cr (Eq. 3) is taken as the 10% of cj (cr = 0.1 cj). The cost items presented above are summarized in Table 1.
The annual inspection cost Ci is defined through the price list of Italian National Autonomous Roads Corpo-ration (ANAS) [45] and it is evaluated by including the cost elements reported in Table 2.
(7)cj = ν C0
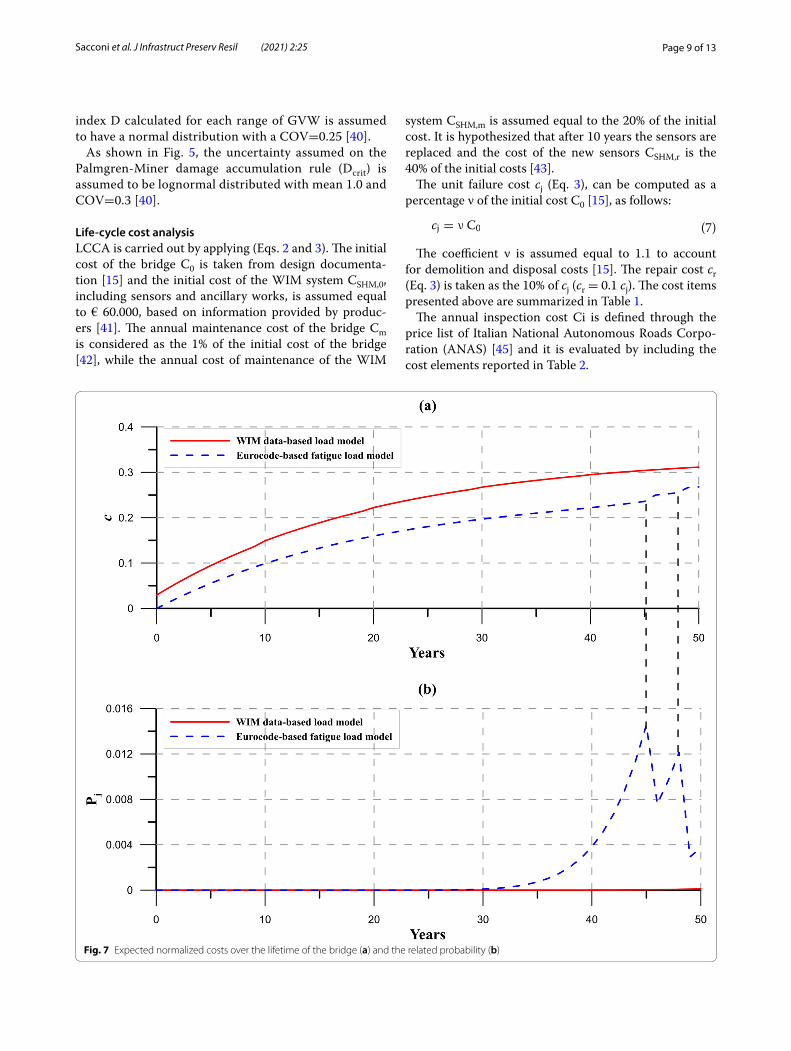
Fig. 7 Expected normalized costs over the lifetime of the bridge (a) and the related probability (b)
Page 10 of 13Sacconi et al. J Infrastruct Preserv Resil (2021) 2:25
The discount rate is assumed equal to r = 0.05 and the threshold of the probability beyond which a repair interven-tion is required is assumed without loss of generality equal to 10-2, corresponding to an average value of reliability index suggested by Eurocode 0 for the structural members sub-jected to the fatigue limit state (1.5 < β < 3.8) [46, 47].
Numerical resultsFigure 6 shows the probability of exceeding the fatigue limit state over time of one of the most critical bridge sections (no. 43, at the midspan of the 8th span), calcu-lated by Eq. (4). Figure 6 (a) represents the probability calculated from the hazard traffic curve obtained from the WIM system data and Fig. 6 (b) shows the probability
referred to the hazard traffic curve obtained from the Eurocode 1. The increase in probability over time is due to the accumulation of damage caused by the passage of vehicles across the bridge.
Figure 7(a) illustrates the expected life cycle cost over time of the bridge normalized with respect to the ini-tial construction costs (Eqs. 2 and 3) and Fig. 7(b) shows the corresponding cumulated probability of failure as a function of time by comparing the case in which the haz-ard traffic curve is obtained from the monitoring system and when it is obtained by the Eurocode 1. In the case of Eurocode, it can be observed a pronounced cost increase with time associated to the attainment of the probability threshold while, in the case of use of WIM data the overall
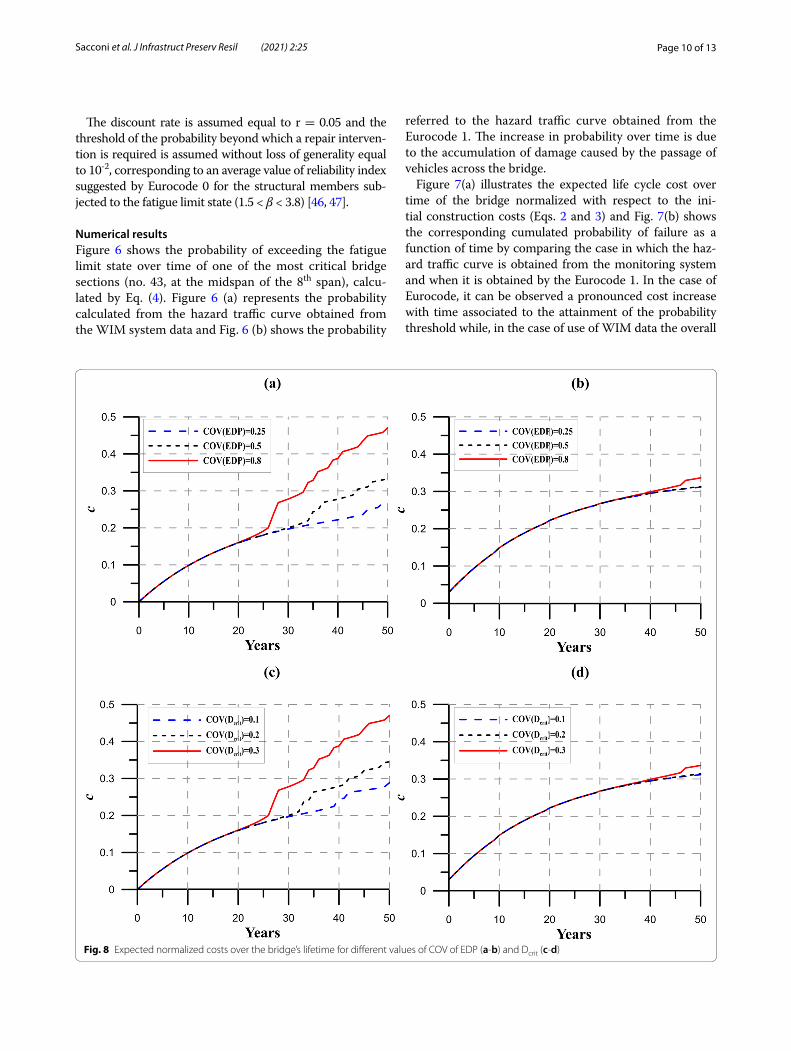
Fig. 8 Expected normalized costs over the bridge’s lifetime for different values of COV of EDP (a-b) and Dcrit (c-d)
Page 11 of 13Sacconi et al. J Infrastruct Preserv Resil (2021) 2:25
life-cycle costs are greater due to the significant initial, maintenance and replacement cost of the WIM system. Nonetheless this results strictly depend on the hypothesis made about costs of the WIM system and about the prob-ability distribution of EDP and fragility model. Conversely, the use of WIM system data has the obvious advantage of guaranteeing a more realistic estimate of fatigue damage probability.
Since the choice of the probability distributions of EDP and Dcrit significantly influence the expected costs, parametric analyses have been carried out on the varia-tions of the COVs of EDP and Dcrit. Figure 8(a) and (b) show the normalized expected cost, evaluated for dif-ferent values of COV of EDP (0.25, 0.5 and 0.8) for Dcrit lognormally distributed with mean 1.0 and COV = 0.3, for the case of Eurocode-based fatigue load model and WIM-based monitoring data load model, respectively. Figure 8(c) and (d) represent the normalized expected cost, evaluated with mean 1.0 and for different values of COV of Dcrit (0.1, 0.2 and 0.3) and for a fixed value of COV of EDP equal to 0.8, for the case of Eurocode-based fatigue load model and WIM-based monitoring data load model, respectively. It is visible from Fig. 8(a-b) that the expected cost increases over time and is greater
when the uncertainty on the EDP is equal to 0.8. On the other hand, Fig. 8(c-d) show that the cost is higher when the uncertainty on COV of Dcrit equals 0.3.
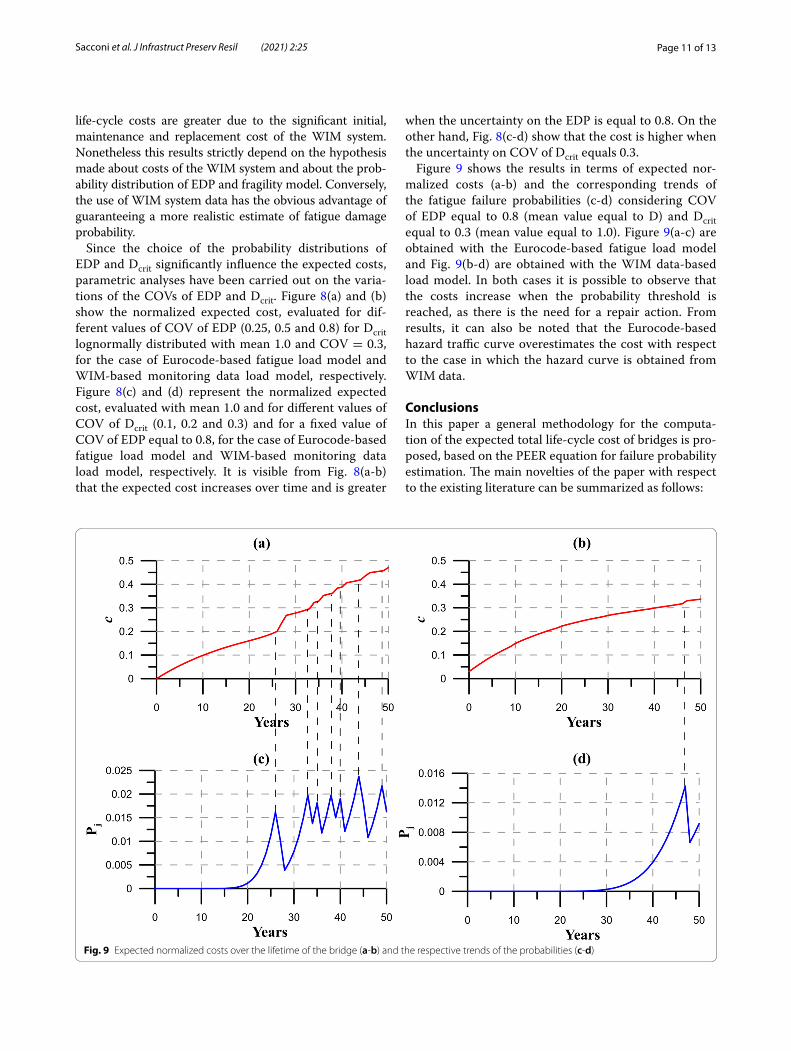
Figure 9 shows the results in terms of expected nor-malized costs (a-b) and the corresponding trends of the fatigue failure probabilities (c-d) considering COV of EDP equal to 0.8 (mean value equal to D) and Dcrit equal to 0.3 (mean value equal to 1.0). Figure 9(a-c) are obtained with the Eurocode-based fatigue load model and Fig. 9(b-d) are obtained with the WIM data-based load model. In both cases it is possible to observe that the costs increase when the probability threshold is reached, as there is the need for a repair action. From results, it can also be noted that the Eurocode-based hazard traffic curve overestimates the cost with respect to the case in which the hazard curve is obtained from WIM data.
ConclusionsIn this paper a general methodology for the computa-tion of the expected total life-cycle cost of bridges is pro-posed, based on the PEER equation for failure probability estimation. The main novelties of the paper with respect to the existing literature can be summarized as follows:
Fig. 9 Expected normalized costs over the lifetime of the bridge (a-b) and the respective trends of the probabilities (c-d)
Page 12 of 13Sacconi et al. J Infrastruct Preserv Resil (2021) 2:25
– the approach based on the PEER equation is for the first time applied to cost and fragility analysis of bridges subjected to fatigue, highlighting the possi-bility of treating the problem of fatigue damage esti-mation with an approach similar to the one currently adopted for damage induced by other hazards, like earthquake and wind;
– the proposed method can use data from WIM systems allowing a reliable life-cycle cost-based assessment.
Starting from the knowledge of the traffic load model, the gross vehicles weight is assumed as IM and the fatigue damage index calculated through the Palmgren-Miner’s rule is adopted as EDP. The damage accumula-tion is evaluated by considering the time dependency of the fatigue damage index.
The framework has been applied to a continuous steel-concrete composite highway bridge by evaluating the fatigue limit state from the traffic loads defined by the Eurocode 1 and obtained through a WIM monitor-ing system, for different probability distributions of the EDP and for different fragility models. The comparison between the fatigue failure probabilities and the life-cycle costs obtained with the two traffic models highlighted that the Eurocode-based hazard traffic curve overesti-mates the cost with respect to the case in which the haz-ard curve is obtained from WIM data, encouraging the adoption of traffic monitoring systems for a correct dam-age estimation.
AbbreviationsCDF: Cumulative distribution function; COV: Coefficient of variation; D: Dam-age index; EDP: Engineering demand parameter; GVW: Gross vehicles weight; IM: Intensity measure; LCCA : Life-cycle cost analysis; PBD: Performance Based Design; PDF: Probability density function; PEER: Pacific Earthquake Engineer-ing Research; RCPSP: Resource-constrained project scheduling problem; SHM: Structural Health Monitoring; WIM: Weigh-in-Motion.
AcknowledgementsThe authors gratefully acknowledge the support of the “Cassa di Rispar-mio di Perugia” Foundation, that funded this study through the Project “Development of an original life-cycle cost model for the optimal manage-ment of bridges and viaducts equipped with SHM systems” (Grant number 2019.0338.029), and the support of Brent Phares at Iowa State University and the Iowa Department of Transportation that provided the field monitoring system data.
Authors’ contributionsAll the Authors contributed to the design of the research, to the analysis of the results and to the writing of the manuscript. The implementation of the analysis was done by Stefano Sacconi with the cooperation of Laura Ierimonti. All authors read and approved the final manuscript.
FundingThe authors gratefully acknowledge the support of the “Cassa di Rispar-mio di Perugia” Foundation, that funded this study through the Project “Development of an original life-cycle cost model for the optimal manage-ment of bridges and viaducts equipped with SHM systems” (Grant number 2019.0338.029).
Availability of data and materialsThe data that support the findings of this study are available from the cor-responding author upon reasonable request.
Declarations
Competing interestsThere are no competing interests for this research work
Received: 23 July 2021 Accepted: 14 September 2021
References 1. Wen YK, Kang YJ (2001) Minimum building life-cycle cost design criteria. I:
Methodology. J. Struct. Eng 127(3):330–337 2. Wang CS, Zhai MS, Li HT, Ni YQ, Guo T (2015) Life-cycle cost based main-
tenance and rehabilitation strategies for cable supported bridges. Adv. Steel Constr. 11(3):395–410
3. Venanzi I, Lavan O, Ierimonti L, Fabrizi S (2018) Multi-hazard loss analysis of tall buildings under wind and seismic loads. Struct and Infrastruct Eng 14(10):1295–1311
4. Micheli L, Alipour A, Laflamme S (2021) Life-cycle-cost optimization of wind-excited tall buildings using surrogate models. Struct Des of Tall Spec Build 30(6):e1840
5. Ierimonti L, Venanzi I, Caracoglia L, M ASCE, Materazzi AL (2019) Cost-Based Design of Nonstructural Element for Tall Buildings under Extreme Wind Environments. J of Aerosp Eng 32(3):04019020
6. Micheli L, Alipour A, Laflamme S, Sarkar P (2019) Performance-based design with life-cycle cost assessment for damping systems integrated in wind excited tall buildings. Eng Struct 195:438–451
7. Micheli L, Cao L, Laflamme S, Alipour A (2020) Life-Cycle Cost Evalua-tion Strategy for High-Performance Control Systems under Uncertain-ties. J Eng Mech 146(2):04019134
8. Kleingesinds S, Lavan O, Venanzi I (2020) Life-Cycle cost-based opti-mization of MTMDs for tall buildings under multiple hazards. Struct Infrastruct Eng 17(7):921–940
9. Hasan MA, Yan K, Lim S, Akiyama M, Frangopol DM (2020) LCC-based identification of geographical locations suitable for using stainless steel rebars in reinforced concrete girder bridges. Struct. Infrastruct. Eng. 16(9):1201–1227
10. Wang Z, Dong Y, Jin W (2021) Life-Cycle Cost Analysis of Deteriorating Civil Infrastructures Incorporating Social Sustainability. J. Infrastruct. Syst. 27(3):04021013
11. Estes AC, Frangopol DM (2001) Bridge lifetime system reliability under multiple limit states. J Bridge Eng 6(6):523-528
12. Ubertini F (2010) Prevention of suspension bridge flutter using multi-ple tuned mass dampers. Wind & Struct 13(3):235–256
13. Lee KM, Cho HN, Choi YM (2004) Life-cycle cost-effective optimum design of steel bridges. J Constr Steel Res 60(11):1585–1613
14. Kim SH, Choi MS, Cho KI, Park SJ (2013) Determining the Optimal Structural Target reliability of a Structure with a Minimal Life-Cycle Cost Perspective. Adv Struct Eng 16(12):2075-2091
15. Venanzi I, Castellani R, Ierimonti L, Ubertini F (2019) An automated proce-dure for assessing local reliability index and life-cycle cost of alternative girder bridge solutions. Adv Civ Eng 5152031
16. Decó A, Frangopol DM (2013) Life-cycle risk assessment of spatially distributed aging bridges under seismic and traffic hazards. Earthquake Spectra. 29(1):127–153
17. Liu SS, Huang HY, Kumala NRD (2020) Two-Stage Optimization Model for Life Cycle Maintenance Scheduling of Bridge Infrastructure. Appl. Sci. 10(24):8887
18. Frangopol DM (2010) Life-cycle performance, management, and opti-mization of structural systems under uncertainty: accomplishments and challenges. Struct. Infrastruct. Eng. 7(6):389–413
19. Orcesi AD, Frangopol DM (2011) Optimization of bridge maintenance strategies based on structural health monitoring information. Struct. Saf. 33:26–41
Page 13 of 13Sacconi et al. J Infrastruct Preserv Resil (2021) 2:25
20. Frangopol DM, Dong Y, Sabatino S (2017) Bridge life-cycle performance and cost: analysis, prediction, optimisation and decision-making. Struct. Infrastruct. Eng. 13(10):1239–1257
21. Kim S, Frangopol DM (2011) Cost effective lifetime structural health monitoring based on availability. J. Struct. Eng. 137:22–33
22. Tong G, Aiqun L, Jianhui L (2008) Fatigue Life Prediction of Welded Joints in Orthotropic Steel Decks Considering Temperature Effect and Increas-ing Traffic Flow. Struct. Health Monit. 7(3):189–202
23. Kwon K, Frangopol DM (2010) Bridge fatigue reliability assessment using probability density functions of equivalent stress range based on field monitoring data. Int. J. Fatigue 32(8):1221–1232
24. Chen ZW, Xu YL, Wang XM (2012) SHMS-Based Fatigue Reliability Analysis of Multiloading Suspension Bridges. J. Struct. Eng. 138(3):299–307
25. Park JY, Park YC, Kim HK (2018) A methodology for fatigue reliability assessment considering stress range distribution truncation. Int. J. Steel Struct. 18(4):1242–1251
26. Guo T, Chen Y-W (2013) Fatigue reliability analysis of steel bridge details based on field-monitored data and linear elastic fracture mechanics. Struct. Infrastruct. Eng. 9(5):496–505
27. Farreras-Alcover I, Chryssanthopoulos MK, Andersen JE (2017) Data-based models for fatigue reliability of orthotropic steel bridge decks based on temperature, traffic and strain monitoring. Int. J. Fatigue 95:104–119
28. Bayane I, Long L, Thöns S, Brühwiler E (2019) Quantification of the conditional value of SHM data for the fatigue safety evaluation of a road viaduct. In: 13th International Conference on Applications of Statistics and Probability in Civil Engineering, ICASP13. South Korea, Seoul
29. Kunnath SK (2007) Application of the PEER PBEE methodology to the I-880 viaduct. I-880 Testbed Committee University of California, Davis, California
30. Anelli A, Mori F, Vona M (2020) Fragility curves of the urban road network based on the debris distributions of interfering buildings. Appl Sci (Swit-zerland) 10(4):1289
31. Aljawhari K, Gentile R, Freddi F, Galasso C (2020) Effects of ground-motion sequences on fragility and vulnerability of case-study reinforced concrete frames. Bull Earthq Eng. https:// doi. org/ 10. 1007/ s10518- 020- 01006-8
32. Deng L, Yan W, Nie L (2019) A simple corrosion fatigue design method for bridges considering the coupled corrosion-overloading effect. Eng Struct 178:309–317
33. Peng D, Jones R, Singh RRK, Berto F, McMillan AJ (2018) On the interac-tion between corrosion and fatigue which determines the remaining life of bridges. Fatigue Fract Eng Mater Struct 41(2):314–322
34. Downing SD, Socie DF (1982) Simple rainflow counting algorithms. J Fatigue 4(1):31–40
35. Miner M (1945) Cumulative damage in fatigue. J Appl Mech 12(3):159–164
36. Torti, M, Venanzi I, Laflamme S. Ubertini F (2021) Life-cycle management cost analysis of transportation bridges equipped with seismic structural health monitoring systems Struct Health Monit. https:// doi. org/ 10. 1177/ 14759 21721 996624
37. Sacconi S, Ierimonti L, Venanzi I, Ubertini F (2021) Towards the develop-ment of a comprehensive framework for life cycle cost analysis of bridges subjected to multiple hazards. In: Proceedings of the 8th ECCOMAS Thematic Conference on Computational Methods in Structural Dynamics and Earthquake Engineering. Greece, Athens
38. Eurocode 1 (2003) Actions on structures-Part 2: Traffic load on bridges, Eurocode 1: EN 1991-2. European Committee for Standardization, Brus-sels, Belgium
39. Eurocode 3 (2005) Design of steel structures-Part 1-9: Fatigue, Eurocode 3: EN 1993-1-9. European Committee for Standardization, Brussels, Belgium
40. Det Norske Veritas (2010) Fatigue Design of Offshore Steel Structures. No. DNV-RP-C203
41. KISTLER. https:// www. kistl er. com/ it/ appli catio ns/ sensor- techn ology/ pesat ura- dinam ica- wim
42. Wicke M (1988) Inspection, assessment and maintenance. Proceedings of the 13th International Association of Bridge and Structural Engineering Congress on Challenges to Structural Engineering. Finland, Helsinki
43. Hallenbeck M, Weinblatt H (2004) Equipment for Collecting Traffic Load Data. Transportation Research Board of the National Academies
44. Neves AC, Leander J, Gonzalez I, Karoumi R (2019) An approach to deci-sion making analysis for implementation of structural health monitoring in bridges. Struct Control and Health Monit 26(6):e2352
45. ANAS S.p.A (2020) Listino prezzi 2020. Prove, Indagini e Monitoraggio https:// www. strad eanas. it/ sites/ defau lt/ files/ PM- IG- MA_ LISTI NO% 20PRE ZZI% 202021. pdf
46. Eurocode 0 (2005) Basis of structural design, Eurocode 0: EN 1990. Euro-pean Committee for Standardization, Brussels, Belgium
47. Rackwitz R (2000) Optimization-the basis of code-making and reliability verification. Struct Saf 22(1):27–60
Publisher’s NoteSpringer Nature remains neutral with regard to jurisdictional claims in pub-lished maps and institutional affiliations.