Embed Size (px)
Citation preview
1
Life Cycle Comparison of Manual
and Machine Dishwashing in
Households
By
Gabriela Yvonne Porras
A thesis submitted in partial
fulfillment of the requirements for the
degree of Masters of Science
(Environment and Sustainability) at
the University of Michigan
April 2019
Thesis Committee:
Dr. Gregory A. Keoleian, Chair
Dr. Geoffrey Lewis

2
3
Abstract
Machine dishwashers are a unique consumer appliance since they are often
substituted with manual dishwashing. Although some studies indicate machine
dishwashers use less energy and water than manual dishwashing, their scopes are limited
to the use phase. Our study evaluates the full life cycle burdens for both manual and
machine dishwashing following typical and recommended behaviors. Use phase behaviors
are observed through a laboratory study and survey, while burdens are calculated using a
life cycle assessment framework. We find that typical manual dishwashing behaviors result
in the greatest greenhouse gas emissions (GHG). Even when recommended behaviors for
machine dishwashers are not followed, they outperform typical manual dishwashing.
Although manufacturers do not include typical behaviors like pre-rinsing when estimating
their value-chain emissions profile, these activities can increase lifetime GHG emissions
by 17%. The sustainability of the average American household can be significantly
enhanced by following recommended machine dishwashing instead of typical manual
dishwashing, thereby reducing GHG emissions by 72%.
ii
4
Acknowledgements
This project was initiated by Nagapooja Seeba, Global Sustainability Senior
Engineer at the Whirlpool Corporation, who presented this research opportunity at the
University of Michigan project fair. Throughout the course of this research, several people
at Whirlpool have provided their expertise. The observational laboratory studies were made
possible by Amanda Rush and her dishwasher team at the St. Joseph Tech Center. Shari
Bither and Cheri Hendrix supported this part of the study immensely. To the participants
in the observational laboratory study, thank you for being a fantastic dataset. Spreadsheets,
diagrams, and other supplemental information for modelling manufacturing were provided
by Druvaraj Slnu, Jennifer Peters, and Robert Schena. Brian Etzkorn was able to fill in
information gaps physical dishwasher parts, on a tour of the Findlay manufacturing plant.
I want to express my sincerest gratitude to all these individuals who made time in their
busy schedules to support this research.
Modelling of the machine dishwashers and manual life cycles on GaBi was
supported by Malcolm Hegemen and Susan Murphy, both consultants at thinkstep. My
understanding of databases and software was made possible by you two.
At the University of Michigan, this project has been supported by the Center for
Sustainable Systems. My sincerest appreciation goes to my advisors who helped me
navigate a field I had never done research in before and develop confidence in my
sustainability knowledge and skills. My advisor Dr. Keoleian has been a major guide in
this project, always keeping an eye on the big picture. My advisor Dr. Lewis has been able
to help me steer myself back on track when I was feeling lost. Both my advisors are
amazing experts in what they do and I truly cannot express how grateful I am to be able to
approach you for guidance. I would also like to thank Helaine Hunscher. Thank you to my
friend Akshat Kasliwal who helped me improve this report immensely.
Last of all, I would like to express my appreciation for my family and friends who
provided moral support and encouragement over the past year. Thank you with my whole
heart to everyone mentioned (and not) who helped make this project come true! We
definitely have produced valuable work.
iii
5
Table of Contents
List of Figures ............................................................................................................................. 7
List of Tables ............................................................................................................................... 8
INTRODUCTION ......................................................................................................................... 1
Literature Review ........................................................................................................................ 2
Energy and Water Use in Residential Buildings ...................................................................... 2 Machine Dishwashers and Manual Dishwashing ..................................................................... 3 Behaviors and Beliefs about Dishwashing ............................................................................... 5 Kitchen Sponges and Microbes ................................................................................................ 6 Machine Dishwashers in the United States .............................................................................. 7
METHODS..................................................................................................................................... 8
Whirlpool Corporation ................................................................................................................ 8
Life Cycle Assessments (LCA) ................................................................................................... 8
Metrics Used to Quantify Impacts ............................................................................................ 9 Selected Machine Dishwashers ................................................................................................ 9 System Boundary.................................................................................................................... 10 Functional Unit ....................................................................................................................... 12
Material Production and Manufacturing Phases ........................................................................ 12
Life Cycle Inventory............................................................................................................... 12 Process-level approach ........................................................................................................... 14 Facility-Level (Black Box) Approach .................................................................................... 14 Differences in the Process and Facility-Level Approaches .................................................... 15
Use Phase .................................................................................................................................. 16
Laboratory Study .................................................................................................................... 16 DOE Testing Procedures for Machine Dishwashers .............................................................. 16 ANSI/AHAM DW-1-2010 ..................................................................................................... 17 Cleaning Performance ............................................................................................................ 18 ENERGY STAR ..................................................................................................................... 19 Recommended (Best Practices) for Machine Dishwashers .................................................... 19 Recommended (Best Practices) for Manual Dishwashing ..................................................... 20 Typical Machine Dishwasher Loading, Typical Manual Dishwashing, & Survey
Questions ................................................................................................................................ 20 Energy Calculations................................................................................................................ 22 Laboratory Data to GaBi ........................................................................................................ 23 Other Parameters .................................................................................................................... 25
End-of-life (EOL) ...................................................................................................................... 25
RESULTS ..................................................................................................................................... 26
Material Production ................................................................................................................... 26
Process-level & Facility-level Approaches to Manufacturing .................................................. 28
Cradle-To-Gate .......................................................................................................................... 29
Use Phase Results from Observational Laboratory Study ......................................................... 31
6
Recommended Machine Use Observations ............................................................................ 31 Recommended (Best Practices) Manual Dishwashing Observations ..................................... 31 Typical Manual Dishwashing Observations ........................................................................... 31 Typical Machine Loading Observations................................................................................. 32 Laboratory Results Summary ................................................................................................. 33 Survey Results ........................................................................................................................ 36
End-of-life ................................................................................................................................. 37
Comparison of Machine and Manual Life Cycles ..................................................................... 38
Sensitivity Analysis ................................................................................................................... 41
Optimizing Machine Dishwasher GHG Reductions .............................................................. 41 Manual Dishwashing GHG Reductions ................................................................................. 43
LIMITATIONS ........................................................................................................................... 45
CONCLUSION ............................................................................................................................ 46
Key Findings ............................................................................................................................. 47
Future Work .............................................................................................................................. 47
REFERENCES ............................................................................................................................ 49
APPENDIX A.1- Summary of Previous Studies Testing Conditions...................................... 54
APPENDIX A.2- Summary of Previous Studies Results ......................................................... 55
APPENDIX B.1- Green Globes Water Consumption Input .................................................... 56
APPENDIX B.2- Green Globes Water Consumption Output ................................................. 57
APPENDIX C- Machine Dishwasher Manufacturing Processes ............................................ 58
APPENDIX D- Recommended (BPT) Manual Dishwashing Behaviors Summary ............... 59
APPENDIX E.1 – Survey Responses on Demographics .......................................................... 60
APPENDIX E.2 – Survey Responses on Dishwashing ............................................................. 61
APPENDIX E.3 – Survey Responses on Machine Dishwasher Use ........................................ 62
APPENDIX E.4 – Survey Responses on Manual Dishwashing ............................................... 64
APPENDIX F- Resources of Interest at Findlay Factory ........................................................ 65
APPENDIX G- Observed Loading Behaviors .......................................................................... 66
APPENDIX H.1- Lifetime burdens under Base Case following different metrics ................ 67
APPENDIX I.1- Base Case GHG emissions with varying regional electrical grid ................ 69
APPENDIX J- Base Case with Natural Gas Water Heater ..................................................... 71
v
7
List of Figures
Figure 1-Life Cycle of a Machine Dishwasher............................................................................. 11
Figure 2-Life Cycle for Manual Dishwashing .............................................................................. 11
Figure 3-Normally Soiled Load of Dishes.................................................................................... 18
Figure 4-Laboratory set-up ........................................................................................................... 21
Figure 5-Use Phase Generic Process Manual Dishwashing ......................................................... 24
Figure 6-Use Phase Generic Process Machine Dishwashing ....................................................... 24
Figure 7-Water Use at Findlay factory to produce one machine dishwasher following the
process-level approach where unaccounted water is the difference between the facility-level and
process-level approach total .......................................................................................................... 28
Figure 8-Facility-level vs. process-level approach comparison where GHG emissions from
manufacturing at the Findlay factory are shown. .......................................................................... 29
Figure 9-Cradle-to-gate impacts of producing one dishwasher using the process-level approach.
Printed wiring board includes both material production and manufacturing stages. .................... 30
Figure 10-Method of Manual Washing for 37 participants who were not outliers and were able to
be identified. .................................................................................................................................. 32
Figure 11-Typical Machine loading behavior for 38 participants who were not outliers ............ 33
Figure 12-Time used for washing one load of normally soiled dishes ......................................... 34
Figure 13-Energy used for washing one load of normally soiled dishes assuming a natural gas
water heater including energy needed by dishwasher to run, heat water, dry, and standby for one
cycle............................................................................................................................................... 34
Figure 14-Water used for washing one load of normally soiled dishes ........................................ 35
Figure 15-Soap used for washing one load of normally soiled dishes ......................................... 35
Figure 16-Summary of Cleaning Results for dishwashing a normally soiled load of 8 place
settings. Manual and Machine dishwashing are scored using the AHAM Cleaning Index. .......... 36
Figure 17-Survey Study results .................................................................................................... 37
Figure 18-End-of-life Options. kg CO2e following TRACI 2.1 Impacts ..................................... 37
Figure 19-Recycling burdens for plastic and stainless steel machine dishwashers as kg CO2e
following TRACI 2.1 Impacts ....................................................................................................... 38
Figure 20-Lifetime Primary Energy Demand for Different Machine Cycles ............................... 38
Figure 21-Lifetime Primary Energy Demand for Different Manual Dishwashing Methods ........ 39
Figure 22-Consolidated Graph of Base Case Scenario ................................................................. 41
Figure 23-Energy Consumed in Per Cycle ................................................................................... 42
Figure 24-Optimizing Machine Dishwasher Use for reduced GHG emissions ............................ 43
Figure 25-Sensitivity Analysis for Manual Dishwashing ............................................................. 44
Figure 26-Natural Gas Use at Findlay factory to produce one machine dishwasher following the
process-level approach where unaccounted water is the difference between the facility-level and
process-level approach total .......................................................................................................... 65
Figure 27-Electricity Use at Findlay factory to produce one machine dishwasher following the
process-level approach where unaccounted water is the difference between the facility-level and
process-level approach total .......................................................................................................... 65
Figure 28-Blue Water Consumption under Base Case ................................................................. 67
Figure 29-kg CO2e under Base Case ........................................................................................... 67
Figure 30-Waste Deposition through Life Cycle following Base Case ........................................ 68
8
Figure 31-Base Case (Michigan electricity grid) .......................................................................... 69
Figure 32-Base Case but with NYUP Electrical Grid .................................................................. 69
Figure 33-Base Case but with MROE Grid .................................................................................. 70
Figure 34-Base Case but with natural gas water heater ................................................................ 71
List of Tables
Table 1-Comparison of Selected Dishwasher Models .................................................................. 10
Table 2-Description of Normally Soiled Load of Dishes ............................................................. 18
Table 3-Standards for Standard-Size Dishwashers ....................................................................... 19
Table 4-Material by Mass for Machine Dishwasher Models ........................................................ 27
Table 5-Average Recommended Machine Use Resource Consumption ...................................... 31
Table 6- Average Observed Typical Manual Dishwashing Resource Use and Cleaning Scores . 32
Table 7-Base Case Assumptions ................................................................................................... 40
vii
1
INTRODUCTION
In 2013, the U.S Energy Information Administration (EIA) reported that 17.7% of
energy consumed in the average American household is used for water heating with
appliances, electronics, and lighting consuming 34.6%. The majority of residential
electricity use is attributed to appliances, electronics, and lighting [1]. Common household
appliances such as machine dishwashers and clothes washing machines require both energy
and heated water to function. Appliances like clothes washing machines are hard to replace
with manual alternatives. Machine dishwashers however, are unique because manual
dishwashing behaviors can replace this appliance. The U.S. Department of Energy (DOE)
estimates that a typical household washes 4 loads of dishes a week (215 annual loads) and
the EIA reported that although dishwashers are owned by more than 80% of American
households, 20% of those households use this appliance less than once a week [2, 3]. These
findings suggest that machine dishwashers are underutilized appliances with dishes often
being washed manually.
Both methods of washing dishes are assumed to achieve an adequate level of
cleaning performance, but as noted in previous studies, there are potential time, energy,
and water savings that result from using a machine dishwasher instead of manually
dishwashing [4-6]. An ENERGY STAR Market Penetration Report indicated that 84% of
dishwashers shipped in 2015 achieved ENERGY STAR standards [7]. The current
ENERGY STAR Recognition criteria for standard sized dishwashers are less than 240 kWh
of energy use per year and less than 3.2 gallons of water use per cycle [8]. Although energy
and water savings are improving according to DOE and ENERGY STAR standards, users
may not be utilizing machine dishwashers as recommended by manufacturers. In previous
studies, typical manual dishwashing was compared to standard testing procedures for
dishwashing machines; this is not an equivalent comparison. [4-6]. Therefore, results for
machine dishwashers may not have been representative because typical user behaviors with
the machines were not considered. Further, these European studies limited the system
boundaries of their comparisons to only the use phase. Burdens associated with different
types of machine dishwashers throughout their life cycles, from material production to
disposal, were not included.
2
Here, we assess life cycle burdens associated with both typical and recommended
best practices for machine use and manual dishwashing in American households. Scenario
analyses showing the impacts of varying electricity grid, water heater type, method of
manual dishwashing, and machine cycle selection are also included.
Literature Review
Energy and Water Use in Residential Buildings
Chini et al. quantified water, energy, and electricity demands in the average single-
family US household, pointed out that appliances and fixtures directly and indirectly use
these resources through the energy-water nexus; in this nexus, energy is necessary for the
production of water and vice versa. A four-occupant home residence uses 100 gallons per
day and the average citizen uses 13,000 kWh of electricity and 720 cubic feet of natural
gas annually [9].
Cost abatement curves indicate that ENERGY STAR machine dishwashers are
economically inefficient. While they offer significant cumulative annual savings in terms
of energy (kWh/year) and water (gal/year) they have larger energy ($/kWh) and water
($/gal) costs than other appliances. Machine dishwashers ranked third highest on energy
cost abatement and highest in water cost abatement potentially owing to their lower water
and energy use than other household appliances. [9] While the cost abatement analysis
indicates that it is unfavorable to invest in a machine to maximize household resource
savings it did not factor in the potential savings from displaced manual dishwashing.
A European study tracked water consumption associated with different activities
performed at the residential kitchen sink and indicated that dishwashing was the most
water-intensive activity, account for 58% of the daily average water use per capita [10].
Dishwashing included manual dishwashing, pre-rinsing activities prior to loading a
machine dishwasher, machine dishwasher use, and cleaning of the sink (if it was associated
with dishwashing). Pre-rinsing activities used 14-25% of water in households with a
dishwashing machine. Households with fewer people consumed more water per person
than larger households. As indicated by the 2010 U.S. Census, the average American
household size is 2.58 people [11]. If European trends of smaller households being more
3
water intensive than larger households holds true in the United States, smaller households
may be a favorable use case for machine dishwashers.
Machine Dishwashers and Manual Dishwashing
The University of Bonn has produced several papers comparing resource use of
different manual dishwashing behaviors and machine dishwashers. These studies involved
observing participants manually wash a set of soiled dishes in a laboratory. European
manual dishwashing behavior is characterized by three different motives: “super
dishwashers” who focused most on cleaning results, “economizers” who cared most about
using as few resources as possible, and “carefree washers” who had no regard for cleaning
results or resource use [4]. A similar study characterized three different manual
dishwashing methods in Europe: dishwashing under running tap water, dishwashing in a
water bath, and a combination of both methods[6]. If more than 80% of dishwashing was
associated with a behavior, then it was categorized into one of the three manual
dishwashing methods. Running tap washers scrub and rinse dishes with little to no shutting
off of the water. Water bath washers often plug a sink or use a plastic tub to soak and scrub
dishes. Rinsing of dishes may also occur in a water bath or with minimal washing under
the tap. Combination washers run the tap at some point in the process dishwashing. These
studies highlight distinct methods of manual dishwashing but do not directly compare
them. A subsequent study expanded the scope to global consumer behaviors and found that
Americans had the highest energy use and tend to use the combination method of washing
[5]. In these manual dishwashing studies, it was found that acceptable cleaning results are
possible with both high and low amounts of energy and detergent but that half of
participants did not achieve an acceptable cleaning result [4, 6]. Most of these studies
concluded that the machine dishwasher is superior to manual dishwashing in terms of water
and energy use as well as cleaning performance. Appendix A summarizes results of
previous studies. Although these studies show that there are different manual dishwashing
methods in Europe and differences in resource consumption, they only focus on the use
phase. A full life cycle assessment of the machine dishwasher compared to manual
dishwashing in American households has not been done.
4
In the observational studies performed at Bonn, machines were evaluated following
the EN 50242 procedure for soiling and testing dishes [4, 6]. In the U.S., dishwashing
machines are similarly evaluated in accordance with the Uniform Test Method for
Measuring the Energy Consumption of Dishwashers set by the DOE [12]. These standards
are designed to test the machine dishwasher as if the user follows the manufacturer’s
recommended procedure best practices for optimal cleaning performance. However, these
standardized procedures do not capture variability in actual behaviors such as loading
patterns, pre-rinsing, or running a dishwasher at less than its full capacity. In the earlier
Bonn studies, participants were asked to manually wash dishes as they typically would at
home. These typical manual dishwashing behaviors were compared to the standard
recommended procedure for machine dishwashers; which does not make for an equivalent
comparison. Recommended machine dishwasher use should be compared to recommended
manual dishwashing. Similarly, typical manual dishwashing behaviors should be compared
to typical machine dishwasher use, including pretreatment and loading behaviors.
Recommended and typical manual dishwashing were compared in a dissertation
that indicated Best Practice Tips (BPT) for manual dishwashing outperformed Everyday
Behavior (EDB) in terms of energy and water consumption [13]. The dissertation cited
several online sources for creating best practice tips for manual dishwashing and these will
be the foundation for recommended behaviors used in this analysis.
Energetic impact, energy for human work, of labor-saving devices such as machine
dishwashers was quantified in a study that indicated manual dishwashing requires
approximately 1.83 kcal/min while machine dishwashing requires about 1.31 kcal/min.
This human energy (calorific energy) for machine dishwashing included energy needed to
pre-rinse dishes, load them, remain seated during the cycle time, and unload the dishwasher
[14]. Overall, less calorific energy is required for a person to simply load a dishwasher than
manually wash dishes since loading requires slightly less calorific energy as well as takes
less time. In this analysis, the time needed for manual dishwashing and loading a machine
dishwasher will be also be compared.
5
Behaviors and Beliefs about Dishwashing
Homeowners do not use machine dishwashers as often as they manually wash
dishes. Previous surveys have explored the motivations behind this decision, the biases that
people have against one method of dishwashing over the other, as well as why people
choose to engage in pretreatment behaviors when using a machine dishwasher. A study of
UK machine dishwasher owners surveyed why they choose to manually wash dishes; 53%
of respondents indicated that the item took up too much space and 52% said that the item
was needed immediately [15]. The same survey found that those who did not own machine
dishwashers stated their main reasons for this were that they do not mind manual
dishwashing (59%) or that they did not feel they had enough dirty dishes (54%). In the
same survey, subjects stated that environmental reasons (water and energy savings) for
owning a machine dishwasher are secondary to time and cleanliness considerations; 66%
responded that time saving was a reason for buying a machine dishwasher, 48% said it
cleans better that manual dishwashing, and 29% believed it uses less water. Another
European survey found that 83% of respondents consider water and energy are the most
important considerations when purchasing a machine dishwasher [16]. This survey
confirmed that in houses with machine dishwashers, the main reasons dishes are still
manually washed is because the item takes up too much space in the dishwasher or is
needed immediately.
Pretreatment of dishware entails soaking, rinsing, scraping, scrubbing, and washing
dishes prior to loading them into a machine dishwasher. When asked about pretreatment
behaviors 39% of respondents indicated they scrape off leftovers, 39% pre-rinse or soak
items, 14% do not pretreat at all, and the remainder wash heavily soiled items manually. It
was also found that pretreatment does not improve satisfaction with cleaning results. In a
survey of 500 Americans, it was found that 75% of machine dishwasher owners pre-rinse
their dishes, 63% of who said that their main reason for doing so was because food sticks
to the dishes [17]. It is notable that 31% reported that they were taught to pre-rinse. These
surveys indicate that time considerations are an important factor for machine dishwasher
ownership, barriers exist to using the machine for all items, and beliefs persist around
pretreatment being necessary for achieving satisfactory machine performance.
6
Aside from motivations behind choosing between machine and manual
dishwashing, some surveys also asked people what their typical everyday behaviors around
washing dishes are. A survey of 2599 Germans showed that households that own a machine
dishwasher are more likely to use the running tap method when manually dishwashing than
households without a machine dishwasher [18]. However, it is unclear if there is a causal
connection or merely a correlation between the two behaviors. The same survey also found
that more than half of respondents would choose a normal cycle, instead of other cycle
options, for running their machine dishwasher. Pretreatment question responses showed
that between 40% and 70% of respondents would wipe food off plates, cups and bowls
while 18% to 41% perform no pretreatment.
While these surveys indicate established behaviors and some underlying
motivators, they do not consider influencing or changing consumer behavior. Another
study set out to determine whether or not Europeans were willing to adjust their cleaning
behaviors based on the soil level of the dishes [19]. Test subjects were found to use similar
amounts of time, water, and detergent regardless of the amount of soiling on the dish and
that only their cleaning performance (measured using a European standard) was
significantly different. This suggests that manual dishwashing is a behavior that is a
habitual response and also a result of parental influence. Therefore, it may be challenging
to alter consumer habits or optimize manual dishwashing to minimize resource
consumption while achieving minimal acceptable cleaning performance.
Kitchen Sponges and Microbes
The primary function of dishwashing is to clean dishes. Two types of residues on
dishware are usually considered: microbiological and chemical [20]. Microbiological
residue measured as total surface bacteria counts (colony forming units of bacteria per area)
are reduced most when dishes are washed with a machine dishwasher rather than by hand.
Kitchens have a high potential to serve as “microbial incubators” [21]. Kitchens host more
microbes than toilets mainly due to the presence of porous sponges, which are ideal habitats
for microbes to thrive. Laboratory testing revealed that kitchen sponges contained
microbial species that can infect humans regardless of regular sanitation techniques
(boiling or microwaving) which can increase certain species counts. The study concludes
7
that sponges can spread bacteria from dishes to kitchens surfaces to humans and
recommend weekly replacement of them. A study of 1029 Swedish children found that
manual dishwashing reduces their risk of allergic disease possibly because of increased
microbial exposure [22]. These studies indicate that the manual dishwashing can bolster
children’s health by exposing them to some microbes but that the sponges needed for this
activity may be supporting infectious microbes. Due to their frequent replacement, the use
of sponges will be included when calculating life cycle burdens in this analysis.
Machine Dishwashers in the United States
Machine dishwasher manufacturers offer a variety of built-in features and varying
aesthetics in their products. Dishwashers come in different sizes: standard (24” X 24” X
35”), compact (18” X 35” X 24”), and countertop (18” X 18” X 18”). There are portable
versions, single drawer, in-sink, and under-sink dishwashers. The majority of dishwashers
sold are standard sized [23]. Some machines offer built-in water softeners that help reduce
mineral deposits and spots on glassware and the dishwasher. Surfactants in rinse-aids are
intended to reduce these mineral deposits as well. Filters can be self-cleaning or require
occasional manual cleaning. The trade-off between the two types of filters is generally
noise level, since the self-cleaning filter is in fact a hard food disposer that requires a motor
to grind food waste, while meshed filters are manually rinsed. A common feature in
dishwashers is noise reduction, generally achieved through sound-dampening insulation
and mastic materials. Operating sound levels can range from 38 decibels (dB) (with noise
reduction) up to 60 dB (without noise reduction) [24]. For context, a normal conversation
is 60 dB. Manufacturers also offer different drying processes such as condensation drying,
heating elements, and fans. Condensation drying works by heating water to high
temperatures at the end of a cycle and increasing the temperature of the dishes to be hotter
than the tub of the dishwasher walls. Since the walls are cooler, droplets will condense on
them rather than on the dishes [25]. Heating elements are electric coils that heat air in the
dishwasher. Fans can be used in conjunction with heating elements to force air out of the
dishwasher vents or they can be used alone to cycle room-temperature air throughout the
dishwasher. Prices for machine dishwashers range from $300 to $2000 [25, 26]. Machine
dishwashers also have different exterior finishes including stainless steel, painted front
8
panels, and wood panels. There are two materials used for manufacturing machine
dishwasher tubs: plastic and stainless steel. While plastic tub dishwashers are generally
cheaper and more likely to absorb odors and stains since they are porous, they do not permit
the same high temperatures as stainless steel for heating water and drying. Stainless steel
interiors aid in the drying process as they retain heat longer than plastic interiors. Stainless
steel tub dishwashers are seen as more high-end, durable products, and are more expensive.
In addition to all of these features and characteristics, machine dishwasher
manufacturers generally offer similar cycle options that use varying amounts of water and
energy. Common cycles include normal, express, and sensor cycles. The normal cycle is
the default on most dishwashers and assumes a full load of 8 places settings with average
food soil. Express wash cycles can have several other names (1 hour Wash, Quick Wash,
etc.) and are meant to quickly wash a load, often in as little as an hour. Sensor cycles (Auto
Wash, Smart Wash, etc.) utilize optical waster indicators (OWI) that adjust water usage to
the amount of soil in the load being washed. OWIs are turbidity meters that work by shining
light through a sample of water in the tub, with the fraction of light transmitted through the
sample being dependent on the amount of soil in the wash water [27]. OWIs take
measurements throughout the cycle to adjust operation. The machine dishwashers in this
study have OWIs. In addition to these cycles, additional options such as high temperature
washing or drying can be added to cycles, which will increase energy and water use.
METHODS
Whirlpool Corporation
This project is a joint effort between the Whirlpool Corporation and the University
of Michigan’s Center for Sustainable Systems. Whirlpool provided data, laboratory space,
and industry insight throughout the project. Whirlpool’s Findlay, Ohio facility
manufactured the dishwashers modeled in this study.
Life Cycle Assessments (LCA)
Life cycle assessments commonly break the life of a product into four distinct
phases: material production, manufacturing, use, and end-of-life. This assessment is a
cradle-to-grave analysis that evaluates methods of dishwashing throughout these four
9
phases by modelling them on GaBi, a common LCA software [28]. For this study, two
general models are created on GaBi: one for manual dishwashing and one for machine
dishwashers. The models incorporate data from available databases, literature review, and
laboratory data. Each of these models is structured to allow for a sensitivity analysis of
various parameters (type of water heater, electrical grid, end-of-life option, etc.)
Metrics Used to Quantify Impacts
We evaluate primary energy, greenhouse gas (GHG) emission, water consumption,
and solid waste production metrics. Primary energy is a common metric used for measuring
the raw energy from nature needed for a product or process and is reported here in
megajoules (MJ). GHG production is characterized using EPA’s Tool for Reduction and
Assessment of Chemicals and Other Environmental Impacts (TRACI 2.1) and is reported
in kg CO2 equivalents (kg CO2e) on a 100-year global warming potential basis based on
the 2001 Intergovernmental Panel on Climate Change (IPCC) calculations [29]. Water
consumption has three major components according to the Water Footprint Network:
green, blue, and grey water [30]. In this analysis, blue water consumption will be the metric
used as it is water from ground and surface sources that is incorporated into a product.
Solid waste production captures the mass of input materials that is not converted into
product or into other forms of waste (such as emissions) and is measured in kilograms (kg).
Selected Machine Dishwashers
The two machine dishwasher models analyzed in this study are the Kitchen Aid
KDTM354 and Whirlpool WDF330. These were selected because they are representative
of machine dishwashers that are most commonly purchased. Table 1 summarizes the
differences between the two machines. A key difference being compared in this study is
that the Whirlpool model is a plastic tub machine whereas the Kitchen Aid model is a
stainless steel tub machine. Hereafter, the WDF330 Whirlpool machine will be referred to
as the plastic machine dishwasher and the KDTM354 Kitchen Aid model will be referred
to as the stainless steel machine dishwasher.
10
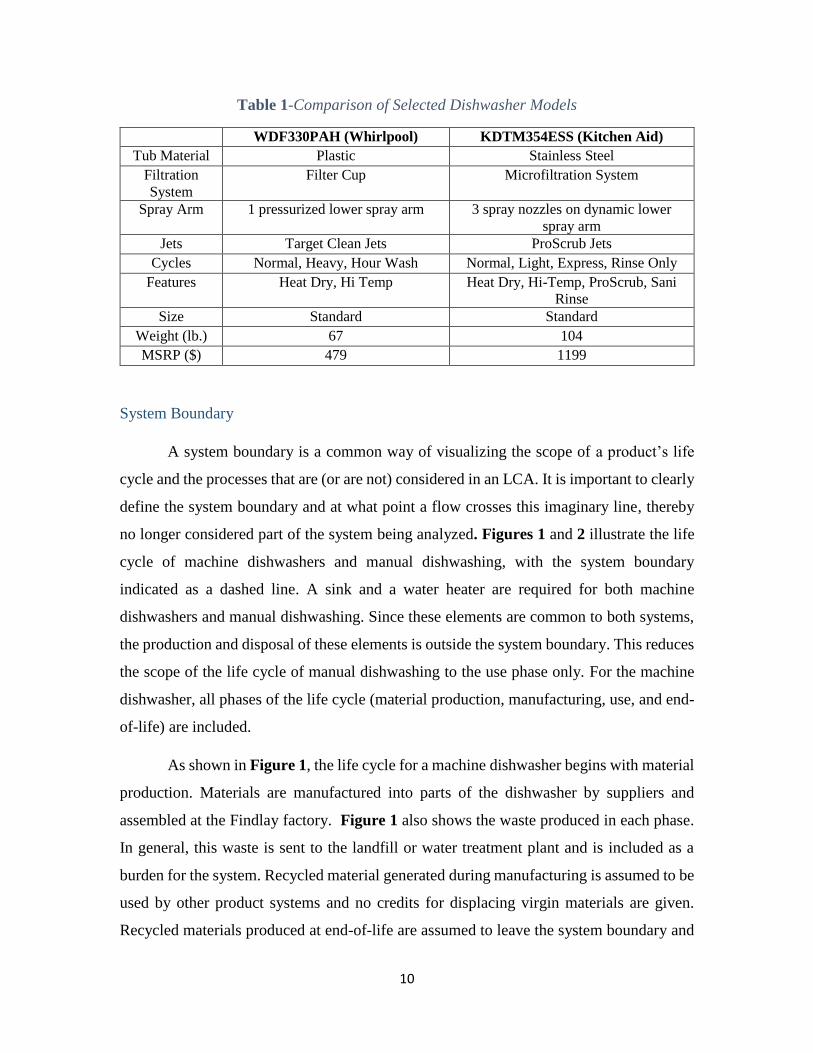
Table 1-Comparison of Selected Dishwasher Models
WDF330PAH (Whirlpool) KDTM354ESS (Kitchen Aid)
Tub Material Plastic Stainless Steel
Filtration
System
Filter Cup Microfiltration System
Spray Arm 1 pressurized lower spray arm 3 spray nozzles on dynamic lower
spray arm
Jets Target Clean Jets ProScrub Jets
Cycles Normal, Heavy, Hour Wash Normal, Light, Express, Rinse Only
Features Heat Dry, Hi Temp Heat Dry, Hi-Temp, ProScrub, Sani
Rinse
Size Standard Standard
Weight (lb.) 67 104
MSRP ($) 479 1199
System Boundary
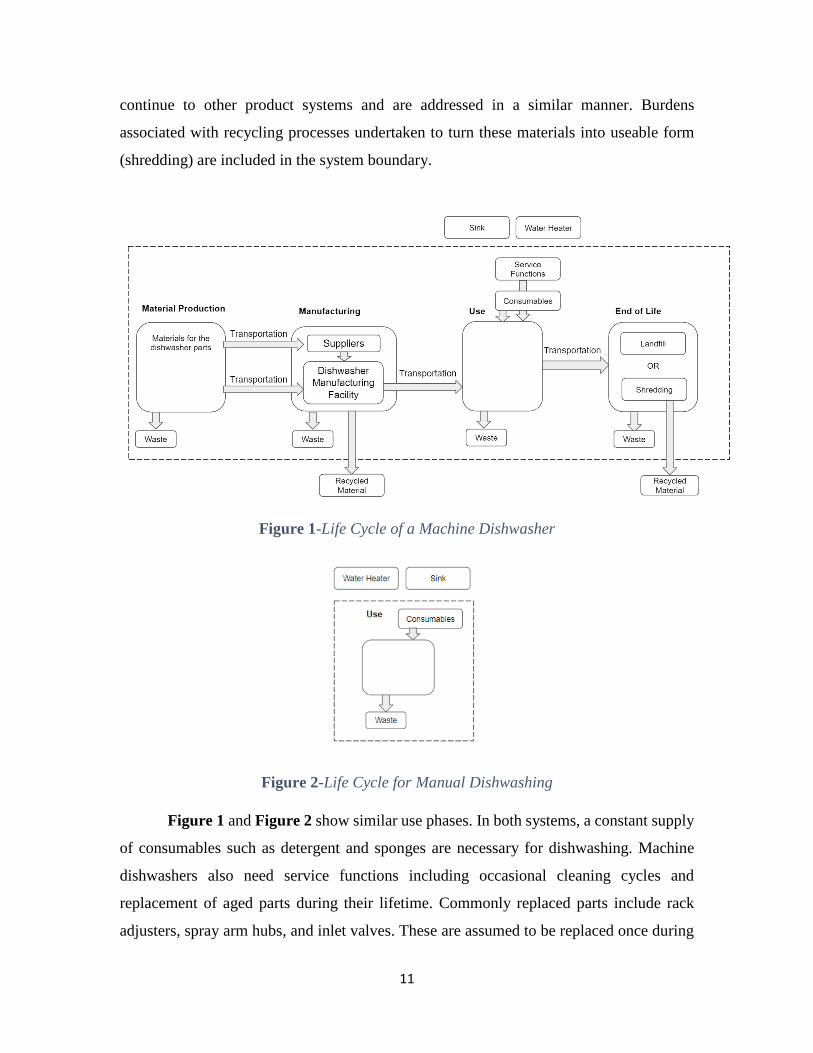
A system boundary is a common way of visualizing the scope of a product’s life
cycle and the processes that are (or are not) considered in an LCA. It is important to clearly
define the system boundary and at what point a flow crosses this imaginary line, thereby
no longer considered part of the system being analyzed. Figures 1 and 2 illustrate the life
cycle of machine dishwashers and manual dishwashing, with the system boundary
indicated as a dashed line. A sink and a water heater are required for both machine
dishwashers and manual dishwashing. Since these elements are common to both systems,
the production and disposal of these elements is outside the system boundary. This reduces
the scope of the life cycle of manual dishwashing to the use phase only. For the machine
dishwasher, all phases of the life cycle (material production, manufacturing, use, and end-
of-life) are included.
As shown in Figure 1, the life cycle for a machine dishwasher begins with material
production. Materials are manufactured into parts of the dishwasher by suppliers and
assembled at the Findlay factory. Figure 1 also shows the waste produced in each phase.
In general, this waste is sent to the landfill or water treatment plant and is included as a
burden for the system. Recycled material generated during manufacturing is assumed to be
used by other product systems and no credits for displacing virgin materials are given.
Recycled materials produced at end-of-life are assumed to leave the system boundary and
11
continue to other product systems and are addressed in a similar manner. Burdens
associated with recycling processes undertaken to turn these materials into useable form
(shredding) are included in the system boundary.
Figure 1-Life Cycle of a Machine Dishwasher
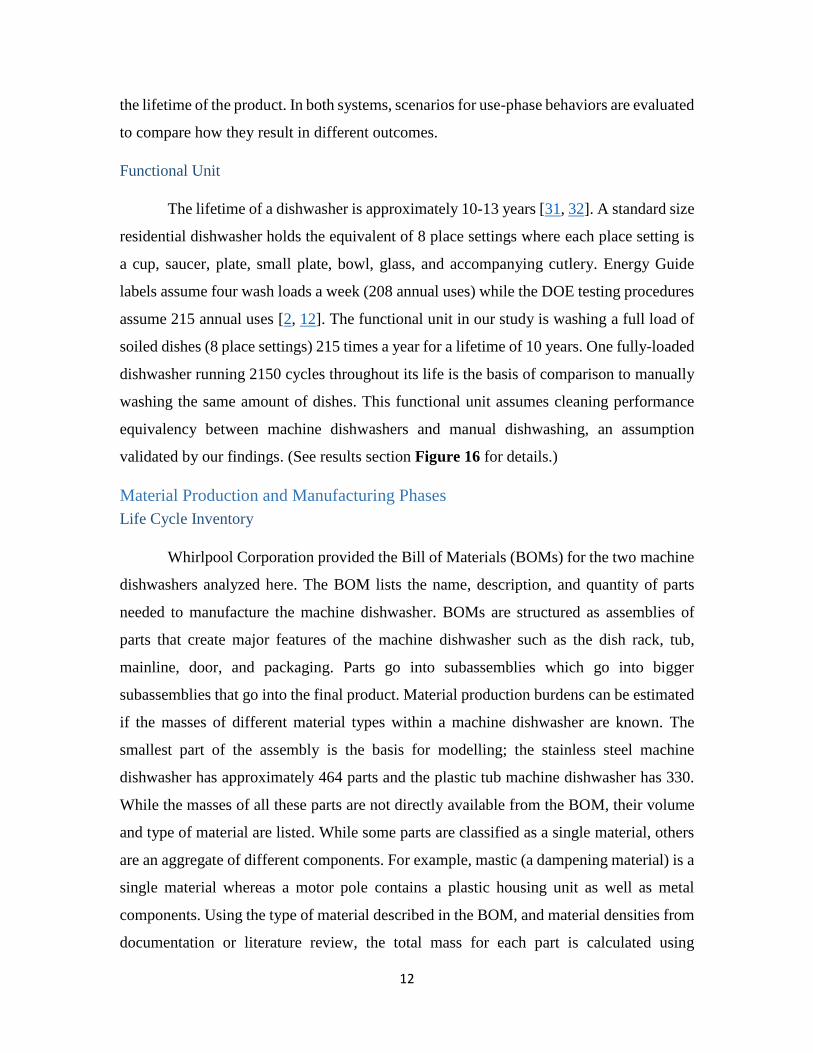
Figure 2-Life Cycle for Manual Dishwashing
Figure 1 and Figure 2 show similar use phases. In both systems, a constant supply
of consumables such as detergent and sponges are necessary for dishwashing. Machine
dishwashers also need service functions including occasional cleaning cycles and
replacement of aged parts during their lifetime. Commonly replaced parts include rack
adjusters, spray arm hubs, and inlet valves. These are assumed to be replaced once during
12
the lifetime of the product. In both systems, scenarios for use-phase behaviors are evaluated
to compare how they result in different outcomes.
Functional Unit
The lifetime of a dishwasher is approximately 10-13 years [31, 32]. A standard size
residential dishwasher holds the equivalent of 8 place settings where each place setting is
a cup, saucer, plate, small plate, bowl, glass, and accompanying cutlery. Energy Guide
labels assume four wash loads a week (208 annual uses) while the DOE testing procedures
assume 215 annual uses [2, 12]. The functional unit in our study is washing a full load of
soiled dishes (8 place settings) 215 times a year for a lifetime of 10 years. One fully-loaded
dishwasher running 2150 cycles throughout its life is the basis of comparison to manually
washing the same amount of dishes. This functional unit assumes cleaning performance
equivalency between machine dishwashers and manual dishwashing, an assumption
validated by our findings. (See results section Figure 16 for details.)
Material Production and Manufacturing Phases
Life Cycle Inventory
Whirlpool Corporation provided the Bill of Materials (BOMs) for the two machine
dishwashers analyzed here. The BOM lists the name, description, and quantity of parts
needed to manufacture the machine dishwasher. BOMs are structured as assemblies of
parts that create major features of the machine dishwasher such as the dish rack, tub,
mainline, door, and packaging. Parts go into subassemblies which go into bigger
subassemblies that go into the final product. Material production burdens can be estimated
if the masses of different material types within a machine dishwasher are known. The
smallest part of the assembly is the basis for modelling; the stainless steel machine
dishwasher has approximately 464 parts and the plastic tub machine dishwasher has 330.
While the masses of all these parts are not directly available from the BOM, their volume
and type of material are listed. While some parts are classified as a single material, others
are an aggregate of different components. For example, mastic (a dampening material) is a
single material whereas a motor pole contains a plastic housing unit as well as metal
components. Using the type of material described in the BOM, and material densities from
documentation or literature review, the total mass for each part is calculated using
13
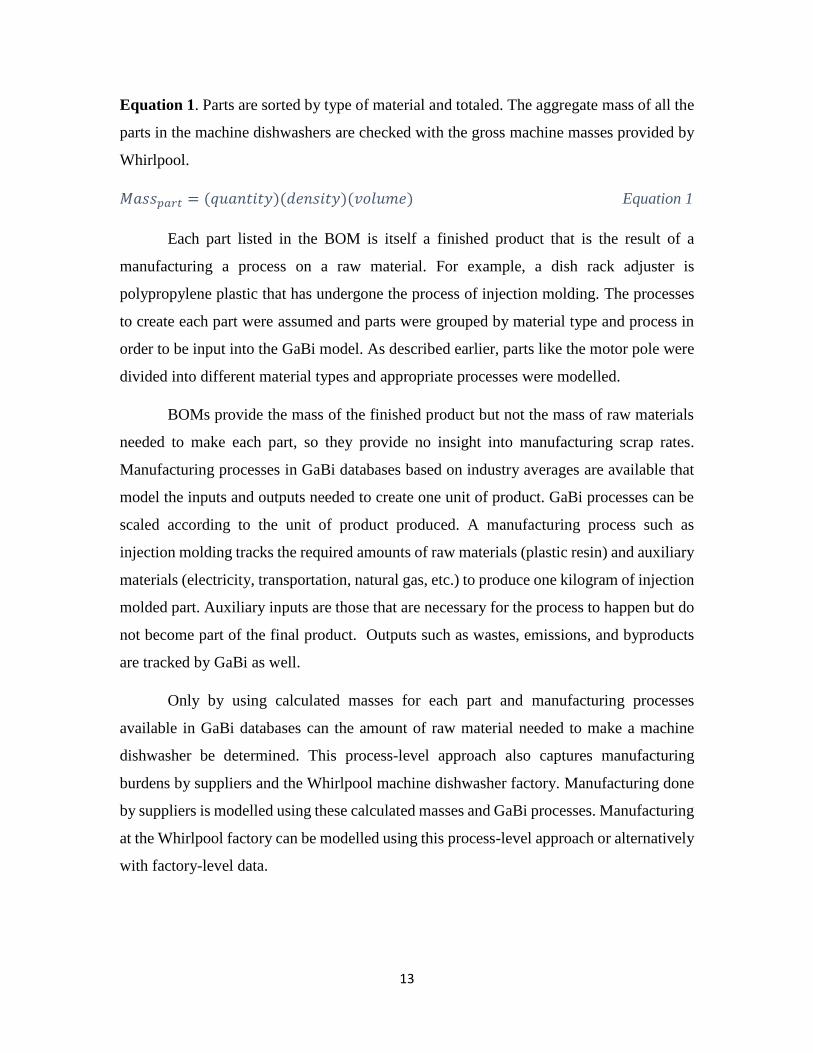
Equation 1. Parts are sorted by type of material and totaled. The aggregate mass of all the
parts in the machine dishwashers are checked with the gross machine masses provided by
Whirlpool.
𝑀𝑎𝑠𝑠𝑝𝑎𝑟𝑡 = (𝑞𝑢𝑎𝑛𝑡𝑖𝑡𝑦)(𝑑𝑒𝑛𝑠𝑖𝑡𝑦)(𝑣𝑜𝑙𝑢𝑚𝑒) Equation 1
Each part listed in the BOM is itself a finished product that is the result of a
manufacturing a process on a raw material. For example, a dish rack adjuster is
polypropylene plastic that has undergone the process of injection molding. The processes
to create each part were assumed and parts were grouped by material type and process in
order to be input into the GaBi model. As described earlier, parts like the motor pole were
divided into different material types and appropriate processes were modelled.
BOMs provide the mass of the finished product but not the mass of raw materials
needed to make each part, so they provide no insight into manufacturing scrap rates.
Manufacturing processes in GaBi databases based on industry averages are available that
model the inputs and outputs needed to create one unit of product. GaBi processes can be
scaled according to the unit of product produced. A manufacturing process such as
injection molding tracks the required amounts of raw materials (plastic resin) and auxiliary
materials (electricity, transportation, natural gas, etc.) to produce one kilogram of injection
molded part. Auxiliary inputs are those that are necessary for the process to happen but do
not become part of the final product. Outputs such as wastes, emissions, and byproducts
are tracked by GaBi as well.
Only by using calculated masses for each part and manufacturing processes
available in GaBi databases can the amount of raw material needed to make a machine
dishwasher be determined. This process-level approach also captures manufacturing
burdens by suppliers and the Whirlpool machine dishwasher factory. Manufacturing done
by suppliers is modelled using these calculated masses and GaBi processes. Manufacturing
at the Whirlpool factory can be modelled using this process-level approach or alternatively
with factory-level data.
14
Process-level approach
Machine dishwashers are produced at a Whirlpool manufacturing factory in
Findlay, Ohio. This plant produces only machine dishwashers and incorporates renewable
energy into its operations by sourcing from a nearby wind farm. Approximately 22% of
the annual energy requirement needed by the plant is attributed to wind turbines [33]. Gabi
modelling accounted for electricity generation from renewables as well as from the Ohio
electrical grid. The Findlay plant employs 2,200 workers over an area of 1,086,400 square
feet. Different manufacturing processes are involved for making plastic and stainless steel
machine dishwashers. Proprietary process diagrams describing the distinct series of steps
are used as an outline for modelling the manufacturing phase. A tour of the plant informed
the types of machinery, what materials undergo which specific processes, and additional
details about manufacturing steps. Annual water use for non-manufacturing purposes at the
plant was estimated from the Green Globes Water Calculator for nonresidential buildings
and resulted in 19,500,000 gallons of annual water use in the facility [34]. See Appendix
B for details. Modelling the Findlay factory was possible using the inventory of parts from
the BOMs and knowledge about processes for their production. Appendix C lists the
processes and data sources for modelling machine dishwasher manufacturing at Findlay.
Facility-Level (Black Box) Approach
Manufacturing at the Findlay plant can also be modelled using a facility-level
approach, quantifying only inflows and outflow from the plant as a whole. Whirlpool
provided input and output data for the Findlay plant in 2017 [35]. This summary describes
volumetric outputs of different classifications of waste including nonhazardous wastes,
hazardous wastes, and wastewater. The summary also quantifies inputs for the plant
including water, renewable energy, electric power, natural gas, etc. Whirlpool also
provided machine dishwasher production volumes for 2017. Findlay produced 1.84 million
plastic and 1.71 million stainless steel machine dishwashers in 2017 [36]. All plastic
machine dishwashers produced at Findlay are modelled as the Whirlpool WDF330 model
and all stainless steel machine dishwashers are modelled as the Kitchen Aid KDTM354
model. Facility-level modelling is also known as top-down modelling because only high-
level information is known about the facility. In our facility-level analysis, the Findlay
15
plant can be referred to as a “black box” model because only input and output information
is provided without any more details about how these inputs are being used within the
plant.
Differences in the Process and Facility-Level Approaches
The process-level approach using GaBi databases allows determination of raw
material amounts necessary for producing machine dishwashers while the facility-level
approach is an exact representation of inputs and outputs occurring at Findlay. Although
the facility-level approach is an exact annual representation of flows, burdens cannot be
allocated to a specific process or between different types of machine dishwasher production
as with the process-level approach.
These two approaches can be used together to see how accurately GaBi databases
model actual production processes at Findlay. Three main resources are highlighted in this
comparison between the process and facility-level approach: water, electricity, and natural
gas. The process-level approach allows determination of specific amounts of a resource
necessary for discrete processes. These are totaled to find resource requirements for the
process-level approach. These resource requirements can be scaled from production of one
machine dishwasher to the annual production of machine dishwashers. On the other hand,
the facility-level approach only has the total amount of a resource needed by Findlay for
the entire year to produce a certain number of dishwashers. This approach does not permit
us to allocate the total resource use to individual processes. A rough estimate of how much
of a resource is needed per machine can be calculated by dividing the total amount of
resource use by the total number of dishwashers. This estimate is crude since it does not
reflect what processes are actually requiring this resource.
The process-level approach is used to model discrete manufacturing steps. The
amount of resources required by these steps are totaled. For both the plastic and stainless
steel models, these totals are scaled to annual production volumes. The stainless steel and
plastic resource requirements are summed. The summed total for the process-level
approach is compared to the facility-level total for the same resource. The total differences
between the two approaches are divided by the total number of annual dishwashers
16
produced. No weighted average is calculated due to lack of knowledge about where this
difference should be allocated.
This comparison is done in order to validate the model and ensure that there is a
comprehensive characterization of the manufacturing phase. The process-level approach is
a bottom-up approach that is incomplete and relies on industry databases. However, it is
necessary to determine raw materials needed for machine dishwasher production. The top-
down facility-level approach is a complete representation of process material flows but
makes allocating burdens between the two types of machine dishwashers difficult.
Use Phase
Laboratory Study
Observational laboratory assessments were conducted as part of this study, which
was designed to compare use of machine dishwashers to manual dishwashing across
recommended and typical behaviors, similar to studies conducted at the University of Bonn
[4-6]. Testing of machine dishwashers already has standardized procedure and this is the
basis from which to evaluate manual dishwashing.
We explicitly make a distinction between recommended (ideal, best practices) and
typical (realistic, everyday) behaviors for both machine dishwasher use and manual
dishwashing. This results in four scenarios: best practices for machine dishwasher use, best
practices for manual dishwashing, typical machine dishwasher use, and typical manual
dishwashing. In the case of the machine dishwasher, the recommended behaviors are those
set out in the DOE standard procedure and suggested by the manufacturer, while typical
behaviors capture specific loading and pretreatment behaviors. In the case of manual
dishwashing, typical behaviors are observed and categorized into one of the three different
categories described in research (running tap, water bath, combination) while
recommended behaviors are guided by literature [6, 13].
DOE Testing Procedures for Machine Dishwashers
Machine dishwasher manufacturers must comply with the Department of Energy
(DOE) provisions for consumer products, which are outlined in the electronic Code of
Federal Regulations (eCFR) [12]. Dishwashers are normally tested following the Uniform
17
Test Method for Measuring the Energy Consumption of Dishwashers (Appendix C1 to
Subpart B of Part 430 of the eCFR). The method indicates specific test conditions,
instrumentation, procedure for testing cycles with differently soiled and sized loads, as well
as an evaluation method for measuring machine dishwasher energy and water use
performance. Further, it specifies how different machine dishwashers should be tested
depending on whether or not they are soil-sensing, water heating, and/or water softening.
The code also distinguishes how calculations should be done in test facilities with natural
gas or electric water heaters.
ANSI/AHAM DW-1-2010
Incorporated within the DOE testing procedure are the American National
Standards Institute/Association of Home Appliance Manufacturers (ANSI/AHAM)
standards for a test load (described in Table 2). These standards are meant to create uniform
and repeatable procedures for dish soiling. The typical test load includes plates, cups,
bowls, platters, glasses, and flatware that are soiled according to ANSI/AHAM DW-1-
2010 standards. The standards describe different levels of soil ranging from light to heavy
soil. Soil consists of varying food types including eggs, mashed potatoes, coffee, tomato
juice, and raspberry preserves. These are all prepared following a specified procedure using
a specific brand and are spread in defined amounts on a portion of a dish’s surface. A
normally soiled plate, for example, could have ¼ of its surface covered with 1 tablespoon
of mashed potatoes. Furthermore, these soils are applied to test loads two hours before they
are washed; this allows for soils to dry onto dishes.
For the purposes of this laboratory study, a few modifications were made to the
soiling and selection of dishes to be washed. In addition to the standard soils and plates,
Whirlpool has developed other soils and dishes in response to user concerns. A cheesy
spaghetti dish and apple sauce on plastic bowls represent tougher soils. These soils are
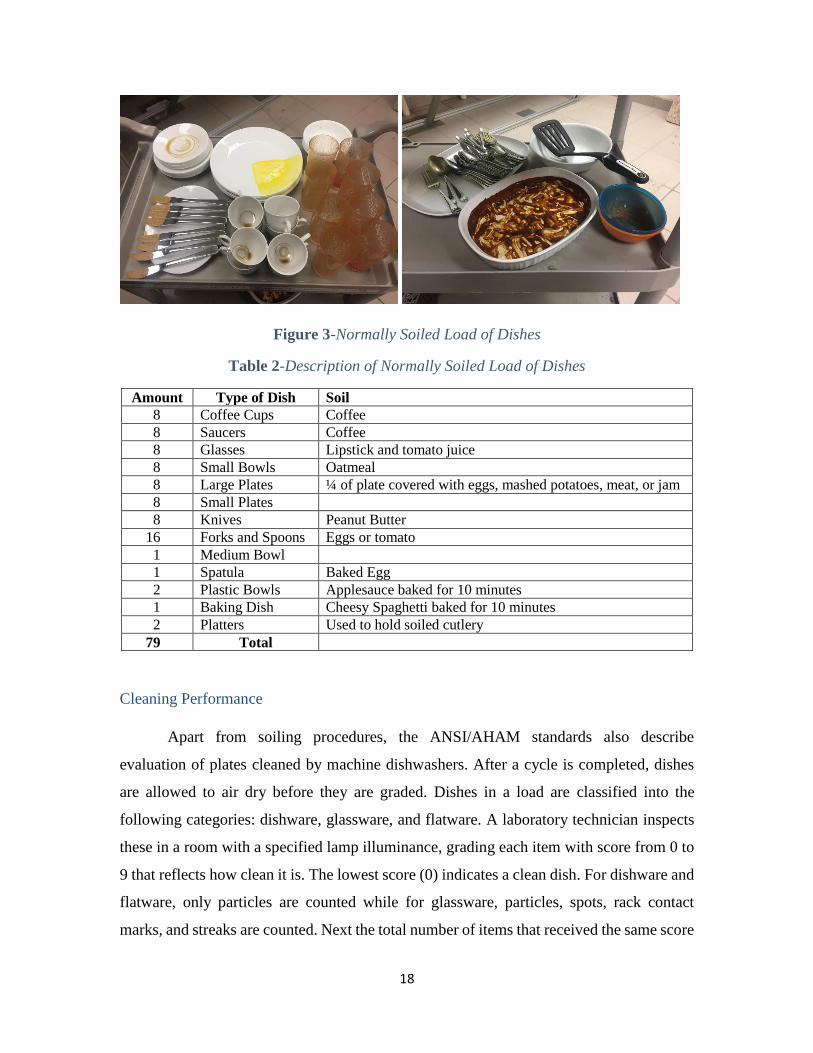
baked on instead of air dried as in the ANSI/AHAM standard. Figure 3 shows the normally
soiled 8 place setting load used in the laboratory testing, and the additional Whirlpool
tougher soils items.
18
Figure 3-Normally Soiled Load of Dishes
Table 2-Description of Normally Soiled Load of Dishes
Amount Type of Dish Soil
8 Coffee Cups Coffee
8 Saucers Coffee
8 Glasses Lipstick and tomato juice
8 Small Bowls Oatmeal
8 Large Plates ¼ of plate covered with eggs, mashed potatoes, meat, or jam
8 Small Plates
8 Knives Peanut Butter
16 Forks and Spoons Eggs or tomato
1 Medium Bowl
1 Spatula Baked Egg
2 Plastic Bowls Applesauce baked for 10 minutes
1 Baking Dish Cheesy Spaghetti baked for 10 minutes
2 Platters Used to hold soiled cutlery
79 Total
Cleaning Performance
Apart from soiling procedures, the ANSI/AHAM standards also describe
evaluation of plates cleaned by machine dishwashers. After a cycle is completed, dishes
are allowed to air dry before they are graded. Dishes in a load are classified into the
following categories: dishware, glassware, and flatware. A laboratory technician inspects
these in a room with a specified lamp illuminance, grading each item with score from 0 to
9 that reflects how clean it is. The lowest score (0) indicates a clean dish. For dishware and
flatware, only particles are counted while for glassware, particles, spots, rack contact
marks, and streaks are counted. Next the total number of items that received the same score
19
are grouped (number of 1’s, etc.) and the category cleaning index (CI) is calculated per
Equation 2.
𝐶𝐼𝑐𝑎𝑡𝑒𝑔𝑜𝑟𝑦 = 100 −
[12.5 (𝑛𝑢𝑚𝑏𝑒𝑟 𝑜𝑓 1′𝑠)+25(𝑛𝑢𝑚𝑏𝑒𝑟 𝑜𝑓 2′𝑠+3′𝑠) +50(𝑛𝑢𝑚𝑏𝑒𝑟 𝑜𝑓 4′𝑠+5′𝑠+6′𝑠)+75(𝑛𝑢𝑚𝑏𝑒𝑟 𝑜𝑓 7′𝑠+8′𝑠)+100(𝑛𝑢𝑚𝑏𝑒𝑟 𝑜𝑓 9′𝑠)]
𝑡𝑜𝑡𝑎𝑙 𝑛𝑢𝑚𝑏𝑒𝑟 𝑜𝑓 𝑖𝑡𝑒𝑚𝑠 𝑖𝑛 𝑐𝑎𝑡𝑒𝑔𝑜𝑟𝑦
Equation 2
Subsequently, a total cleaning index is calculated for the entire load using Equation
3 below. The ANSI/AHAM standard recommends running a minimum of three tests and
applying statistical methods in order to produce more reliable results. Three tests were run
for each dishwasher and the average Total Cleaning Index are reported here.
𝑇𝑜𝑡𝑎𝑙 𝐶𝑙𝑒𝑎𝑛𝑖𝑛𝑔 𝐼𝑛𝑑𝑒𝑥 =𝐶𝐼𝐷𝑖𝑠ℎ𝑒𝑠 𝑁𝐷𝑖𝑠ℎ𝑒𝑠 + 𝐶𝐼𝐺𝑙𝑎𝑠𝑠𝑒𝑠 𝑁𝐺𝑙𝑎𝑠𝑠𝑒𝑠 + 𝐶𝐼𝐹𝑙𝑎𝑡𝑤𝑎𝑟𝑒 𝑁𝐹𝑙𝑎𝑡𝑤𝑎𝑟𝑒
𝑁𝐷𝑖𝑠ℎ𝑒𝑠 + 𝑁𝐺𝑙𝑎𝑠𝑠𝑤𝑎𝑟𝑒 + 𝑁𝐹𝑙𝑎𝑡𝑤𝑎𝑟𝑒 Equation 3
ENERGY STAR
Both machine dishwashers in our analysis are ENERGY STAR certified. ENERGY
STAR released the most recent recognition criteria for dishwashers in 2017 [8]. To verify
that a machine meets these requirements, energy and water performance is measured using
the DOE uniform test procedure. To receive the ENERGY STAR Most Efficient product
label, a machine dishwasher must also have a cleaning index greater than 70 for heavy,
medium, and light cycles as determined by the AHAM/ANSI evaluation method embedded
within the DOE uniform test procedure. Table 3 compares DOE and ENERGY STAR
standards for standard-size dishwashers.
Table 3-Standards for Standard-Size Dishwashers
Energy Water
(kWh/year) (gal/cycle)
DOE (2013) 307 5
ENERGY STAR (2017) 240 3.2
Recommended (Best Practices) for Machine Dishwashers
Manufacturers provide a manual describing how to use the machine for optimal
performance. The manual includes a diagram that demonstrates optimal loading of the
machine, as well as recommending using rinse aid, high-quality detergent packs, and
20
periodic cleaning of the machine interior. A normal cycle with the heat dry option is the
recommended cycle and is often the default setting on machines. The DOE Uniform
Testing Procedures are performed using standard consumables and cycle selection.
Therefore, recommended machine use for both the stainless steel and plastic machine
dishwasher models can be evaluated as they normally would under the DOE testing
procedures. These standardized procedures do not account for pre-rinsing with water; the
ENERGY STAR website advises to avoid this behavior [37]. For both the plastic and
stainless steel machine dishwashers, the normal and heavy/tough cycle is tested three times
each. Water consumed (gallons), electric energy used (kWh), detergent used (grams), time
taken (minutes), and cleaning score for the load are recorded for each test cycle.
Recommended (Best Practices) for Manual Dishwashing
Recommended manual dishwashing behaviors are sourced from existing literature.
Best practices include soaking and scrubbing soiled dishes in a hot-water bath and rinsing
dishes in a cold-water bath [13]. Air drying of dishes is recommended. In order to capture
resource use by manual dishwashers who follow recommended behaviors, an in-house
observational study was conducted by Whirlpool. Three participants were trained on best
practices for manual dishwashing. Next, they were asked to wash the load of normally
soiled dishes. A small summary page with a diagram of best practices for manual
dishwashing was posted at the washing station to remind participants of the steps
(Appendix D). Resource consumption and cleaning scores were evaluated. Participants
also answered subsequent survey questions.
Typical Machine Dishwasher Loading, Typical Manual Dishwashing, & Survey Questions
Machine dishwashers may not be optimally loaded as recommended by
manufacturers. The only pretreatment recommended in the manual is scraping leftover
food off dishes without pre-rinsing [38]. However, some still choose to pretreat by rinsing
or soaking their dishes before loading. Manual dishwashing behaviors can be categorized
into running tap, water bath, and combination methods [5]. In order to observe typical
behaviors, an observational laboratory study was conducted using forty participants
recruited from within the Benton Harbor Whirlpool campus. The majority of participants
were male, over the age of 35, and the majority lived in households with four people.
21
Further demographics for this group are summarized in Appendix E. In order to minimize
bias, only employees who were not from the Sustainability or Dishwasher Teams were
allowed to participate. These participants were asked to complete three different tasks: load
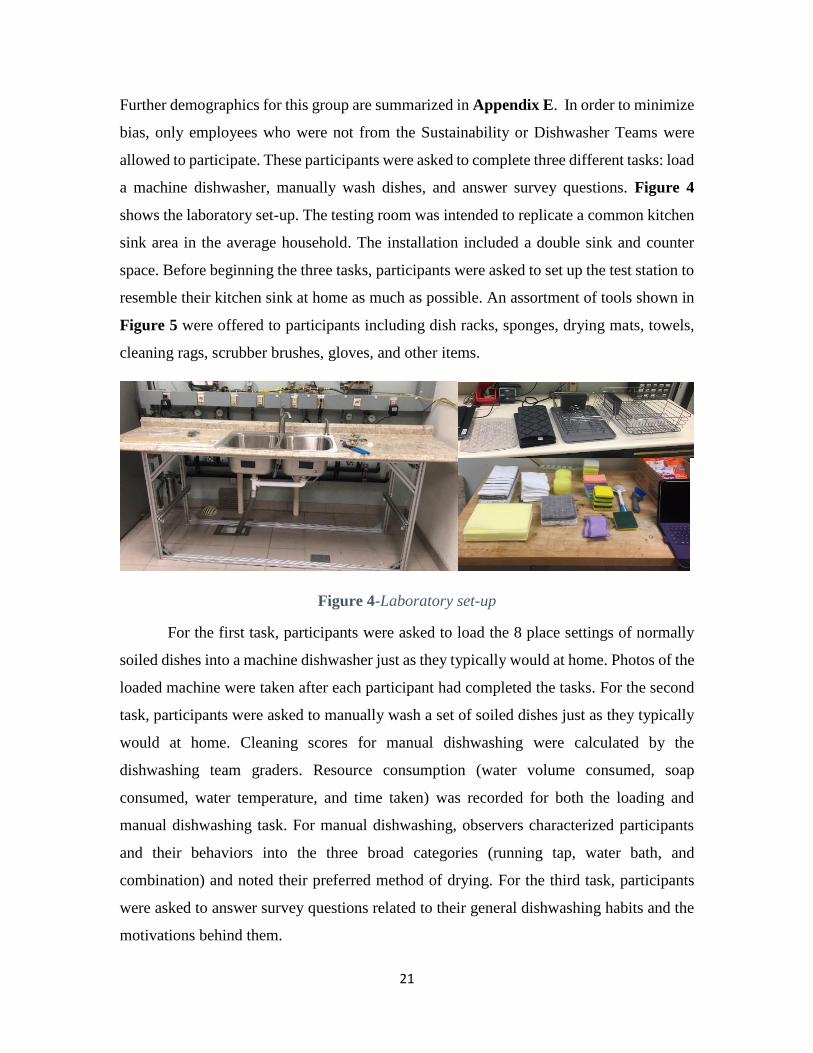
a machine dishwasher, manually wash dishes, and answer survey questions. Figure 4
shows the laboratory set-up. The testing room was intended to replicate a common kitchen
sink area in the average household. The installation included a double sink and counter
space. Before beginning the three tasks, participants were asked to set up the test station to
resemble their kitchen sink at home as much as possible. An assortment of tools shown in
Figure 5 were offered to participants including dish racks, sponges, drying mats, towels,
cleaning rags, scrubber brushes, gloves, and other items.
Figure 4-Laboratory set-up
For the first task, participants were asked to load the 8 place settings of normally
soiled dishes into a machine dishwasher just as they typically would at home. Photos of the
loaded machine were taken after each participant had completed the tasks. For the second
task, participants were asked to manually wash a set of soiled dishes just as they typically
would at home. Cleaning scores for manual dishwashing were calculated by the
dishwashing team graders. Resource consumption (water volume consumed, soap
consumed, water temperature, and time taken) was recorded for both the loading and
manual dishwashing task. For manual dishwashing, observers characterized participants
and their behaviors into the three broad categories (running tap, water bath, and
combination) and noted their preferred method of drying. For the third task, participants
were asked to answer survey questions related to their general dishwashing habits and the
motivations behind them.
22
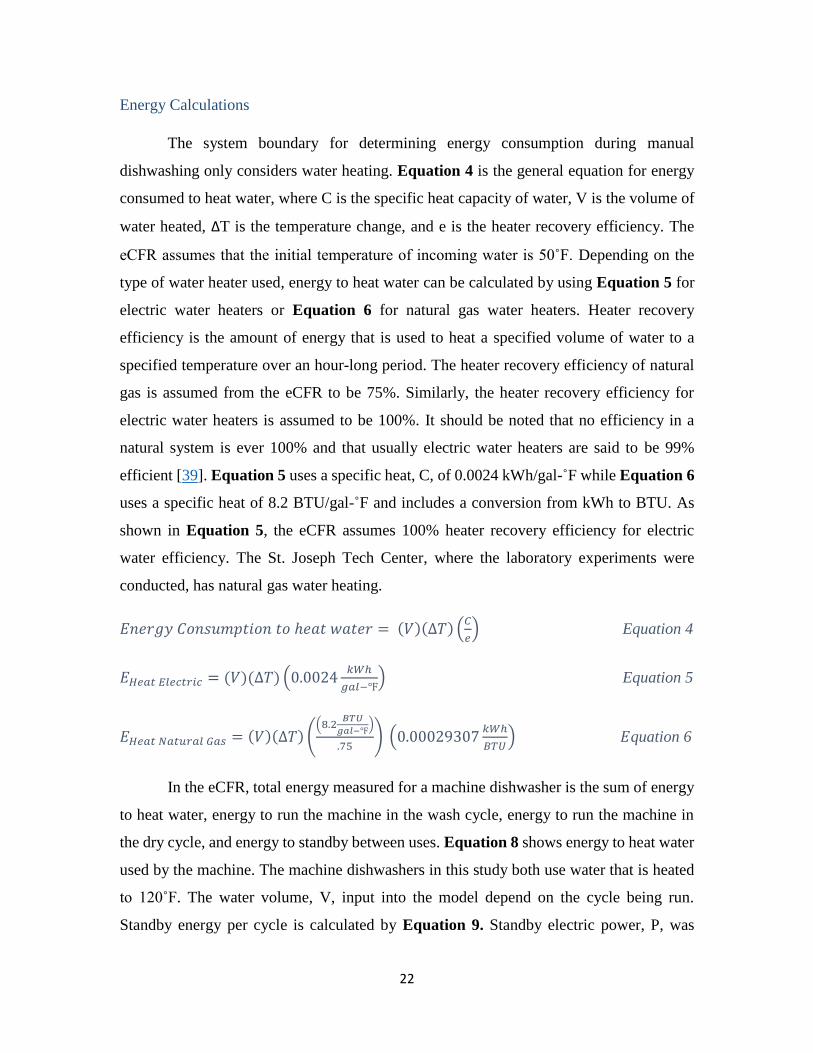
Energy Calculations
The system boundary for determining energy consumption during manual
dishwashing only considers water heating. Equation 4 is the general equation for energy
consumed to heat water, where C is the specific heat capacity of water, V is the volume of
water heated, ΔT is the temperature change, and e is the heater recovery efficiency. The
eCFR assumes that the initial temperature of incoming water is 50˚F. Depending on the
type of water heater used, energy to heat water can be calculated by using Equation 5 for
electric water heaters or Equation 6 for natural gas water heaters. Heater recovery
efficiency is the amount of energy that is used to heat a specified volume of water to a
specified temperature over an hour-long period. The heater recovery efficiency of natural
gas is assumed from the eCFR to be 75%. Similarly, the heater recovery efficiency for
electric water heaters is assumed to be 100%. It should be noted that no efficiency in a
natural system is ever 100% and that usually electric water heaters are said to be 99%
efficient [39]. Equation 5 uses a specific heat, C, of 0.0024 kWh/gal-˚F while Equation 6
uses a specific heat of 8.2 BTU/gal-˚F and includes a conversion from kWh to BTU. As
shown in Equation 5, the eCFR assumes 100% heater recovery efficiency for electric
water efficiency. The St. Joseph Tech Center, where the laboratory experiments were
conducted, has natural gas water heating.
𝐸𝑛𝑒𝑟𝑔𝑦 𝐶𝑜𝑛𝑠𝑢𝑚𝑝𝑡𝑖𝑜𝑛 𝑡𝑜 ℎ𝑒𝑎𝑡 𝑤𝑎𝑡𝑒𝑟 = (𝑉)(∆𝑇) (𝐶
𝑒) Equation 4
𝐸𝐻𝑒𝑎𝑡 𝐸𝑙𝑒𝑐𝑡𝑟𝑖𝑐 = (𝑉)(∆𝑇) (0.0024𝑘𝑊ℎ
𝑔𝑎𝑙−℉) Equation 5
𝐸𝐻𝑒𝑎𝑡 𝑁𝑎𝑡𝑢𝑟𝑎𝑙 𝐺𝑎𝑠 = (𝑉)(∆𝑇) ((8.2
𝐵𝑇𝑈
𝑔𝑎𝑙−℉)
.75) (0.00029307
𝑘𝑊ℎ
𝐵𝑇𝑈) 𝐸quation 6
In the eCFR, total energy measured for a machine dishwasher is the sum of energy
to heat water, energy to run the machine in the wash cycle, energy to run the machine in
the dry cycle, and energy to standby between uses. Equation 8 shows energy to heat water
used by the machine. The machine dishwashers in this study both use water that is heated
to 120˚F. The water volume, V, input into the model depend on the cycle being run.
Standby energy per cycle is calculated by Equation 9. Standby electric power, P, was
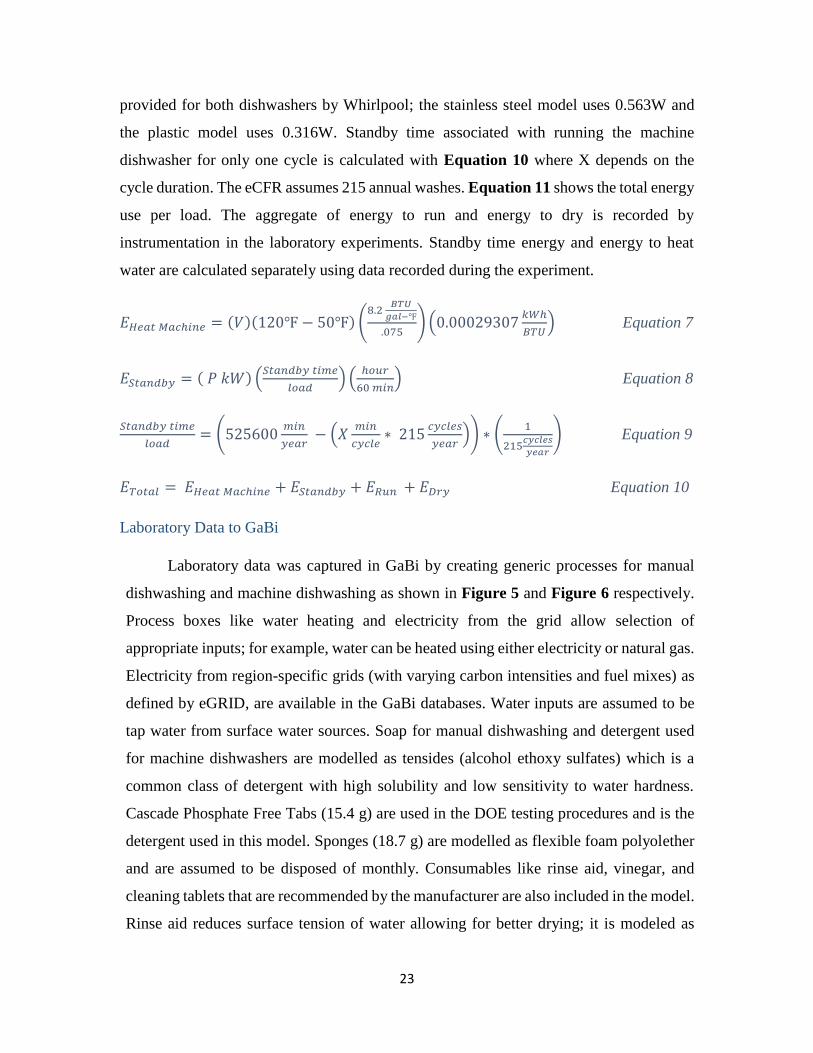
23
provided for both dishwashers by Whirlpool; the stainless steel model uses 0.563W and
the plastic model uses 0.316W. Standby time associated with running the machine
dishwasher for only one cycle is calculated with Equation 10 where X depends on the
cycle duration. The eCFR assumes 215 annual washes. Equation 11 shows the total energy
use per load. The aggregate of energy to run and energy to dry is recorded by
instrumentation in the laboratory experiments. Standby time energy and energy to heat
water are calculated separately using data recorded during the experiment.
𝐸𝐻𝑒𝑎𝑡 𝑀𝑎𝑐ℎ𝑖𝑛𝑒 = (𝑉)(120℉ − 50℉) (8.2
𝐵𝑇𝑈
𝑔𝑎𝑙−℉
.075) (0.00029307
𝑘𝑊ℎ
𝐵𝑇𝑈) Equation 7
𝐸𝑆𝑡𝑎𝑛𝑑𝑏𝑦 = ( 𝑃 𝑘𝑊) (𝑆𝑡𝑎𝑛𝑑𝑏𝑦 𝑡𝑖𝑚𝑒
𝑙𝑜𝑎𝑑) (
ℎ𝑜𝑢𝑟
60 𝑚𝑖𝑛) Equation 8
𝑆𝑡𝑎𝑛𝑑𝑏𝑦 𝑡𝑖𝑚𝑒
𝑙𝑜𝑎𝑑= (525600
𝑚𝑖𝑛
𝑦𝑒𝑎𝑟 − (𝑋
𝑚𝑖𝑛
𝑐𝑦𝑐𝑙𝑒∗ 215
𝑐𝑦𝑐𝑙𝑒𝑠
𝑦𝑒𝑎𝑟)) ∗ (
1
215𝑐𝑦𝑐𝑙𝑒𝑠
𝑦𝑒𝑎𝑟
) Equation 9
𝐸𝑇𝑜𝑡𝑎𝑙 = 𝐸𝐻𝑒𝑎𝑡 𝑀𝑎𝑐ℎ𝑖𝑛𝑒 + 𝐸𝑆𝑡𝑎𝑛𝑑𝑏𝑦 + 𝐸𝑅𝑢𝑛 + 𝐸𝐷𝑟𝑦 Equation 10
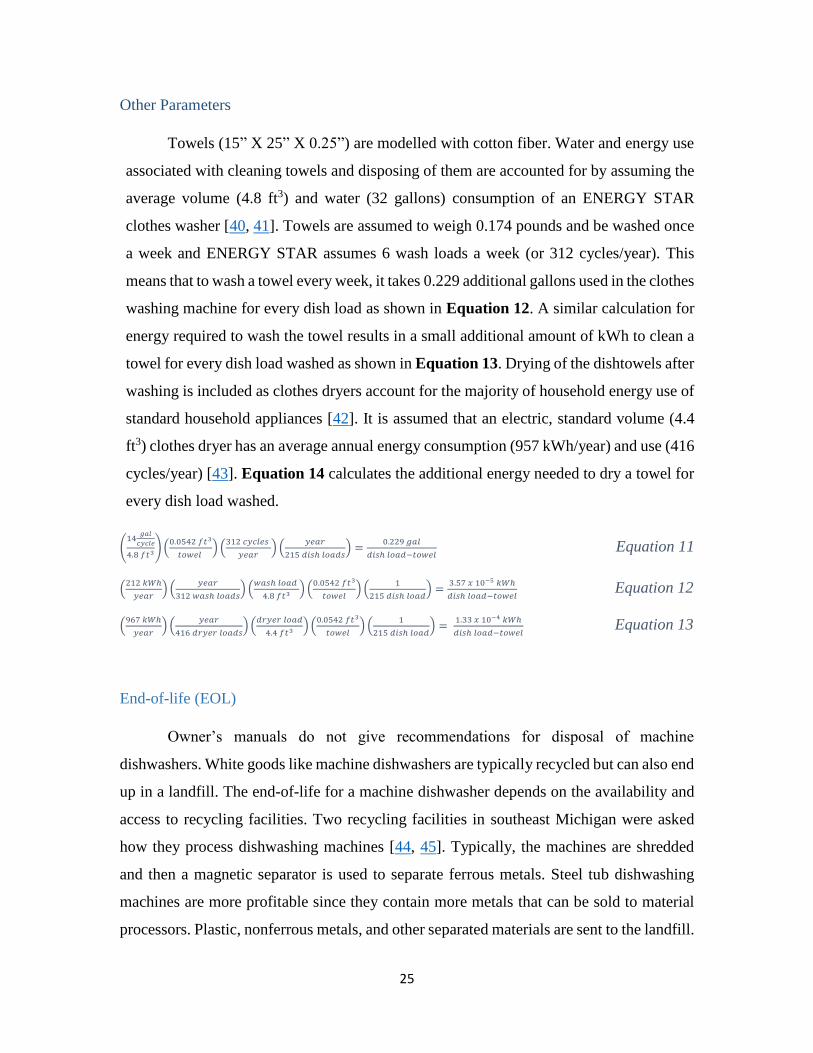
Laboratory Data to GaBi
Laboratory data was captured in GaBi by creating generic processes for manual
dishwashing and machine dishwashing as shown in Figure 5 and Figure 6 respectively.
Process boxes like water heating and electricity from the grid allow selection of
appropriate inputs; for example, water can be heated using either electricity or natural gas.
Electricity from region-specific grids (with varying carbon intensities and fuel mixes) as
defined by eGRID, are available in the GaBi databases. Water inputs are assumed to be
tap water from surface water sources. Soap for manual dishwashing and detergent used
for machine dishwashers are modelled as tensides (alcohol ethoxy sulfates) which is a
common class of detergent with high solubility and low sensitivity to water hardness.
Cascade Phosphate Free Tabs (15.4 g) are used in the DOE testing procedures and is the
detergent used in this model. Sponges (18.7 g) are modelled as flexible foam polyolether
and are assumed to be disposed of monthly. Consumables like rinse aid, vinegar, and
cleaning tablets that are recommended by the manufacturer are also included in the model.
Rinse aid reduces surface tension of water allowing for better drying; it is modeled as
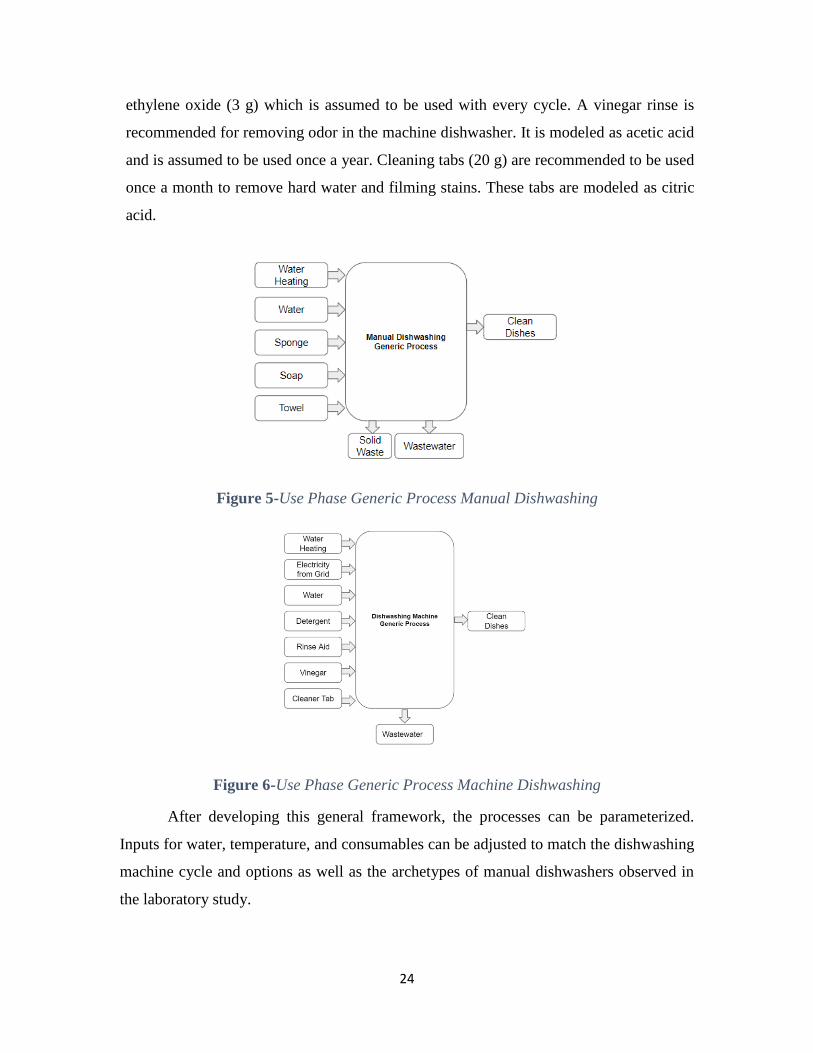
24
ethylene oxide (3 g) which is assumed to be used with every cycle. A vinegar rinse is
recommended for removing odor in the machine dishwasher. It is modeled as acetic acid
and is assumed to be used once a year. Cleaning tabs (20 g) are recommended to be used
once a month to remove hard water and filming stains. These tabs are modeled as citric
acid.
Figure 5-Use Phase Generic Process Manual Dishwashing
Figure 6-Use Phase Generic Process Machine Dishwashing
After developing this general framework, the processes can be parameterized.
Inputs for water, temperature, and consumables can be adjusted to match the dishwashing
machine cycle and options as well as the archetypes of manual dishwashers observed in
the laboratory study.
25
Other Parameters
Towels (15” X 25” X 0.25”) are modelled with cotton fiber. Water and energy use
associated with cleaning towels and disposing of them are accounted for by assuming the
average volume (4.8 ft3) and water (32 gallons) consumption of an ENERGY STAR
clothes washer [40, 41]. Towels are assumed to weigh 0.174 pounds and be washed once
a week and ENERGY STAR assumes 6 wash loads a week (or 312 cycles/year). This
means that to wash a towel every week, it takes 0.229 additional gallons used in the clothes
washing machine for every dish load as shown in Equation 12. A similar calculation for
energy required to wash the towel results in a small additional amount of kWh to clean a
towel for every dish load washed as shown in Equation 13. Drying of the dishtowels after
washing is included as clothes dryers account for the majority of household energy use of
standard household appliances [42]. It is assumed that an electric, standard volume (4.4
ft3) clothes dryer has an average annual energy consumption (957 kWh/year) and use (416
cycles/year) [43]. Equation 14 calculates the additional energy needed to dry a towel for
every dish load washed.
(14
𝑔𝑎𝑙
𝑐𝑦𝑐𝑙𝑒
4.8 𝑓𝑡3) (0.0542 𝑓𝑡3
𝑡𝑜𝑤𝑒𝑙 ) (
312 𝑐𝑦𝑐𝑙𝑒𝑠
𝑦𝑒𝑎𝑟) (
𝑦𝑒𝑎𝑟
215 𝑑𝑖𝑠ℎ 𝑙𝑜𝑎𝑑𝑠) =
0.229 𝑔𝑎𝑙
𝑑𝑖𝑠ℎ 𝑙𝑜𝑎𝑑−𝑡𝑜𝑤𝑒𝑙 Equation 11
(212 𝑘𝑊ℎ
𝑦𝑒𝑎𝑟) (
𝑦𝑒𝑎𝑟
312 𝑤𝑎𝑠ℎ 𝑙𝑜𝑎𝑑𝑠) (
𝑤𝑎𝑠ℎ 𝑙𝑜𝑎𝑑
4.8 𝑓𝑡3) (
0.0542 𝑓𝑡3
𝑡𝑜𝑤𝑒𝑙) (
1
215 𝑑𝑖𝑠ℎ 𝑙𝑜𝑎𝑑) =
3.57 𝑥 10−5 𝑘𝑊ℎ
𝑑𝑖𝑠ℎ 𝑙𝑜𝑎𝑑−𝑡𝑜𝑤𝑒𝑙 Equation 12
(967 𝑘𝑊ℎ
𝑦𝑒𝑎𝑟) (
𝑦𝑒𝑎𝑟
416 𝑑𝑟𝑦𝑒𝑟 𝑙𝑜𝑎𝑑𝑠) (
𝑑𝑟𝑦𝑒𝑟 𝑙𝑜𝑎𝑑
4.4 𝑓𝑡3 ) (0.0542 𝑓𝑡3
𝑡𝑜𝑤𝑒𝑙) (
1
215 𝑑𝑖𝑠ℎ 𝑙𝑜𝑎𝑑) =
1.33 𝑥 10−4 𝑘𝑊ℎ
𝑑𝑖𝑠ℎ 𝑙𝑜𝑎𝑑−𝑡𝑜𝑤𝑒𝑙 Equation 13
End-of-life (EOL)
Owner’s manuals do not give recommendations for disposal of machine
dishwashers. White goods like machine dishwashers are typically recycled but can also end
up in a landfill. The end-of-life for a machine dishwasher depends on the availability and
access to recycling facilities. Two recycling facilities in southeast Michigan were asked
how they process dishwashing machines [44, 45]. Typically, the machines are shredded
and then a magnetic separator is used to separate ferrous metals. Steel tub dishwashing
machines are more profitable since they contain more metals that can be sold to material
processors. Plastic, nonferrous metals, and other separated materials are sent to the landfill.
26
The following assumptions are made for recycling and landfilling. The appliance
shredder is assumed to be have a 149 kW power rating and take 25 seconds to shred a
dishwashing machine. [46] The magnetic current separator is assumed to require 16.2 kW
of power and 60 seconds to process all the material through [47-49]. It is unclear if
recycling centers or landfills would actually be closer to use-phase locations. Therefore,
the same distance will be assumed for both as is commonly done [50, 51]. The default
setting in GaBi for transport distances is 100 miles taken from EPA SmartWay fleet data.
This distance will be assumed for distance from home to landfill, distance from home to
recycling center, and distance from recycling center to landfill.
RESULTS
Material Production
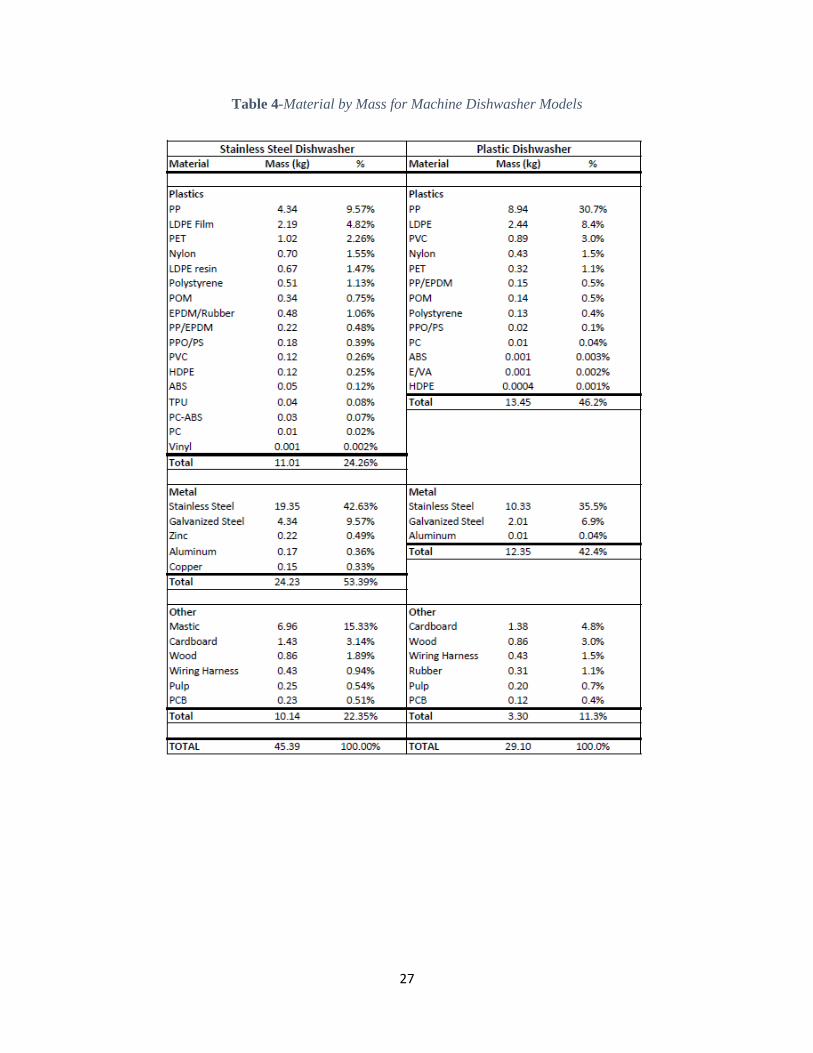
Table 4 summarizes the amount and type of material found in the stainless steel
and plastic machine dishwashers as calculated using the estimation technique described in
the Methods section. Whirlpool reports the gross weight of a stainless steel machine as
47.2 kg (104 lb.), however Table 4 totals 45.4 kg (100 lb.). ISO 14044 describes cut-off
criteria for modelling by mass; typically, 95% of the total mass of a product is modelled
while the rest can be excluded [52]. It should be noted that the excluded portions are not
expected to have a significant environmental impact. For the stainless steel machine
dishwasher, 96.2% of the total mass is captured in the estimation. The plastic machine
dishwasher has a gross weight of 30.4 kg (67 lb.) and 95.7% of this total mass is captured
in the model.
27
Table 4-Material by Mass for Machine Dishwasher Models
28
Process-level & Facility-level Approaches to Manufacturing
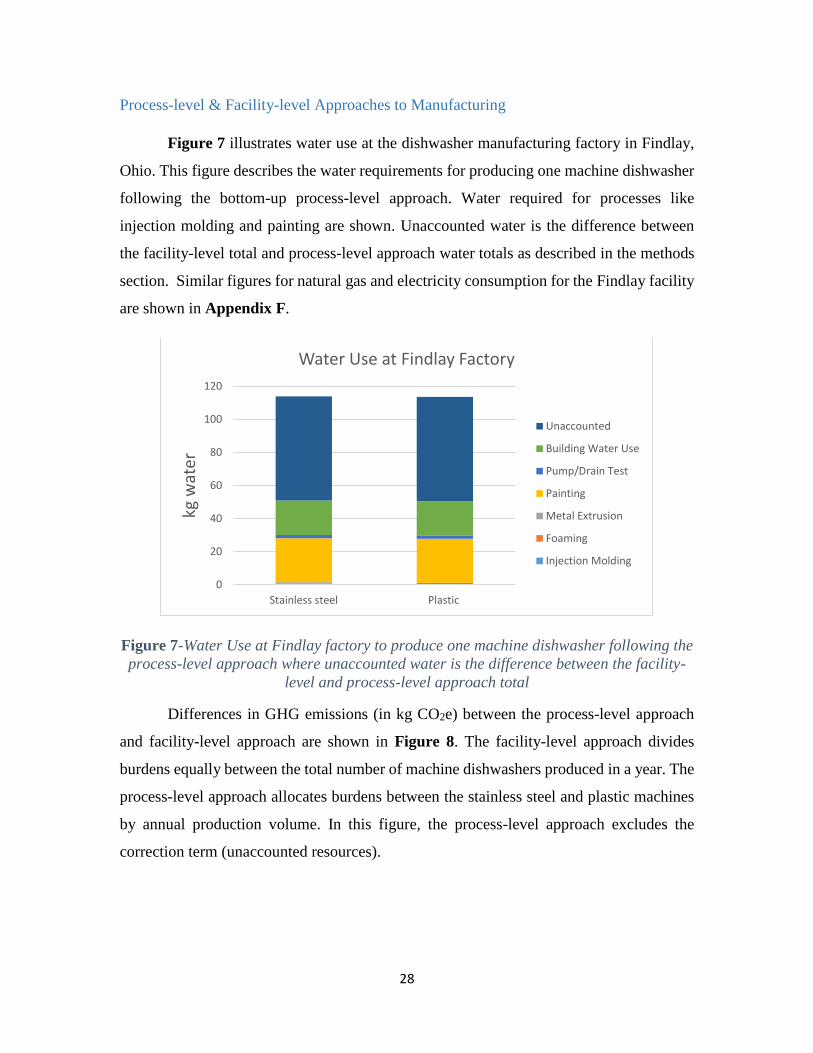
Figure 7 illustrates water use at the dishwasher manufacturing factory in Findlay,
Ohio. This figure describes the water requirements for producing one machine dishwasher
following the bottom-up process-level approach. Water required for processes like
injection molding and painting are shown. Unaccounted water is the difference between
the facility-level total and process-level approach water totals as described in the methods
section. Similar figures for natural gas and electricity consumption for the Findlay facility
are shown in Appendix F.
Figure 7-Water Use at Findlay factory to produce one machine dishwasher following the
process-level approach where unaccounted water is the difference between the facility-
level and process-level approach total
Differences in GHG emissions (in kg CO2e) between the process-level approach
and facility-level approach are shown in Figure 8. The facility-level approach divides
burdens equally between the total number of machine dishwashers produced in a year. The
process-level approach allocates burdens between the stainless steel and plastic machines
by annual production volume. In this figure, the process-level approach excludes the
correction term (unaccounted resources).
0
20
40
60
80
100
120
Stainless steel Plastic
kg w
ater
Water Use at Findlay Factory
Unaccounted
Building Water Use
Pump/Drain Test
Painting
Metal Extrusion
Foaming
Injection Molding
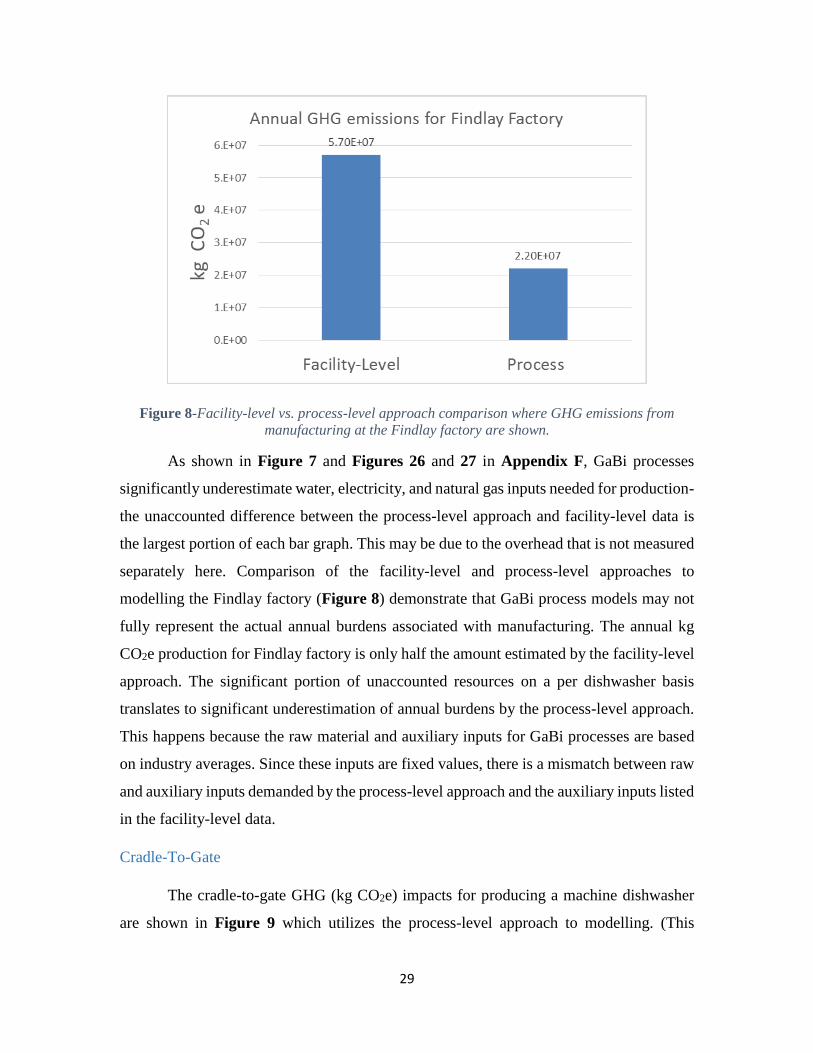
29
Figure 8-Facility-level vs. process-level approach comparison where GHG emissions from
manufacturing at the Findlay factory are shown.
As shown in Figure 7 and Figures 26 and 27 in Appendix F, GaBi processes
significantly underestimate water, electricity, and natural gas inputs needed for production-
the unaccounted difference between the process-level approach and facility-level data is
the largest portion of each bar graph. This may be due to the overhead that is not measured
separately here. Comparison of the facility-level and process-level approaches to
modelling the Findlay factory (Figure 8) demonstrate that GaBi process models may not
fully represent the actual annual burdens associated with manufacturing. The annual kg
CO2e production for Findlay factory is only half the amount estimated by the facility-level
approach. The significant portion of unaccounted resources on a per dishwasher basis
translates to significant underestimation of annual burdens by the process-level approach.
This happens because the raw material and auxiliary inputs for GaBi processes are based
on industry averages. Since these inputs are fixed values, there is a mismatch between raw
and auxiliary inputs demanded by the process-level approach and the auxiliary inputs listed
in the facility-level data.
Cradle-To-Gate
The cradle-to-gate GHG (kg CO2e) impacts for producing a machine dishwasher
are shown in Figure 9 which utilizes the process-level approach to modelling. (This
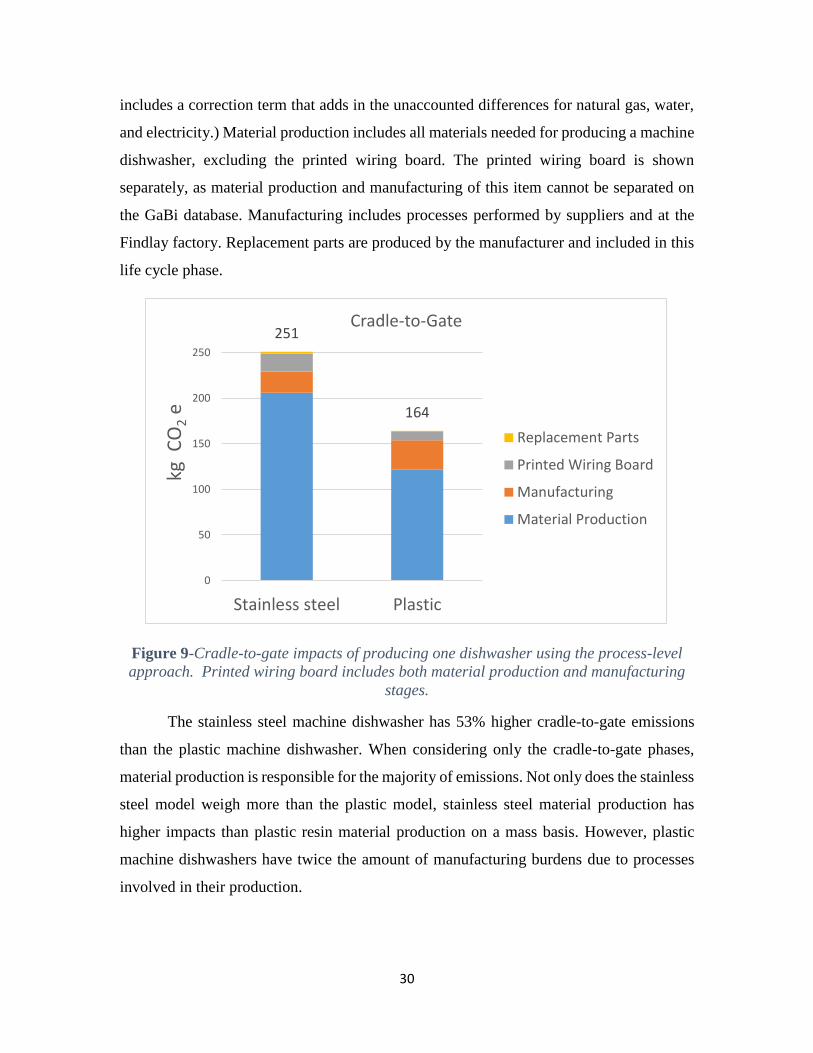
30
includes a correction term that adds in the unaccounted differences for natural gas, water,
and electricity.) Material production includes all materials needed for producing a machine
dishwasher, excluding the printed wiring board. The printed wiring board is shown
separately, as material production and manufacturing of this item cannot be separated on
the GaBi database. Manufacturing includes processes performed by suppliers and at the
Findlay factory. Replacement parts are produced by the manufacturer and included in this
life cycle phase.
Figure 9-Cradle-to-gate impacts of producing one dishwasher using the process-level
approach. Printed wiring board includes both material production and manufacturing
stages.
The stainless steel machine dishwasher has 53% higher cradle-to-gate emissions
than the plastic machine dishwasher. When considering only the cradle-to-gate phases,
material production is responsible for the majority of emissions. Not only does the stainless
steel model weigh more than the plastic model, stainless steel material production has
higher impacts than plastic resin material production on a mass basis. However, plastic
machine dishwashers have twice the amount of manufacturing burdens due to processes
involved in their production.
251
164
0
50
100
150
200
250
Stainless steel Plastic
kg C
O2
e
Cradle-to-Gate
Replacement Parts
Printed Wiring Board
Manufacturing
Material Production
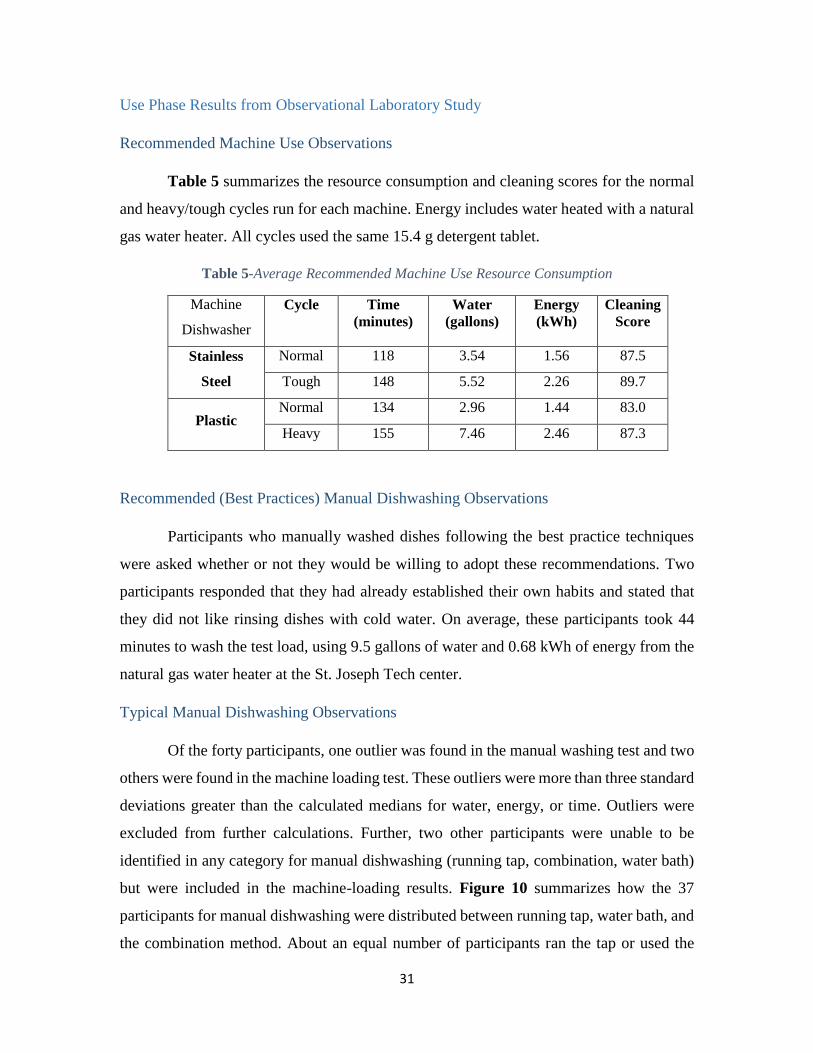
31
Use Phase Results from Observational Laboratory Study
Recommended Machine Use Observations
Table 5 summarizes the resource consumption and cleaning scores for the normal
and heavy/tough cycles run for each machine. Energy includes water heated with a natural
gas water heater. All cycles used the same 15.4 g detergent tablet.
Table 5-Average Recommended Machine Use Resource Consumption
Machine
Dishwasher
Cycle Time
(minutes)
Water
(gallons)
Energy
(kWh)
Cleaning
Score
Stainless
Steel
Normal 118 3.54 1.56 87.5
Tough 148 5.52 2.26 89.7
Plastic Normal 134 2.96 1.44 83.0
Heavy 155 7.46 2.46 87.3
Recommended (Best Practices) Manual Dishwashing Observations
Participants who manually washed dishes following the best practice techniques
were asked whether or not they would be willing to adopt these recommendations. Two
participants responded that they had already established their own habits and stated that
they did not like rinsing dishes with cold water. On average, these participants took 44
minutes to wash the test load, using 9.5 gallons of water and 0.68 kWh of energy from the
natural gas water heater at the St. Joseph Tech center.
Typical Manual Dishwashing Observations
Of the forty participants, one outlier was found in the manual washing test and two
others were found in the machine loading test. These outliers were more than three standard
deviations greater than the calculated medians for water, energy, or time. Outliers were
excluded from further calculations. Further, two other participants were unable to be
identified in any category for manual dishwashing (running tap, combination, water bath)
but were included in the machine-loading results. Figure 10 summarizes how the 37
participants for manual dishwashing were distributed between running tap, water bath, and
the combination method. About an equal number of participants ran the tap or used the
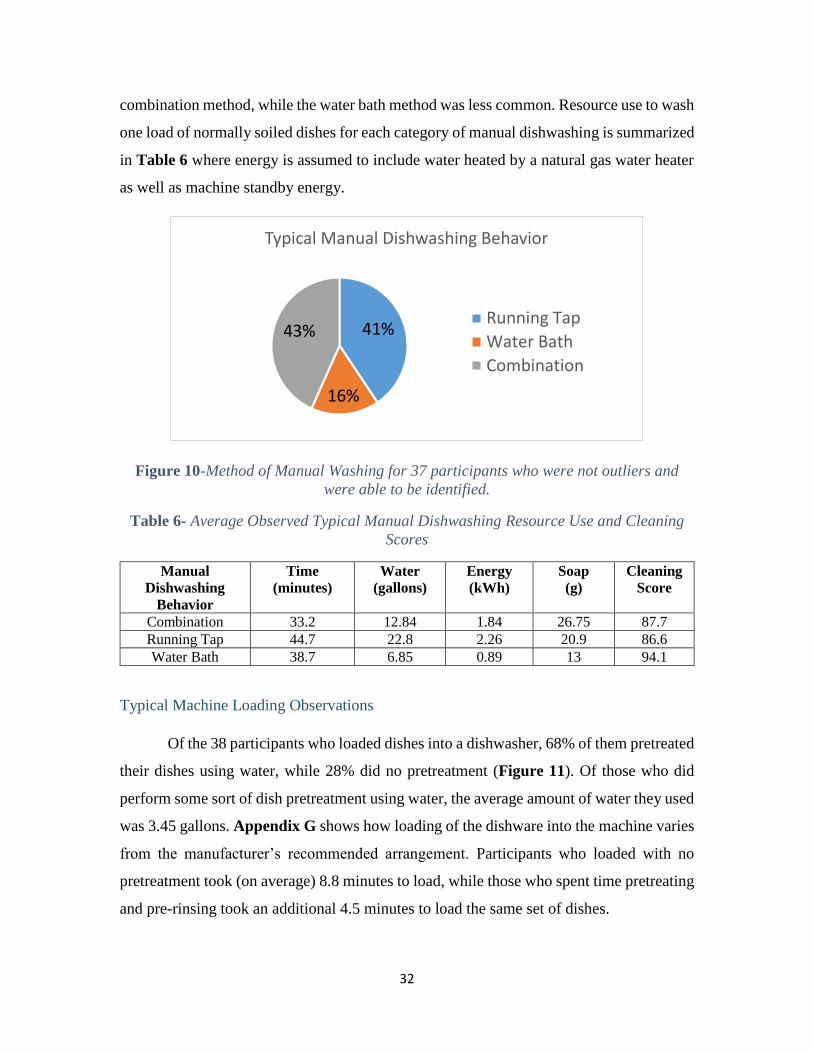
32
combination method, while the water bath method was less common. Resource use to wash
one load of normally soiled dishes for each category of manual dishwashing is summarized
in Table 6 where energy is assumed to include water heated by a natural gas water heater
as well as machine standby energy.
Figure 10-Method of Manual Washing for 37 participants who were not outliers and
were able to be identified.
Table 6- Average Observed Typical Manual Dishwashing Resource Use and Cleaning
Scores
Manual
Dishwashing
Behavior
Time
(minutes)
Water
(gallons)
Energy
(kWh)
Soap
(g)
Cleaning
Score
Combination 33.2 12.84 1.84 26.75 87.7
Running Tap 44.7 22.8 2.26 20.9 86.6
Water Bath 38.7 6.85 0.89 13 94.1
Typical Machine Loading Observations
Of the 38 participants who loaded dishes into a dishwasher, 68% of them pretreated
their dishes using water, while 28% did no pretreatment (Figure 11). Of those who did
perform some sort of dish pretreatment using water, the average amount of water they used
was 3.45 gallons. Appendix G shows how loading of the dishware into the machine varies
from the manufacturer’s recommended arrangement. Participants who loaded with no
pretreatment took (on average) 8.8 minutes to load, while those who spent time pretreating
and pre-rinsing took an additional 4.5 minutes to load the same set of dishes.
41%
16%
43%
Typical Manual Dishwashing Behavior
Running Tap
Water Bath
Combination
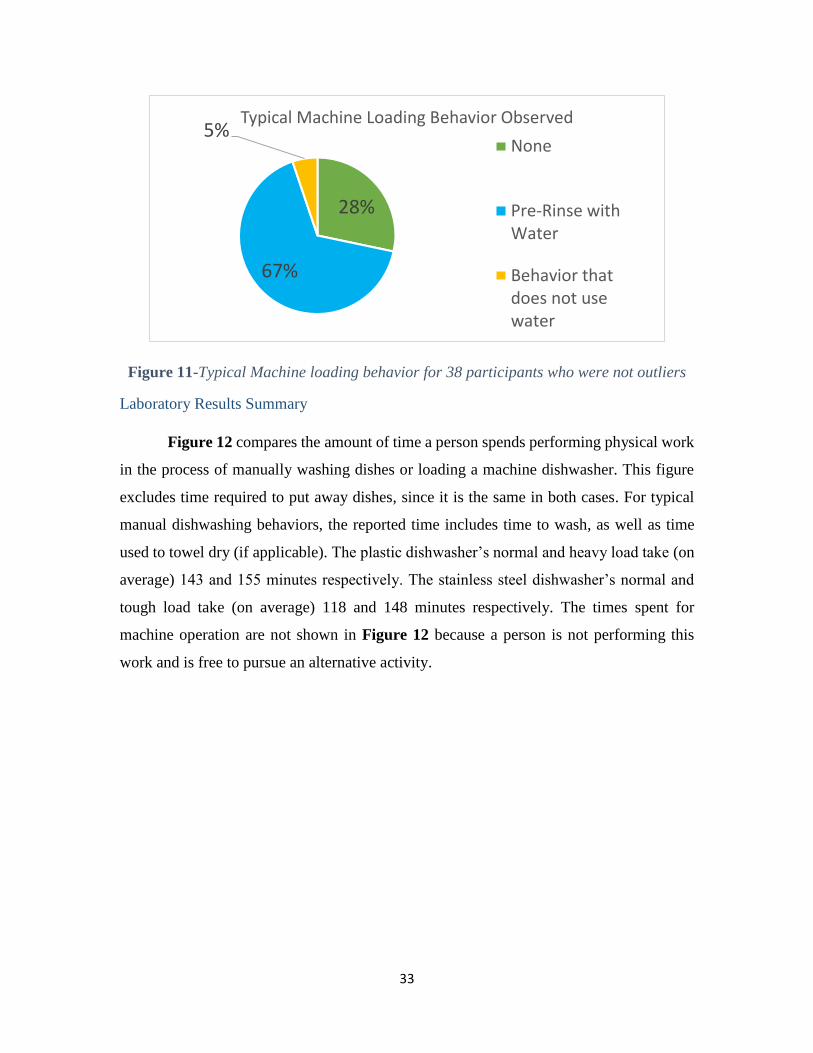
33
Figure 11-Typical Machine loading behavior for 38 participants who were not outliers
Laboratory Results Summary
Figure 12 compares the amount of time a person spends performing physical work
in the process of manually washing dishes or loading a machine dishwasher. This figure
excludes time required to put away dishes, since it is the same in both cases. For typical
manual dishwashing behaviors, the reported time includes time to wash, as well as time
used to towel dry (if applicable). The plastic dishwasher’s normal and heavy load take (on
average) 143 and 155 minutes respectively. The stainless steel dishwasher’s normal and
tough load take (on average) 118 and 148 minutes respectively. The times spent for
machine operation are not shown in Figure 12 because a person is not performing this
work and is free to pursue an alternative activity.
28%
67%
5%Typical Machine Loading Behavior Observed
None
Pre-Rinse withWater
Behavior thatdoes not usewater
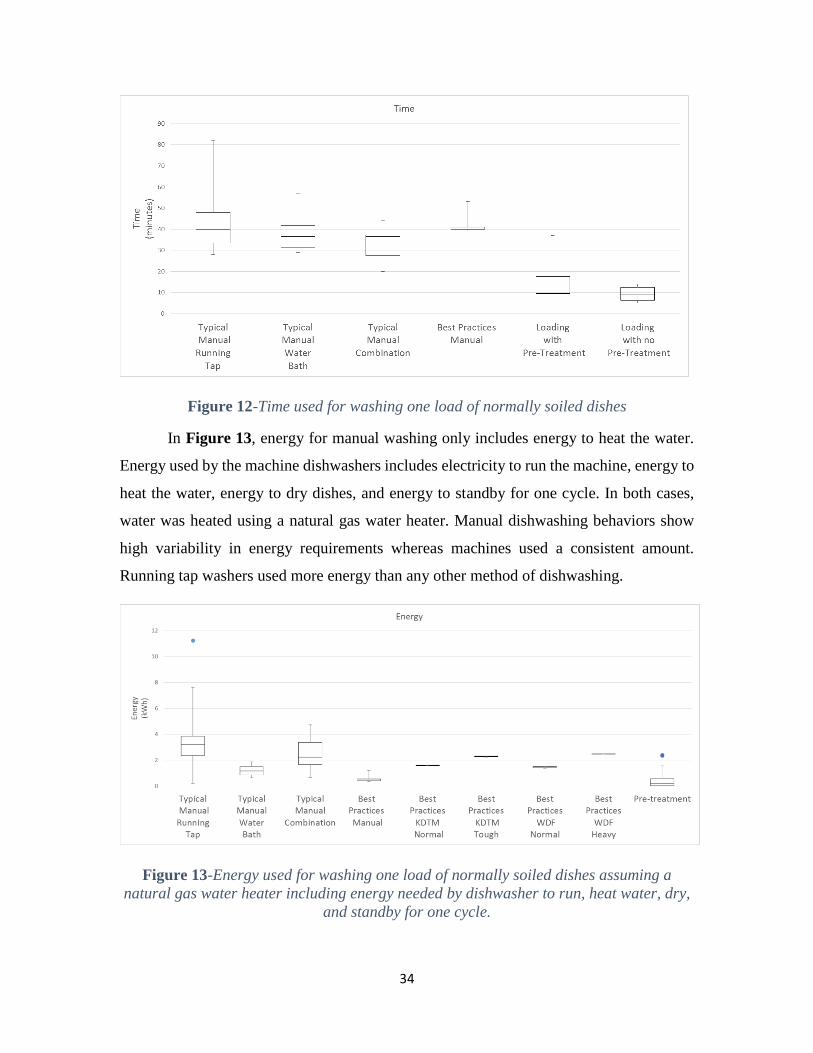
34
Figure 12-Time used for washing one load of normally soiled dishes
In Figure 13, energy for manual washing only includes energy to heat the water.
Energy used by the machine dishwashers includes electricity to run the machine, energy to
heat the water, energy to dry dishes, and energy to standby for one cycle. In both cases,
water was heated using a natural gas water heater. Manual dishwashing behaviors show
high variability in energy requirements whereas machines used a consistent amount.
Running tap washers used more energy than any other method of dishwashing.
Figure 13-Energy used for washing one load of normally soiled dishes assuming a
natural gas water heater including energy needed by dishwasher to run, heat water, dry,
and standby for one cycle.
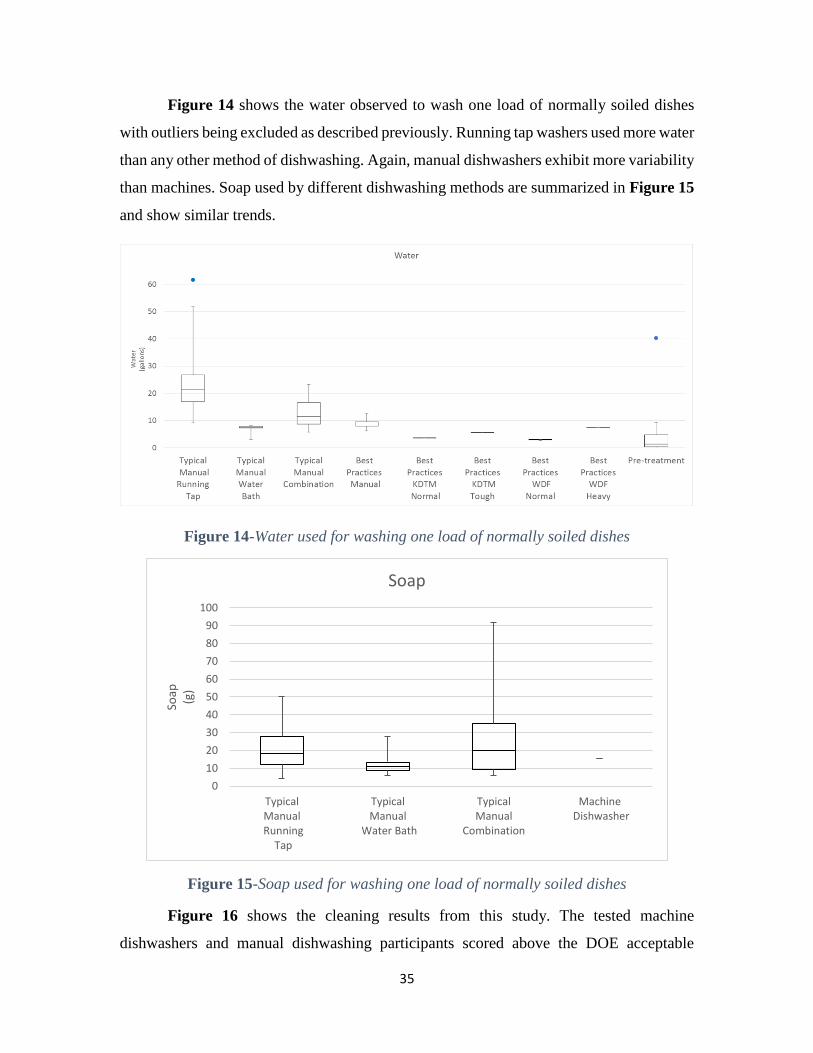
35
Figure 14 shows the water observed to wash one load of normally soiled dishes
with outliers being excluded as described previously. Running tap washers used more water
than any other method of dishwashing. Again, manual dishwashers exhibit more variability
than machines. Soap used by different dishwashing methods are summarized in Figure 15
and show similar trends.
Figure 14-Water used for washing one load of normally soiled dishes
Figure 15-Soap used for washing one load of normally soiled dishes Figure 16 shows the cleaning results from this study. The tested machine
dishwashers and manual dishwashing participants scored above the DOE acceptable
0
10
20
30
40
50
60
70
80
90
100
TypicalManual
Running Tap
TypicalManual
Water Bath
TypicalManual
Combination
Machine Dishwasher
Soap
(g)
Soap
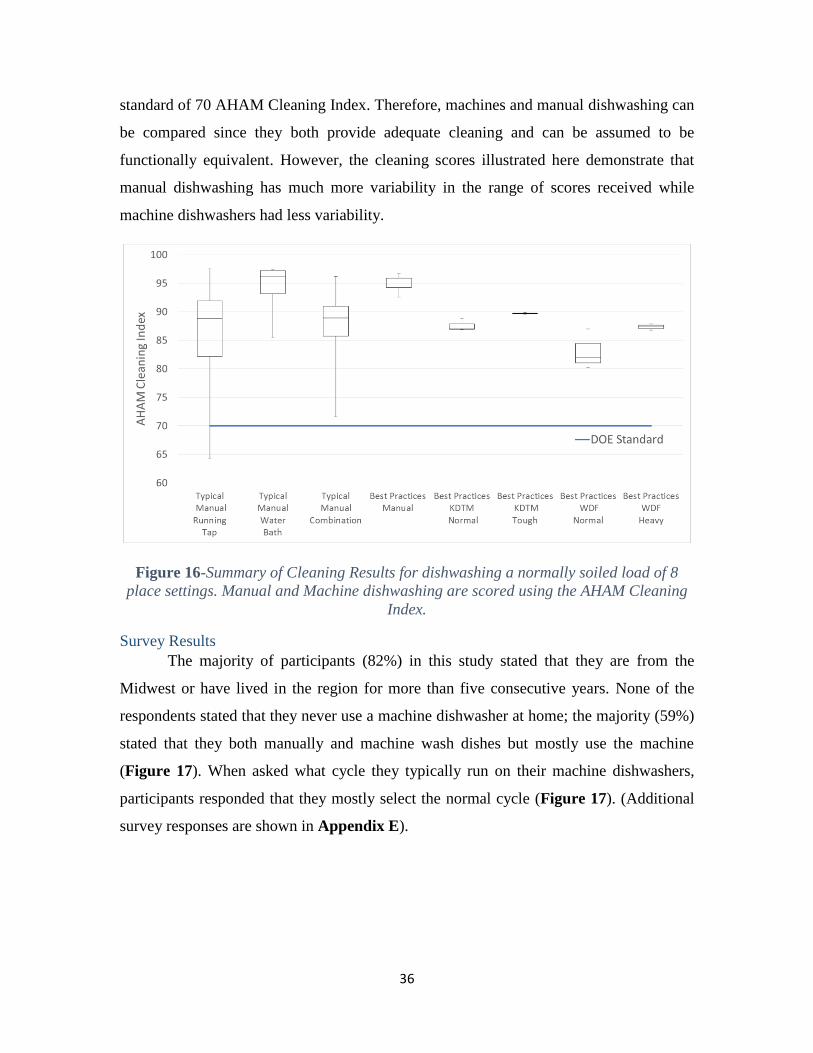
36
standard of 70 AHAM Cleaning Index. Therefore, machines and manual dishwashing can
be compared since they both provide adequate cleaning and can be assumed to be
functionally equivalent. However, the cleaning scores illustrated here demonstrate that
manual dishwashing has much more variability in the range of scores received while
machine dishwashers had less variability.
Figure 16-Summary of Cleaning Results for dishwashing a normally soiled load of 8
place settings. Manual and Machine dishwashing are scored using the AHAM Cleaning
Index.
Survey Results
The majority of participants (82%) in this study stated that they are from the
Midwest or have lived in the region for more than five consecutive years. None of the
respondents stated that they never use a machine dishwasher at home; the majority (59%)
stated that they both manually and machine wash dishes but mostly use the machine
(Figure 17). When asked what cycle they typically run on their machine dishwashers,
participants responded that they mostly select the normal cycle (Figure 17). (Additional
survey responses are shown in Appendix E).
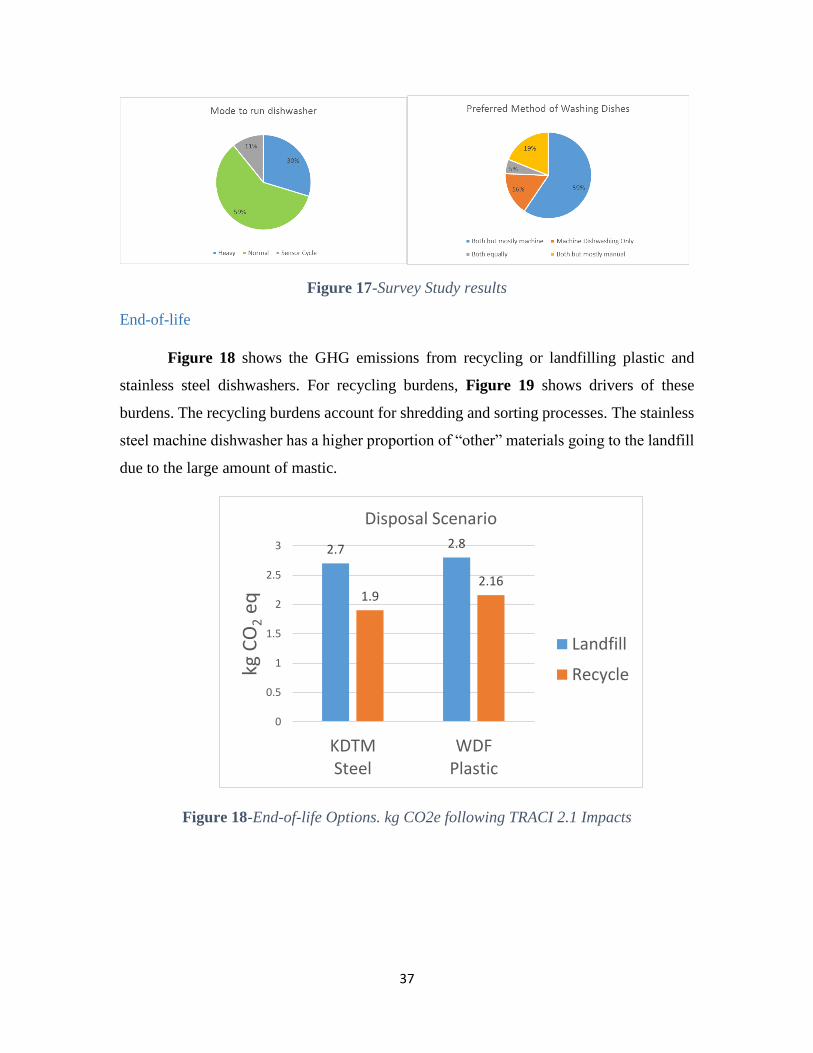
37
Figure 17-Survey Study results
End-of-life
Figure 18 shows the GHG emissions from recycling or landfilling plastic and
stainless steel dishwashers. For recycling burdens, Figure 19 shows drivers of these
burdens. The recycling burdens account for shredding and sorting processes. The stainless
steel machine dishwasher has a higher proportion of “other” materials going to the landfill
due to the large amount of mastic.
Figure 18-End-of-life Options. kg CO2e following TRACI 2.1 Impacts
2.7 2.8
1.92.16
0
0.5
1
1.5
2
2.5
3
KDTMSteel
WDFPlastic
kg C
O2
eq
Disposal Scenario
Landfill
Recycle
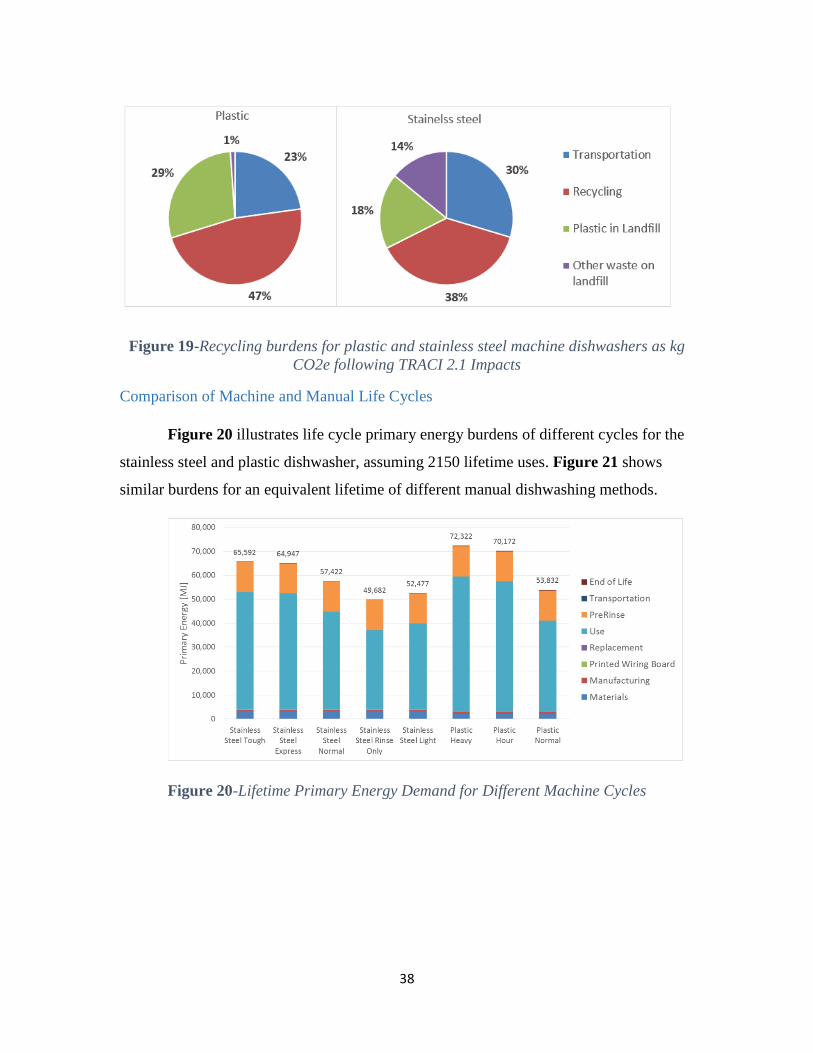
38
Figure 19-Recycling burdens for plastic and stainless steel machine dishwashers as kg
CO2e following TRACI 2.1 Impacts
Comparison of Machine and Manual Life Cycles
Figure 20 illustrates life cycle primary energy burdens of different cycles for the
stainless steel and plastic dishwasher, assuming 2150 lifetime uses. Figure 21 shows
similar burdens for an equivalent lifetime of different manual dishwashing methods.
Figure 20-Lifetime Primary Energy Demand for Different Machine Cycles
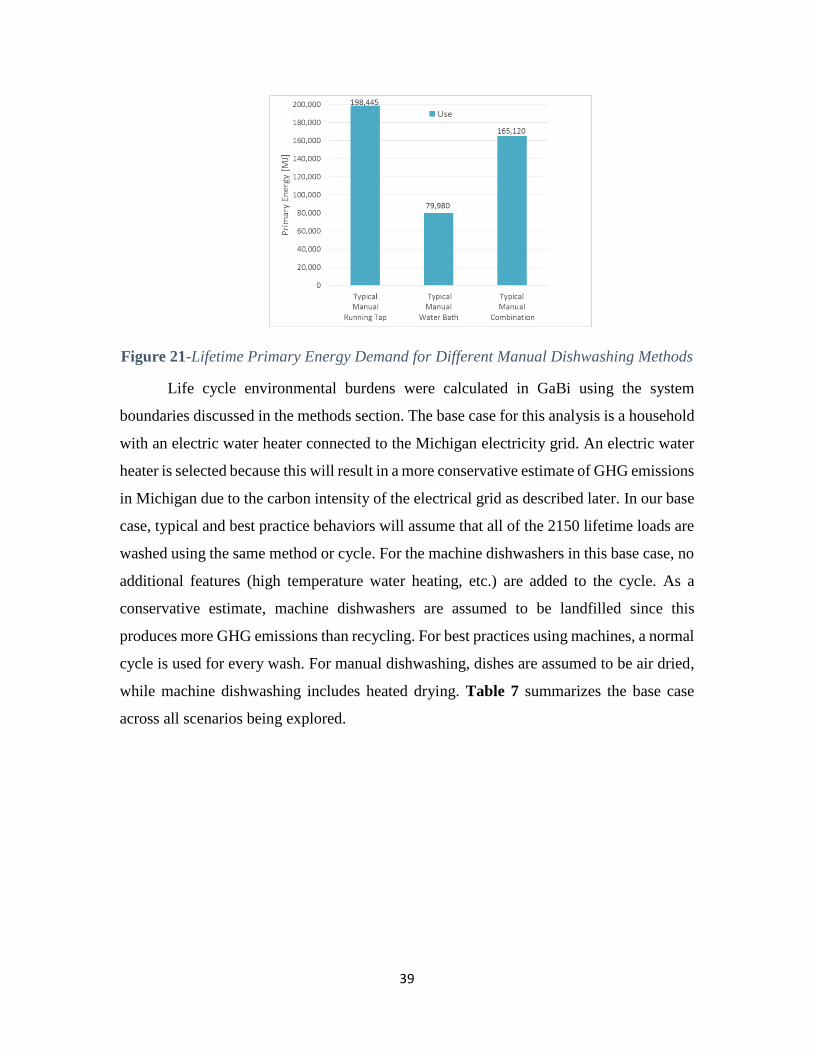
39
Figure 21-Lifetime Primary Energy Demand for Different Manual Dishwashing Methods
Life cycle environmental burdens were calculated in GaBi using the system
boundaries discussed in the methods section. The base case for this analysis is a household
with an electric water heater connected to the Michigan electricity grid. An electric water
heater is selected because this will result in a more conservative estimate of GHG emissions
in Michigan due to the carbon intensity of the electrical grid as described later. In our base
case, typical and best practice behaviors will assume that all of the 2150 lifetime loads are
washed using the same method or cycle. For the machine dishwashers in this base case, no
additional features (high temperature water heating, etc.) are added to the cycle. As a
conservative estimate, machine dishwashers are assumed to be landfilled since this
produces more GHG emissions than recycling. For best practices using machines, a normal
cycle is used for every wash. For manual dishwashing, dishes are assumed to be air dried,
while machine dishwashing includes heated drying. Table 7 summarizes the base case
across all scenarios being explored.
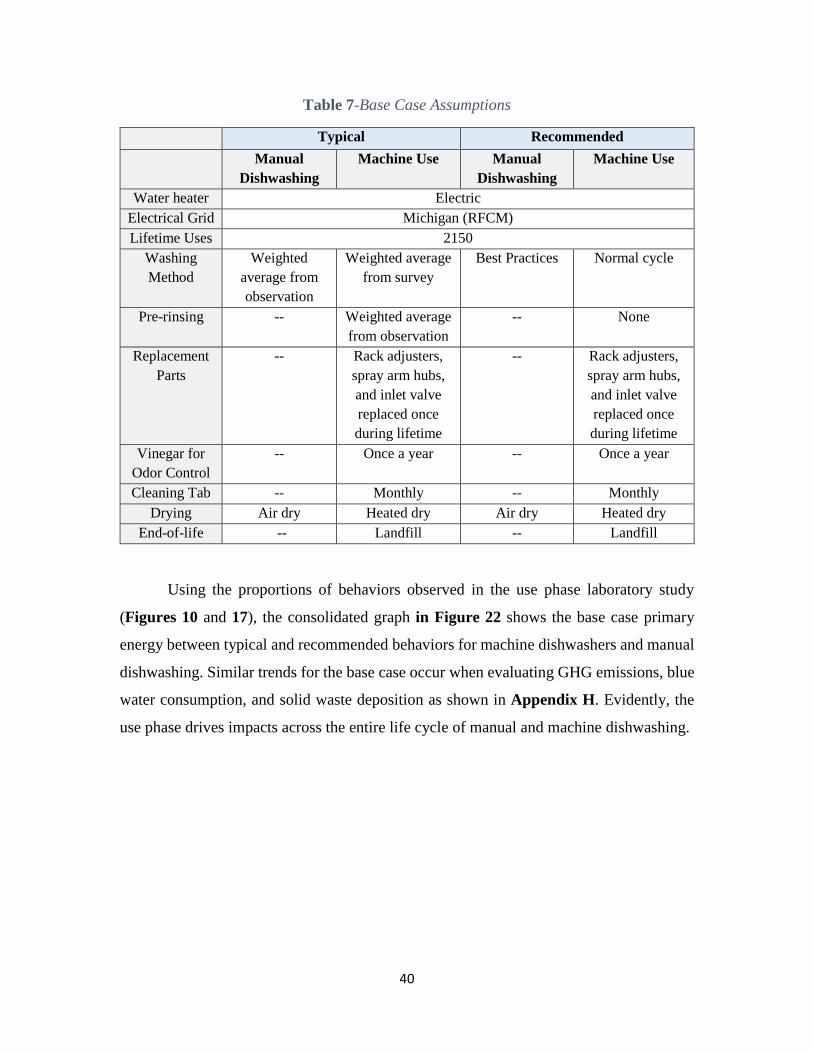
40
Table 7-Base Case Assumptions
Typical Recommended
Manual
Dishwashing
Machine Use Manual
Dishwashing
Machine Use
Water heater Electric
Electrical Grid Michigan (RFCM)
Lifetime Uses 2150
Washing
Method
Weighted
average from
observation
Weighted average
from survey
Best Practices Normal cycle
Pre-rinsing -- Weighted average
from observation
-- None
Replacement
Parts
-- Rack adjusters,
spray arm hubs,
and inlet valve
replaced once
during lifetime
-- Rack adjusters,
spray arm hubs,
and inlet valve
replaced once
during lifetime
Vinegar for
Odor Control
-- Once a year -- Once a year
Cleaning Tab -- Monthly -- Monthly
Drying Air dry Heated dry Air dry Heated dry
End-of-life -- Landfill -- Landfill
Using the proportions of behaviors observed in the use phase laboratory study
(Figures 10 and 17), the consolidated graph in Figure 22 shows the base case primary
energy between typical and recommended behaviors for machine dishwashers and manual
dishwashing. Similar trends for the base case occur when evaluating GHG emissions, blue
water consumption, and solid waste deposition as shown in Appendix H. Evidently, the
use phase drives impacts across the entire life cycle of manual and machine dishwashing.
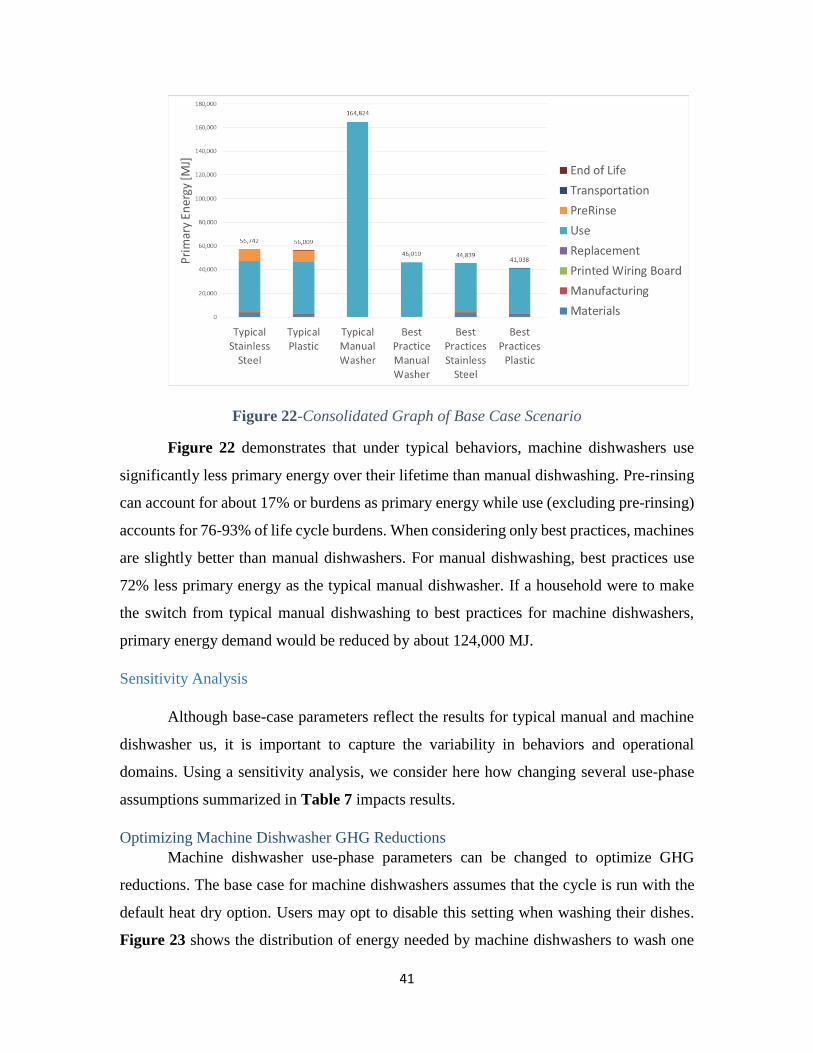
41
Figure 22-Consolidated Graph of Base Case Scenario
Figure 22 demonstrates that under typical behaviors, machine dishwashers use
significantly less primary energy over their lifetime than manual dishwashing. Pre-rinsing
can account for about 17% or burdens as primary energy while use (excluding pre-rinsing)
accounts for 76-93% of life cycle burdens. When considering only best practices, machines
are slightly better than manual dishwashers. For manual dishwashing, best practices use
72% less primary energy as the typical manual dishwasher. If a household were to make
the switch from typical manual dishwashing to best practices for machine dishwashers,
primary energy demand would be reduced by about 124,000 MJ.
Sensitivity Analysis
Although base-case parameters reflect the results for typical manual and machine
dishwasher us, it is important to capture the variability in behaviors and operational
domains. Using a sensitivity analysis, we consider here how changing several use-phase
assumptions summarized in Table 7 impacts results.
Optimizing Machine Dishwasher GHG Reductions
Machine dishwasher use-phase parameters can be changed to optimize GHG
reductions. The base case for machine dishwashers assumes that the cycle is run with the
default heat dry option. Users may opt to disable this setting when washing their dishes.
Figure 23 shows the distribution of energy needed by machine dishwashers to wash one
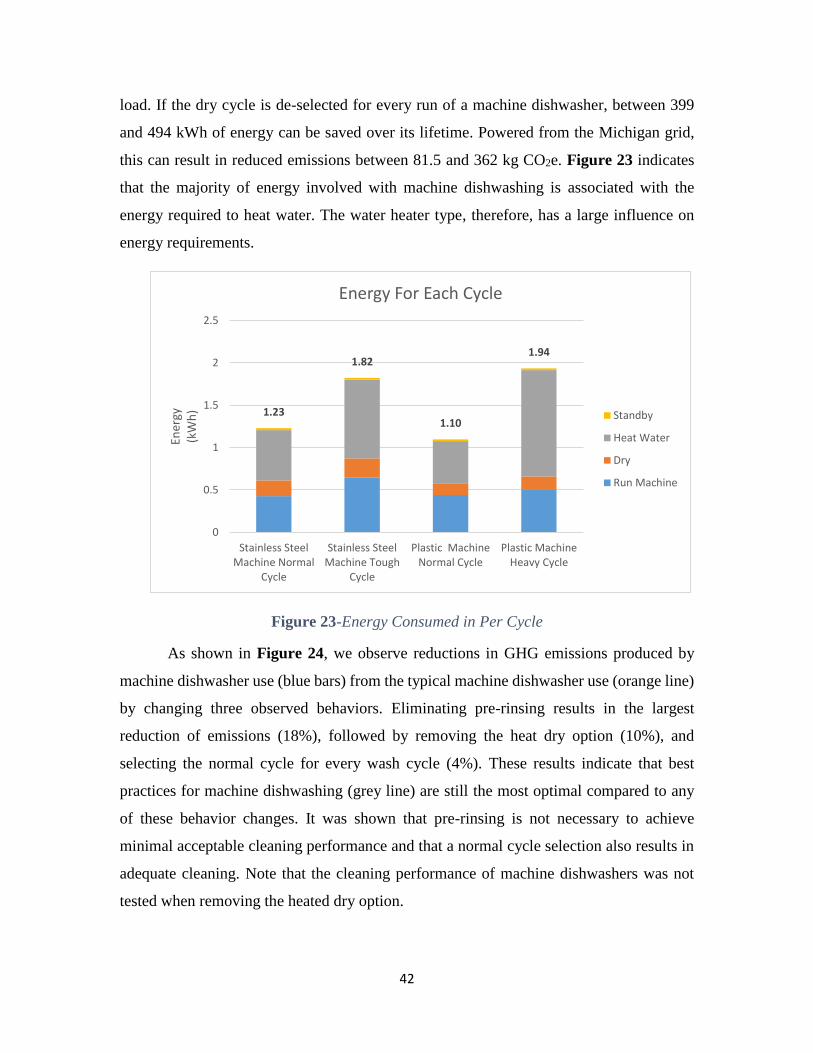
42
load. If the dry cycle is de-selected for every run of a machine dishwasher, between 399
and 494 kWh of energy can be saved over its lifetime. Powered from the Michigan grid,
this can result in reduced emissions between 81.5 and 362 kg CO2e. Figure 23 indicates
that the majority of energy involved with machine dishwashing is associated with the
energy required to heat water. The water heater type, therefore, has a large influence on
energy requirements.
Figure 23-Energy Consumed in Per Cycle
As shown in Figure 24, we observe reductions in GHG emissions produced by
machine dishwasher use (blue bars) from the typical machine dishwasher use (orange line)
by changing three observed behaviors. Eliminating pre-rinsing results in the largest
reduction of emissions (18%), followed by removing the heat dry option (10%), and
selecting the normal cycle for every wash cycle (4%). These results indicate that best
practices for machine dishwashing (grey line) are still the most optimal compared to any
of these behavior changes. It was shown that pre-rinsing is not necessary to achieve
minimal acceptable cleaning performance and that a normal cycle selection also results in
adequate cleaning. Note that the cleaning performance of machine dishwashers was not
tested when removing the heated dry option.
1.23
1.82
1.10
1.94
0
0.5
1
1.5
2
2.5
Stainless SteelMachine Normal
Cycle
Stainless SteelMachine Tough
Cycle
Plastic MachineNormal Cycle
Plastic MachineHeavy Cycle
Ener
gy(k
Wh
)
Energy For Each Cycle
Standby
Heat Water
Dry
Run Machine
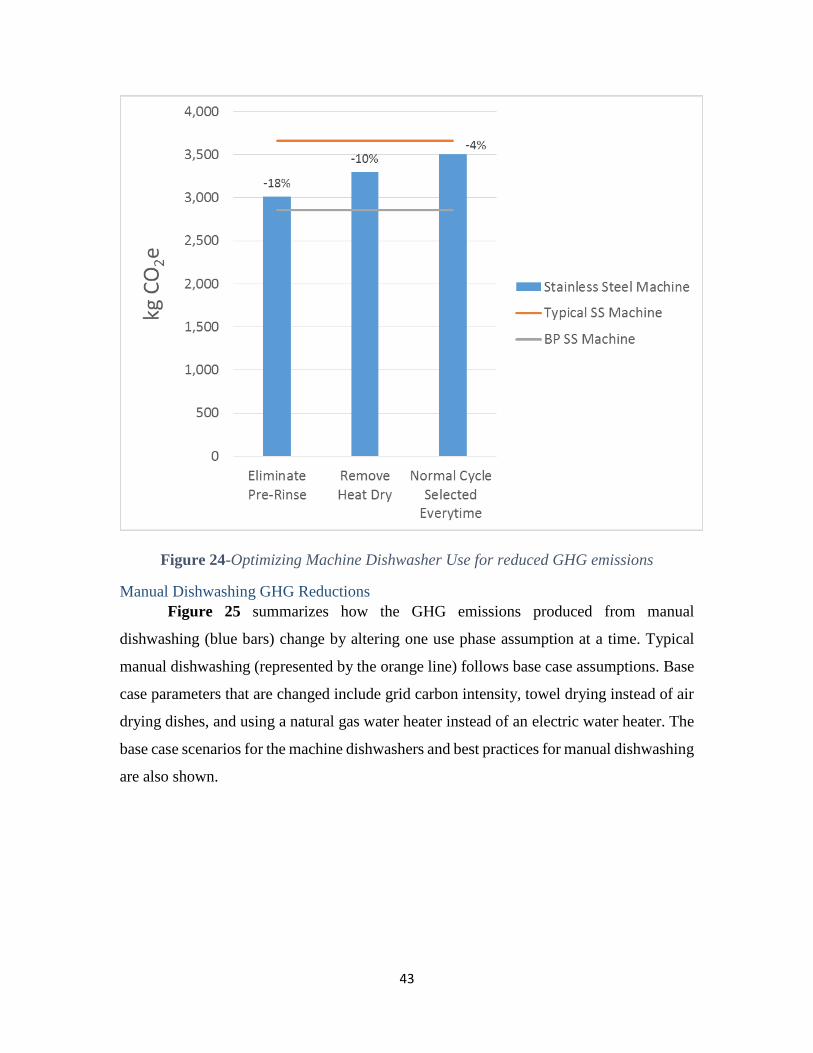
43
Figure 24-Optimizing Machine Dishwasher Use for reduced GHG emissions
Manual Dishwashing GHG Reductions
Figure 25 summarizes how the GHG emissions produced from manual
dishwashing (blue bars) change by altering one use phase assumption at a time. Typical
manual dishwashing (represented by the orange line) follows base case assumptions. Base
case parameters that are changed include grid carbon intensity, towel drying instead of air
drying dishes, and using a natural gas water heater instead of an electric water heater. The
base case scenarios for the machine dishwashers and best practices for manual dishwashing
are also shown.
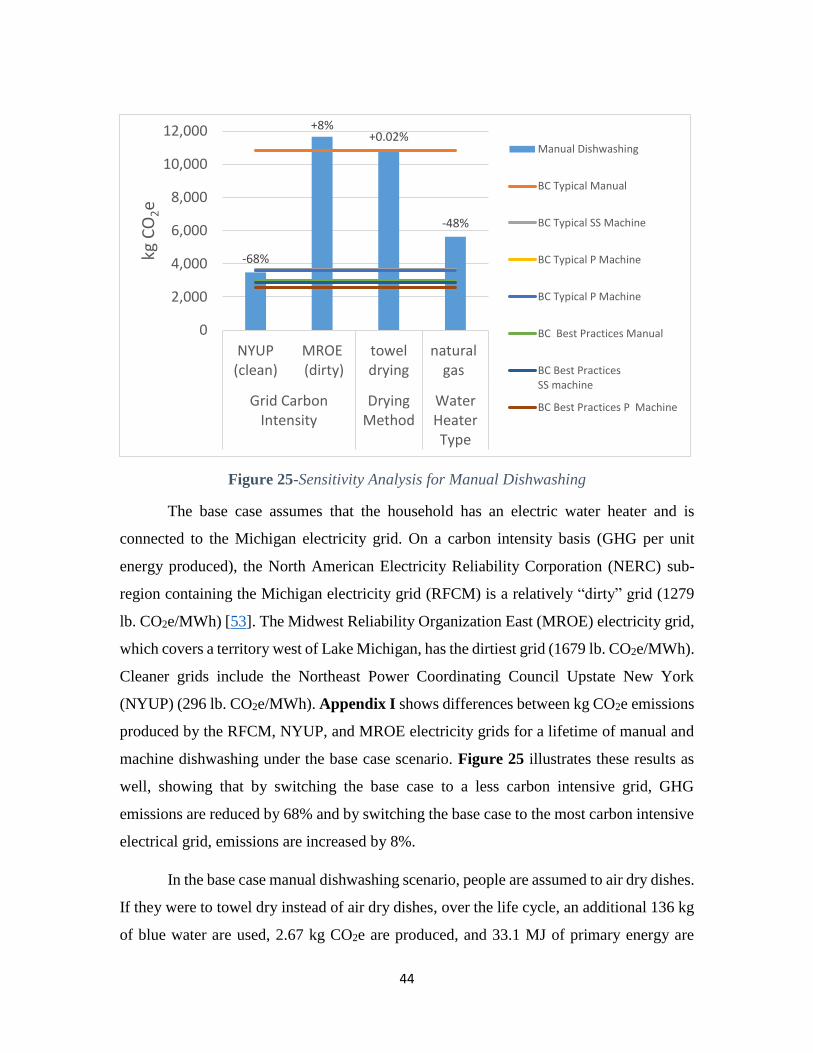
44
Figure 25-Sensitivity Analysis for Manual Dishwashing
The base case assumes that the household has an electric water heater and is
connected to the Michigan electricity grid. On a carbon intensity basis (GHG per unit
energy produced), the North American Electricity Reliability Corporation (NERC) sub-
region containing the Michigan electricity grid (RFCM) is a relatively “dirty” grid (1279
lb. CO2e/MWh) [53]. The Midwest Reliability Organization East (MROE) electricity grid,
which covers a territory west of Lake Michigan, has the dirtiest grid (1679 lb. CO2e/MWh).
Cleaner grids include the Northeast Power Coordinating Council Upstate New York
(NYUP) (296 lb. CO2e/MWh). Appendix I shows differences between kg CO2e emissions
produced by the RFCM, NYUP, and MROE electricity grids for a lifetime of manual and
machine dishwashing under the base case scenario. Figure 25 illustrates these results as
well, showing that by switching the base case to a less carbon intensive grid, GHG
emissions are reduced by 68% and by switching the base case to the most carbon intensive
electrical grid, emissions are increased by 8%.
In the base case manual dishwashing scenario, people are assumed to air dry dishes.
If they were to towel dry instead of air dry dishes, over the life cycle, an additional 136 kg
of blue water are used, 2.67 kg CO2e are produced, and 33.1 MJ of primary energy are
-68%
+8%+0.02%
-48%
0
2,000
4,000
6,000
8,000
10,000
12,000
NYUP(clean)
MROE (dirty)
toweldrying
naturalgas
Grid CarbonIntensity
DryingMethod
WaterHeaterType
kg C
O2e
Manual Dishwashing
BC Typical Manual
BC Typical SS Machine
BC Typical P Machine
BC Typical P Machine
BC Best Practices Manual
BC Best PracticesSS machine
BC Best Practices P Machine
45
needed. Figure 25 demonstrates that there is only 0.02% increase in GHG emissions from
the base case if towel drying is used.
The majority of US households have a natural gas water heater [54]. By changing
the base case water heater from electric to natural gas, the typical manual washer in
Michigan can reduce lifetime GHG emissions by 48%. Appendix J shows that when a
natural gas water heater is used, machine dishwashers produce less GHG emissions than
manual dishwashing in most cases. However, when considering best practices as seen in
Appendix J, the machines produce slightly more GHG emissions than manual
dishwashing. While both methods of dishwashing have lower GHG emissions for water
heating when natural gas is used, machines still require electricity from the Michigan
electrical grid.
LIMITATIONS
We assume that machine dishwashers are run while fully loaded, consistent with
the Uniform Test Method from the eCFR. However, it is important to acknowledge that
users do not always wash a full load of dishes. Future work should consider the relative
impacts of dishwashing for partial loads. A dishwasher that is run half loaded will have
twice the environmental burdens per functional unit as one that is always run fully loaded
(basis for this study).
We also assume constant efficiencies in our analysis. Like any appliance, machine
dishwashers will have reduced electrical and water use efficiency over their lifetime [55].
Efficiency degradation of these machines over their lifetime is assumed to be negligible in
our analysis. Several studies, including life cycle optimization for similar household
appliances, assume constant performance efficiencies over their useful life [56-58].
Similarly, the efficiency of household water heaters is assumed to be constant over the
period analyzed in our study. Both system models for machine use and manual dishwashing
both include water heating. Even if degrading water heater efficiencies are considered, the
relative difference in environmental burdens that come from heating water in the use phase
between machines and manual dishwashing will remain the same. In cases where there is
46
hard water, water heater efficiency will be significantly reduced, and the machine
dishwasher lifespan will be reduced [59].
Loading patterns and pretreatment behaviors can impact cleaning performance but this
is not evaluated in this analysis. Machine dishwashers are normally tested without
considering pretreatment. If pre-rinsing is done, it remains unclear whether the OWI used
in the sensor cycles will be able to detect any turbidity. No conclusions can be made about
whether or not pre-rinsing actually has the intended effect on cleaning performance that
users believe it does. Without pre-rinsing, dishes were already able to reach acceptable
cleaning scores as shown in this study. Future work can evaluate this might impact
operating energy and water inputs and how much cleaner (AHAM Cleaning Index) dishes
get per unit of water used to pre-rinse.
The participants in this survey were Whirlpool employees and were considered to
exhibit behaviors characteristic to Michigan. Most were males over the age of 35 living in
households with four people. This study can be expanded beyond Michigan and to other
demographics for observing whether dishwashing behaviors are regionally dependent or
vary by across different groups. Further, adoption of best practices can have a larger benefit
in water-stressed regions with electrical grids fueled mostly by non-renewables.
We used GaBi databases for modelling materials and processes needed for machine
dishwasher manufacturing and production. These have default industry estimates for
transportation of materials, resources use, and other data. However, an in-depth study of
the actual machine dishwasher value chain could be conducted. In the actual value chain,
sustainability can also be assessed from a social lens.
CONCLUSION
This study is a comprehensive life cycle assessment of machine dishwashers and
manual dishwashing under various scenarios. Although machine dishwashers are not being
used optimally, typical machine use produces fewer GHG emissions than typical manual
dishwashing. The following major conclusions result from this assessment.
47
Key Findings
Of the typical manual dishwashing behaviors observed in the study, it is found that
the water bath has the least lifetime primary energy demand (80,000 MJ), while the running
tap method uses approximately 60% less primary energy (198,000 MJ). The most prevalent
typical manual dishwashing behaviors (running tap and combination) are also those with
the most burdens. Further, participants stated behavioral barriers exist to adoption of best
practices for manual dishwashing.
The majority of the energy used in machine dishwashing is attributed to heating
water. Although a natural gas water heater is preferable in a region with a highly carbon-
intense electrical grid (like Michigan), this may not be true for all electrical grids. For
example, in a grid that has a high penetration of renewables, it would not be preferable to
use a natural gas instead of an electrical water heater.
Here, we discuss the similarities and differences with previous studies that machine
dishwashers consume less energy and water than manual dishwashing. Our analysis
provides more clarity about what drives energy use in machines and what scenarios result
in the least environmental burdens. Finally, we conclude that the scenario that would result
in the least GHG emissions is the machine dishwasher following recommended use (no
pre-rinsing, normal cycle selection, heat dry option selected).
A major opportunity for reducing GHG emissions from dishwashing in the
American residential sector exists in households that already own but do not use their
machine dishwasher, about 16 million households [3]. If typical manual dishwashing was
substituted by the recommended use of a steel machine dishwasher, approximately 89.2
metric tons CO2e and 7.07 X 10¹¹ kg (1.82 X 10¹¹ gal) blue water could be reduced over an
10 year period (2150 uses). Even more savings are possible if the 24 million households
that do not own a dishwasher were able to switch from typical manual to recommended
machine dishwashing.
Future Work
Process-level modeling approaches underestimate facility-level burdens. Sub-
metering within the Findlay manufacturing plant is recommended to determine the actual
amount of resources (electricity, water, natural gas) used for each manufacturing process.
48
Subsequent values can be compared against GaBi databases to verify whether or not they
adequately model the factory’s actual operations. This may improve the accuracy and
completeness of Scope 2 reporting.
Survey responses indicated that there are items that users are unwilling to load into the
machine dishwasher (Appendix E). This may be because these items have soils that are
more difficult to remove or they take up too much space in the machine. It remains unclear
if these items are responsible for a higher fraction of manual dishwashing burdens.
Experiments excluding the more heavily soiled items such as the baked spaghetti dish
might result in less burdens from manual dishwashing.
ANSI/AHAM standards grade cleaning ability of machine dishwashers based on how
many spots and stains are left on dishes. Since machine dishwashers can reach higher
temperatures than manual dishwashing methods, they could potentially have a higher
ability to sanitize dishes. If cleaning ability was measured using microbial counts, manual
dishwashing methods might not achieve acceptable cleaning performance.
The LCA can be further refined by addressing limitations highlighted above.
However, we expect our conclusion that machine dishwashing (following recommended
procedures) will outperform manual dishwashing is robust.
49
REFERENCES
1. U.S. Energy Information Administration. Heating and cooling no longer majority of U.S home energy use. Residential Energy Consumption Survey (RECS). March 7, 2013:Available from: https://www.eia.gov/todayinenergy/detail.php?id=10271&src=%E2%80%B9%20Consumption%20%20%20%20%20%20Residential%20Energy%20Consumption%20Survey%20(RECS)-b1.
2. U.S Government. Energy Guide Dishwasher: KitchenAid by Whirlpool Corporation. Energy Star.
3. U.S. Energy Information Administration. Dishwashers are among the least-used appliances in American Homes. 2017; Available from: https://www.eia.gov/todayinenergy/detail.php?id=31692.
4. Stamminger, R., R. Badura, G. Broil, S. Dörr, and A. Elschenbroisch, A European Comparison of cleaning dishes by hand. University of Bonn, 2004.
5. Berkholz, P., V. Kobersky, and R. Stamminger, Comparative analysis of global consumer behaviour in the context of different manual dishwashing methods. International Journal of Consumer Studies, 2013. 37(1): p. 46-58.
6. Stamminger, R., A. Elschenbroich, B. Rummler, and G. Broil, Washing-up behaviour and techniques in Europe. Hauswirtschaft und Wissenschaft, 2007. 1(2007): p. 31-37.
7. U.S. Environmental Protection Agency. ENERGY STAR® Unit Shipment and Market Penetration Report Calendar Year 2015 Summary. Available from: https://www.energystar.gov/ia/partners/downloads/unit_shipment_data/2015_USD_Summary_Report.pdf?c86f-4bbd.
8. Energy Star. Recognition Criteria Dishwashers. Most Efficient 2017.
9. Chini, C.M., K.L. Schreiber, Z.A. Barker, and A.S. Stillwell, Quantifying energy and water savings in the US residential sector. Environmental science & technology, 2016. 50(17): p. 9003-9012.
10. Richter, C.P. and R. Stamminger, Water consumption in the kitchen–a case study in four European countries. Water resources management, 2012. 26(6): p. 1639-1649.
11. Daphne Lofquist, T.L., Martin O'Connell, and Sarah Feliz. Households and Families: 2010. Available from: https://www.census.gov/prod/cen2010/briefs/c2010br-14.pdf.
12. Electronic Code of Federal Regulations. Title 10 Chapter II, Subchapter D Part 430-Energy Conservation Program for Consumer Products; Available from: https://www.ecfr.gov/cgi-bin/text-
50
idx?SID=607d97ca0a3c53759d9194b15bd28580&mc=true&node=pt10.3.430&rgn=div5.
13. Fuss, N.A., Determination and verification of possible resource savings in manual dishwashing. PhD dissertation. University of Bonn. 2011.
14. Lanningham‐Foster, L., L.J. Nysse, and J.A. Levine, Labor saved, calories lost: the energetic impact of domestic labor‐saving devices. Obesity Research, 2003. 11(10): p. 1178-1181.
15. Berkholz, P., R. Stamminger, G. Wnuk, J. Owens, and S. Bernarde, Manual dishwashing habits: an empirical analysis of UK consumers. International Journal of Consumer Studies, 2010. 34(2): p. 235-242.
16. Richter, C.P., Automatic dishwashers: efficient machines or less efficient consumer habits? International Journal of Consumer Studies, 2010. 34(2): p. 228-234.
17. DuPont, 2012 US Consumer Dishwashing Study. 2013.
18. Stamminger, R. and C. Streichardt, Selected aspects of consumer behaviour in the manual and mechanical dishwashing in Germany. SÖFW Journal, 2009. 135(11): p. 50.
19. Gilleßen, C., P. Berkholz, and R. Stamminger, Manual dishwashing process–a pre‐assigned behaviour? International Journal of Consumer Studies, 2013. 37(3): p. 286-290.
20. Stamminger, R., Residues in Dishwashing. Section Household and Appliance Technology, 2003.
21. Cardinale, M., D. Kaiser, T. Lueders, S. Schnell, and M. Egert, Microbiome analysis and confocal microscopy of used kitchen sponges reveal massive colonization by Acinetobacter, Moraxella and Chryseobacterium species. Scientific reports, 2017. 7(1): p. 5791.
22. Hesselmar, B., A. Hicke-Roberts, and G. Wennergren, Allergy in children in hand versus machine dishwashing. Pediatrics, 2015: p. peds. 2014-2968.
23. Miller, D. Dishwasher Manufacturing in the US. IBISWorld Industry Report. IBISWorld. Available from: https://clients1.ibisworld.com/reports/us/industry/ataglance.aspx?entid=4254.
24. Flowers, J. Dishwasher Decibel Ratings: How to Find the Quietest Dishwasher. 2015; (Accessed on: March 20, 2019.) Available from: https://learn.compactappliance.com/dishwasher-decibel-ratings/.
25. Doolin, P. Dishwasher Buying Guide. 2016; (Accessed on: March 20, 2019.) Available from: https://www.angieslist.com/articles/dishwasher-buying-guide.htm.
51
26. Moor, T. How Much Does a Dishwasher Cost? 2016; (Accessed on: March 26, 2019.) Available from: https://www.angieslist.com/articles/how-much-does-dishwasher-cost.htm.
27. GE, Turbidity and Temperature, in Sensing & Inspection Technologies. 2009. Available from: http://www.mouser.com/catalog/specsheets/920-480A_E_LR.pdf
28. Thilo Kupfer, M.B., Cecilia Makishi Colodel, Morten Kokborg. GaBi Database & Modelling Principles. 2017; Available from: http://www.gabi-software.com/america/overview/what-is-gabi-software/.
29. Bare, J. Tool for the Reduction and Assessment of Chemical and Other Environmental Impacts (TRACI) version 2.1 User’s Guide. U.S. Envirionmental Protection Agency.
30. Arjen Y. Hoekstra, A.K.C., Maite M. Aldaya, and Mesfin M. Mekonnen. The Water Footprint Assessment Manual: Setting the Global STandard. 2011; Available from: https://waterfootprint.org/en/water-footprint/what-is-water-footprint/.
31. Janeway, K. How to Make Your Dishwasher Last Longer. Consumer Reports 2019; (Accessed on: March 26, 2019.) Available from: https://www.consumerreports.org/dishwashers/how-to-make-your-dishwasher-last-longer/.
32. Bailen, C. How long should my appliances last? Reviewed: Part of the USA Today Network 2018; (Accessed on: March 26, 2019.) Available from: https://www.reviewed.com/dishwashers/features/how-long-should-my-appliances-last.
33. Goldwind. Wind Energy Powers Whirlpool Corporation & Ball Corporation Findlay, Ohio Plant. (Accessed on: April 3, 2019.) Available from: https://www.goldwindamericas.com/wind-energy-powers-whirlpool-corporation-ball-corporation-findlay-ohio-plant.
34. Green Globes, Green Globes Water Consumption Calculator v. 1.3. 2019. (Accessed on: March 30, 2019).
35. Service Cost and Usage 2017.; Whirlpool-Findlay. Datasheet provided byWhirlpool Corporation. (Accessed on: July 18, 2017).
36. Production Volume 2017. Datasheet provided by Whirlpool Corporation. (Accessed on: July 18, 2017).
37. Energy Star. Dishwashers. Best Practices. Certified Products; (Accessed on: April 3, 2019). Available from: https://www.energystar.gov/products/appliances/dishwashers.
38. KitchenAid, Use and Care Guide. 2016.
52
39. Zeljko. Water Heating Basics and Facts For Easier Water Heater Selection. Hot Water Heaters Reviews Water Heating Guide 2017; (Accessed on: April 4, 2019). Available from: https://www.hot-water-heaters-reviews.com/water-heating-basics.html.
40. U.S Government. Energy Guide Clothes Washer: Whirlpool Corporation Model WTW7500G*. ENERGY STAR. (Accessed on: March 26, 2019).
41. How Much Water Does A Washing Machine Use. 2019; (Accessed on: March 26, 2019). Available from: https://www.whirlpool.com/blog/washers-and-dryers/he-washing-machine-water-usage.html.
42. Energy Star. Clothes Dryers. Certified Products; (Accessed on: March 26, 2019). Available from: https://www.energystar.gov/products/appliances/clothes_dryers.
43. Energy Star, ENERGY STAR Market & Industry Scoping Report. Residential Clothes Dryers, 2011.
44. Great Lakes Recycling (GLR). Interview by Gabriela Porras. Phone interview. June 15, 2019.
45. Haggerty Metals. Interview by Gabriela Porras. Phone interview. June 15, 2019.
46. SSI Shredding Systems. PRI_MAX PR790 Primary Reducer. 2019; Available from: https://www.ssiworld.com/en/products/pri_max_primary_reducers/pri-max_pr780.
47. Goudsmit Magnetic Systems, Eddy Current Separators.
48. Goudsmit Magnetic Systems, EddyFines - Eddy current separator - Head pulley separator - Conveyor belt feeder - 1500 mm. (Accessed on: March 27, 2019).
49. Eddy current separator - non-ferrous metal, plastic and iron separation. 2012; (Accessed on: March 27, 2019). Available from: https://www.youtube.com/watch?v=_38kiL3cR6w.
50. U.S. Environmental Protection Agency. Hazardous Waste Management Sytem: Land Disposal Restrictions. Available from: https://www.epa.gov/sites/production/files/2016-03/documents/51fr44714.pdf.
51. Waste Management. Transfer stations. 2017; (Accessed on: April 1, 2019). Available from: http://www.wm.com/location/colorado/co/residential/transfer-stations.jsp.
52. Finkbeiner, M., A. Inaba, R. Tan, K. Christiansen, and H.-J. Klüppel, The new international standards for life cycle assessment: ISO 14040 and ISO 14044. The international journal of life cycle assessment, 2006. 11(2): p. 80-85.
53
53. U.S. Environmental Protection Agency. eGRID 2016 Unit, Generator, Plant, State, Balancing Authority Area, eGRID Subregion, NERC Region, U.S., and Grid Gross Loss (%) Data Files. eGRID subregion. (Accessed on: March 27, 2019).
54. Berry, C. Residential Energy Consumption Survey;. U.S. Energy Information AdministrationAvailable from: https://www.eia.gov/consumption/residential/data/2009/#water.
55. Tom Devoldere, B.W., Joost R. Duflou, Wim Dewulf, The Eco-Efficiency of Reuse Centres Critically Explored - The Washing Machine Case. International Journal of Sustainable Manufacturing (IJSM), 2009. 1(3).
56. Bole, R., Life-Cycle Optimization of Residential Clothes Washer Replacement, in Center for Sustainable Systems. 2006, University of Michigan. p. 46.
57. A. Boustani, S.S., S.C. Graves, and T. G. Gutowski, Appliance Remanufacturing and Life Cycle Energy and Economic Savings, in Proceedings of the 2010 IEEE Internation Symposium on Sustainable Systems and Technology. 2010, IEEE: Arlington, VA, USA.
58. A M Chalkley*, E.B., D Harrison and G Simpson, Development of a method for calculating the environmentally optimum lifespan of electrical household products. 2003.
59. Foundation, W.Q.R. Softened Water Benefits Study: Energy Savings, Detergent Savings.
60. Piper Plastics Corp. See the Fluidized Bed Powder Coating Process. 2017; Available from: https://www.youtube.com/watch?v=zU9J30OKp3E.
61. Products Finishing, Understanding Fluidized Bed Powder Coating. 2004. (Accessed on: April 25, 2019).
62. Philips Lighting, InfraRed Industrial Heat Incandescent. 2018. (Accessed on: March 26, 2019).
63. Administration, U.S.E.I. COMMERCIAL BUILDINGS ENERGY CONSUMPTION SURVEY (CBECS). 2016; Available from: https://www.eia.gov/consumption/commercial/data/2012/c&e/cfm/c30.php.
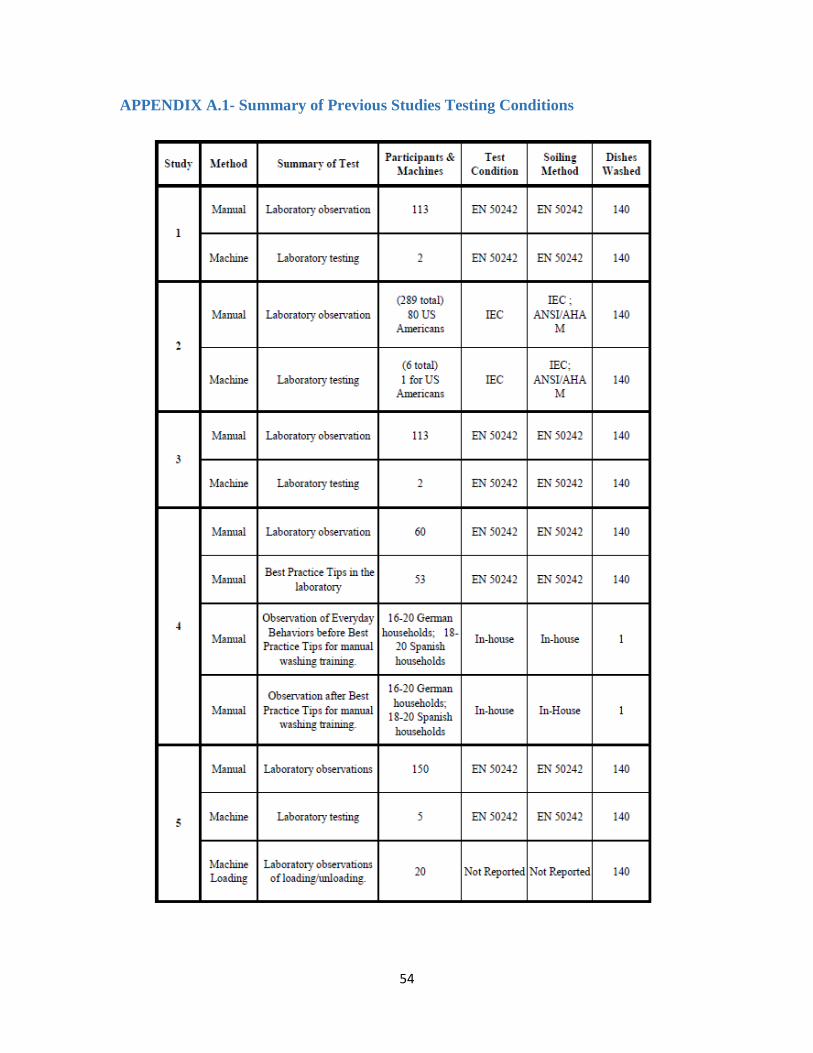
54
APPENDIX A.1- Summary of Previous Studies Testing Conditions
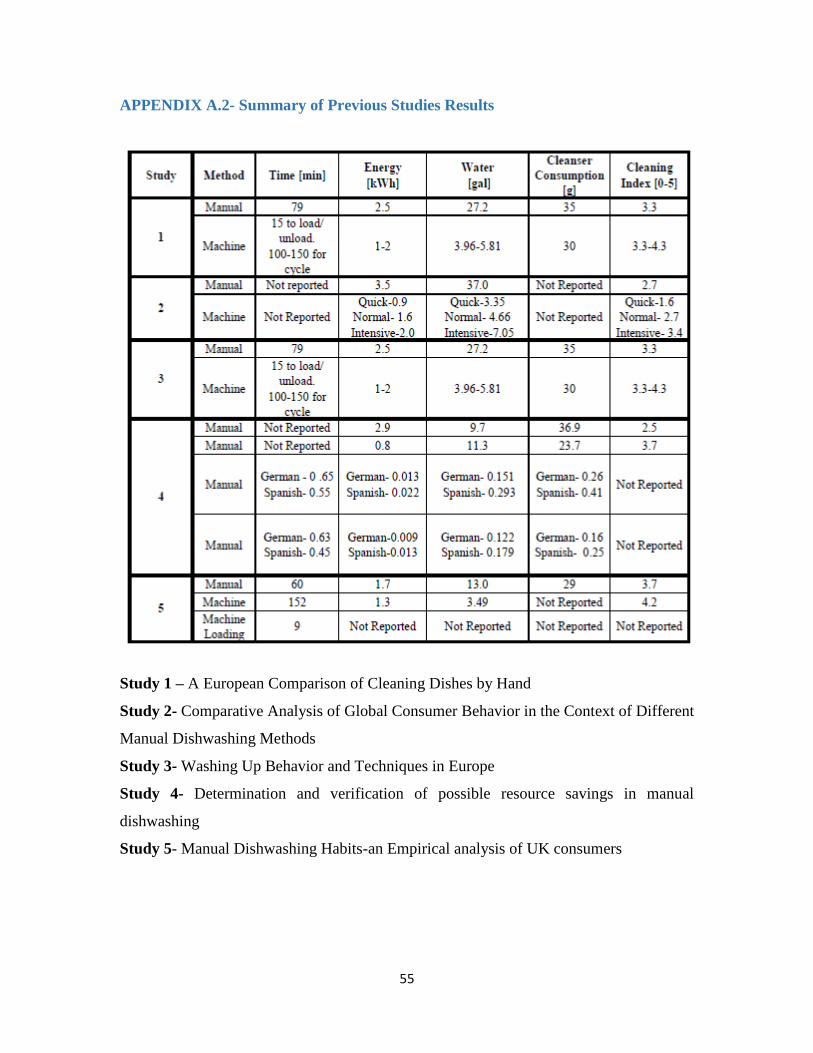
55
APPENDIX A.2- Summary of Previous Studies Results
Study 1 – A European Comparison of Cleaning Dishes by Hand
Study 2- Comparative Analysis of Global Consumer Behavior in the Context of Different
Manual Dishwashing Methods
Study 3- Washing Up Behavior and Techniques in Europe
Study 4- Determination and verification of possible resource savings in manual
dishwashing
Study 5- Manual Dishwashing Habits-an Empirical analysis of UK consumers
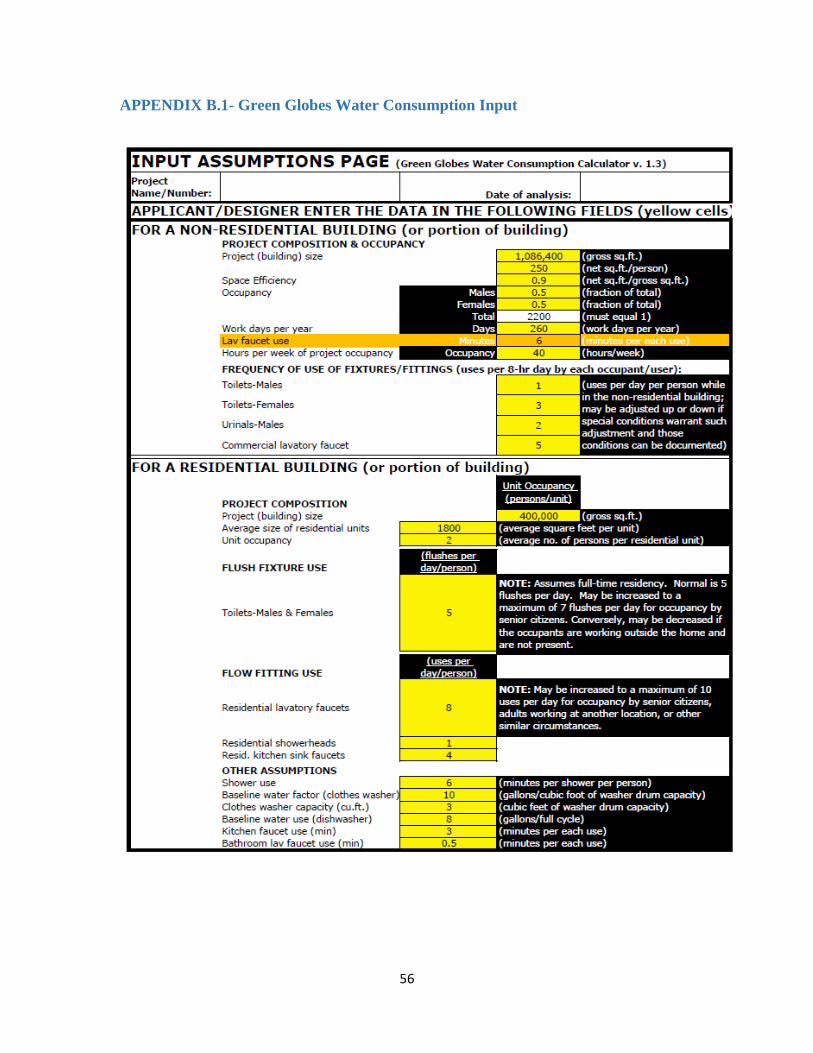
56
APPENDIX B.1- Green Globes Water Consumption Input
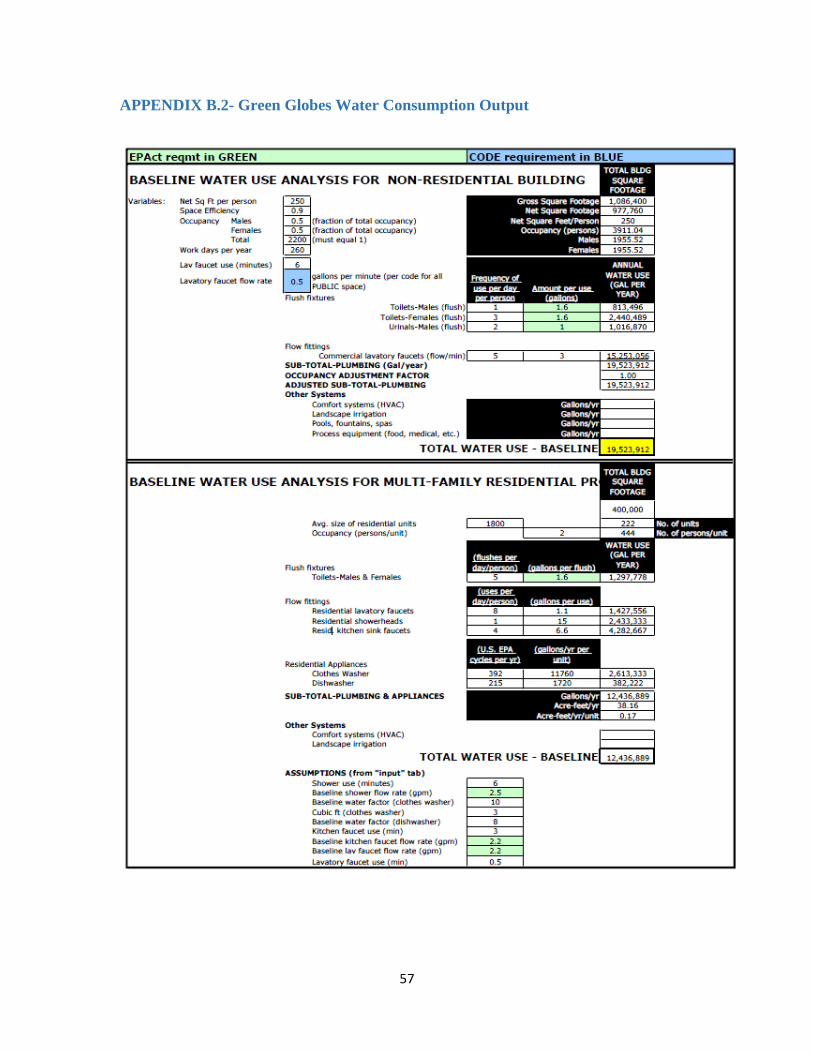
57
APPENDIX B.2- Green Globes Water Consumption Output
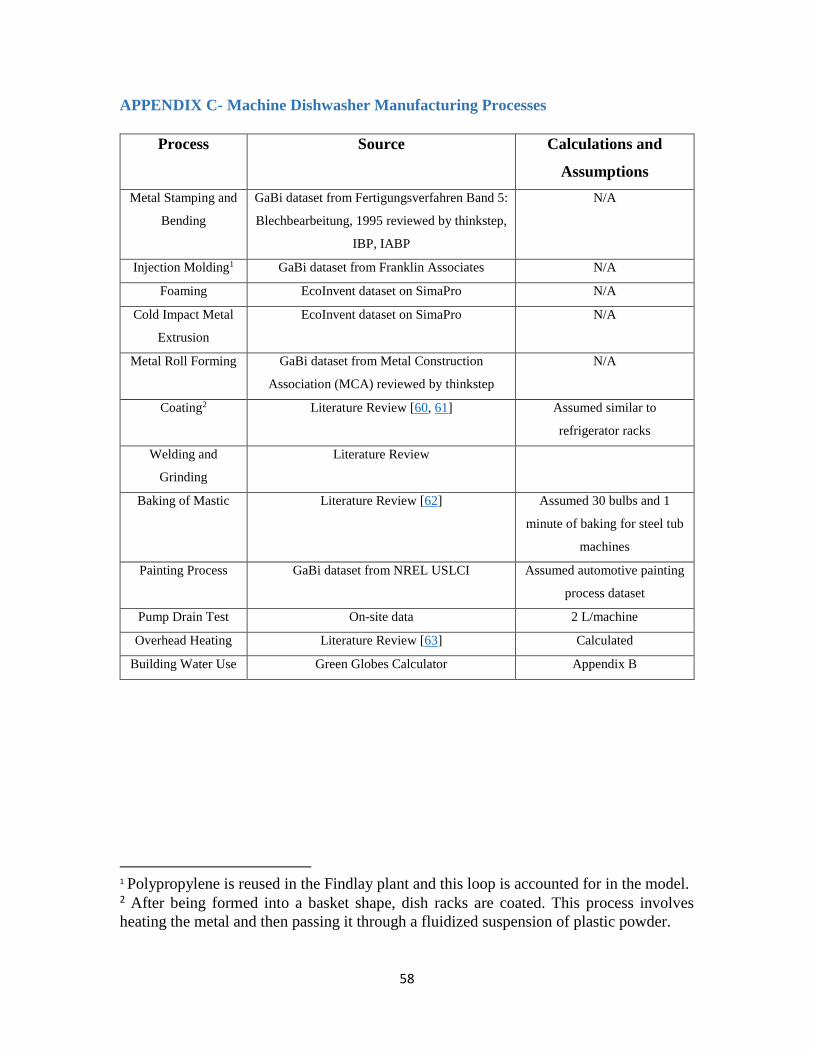
58
APPENDIX C- Machine Dishwasher Manufacturing Processes
Process Source Calculations and
Assumptions
Metal Stamping and
Bending
GaBi dataset from Fertigungsverfahren Band 5:
Blechbearbeitung, 1995 reviewed by thinkstep,
IBP, IABP
N/A
Injection Molding1 GaBi dataset from Franklin Associates N/A
Foaming EcoInvent dataset on SimaPro N/A
Cold Impact Metal
Extrusion
EcoInvent dataset on SimaPro N/A
Metal Roll Forming GaBi dataset from Metal Construction
Association (MCA) reviewed by thinkstep
N/A
Coating2 Literature Review [60, 61] Assumed similar to
refrigerator racks
Welding and
Grinding
Literature Review
Baking of Mastic Literature Review [62] Assumed 30 bulbs and 1
minute of baking for steel tub
machines
Painting Process GaBi dataset from NREL USLCI Assumed automotive painting
process dataset
Pump Drain Test On-site data 2 L/machine
Overhead Heating Literature Review [63] Calculated
Building Water Use Green Globes Calculator Appendix B
1 Polypropylene is reused in the Findlay plant and this loop is accounted for in the model. 2 After being formed into a basket shape, dish racks are coated. This process involves
heating the metal and then passing it through a fluidized suspension of plastic powder.
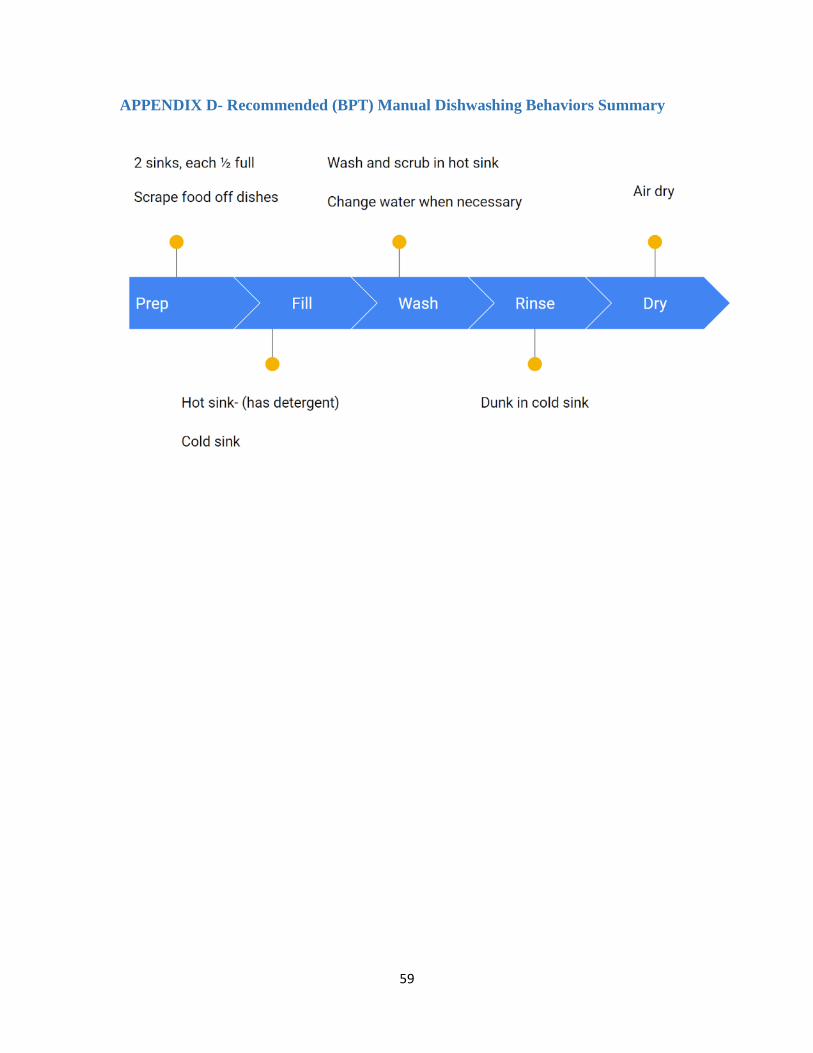
59
APPENDIX D- Recommended (BPT) Manual Dishwashing Behaviors Summary
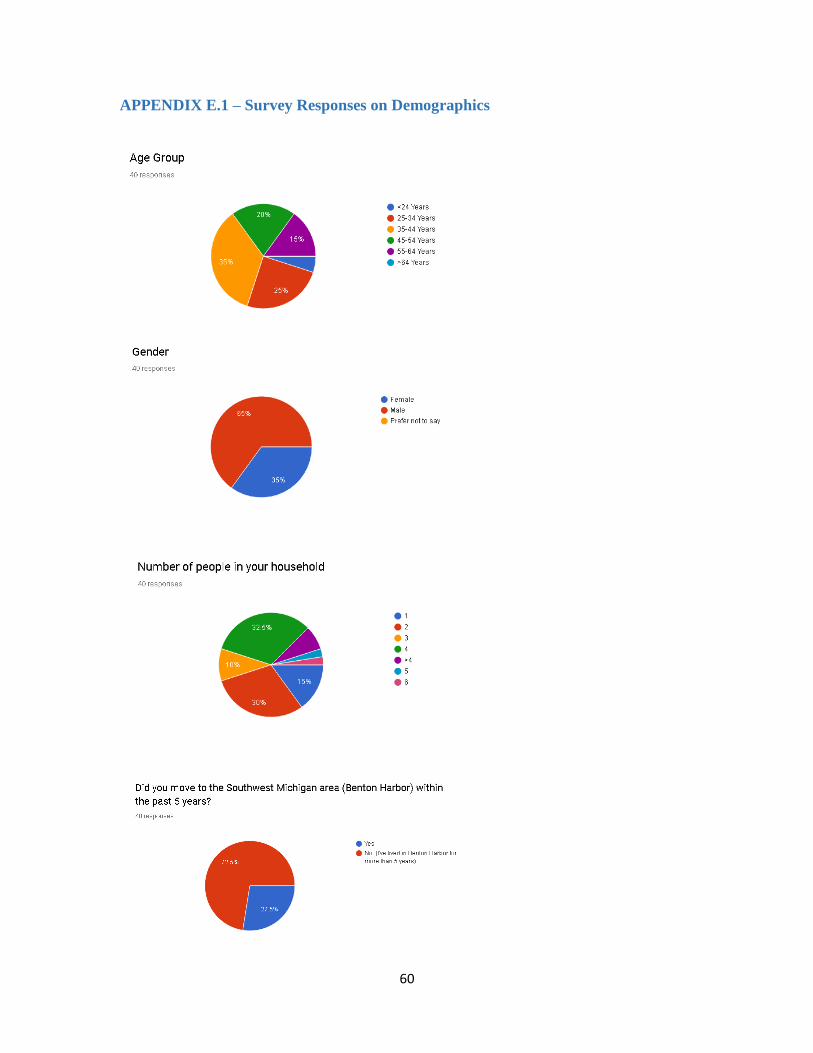
60
APPENDIX E.1 – Survey Responses on Demographics
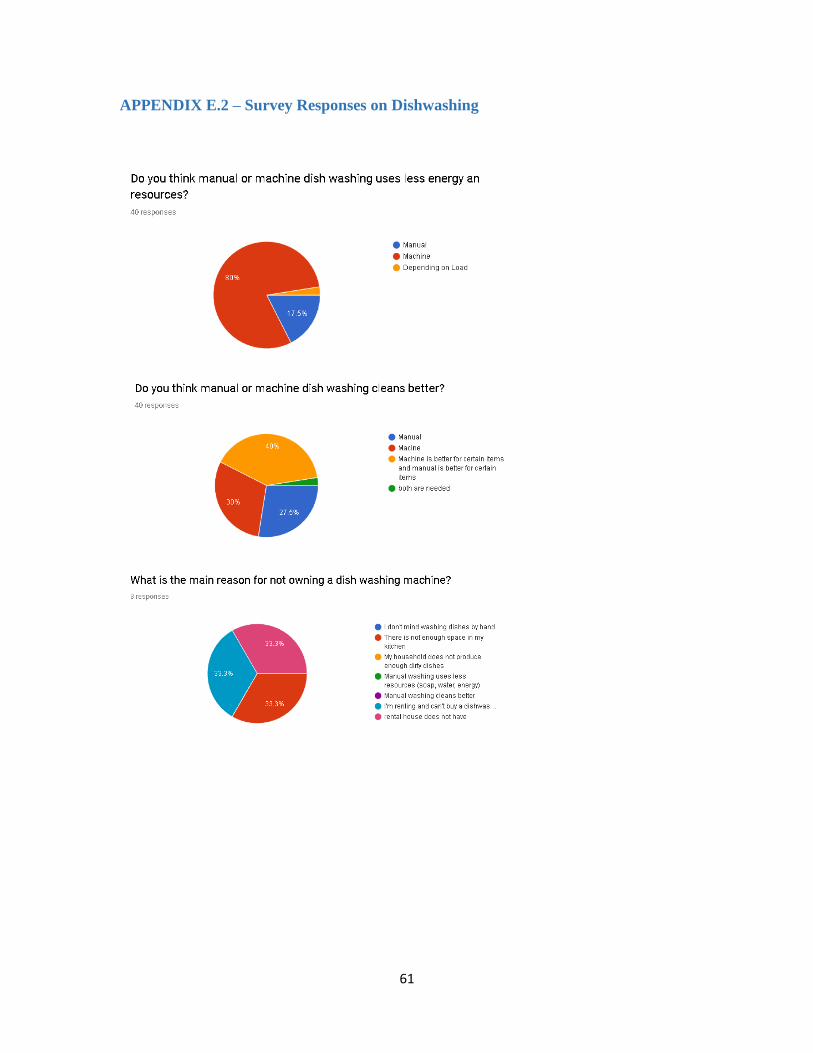
61
APPENDIX E.2 – Survey Responses on Dishwashing
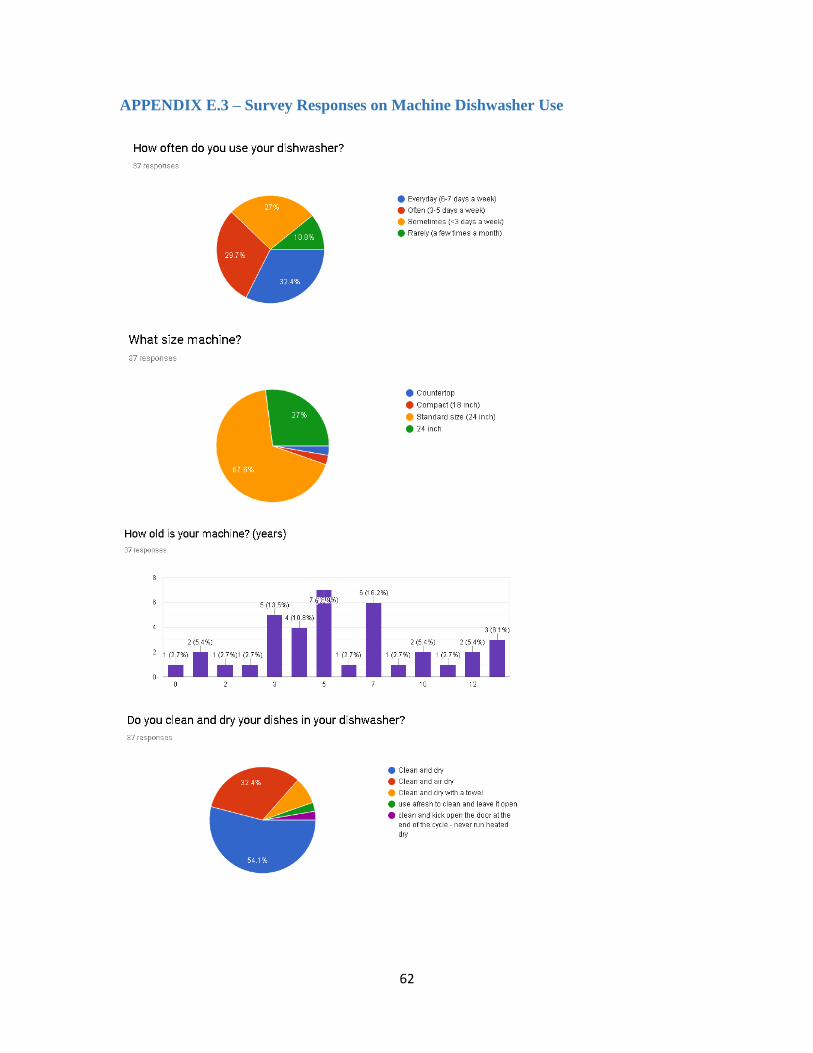
62
APPENDIX E.3 – Survey Responses on Machine Dishwasher Use
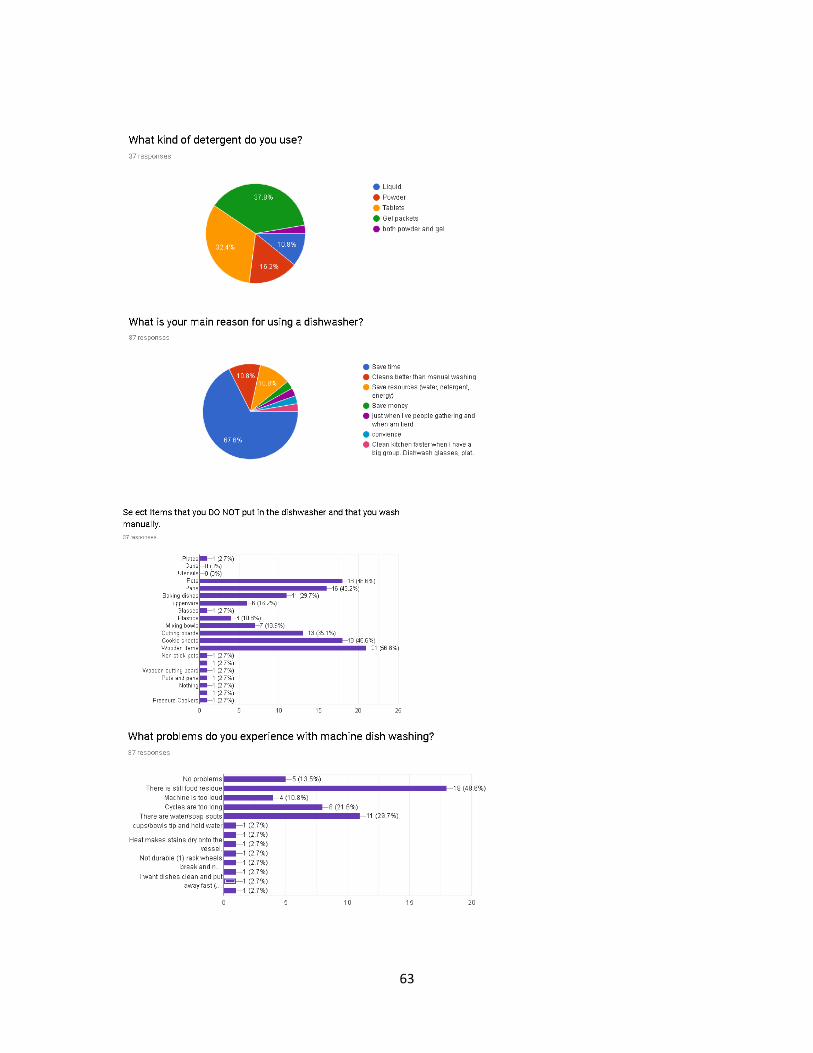
63
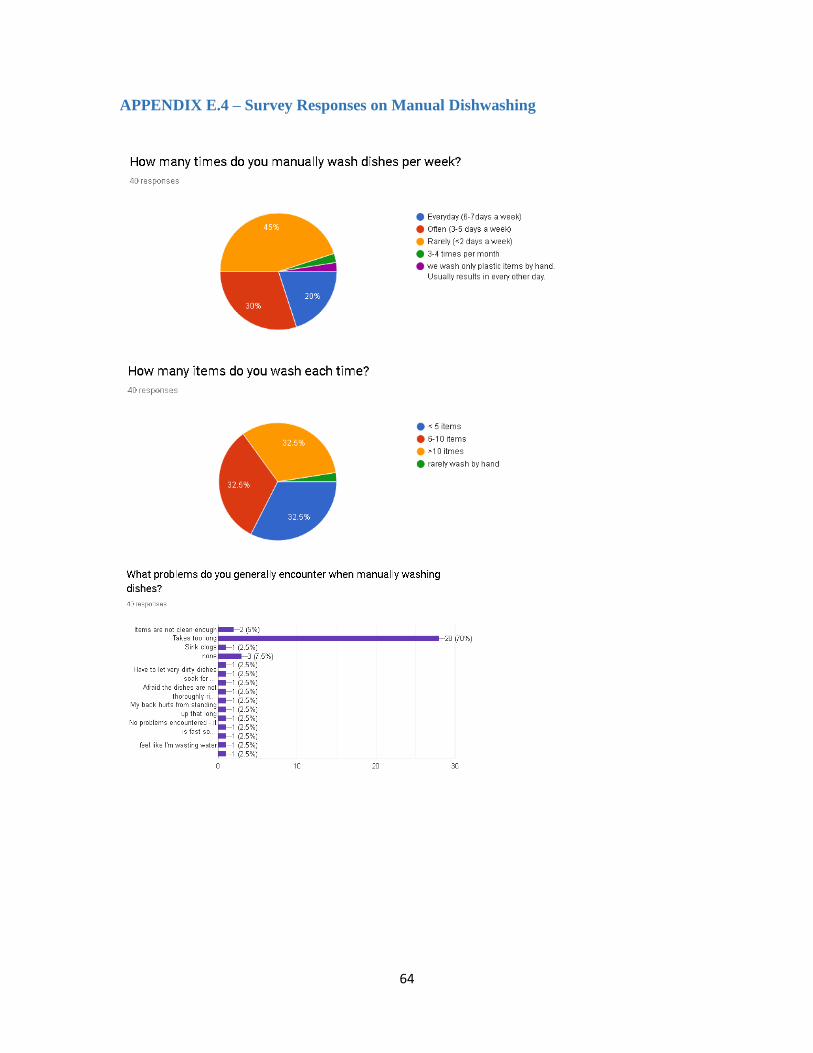
64
APPENDIX E.4 – Survey Responses on Manual Dishwashing
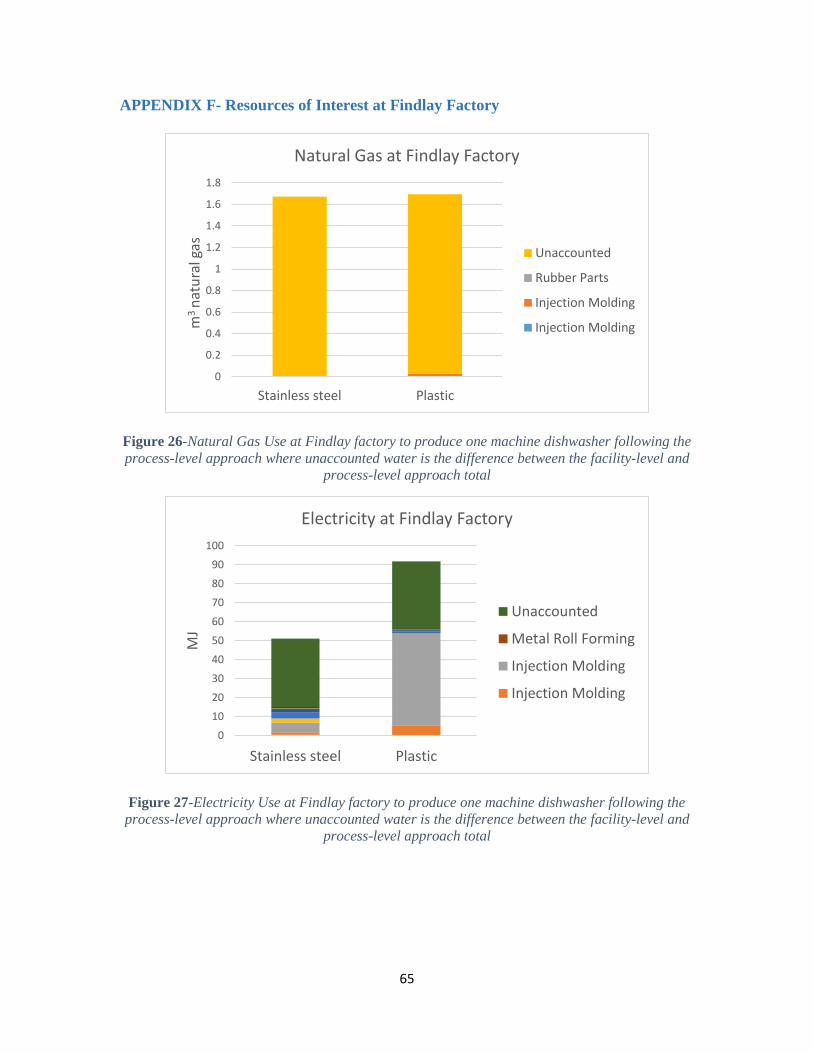
65
APPENDIX F- Resources of Interest at Findlay Factory
Figure 26-Natural Gas Use at Findlay factory to produce one machine dishwasher following the
process-level approach where unaccounted water is the difference between the facility-level and
process-level approach total
Figure 27-Electricity Use at Findlay factory to produce one machine dishwasher following the
process-level approach where unaccounted water is the difference between the facility-level and
process-level approach total
0
0.2
0.4
0.6
0.8
1
1.2
1.4
1.6
1.8
Stainless steel Plastic
m3
nat
ura
l gas
Natural Gas at Findlay Factory
Unaccounted
Rubber Parts
Injection Molding
Injection Molding
0
10
20
30
40
50
60
70
80
90
100
Stainless steel Plastic
MJ
Electricity at Findlay Factory
Unaccounted
Metal Roll Forming
Injection Molding
Injection Molding
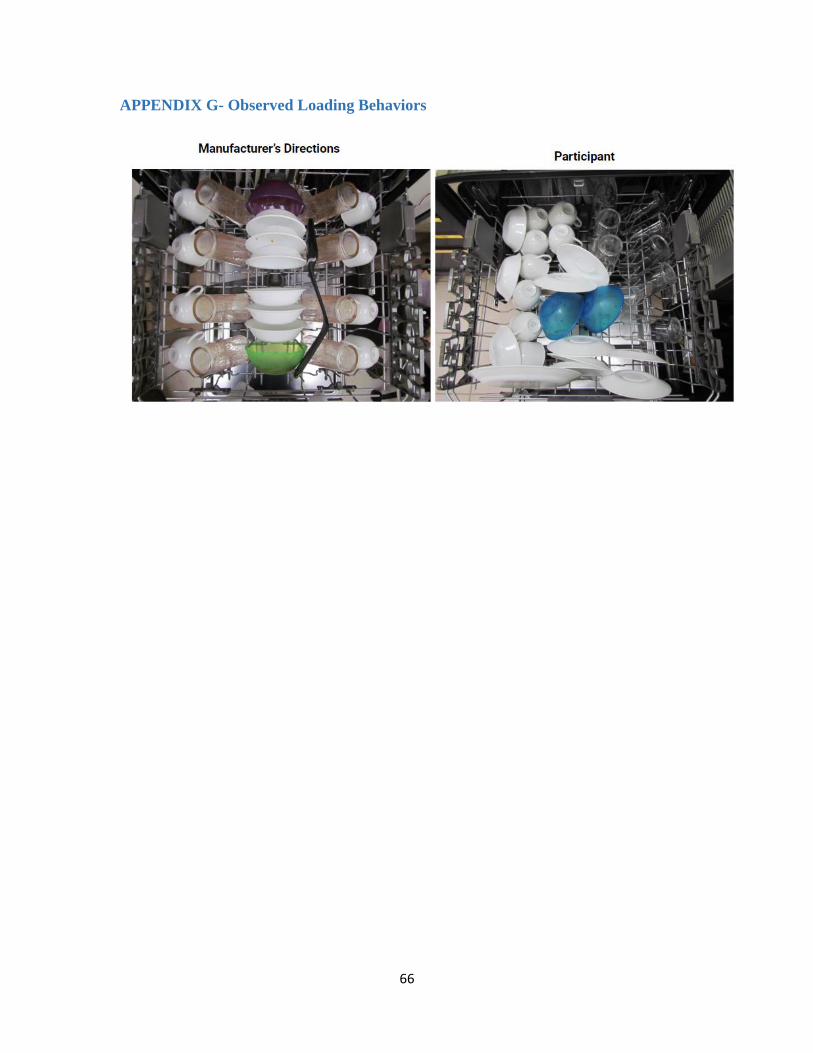
66
APPENDIX G- Observed Loading Behaviors
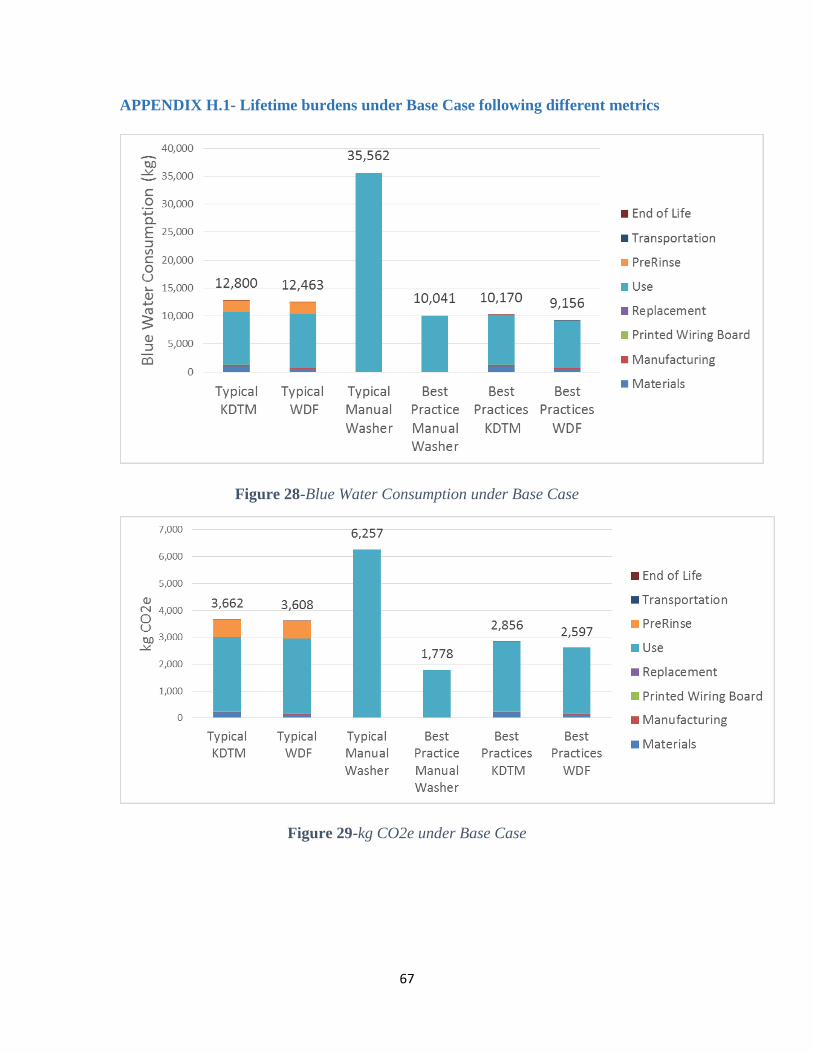
67
APPENDIX H.1- Lifetime burdens under Base Case following different metrics
Figure 28-Blue Water Consumption under Base Case
Figure 29-kg CO2e under Base Case
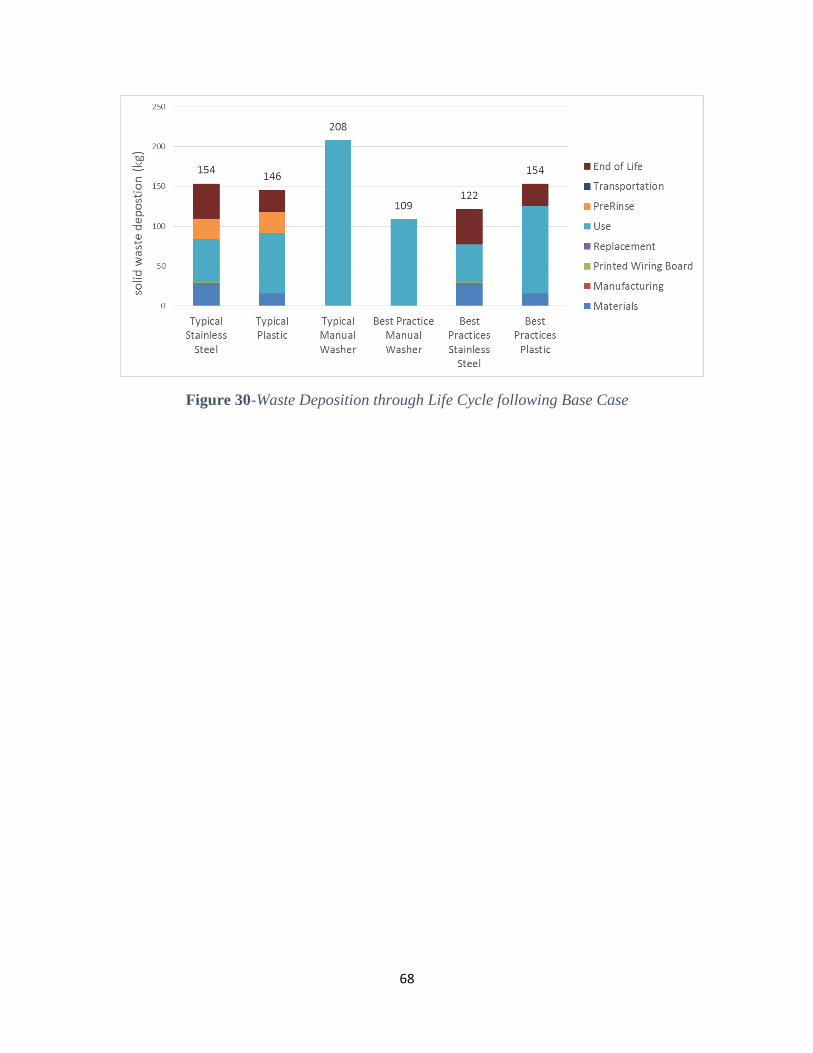
68
Figure 30-Waste Deposition through Life Cycle following Base Case
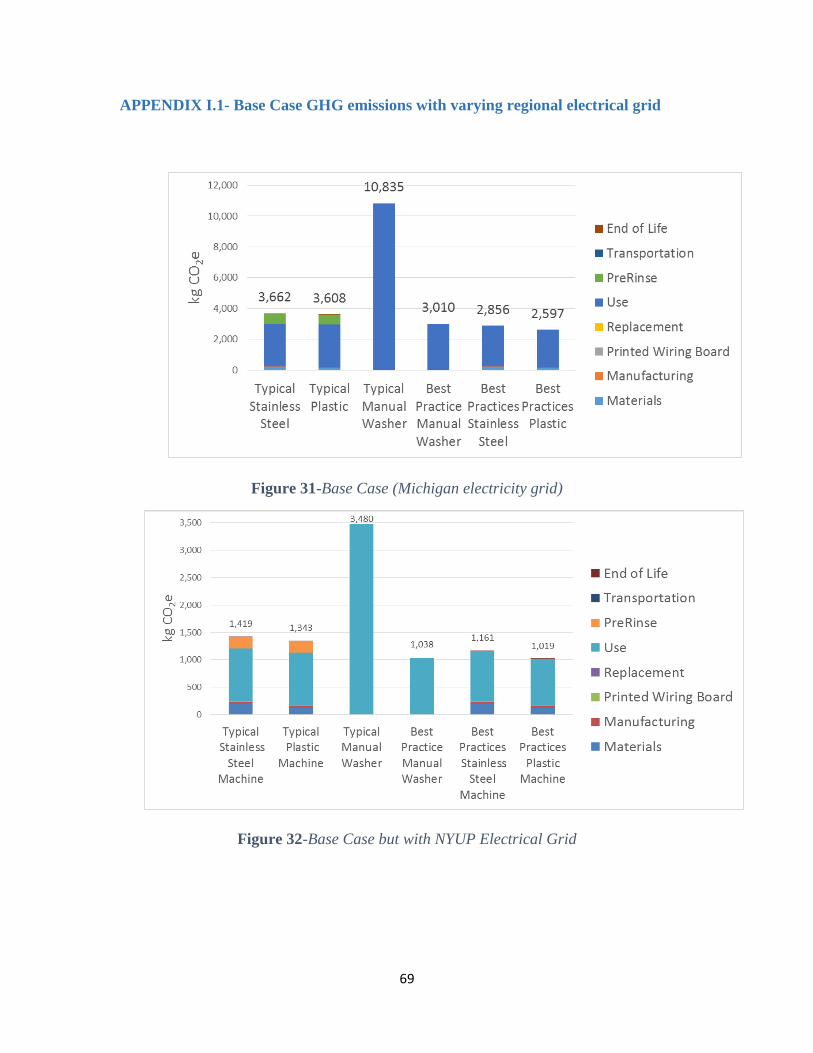
69
APPENDIX I.1- Base Case GHG emissions with varying regional electrical grid
Figure 31-Base Case (Michigan electricity grid)
Figure 32-Base Case but with NYUP Electrical Grid
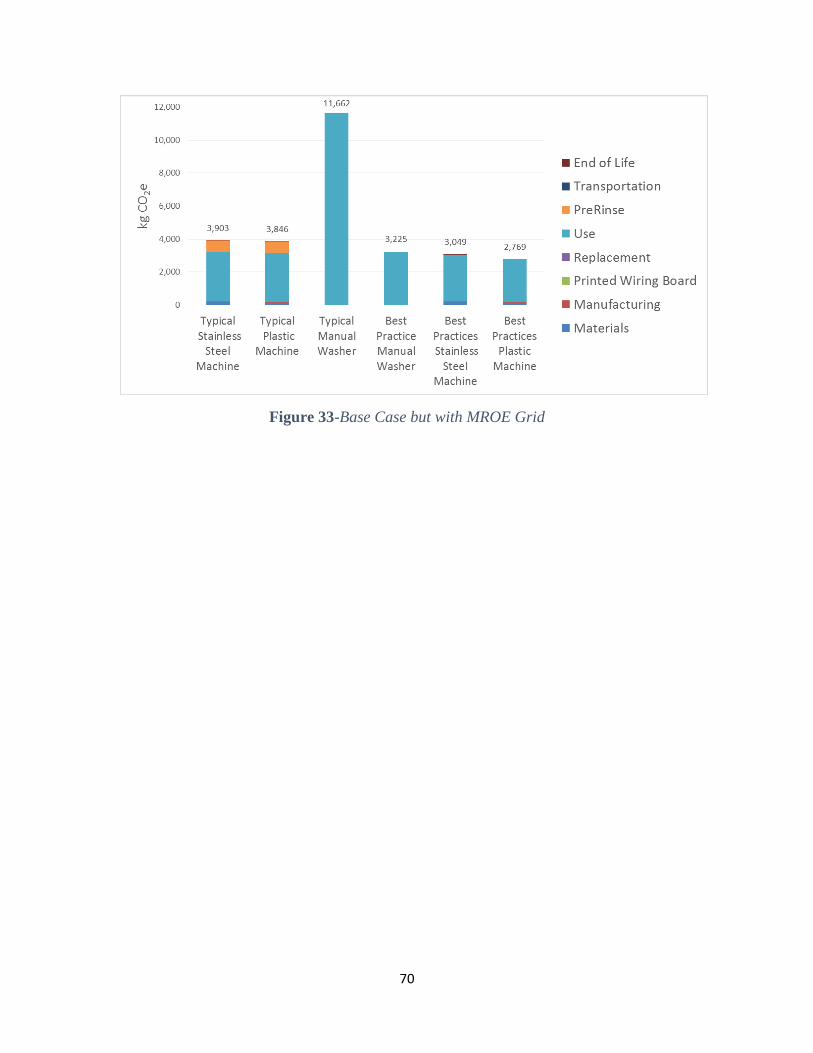
70
Figure 33-Base Case but with MROE Grid
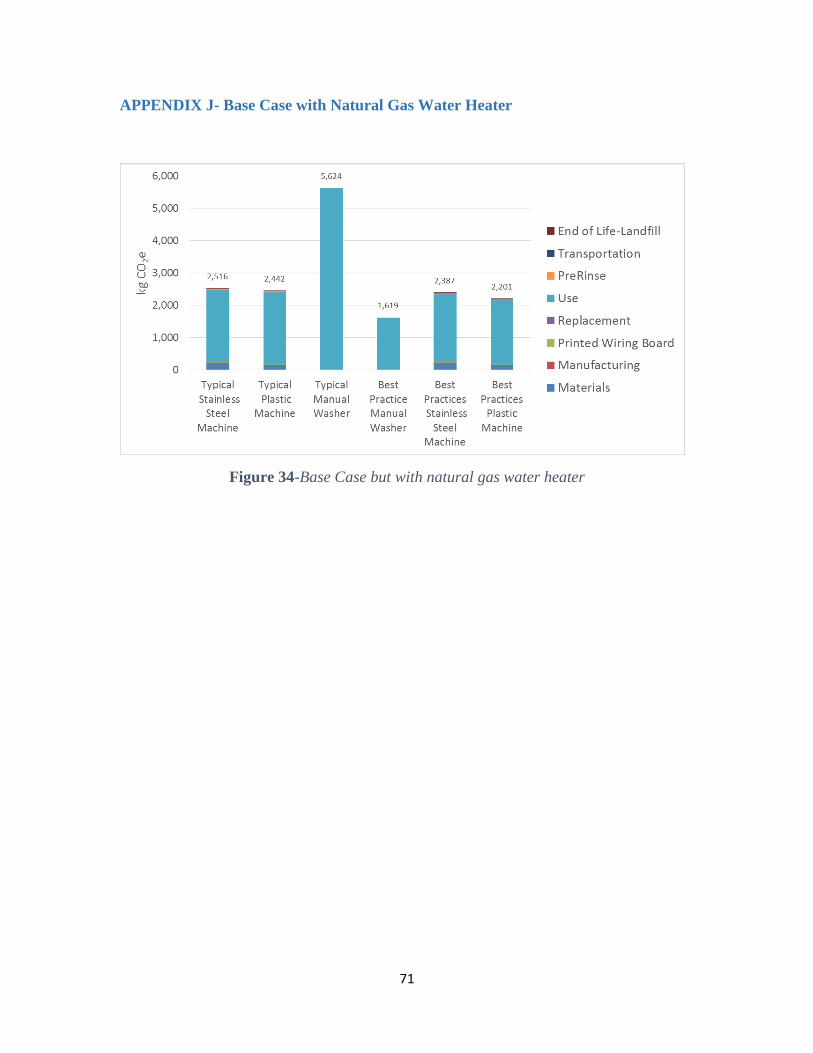
71
APPENDIX J- Base Case with Natural Gas Water Heater
Figure 34-Base Case but with natural gas water heater