Embed Size (px)
Citation preview

R E S E A R C H A N D A N A LYS I S
Life Cycle Assessment ofWater Supply Plans inMediterranean SpainThe Ebro River Transfer Versus the AGUAProgramme
Ivan Munoz, Llorenc Mila-i-Canals,and Amadeo R. Fernandez-Alba
Keywords:
desalinationfreshwater ecosystem impactindustrial ecologylife cycle impact assessment (LCIA)water footprintwater reuse
Supplementary material is availableon the JIE Web site
Address correspondence to:Ivan MunozDepartamento de Hidrogeologıa y
Quımica AnalıticaUniversidad de AlmerıaCtra. de Sacramento s/n, La Canada de
San Urbano, 04120, Almerıa (Spain)[email protected]
c© 2010 by Yale UniversityDOI: 10.1111/j.1530-9290.2010.00271.x
Volume 14, Number 6
Summary
Life cycle assessment (LCA) was used to compare the currentwater supply planning in Mediterranean Spain, the so-calledAGUA Programme, with its predecessor, the Ebro river watertransfer (ERWT). Whereas the ERWT was based on a singleinterbasin transfer, the AGUA Programme excludes new trans-fers and focuses instead on different types of resources, includ-ing seawater and brackish water desalination and wastewaterreuse, among others. The study includes not only water supplybut the whole anthropic cycle of water, from water abstractionto wastewater treatment. In addition to standard LCA impactcategories, a specific impact category focusing on freshwa-ter resources is included, which takes into account freshwaterscarcity in the affected water catchments. In most impact cat-egories the AGUA Programme obtains similar or even lowerimpact scores than ERWT. Concerning impacts on freshwaterresources, the AGUA Programme obtains an impact score49% lower than the ERWT. Although the current water plan-ning appears to perform better in many impact categories thanits predecessor, this study shows that water supply in SpanishMediterranean regions is substantially increasing its energy in-tensity and that Mediterranean basins suffer a very high level ofwater stress due to increasing demand and limited resources.
902 Journal of Industrial Ecology www.wileyonlinelibrary.com/journal/jie

R E S E A R C H A N D A N A LYS I S
Introduction
National water planning in Spain has alwaysbeen a challenge, due to the significant geograph-ical imbalance between areas of natural wateravailability and water resource needs (Downwardand Taylor 2007). Traditionally, hydrologicalplanning has been driven by a supply approach,which involves huge investments in water works,such as the National Hydrological Plan (NHP)of 1993, which was intended to interconnect allthe main basins of the Iberian peninsula, transfer-ring nearly 4,000 gigaliters (GL) per year (Albiacet al. 2007). This plan was finally rejected, andthe government undertook a new planning effort,based on a single interbasin transfer bringing wa-ter from the Ebro River. A main subproject ofthis new NHP, approved in 2001, was the trans-fer of 1,050 GL per year from the lower Ebro,including 190 GL supplied to the Barcelona areain the north and the remaining volume suppliedto southern basins, some of which are as far as
Figure 1 The Ebro River water transfer (ERWT).
700 kilometers (km) away. This transfer, how-ever, raised a political conflict between donatingand receiving territories and faced strong opposi-tion from water resource experts (Ibanez and Prat2003) and environmental and social organiza-tions. Furthermore, the European Union (EU) re-fused to fund the project, on the basis of the envi-ronmental impact of the proposed transfer and itsinconsistency with EU environmental legislationand policies, such as the Habitats Directive or theWater Framework Directive (European Commis-sion 2004). Finally, the NHP was cancelled in2005 by the newly elected government, and a newwater policy, called AGUA Programme1 (Minis-terio de Medio Ambiente 2009), was launched.This policy targeted Mediterranean Spain as apriority for action, forecasting 1,063 GL of waterto be supplied to the regions from Girona, in thenortheast, to Malaga, in the southwest. Instead ofproposing interbasin transfers, the AGUA Pro-gramme is based on increasing desalination ca-pacity as well as on improving the management
Munoz et al., LCA of Water Supply Plans in Mediterranean Spain 903
R E S E A R C H A N D A N A LYS I S
of existing resources (wastewater reuse, upgradingof existing infrastructures, etc.). This new planhas also been subject to controversy, however,especially concerning the environmental issuesassociated with desalination and also because,similar to its predecessors, it focuses on supplyrather than on demand (Meerganz von Medeazza2005; OECD 2008).
A qualitative environmental assessment of theAGUA Programme was carried out by the Span-ish Ministry of the Environment, including anestimation of carbon dioxide (CO2) emissions re-lated to water supply. The report states, however,that to get a complete picture of the environmen-tal performance, one must take a life cycle as-sessment (LCA) approach (Ministerio de MedioAmbiente 2005). Certainly, LCA has been usedas a decision-making tool in the context of wa-ter supply (Lundie et al. 2004; Vince et al. 2008;Stokes and Horvath 2009). Actually, the envi-ronmental performance of the Ebro River watertransfer (ERWT) was evaluated with LCA byRaluy and colleagues (2005), who compared itto sea water desalination. Besides sea water de-salination, however, the AGUA Programme fo-cuses on other water sources and technologies.In addition, Raluy and colleagues (2005) statedthat their ERWT scenario did not include addi-tional treatment for drinking water and the wa-ter distribution network, which should be partof a complete assessment. Furthermore, despitethe relevance of freshwater to human welfareand ecosystem quality, the LCA methodology hastraditionally omitted this issue in the impact as-sessment phase, and methods for assessing wateruse as an specific impact category have been de-veloped only recently (Frischknecht et al. 2006;Mila i Canals et al. 2009; Pfister et al. 2009; Ba-yart et al. 2010). It is clear that in the contextof environmental assessment of water planningalternatives, water use impacts are of the utmostimportance.
We applied LCA for the environmental eval-uation of the AGUA Programme as compared toits predecessor, the ERWT. Besides the goal ofcomparing these two options, we had a method-ological purpose, which was to show how impactson freshwater resources can be assessed in LCAstudies dealing with water supply planning.
Scope of the Life CycleAssessment
Description of the Alternatives
The ERWT (figure 1) was intended to abstractevery year the following volumes of water: 190 GLfor the northern basins of Catalonia (basically theBarcelona area), 315 GL for the Jucar basin (Va-lencia), 450 GL for the Segura basin (Murcia andAlicante), and 90GL for Almerıa. The overall ab-stracted volume was 1,050 GL per year, of which1,000 GL were expected to reach their destina-tion, whereas the remaining 50 GL correspond tolosses by leaks and evaporation. Fifty-six percentof the transferred water was intended for agricul-tural use, and the remaining 44% was devoted tourban use. The transfer infrastructure would con-sist of a northern route directed toward Barcelona(180 km) and a southern route ending in Almerıa(745 km). Most of the transfer was projected asan open channel, with numerous tunnels, aque-ducts, siphons, and pumping stations, especiallyin the southern route, due to its hilly nature.
Water supply, according to the AGUAProgramme (table 1), involves different watersources and production technologies. The af-fected geographical area ranges from Girona, nearFrance, to Malaga in the south. The overall vol-ume of water to be supplied is 1,063 GL peryear. More than 50% of this volume will be pro-duced by means of seawater desalination, and23% will come from wastewater and agriculturalrunoff reclamation. The remaining resources willbe generated from surface water and groundwa-ter. It must be highlighted that little informationis available on each subproject. As opposed tothe ERWT, for which detailed documentation isavailable, the AGUA Programme has no generalreport or document but only a Web site (Min-isterio de Medio Ambiente 2009) that lists theprojects, along with links to short press releasesreporting on the status of some these projects anda sustainability report (Ministerio de Medio Am-biente 2005).
Water Balance
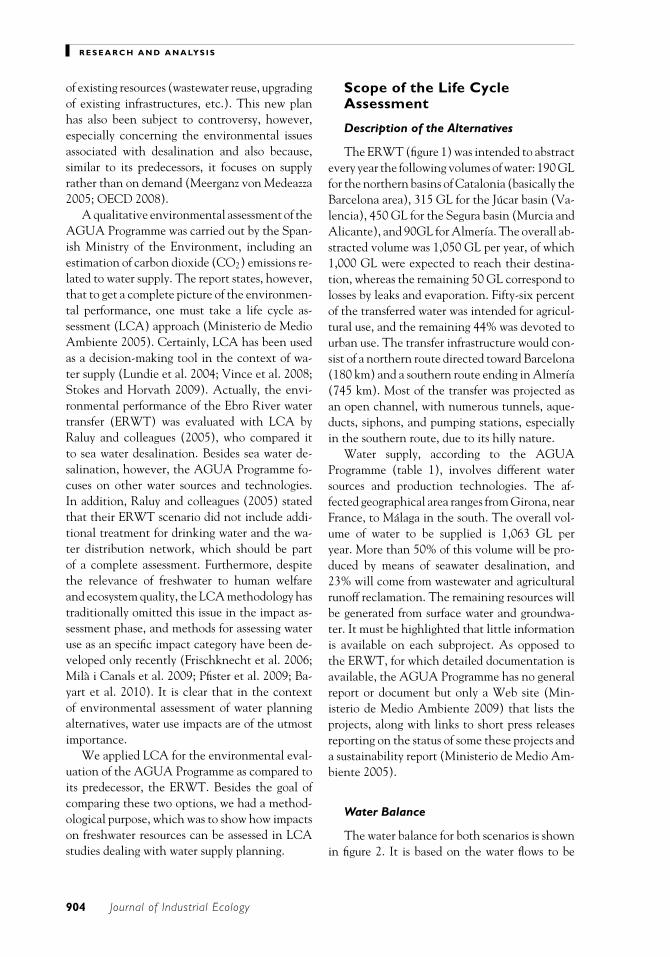
The water balance for both scenarios is shownin figure 2. It is based on the water flows to be
904 Journal of Industrial Ecology

R E S E A R C H A N D A N A LYS I S
Table 1 Water supply according to the AGUA Programme
SupplyWater source Intended use (GL year−1) Description
Seawaterdesalination
Urban andagricultural
566 23 new or enlarged reverse osmosisdesalination plants in Malaga, Almerıa,Murcia, Alicante, Castellon, Barcelona,and Girona
Brackish waterdesalination
Agricultural 55 Two reverse osmosis plants for desalination ofagricultural runoff (Murcia and Alicante)
Urban 30 Two reverse osmosis plants for desalination ofgroundwater (Besos aquifer, Barcelona) andsurface water (Guadalhorce reservoir,Malaga)
Wastewaterreclamation
Urban andagricultural
189 11 projects for advanced treatment ofwastewater reclamation and distributionnetwork in Malaga, Almerıa, Murcia,Alicante, Valencia, Castellon, Barcelona,and Girona
Surface water andgroundwater
Agricultural 173 19 heterogeneous projects for surface waterand groundwater use in agriculture (newand upgraded hydraulic infrastructures) inAlmerıa, Murcia, Alicante, Valencia andCastellon.
Urban 50 4 projects in Barcelona for water regulation,upgrading of drinking water productionplants, distribution systems in Barcelona
Note: GL year−1 = gigaliters per year.
1000
Agriculturaluse
Urban use
560 440 Distribution Losses
74
Wastewater 366
Effluent 366
Wastewater treatment
Surface water 1050
Evaporation and leaks
50
Ebro river water
transfer
Water treatment
Crop evaporation
330
Distribution losses and runoff
230
1063
Agriculturaluse
Urban use
595 468 Distribution Losses
79
Wastewater 389
Effluent 200
Wastewater treatment
Advanced treatment
189
Runoff 85
Brine 30
Runoff Desalination
55
Sea water 1258Surface water and groundwater 223Brackish water 46
Brine 708AGUA Programme
supply
Crop evaporation
351
Distribution losses and runoff
244
102a0b
291a189b
Figure 2 Water balance in gigaliters per year for the two alternatives, based on our assumptions. The flowfrom and to the advanced wastewater treatment in the AGUA Programme depends on the technologyconsidered: aflows in the membrane treatment case or bflows in the disinfection treatment case.
Munoz et al., LCA of Water Supply Plans in Mediterranean Spain 905

R E S E A R C H A N D A N A LYS I S
supplied from each source and the following as-sumptions we made: The performance of seawa-ter desalination and brackish water desalination,in terms of the product-to-input ratio, is 45%and 65%, respectively (Munoz and Rodrıguez2008). The performance of agricultural runoffdesalination is assumed to be the same as forbrackish water desalination. The overall shareof agricultural and urban use in the AGUAProgramme is not available. As can be seen intable 1, reclaimed wastewater and desalinatedwater will be used for both purposes. As a conse-quence, the partitioning according to the ERWThas been assumed (56% agricultural and 44%urban). Average losses in the urban distribu-tion network in Spain are 16.7% (Instituto Na-cional de Estadıstica 2008), whereas the extentof losses in agriculture, calculated from the watersupplied and actual crop demand, according tothe National Irrigation Plan, is 41% (Ministeriode Medio Ambiente 2002). It is expected thatthis figure will be brought down by the AGUAProgramme, given that many interventions aimat upgrading and improving existing irrigationinfrastructures; however, we lack specific dataand therefore use the current figure. Concern-ing wastewater reclamation in the AGUA Pro-gramme, the planned technologies range froma mild disinfection step to the more resource-intensive membrane processes (microfiltration,reverse osmosis). The latter involve a substan-tial flow of concentrate, which is sent back tothe primary and secondary treatment; this leadsto higher wastewater volumes to be treated, ascompared to when only disinfection is applied.
Functional Unit
The system under study has as its functionthe supply of water in the Mediterranean re-gions of Spain. There is a secondary functionin the AGUA Programme alternative—namely,the supply of nutrients (nitrogen and phospho-rus) by means of reusing reclaimed wastewaterin agriculture. This function is not fulfilled bythe ERWT, because treated sewage is discharged.This function has not been taken into account,however, given that a preliminary assessmentshowed that avoided burdens from saved mineralfertilizers were negligible. In addition, if reverse
osmosis is applied for wastewater reclamation,most of the nitrogen and phosphorus is removed(Abdel-Jawad et al. 1999; Madwal and Tarazi2002).
Concerning the functional unit, there is nota straightforward choice, because the overall vol-ume of water supplied per year is different, as arethe regions affected (Girona and Malaga werenot included in the ERWT). If we exclude theseregions from the AGUA Programme, the twoscenarios become more comparable in terms ofgeographical boundaries, but the overall amountof water supplied remains different (928 GL com-pared to 1,000 GL); therefore, these two regionswere kept within the system boundaries. We de-cided to compare both scenarios on the basis of1 average cubic meter water from the 1,000 GLand 1,063 GL supplied per year.
System Boundaries and Inventory Analysis
For the alternative plans to be fairly com-pared, the LCA study must include not only wa-ter supply itself but also distribution and wastew-ater treatment. As has been stated previously,the ERWT requires the transferred water to betreated and distributed, at least in the case of ur-ban use. The use phase is common to both alter-natives and is therefore not included. Wastewa-ter treatment (primary and secondary treatment)has to be included, because the final volume ofwastewater treated is different in each alterna-tive, due to the wastewater reclamation step (seefigure 2).
Data concerning the ERWT were obtainedfrom the study by Raluy and colleagues (2005),which included the whole infrastructure andthe average power demand during the opera-tion phase. Seawater and brackish water desali-nation were modeled with data from Munoz andRodrıguez (2007), including plant infrastructure,operation, and dismantling. Advanced treatmentof wastewater was modeled on the assumption oftwo alternative options: a mild treatment con-sisting of physical-chemical treatment followedby ultraviolet (UV) disinfection, and an inten-sive treatment by means of membranes (micro-filtration plus reverse osmosis). Inventory dataincluded energy and chemicals, based on av-erage figures provided by a Spanish company
906 Journal of Industrial Ecology

R E S E A R C H A N D A N A LYS I S
that runs several wastewater reclamation plants(Rouge 2005). In the case of membrane filtra-tion, an overall performance of 65% permeate wasconsidered. Infrastructure for the advanced treat-ment plant was approximated from the area of aplant applying membrane treatment in El Ejido(southeastern Spain) and an ecoinvent data setfor industrial buildings (Kellenberger et al. 2007).Conversely, membrane renewal was excluded, be-cause it has been shown to be of little environ-mental relevance in LCA studies (Tangsubkul etal. 2006). Treatment of surface water and ground-water for drinking water production has beenmodeled by means of data from a plant in Abrera(Barcelona), which applies a physical-chemicaltreatment recently upgraded with an electro-dialysis reversal (EDR) process. The inventoryincludes the demand of energy and chemicals(Algra 2002; ATLL 2009), whereas, due to lackof data, infrastructure was approximated with theecoinvent data set for water works (Althaus et al.2007). Distribution of treated water from drink-ing water production plants, desalination plants,and wastewater reclamation plants includes thepumping energy (Ministerio de Medio Ambiente2005) and the distribution network, the latter ofwhich was obtained from the ecoinvent database(Althaus et al. 2007).
Abstracting surface water and groundwater foragriculture in the AGUA Programme includesthe average energy used for pumping, accordingto the National Irrigation Plan (Ministerio deMedio Ambiente 2002). It was not possible tocollect data on construction and upgrading of hy-draulic infrastructures, because a large number ofsmall-scale heterogeneous projects are involved,such as new wells, upgrading of channels, buildingof small dams and pumping stations, and so on,and the available information on these projectswas poor and inadequate for an LCA study. Inorder not to exclude this aspect, we consideredthe infrastructure of the ERWT as an approxima-tion of the one required for supply of ground andsurface water for irrigation. This is clearly an over-estimation, because the AGUA Programme in-volves mostly upgrading existing infrastructures,whereas the ERWT involved constructing newones, and at a much bigger scale. For this rea-son, this assumption is only made in a pessimisticscenario (see table 2).
We included conventional treatment of urbansewage, taking into account the average compo-sition of Spanish wastewater (Instituto Nacionalde Estadıstica 2007), and a wastewater treat-ment model, including sewer and plant infras-tructure, energy and chemicals, and sludge dis-posal (Munoz et al. 2007). According to Spanishstatistics, 65% of excess sludge is sent to agricul-tural application (Ministerio de Medio Ambiente2008), whereas the remaining 35% is mostly sentto landfill. Treatment of the concentrate flowfrom advanced wastewater treatment (microfil-tration and reverse osmosis) was modeled in thesame way as wastewater coming from the sewer.
We obtained the background data used in theinventory analysis (energy carriers, chemicals, in-frastructure materials, etc.) from the ecoinventdatabase Version 2.1. (Swiss Centre for Life Cy-cle Inventories 2009).
Due to the uncertainty involved in many ofthe mentioned processes, we considered in the in-ventory analysis an optimistic and a pessimisticcase for each process, especially concerning en-ergy use, which we expected to have an importantinfluence on the results. Table 2 summarizes theseoptimistic and pessimistic conditions. Detailedinventory tables for all processes are available inthe Supplementary Material on the Web.
Water Flows in the Inventory Analysis
According to Mila i Canals and colleagues(2009) and Pfister and colleagues (2009), rele-vant water flows from an environmental impactperspective are those involving evaporative use,such as evapotranspiration by crops, leading toa local loss of the resource in the short term. Inthe system under study, not all water supplied isused in agriculture; some is also used in urbanareas, where evaporative uses are less common.Nevertheless, the area under study is located rel-atively close to the coast, and even though fresh-water may not be evaporated, it is “lost” whendischarged to the sea. Therefore, in this studywe have considered all abstracted water (“blue”water) in the foreground system as consumptive,regardless of the intended use. Concerning wa-ter use in the background system, contributionshave been taken into account from blue waterinputs to processes, such as water used in power
Munoz et al., LCA of Water Supply Plans in Mediterranean Spain 907

R E S E A R C H A N D A N A LYS I S
Table 2 Optimistic and pessimistic conditions for the unit processes involved in both alternatives
Process Optimistic Pessimistic Source and comments
Seawaterdesalination
3 kWh m−3 4 kWh m−3 A modern plant with energy recovery systemis considered (Ministerio de MedioAmbiente 2005). Pumping energy for waterdistribution is not included here.
Brackish waterdesalination
1 kWh m−3 2 kWh m−3 The low value is the average for a plantcurrently in operation in Malaga (ElAtabal), whereas the high valuecorresponds to a plant in Cuevas delAlmanzora (Almerıa; Munoz and Rodrıguez2007).
Advancedwastewatertreatment
0.12 kWh m−3 1.5 kWh m−3 The low value involves sand filtration,coagulation, flocculation, and ultravioletdisinfection, whereas the high value adds amembrane treatment (microfiltrationfollowed by reverse osmosis; Rouge 2005).
Waterdistributionfrom treatmentplants
0.2 kWh m−3 0.8 kWh m−3 Pumping requirements are site-specific. Thesevalues are taken from the work ofMinisterio de Medio Ambiente (2005).
Water transferfrom EbroRiver
2.5 kWh m−3
50 years ofinfrastructure
3 kWh m−3
25 years ofinfrastructure
The optimistic energy demand corresponds tothe first figure proposed in the NationalHydrological Plan and used by Raluy andcolleagues (2005), whereas the higherfigure is a more realistic value suggested bythe Ministerio de Medio Ambiente (2005).Useful life of the Ebro transfer is asconsidered by Raluy and colleagues (2005).
Irrigation waterfrom surfacewater andgroundwater
0.14 kWh m−3
+ 0.38 MJdiesel m−3
0.9 kWh m−3 +infrastructurefrom Ebrotransfer (50years)
The optimistic scenario corresponds to theaverage energy use for supply in Spanishirrigated areas (Ministerio de MedioAmbiente 2002). The pessimistic scenariocorresponds to typical energy use forgroundwater extraction in southeasternSpain (Gimenez 2009). The Ebro transferconstruction impacts per cubic meter areused as a worst-case approximation ofhydraulic infrastructures for irrigation.
Note: kWh m−3 = kilowatt hours per cubic meter; MJ diesel m−3 = megajoules of diesel per cubic meter.
plants, but also from changes in rainwater infiltra-tion caused by land use (“green” water), accord-ing to Mila i Canals and colleagues (2009). Waterused in background processes has been consideredas consumptive or nonconsumptive according tothe following rules:
• Water used to move turbines: This involvesin-stream use where the main change by thewater used is the loss of kinetic energy. This
category of water use has been consideredas nonconsumptive, because water remainsavailable for other uses, with virtually noquality loss.
• Cooling water: Although large amounts ofwater are used by thermal power plants forcooling, most of this water is quickly re-turned to the water body, with a highertemperature. According to Spanish statis-tics, about 95% of water abstracted for
908 Journal of Industrial Ecology

R E S E A R C H A N D A N A LYS I S
this purpose is returned (Instituto Nacionalde Estadıstica 2008). As a consequence,we have only taken into account as con-sumptive use 5% of the total volume ofcooling water. The loss of quality relatedto increased temperature is not taken intoaccount.
• For all other freshwater flows, regardless ofthe origin of water (river, lake, well, etc.),a conservative approach is taken, wherebythey are assumed to be consumptive.
Lost precipitation, in millimeters per squaremeter per year (mm m−2 year−1), due to landoccupation has been estimated for the Span-ish Mediterranean region following the guide-lines by Mila i Canals and colleagues (2009): Aweighed average precipitation rate of 400 mmyear−1 has been calculated from meteorologicalstatistics for the area under study—namely, thecoastal provinces from Girona to Malaga. Lostprecipitation associated with different land useclasses has been calculated from the percentagesof usable precipitation considering the values forrainfall below 600 mm year−1 (see Mila i Canalset al. 2009, Table 1).
Life Cycle Impact Assessment: StandardImpact Indicators
Impact categories commonly assessed in LCAstudies have been included at the characteriza-tion level, according to the CML 2001 method(Guinee et al. 2004). This method is based onthe ISO standards for LCA (ISO 2006) and con-stitutes a well-known methodology for impact as-sessment that is widely used by LCA practition-ers. Nevertheless, toxicity-related categories inthis method have been excluded. One of the rea-sons for this is the lack of adequate data on thecontent and fate of trace pollutants in wastewa-ter and reclaimed wastewater, including emergingand priority substances, which have been iden-tified as key contributors to toxicity impacts inrecent studies (Munoz et al. 2008a, 2009). Theother reason is that current life cycle impact as-sessment (LCIA) practice does not allow us toproperly include the toxicity of waste brine fromdesalination plants. Another important aspectnot included in the assessment is the direct effect
on biodiversity of both alternatives. Currently, nostandardized LCIA method for assessing impactson biodiversity exists. The Freshwater ecosystemimpact (FEI) indicator (see next section), how-ever, can be considered as a simple approximationfor impacts on biodiversity in freshwater ecosys-tems. In addition to the CML impact categories,cumulative energy demand (CED), assessed assuggested by Frischknecht and Jungbluth (2007),has also been included. CED is a direct and eas-ily understandable indicator of process efficiency,which has traditionally been used for environ-mental assessment of products and processes.
Life Cycle Impact Assessment: FreshwaterResources
Impacts on freshwater resources are far frombeing standardized in current LCIA practice. Todate, most studies have neglected this issue orreflected it as a simple indicator expressing thevolume of water abstracted by the product system(Munoz et al. 2008b). In the present study, wehave applied the FEI method recently developedby Mila i Canals and colleagues (2009), mea-sured as volume of “ecosystem-equivalent” water,which refers to the volume of water likely to beaffecting freshwater ecosystems. FEI is calculatedwith equation (1):
FEI =n∑
i =1
CWUi × WTAi (1)
Where CWUi is consumptive water use of aunit process (L), WTA is the withdrawal-to-availability ratio of the river basin where water isconsumed, and i to n are the set of unit processesinvolved in the product system. The characteri-zation factor, WTA, is defined as
WTA = WUWR
(2)
where WU is the total annual freshwater with-drawal in a river basin and WR is the annualfreshwater availability in that same basin.
The impact pathway assessed by FEI is thechange in freshwater availability for ecosystems,which leads to effects on ecosystem quality. Itreflects in a simple way this impact chain andconstitutes an early midpoint approach. A highWTA in a basin indicates serious water stress,
Munoz et al., LCA of Water Supply Plans in Mediterranean Spain 909

R E S E A R C H A N D A N A LYS I S
involving less availability of resources for ani-mals and plants. According to Mila i Canals andcolleagues (2009), further sophistication is pos-sible in this method, which allows for inclusionof environmental requirements and nonlinear re-lationships. In addition, a relationship betweenWTA and the potentially affected fraction ofspecies (PAF) can be worked out, which leadsto a damage assessment.
Applying WTA as characterization factor re-quires, first, determining at the inventory levelthe regions where water withdrawals take place,and, second, obtaining the WTA values for thoseregions. In the foreground system, the river basinswhere water is abstracted are known, and the cor-responding WTA values have been calculatedfrom river basin authority statistics, regional wa-ter plans, and so on (table 3). In the backgroundsystem, it is unknown where water abstractionstake place, but it is assumed that they take place
mostly in Spain. For this reason, the averagecountry-level WTA for Spain, according to theAquastat online statistics (FAO 2009), has beenused. Table 3 shows the WTA values used as char-acterization factors for the consumptive waterflows quantified in the inventory analysis. As canbe seen, the WTA for seawater is zero, becauseseawater is regarded as an unlimited resource.Similarly, reuse of reclaimed wastewater and re-claimed agricultural runoff are also assigned aWTA of zero, given that water reuse has a benefi-cial rather than detrimental effect, as it decreasesthe pressure on freshwater ecosystems. It mustbe highlighted that WTA values for river basinsused in the study reflect not current WU andWR but the prospective WU and WR accordingto each alternative. In this way, for each basin,WU reflects current WU plus additional freshwa-ter abstractions. Accordingly, WR includes cur-rent WR plus additional resources. As additional
Table 3 Withdrawal-to-availability values used as characterization factors in the Freshwater EcosystemImpact (FEI) indicator
WU (GL year−1) WR (GL year−1)WTA
Current Additionala Current, Current, from Additionalb (a + b)/Source of water (a) (b) local (c) existing transfers (d) (e) (c + e)
Catalonia internal basinsBesos basin 183c 15 100c 80c 1.98Llobregat basin 689d 30 712d 70 0.92
Segura basin 1,785e 43 960e 540e 291 1.46Jucar basin 2,962f 138 4,142f 144 0.72Andalusian
Mediterraneanwater district
1,377g 17 1,220g 295 0.92
Ebro basin 7,325h 1,050 18,217h 0.46Seawater/water reusei 0.00Spain (background
system)j11,2000 35,600 0.32
aAdditional surface or groundwater abstractions according to either the AGUA Programme or the Ebro River transfer.bAdditional resources by means of wastewater reclamation, agricultural runoff reclamation, or seawater desalination.cDepartament de Medi Ambient (1992). Transferred resources come from the Ter River.dMinisterio de Medio Ambiente (2000).eConfederacion Hidrografica del Segura (2009). Transferred resources come from the Tajo River.f Confederacion Hidrografica del Jucar (2009).gJunta de Andalucıa (2008).hConfederacion Hidrografica del Ebro (2009). WU includes only 5% of the abstracted volume for cooling in powerplants (see the Water Flows in the Inventory Analysis section).iSeawater desalination and water reuse decrease pressure on freshwater ecosystems. WTA is zero.jAquastat (FAO 2009).
910 Journal of Industrial Ecology

R E S E A R C H A N D A N A LYS I S
resources we refer to water obtained by meansof seawater desalination, wastewater reclamation,or agricultural runoff reclamation. For example,in the Ebro basin, the current WTA is 0.40, butthe latter would increase to 0.46 if the ERWTwere implemented, because WU increases from7,325 GL year−1 to 8,375 GL year−1, with avail-able resources (WR) remaining the same. An-other important point is that in basins currentlyreceiving water from other basins, by means ofalready existing interbasin transfers (e.g., Tajo-Segura transfer), the calculation of WR excludesthese external resources, which sometimes leadsto extremely high WTA values, as can be seen inthe table.
Results and Discussion
Standard Impact Indicators
Table 4 shows the LCIA scores for the CMLimpact categories, according to the pessimisticand optimistic case. As could be expected, the
scores of the ERWT and AGUA Programme dif-fer significantly for these optimistic or pessimisticconditions: Abiotic depletion increases by 65%in the pessimistic AGUA Programme as com-pared to its optimistic scenario, whereas in thepessimistic ERWT the score in this impact cat-egory increases by 29%. When the ERWT andAGUA Programme are compared, very similarresults can be seen in most impact categoriesof the pessimistic scenario, with the exceptionof ozone depletion and eutrophication. In theoptimistic case, however, differences are moreprominent; the AGUA Programme shows im-pact scores 24% to 28% lower, with the excep-tion of ozone depletion. The lower impact ofthe AGUA Programme in eutrophication is re-lated to the recycling of nitrogen and phospho-rus through wastewater reuse, which thus avoidsits discharge to the sea. In the ERWT there isno wastewater reuse; therefore, all nutrients aredischarged to the sea. Concerning ozone deple-tion, the higher impact of the AGUA Programmehas to do mainly with production of iron (III)
Table 4 Results of standard impact assessment indicators per cubic meter water supplied
Pessimistic case Optimistic case
AGUA/ AGUA/Impact category Unit AGUA ERWT ERWT (%) AGUA ERWT ERWT (%)
Abioticdepletion
kg Sb-eq 0.016 0.017 92 0.009 0.013 72
Acidification kg SO2-eq 0.020 0.020 100 0.012 0.016 76Eutrophication kg
phosphate-eq
0.0058 0.0067 86 0.0052 0.0064 81
Globalwarminga
kg CO2-eq 2.3 2.5 93 1.4 1.9 74
Ozone layerdepletion
kg CFC-11-eq
2.5 × 10⁻⁷ 2.0 × 10⁻⁷ 125 1.9 × 10⁻⁷ 1.7 × 10⁻⁷ 115
Photochemicaloxidation
kg C2H4-eq 8.0 × 10⁻⁴ 8.1 × 10⁻⁴ 98 4.9 × 10⁻⁴ 6.4 × 10⁻⁴ 76
Cumulativeenergydemand
MJ 43 46 93 26 36 72
Note: ERWT = Ebro River water transfer; kg Sb-eq = kilograms of antimony equivalent; kg SO2-eq = kilograms of sulfurdioxide equivalent; kg phosphate-eq = kilograms of phosphate equivalent; kg CO2-eq = kilograms of carbon dioxideequivalent; kg CFC-11-eq = kilograms of chlorofluorocarbon-11 equivalent; kg C2H4-eq = kilograms of ethyleneequivalent; MJ = megajoules.aExcludes biogenic carbon dioxide (CO2) emissions.
Munoz et al., LCA of Water Supply Plans in Mediterranean Spain 911

R E S E A R C H A N D A N A LYS I S
chloride, a coagulant used in desalination plantsand wastewater treatment.
In the remaining impact categories, the betterperformance of the AGUA Programme is relatedto a lower energy and resource intensity, as canbe seen in figure 3, which shows the contributionfrom unit processes to greenhouse-gas emissions.The most important sources of environmentalimpact are the water transfer in the ERWT andseawater desalination in the AGUA Programme.When seawater desalination and the transfer ofwater from the Ebro river are assessed separately,as Raluy and colleagues (2005) did, desalinationinvolves a higher impact, basically due to the en-ergy intensity of the process: According to Raluyand colleagues (2005), desalination produces upto 40% more carbon dioxide (CO2) emissions percubic meter supplied. The AGUA Programme re-lies not only on seawater desalination, however,but also on less energy-intensive options, whichmakes the current water planning appear similarin most impact categories. What is clear, how-ever, is a tendency for increasing the resourceintensity of water supply, regardless of the alter-native considered, given that most of the watersupply processes included in this study lead to
a substantial increase in energy and CO2 emis-sions when compared to traditional freshwatersupply from local basins. For example, CO2 emis-sions from a typical drinking water productionplant, such as the one in Abrera (Barcelona),with the exclusion of water distribution, are 0.37kilograms of CO2 equivalent per cubic meter sup-plied (kg CO2-eq per m3 supplied), but the emis-sions increase to 0.72 kg CO2-eq per m3 sup-plied when the EDR process is added. Emissionsfrom sea water desalination and brackish waterdesalination are 1.95 and 1.07 kg CO2-eq perm3 supplied (Munoz and Rodrıguez 2007), andwastewater reclamation through reverse osmosisinvolves 0.93 kg CO2-eq per m3 supplied, whentreatment of concentrate is excluded. This inten-sification can be even more evident when wateris used for agriculture: Average irrigation water,modeled with data from the National IrrigationPlan, involves emissions of only 0.19 kg CO2-eqper m3 supplied, with the exclusion of emissionsfrom infrastructure production.
Previous studies in other countries have usedLCA to assess water supply scenarios, such asthe study by Stokes and Horvath (2009) toassess alternative water supply technologies in
Figure 3 Disaggregated results for global warming. kg CO2-eq. m−3 = kilograms carbon dioxide equivalentper cubic meter ; ERWT = Ebro River water transfer ; EDR = electrodialysis reversal.
912 Journal of Industrial Ecology
R E S E A R C H A N D A N A LYS I S
southern California—namely, transferring waterfrom the San Joaquin River (1,100 km) and Col-orado River (400 km), desalinating, and reclaim-ing wastewater. In terms of energy use and CO2
emissions, desalination appears as the worst op-tion, especially when seawater instead of brack-ish water is used, whereas wastewater reuse andimported water have a similar performance. Thefigures from Stokes and Horvath are on the sameorder of magnitude as the ones in the presentstudy: Energy use ranges from 18 megajoules percubic meter (MJ m−3) for wastewater reuse to 42MJ m−3 for seawater desalination, whereas CO2
emissions range from 1.02 kg m−3 to 2.46 kg m−3
for the same technologies, although wastewaterand sludge treatment is not included. This studyfrom California agrees with that by Raluy andcolleagues (2005), in the fact that when desali-nation is not combined with other supply options,it involves the highest impacts.
Other studies focus not only on water supplybut on the whole cycle—that is, from abstrac-tion to the wastewater treatment plant. Lundieand colleagues (2004) analyzed the current wa-ter supply system in the Sidney metropolitan areaand found an energy use of 13 MJ m−3 and green-house gas emissions of 1.2 kg CO2-eq per m3
supplied, both low values when compared to thefigures in the present study (26 to 46 MJ m−3, 1.4to 2.5 kg CO2-eq m−3). The technologies usedfor water treatment are not specified in that Aus-tralian study, but wastewater treatment involveshigher emissions than drinking water production,which probably means that “soft” drinking waterproduction technologies are used. Another studyevaluated the cycle of water from abstraction tothe wastewater treatment plant in the Walloonregion of Belgium (Lassaux et al. 2007). Unfor-tunately, the impact assessment results are onlyshown after weighting, and this makes the com-parison with our results very difficult, although,according to the energy use figures used in theinventory analysis, CO2 emissions are probablylower than those in our study.
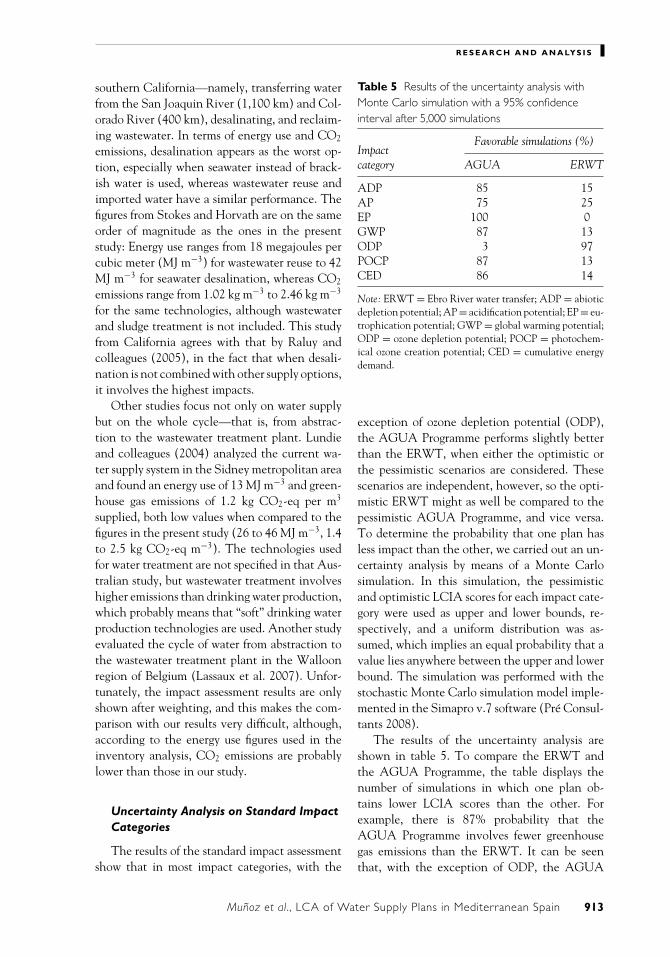
Uncertainty Analysis on Standard ImpactCategories
The results of the standard impact assessmentshow that in most impact categories, with the
Table 5 Results of the uncertainty analysis withMonte Carlo simulation with a 95% confidenceinterval after 5,000 simulations
Favorable simulations (%)Impactcategory AGUA ERWT
ADP 85 15AP 75 25EP 100 0GWP 87 13ODP 3 97POCP 87 13CED 86 14
Note: ERWT = Ebro River water transfer; ADP = abioticdepletion potential; AP = acidification potential; EP = eu-trophication potential; GWP = global warming potential;ODP = ozone depletion potential; POCP = photochem-ical ozone creation potential; CED = cumulative energydemand.
exception of ozone depletion potential (ODP),the AGUA Programme performs slightly betterthan the ERWT, when either the optimistic orthe pessimistic scenarios are considered. Thesescenarios are independent, however, so the opti-mistic ERWT might as well be compared to thepessimistic AGUA Programme, and vice versa.To determine the probability that one plan hasless impact than the other, we carried out an un-certainty analysis by means of a Monte Carlosimulation. In this simulation, the pessimisticand optimistic LCIA scores for each impact cate-gory were used as upper and lower bounds, re-spectively, and a uniform distribution was as-sumed, which implies an equal probability that avalue lies anywhere between the upper and lowerbound. The simulation was performed with thestochastic Monte Carlo simulation model imple-mented in the Simapro v.7 software (Pre Consul-tants 2008).
The results of the uncertainty analysis areshown in table 5. To compare the ERWT andthe AGUA Programme, the table displays thenumber of simulations in which one plan ob-tains lower LCIA scores than the other. Forexample, there is 87% probability that theAGUA Programme involves fewer greenhousegas emissions than the ERWT. It can be seenthat, with the exception of ODP, the AGUA
Munoz et al., LCA of Water Supply Plans in Mediterranean Spain 913

R E S E A R C H A N D A N A LYS I S
Figure 4 Disaggregated results forfreshwater ecosystem impact (FEI). Lecosystem-eq. m−3 = liters ofecosystem-equivalent water in cubicmeters.
Programme is likely to perform better in all im-pact categories.
Freshwater Ecosystem Impact
Figure 4 shows the results of the FEI indicator,measured in liters (L) of ecosystem-equivalentwater per cubic meter (ecosystem-eq. water/m3)supplied. In this case, there is no need to displayoptimistic and pessimistic scenarios, because thedifference in impact scores between these scenar-ios turned out to be negligible. The figure showsthe contribution to the overall FEI score from thedifferent water flows: “Blue water” refers to waterabstractions, whereas “green water” refers to wa-ter lost due to changes in land use. It can be seenthat background processes (water inputs and landuse related to energy and materials production)have very little importance in both alternatives(7 L ecosystem-eq. water/m3), as compared to thewater flows used for water supply. This is probablyrelated to the fact that we assessed a water supplysystem in which water flows are very important inthe foreground system. In LCA studies of indus-trial products, for example, background processescould be more important than in the present one.
When the AGUA Programme and the ERWTare compared, the FEI of the former is 49%lower. The impact of the ERWT is basically ex-plained by the water abstracted from the EbroRiver, whereas in the AGUA Programme thereare important contributions from several basins.
Although the AGUA Programme has a substan-tially lower impact score, it could be surprisingthat it is not even lower, when one takes into ac-count that 75% of the water supplied comes fromseawater or reclaimed effluents, with character-ization factors of zero and thus no impact. Thereason for this is that the remaining 25% of sup-plied water comes from very stressed basins, as isshown in table 3. The table shows clearly that theEbro basin has more resources and is much lessstressed than the receiving basins, which was themain reason to justify the ERWT in the first place.Therefore, although the AGUA Programme per-forms better in global terms, one cannot overlookthe important impact from freshwater abstractionin its affected basins.
We carried out a sensitivity analysis to checkwhether the way WTA values are calculated af-fects the results. In our baseline assessment (ta-ble 3), WTA includes current and predicted de-mand as well as current and predicted resources;it excludes resources coming from existing trans-fers. In the sensitivity analysis we calculated newWTA values in the following ways:
• including only current demand and re-sources but excluding resources from exist-ing transfers—calculated as a/b in table 3
• as in the baseline assessment, but in-cluding resources from existing transfers—calculated as (a + b)/(c + d + e) intable 3
914 Journal of Industrial Ecology

R E S E A R C H A N D A N A LYS I S
Table 6 shows the results of this analysis. Itcan be seen that LCIA scores increase or decreaseup to 15% as compared with the baseline assess-ment. Calculating WTA with only current localresources and demand favors the ERWT, becauseexcluding the predicted abstraction of 1,050 GLper year in this basin leads to a lower WTA. Con-versely, including resources from existing trans-fers favors the AGUA Programme, because theseadditional resources lead to lower WTA valuesfor the Jucar and Besos basins. Still, in both ap-proaches, the AGUA Programme performs betterin FEI, with scores 40% to 57% lower than theERWT. In our opinion, however, the WTA cal-culation carried out in the baseline assessment(table 3) should be considered as a default inthis kind of study, because it captures not onlycurrent but also predicted effects on resourcesand demand for each basin. In addition, exclud-ing existing resources from transfers already inoperation leads to a more sustainability-drivenapproach, in which basins receiving significantresources from other basins are assigned a higherWTA.
This case study shows how impacts on fresh-water resources can be assessed in LCA studiesof regional water planning, following a relativelysimple methodology. The main difficulty of ap-plying such a method is the need for spatial differ-entiation at the inventory and impact assessmentlevels. At the inventory level, the places wherewater abstractions take place must be known, aswell as the intended use of water. This kind of in-formation should be available from the assessedplans or projects. At the impact assessment level,the determination of WTA values requires appro-priate data about the river basins affected, whichshould be available but are not always sufficiently
updated. WTA values can also be obtained frommodels that take advantage of geographical in-formation systems, as shown by Pfister and col-leagues (2009). In addition, if a normalizationstep is required to compare the relevance of thisimpact category with others, normalization fac-tors at the country level are easy to calculate from,for example, AQUASTAT statistics.
Conclusions
We have used the LCA methodology to assessfrom an environmental point of view the cur-rent water supply plan in Mediterranean Spain,the so-called AGUA Programme, as comparedto its predecessor, the ERWT. Besides a stan-dard impact assessment, we have placed a specialfocus on assessing the impacts on freshwater re-sources, by means of a specific impact categorybased on the methodology developed by Milai Canals and colleagues (2009). Environmentalimpacts on biodiversity have not been explicitlyaddressed, however.
The results of the standard impact assessmentshow that in a pessimistic case, the AGUA Pro-gramme has a similar environmental performanceto that of the ERWT, with the exception of ozonedepletion and eutrophication; the former is fa-vorable under the ERWT, and the latter is favor-able under the AGUA Programme. Conversely,an optimistic scenario reveals a lower environ-mental impact for the AGUA Programme, withimpact scores around 25% lower, with the ex-ception of ozone depletion, for which the ERWTstill performs better. These results are interest-ing, because one of the main criticisms of theAGUA Programme from ERWT supporters in
Table 6 Sensitivity analysis on freshwater ecosystem impact
Sensitivity analysis
Baseline WTA values include current WTA values as in baseline plusAlternative assessment local resources and demand resources from existing transfers
ERWT 239 258 209AGUA 489 429 489AGUA/ERWT (%) 49% 60% 43%
Note: Values are in liters of ecosystem-equivalent water per cubic meter supplied (L ecosystem-eq. m−3 supplied).WTA = withdrawal-to-availability ratio; ERWT = Ebro River water transfer.
Munoz et al., LCA of Water Supply Plans in Mediterranean Spain 915

R E S E A R C H A N D A N A LYS I S
recent years is based on the supposedly higher en-ergy intensity and greenhouse gas emissions of theformer, due to the energy demand of seawater de-salination. Although seawater desalination on itsown certainly involves a higher energy demand,the AGUA Programme also uses fewer energy-demanding water resources, such as water reuseand local freshwater from surface and groundwa-ter sources. As a consequence, the overall energydemand and CO2 emissions per cubic meter sup-plied, according to the AGUA Programme, aresimilar to or even lower than those related to theERWT. Nevertheless, the results also show thatwater supply in the Mediterranean regions is un-dergoing an increase in energy intensity and CO2
emissions, as compared to earlier decades.Concerning impacts on freshwater resources,
the FEI indicator shows that the AGUA Pro-gramme has an impact 49% lower than theERWT, because the former is based to a great ex-tent (75%) on alternative water resources, suchas seawater and wastewater, whereas the ERWTconsidered only freshwater abstraction from a sin-gle river. Nonetheless, the FEI method also al-lowed us to show the high level of water stressin the basins affected by the AGUA Programme,where in some cases water demand exceeds avail-able resources. In spite of this, a supply-drivenrather than demand-driven water supply system isstill favored by the authorities. According to Al-biac and colleagues (2007), achieving sustainablemanagement of water resources in Spain shouldinvolve the combination of water demand andsupply management measures adapted to eachbasin, including aquifer overexploitation control,water markets, and desalination.
From a methodological point of view, the FEImethod has been proven to be a useful and op-erative approach to assess impacts on freshwaterresources, an issue omitted until recently in LCAstudies. A future step should be to apply otherexisting methods to check the robustness of ourresults and potential divergences between thesemethods. A methodological challenge remainingfor LCA studies involving desalination is the de-velopment of characterization models to includethe toxicity in seawater of hypersaline brine. Un-til such models are developed, a fair comparisonof toxicity-related impacts of water supply, in-cluding desalination, is not possible.
Acknowledgments
We thank the Spanish Ministry of Educationand Science for its financial assistance (ContractCSD2006–44).
Note
1. Programa AGUA: Actuaciones Para la Gestion y laUtilizacion del Agua (actions for the managementand use of water).
References
Abdel-Jawad, M., S. Ebrahim, M. A1-Tabtabaei, andS. Al-Shammari. 1999. Advanced technologiesfor municipal wastewater purification: Technicaland economic assessment. Desalination 124(1–3):251–261.
Albiac, J., M. Hanemann, J. Calatrava, J. Uche, andJ. Tapia. 2007. The rise and fall of the Ebro wa-ter transfer. Natural Resources Journal 46(3): 727–757.
Algra, D. 2002. Environmental impact of drinkingwater: A life cycle analysis of the drinking wa-ter systems for the region of Barcelona. IVEM-doctoraalverlsag nr. 150, University of Gronin-gen, Groningen, the Netherlands.
Althaus, H. J., M. Chudacoff, R. Hischier, N. Jung-bluth, M. Osses, and A. Primas. 2007. Life cy-cle inventories of chemicals. Final report ecoinventdata v2.0. Vol. 8. Dubendorf, Switzerland: SwissCentre for LCI, Empa–TSL.
ATLL (Aigues Ter Llobregat). 2009. Memoria 2008Aigues Ter Llobregat. [Aigues Ter Llobregat 2008report.] Barcelona, Spain: Departament de MediAmbient i Habitatge, Generalitat de Catalunya.
Bayart, J. B., C. Bulle, A. Koehler, M. Margni, S. Pfister,F. Vince, and L. Deschenes. 2010. A frameworkfor assessing off-stream freshwater use in LCA.International Journal of Life Cycle Assessment 15(5):439–453.
Confederacion Hidrografica del Ebro. 2009. www.chebro.es/. Accessed 8 September 2009.
Confederacion Hidrografica del Jucar. 2009. De-scripcion general. [General description.]www.chj.es/cgi-bin/cuenca.asp. Accessed 8September 2009.
Confederacion Hidrografica del Segura. 2009.Resumen de datos basicos: Balance. [Sum-mary of basic data: Balance.] www.chsegura.es/chs/cuenca/resumendedatosbasicos/balance/. Accessed 8 September 2009.
916 Journal of Industrial Ecology

R E S E A R C H A N D A N A LYS I S
Departament de Medi Ambient. 1992. Pla Hidrologicde les Conques Internes de Catalunya. [Hydro-logical plan for the Internal Basins of Catalo-nia.] Barcelona, Spain: Departament de PolıticaTerritorial i Obres Publiques, Generalitat deCatalunya.
Downward, S. R. and R. Taylor. 2007. An assessment ofSpain’s Programa AGUA and its implications forsustainable water management in the province ofAlmerıa, southeast Spain. Journal of Environmen-tal Management 82(2): 277–289.
European Commission. 2004. Your request for anopinion concerning four projects related to theproposed transfer of water from the River Ebro.Directorate-General Environment. www.mma.es/secciones/agua/pdf/informesphncon/ue_reponse_ebro.pdf. Accessed 28 July 2009.
FAO (Food and Agriculture Organization of theUnited Nations). 2009. Aquastat: Global infor-mation system on water and agriculture. www.fao.org/nr/water/aquastat/main/index.stm. Accessed21 July 2009.
Frischknecht, R. and N. Jungbluth. 2007. Implemen-tation of life cycle assessment methods. Ecoinventreport No. 3. Dubendorf, Switzerland: Swiss Cen-tre for Life Cycle Inventories.
Frischknecht, R., R. Steiner, A. Braunschweig, N.Egli, and G. Hildesheimer. 2006. Swiss ecolog-ical scarcity method: The new version 2006. Pa-per presented at the Seventh International Con-ference on EcoBalance, 14 − 16 November,Tsukuba, Japan.
Gimenez, G. 2009. Personal communication with G.Gimenez, agricultural engineer, Comunidad deregantes Sol Poniente, Almerıa, 6 April 2009.
Guinee, J. B., M. Gorree, R. Heijungs, G. Huppes, andR. Kleijn. 2004. Life cycle assessment: An opera-tional guide to ISO standards. Leiden, the Nether-lands: Centre of Environmental Science, LeidenUniversity (CML).
Ibanez, C. and N. Prat. 2003. The environmental im-pact of the Spanish National Hydrological Planon the Lower Ebro River Delta. International Jour-nal of Water Resources Development 19(3): 485–500.
Instituto Nacional de Estadıstica. 2007. Encuesta sobreel suministro y saneamiento del agua. Ano 2007.[Survey on water supply and sanitation. Year2007.] www.ine.es/jaxi/menu.do?type=pcaxis&path=%2Ft26%2Fp067%2Fp01&file=inebase&L=. Accessed 8 September 2009.
Instituto Nacional de Estadıstica. 2008. Estadısticase indicadores del agua. 2008. [Statisticsand indicators on water. 2008.] www.ine.es/
revistas/cifraine/0108.pdf. Accessed 8 September2009.
ISO (International Organization for Standardization).2006. ISO 14044: Environmental management—life cycle assessment—requirements and guidelines.Geneva, Switzerland: ISO.
Junta de Andalucıa. 2008. Medio Ambiente en An-dalucıa. Informe 2007. [The environment in An-dalucıa. 2007 report.] Seville, Spain: Consejerıade Medio Ambiente.
Kellenberger, D., H. J. Althaus, N. Jungbluth, andT. Kunniger. 2007. Life cycle inventories of build-ing products. Final report ecoinvent 2000. Vol.7. Dubendorf, Switzerland: Swiss Centre for LCI,EMPA-DU.
Lassaux, S., R. Renzoni, and A. Germain. 2007. Lifecycle assessment from the pumping station to thewastewater treatment plant. International Journalof Life Cycle Assessment 12(2): 118–126.
Lundie, S., G. M. Peters, and P. C. Beavis. 2004. Lifecycle assessment for sustainable metropolitan wa-ter systems planning. Environmental Science andTechnology 38(13): 3465–3473.
Madwal, K. and H. Tarazi. 2002. Desalination tech-niques for industrial wastewater reuse. Desalina-tion 152(1–3): 325–332.
Meerganz von Medeazza, G. L. 2005. “Direct” andsocially-induced environmental impacts of desali-nation. Desalination 185(1–3): 57–70.
Mila i Canals, Ll., J. Chenoweth, A. Chapagain, S. Orr,A. Anton, and R. Clift. 2009. Assessing freshwa-ter use impacts in LCA: Part I—inventory model-ing and characterization factors for the main im-pact pathways. International Journal of Life CycleAssessment 14(1): 28–42.
Ministerio de Medio Ambiente. 2000. Plan HidrologicoNacional: Analisis de los sistemas hidraulicos.[National Hydrological Plan: Hydraulic systemsanalysis.] Madrid, Spain: Spanish Ministry of theEnvironment.
Ministerio de Medio Ambiente. 2002. PlanNacional de Regadıos. [National Irri-gation Plan.] www.mapa.es/es/desarrollo/pags/pnr/principal.htm. Accessed 31 July 2009.
Ministerio de Medio Ambiente. 2005. Informe desostenibilidad ambiental de las actuaciones ur-gentes del programa A.G.U.A. en las cuencasmediterraneas. [Environmental sustainability ofthe AGUA Programme’s urgent actions in theMediterranean Basin.] Madrid, Spain: SpanishMinistry of the Environment.
Ministerio de Medio Ambiente. 2008. Plan Nacional In-tegrado de Residuos (PNIR) 2008–2015. [NationalIntegrated Waste Management Plan 2008–2015.]
Munoz et al., LCA of Water Supply Plans in Mediterranean Spain 917

R E S E A R C H A N D A N A LYS I S
version preliminar [draft]. Madrid, Spain: SpanishMinistry of the Environment.
Ministerio de Medio Ambiente. 2009. Programa Agua[Program Agua]. www.mma.es/secciones/agua/entrada.htm. Accessed 28 July 2009.
Munoz, I., and A. Rodrıguez. 2008. Reducing the envi-ronmental impacts of reverse osmosis desalinationby using brackish groundwater resources. WaterResearch 42(3): 801–811.
Munoz, I., Ll. Mila i Canals, and G. Doka. 2007. A sim-ple model to include human excretion and wastewatertreatment in life cycle assessment of food products.CES Working Papers, 01/07. Surrey, UK: Centrefor Environmental Strategy, University of Surrey.
Munoz, I., M. J. Gomez, A. Molina-Dıaz, M. A. J.Huijbregts, A. R. Fernandez-Alba, and E. Garcıa-Calvo. 2008a. Ranking potential impacts of prior-ity and emerging pollutants in urban wastewaterthrough life cycle impact assessment. Chemosphere74(1): 37–44.
Munoz, I., Ll. Mila i Canals, and R. Clift. 2008b. Con-sider a spherical man: A simple model to includehuman excretion in life cycle assessment of foodproducts. Journal of Industrial Ecology 12(4): 520–538.
Munoz, I., A. Rodrıguez, A. Rosal, and A. R. Fernandez-Alba. 2009. Life cycle assessment of urbanwastewater reuse with ozonation as tertiary treat-ment: A focus on toxicity-related impacts. Scienceof the Total Environment 407(4): 1245–1256.
OECD (Organization for Economic Co-operation andDevelopment). 2008. Environmental performanceof agriculture in OECD countries since 1990. Paris:OECD.
Pfister, S., A. Koehler, and S. Hellweg. 2009. As-sessing the environmental impacts of freshwaterconsumption in LCA. Environmental Science andTechnology 43(11): 4098–4104.
Pre Consultants. 2008. SimaPro 7. www.pre.nl/simapro/. Accessed 28 July 2009.
Raluy G., L. Serra, J. Uche, and A. Valero. 2005. Lifecycle assessment of water production technolo-gies. Part 2: Reverse osmosis desalination versus
the Ebro river transfer. International Journal of LifeCycle Assessment 10(5): 346–354.
Rouge, P. 2005. Evaluacion tecnica y economica delas tecnologıas de regeneracion de aguas. [Tech-nical and economic assessment of water recla-mation.] Paper presented at the conference Jor-nades Tecniques La integracio de l’aigua regen-erada en la gestio dels recursos: El paper dina-mitzador del territori, 19–20 October, Lloret deMar, Barcelona.
Stokes, J. and A. Horvath. 2009. Energy and air emis-sion effects of water supply. Environmental Scienceand Technology 43(8): 2680–2687.
Swiss Centre for Life Cycle Inventories. 2009.www.ecoinvent.ch/. Accessed 28 July 2009.
Tangsubkul, N., K. Parameshwaran, S. Lundie, A. G.Fane, and T. D. Waite. 2006. Environmental lifecycle assessment of the microfiltration process.Journal of Membrane Science 284(1–2): 214–226.
Vince, F., E. Aoustin, P. Breant, and F. Marechal. 2008.LCA tool for the environmental evaluation ofpotable water production. Desalination 220(1–3):37–56.
About the Authors
Ivan Munoz was a research fellow at theDepartment of Hydrogeology and AnalyticalChemistry, University of Almeria (Spain), atthe time the article was written. He is cur-rently environmental sustainability scientist inUnilever’s Safety and Environment AssuranceCentre (SEAC) group, Unilever Colworth(UK). Llorenc Mila i Canals is environmen-tal sustainability scientist in Unilever’s SEACgroup, Unilever Colworth (UK). Amadeo R.Fernandez-Alba is professor of chemistry at theDepartment of Hydrogeology and AnalyticalChemistry, University of Almeria (Spain) andresearcher of the Madrid Institute of AdvancedStudies in Water Technologies—IMDEA Agua.
Supplementary Material
Additional Supplementary Material may be found in the online version of this article:
Supplement S1: Comprehensive inventory tables for all the processes modeled in the study.
Please note: Wiley-Blackwell is not responsible for the content or functionality of any supple-mentary materials supplied by the authors. Any queries (other than missing material) should bedirected to the corresponding author for the article.
918 Journal of Industrial Ecology