Embed Size (px)
Citation preview

INTEGRATED MASTER IN ENVIRONMENTAL ENGINEERING 2012/2013
LIFE CYCLE ASSESSMENT OF TWO TEXTILE PRODUCTS
WOOL AND COTTON
ALBINO ANDRÉ MOREIRA CARDOSO
Dissertation submitted for the degree of
MASTER ON ENVIRONMENTAL ENGINEERING
President of the jury: Prof. Dr. Cidália Maria de Sousa Botelho
(Assistant Professor from the Department of Chemical Engineering from the Faculty of Engineering, Porto University, Portugal)
___________________________________________________________ Supervisor at the University: Prof. Dr. Belmira de Almeida Ferreira Neto
(Assistant Professor from the Department of Metallurgical and Materials Engineering from the Faculty of Engineering, Porto University, Portugal)
Supervisor at the hosting institution: Dr. Mireille Faist Emmenegger (Director, operations, project manager of Quantis Switzerland/Germany. Formerly
researcher at Empa)
September 2013


Master Thesis LCA of Two Textile Products: Wool and Cotton
i
Abstract
The textiles represent the fourth largest manufacturing industry worldwide in terms of
revenues and production. This sector leads to significant burdens in the environment due to
the activities taking place during the yarn fibre manufacture including the raw fibre
production (agriculture), spinning, dyeing and finishing processes. Therefore, it is very
important to assess the impacts and find ways to reduce its impacts and improve the
environmental performance of this industrial sector.
In the present study the life cycle stages associated with the processing wool and cotton are
assessed based on real data obtained from some of the company (i.e. HUGO BOSS)
suppliers’ activity in 2011. It comprises the production of raw fibre (sheep farming and
cotton cultivation), spinning, dyeing, dyeing & bleaching and scouring wool. The analysis was
performed with the SimaPro software using ILCD impact assessment method and results are
presented for the characterization step. The method allowed the quantification of potential
environmental impacts at midpoint and the selected impact categories were: climate change,
ozone depletion, human toxicity cancer effects, human toxicity non-cancer effects,
eutrophication (freshwater and marine), freshwater ecotoxicity and water resource depletion.
The inventories were built using primary data made available by suppliers and secondary
data was estimated based on existing models (mainly to model agriculture emissions) or
taken from the ecoinvent databases. Results are analysed life cycle stage by life cycle stage
for each material. Scenarios were created in order to assess the multiple combinations
possible for the production of cotton and wool yarns based on the distinct processes taking
part at each supplier. A worst and a best case scenarios are built that both materials can be
compared in terms of impact.
Results show that in general, the field emissions in raw fibre production (more specifically the
livestock emissions in sheep farming and the losses in the fertilizers to the environment in
the cotton cultivation) show to contribute largely to the overall environmental impact
categories studied. The production of fertilizers is another activity that shows a relevant
pressure in the environment.
The results concerning the spinning processes show that the large electricity demand and
electricity production leads to the major contribution in the cotton and the wool yarns
manufacture. Water use, packaging and chemicals production (mainly in wool’s spinning
mills) also contribute significantly to environment problems. The dyeing (and bleaching) and
scouring wool as a wet processes need considerable amounts of water and that is very much
associated with the energy needed for heating and cooling baths and for drying yarns or
fibres. Activities which are not directly associated to the company activity as the production
of wire used for packaging and transoceanic transports emerge as important contributors in
most of the categories for the scouring mill.

Master Thesis LCA of Two Textile Products: Wool and Cotton
ii
When the entire supply chain is analysed it is observed that the raw fibre production (named
as sheep farming for wool and cotton cultivation for cotton) is the life cycle stage that is the
main contributor to the impacts. In the worst case scenario, wool yarns have the largest
impacts in the overall results except for freshwater eutrophication and water resource
depletion. When a best case scenario is regarded, cotton has the largest burdens in
categories as freshwater eutrophication, marine eutrophication, freshwater ecotoxicity and
water resource depletion.
Keywords:
Life Cycle Assessment (LCA) | Textiles | Cotton | Wool | Sheep farming | Cotton cultivation |
Scouring wool | Spinning | Dyeing | Bleaching

Master Thesis LCA of Two Textile Products: Wool and Cotton
iii
Acknowledgments
I would like to express my gratitude to my supervisor at FEUP, Belmira Neto, for the useful
comments, remarks and engagement throughout the process of this master thesis; for the
excellent opportunity which she created for the students to learn more about LCA in
Academia SimaPro - group which made my motivation in this field grow up.
Furthermore I would like to thank my supervisor at EMPA, Mireille Faist, for the fantastic
opportunity offered to do my internship with her, for introducing me to the topic, for the
support on the way and great reception in Switzerland.
I would like to thank my team in HUGO BOSS for its assistance, guidance and for letting me
to use this data for my master thesis: Daniele Massetti, Heinz Zeller, Michela Gioacchini and
Paola Mugavero. I'm very grateful for the opportunity I have to work with you and,
consequently, to continue my studies on this field.
I’m very grateful to all the people I met in EMPA and ecoinvent for your support, good
discussions, great chocolates, coffee breaks and, of course, for the kendama training! For all
of these I wish to thanks Andrea Del Dulce, Ibrahim Ismail, Simon Gmuender, Rainer Zah,
Juergen Reinhard, Tereza Lévová, Linda Wegelin, Emilia Moreno Ruiz, Gregor Wernet,
Dominic Notter and Hans-Jörg Althaus.
I am indebted to my many friends who supported me at several levels during the last years. I
wish to thank you very much:
- Catarina Carneiro for the unforgettable support and care;
- João Carvalho who I completely admire its friendship, knowledge (and guitar skills) -
thank you for your fellowship and help throughout these years at FEUP;
- Isabel Ramos, Bruno Martins, Filipe Marques, Frederico Leite, João Carvalho and
Paulo Carvalho for all the good times we had and support you offer;
- Sr. Abel and Dona Palmira whose friendship was more than that;
- Nuno Rocha for the important help and guidance during my first years at FEUP.
For the time we have been studying, working and sharing knowledge I want to thanks: Ana
Cardoso, Ana Cavadas, Eduardo Ventura, Emanuel Costa, Franklim Cardozo, Nuno Silva,
Manuel Macedo, Maria Oliveira and all the other colleagues I had the pleasure to work with
during the last 5 years.
I would like to thank Eleni, Nara, Ibrahim, Jamile, Ana, Georgi, Sohini and Joeri for the
fantastic fellowship and for the cultural experiences shared in Switzerland.
Last but certainly the most important, I would like to thank my parents, sisters, nieces and my
brothers-in-law for their endless love and entire support. I will be grateful forever for your
love, help and teachings.

Master Thesis LCA of Two Textile Products: Wool and Cotton
iv

Master Thesis LCA of Two Textile Products: Wool and Cotton
v
Contents
Abstract ......................................................................................................................................................................... i
Acknowledgments .................................................................................................................................................. iii
Contents ...................................................................................................................................................................... v
List of Figures ............................................................................................................................................................ ix
List of Tables ............................................................................................................................................................. xi
Lists of abbreviations ........................................................................................................................................... xiii
1 INTRODUCTION .............................................................................................................................................. 1
1.1 EcoLogText ............................................................................................................................................... 2
1.2 Thesis objective and goal ................................................................................................................... 3
1.3 Thesis outline .......................................................................................................................................... 4
2 CHARACTERIZATION OF THE LIFE CYCLE STAGES ............................................................................. 5
2.1 Wool life cycle stages: sheep farming and scouring wool ..................................................... 6
2.2 Cotton life cycle stages: cultivation and ginning ....................................................................... 7
2.3 Mechanical and chemical processes for dyed yarn production (for wool and cotton)
8
2.4 Environmental aspects from the production of textiles .......................................................... 9
2.4.1 Water consumption .................................................................................................................. 11
2.4.2 Energy consumption ................................................................................................................ 12
2.4.3 Air Emissions................................................................................................................................ 12
2.4.4 Soil emissions .............................................................................................................................. 13
2.4.5 Solid waste production ............................................................................................................ 13
2.3 Overview of LCA studies for textile products: cotton and wool ....................................... 14
3 THE LIFE CYCLE ASSESSMENT METHODOLOGY .............................................................................. 17
3.1 LCA methodological phases ........................................................................................................... 17
3.2 Goal and Scope of the study .......................................................................................................... 19
3.2.1 System boundaries .................................................................................................................... 20
3.2.2 Allocation process ..................................................................................................................... 23
3.3 Inventory analysis ............................................................................................................................... 23
3.3.1 Inventory for sheep farming .................................................................................................. 24
3.3.2 Inventory for cotton cultivation ........................................................................................... 28

Master Thesis LCA of Two Textile Products: Wool and Cotton
vi
3.3.3 Inventory of mechanical and chemical processes for dyed yarn production ..... 32
3.3.4 Datasets from ecoinvent ......................................................................................................... 36
3.4 Impact assessment ............................................................................................................................. 36
4 RESULTS AND DISCUSSION ..................................................................................................................... 39
4.1 LCA of Wool Yarns .............................................................................................................................. 39
4.1.1 Sheep farming............................................................................................................................. 39
4.1.2 Scouring wool ............................................................................................................................. 43
4.1.3 Spinning ........................................................................................................................................ 46
4.1.4 Dyeing ............................................................................................................................................ 51
4.2 LCA of Cotton Yarns .......................................................................................................................... 54
4.2.1 Cotton cultivation ...................................................................................................................... 54
4.2.2 Spinning ........................................................................................................................................ 57
4.2.3 Dyeing and bleaching .............................................................................................................. 60
5 ANALYSING SCENARIOS FOR YARN PRODUCTION (COTTON AND WOOL) ....................... 63
5.1 Identifying and assessing all scenarios ....................................................................................... 63
5.1.1 Wool yarns ................................................................................................................................... 64
5.1.2 Cotton yarns ................................................................................................................................ 66
5.2 Analysing the best and worst results from scenarios ........................................................... 67
5.2.1 Wool yarns ................................................................................................................................... 68
5.2.2 Cotton yarns ................................................................................................................................ 70
5.3 Comparative analysis of cotton and wool ................................................................................. 72
6 CONCLUSIONS.............................................................................................................................................. 75
7 RECOMMENDATIONS FOR FUTURE WORKS .................................................................................... 79
Bibliographic references ..................................................................................................................................... 81
Appendixes .............................................................................................................................................................. 85
Appendix A: ecoinvent datasets used for energy ..................................................................................... 87
ELECTRICITY ................................................................................................................................................... 87
HEAT ................................................................................................................................................................. 87
Appendix B: ecoinvent datasets used for agriculture (sheep farming and cotton cultivation) 89
MACHINERY ................................................................................................................................................... 89
FEEDSTUFF ...................................................................................................................................................... 89
FERTILIZERS .................................................................................................................................................... 89
Master Thesis LCA of Two Textile Products: Wool and Cotton
vii
PESTICIDES ..................................................................................................................................................... 90
CHEMICAL TREATMENTS OF SHEEP AND COTTON SEEDS ......................................................... 90
EMISSIONS ..................................................................................................................................................... 91
Appendix C: ecoinvent datasets used for packaging materials ........................................................... 93
Appendix D: ecoinvent datasets used for water, wastewater treatment and water emissions 95
WATER CONSUMPTION ............................................................................................................................ 95
WASTEWATER TREATMENT PLANT ...................................................................................................... 95
WATER EMISSIONS ..................................................................................................................................... 96
Appendix E: ecoinvent datasets used for chemicals, dyestuffs and auxiliaries .............................. 97
Appendix F: ecoinvent datasets used for transports ............................................................................... 99
Appendix G: ecoinvent datasets used for solid waste........................................................................... 101
Appendix H: Heavy metal content in fertilizers, wool and cotton .................................................... 103
HEAVY METALS IN WOOL ...................................................................................................................... 103
HEAVY METALS IN FERTILIZERS ........................................................................................................... 104
HEAVY METALS UPTAKE IN COTTON ................................................................................................ 105
Appendix I: Selection of the best supplier for sheep farming............................................................ 106

Master Thesis LCA of Two Textile Products: Wool and Cotton
viii

Master Thesis LCA of Two Textile Products: Wool and Cotton
ix
List of Figures
Figure 1 - Main life cycle stages of the supply chain for wool. The assembly, use phase and
the final disposal is here disregarded. Transports link the presented stages ................................... 5
Figure 2- Main life cycle stages of the supply chain for cotton. The assembly, use phase and
the final disposal is here disregarded. Transports link the presented stages ................................... 6
Figure 3 - Main environmental aspects associated with the textile industry: from the raw fibre
to the finished textile product [26]. ................................................................................................................ 10
Figure 4 - Phases of a LCA study [10]. ........................................................................................................... 17
Figure 5 - Life cycle stages processes associated to the production of seed cotton and greasy
wool. ........................................................................................................................................................................... 21
Figure 6 – Life cycle stages processes associated to the mechanical and chemical processes
for dyed yarn production (activities occurring after ginned cotton and greasy wool
production). ............................................................................................................................................................. 22
Figure 7 - Relative contribution of each activity to the overall impact for F1, F2 and F3. ......... 41
Figure 8 - Relative contribution of each activity to the overall impact for scouring wool. ....... 44
Figure 9 - Relative contribution of each activity to the overall impact for spinning mills. ....... 48
Figure 10 - Relative contribution of each activity to the overall impact for dyeing mills (D1,
D2 and D3) ............................................................................................................................................................... 52
Figure 11 - Relative contribution of each activity to the overall impact for conventional and
organic cotton production. ............................................................................................................................... 55
Figure 12 - Relative contribution of each activity to the total impact in spinning mills S1 and
S2. ................................................................................................................................................................................ 58
Figure 13 - Relative contribution of each activity to the total impact in both dyeing &
bleaching mills. ...................................................................................................................................................... 61
Figure 14 - Supply chain for the production of cotton and wool dyed yarns regarding to the
suppliers assessed and its rate of raw fibre conversion. ........................................................................ 63
Figure 15 - Results for wool yarn combinations ....................................................................................... 65
Figure 16 - Results for cotton yarn combinations. ................................................................................... 67
Figure 17 – LCA results for the worst and best cases studied for wool dyed yarn production.
Results for the production of 1 kg of dyed yarn. ...................................................................................... 68
Figure 18 – Relative contribution of each life cycle stage to the total impact in the wool case
scenarios: worst and best. Results for the production of 1 kg of dyed yarn. ................................. 69
Figure 19 - LCA results for the worst, average and best cases studied for cotton dyed yarn
production. Results for the production of 1 kg of dyed yarn. ............................................................. 70
Figure 20 - Relative contribution of each life cycle stage to the total impact in the cotton case
scenarios: worst, average and best. Results for the production of 1 kg of dyed yarn. ............... 70
Figure 21 - Relative impact of each product (wool and cotton) for worst and best case
scenarios. Results for the production of 1 kg of dyed yarn. ................................................................. 72

Master Thesis LCA of Two Textile Products: Wool and Cotton
x

Master Thesis LCA of Two Textile Products: Wool and Cotton
xi
List of Tables
Table 1 – Textile fibres [2] ..................................................................................................................................... 1
Table 2 - Specific water pollutants caused by the processing of textiles per process of the life
cycle stages [29]. ................................................................................................................................................... 11
Table 3 - Benchmarks values for electricity, heat and water consumption taken from BAT for
wool and cotton[12]. ............................................................................................................................................ 12
Table 4 - Sources of air emissions in textile industry.[2] ........................................................................ 13
Table 5 - Major sources of soil emissions in the textile industry [33, 34]. ....................................... 13
Table 6 – Sources of solid waste generation in the textile industry [35]. ........................................ 13
Table 7 - Set of selected studies regarding LCA and LCIA of cotton and wool. ........................... 16
Table 8 – Data provided from suppliers for wool and cotton productions for 2011. ................. 19
Table 9 - Products (underlined) and by-products produced by the suppliers and the
allocation factors used. ....................................................................................................................................... 23
Table 10 – Profile of the assessed farms ...................................................................................................... 24
Table 11 – Inventory of inputs for the life cycle stage of sheep farming. Values related to the
FU of 1 kg of greasy wool produced. ............................................................................................................ 25
Table 12 – Inventory of emissions to air, water and soil from sheep farming. Values related to
the FU: 1kg of pollutant per 1 kg of greasy wool produced. ............................................................... 27
Table 13 - Inventory of inputs for the life cycle stage of cotton cultivation. Values related to
the FU of 1 kg of ginned cotton] .................................................................................................................... 29
Table 14 - Inventory of emissions to air, water and soil from cotton cultivation. Values related
to the FU: 1kg of pollutant per 1 kg of ginned cotton produced. ..................................................... 31
Table 15 - Life cycle stage inputs for scouring, dyeing, dyeing & bleaching and spinning. .... 33
Table 16 – Water emissions from wet processes of scouring and dyeing wool reported as
kilogram of compound per FU (wool top and dyed product, respectively). .................................. 34
Table 17 –Inventory of solid waste production per type of final disposal ...................................... 35
Table 18 – Air emissions from the spinning mill S2. Values reported to the functional unit of 1
kg of cotton yarn ................................................................................................................................................... 35
Table 19 – Location of the datasets utilized in the appendixes. ......................................................... 36
Table 20 – Results from sheep farming (case study: F1, F2, F3) and its relative contribution to
the maximum value calculated for each category. ................................................................................... 39
Table 21 - Results from the scouring mill. ................................................................................................... 43
Table 22 - Results of spinning activity of each case study and its relative contribution to the
maximum value calculated for each category............................................................................................ 46
Table 23 - Results of dyeing mills activity and its relative contribution to the maximum value
calculated for each category. ............................................................................................................................ 51
Table 24 - Results from cotton cultivation (conventional and organic) and its relative
contribution to the maximum value calculated for each category. ................................................... 54

Master Thesis LCA of Two Textile Products: Wool and Cotton
xii
Table 25 - Results of spinning activity of each case study and its relative contribution to the
maximum value calculated for each category............................................................................................ 57
Table 26 - Results of dyeing & bleaching activity of each case study and its relative
contribution to the maximum value calculated for each category .................................................... 60
Table 27 - Number of combinations possible for the production of dyed wool yarns. ............. 64
Table 28 - Number of combinations possible for the production of dyed cotton yarns .......... 66
Table 29 – Selected suppliers to draw the wool and cotton supply chains for each one of the
defined cases: best and worst. ......................................................................................................................... 68
Master Thesis LCA of Two Textile Products: Wool and Cotton
xiii
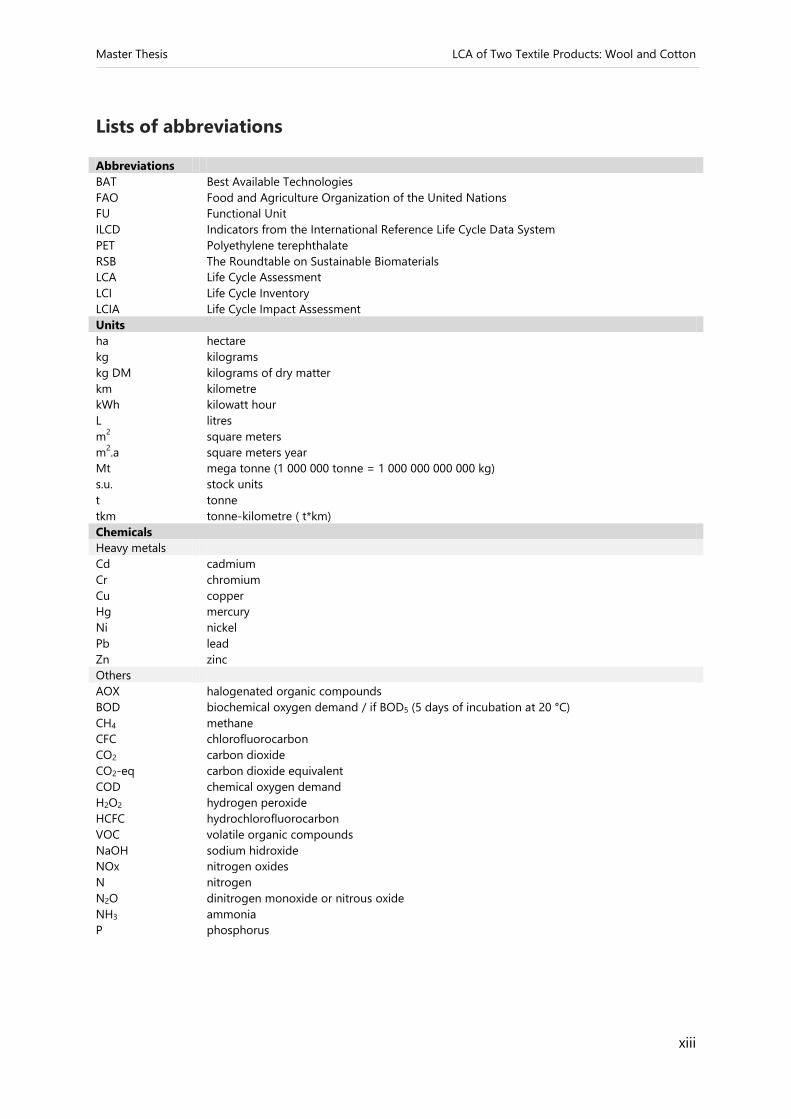
Lists of abbreviations
Abbreviations
BAT Best Available Technologies
FAO Food and Agriculture Organization of the United Nations
FU Functional Unit
ILCD Indicators from the International Reference Life Cycle Data System
PET Polyethylene terephthalate
RSB The Roundtable on Sustainable Biomaterials
LCA Life Cycle Assessment
LCI Life Cycle Inventory
LCIA Life Cycle Impact Assessment
Units
ha hectare
kg kilograms
kg DM kilograms of dry matter
km kilometre
kWh kilowatt hour
L litres
m2 square meters
m2.a square meters year
Mt mega tonne (1 000 000 tonne = 1 000 000 000 000 kg)
s.u. stock units
t tonne
tkm tonne-kilometre ( t*km)
Chemicals
Heavy metals
Cd cadmium
Cr chromium
Cu copper
Hg mercury
Ni nickel
Pb lead
Zn zinc
Others
AOX halogenated organic compounds
BOD biochemical oxygen demand / if BOD5 (5 days of incubation at 20 °C)
CH4 methane
CFC chlorofluorocarbon
CO2 carbon dioxide
CO2-eq carbon dioxide equivalent
COD chemical oxygen demand
H2O2 hydrogen peroxide
HCFC hydrochlorofluorocarbon
VOC volatile organic compounds
NaOH sodium hidroxide
NOx nitrogen oxides
N nitrogen
N2O dinitrogen monoxide or nitrous oxide
NH3 ammonia
P phosphorus

Master Thesis LCA of Two Textile Products: Wool and Cotton
xiv

Master Thesis LCA of Two Textile Products: Wool and Cotton
1
1 INTRODUCTION
The textiles represent the fourth largest manufacturing industry worldwide in terms of
revenues and production. The apparel sector is forming the most representative sector of
this industry [1]. The textile industries are responsible for the production of yarn, fabric, and
finished goods from natural or manmade fibers. Table 1 shows the different materials
possible to produce from natural and man-made fibers.
Table 1 – Textile fibres [2]
Categories Sub-Categories Example of fibres
Natural Fibers
Organic
Vegetable fibers
Cotton
Flax, Hemp
Jute, Sisal, Broom
Animal fibers Wools
Silk
Inorganic Mineral fibers Basalt
Asbestos
Manmade fibers
Organic regenerated natural fibers
Regenerated cellulose
Viscose
Cellulose acetate
Cellulose triacetate
Organic synthetic polymers
Polyester
Polyamide
Polyolefins
Polyacrilic
Inorganic fibers Glass
Carbon
The fiber production and consumption are increasing annually due to the population growth,
the increasing fiber consumption with increasing per capita prosperity and the continual
increasing of new applications for textiles
The clothing and textiles constitute about seven per cent of the world’s exports in terms of
sales. About one third of the sales were made in Western Europe, the same amount in North
America and one quarter in Asia. In 2000 the industry employed 26.5 million people
worldwide. More than 25 per cent of the world’s production of clothing and textiles is made
in China [3]. The volume of the world’s fiber production, associated to the textile industry in
2012, was around 88.5 Mt, from which 56 Mt were manmade (40% polyester) and 32.5 Mt
natural fibers (80% cotton) [4]. Summing up synthetic fibers does represent 64% of the
overall amount of the production of textile fibers.
Cotton and wool are the world‘s most produced natural fibers. FAO in 2011 estimated a
production of 26.1 Mt for cotton and 2.0 Mt for wool. China, United States and India are the
three world level largest producers of cotton with productivity yields amounting respectively
6.58, 5.98 and 3.41 Mt. In the same year, the annual wool production is around 2.0 Mt. China
has a share of 0.39 Mt, Australia 0.36 Mt and New Zealand 0.17 Mt [5, 6].

Master Thesis LCA of Two Textile Products: Wool and Cotton
2
The World Bank estimates that 17 to 20 per cent of industrial water pollution comes from
textile industry, mainly from the operations of dyeing and finishing. This sector is the second
main contributor to clean water pollution. This is associated with the large amounts of water
used, the energy needed to heat water and the large quantities of chemicals used in these
processes[7].
The consumer’s consciousness for textile products produced in more environmentally
friendly way is increasing every time. At the same time its price is also an important criterion
for purchasing. The pressure in this industry is promoted by markets which demand products
with superior performance and quality as well as by regulations for sustainability and cleaner
production. This is a strong motive for the textile companies to focus more and more on the
production of sustainable products regarding its supply chain.
It is now clear that optimizations in the management performance of the supply chains turns
it possible to achieve higher profits and improve the social and environmental performance
of the business sector [8]. To improve this in a company or industry, it is necessary to
understand how the supply chain system works, which symbiosis exists and where the
opportunities to improve those relationships are. In an environmental point of view, life cycle
assessment is an important tool used to evaluate the environmental burdens over the entire
life-cycle of products and services. This tool analyses all the life cycle stages of products from
raw material extraction to production process, distribution, use, and final disposal. It offers a
holistic perspective of the supply chain performance and can help decision makers on
identifying more efficient supply chains.
1.1 EcoLogText
The work presented is part of my internship tasks in the EcoLogTex project, at the Life Cycle
Assessment and Modelling Group of EMPA (the Swiss Federal Laboratories for Materials
Science and Technology) in collaboration with HUGO BOSS and IDSIA (Istituto Dalle Molle di
Studi sull'Intelligenza Artificiale). Currently, due to a spin-off to the new branch of Quantis
(Quantis Switzerland / Germany), the EMPA’s group doesn’t exist anymore and the project is
now developed by the latter mentioned organization (Quantis).
The project EcoLogTex aims to deliver a new methodology and a tool (web-based software
application) to evaluate alternatives for the textile supply chains taking into account the
impact on the environment, while satisfying corporate social responsibility constraints. The
results of this project will allow the textile companies to efficiently optimize their supply
chains and suppliers to benchmark themselves. The integration of LCA in each step of the
supply chain for the textile industry might add the environmental perspective when
designing a more environmentally effective supply chain [9]. Questionnaires specific for the
different life cycle stages of the supply chain for the two textile products in focus (cotton and
wool) have been developed and sent to HUGO BOSS’ suppliers and to other companies
active in its supply chains (cotton growers, spinning mills, dyeing mills, finishing companies,

Master Thesis LCA of Two Textile Products: Wool and Cotton
3
assembly etc.), in order to obtain data used to assess the different processes from the life
cycle of textile production.
The information is made available from the suppliers or estimated. The data considered
includes specific data from companies as the consumption of energy, chemicals and water
and production of waste as well as emissions in water and air and soil. The values were
modelled into an inventory using the Ecoinvent database v2.2 for background data
(www.ecoinvent.org).
During the internship at EMPA the data was analyzed and was used to model the
environmental impacts by using SimaPro (LCA commercial software tool). The results
obtained for the different suppliers from different parts of the supply chain for the two main
fabrics in focus by EcoLogTex (i.e. cotton and wool) are presented in this study. Moreover,
scenarios for the production of dyed wool and cotton are created, the worst and best case
selected and the yarn production for both cases scenarios and materials are compared.
1.2 Thesis objective and goal
The main goal of this study is to assess the environmental burdens associated with the
different life cycle stages from two textile products (cotton and wool) comprising: fibre
production, spinning, dyeing, dyeing & bleaching and scouring wool. Scenarios for the
production of the two yarns for each material (cotton and wool) were built based on the
distinct processes reported by the suppliers for the different life cycle stages. This study
compares the worst and the best scenarios in terms of environmental impacts for each
material. Inventory data is collected from several suppliers and refer to 2011.
This study is elaborated following the scope of EcoLogTex project and its specifications. The
environmental impacts are quantified using LCA and the guidelines reported in the ISO
14040:2002 [10]. In terms of the assessment of the impact categories this work performs
LCIA until the characterization step and the methods used are taken from ILCD
recommendations [11] due to the requirements of the above mentioned project. The main
life cycle stages contributing to the impacts are identified. This is to say that the relevant
emissions underlining each calculated impact categories (e.g. climate change induced by
energy use due to greenhouse gas emissions from power plants). In the end scenarios are
created in order to ascertain a comparison for the environmental performance of wool and
cotton dyed yarns production. A comparative analysis among the best and the worst
scenario is made.

Master Thesis LCA of Two Textile Products: Wool and Cotton
4
1.3 Thesis outline
Chapter 1 overviews the main characteristics of the textile industry, including the annual
average production and its environmental pressures. The role of the study in the EcoLogTex
project is summarized and, at the end, the thesis’s goals, objectives and structure are
identified.
Chapter 2 presents and characterises the main processes of the textile industry supply chain
for wool and cotton. A review of the main LCA studies in this sector and the main
conclusions in terms of environmental problems are briefly presented.
Chapter 3 presents the LCA methodology and its application to the study. Following the ISO
14040:2002 [10] the main steps of LCA (goal and scope, inventory analysis, impact
assessment and interpretation) are described while study data is presented. The study
boundaries for each life cycle stage are drawn and the inventory data analysed.
Chapter 4 presents and discusses the LCA results for each life cycle stage of each material
assessed (cotton and wool). The major contributors are identified and discussed.
In Chapter 5 combinations of several possible processes are presented resulting in the
production of cotton and wool yarns. Subsequently two cases scenarios (worst and best) are
identified and used to perform a comparative evaluation for each life cycle stage and for
each textile product analysed. This is to understand which life cycle stages contribute mostly
to the overall impact and to compare the environmental performance of the two textile
products.
Chapter 6 draws and discusses the conclusions of the study. Recommendations for further
works, based on the identified limitations, are listed.

Master Thesis LCA of Two Textile Products: Wool and Cotton
5
2 CHARACTERIZATION OF THE LIFE CYCLE STAGES
Generally, all textile fibers are processed in a similar way: raw fibers are produced, collected
and prepared to be spun by spinning mills. The produced yarn might pass through other
pretreatments before being transformed into a knitted or woven fabric. After that, fabrics are
cut and assembled into clothes which are ready to be transported to retailers, distributed to
stores and sold to the final consumer, which will use them until its final destination. Between
different stages the use of transportation is needed and the travelling distances might vary
from short to medium and long (e.g. country, continent or transcontinental trips). This
industry is identified has having one of the most complex industrial chains [12].
The present study focus on the production of wool and cotton dyed yarns. Having distinct
natural origins (vegetal and animal), some processes are different for the two materials
(cotton and wool). The cotton is harvested, dried and ginned while the greasy wool is
scoured after the sheep shearing. Figure 2 and Figure 1 illustrate, respectively for cotton and
wool, an example of the supply chain highlighting the main activities taking place on the
production process (i.e. fibre to textile fabric).
Figure 1 - Main life cycle stages of the supply chain for wool. The assembly, use phase and the final
disposal is here disregarded. Transports link the presented stages

Master Thesis LCA of Two Textile Products: Wool and Cotton
6
Figure 2- Main life cycle stages of the supply chain for cotton. The assembly, use phase and the final
disposal is here disregarded. Transports link the presented stages
In the present section specifications for the life cycle stages of cotton and wool textiles are
identified and described, its generic stages of mechanical and chemical processing for dyed
yarns production are characterized and the main environmental concerns are summarized in
the following.
The present study only comprises the life cycle stages which data was supplied during the
internship. It includes the stages of sheep farming, scouring wool, cotton cultivation, ginning
spinning (wool and cotton), dyeing (wool) and dyeing & bleaching (cotton). However, other
finishing processes might occur throughout the supply chain of each material as presented
in 2.3. These were, however, disregarded from this thesis scope.
2.1 Wool life cycle stages: sheep farming and scouring wool
Wools might be produced from sheep, goat, alpaca, camel and rabbit among other animals.
Wool’s production is mainly from sheep. In this case, the supply chain starts in grazing and
shearing the ovine followed by the removal of impurities of the fleece. After this, wool is
ready to be spun and dyed.
Sheep farming: the sheep is grazed on pasture and different cares are needed. Farmers have
to ensure the correct nutritional requirements of animals (around 4L of water and 1kg of dry

Master Thesis LCA of Two Textile Products: Wool and Cotton
7
matter of food per day) as well as to prevent diseases (chemical or biological treatments).
Sometime agricultural activities as fertilizers application or irrigation are developed on
pastures in order to increase the meadow yield. The feedstuff as silage or grain may be
imported or locally produced when the available grass is not enough. In fact, on average,
one sheep produces about 4 to 5 kilograms of wool and around 40 to 60 kilogram of meat
per year [13-15]. This animal has also an important role on greenhouse gases emissions due
to its metabolic activity – enteric fermentation and manure left on pasture. In order to collect
the fleece from the sheep there is the activity of shearing. It is usually made once a year in
the springtime [14-16]. Most of the farmers worldwide shear sheep by hand and an
experienced shearer can shear up to 200 sheep per day [17]. The fleece is kept in one piece
and due to its content of natural grease it is named as greasy wool.
Scouring wool: it is a process similar to the scouring presented below (section 2.3) but in the
case of wool it is always performed after shearing the sheep to remove impurities from the
fleece. The main impurity is grease and suint and the goal of the process is to remove it
using detergents. The extracted grease is turned into lanolin (byproduct with commercial
value) [18]. Scouring facilities generates strongly alkaline effluents and significant loads of
BOD5 and COD [2]. Usually the scouring mills include processes of carding and combing and,
in that case, the final product is named as wool top. This product is in a form ready for
spinning. Wool tops are recombed in spinning mills in order to adjust the slivers weight and
thickness as well as to realign fibers after dyeing and blending processes [19].
2.2 Cotton life cycle stages: cultivation and ginning
The life cycle stage of cotton textiles begins in the cultivation and it is followed by ginning.
The fresh ginned cotton is ready to be spun or dyed in processes which are similar for both
materials (cotton and wool).
Cultivation – cotton (Gossypium species) is a perennial shrub often cultivated as an annual
crop for cotton-producing industries. Its propagation is usually made by seeds which are
pre-treated with fungicides, insecticides and plant growth regulators to provide protection
against diseases and pests (this pesticides are also applied to the crop during growing
periods); plants can reach 1 to 2 meters high (sometimes more) [20] and the productivity rate
equals a maximum annual average production ranging from 1 to 2 tonnes of seed cotton per
hectare [21]. At this stage the raw fiber is named as seed cotton due to the presence of seeds
mixed with lint (cotton fibers). Once the seed cotton is picked it is compacted into modules
and is then transported to a cotton gin.
Ginning – this process is usually performed by cotton growers and it follows the harvest. The
cotton seeds are stored in a natural capsule of the plant, surrounded by lint (makes up
approximately 35% of the seed cotton) [22]. Ginning is a mechanical process used to
separate the fibers (the more commercially interesting part of the plant) from the seeds. In
order to reduce the moisture and improve the fiber quality, ginning is accompanied by

Master Thesis LCA of Two Textile Products: Wool and Cotton
8
drying processes that can be made by natural or artificial techniques [22]; these fibers are
then compressed and baled. At this stage, the final product might be called as cotton lint or
ginned cotton.
2.3 Mechanical and chemical processes for dyed yarn production (for
wool and cotton)
Ginned cotton and scoured wool will follow the same life cycle stages. They will be spun and
dyed in order to create a dyed yarn.
Spinning: is the process of transforming fibers into yarn; most of the mills encompasses
processes as mixing (blending), cleaning, carding, combing, drawing and spinning fibers,
followed by coning and packaging yarns.
Carding is the process which separates the fibres and then assembles it into a loose
strand, there is no preferential orientation of the fibres and a web-like fibre is formed
using a carding machine consisting of rollers or drums which have pointed wires
protruding from the surface. The wires pull the cotton fibre into line forming a sliver or a
type of rope [22].
Combing is the process that organizes fibres in a parallel orientation and removes some
organic matter as straw or leafs remaining on the fibres. This activity is performed after
carding and it offers a high quality of threads when compared with carded materials.
The slivers are thinned out or thinned by using a process called drawing and drafting.
This is completed by a series of rollers which make the fibres a consistent size in
preparation for spinning [22].
Spinning the yarn might be spun directly from the slivers (rotor spinning) or the fibre is
twisted into thinner roving before being spun (ring spinning) [22].
Finishing: The “wet processes” also known as “finishing processes” (as presented in Figure 3)
are the main activities of fabric preparation which might take place in different stages of the
material production (fiber, yarn or fabric) depending on the required specifications of the
final product. Examples of these activities are dyeing, bleaching, mercerizing, printing,
desizing and washing [2, 12]. Every stage of production might include its finishing processes
which allows the best fiber, yarn or fabric quality; in textile industry it is often applied after
weaving or knitting the fabric in order to reach desirable fabric properties in terms of handle
(softness and flexibility) and drape; the key goals are to remove surface hairs, increase fiber
binding / cohesion and increase fiber friction according to the final product specifications [1];
finishing processes might comprise different processes according to the final desired
product. Some examples of finishing or pretreatment processes are:
Dyeing: process of adding color to fibers; batch, continuous or semi-continuous
processes might be used depending on different factors as the stage of the material
(fiber, yarn, fabric or garment), size of dye lots and quality requirements in the dyed

Master Thesis LCA of Two Textile Products: Wool and Cotton
9
fabric; the machinery must be resistant to attack by acids, bases, other auxiliary
chemicals and dyes [23].
Printing: Is the application of color to the surface of a fabric in a predetermined pattern
using paste or ink; it may be considered as localized dyeing [1].
Bleaching: is the process to make these products brighter or whiter; the most common
bleaching reagent is hydrogen peroxide and may also be used reagents like sodium
hypochlorite, sodium chlorite/chlorate and sulfur dioxide gas [2]; sometimes bleaching
can be carried out in combination with other treatments: bleaching / scouring, bleaching
/ dyeing bleaching / scouring / desizing [12]. When the material has to be dyed in dark
colors it can be directly dyed without requiring bleaching. On the contrary, bleaching is
an obligatory step when the fiber has to be dyed in pastel colors or when it will need to
be subsequently printed. In some cases, even with dark colors a pre-bleaching step may
be needed [12].
Mercerizing – consists of the pre-treatment of cotton fibers with caustic soda or liquid
ammonia in order to improve tensile strength, dimensional stability and lustre [12]; this
treatment increases the dye affinity of the materials, reducing the dyestuff consumption
in the further process of dyeing; it can be done in two basis stages of material: yarn or
fabric [2, 12]; usually post bleaching and pre-coloring process [24].
Scouring: commonly scouring is the process that aims the removal of impurities as
pectins, proteins, fat and waxes from raw fibers; the fibers go through a series of bowls
and the scums are removed [12].
Desizing: Sizing agents are introduced by the weaving firm in order to strength the
fabric, but its excesses has to be removed by desizing processes using enzymes and
other auxiliaries; as a result it has a high waste water production.[12].
After the yarn production (including its finishing processes) the fabric is created by knitting
or weaving – at this stage we may also have a garment product (e.g. knitted wear).Knitting is
the process responsible for the production of knitted fabrics. The material is produced by set
of connected loops from series of yarns while weaving, similarly to knitting, originates woven
fabrics by interlacing two types of threads [25]. After knitting or weaving, might be the life
cycle stage of assembly in which the fabric is cut in a determined shape and assembled into
a garment, usually using sewing processes. Sometimes trimmings are applied to the final
clothing – it is the final stage of textile making.
2.4 Environmental aspects from the production of textiles
Environmental impacts occur at every stage of the life cycle of a product. More specifically
and due to the growing need to lower the environmental impacts associated with the
production of clothes. New patterns of production must be employed in such a way that the
use of non-renewable resources, water, chemicals, fertilizers and land would be minimized
throughout the supply chain. In summary, the textile fashion companies are focusing more
and more on the production of sustainable products.

Master Thesis LCA of Two Textile Products: Wool and Cotton
10
This industry is pointed as an intensive user for water, energy and chemicals. The air
emissions, odours production and solid waste from processing fibres are also not negligible
[12]. Figure 3 presents the relevant environmental effects per life cycle stage of a textile
product.
Figure 3 - Main environmental aspects associated with the textile industry: from the raw fibre to the
finished textile product [26].
The production and use phase of the natural fibres wool and cotton are identified as the
main life cycle stages that contribute for the environmental impact of textiles [27].
The impacts on the environment of cotton production are related to cultivation practices and
local conditions. The use of water for irrigation can salinize the soils, deplete the water
resources and contribute to desertification. The large-scale explorations, mainly
monocultures contribute to the losses in biodiversity. This crop is pointed as responsible for
8-10% of the global use of pesticides (around 50% of all pesticides are developed to be used
in cotton cultures). Furthermore, large fractions of the amount of pesticides as well as
fertilizers utilized to grow cotton are loose into the ground and can pollute the ground and
surface water [28].
The production of wool requires a lot of land and the land on which sheep are grazed is
generally less suitable for other agriculture. Depending on the original biodiversity and
grazing techniques, grazing sheep may lead to a loss of biodiversity and erosion of the soil.
Sheep contributes to the emission of methane and nitrous oxide, that are important
greenhouse gases due to the fact that they have a significant contribution to climate change
[28]. Some farmers utilize pesticides and fertilizers in order to improve pasture yields, even
not being used in comparable scale as in the cotton cultivation, it is also an important issue
as explained before. Wool is a more reactive and dirty raw fibre as it is called greasy wool
after the shearing. Consequently, raw cotton is a much cleaner raw fiber than wool and initial

Master Thesis LCA of Two Textile Products: Wool and Cotton
11
operation (ginning) is mainly dry and simple against scouring wool that is complex and wet
process (it is more intensive and with larger contributions to the environmental impacts).
In the following are described the main issues related to water and energy consumption, the
mains pollutants emitted to air, water and soil as well as its source. Some benchmark values
collected from the literature are listed as well.
2.4.1 Water consumption
The textile industry water-related impacts have origin in the use of dyes and chemicals in
many different processes of textile manufacture [7, 12]. There is a need to encourage the use
of less toxic dyes and chemicals as well as to recycle/re-use water within the supply chain.
Most of the wastewater production is characteristically alkaline and with high BOD and COD
loads and its discards might increase the streams temperature. The typical pollutants found
in this emissions comprises suspended solids, mineral oils, surfactants, phenols and
halogenated organics as well as heavy metals mainly from dyeing processes [2, 29]. A list of
some water emissions that may be generated at different stages of textile processing are
provided in Table 2 and the average consumption of water per life cycle stage considered as
best available techniques (BAT) are listed in Table 3.
In addition, the wastewater resulting from natural fibre processing as wool and cotton might
include pesticides residues, wax (grease and suint) and microbiological pollutants [2, 7, 29].
High water quantities are also used for irrigation during the growing of natural fibres,
depending of course on the rainfall patterns and crop needs [12]. Varying with the amount
and type of fertilizers, important emissions of nitrates and phosphates are released as well. In
general, the water pollution in textile industry tends to be one of the most important
problems caused to the environment, dominating in terms of environmental impacts, air
emissions and solid waste production [24].
Table 2 - Specific water pollutants caused by the processing of textiles per process of the life cycle stages
[29].
Life cycle stage Compounds
Desizing Sizes as enzymes and starch, waxes, ammonia
Scouring NaOH, surfactants, soaps, fats, waxes, pectin, oils, sizes, anti-static agents, spent solvents,
enzymes, insecticides and pesticides.
Bleaching H2O2, AOX, sodium silicate or organic stabilizer, high pH
Mercerizing High pH, NaOH
Dyeing Colour, metals, salts, surfactants, organic processing assistants, sulphide, acidity/alkalinity,
formaldehyde
Printing Urea, solvents, colour, metals
Finishing Resins, waxes, chlorinated compounds, acetate, stearate, spent, solvent, softeners

Master Thesis LCA of Two Textile Products: Wool and Cotton
12
2.4.2 Energy consumption
The requirements for fossil fuels used in the production of electricity used in the industrial
machinery, heating processes, transportation and agricultural machinery causes a large
contribution to the climate change and resources depletion. The uses of water and energy
are often related in the textile industry since the main use of energy is to heat up the process
baths [12] and drying operations occurring after the wet processes [2]. In a scenario where
the stage of “garments use” is accounted, laundry operation the electricity consumption has
a large contribution summing up about 65% of the overall life cycle of a textile product [3].
Table 3 presents some benchmarks values taken from BAT [12] for different life cycle stages.
Table 3 - Benchmarks values for electricity, heat and water consumption taken from BAT for wool and
cotton[12].
Life cycle stage Electricity, kWh/kg Heat, MJ/kg Water, L/kg
Wool scouring a) 0.3 3.5 2-6
Yarn finishing - - 70-120
Yarn dyeing 0.8-1.1 13-16 15-50
Fibre dyeing 0.1-0.4 4-14 4-20
Knitted fabric finishing 1-6 10-60 70-120
Woven fabric finishing 0.5-1.5 30-70 50-100
Dyed woven fabric finishing - - <200
Spinning b)
1-3 1.1 – 4.7 -
a) Values from Barber et al. (2006) for average production of wool top (scouring + carding + combing) in New Zealand.
b) Average values reported in YST (2006) [30] and not in BAT.
2.4.3 Air Emissions
Activities as agriculture, grazing sheep, and all the energy consumption processes are the
main contributors to air emissions. However, some of the air emissions are not produced in
the exploration place but in the power plants where the electricity is generated. About 14%
of the overall 2004 global greenhouse gases emissions were release from agriculture [31].
Examples of its sources are the management of agricultural soils, livestock, rice production,
and biomass burning. The most dominant greenhouse gases emitted from agriculture are
CH4 and N2O, which contribute, respectively, to 21 and 310 times to the global warming
potential of CO2. The agricultural activities, such as the application of fertilisers are the
primary source of N2O emissions [31]. At the end, the livestock production results in CH4
emission from enteric fermentation and both CH4 and N2O emissions from livestock manure
management [32].
Significant sources of direct air emissions in fiber, yarn and fabric processing have origin in
finishing, dyeing, printing, drying and cleaning fiber operations [2]. A list of air emissions that
may be generated at different stages of textile processing are provided in Table 4.
Master Thesis LCA of Two Textile Products: Wool and Cotton
13
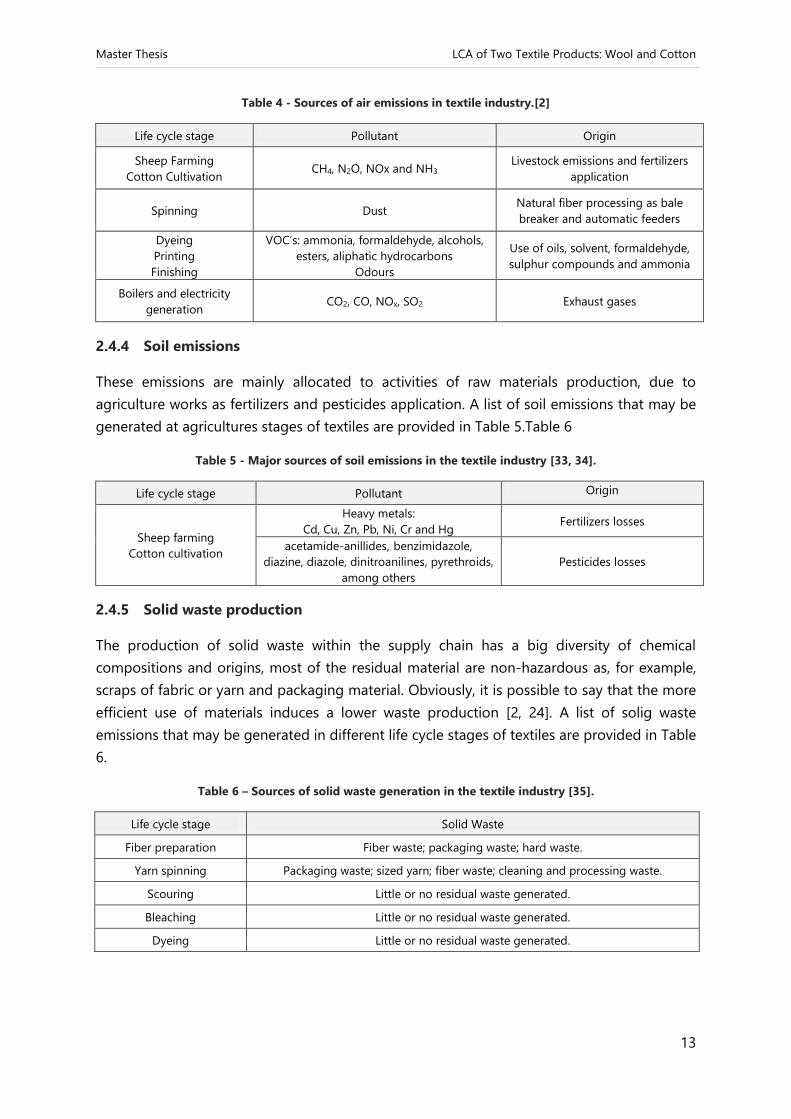
Table 4 - Sources of air emissions in textile industry.[2]
Life cycle stage Pollutant Origin
Sheep Farming
Cotton Cultivation CH4, N2O, NOx and NH3
Livestock emissions and fertilizers
application
Spinning Dust Natural fiber processing as bale
breaker and automatic feeders
Dyeing
Printing
Finishing
VOC’s: ammonia, formaldehyde, alcohols,
esters, aliphatic hydrocarbons
Odours
Use of oils, solvent, formaldehyde,
sulphur compounds and ammonia
Boilers and electricity
generation CO2, CO, NOx, SO2 Exhaust gases
2.4.4 Soil emissions
These emissions are mainly allocated to activities of raw materials production, due to
agriculture works as fertilizers and pesticides application. A list of soil emissions that may be
generated at agricultures stages of textiles are provided in Table 5.Table 6
Table 5 - Major sources of soil emissions in the textile industry [33, 34].
Life cycle stage Pollutant Origin
Sheep farming
Cotton cultivation
Heavy metals:
Cd, Cu, Zn, Pb, Ni, Cr and Hg Fertilizers losses
acetamide-anillides, benzimidazole,
diazine, diazole, dinitroanilines, pyrethroids,
among others
Pesticides losses
2.4.5 Solid waste production
The production of solid waste within the supply chain has a big diversity of chemical
compositions and origins, most of the residual material are non-hazardous as, for example,
scraps of fabric or yarn and packaging material. Obviously, it is possible to say that the more
efficient use of materials induces a lower waste production [2, 24]. A list of solig waste
emissions that may be generated in different life cycle stages of textiles are provided in Table
6.
Table 6 – Sources of solid waste generation in the textile industry [35].
Life cycle stage Solid Waste
Fiber preparation Fiber waste; packaging waste; hard waste.
Yarn spinning Packaging waste; sized yarn; fiber waste; cleaning and processing waste.
Scouring Little or no residual waste generated.
Bleaching Little or no residual waste generated.
Dyeing Little or no residual waste generated.

Master Thesis LCA of Two Textile Products: Wool and Cotton
14
2.3 Overview of LCA studies for textile products: cotton and wool
There are some studies concerning LCA for the textile industry. Most of the studies are based
on the indirect collection of data (i.e. data is provided by suppliers of the supply chain) and
focused t-shirts as the textile sector product. Cotton is dominating the production of natural
fibers; therefore LCA studies for this material are more complete. Thus, the available
literature for wool only regards fiber production and cleaning. This means that the
downstream processes as spinning, dyeing finishing, assembly and use phase are missing.
Some of the case studies found in literature are LCI studies and, consequently, no
environmental impacts are assessed. Table 7 presents an overview of the LCAs studies for the
textile industry focusing mainly in cotton ([36] [37] [38]) but also in wool ([13] [18]) and one
study where both are compared among other fibers [27].
The study named as “Environmental Improvement Potential of Textiles” from the European
Commission presents a comparison between production systems using different types of
fibers (as Viscose, Flax, Silk, Wool, Cotton, Polyester, PA6, Acrylic and Polypropylene) [27] The
functional unit is the production of 1 kg of finished woven fabric (i.e. a t-shirt). It is concluded
that the production of raw materials (comprising the raw fiber production and its first
treatments as ginning cotton or scouring wool) is the main contributor to the overall results
in each environmental impact category assessed (climate change, human toxicity, freshwater
ecotoxicity, ecosystem diversity and resource availability). The second main contributor is the
finishing processes. However, when cotton and wool are compared, cotton has the largest
impacts in all the assessed categories (except in human toxicity). If it is concerned only the
life cycle stages related to the production of a dyed yarn: wool processing has the main
contribution on climate change, human toxicity and resource availability the overall results
(mainly due to the production of raw fiber); while cotton processing has the largest impacts
in the categories of freshwater ecotoxicity and ecosystem diversity.
The study from Cotton Incorporated and PE International compiles a robust and current LCI
dataset for global cotton fibre production and textile manufacturing based on the LCA of
1,000 kg of cotton fibre, 1,000 kg of knit fabric (shirt), and 1,000 kg of woven fabric (pant)
[36] With the purpose of being more representative of the global situation, data from cotton
growers in U.S., China and India as well as fabric producers in Turkey, India, China, and Latin
America (where the main producers are settled) were collected. Looking into the knit fabric
production impacts, spinning is the major contributor followed by dyeing and finishing. In
the other hand, the potential impacts of wove fabric production are strongly affected by
spinning and secondly by finishing, dyeing and weaving. The main impacts from agriculture
are identified as irrigation, post-harvest (transport to ginning facility and ginning), field
emissions (estimated loss of fertilizer and pesticides to the air, water or soil), fertilizer and
fuel use. The main causes of the overall results are energy and water use along the
processing stages of the fibre. When agriculture is considered it has a contribution up to
20% to the final results, while in the category of water consumption it reaches almost 80%.

Master Thesis LCA of Two Textile Products: Wool and Cotton
15
The assembly, use and disposal contribute with more than 80% to the ozone depletion
potential.
The cotton LCI study’ of Blackburn and Payne focus on energy consumption. It concludes
that 76% are used in the use phase, 19% in stages of fiber processing and 4% during the
agriculture [37] The authors compare the energy (heat and electricity) and water
consumption during the production phase concluding that dyeing and spinning are the high
input processes, being spinning the largest consumer of energy followed by dyeing (that is
the biggest consumer of water).
The carbon dioxide and sulphur dioxide emissions from energy consumption in each life
cycle stage analysed are accounted in the production of four different t-shirts in the study
from Steinberger et al. [38]. In this LCI study the production stages of spinning and dying are
also the largest contributors for these emissions in which both are responsible for about 50%
of the total air emissions.
The study from Biswas et al. (2010) [13] studied the life cycle global warming potential of
wheat, meat and wool in three different pasture systems and identified that the activities in
the farm stage (seeding, spraying, harvesting, topdressing, sheep shearing, fertilizer, and
pesticide use and emissions from pastures and crop fields) contributed to the most
significant portion of total GHG emissions. Emissions of methane resulting from the enteric
production and from the decomposition of manure accounted for a significant part of the
total emissions (40 to 90% depending on the type of pasture and farming activities
developed).
In summary, it is possible to conclude that due to the use of heat and electricity, spinning is
reported as one of the crucial stages of cotton fabric production. This stage is followed by
the dyeing and finishing processes that use significant amounts of water, chemicals and
energy. However, there is no results identifying individually the contribution of all the
production processes and only a few are reporting more than one impact category. There are
also only a few studies available related with LCA of wool. This limits the number of data
available associated with the environmental impacts categories.

Master Thesis LCA of Two Textile Products: Wool and Cotton
16
Table 7 - Set of selected studies regarding LCA and LCIA of cotton and wool.
Study
Environmental Improvement
Potential of Textiles – IMPRO-
textiles
Life Cycle Assessment of Cotton
Fiber & Fabric LCA of cotton towels
A spatially explicit life cycle
inventory of the global textile
chain
Global warming contributions
from wheat, sheep meat and
wool production
Merino Wool Total Energy Use
and Carbon Dioxide Emissions
Reference Beton et al. (2006)[27] Cotton Incorporated and PE
International (2012)[36] Blackburn and Payne (2004)[37] Steinberger et al.(2009)[38]
Biswas, Graham, Kelly and John
(2010)[13]
Andrew Barber and Glenys Pellow
(2006)[18]
Location EU-27
Cotton growers: U.S., China and
India; fabric production: Turkey,
India, China, and Latin America;
U.S. - Australia New Zealand
Goals
Comparison of different fibre
types (Viscose, Flax, Silk, Wool,
Cotton, Polyester, PA6, Acrylic
and Polypropylene)
Compile a robust and current LCI
dataset for global cotton fiber
production and textile
manufacturing.
Ascertain the impact of domestic
laundering on the life cycle of
cotton articles and whether
techniques to provide an overall
greener life cycle.
Establishing a country level,
spatially explicit life cycle
inventory (LCI)
Comparison of the life cycle
global warming potential of
wheat, meat and wool in different
pasture systems
Develop LCI for New Zealand
merino farms, offering
benchmark figures to this
industry based on a LCA
perspective.
FU 1 kg of finished woven fabric (t-
shirt)
1000 kg of cotton fiber, 1000 kg
of knit fabric, and 1000
kg of woven fabric
dyed 600g of a 100% cotton
towel 1 t-shirt (110g)
1 kg of wheat, sheep meat and
wool produced
Tonne of dry wool top; tonne of
greasy wool
Life cycle
stages
Raw material production,
cleaning, desizing, spinning,
printing and dyeing, weaving and
finishing
Cotton production, ginning and
knit and woven fabric
manufacturing (spinning, dyeing,
knitting/weaving and finishing).
Growing cotton fibre; towel
making (ginning, spinning,
weaving, dyeing and finishing
and assembly); consumer use and
disposal.
Agriculture, Production (spinning,
knitting, dyeing, apparel,
transport); Use (washing, drying
and disposal)
Agricultural machinery; fertilizer
and pesticide (use, production
and transportation) and
emissions from pastures and crop
fields.
Production and use of fertilizers
and pesticides; wool processing
(farming, shearing, scouring,
combing) and shipping wool top
to China.
Method ReCiPe USEtox™ - - - -
Impact
categories
Midponts: climate change,
human toxicity and freshwater
ecotoxicity. Endpoints: human
health, ecosystem diversity and
resource availability.
Acidification, eutrophication,
global warming, ozone depletion,
smog creation, energy demand,
water use and water
consumption
Energy consumption
The carbon dioxide and sulphur
dioxide emissions from energy
consumption in each life cycle
stage
Global warming potential -
Hot spots
Finishing and raw material
production are the biggest
contributors. Finishing assumes
an important role in cotton
fabric's LCA while raw material
production is the main cause in
wool product's impacts.
Agriculture: field emissions and
fertilizer use; Knitted fabric:
mainly spinning, secondly dyeing
and finishing; Woven fabric:
mainly spinning, secondly
finishing, dyeing and weaving.
76% use phase
19% towel making
4% growing cotton
CO2 emissions: Agriculture (15%);
Spinning (7%); Dyeing (7%); Use
phase (65%). SO2 emissions:
Agriculture (30%); Spinning (17);
Dyeing (13%); Use phase (25%).
CH4 emissions from enteric
methane production and from
the decomposition of manure
accounted for a significant
portion of the total emissions.
On-farm activities have a
contribution of 67% while
processing 30% on the overall
results.
Conclusions
Raw material production and
finishing are the main
contributors in the overall results.
Cotton as the highest impacts in
all the assessed categories when
compared with wool.
Energy and water use are the
significant causes to the overall
results. Agriculture has a
contribution up to 20% in the
final results while in water
consumption its contributions are
around 80%.
Within towel making processes,
dyeing and spinning are the high
input processes.
In this LCI study the production
stages of spinning and dying are
also the largest contributors for
these emissions in which both are
responsible for about 50% of the
total scores
The life cycle GHG emissions of 1
kg of wool is significantly higher
than that of wheat and sheep
meat.
Wool processing accounts for
47% of total energy use, of which
almost 90% occurs during wool
scouring.
Limitations
Based on high amount of
literature data. Cotton is better
modelled than the other fibres
due to the amount of data
available.
Data not collected directly in the
suppliers facilities. Focus on use phase
LCI and only for emissions from
energy consumption
Specific for the local, only global
warming assessed and
downstream processes missing.
This study only evaluates one
impact category (energy use).
Processing energy use was based
on a German wool scouring and
top making plant

Master Thesis LCA of Two Textile Products: Wool and Cotton
17
3 THE LIFE CYCLE ASSESSMENT METHODOLOGY
In the present study LCA is performed according to the principles of the International
Organization for Standardization (ISO) both 14040 and 14044 series of standards for Life
Cycle Assessment [10, 39]. Another methodological guideline for this study was The Hitch
Hiker’s Guide to LCA [40]. The measurement of the potential environmental impacts is
performed using the commercial software SimaPro (version 7.3.3, 2011).
3.1 LCA methodological phases
Life Cycle Assessment is an environmental tool that allows to assess the environmental
impacts of the product, process or activity (including the entire life cycle), encompassing
stages as: extraction and processing of raw materials, manufacturing, transport, distribution,
use and final disposal – accounting for water, air and soil emissions, energy and material
consumption and waste disposal. LCA usually analysis a diversity of environmental impacts
such as climate change, human toxicity, resources depletion, land use among others.
According to the ISO standards, a LCA is carried out in four distinct phases: Goal and Scope
Definition, Inventory Analysis, Impact Assessment and Interpretation (as shown in Figure 4).
The Goal and Scope Definition is the first phase of LCA, which states the context of the
study and the purposes of its results. Technical aspects and the level of detail considered are
here defined by aspects as functional unit (FU)1, system boundaries, assumption and
limitations, allocation methods and impact categories chosen. ISO standards require that the
goal and scope of an LCA has to be clearly defined and consistent.
Figure 4 - Phases of a LCA study [10].
1 The FU defines exactly the object being studied, providing a reference to which the inputs and outputs can be
related. It makes all the inputs and outputs of the studied product comparable.

Master Thesis LCA of Two Textile Products: Wool and Cotton
18
The Inventory Analysis takes place after defining the goal and scope of the study, a
fundamental component of LCA is the creation of the LCI, a complete list compiling the
relevant inputs (energy and materials) and outputs (environmental releases or emissions)
related to the functional unit defined.
The Impact Assessment (LCIA) is when the quantified LCI flows are linked to its potential
environmental impacts using a selected method. The method comprises selected categories
of environmental impacts and characterization, normalization or weighting factors. This step
is done using a systematic procedure based on a sequence of steps stated by the ISO
standards (some of these steps are compulsory whilst others are optional):
Classification (compulsory): respecting the selected method, the inventory flows are
classified according to the type of environmental impact they cause (e.g. CH4 emission
are associated with climate change).
Characterization (compulsory): after classified, the substance flow must be characterized;
each means that all the flows causing the same environmental impact are converted to
the same representative unit (e.g. conversion of CH4 to CO2-eq).
Normalization (optional): this step offers a reference situation (country, region or world)
of pressure on environment for each environmental impact category analysed [41].
Grouping (optional): consists of sorting and possibly ranking the impact categories.
Weighting (optional): is a subjective result where the impact categories are weighted
relative to each other so that it can be possible to generate a single final score.
The Interpretation is made throughout all the phases with the purpose to summarize and
discuss the results achieved systematically and to verify if the results are in accordance with
the defined goal and scope. Changes and recommendations are proposed and the final
conclusions of the study are drawn.

Master Thesis LCA of Two Textile Products: Wool and Cotton
19
3.2 Goal and Scope of the study
The main goal of this study is to assess the environmental burdens associated to different life
cycle stages of dyed yarns (cotton and wool) comprising: fibre production, spinning, dyeing,
dyeing & bleaching and scouring wool; while ascertain about the environmental
performance of wool and cotton dyed yarn production concerning the possible scenarios for
its manufacture and the suppliers assessed for each material. The inventory data collected
from several producers is from 2011. The different producers located worldwide may have
distinct technologies within the same life cycle stage. The wool and cotton processes studied
as its production yields are summarized in Table 8 for each company that supplied the
inventory data. This table also identifies the functional unit (FU) utilized to report the data
collected according to the final product of each life cycle stages.
All the case studies are named with a code as listed in the table: as an example, three case
studies supplying the greasy wool from sheep faming were used in the analysis and they are
designated as F1, F2 and F3 (the same procedure was used in spinning, dyeing and dyeing &
bleaching); cotton growers are distinguished by its mode of cultivation (conventional and
organic) and; as only one scouring mill is assessed no code was defined.
Table 8 – Data provided from suppliers for wool and cotton productions for 2011.
Life cycle stage Case studies Location Annual average
production, t Functional Unit (FU)
WOOL
Sheep farming
F1 New Zealand 70
1 kg of greasy wool F2 Australia 50
F3 Australia 30
Scouring wool
Italy 6000 1 kg of wool top
Spinning
S3 China 400
1 kg of wool yarn S4
1) Italy 4000
S5 Italy 1200
S6 Italy 250
Dyeing
D11)
Italy 4000
1 kg of dyed wool D2 Italy 650
D3 China 5500
COTTON
Cotton cultivation Conventional Tajikistan 2.2 t/ha
1 kg of ginned cotton Organic Tajikistan 2.5 t/ha
Spinning S1 China 12500 1 kg of cotton yarn
S2 Switzerland 3500
Dyeing & Bleaching D&B 2 Italy 100 1 kg of dyed and
bleached cotton D&B 3 China 30
1) S4 and D1 are developed under the same facility roof. It explains the equal amount of product produced.

Master Thesis LCA of Two Textile Products: Wool and Cotton
20
3.2.1 System boundaries
The LCA perspective adopted is cradle-to-gate for the case studies considered. The
boundaries of the processes encompass the production of chemicals and auxiliaries needed
for the supplier activities including raw materials, manufacture of intermediate materials and
manufacture of the product being studied.
Two main groups are identified for the two products, namely activities from the agricultural
sector (cotton cultivation and sheep farming) and mechanical and chemical processes
comprehending the scouring wool, spinning, dyeing and dyeing & bleaching.
For all systems it was excluded the transportation and storage of materials as chemicals,
auxiliaries, fertilizers, pesticides, feedstuff and packaging as well as activities that were not
directly related to the production system as such the administrative, labs and other services
operations.
Figure 5 identifies the stages considered in the analysis by detailing the processes, input and
output products concerned for the production of ginned cotton and greasy wool. Similarly,
the Figure 6 illustrates the activities regarded to model the textile products (wool and
cotton).
Sheep farming and Cotton cultivation
Regarding the main activities of these life cycle stages inputs and outputs from on-farm and
pre-farm origin are included. In Figure 5 are illustrated the stages considered within the
system boundaries. The modelling of these agricultural systems comprises:
The production of cotton seeds, fertilizers (organic or inorganic), pesticides (insecticides,
fungicides and plant growth regulators), chemicals for seed2 and sheep3 treatments and
sheep feed;
Machinery use in field works based on its consumption (e.g. harrowing, sowing and
pesticides application);
Water consumed by the plants (cotton and pastures) and sheep;
Energy production from grid or own;
Emissions to air (NH3, N2O and NOx), water (NO3- and PO4
3-) and soil (heavy metals and
pesticides);
Emission from livestock (CH4, NH3 and N2O);
The process of ginning after harvesting cotton.
2 It refers to the application of fungicide, insecticide or a combination of both in order to disinfect and protect the
seeds from seed-borne or soil-borne pathogenic organisms and storage insects. 3 Sheep lice and blowflies, among other parasites’ threats cause major economic loss to the wool industry [42].
Some farmers are using chemicals to prevent the contamination of its ovine. Most of these products comprises as
active ingredient pesticides.

Master Thesis LCA of Two Textile Products: Wool and Cotton
21
From this analysis are excluded:
The carbon dioxide equivalent uptake was not considered because:
- Following the study of Eady et al. (2011), biogenic carbon that is part of the annual
carbon cycle was assumed to be in equilibrium thus changes in soil and vegetation
carbon in farm products were not included in the system boundary [15]; thus, in
extensive pasture the majority of the vegetable materials are retained on site and it
is assumed that CO2 will be released with time respecting the carbon cycle.
- Cotton and wool fibre stores carbon but it is then released at end of life;
- Soil carbon sequestration is not considered to be significant during periods ranging
from 6 to 12 months according to Biswas et al. (2012) [13]
The production and use of bio controllers and natural pesticides due to the lack of
background information and datasets to model it. For the same reasons, cow manure
production is not considered within the system boundaries (but its emissions are
modelled).
Emissions from the application of chemical treatments in sheep are not accounted. It is
considered an output which will be released from wool and carried out in downstream
processes (e.g. wastewater emissions from scouring wool).
Transports of fertilizers, pesticides and chemicals are not included as they are assumed
to be transported from local retailers to farm and thus not relatively significant for the
overall analysis.
Figure 5 - Life cycle stages processes associated to the production of seed cotton and greasy wool.

Master Thesis LCA of Two Textile Products: Wool and Cotton
22
Mechanical and chemical processes for dyed yarn production
Regarding the main activities of these life cycle stages inputs and outputs from on-company
and pre-company origin are included. In Figure 6 are illustrated the stages considered within
the system boundaries. The modelling of these industrial systems comprises:
Chemicals, auxiliaries and packaging material production;
Energy (electricity, heat or cogeneration) production from grid or own production;
Water used (e.g. tap water, underground water and industrial water);
Wastewater and solid waste final treatment;
Air emissions;
The modes of raw material (textile products) transportation from the previous step of
the supply chain to the company and correspondent impacts are accounted.
Figure 6 – Life cycle stages processes associated to the mechanical and chemical processes for dyed yarn
production (activities occurring after ginned cotton and greasy wool production).
From the analysis are excluded:
Solid wastes which are recycled are not assessed as it is assumed as a raw material of
other processes outside the system boundaries.
Transports of chemicals, auxiliaries and packaging materials are not included as they are
assumed to be transported from local retailers to the suppliers and considered that low
amount of fuel would be used. Following the same consideration, solid waste transports
to its final disposal is not accounted.

Master Thesis LCA of Two Textile Products: Wool and Cotton
23
3.2.2 Allocation process
The case companies that supplied the inventory data produced a number of products and
sub products. The data supplied reports to the production of all the set of products and sub-
products. In order to report the specific values referring the products under study the
amount of inputs and outputs (materials and energy) flows were split among the different
products or by-products. Allocation is defined as partitioning the input or output flows of a
process to the product system under study [10, 40]. Economic allocation was used as
preferential due to the fact that in ISO 14044 [39] this allocation is suggested where physical
relationship (i.e. kg, L, m2, m3, among others) cannot be established. It is assumed that
economical partitioning reflects the relationships between products and by-products
production. Table 9 presents the allocation factors used.
Table 9 - Products (underlined) and by-products produced by the suppliers and the allocation factors
used.
Life cycle stage Case studies Products Allocation Factor Type
WOOL
Sheep Farming F1 | F2 | F3
F1 F2 F3
Greasy wool 0.30 0.62 0.81
Economical Carcases 0.70 0.23 0.13
Live Units a) 0.15 0.06
Scouring
Wool top 0.85 Economical
Lanolin 0.15
Spinning
S3 Wool yarn 1 none
S4 Wool yarn 0.96
Economical Wool noil 0.04
S5 | S6 Wool yarn 1 none
Dyeing D1| D2 | D3 Wool 1 none
COTTON
Cotton Cultivation Conventional
Organic
Ginned cotton 0.60
Economical Seeds 0.37
Neps 0.03
Spinning S1 | S2
S1 S2
Cotton yarn 0.80 0.83 Economical
Cotton comber 0.20 0.17
Dyeing & Bleaching D&B 2 |D&B 3 Cotton 1 none
a) The supplier F1 is not selling live unit.
3.3 Inventory analysis
The inventories were built using primary data made available by suppliers, secondary data
was estimated based on existing models or taken from the ecoinvent databases.
The suppliers reported the consumption of energy and materials used and outputs as
products, by-products, solid waste and emissions (water and air) from their production
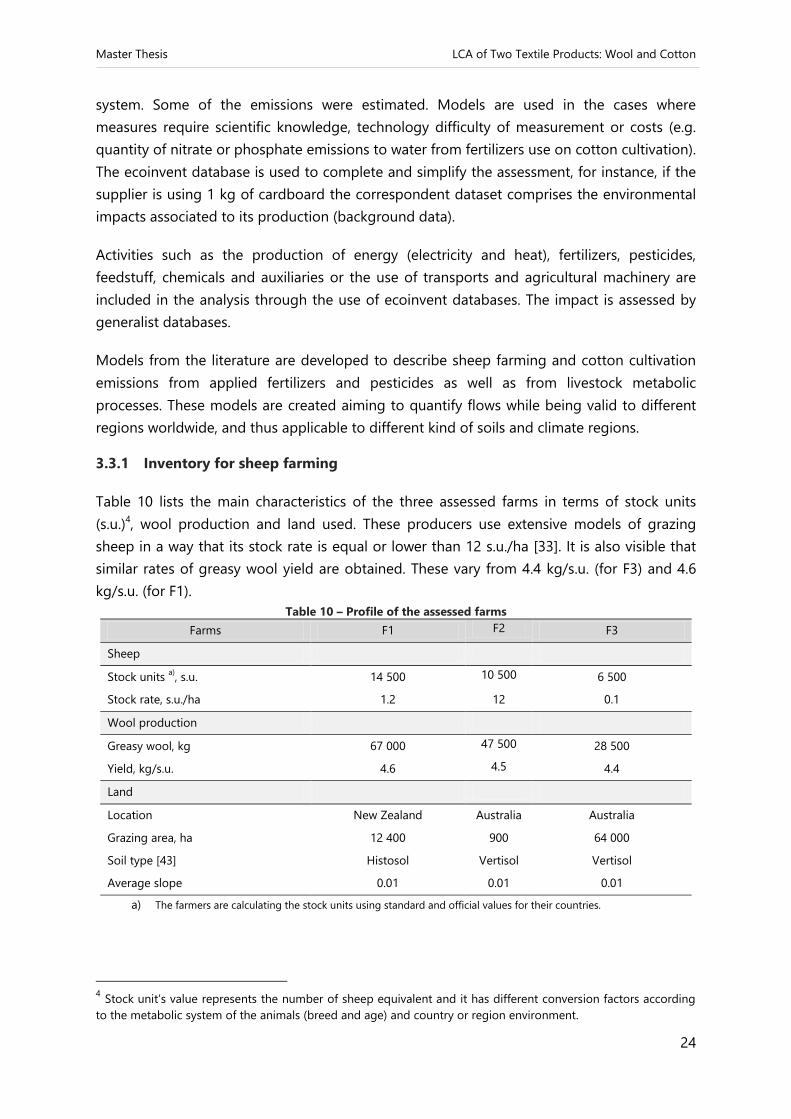
Master Thesis LCA of Two Textile Products: Wool and Cotton
24
system. Some of the emissions were estimated. Models are used in the cases where
measures require scientific knowledge, technology difficulty of measurement or costs (e.g.
quantity of nitrate or phosphate emissions to water from fertilizers use on cotton cultivation).
The ecoinvent database is used to complete and simplify the assessment, for instance, if the
supplier is using 1 kg of cardboard the correspondent dataset comprises the environmental
impacts associated to its production (background data).
Activities such as the production of energy (electricity and heat), fertilizers, pesticides,
feedstuff, chemicals and auxiliaries or the use of transports and agricultural machinery are
included in the analysis through the use of ecoinvent databases. The impact is assessed by
generalist databases.
Models from the literature are developed to describe sheep farming and cotton cultivation
emissions from applied fertilizers and pesticides as well as from livestock metabolic
processes. These models are created aiming to quantify flows while being valid to different
regions worldwide, and thus applicable to different kind of soils and climate regions.
3.3.1 Inventory for sheep farming
Table 10 lists the main characteristics of the three assessed farms in terms of stock units
(s.u.)4, wool production and land used. These producers use extensive models of grazing
sheep in a way that its stock rate is equal or lower than 12 s.u./ha [33]. It is also visible that
similar rates of greasy wool yield are obtained. These vary from 4.4 kg/s.u. (for F3) and 4.6
kg/s.u. (for F1).
Table 10 – Profile of the assessed farms
Farms F1 F2 F3
Sheep
Stock units a), s.u. 14 500 10 500 6 500
Stock rate, s.u./ha 1.2 12 0.1
Wool production
Greasy wool, kg 67 000 47 500 28 500
Yield, kg/s.u. 4.6 4.5 4.4
Land
Location New Zealand Australia Australia
Grazing area, ha 12 400 900 64 000
Soil type [43] Histosol Vertisol Vertisol
Average slope 0.01 0.01 0.01
a) The farmers are calculating the stock units using standard and official values for their countries.
4 Stock unit’s value represents the number of sheep equivalent and it has different conversion factors according
to the metabolic system of the animals (breed and age) and country or region environment.
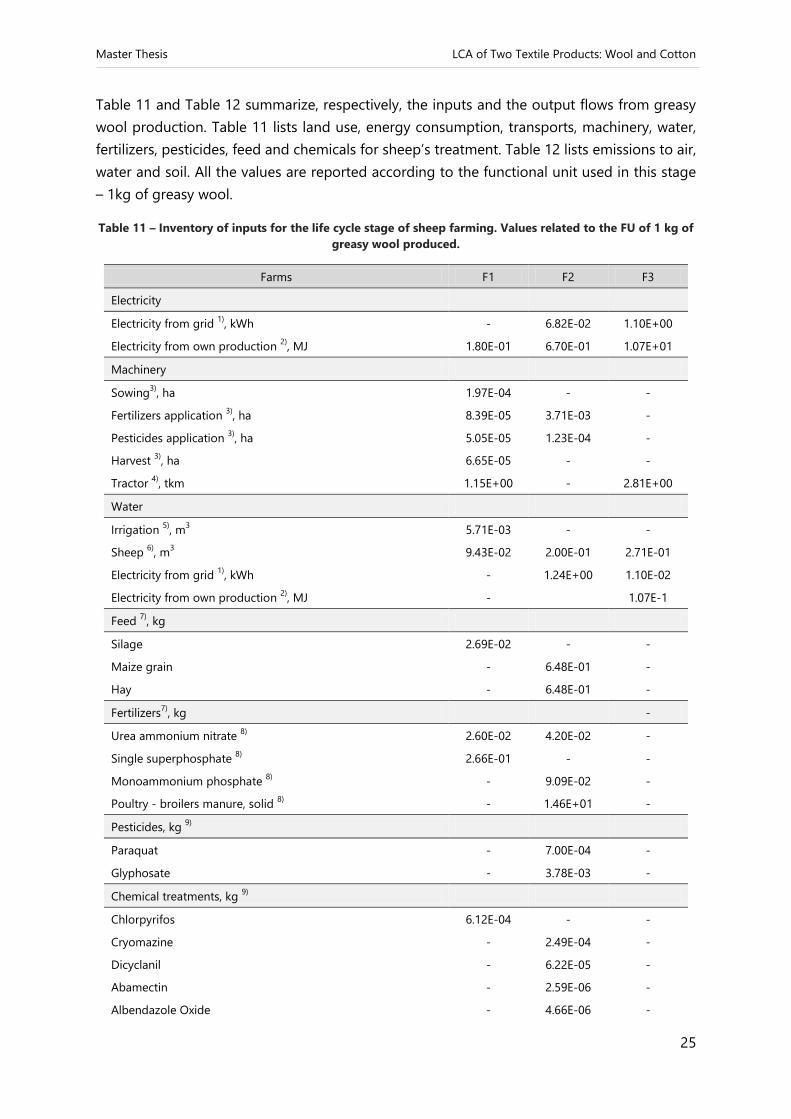
Master Thesis LCA of Two Textile Products: Wool and Cotton
25
Table 11 and Table 12 summarize, respectively, the inputs and the output flows from greasy
wool production. Table 11 lists land use, energy consumption, transports, machinery, water,
fertilizers, pesticides, feed and chemicals for sheep’s treatment. Table 12 lists emissions to air,
water and soil. All the values are reported according to the functional unit used in this stage
– 1kg of greasy wool.
Table 11 – Inventory of inputs for the life cycle stage of sheep farming. Values related to the FU of 1 kg of
greasy wool produced.
Farms F1 F2 F3
Electricity
Electricity from grid 1)
, kWh - 6.82E-02 1.10E+00
Electricity from own production 2)
, MJ 1.80E-01 6.70E-01 1.07E+01
Machinery
Sowing3)
, ha 1.97E-04 - -
Fertilizers application 3)
, ha 8.39E-05 3.71E-03 -
Pesticides application 3)
, ha 5.05E-05 1.23E-04 -
Harvest 3)
, ha 6.65E-05 - -
Tractor 4)
, tkm 1.15E+00 - 2.81E+00
Water
Irrigation 5)
, m3 5.71E-03 - -
Sheep 6)
, m3 9.43E-02 2.00E-01 2.71E-01
Electricity from grid 1)
, kWh - 1.24E+00 1.10E-02
Electricity from own production 2)
, MJ - 1.07E-1
Feed 7)
, kg
Silage 2.69E-02 - -
Maize grain - 6.48E-01 -
Hay - 6.48E-01 -
Fertilizers7)
, kg -
Urea ammonium nitrate 8)
2.60E-02 4.20E-02 -
Single superphosphate 8)
2.66E-01 - -
Monoammonium phosphate 8)
- 9.09E-02 -
Poultry - broilers manure, solid 8)
- 1.46E+01 -
Pesticides, kg 9)
Paraquat - 7.00E-04 -
Glyphosate - 3.78E-03 -
Chemical treatments, kg 9)
Chlorpyrifos 6.12E-04 - -
Cryomazine - 2.49E-04 -
Dicyclanil - 6.22E-05 -
Abamectin - 2.59E-06 -
Albendazole Oxide - 4.66E-06 -

Master Thesis LCA of Two Textile Products: Wool and Cotton
26
Levamasole Hydrochloride - 1.07E-05 -
Spinosad - 1.62E-06 -
Vacines 10)
- 2.36E-06 -
Note: cells with hyphen (-) means that the input is inexistent for the respective supplier.
1) Electricity consumption reported by the suppliers for activities related to sheep (pumping water,
shearing, and illumination).
2) Values calculated in MJ according to the farmer’s litres of diesel consumed for electricity production
and its calorific power of 43 MJ/kg (with the density of 0.832 L/kg). It is assume that the electricity is
produced in a diesel generator set.
3) Litres of diesel consumed per agricultural work are reported by the farmers and are converted to
hectares according to the rate of fuel consumption (L/ha) of the dataset utilized [33].
4) Litres of diesel consumed for transports are reported by the farmers and are converted to tonne-
kilometre according to the rate of fuel consumption (L/tkm) of the dataset utilized [33]. Transports of
persons and animals are considered.
5) Value reported by the supplier. For F1 the supplies is not reporting the electricity used for irrigation,
thus a dataset from ecoinvent concerning the energy use for this activity was utilized.
6) Drinking water for sheep is estimated based on bibliographic references due to the inexistence of
specific data from farmers.
7) Value reported by the supplier.
8) Class of fertilizers selected according to the properties of the commercial products utilized by the
companies.
9) Values reported according to the active principle content of the commercial products
10) A low generic content of 2 mL of active principle per vaccine is adopted according to the values
reported in Walter (2009).
The suppliers F2 and F3 are consuming electricity from Australian grid. The 2011 mix of the
country is published in 2012 Australian Energy Update and utilized in order to model the
electricity generation using datasets from ecoinvent. For that year, the electricity mix was:
38% coal, 35% oil, 22% gas and 5% renewables [45].
Farmers report on questionnaires the litres of fuel consumed for each one of the machinery
works presented. These values are converted from litres to hectares or from litres to tonne-
kilometre depending on the FU required while respecting the rates of fuel consumption
reported by the ecoinvent database [33]. The conversion factors and correspondent datasets
are specific for each type of machinery used and are presented in Table B.6 in Appendix B.
Water is one of the basic needs of any system and its consumption must be accounted.
Drinking water for sheep is estimated based on its nutritional values and on bibliographic
references due to the inexistence of specific data from farmers. The value is based on an
average of 4 litres of water per sheep and day [46].
The selection of datasets to model the fertilizers production was based on the active nutrient
of the fertilizers and its content reported by farmers. Most of the fertilizers applied have the
same composition of as the modelled ones.

Master Thesis LCA of Two Textile Products: Wool and Cotton
27
Suppliers are reporting the quantities of active ingredient presented in the pesticides applied
on field. Attending to the chemical classes of the pesticides, datasets have been selected.
Data for certain pesticides is not available, therefore surrogate figures have been used based
on the active ingredients, i.e., generic dataset as for instance unspecified insecticides,
fungicides or pesticides, growth regulators and chemicals organic was considered in the
analysis. The same assumption is made for the chemical treatments of sheep that uses
pesticide compounds. Furthermore data from two studies (Van Cleemput et al., 1998, and
West, 2002) indicate that there are not large differences in energy requirements and carbon
emissions between herbicides, insecticides and fungicides, so representative compounds
were used.
Table 12 – Inventory of emissions to air, water and soil from sheep farming. Values related to the FU: 1kg
of pollutant per 1 kg of greasy wool produced.
Compartment Emissions F1 F2 F3
Air
CH4 1)
5.17E-01 1.09E+00 1.49E+00
N2O 2) 2.91E-02 5.64E-02 7.43E-02
NOx 3) 1.13E-05 7.27E-03 1.56E-02
NH3 4)
2.37E-01 3.47E-01 4.43E-01
Water
Nitrate 5)
- - 5.96E-04
Phosphorus 6)
1.26E-04 3.05E-04 1.79E-04
Phosphate 6)
4.75E-04 1.00E-03 5.87E-04
Soil
From fertilizers 7)
Cd 4.45E-05 8.74E-06 -
Cu 8.27E-05 2.20E-04 -
Zn 4.20E-04 1.96E-03 -
Pb 4.88E-04 1.92E-05 -
Hg
1.16E-06 -
From pesticides 8)
Glyphosate - 3.78E-03 -
Paraquat - 7.00E-04 -
Note: cells with hyphen (-) means that the output is inexistent for the respective supplier due to a result on the
calculation (nitrates), lack of information for the fertilizer utilized (Hg) or not use of pesticides.
1) Grazing sheep emissions of CH4 from livestock estimated using emission factors from the IPCC (2007) of 8
kg CH4/stock unit [32] reported per country and year by FAO.
2) Grazing sheep emissions of N2O from livestock estimated using emission factors from the IPCC (2007) of
0.5 (New Zealand) and 0.4 (Australia) kg N2O/stock unit [32] reported per country and year by FAO.
Emissions from the application of fertilizers are estimated according to the formula in Nemecek and Kägi
(2007)[35] and adopts the IPCC (2006) guidelines[49]
3) Emissions are calculated based on the formula in Nemecek and Kägi [35] and the dinitrogen oxides
releases: NOx = 0.21 * N2O.
4) Livestock emissions are estimated according to the emission factor of 1.4 kg NH3/stock unit reported by
EMEP (2006) [50] . Emissions from agriculture activities are calculated based on the Agrammon Group
(2009) models.
5) The nitrate emissions from agricultural nitrogen inputs are modeled according to the models developed
by Faist et al. (2009) in the Sustainability Quick Check for Biofuels [51].

Master Thesis LCA of Two Textile Products: Wool and Cotton
28
6) Phosphate emissions are calculated using the models described in [52], [53] and [54]
7) Heavy metal emissions in soil are estimated using the same model as the one used in the ecoinvent
report Life Cycle Inventories of Bioenergy [55]
8) The emissions of the specific pesticides are equal to the inputs of pesticides [55].
Ammonia releases to air are quantified using two models according to the use of mineral
fertilizer or organic fertilizer both based on the nitrogen emissions in form of NH3 (NH3-N):
In case of mineral fertilizers the procedure is based on the nitrogen emissions in form of
NH3 (NH3-N) from fertilizers use and then NH3-N is converted to NH3. Using the
conversion factor of 17/14;
The Agrammon methods [56] are used to model emissions from organic fertilizers use
and the NH3-N emissions are calculated considering the parameters: TAN (total
ammoniacal nitrogen) and standard emission rates for specific manure.
Water emission as nitrate and phosphates are estimated by considering different parameters.
Nitrate emissions are accounted regarding the amount of nitrogen inputs, nitrogen uptake
by vegetation, amount of nitrogen in soil organic matter, precipitation, clay content on soil
and root depth.
Phosphorus losses are estimated in the shape of dissolved ions (phosphate). Its models
follows several studies based on average availability of phosphorus, erosivity and slope
factors, use of fertilizers and its application technics and run-off [52-54].
Heavy metals are emitted to the soil when fertilizers are applied. These emissions were
estimated based on the SALCA for identifying emission factors from fertilisers and uptakes
from wool [35]. Following the studies of Kazemeini et al. (2010), Nemecek et al. (2004),
Patkowska-Sokola et al. (2009) and Smith et al. (2010) to estimate the metal-uptakes by wool
which uptake figures are listed in the Table H.1 and Table H.2 in Apendix H.
The pesticides emissions were estimated by using a simplified model following the one
presented in the ecoinvent report Life Cycle Inventories for Bioenergy [55] where it is assumed
that all inputs of pesticides are emitted in the nature. Therefore it is considered that the
emissions to the soil of the specific pesticides are equal to the amounts used.
3.3.2 Inventory for cotton cultivation
The cotton growers’ production is made in Tajikistan and the two case studies have distinct
modes of agriculture production: while one is using conventional, the other is adopting
organic production. Both growers fields have an average slope of 0.015 and the soil type is
characterized as gelisol according to USDA standards [43]. On average the growing period of
the cotton plant is around 6.5 months and seed cotton is harvest by hand for both farms.

Master Thesis LCA of Two Textile Products: Wool and Cotton
29
Table 13 summarizes the inputs as land use, energy consumption, transports, machinery,
water, fertilizers, pesticides and chemicals for seeds’ treatment and in Table 14 are listed the
output flows from cotton cultivation as emissions to air, water and soil.
Table 13 - Inventory of inputs for the life cycle stage of cotton cultivation. Values related to the FU of 1 kg
of ginned cotton]
Cotton producer Conventional Organic
Land occupation, m2a 4.48E+00 3.94+00
Irrigation
Rain 3)
, m3 1.03E+00 9.09E-01
River 1)
, m3 5.18E+00 4.83E+00
Groundwater 1)
, m3 1.73E+00 1.52E+00
Electricity 4)
, kWh 4.13E-01 3.64E-01
Machinery 5)
, ha
Soil preparations 6.65E-04 1.67E-06
Harrowing 6.25E-03 1.57E-05
Sowing 1.82E-03 4.57E-06
Fertilizers application - 3.30E-06
Cleaning 2.02E-03 5.08E-06
Fertilizers, kg 6)
Ammonium nitrate, as N 2.07E-01 -
Potassium chloride, as K2O 8.26E-02 -
Ammonium nitrate phosphate, as P2O5 1.65E-01 -
Compost - 7.27E-01
Poultry manure - 7.27E-01
Ginning1)
Electricity, kWh 8.86E-02 8.86E-02
Packaging, kg
Cotton cloths 6.29E-04 6.29E-04
Metal rings 4.09E-03 4.09E-03
Transports, tkm 7)
1.24E-02 1.24E-02
Pesticides, kg 81)
Lambda-cyhalothrin 2.48E-04 -
Prometryn 1.03E-03 -
Diquat 2.08E-03 -
Seeds, kg
Seeds bought 1)
8.26E-02 6.23E-02
Seed treatments 9)
Bronopol 5.79E-04 -
Carboxin 10)
7.02E-05 -
Thiram 10)
7.02E-05 -

Master Thesis LCA of Two Textile Products: Wool and Cotton
30
Note: cells with hyphen (-) means that the particular input does not exist in the respective supplier’s activity
1) Quantity reported by the suppliers.
2) Area of land occupied per growing period. The area is allocated to the 6.5 months of cultivation.
3) This value was calculated based on the rainfall stress and farmer’s reliability as well as the quantity of
rainwater needed to grow cotton without irrigation.
4) Electricity consumption reported by the suppliers for pumping water.
5) Litres of diesel consumed per agricultural work are reported by the farmers and are converted to hectares
according to the rate of fuel consumption (L/ha) of the dataset utilized [33].
6) Class of fertilizers selected according to the properties of the commercial products utilized by the
companies.
7) Average distance between cultivation fields and ginning mill is used and multiplied by the quantity
processed in order to have tonne-kilometre units.
8) Values reported according to the active principle content of the commercial products.
9) Values reported according to the active principle content of the commercial products.
10) Carboxin and thiram are the active ingredients of the commercial product utilized by the farmers (Vitavals
200FF) both compounds have a concentration of 200 g/L.
According to UNESCO (2005) [58] the minimum amount of rainfall needed for cotton plant
growth without artificial irrigation is around 500 mm per year. This value is used as reference
due to the lack of average precipitation values in some countries and regions as well as the
variability verified in mountain areas (climate might drastically change depending on the side
of the mountain where the farmers are located). This figure is than corrected according to
the level of reliability of the cotton growers on the effective rainfall. In these study cases the
Tajik farmers are not relying on the rain water and are using irrigation systems. It is assumed
that 25% of the UNESCO’s value is consumed by the plants. Extra amounts of water are
extracted from river or underground reservoirs for irrigation purposes and are reported by
the suppliers.
The electricity produced from standard grid is modelled according to the mix of the country
published in PSIA Energy Tajikistan (2011) [59]. The energetic mix reported is from 2008
production as no recent data are available. For that year, the electricity mix was: 56%
hydropower, 22% oil, 18% gas and 4% coal.
The suppliers are not reporting direct data for ginning as most of the times this process is
performed by cotton growers itself. For model ginning it is used the data reported from
cotton growers’ outsourced company.
Pesticides applied as well as seed treatments are modelled regarding the same
considerations made for grazing sheep models for pesticides and sheep’ chemical
treatments (3.3.1). In this case, the farmer is reporting its consumption based on the
commercial names of the products and datasets are selected according to the chemical class
of the products used.

Master Thesis LCA of Two Textile Products: Wool and Cotton
31
Table 14 - Inventory of emissions to air, water and soil from cotton cultivation. Values related to the FU:
1kg of pollutant per 1 kg of ginned cotton produced.
Compartment Emissions Conventional Organic
Air
N2O 1) 1.36E-03 3.26E-04
NOx 2) 2.87E-04 6.85E-05
NH3 3)
1.82E-03 4.95E-04
Water
Nitrate 4)
1.84E-01 -
Phosphorus 5)
2.04E-03 1.79E-03
Phosphate 6)
1.77E-04 1.56E-04
Soil
From fertilizers 7)
Cd 1.67E-05 1.17E-07
Cu 5.12E-06 3.45E-05
Zn 5.81E-05 4.69E-04
Pb 1.36E-06 1.98E-06
Ni 2.83E-06 7.32E-06
Cr 8.48E-05 5.54E-06
Hg - 2.01E-07
From pesticides 8)
Diquat 2.08E-03 -
Lambda-cyhalothrin 2.48E-04 -
Prometryn 1.03E-03 -
From seed treatments
Bronopol 5.79E-04 -
Carbonix 7.02E-05 -
Thiran 7.02E-05 -
Note: cells with hyphen (-) means that the output is inexistent for the respective supplier due to a result on the
calculation (nitrates), lack of information for the fertilizer utilized (Hg) or not use of pesticides and seed
treatments.
1) Emissions estimated according to the formula in Nemecek and Kägi (2007)[35] and adopts the IPCC (2006)
guidelines[49]
2) Emissions are calculated based on the formula in Nemecek and Kägi [35] and the dinitrogen oxides
releases: NOx = 0.21 * N2O.
3) Emissions are calculated based on the Agrammon Group (2009) model and Flish et al (2009).
4) The nitrate emissions from agricultural nitrogen inputs are modeled according to the models developed
by Faist et al. (2009) in the Sustainability Quick Check for Biofuels [51].
5) Phosphate emissions are calculated using the models described in [52], [53] and [54]
6) Heavy metal emissions in soil are estimated using the same model as the one used in the ecoinvent report
Life Cycle Inventories of Bioenergy [55]
7) The emissions of the specific pesticides are equal to the inputs of pesticides [55].
To model these emissions the same models as in 3.3.1 for sheep farming have been used. Of
course that livestock releases are not accounted in this subsection as no animal is grazed on
the crop fields during the growing periods.

Master Thesis LCA of Two Textile Products: Wool and Cotton
32
Heavy metals are emitted to the soil when fertilizers are applied. These emissions were
estimated based on the SALCA for identifying emission factors from fertilisers and uptakes
from cotton. Emission and uptake factors used are presented in Table H.3, H.4 and H5 in
Appendix H.
The pesticides emissions were estimated by using a simplified model following the one used
in the ecoinvent report Life Cycle Inventories for Bioenergy [55] as in 3.3.1 for sheep farming.
In cotton cultivation this model is not only followed for pesticides applied on cotton crop but
also for the pesticides used as seeds treatment. Following the same lines it is assumed that
all inputs of pesticides are emitted in the nature (in soil from agriculture).
3.3.3 Inventory of mechanical and chemical processes for dyed yarn production
Scouring wool, spinning, dyeing and dyeing & bleaching are modelled using similar
methods. All are wet processes with the exception of spinning which generation of
wastewater is pointed as small and with low content of pollutants. The input flows of these
life cycle stages are presented Table 15.
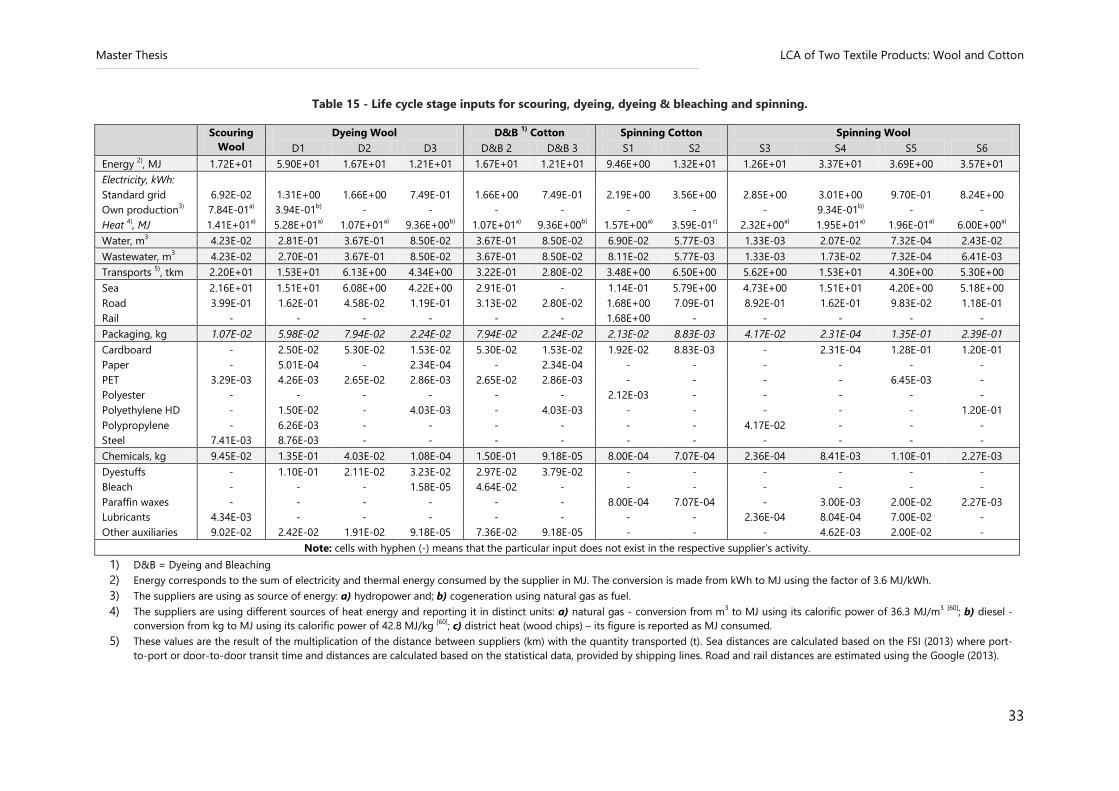
Master Thesis LCA of Two Textile Products: Wool and Cotton
33
Table 15 - Life cycle stage inputs for scouring, dyeing, dyeing & bleaching and spinning.
Scouring
Wool
Dyeing Wool D&B 1)
Cotton Spinning Cotton Spinning Wool
D1 D2 D3 D&B 2 D&B 3 S1 S2 S3 S4 S5 S6
Energy 2), MJ 1.72E+01 5.90E+01 1.67E+01 1.21E+01 1.67E+01 1.21E+01 9.46E+00 1.32E+01 1.26E+01 3.37E+01 3.69E+00 3.57E+01
Electricity, kWh:
Standard grid 6.92E-02 1.31E+00 1.66E+00 7.49E-01 1.66E+00 7.49E-01 2.19E+00 3.56E+00 2.85E+00 3.01E+00 9.70E-01 8.24E+00
Own production3) 7.84E-01
a) 3.94E-01
b) - - - - - - - 9.34E-01
b) - -
Heat 4), MJ 1.41E+01
a) 5.28E+01
a) 1.07E+01
a) 9.36E+00
b) 1.07E+01
a) 9.36E+00
b) 1.57E+00
a) 3.59E-01
c) 2.32E+00
a) 1.95E+01
a) 1.96E-01
a) 6.00E+00
a)
Water, m3 4.23E-02 2.81E-01 3.67E-01 8.50E-02 3.67E-01 8.50E-02 6.90E-02 5.77E-03 1.33E-03 2.07E-02 7.32E-04 2.43E-02
Wastewater, m3 4.23E-02 2.70E-01 3.67E-01 8.50E-02 3.67E-01 8.50E-02 8.11E-02 5.77E-03 1.33E-03 1.73E-02 7.32E-04 6.41E-03
Transports 5), tkm 2.20E+01 1.53E+01 6.13E+00 4.34E+00 3.22E-01 2.80E-02 3.48E+00 6.50E+00 5.62E+00 1.53E+01 4.30E+00 5.30E+00
Sea 2.16E+01 1.51E+01 6.08E+00 4.22E+00 2.91E-01 - 1.14E-01 5.79E+00 4.73E+00 1.51E+01 4.20E+00 5.18E+00
Road 3.99E-01 1.62E-01 4.58E-02 1.19E-01 3.13E-02 2.80E-02 1.68E+00 7.09E-01 8.92E-01 1.62E-01 9.83E-02 1.18E-01
Rail - - - - - - 1.68E+00 - - - - -
Packaging, kg 1.07E-02 5.98E-02 7.94E-02 2.24E-02 7.94E-02 2.24E-02 2.13E-02 8.83E-03 4.17E-02 2.31E-04 1.35E-01 2.39E-01
Cardboard - 2.50E-02 5.30E-02 1.53E-02 5.30E-02 1.53E-02 1.92E-02 8.83E-03 - 2.31E-04 1.28E-01 1.20E-01
Paper - 5.01E-04 - 2.34E-04 - 2.34E-04 - - - - - -
PET 3.29E-03 4.26E-03 2.65E-02 2.86E-03 2.65E-02 2.86E-03 - - - - 6.45E-03 -
Polyester - - - - - - 2.12E-03 - - - - -
Polyethylene HD - 1.50E-02 - 4.03E-03 - 4.03E-03 - - - - - 1.20E-01
Polypropylene - 6.26E-03 - - - - - - 4.17E-02 - - -
Steel 7.41E-03 8.76E-03 - - - - - - - - - -
Chemicals, kg 9.45E-02 1.35E-01 4.03E-02 1.08E-04 1.50E-01 9.18E-05 8.00E-04 7.07E-04 2.36E-04 8.41E-03 1.10E-01 2.27E-03
Dyestuffs - 1.10E-01 2.11E-02 3.23E-02 2.97E-02 3.79E-02 - - - - - -
Bleach - - - 1.58E-05 4.64E-02 - - - - - - -
Paraffin waxes - - - - - - 8.00E-04 7.07E-04 - 3.00E-03 2.00E-02 2.27E-03
Lubricants 4.34E-03 - - - - - - - 2.36E-04 8.04E-04 7.00E-02 -
Other auxiliaries 9.02E-02 2.42E-02 1.91E-02 9.18E-05 7.36E-02 9.18E-05 - - - 4.62E-03 2.00E-02 -
Note: cells with hyphen (-) means that the particular input does not exist in the respective supplier’s activity.
1) D&B = Dyeing and Bleaching
2) Energy corresponds to the sum of electricity and thermal energy consumed by the supplier in MJ. The conversion is made from kWh to MJ using the factor of 3.6 MJ/kWh.
3) The suppliers are using as source of energy: a) hydropower and; b) cogeneration using natural gas as fuel.
4) The suppliers are using different sources of heat energy and reporting it in distinct units: a) natural gas - conversion from m3 to MJ using its calorific power of 36.3 MJ/m
3 [60]
; b) diesel -
conversion from kg to MJ using its calorific power of 42.8 MJ/kg [60]
; c) district heat (wood chips) – its figure is reported as MJ consumed.
5) These values are the result of the multiplication of the distance between suppliers (km) with the quantity transported (t). Sea distances are calculated based on the FSI (2013) where port-
to-port or door-to-door transit time and distances are calculated based on the statistical data, provided by shipping lines. Road and rail distances are estimated using the Google (2013).

Master Thesis LCA of Two Textile Products: Wool and Cotton
34
The suppliers D3 and S1 (both located in China) do report the energy mix utilized on the
production of the electricity consumed in their facilities. D3’s energy mix is composed by
81% coal, 18% solar and 1% nuclear, while S1’s mix uses 65% coal, 30% hydro and 5% solar.
All the others suppliers presented are modelled regarding its country’s standard grid in
ecoinvent. Electricity imports are also accounted for.
Heat production is modelled according to the datasets available in the ecoinvent. The model
selected refers to the boiler capacity and burner type utilized in the case studies. In the case
where district heating is used the generic dataset selected according the energy source
utilized (wood chips).
The suppliers describe the origins of its fibres or yarns (raw materials to be processed in their
facilities) as well as the type of transportation used from the previous life cycle stage to the
company. The modes of transports used are sea, road and rail and distances are estimated
based on tools available online.
Chemicals and auxiliaries productions are modelled according to the datasets existing in the
database utilized. Some assumptions are made when specific ingredients are not modelled in
the databases. That way, some alternatives are adopted taking into account its similarity with
other compounds or their chemical class. This is done for organic, inorganic or a mixture of
both.
Water emissions are listed in Table 16. The composition for the effluents is only reported by
the scouring mill and dyeing mil D1 as these have internal treatment of polluted water
coming from its processes. All other suppliers are releasing its wastewater for external
treatment plants. For these cases, wastewater impacts are modelled using datasets for
wastewater treatment plant.
Table 16 – Water emissions from wet processes of scouring and dyeing wool reported as kilogram of
compound per FU (wool top and dyed product, respectively).
Compounds Scouring wool Dyeing wool (D1)
Ammonium, NH4-N 4.86E-03 1.23E-04
BOD5 8.97E-03 7.26E-05
Chlorides, Cl- 3.80E-02 4.88E-04
Chromium, Cr - 2.90E-07
COD 3.09E-02 2.18E-04
Copper, Cu - 1.45E-07
Iron, Fe - 7.12E-06
Lead, Pb - 1.45E-07
Mercury, Hg - 1.45E-08
Nickel, Ni - 1.45E-07
Nitrate, NO3-N 4.00E-04 3.33E-03
Nitrite, NO2-N 2.76E-05 -
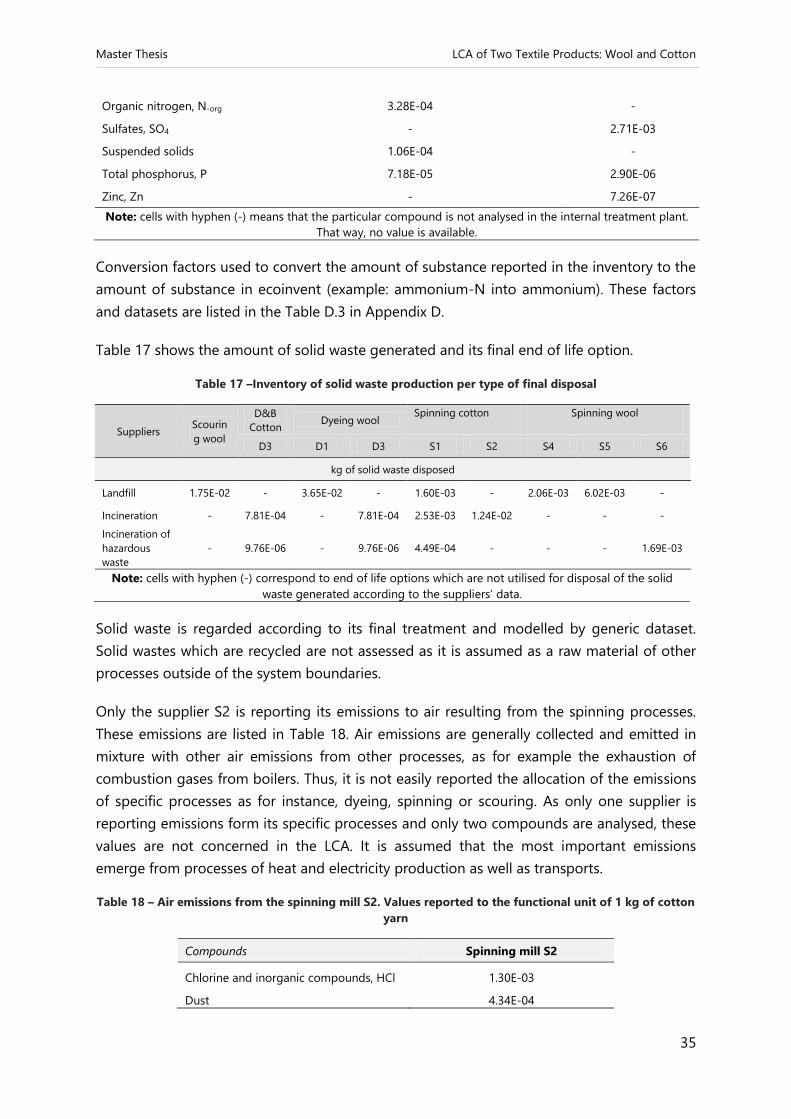
Master Thesis LCA of Two Textile Products: Wool and Cotton
35
Organic nitrogen, N-org 3.28E-04 -
Sulfates, SO4 - 2.71E-03
Suspended solids 1.06E-04 -
Total phosphorus, P 7.18E-05 2.90E-06
Zinc, Zn - 7.26E-07
Note: cells with hyphen (-) means that the particular compound is not analysed in the internal treatment plant.
That way, no value is available.
Conversion factors used to convert the amount of substance reported in the inventory to the
amount of substance in ecoinvent (example: ammonium-N into ammonium). These factors
and datasets are listed in the Table D.3 in Appendix D.
Table 17 shows the amount of solid waste generated and its final end of life option.
Table 17 –Inventory of solid waste production per type of final disposal
Suppliers Scourin
g wool
D&B
Cotton Dyeing wool
Spinning cotton Spinning wool
D3 D1 D3 S1 S2 S4 S5 S6
kg of solid waste disposed
Landfill 1.75E-02 - 3.65E-02 - 1.60E-03 - 2.06E-03 6.02E-03 -
Incineration - 7.81E-04 - 7.81E-04 2.53E-03 1.24E-02 - - -
Incineration of
hazardous
waste
- 9.76E-06 - 9.76E-06 4.49E-04 - - - 1.69E-03
Note: cells with hyphen (-) correspond to end of life options which are not utilised for disposal of the solid
waste generated according to the suppliers’ data.
Solid waste is regarded according to its final treatment and modelled by generic dataset.
Solid wastes which are recycled are not assessed as it is assumed as a raw material of other
processes outside of the system boundaries.
Only the supplier S2 is reporting its emissions to air resulting from the spinning processes.
These emissions are listed in Table 18. Air emissions are generally collected and emitted in
mixture with other air emissions from other processes, as for example the exhaustion of
combustion gases from boilers. Thus, it is not easily reported the allocation of the emissions
of specific processes as for instance, dyeing, spinning or scouring. As only one supplier is
reporting emissions form its specific processes and only two compounds are analysed, these
values are not concerned in the LCA. It is assumed that the most important emissions
emerge from processes of heat and electricity production as well as transports.
Table 18 – Air emissions from the spinning mill S2. Values reported to the functional unit of 1 kg of cotton
yarn
Compounds Spinning mill S2
Chlorine and inorganic compounds, HCl 1.30E-03
Dust 4.34E-04

Master Thesis LCA of Two Textile Products: Wool and Cotton
36
3.3.4 Datasets from ecoinvent
Secondary data from ecoinvent used to model the life cycle stages presented are listed in the
Appendix A to G. Table 19 summarizes the datasets included in the listed Appendixes.
Table 19 – Location of the datasets utilized in the appendixes.
Category Sub-category Appendix Table
Energy production Electricity
A A.1
Heat A.2
Agriculture
Machinery
B
B.1
Feedstuff B.2
Fertilizers B.3
Pesticides B.4
Chemical treatments (sheep and seeds) B.5
Emissions B.6
Packaging material - C C.1
Water
Sources of consumed water
D
D.1
Wastewater treatment D.2
Water emissions D.3
Chemicals, dyestuffs and auxiliaries - E E.1
Transports - F F.1
Solid waste disposal - G G.1
3.4 Impact assessment
Environmental impacts are quantified using the LCA tool and respecting the guidelines
reported in the ISO 14040:2002 [10]. This work performs LCIA until characterization step and
following the EcoLogTex the methods used are from taken from ILCD recommendations [11].
This method was chosen because it is a result of a project for the European Commission that
analysed several life cycle impact assessments (LCIA) methodologies to reach and
recommend a consensual methodology [11]. Thus, the potential environmental impact
categories assessed were:
Climate change: Global Warming Potential calculating the radiative forcing over a time
horizon of 100 years. | IPCC 2007.
Ozone depletion: Ozone Depletion Potential (ODP) calculating the destructive effects
on the stratospheric ozone layer over a time horizon of 100 years. | World
Meteorological Organization (WMO) 1999.
Human toxicity, (cancer effects and non-cancer effects): Comparative Toxic Unit for
humans (CTUh) expressing the estimated increase in morbidity in the total human
population per unit mass of a chemical emitted (cases per kilogramme). | USEtox.

Master Thesis LCA of Two Textile Products: Wool and Cotton
37
Acidification: Accumulated Exceedance (AE) characterizing the change in critical load
exceedance of the sensitive area in terrestrial and main freshwater ecosystems, to which
acidifying substances deposit. | Seppälä et al. 2006 and Posch et al. 2008.
Freshwater eutrophication: Expression of the degree to which the emitted nutrients
reaches the freshwater end compartment (phosphorus considered as limiting factor in
freshwater). | ReCiPe version 1.05.
Marine eutrophication: Expression of the degree to which the emitted nutrients
reaches the marine end compartment (nitrogen considered as limiting factor in marine
water). | ReCiPe version 1.05.
Freshwater ecotoxicity: Comparative Toxic Unit for ecosystems (CTUe) expressing an
estimate of the potentially affected fraction of species (PAF) integrated over time and
volume per unit mass of a chemical emitted (PAF m3 year/kg). | USEtox.
Water resource depletion: Freshwater scarcity: Scarcity-adjusted amount of water used.
| Swiss Ecoscarcity 2006.

Master Thesis LCA of Two Textile Products: Wool and Cotton
38

Master Thesis LCA of Two Textile Products: Wool and Cotton
39
4 RESULTS AND DISCUSSION
Here the results for the different life cycle stages are presented and discussed for each textile
product. Moreover, the results obtained for each supplier for the same life cycle stage are
compared, the burdens are identified and the opportunities of improvements suggested.
The presentation of the results is divided in two phases according to the materials assessed.
At first the results for wool yarns production (including sheep farming, scouring, spinning
and dyeing) are presented. These are followed by the results for cotton yarn manufacture
(including cotton cultivation, spinning and dyeing & bleaching).
4.1 LCA of Wool Yarns
4.1.1 Sheep farming
The contribution to the total impact of greasy wool production from each farm is shown in
Table 20 for F1, F2 and F3. In order to highlight the representativeness of each supplier for
each environmental impact category assessed it is calculated the relative contribution. This is
done by dividing the contribution of each supplier by the maximum value calculated for each
impact category as show in the table.
Table 20 – Results from sheep farming (case study: F1, F2, F3) for the production of 1 kg of greasy wool
and its relative contribution to the maximum value calculated for each category.
Impact Category F1 F2 F3 Relative contribution, %
F1 F2 F2
Climate change,
kg CO2 eq 2.11E+01 4.39E+01 5.76E+01 37
a) 76 100
Ozone depletion,
kg CFC-11 eq 9.51E-08 3.34E-07 2.55E-07 28 100 76
Human toxicity (CE) b)
,
CTUh 6.01E-08 4.31E-08 1.19E-09 100 72 2
Human toxicity (NCE) b)
,
CTUh 3.81E-05 9.07E-05 2.62E-06 42 100 3
Acidification,
molc H+ eq
5.39E-01 1.09E+00 8.21E-01 50 100 76
Freshwater
eutrophication, kg P eq 5.84E-04 2.08E-03 2.21E-04 28 100 11
Marine eutrophication, kg
N eq 1.82E-02 5.55E-02 3.89E-02 33 100 70
Freshwater ecotoxicity,
CTUe 1.23E+01 5.12E+01 1.55E+00 24 100 3
Water resource depletion,
m3 water eq
1.68E-02 3.40E-02 4.42E-02 38 77 100
a) Example of the procedure performed for the calculation of the relative contribution of each supplier in
all the categories: for F1 in the climate change category = 2.11E+01 / 5.76E+01 * 100.
b) CE = cancer effects; NCE = non-cancer effects

Master Thesis LCA of Two Textile Products: Wool and Cotton
40
The sheep farmer F2 has the largest impacts for six categories out of 9 calculated, namely for
the ozone depletion, human toxicity (non-cancer effects), acidification, eutrophication
(freshwater and marine) and freshwater ecotoxicity. This supplier has the second largest
contribution in the other categories (climate change, human toxicity (cancer effects) and
water resource depletion). F2’s has a larger input of fertilizers, pesticides and chemical
treatments to sheep. This activity has also a substantial use of machinery and electricity.
No fertilizers, chemicals nor pesticides and chemicals are utilized by F3 but it reports a high
consumption of energy and use of tractor on its activities. These reflect its large results in
categories such as climate change, ozone depletion, acidification and marine eutrophication
while having low contribution in human toxicity (cancer and non-cancer), freshwater
eutrophication and freshwater ecotoxicity categories. As a big area is used by this supplier
the use of tractor to cover all the fields is higher.
F1’s burdens are mostly in between F2 and F3 in the overall results. Exceptions are made for
climate change, ozone and water resource depletion in which it has the lowest potential
impacts and in human toxicity (cancer effects) where this supplier has the highest
contribution.
The relative contribution of each activity to the total impact on cotton fibre production is
illustrated in Figure 7.
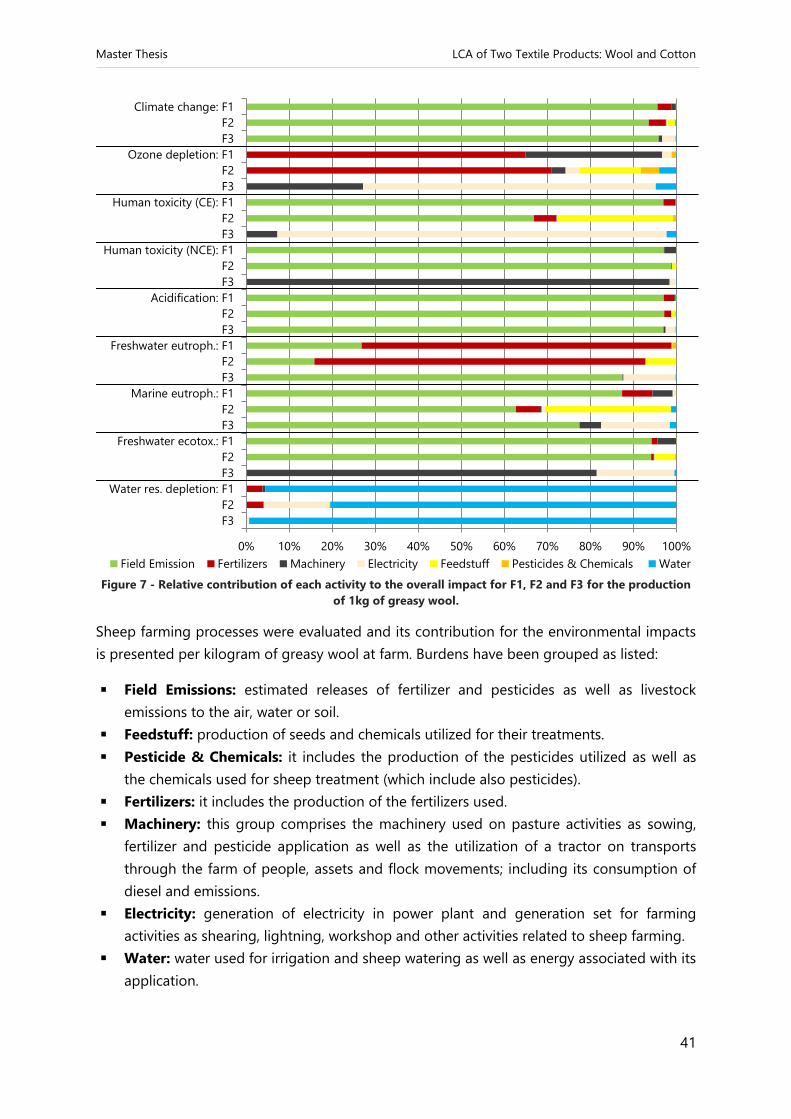
Master Thesis LCA of Two Textile Products: Wool and Cotton
41
Figure 7 - Relative contribution of each activity to the overall impact for F1, F2 and F3 for the production
of 1kg of greasy wool.
Sheep farming processes were evaluated and its contribution for the environmental impacts
is presented per kilogram of greasy wool at farm. Burdens have been grouped as listed:
Field Emissions: estimated releases of fertilizer and pesticides as well as livestock
emissions to the air, water or soil.
Feedstuff: production of seeds and chemicals utilized for their treatments.
Pesticide & Chemicals: it includes the production of the pesticides utilized as well as
the chemicals used for sheep treatment (which include also pesticides).
Fertilizers: it includes the production of the fertilizers used.
Machinery: this group comprises the machinery used on pasture activities as sowing,
fertilizer and pesticide application as well as the utilization of a tractor on transports
through the farm of people, assets and flock movements; including its consumption of
diesel and emissions.
Electricity: generation of electricity in power plant and generation set for farming
activities as shearing, lightning, workshop and other activities related to sheep farming.
Water: water used for irrigation and sheep watering as well as energy associated with its
application.
0% 10% 20% 30% 40% 50% 60% 70% 80% 90% 100%
F3
F2
Water res. depletion: F1
F3
F2
Freshwater ecotox.: F1
F3
F2
Marine eutroph.: F1
F3
F2
Freshwater eutroph.: F1
F3
F2
Acidification: F1
F3
F2
Human toxicity (NCE): F1
F3
F2
Human toxicity (CE): F1
F3
F2
Ozone depletion: F1
F3
F2
Climate change: F1
Field Emission Fertilizers Machinery Electricity Feedstuff Pesticides & Chemicals Water

Master Thesis LCA of Two Textile Products: Wool and Cotton
42
Field emissions to the air, water or soil comprising the releases of fertilizer and pesticides
and livestock emissions are identified to be a major contributor in most of the potential
impact categories for all the farms. Its relative contributions are larger than 60% for impact
categories such as climate change, human toxicity, acidification, marine eutrophication and
freshwater ecotoxicity. These results are lower in F3 for the categories of human toxicity and
freshwater ecotoxicity as this supplier has no inputs of pesticides.
Another important contributor was fertilizer manufacture which showed up a high impact
(around 70%) on ozone depletion and freshwater eutrophication in the suppliers F1 and F2.
In the other hand machinery and electricity have significant weight in categories as human
toxicity and freshwater ecotoxicity in F3. Feedstuff has significant contributions in F2 in
ozone depletion, human toxicity (cancer effects) and freshwater ecotoxicity.
The major impact associated with the water resource depletion is from water used in the
sheep farming activities as drinking water for sheep (major contribution) or irrigation.
Emissions from livestock of CH4 and N2O show up as the major contributors on climate
change in the three case studies. Although the emissions per FU are differing between farms,
the emissions and yield of wool production per livestock unit are similar. The results are
almost proportional to the allocation factor (economical) of each production. In studies from
Biswas et al (2010)[13] and Eady et al. (2012) [15] it is calculated a similar allocation factors to
the one used in F1. These studies are reporting values of CO2-eq per kilogram of greasy wool
around 16 and 29, respectively – similar to the results of F1 (21 kg CO2 eq). This fact leads to
conclude that greenhouse gases emissions from sheep farming are in line with the literature
values.
Since most ozone depleting chemicals (mostly refrigerants) were phased out after the
Montreal Protocol [36], ozone depletion emissions today are usually minimal and related to
electricity production. Fertilizers production is the main contributor to Ozone Depletion due
to releases of halons, HCFC’s and CFC’s in electricity production in their upstream life cycles
stages. Other important contributions are coming from machinery operations which are
consuming diesel and the electricity consumption in farms (both are main contributors in the
supplier F3 as no fertilizers are utilized).
The major inputs of heavy metals (mainly lead, cadmium, zinc and mercury) into agricultural
systems are from fertilizers use. It increases the toxicity and has a large contribution in the
categories of human toxicity and freshwater ecotoxicity. The origins of these inputs are, of
course the fertilizers utilized in pastures but also the one used to grow feed crops. Emissions
of glyphosate to soil from pesticide application in the supplier F2 also contributes to its
impacts on freshwater ecotoxicity. As neither fertilizers nor pesticides are utilized in F3’s
activities his contributions to the rise of toxicity potential in these categories are on the use
of tractor which is emitting heavy metals to soil, air and water and upstream activities of
electricity production (e.g. burning hard coal and disposal its ashes).
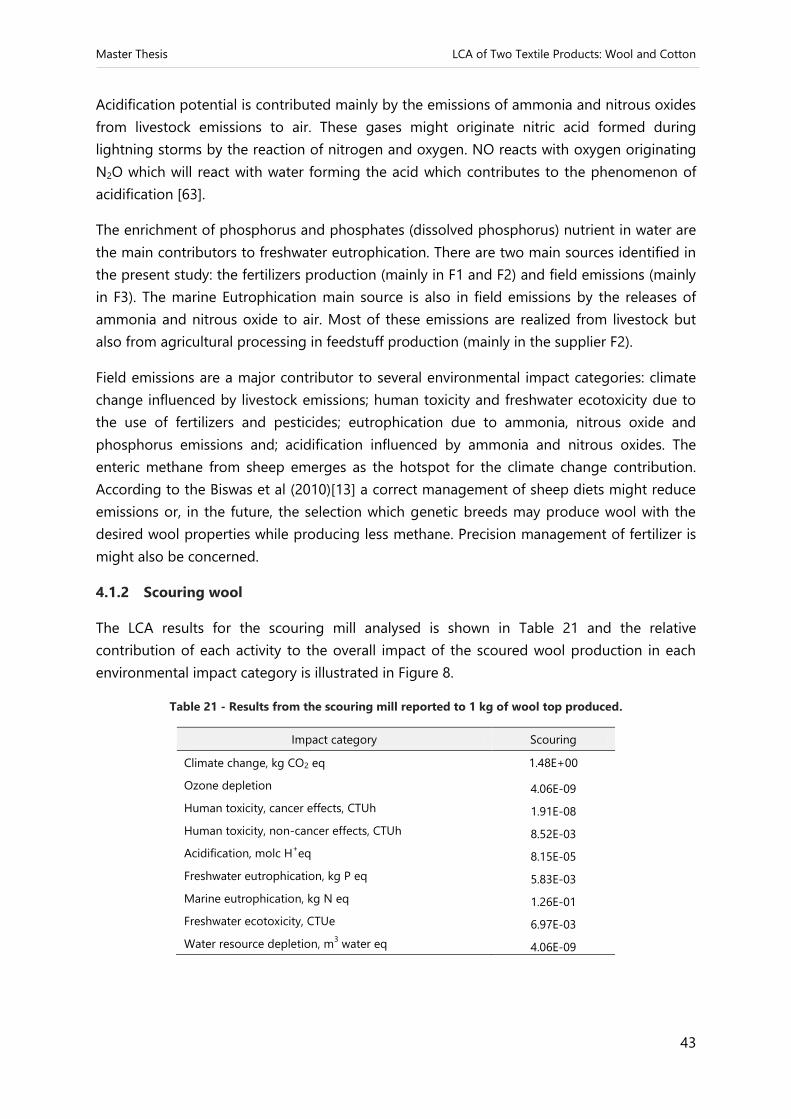
Master Thesis LCA of Two Textile Products: Wool and Cotton
43
Acidification potential is contributed mainly by the emissions of ammonia and nitrous oxides
from livestock emissions to air. These gases might originate nitric acid formed during
lightning storms by the reaction of nitrogen and oxygen. NO reacts with oxygen originating
N2O which will react with water forming the acid which contributes to the phenomenon of
acidification [63].
The enrichment of phosphorus and phosphates (dissolved phosphorus) nutrient in water are
the main contributors to freshwater eutrophication. There are two main sources identified in
the present study: the fertilizers production (mainly in F1 and F2) and field emissions (mainly
in F3). The marine Eutrophication main source is also in field emissions by the releases of
ammonia and nitrous oxide to air. Most of these emissions are realized from livestock but
also from agricultural processing in feedstuff production (mainly in the supplier F2).
Field emissions are a major contributor to several environmental impact categories: climate
change influenced by livestock emissions; human toxicity and freshwater ecotoxicity due to
the use of fertilizers and pesticides; eutrophication due to ammonia, nitrous oxide and
phosphorus emissions and; acidification influenced by ammonia and nitrous oxides. The
enteric methane from sheep emerges as the hotspot for the climate change contribution.
According to the Biswas et al (2010)[13] a correct management of sheep diets might reduce
emissions or, in the future, the selection which genetic breeds may produce wool with the
desired wool properties while producing less methane. Precision management of fertilizer is
might also be concerned.
4.1.2 Scouring wool
The LCA results for the scouring mill analysed is shown in Table 21 and the relative
contribution of each activity to the overall impact of the scoured wool production in each
environmental impact category is illustrated in Figure 8.
Table 21 - Results from the scouring mill reported to 1 kg of wool top produced.
Impact category Scouring
Climate change, kg CO2 eq 1.48E+00
Ozone depletion 4.06E-09
Human toxicity, cancer effects, CTUh 1.91E-08
Human toxicity, non-cancer effects, CTUh 8.52E-03
Acidification, molc H+eq 8.15E-05
Freshwater eutrophication, kg P eq 5.83E-03
Marine eutrophication, kg N eq 1.26E-01
Freshwater ecotoxicity, CTUe 6.97E-03
Water resource depletion, m3 water eq 4.06E-09
Master Thesis LCA of Two Textile Products: Wool and Cotton
44
Figure 8 - Relative contribution of each activity to the overall impact for scouring wool reported to 1 kg of
wool top produced..
Scouring mill activities were evaluated and its contribution for the environmental impacts is
presented per kilogram of scoured wool at company gate. Burdens have been grouped by its
origins or main activities as listed:
Water & Wastewater: consumption of water from aqueduct and well, water emissions
from internal treatment and wastewater treatment of untreated water in a municipal
plant.
Chemicals: production of chemicals and auxiliaries utilized.
Packaging: manufacture of packaging materials used to pack the products.
Electricity: generation of electricity in power plant as well as from own production
(hydro).
Heat: production of calorific energy within the facilities.
Transports: transport of fibres to be scoured from sheep farmers to the scouring mill.
Solid waste: waste disposal.
Climate change and ozone depletion are characterized by the large contribution of heat.
Human toxicity (cancer and non-cancer effects) main contributor is the production of steel
used in packaging (contribution up to 80%). Transports are sharing a burden of 30% in the
category of human toxicity non-cancer effects.
Acidification potential is increased by the activities of transportation by sea of raw materials
with origins in different continents - contribution around 70%. This activity also has
significant impacts in climate change, ozone depletion human toxicity (non-cancer effects),
marine eutrophication and freshwater ecotoxicity (contributions up to 30%).
Packaging materials production, mainly of the wire utilized to tie the scoured wool, has the
largest burden in the category of human toxicity (cancer effects) and has significant
0% 10% 20% 30% 40% 50% 60% 70% 80% 90% 100%
Water resource depletion
Freshwater ecotoxicity
Marine eutrophication
Freshwater eutrophication
Acidification
Human toxicity (NCE)
Human toxicity (CE)
Ozone depletion
Climate change
Water & Wastewater Heat Packaging Transports Chemicals Electricity Solid Waste

Master Thesis LCA of Two Textile Products: Wool and Cotton
45
contributions in the categories of human toxicity (non-cancer effects) and freshwater
ecotoxicity.
Both, transports, packaging and chemicals are sharing a burden around 30% in freshwater
ecotoxicity.
Electricity production has small impacts in the overall results as 95% of the energy is
produced by the company (hydroelectric power). The remaining 5% are imported from the
Italian standard grid. Solid waste accounts for not more than 4% of the impacts in all
categories.
Most of the climate change contributors are exhaust gases (mainly CO2, CH4 and N2O)
released from fossil fuel combustion in heat production and transports. The same drivers
have a similar share in Ozone Depletion due to the emission of halons and CFC’s in upstream
activities of natural gas and diesel production.
The production of metallic wire used to tie the scoured wool packaging, use of transports
and heat generation are responsible for the emission of heavy metals such as chromium,
mercury, lead and zinc to air and water which contributes most to human toxicity and
freshwater ecotoxicity. The origins of these emissions are in the production of wire,
combustion of fossil fuels and disposal of mining residues in upstream processes of
electricity generation. Chemicals production also has a significant burden in the freshwater
ecotoxicity due to upstream processes of energy production.
Air emissions of SO2 and NOx which are released in exhaust gases coming from the
combustion of fossil fuels in transports, heat and electricity production are the main cause
for acidification potential category. These gases might originate nitric and sulphuric acid,
respectively
Freshwater eutrophication is mainly caused by phosphate, while marine eutrophication by
ammonia, nitrate and nitrite in its water emissions. The latter category is also a result of
emissions of NOx to air from transports.
Scouring wool is a wet process, in such a way that large quantities of water are consumed
and consequently big amounts of wastewater are generated. It has negative repercussions in
environmental impact categories of eutrophication (freshwater and marine) and water
resource depletion (contributions larger than 65%). Since the use of water and energy are
often related in the textile industry as the main use of energy is to heat up the process baths
and drying fibres. Heat is the biggest contributor in the potential impact categories of
climate change and ozone depletion with contributions larger than 65%. A positive aspect
which has to be highlighted is the electricity production mix based mostly on a hydropower
source. It results on a small share in the overall results.

Master Thesis LCA of Two Textile Products: Wool and Cotton
46
The scouring mill is located in Italy and its suppliers are producing wool in New Zealand,
Australia and South Africa. It means that large distances are travelled in order to produce 1
kilogram of wool top and strong impacts are emerging from transoceanic transports in all
the categories assessed (exceptions are considered in freshwater eutrophication and water
resource depletion.
The production of the wire used to tie the packages has important role on the toxicity
categories. A substitution of this material or the reduction of its inputs might increase the
environmental performance of the company.
In the study from Barber et al. (2006) [18] the average quantities of electricity is 0.2 kWh
while heat consumption is around 15 MJ for the production of one kilogram of wool top.
These values are quite similar to the ones reported by the supplier.
In the other hand, comparing the consumption of energy and water of the presented
scouring mill with those referenced values by BAT, possible improvements might be achieved
using different processing technologies or management. Regarding to the average values
reported in BAT the case study is producing 2.5 to 6 times more wastewater, 4 times more
energy and 3 times more electricity. The establishment of a roadmap fixing targets and
procedures to reduce its consumption shall provide opportunities to improve the overall
results.
4.1.3 Spinning
The contribution of each activity to the total impact in the spinning mills assessed is
presented in Table 1Table 22. In order to compare the relative contribution of each mill, the
relative contribution of the suppliers per environmental impact category is calculated
dividing its contribution by the maximum value calculated for each category (example of the
calculus provided in the table).
Table 22 - Results of spinning activity of each case study for the production of 1kg of yarn and its relative
contribution to the maximum value calculated for each category.
Impact category S3 S4 S5 S6 Relative contribution, %
S3 S4 S5 S6
Climate change,
kg CO2 eq 2.27E+00 3.86E+00 1.02E+00 6.02E+00 38
ª) 64 17 100
Ozone depletion,
kg CFC-11 eq 2.17E-07 4.36E-07 9.21E-08 5.39E-07 40 81 17 100
Human toxicity, cancer
effects, CTUh 2.27E-09 4.12E-09 2.15E-09 6.28E-09 36 66 34 100
Human toxicity, non-cancer
effects, CTUh 3.56E-08 6.75E-08 4.64E-08 1.12E-07 32 60 41 100
Acidification,
molc H+ eq
1.34E-02 1.74E-02 6.16E-03 3.28E-02 41 53 19 100
Freshwater eutrophication,
kg P eq 5.17E-05 7.22E-05 2.47E-05 1.52E-04 34 47 16 100
Marine eutrophication, 2.38E-03 3.20E-03 1.16E-03 4.91E-03 49 65 24 100

Master Thesis LCA of Two Textile Products: Wool and Cotton
47
kg N eq
Freshwater ecotoxicity,
CTUe 3.50E-01 4.02E-01 4.03E-01 1.06E+00 33 38 38 100
Water resource depletion,
m3 water eq
1.22E-03 4.44E-03 9.09E-04 7.11E-03 17 62 13 100
a) Example of the procedure performed for the calculation of the relative contribution of each supplier in all
the categories is: for S3 in the climate change category = 2.27E+00 / 6.02E+00 * 100.
The supplier S6 has the largest impacts in the overall results. This company is consuming
more energy (electricity and heat), water and packaging materials to produce 1 kg of yarn
when compared among the other suppliers. In general, the supplier S5 has the lowest
burdens in the total results.
The relative contribution of each activity to the total impact on spinning mills activity is
illustrated in Figure 9.

Master Thesis LCA of Two Textile Products: Wool and Cotton
48
Figure 9 - Relative contribution of each activity to the overall impact for spinning mills for the production
of 1 kg of yarn.
Spinning mill activities were evaluated and its contribution for the environmental impacts is
presented per kilogram of spun wool or wool yarn at spinning mill gate. Burdens have been
grouped by its origins as listed:
Water & Wastewater: consumption of water from aqueduct or well and wastewater
treatment in a municipal plant.
Chemicals: production of chemicals and auxiliaries utilized.
0% 10% 20% 30% 40% 50% 60% 70% 80% 90% 100%
S6
S5
S4
Water res. depletion: S3
S6
S5
S4
Freshwater ecotox.: S3
S6
S5
S4
Marine eutroph.: S3
S6
S5
S4
Freshwater eutroph.: S3
S6
S5
S4
Acidification: S3
S6
S5
S4
Human toxicity (NCE): S3
S6
S5
S4
Human toxicity (CE): S3
S6
S5
S4
Ozone depletion: S3
S6
S5
S4
Climate change: S3
Electricity Packaging Transports Water & Wastewater Heat Chemicals Solid Waste
Master Thesis LCA of Two Textile Products: Wool and Cotton
49
Packaging: manufacture of packaging materials used to pack the products as well as
plastic or cardboard cones utilized to give shape or support the yarns.
Electricity: generation of electricity in power plant or own facilities.
Heat: production of heat from natural gas in boilers to be used in the spinning.
Transports: transport of fibres to be spun from scouring mills to spinning mills.
Solid waste: disposal of the solid waste generated.
The main contributor in climate change and ozone depletion is electricity production. It
emerges as the major origin of its impacts in most of the suppliers (up to 85%) while heat
production is the larger hotspot in the supplier S4. Activities as packaging and chemicals
production are a significant contribution (around 15%) in the spinning mill S3.
Human toxicity categories have different key origins for its burdens in each supplier but
electricity is always sharing significant contributions (ranging from 20% in S5 to 50% in S3
and S6). Human toxicity (cancer effects) is mainly originated by contributions around 35% in
S3 and S6 and 25% in S4 from packaging production but also contributions from chemicals
production in the supplier S4 and S5 (30% and 50% respectively). Water and wastewater
have an important share in S4 around 30%. In the environmental impact category of human
toxicity (non-cancer effects) electricity keeps being the largest contributor for the suppliers
S3 and S6 (around 60%), while the major contributors in S4 and S5 are water & wastewater
(45%) and packaging materials production (65%).
The environmental impact of electricity generation is the key contributor in the category of
acidification. It shows up contributions larger than 55% in all the spinning mills assessed,
Transports also have important shares (up to 25%). A similar pattern of contributions is
verified in marine eutrophication where electricity has smaller impacts and transports’
contribution is now up to 35%.
Freshwater eutrophication is mainly originated by electricity production as well. 20% of its
contribution in this category is coming from water & wastewater in the supplier S4 and
packaging in the supplier S5.
Freshwater ecotoxicity has a similar pattern as the one verified for the category of human
toxicity (non-cancer effects).
In the category of water resource depletion the major contributors are electricity production
for S3 and S4 and packaging production for S5 and S6. Packaging also has an important
contribution in the environmental performance of S3 (up to 30%).
The use of fossil fuels in power plants, boilers as well as in engines of transports is
responsible for several negative impacts in the environment mainly due to the release of
greenhouse gases and heavy metals. Examples of exhaust gases coming from its combustion
and correspondent impacts are CO2, CH4 and N2O emissions which contributes most to the
Master Thesis LCA of Two Textile Products: Wool and Cotton
50
climate change and SO2 and NOx that have important burdens on acidification due to the
potential formation of sulphuric and nitric acid.
The consumption of these fuels is also associated to the emissions of heavy metals from
burning coal and light fuels processes as well as from the generation of mining spoils from
its extraction. Example of these toxic compounds which are released to air, water and soil are
chromium, mercury, lead and zinc which contributes most to the categories of human
toxicity and freshwater ecotoxicity.
As mentioned before ozone depletion emissions today are usually minimal and related to
electricity production. In the present case it is systematic burden with origin on the
processing of natural gas and the main actors are halons, HCFC’s and CFC’s.
Other important shares of electricity on environmental impact are in eutrophication: while
mining activities also generates the emissions of nutrients as phosphates which contributes
most to freshwater eutrophication, NOx and ammonia from exhaust gases increases the
potential impact of marine eutrophication.
Chemicals and packaging material have important impacts on ozone depletion in the
supplier S5 as in its production energy is consumed but also direct releases of ozone
depletion contributors.
Emissions of heavy metals and losses of pesticides and fertilizers from agricultural processes
in upstream activities of the cardboard production are the mains origins of its contributions.
The major contributor for the overall results is electricity. Packaging emerges as a significant
contributor in categories as human toxicity, freshwater eutrophication and water resource
depletion (mainly in the supplier S5 but also in S6). Transports have important contributions
(up to 30%) in ozone depletion, acidification and marine eutrophication. Chemicals
production has impact in the overall results of S4 and S5. The spinning mill S4 is producing
more heat and wastewater than the others, that way it is a hotspot in the categories of
climate change, ozone depletion and water resource depletion for the latter driver. Solid
waste accounts for not more than 3% of the impacts in all indicators.
The spinning activity has very low direct impacts, as direct emissions from this activity are
almost none. The main drivers for the environmental impacts of spinning mills are activities
which happen in upstream processes like e.g. electricity production. Therefore, possible
improvements are mainly depending on the supplier management.
The S3 and S5 companies, which are having relative impacts, are reporting consumption
levels of electricity and heat as the ones reported as an average in literature: 1 to 3 kWh/kg
of electricity and 1 to 5 MJ/kg of thermal energy. The heat used in S5 is 10 times lower than
the minimum reported while in S4 it is almost 3 times higher. Regarding the LCI of this
energetic consumption values, higher improvements might be needed in S4 in terms of heat

Master Thesis LCA of Two Textile Products: Wool and Cotton
51
and in S6 in terms of electricity consumption. That way, improvements in the overall results
may be achieved.
4.1.4 Dyeing
The contribution of each driver to the total impact in the three dyeing mills is shown in Table
1Table 23. Similarly to the previous results, in order to compare the relative contribution of
each mill the relative contribution of the suppliers per environmental impact category is
calculated dividing its contribution by the maximum value calculated for each category
(example of the calculus provided in the table).
Table 23 - Results of dyeing mills activity for the production of 1 kg of dyed yarn and its relative
contribution to the maximum value calculated for each category.
Impact category D1 D2 D3 Relative Contribution
D1 D2 D3
Climate change,
kg CO2 eq 5.36E+00 2.15E+00 1.84E+00 100 40 34
Ozone depletion,
kg CFC-11 eq 7.01E-07 2.50E-07 1.40E-07 100 36 20
Human toxicity (CE),
CTUh 1.92E-08 3.11E-08 1.04E-08 62 100 34
Human toxicity (NCE),
CTUh 2.75E-07 7.00E-07 1.91E-07 39 100 27
Acidification,
molc H+ eq
1.53E-02 1.06E-02 1.41E-02 100 69 92
Freshwater
eutrophication, kg P eq 1.68E-04 3.73E-04 1.09E-04 45 100 29
Marine eutrophication,
kg N eq 6.26E-03 8.88E-03 3.38E-03 71 100 38
Freshwater ecotoxicity,
CTUe 6.09E-01 1.02E+00 3.25E-01 59 100 32
Water resource
depletion, m3 water eq
4.63E-02 6.53E-02 1.61E-02 71 100 25
a) Example of the procedure performed for the calculation of the relative contribution of each supplier in all
the categories is: for D3 in the climate change category = 1.84E+00 / 5.36E+00 * 100.
The supplier D2 has the highest impacts in most of the categories and is the second largest
contributor in climate change and ozone depletion after the suppliers D1 and has the lowest
share in the category of acidification where D1 is the main contributor. D3 is the dyeing mill
which has the lowest shares in most of categories.
Dyeing mills activities were evaluated and its contribution for the environmental impacts is
presented per kilogram of dyed and bleached yarn at factory gate. Burdens have been
grouped along the lines of what has been done with the spinning mills. In this case the
group Chemicals also comprises the production of dyestuffs and bleach.
The relative contribution of each driver to the total impact on cotton fibre production is
illustrated in Figure 10.

Master Thesis LCA of Two Textile Products: Wool and Cotton
52
Figure 10 - Relative contribution of each activity to the overall impact for dyeing mills (D1, D2 and D3) for
the production of 1 kg of dyed yarn.
The main contributors to climate change and ozone depletion are heat and electricity
production, having shares up to 85% and 50% respectively. Electricity generation also has
burdens larger than 35% in acidification, being the key contributor to this category. Water
and wastewater emerges as the key factor for the environmental burdens in all the other
categories (human toxicity, eutrophication, freshwater ecotoxicity and water resource
depletion) with relative contributions ranging from 40% for freshwater ecotoxicity to 98% for
water resource depletion. Chemicals and transports have meaningful shares in the overall
results while solid waste doesn’t account for more than 1%.
Most of the climate change burdens are shared between electricity and heat production due
to the release to air of CO2, CH4 and N2O from fossil fuels combustion. The same drivers have
a similar share in Ozone Depletion due to the emission of halon, HCFC’s and CFC’s in
upstream activities of natural gas and light fuel processing. Electricity in D3 has small share
on the ozone depletion as its production mix is strongly based on coal which processing has
smaller emissions of CFC’s. Air emissions of SO2 and NOx originated in power plants, boilers
0% 10% 20% 30% 40% 50% 60% 70% 80% 90% 100%
D 3
D 2
Water res. depletion: D 1
D 3
D 2
Freshwater ecotox.: D 1
D 3
D 2
Marine eutroph.: D 1
D 3
D 2
Freshwater eutroph.: D 1
D 3
D 2
Acidification: D 1
D 3
D 2
Human toxicity (NCE): D 1
D 3
D 2
Human toxicity (CE): D 1
D 3
D 2
Ozone depletion: D 1
D 3
D 2
Climate change: D 1
Water & Wastewater Heat Electricity Chemicals Packaging Transports Solid Waste

Master Thesis LCA of Two Textile Products: Wool and Cotton
53
and transports from the burning of fossil fuels originate big burdens in the acidification
results.
Human toxicity (cancer and non-cancer effects) and freshwater ecotoxicity are mainly
affected by heavy metals emissions to air, water and soil from wastewater emissions and
treatment but also from upstream processes related to the electricity production. Chromium,
mercury, zinc and lead are the main pollutants which conduct these impacts. The production
of packaging cardboard has some impact in freshwater ecotoxicity due to agriculture
activities (pollutants releases due to losses of fertilizers and pesticides) while wire production
is related to heavy metal emissions from its manufacture.
Chemicals production also has an important contribution in categories as human toxicity
(cancer effects) and acidification. While in the first it is verified because of chromium and
mercury emissions from electricity produced (upstream) and disposal of solid wastes
generated, in the second it is due sulphur dioxide, nitrogen oxides and ammonia to air from
its production processes.
Freshwater eutrophication is mainly caused by phosphate emissions from wastewater
emissions and the disposal of spoil from coil and lignite mining in upstream processes of
electricity production.
Marine eutrophication is most related to emissions of NOx to air from electricity production
(combustion of fossil fuels) and emissions of nitrates and ammonia (ion) to water from
wastewater emissions.
As dyeing consumes high quantities of water and consequently generates big amounts of
wastewater, strong effects of Water & Wastewater are verified in the categories of human
toxicity (cancer and non-cancer effects), eutrophication (freshwater and marine), freshwater
ecotoxicity end, of course, water resource depletion. Energy consumption (mainly heat but
also electricity) is most of the times associated with water use in the textile industry. This is a
major issue in the potential impact categories of climate change, ozone depletion and
acidification.
Comparing the inventory data for electricity, heat and water consumption per kilogram of
dyed product with the energy use BAT values presented in section 2.4.2.
The dyeing mill D1 has the highest consumptions patterns. It corresponds to 1.7 kWh
against those 0.8 to 1.1 kWh in BAT and is using 3 times more energy and 5 times
more water than the referenced maximum values.
The dyeing mill D2 is consuming similar amount of electricity as D1 and 7 times more
water than the referred on BAT while is consuming 11 MJ of energy that is lower than
the referenced range of 13 to 16 MJ.

Master Thesis LCA of Two Textile Products: Wool and Cotton
54
D3‘s electricity consumption is equal to minimum in the literature (0.8 kWh) and the
supplier is using 9 MJ of energy (lower than the in BAT). However its water
consumption (around 80 L) is bigger than the reported 15 to 50 litres.
Water & Wastewater activities are the main problems associated with dyeing. The
establishment of a roadmap fixing targets and procedures to reduce its consumption shall
provide opportunities to improve the overall results. Electricity and heat are also important
drivers due to the extraction, processing and use of non-renewable sources of energy for
energy production. It is expected that saves on the quantity used of water might reduce the
energy needs.
4.2 LCA of Cotton Yarns
4.2.1 Cotton cultivation
The contribution of each driver to the total impact on cotton fibre production from both case
studies (conventional and organic cotton productions) is shown in Table 24. Similarly and to
compare the relative contribution of each cotton grower, its contribution is divided by the
maximum value calculated for each category.
Table 24 - Results from cotton cultivation (conventional and organic) for the production of 1 kg of ginned
cotton and its relative contribution to the maximum value calculated for each category.
Impact category Conventional Organic Relative contribution, %
Conventional Organic
Climate change, kg CO2 eq 2.93E+00 5.97E-01 100 20 a)
Ozone depletion, kg CFC-11 eq 2.09E-07 3.10E-08 100 15
Human toxicity, cancer effects, CTUh 2.04E-08 2.24E-08 91 100
Human toxicity, non-cancer effects, CTUh 4.62E-06 2.10E-05 22 100
Acidification, molc H+ eq 2.04E-02 6.06E-03 100 30
Freshwater eutrophication, kg P eq 2.19E-03 2.01E-03 100 92
Marine eutrophication, kg N eq 4.58E-02 6.15E-04 100 1
Freshwater ecotoxicity, CTUe 2.83E+01 1.13E+01 100 40
Water resource depletion, m3 water eq 1.29E+00 9.38E-01 100 73
a) Example of the procedure performed for the calculation of the relative contribution of each supplier in all
the categories is: for organic in the climate change category = 5.97E-01 / 2.93E+00 * 100.
The organic cotton grower shows lower contributions for the overall results. This fact is
justified by the low use of machinery and no consumption of pesticides. This organic cotton
culture also has highest yield of production when compared with the conventional
production process. That way, it is producing more with fewer inputs.
Nevertheless, the organic cotton cultivation has higher burdens in human toxicity categories,
This is because the emissions of heavy metals in soil are bigger when compared with the

Master Thesis LCA of Two Textile Products: Wool and Cotton
55
conventional grower. According to the study from Tewolde et al., (2011 [64], applying poultry
litter might increase soil Zn by about 59% and soil Cu by 134% relative to applying
ammonium nitrate. The concentrations of heavy-metal contents of synthetic and organic
fertilizers utilized to model these emissions are summarized in Table H.3 and H.4 in the
Appendix H, respectively.
The relative contribution of each activity to the total impact on cotton fibre production is
illustrated in Figure 11.
Figure 11 - Relative contribution of each activity to the overall impact for 1 kg of conventional and
organic cotton production.
Cotton cultivation processes were evaluated and its contribution for the environmental
impacts is presented per kilogram of cotton fibre after ginning. Burdens have been grouped
by its causes as listed:
Field Emissions: estimated losses of fertilizer and pesticides to air, water or soil.
Cotton Seeds: production of seeds and chemicals utilized for their treatments.
Irrigation: water used for irrigation as well as the energy associated.
Pesticides: it includes the production of the pesticides used.
Fertilizers: it includes the production of the fertilizers used.
Machinery: this group comprises the machinery used in the cultivation of cotton (e.g.,
seeding, fertilizer and pesticide application) as well as the utilization of a tractor on
transports through the farm of people and assets related to the cotton production.
0% 20% 40% 60% 80% 100%
Org.
Water res. depletion: Conv.
Org.
Freshwater ecotox.: Conv.
Org.
Marine eutroph.: Conv.
Org.
Freshwater eutroph.: Conv.
Org.
Acidification: Conv.
Org.
Human toxicity (NCE): Conv.
Org.
Human toxicity (CE): Conv.
Org.
Ozone depletion: Conv.
Org.
Climate change: Conv.
Field Emissions Fertilizers Irrigation Machinery Ginning Cotton Seeds Pesticides

Master Thesis LCA of Two Textile Products: Wool and Cotton
56
Ginning: transport from field to the ginning mill, processing through the cotton gin,
packaging materials production (bale bags and ties) and packaging process.
Most of the climate change contribution is due to fertilizer production processes (50%)
followed by field emissions (15%) and machinery operations (13%). Emissions of N2O are the
main reason behind these results.
The fertilizers production is the dominant sponsors to the category of ozone depletion in the
conventional supplier (55%) and is the second main contributor in the organic supplier (40%)
following Irrigation (60%). Other important contributions in conventional grower are the
machinery operations which are consuming diesel. These shares are related to the release of
halons, HCFC’s and CFC’s from electricity production in upstream processes. As mentioned in
0, nowadays, most of the ozone depleting chemicals is related to electricity production
(mainly from production and refinement of fuels.).
Field emissions were identified to be a major contributor for impact categories such as
human toxicity, freshwater eutrophication and freshwater ecotoxicity (relative contributions
are higher than 80%). This result is also verified in marine eutrophication in the organic
cotton supplier.
Fertilizers production process is in itself a source of NH3 and NOx emissions and which are
contributing most to the impact category of acidification. This category is also strongly
affected by the emissions of NH3 and NOx from field (25%). Machinery operations consume
fuel and thus it is a source of NOx emissions which also contributes to potential acidification
in the conventional cotton production (20%). Upstream activities related to electricity
generation reflect the contribution from irrigation (20% in organic grower) and ginning
activities.
Cotton seeds, pesticides, machinery and ginning do not account for more than 10 to 20% of
the impacts for all indicators. An exception is made to the machinery use in the organic
grower which represents around 25% of the contribution to the ozone depletion potential.
Literature values for conventional production of cotton for CO2 eq emission are 2 and 3
kilograms [27, 36] These are similar to the values here calculated. However, when the field
emissions are compared with results from [36], it is possible to conclude that they are 10%
lower and the production fertilizers have higher contributions.
Field application of fertilizers was the main contributor to the environmental impact in the
categories of human toxicity (cancer and non-cancer effects) and freshwater ecotoxicity
based on its emissions of heavy metals as chromium, cadmium, nickel lead and zinc to soil.
Emissions from pesticides to the soil as prometryn and lambda cyhalothrin are also
important contributors in the freshwater ecotoxicity category.

Master Thesis LCA of Two Textile Products: Wool and Cotton
57
Freshwater and marine eutrophication main source is in field emissions. In the first case it is
verified mainly from phosphorous and phosphate emissions to water and in the second by
the releases of nitrates to water as well as nitrous oxide, nitrogen oxides and ammonia to air.
The organic cotton production has an impact in Marine Eutrophication 74 times lower as its
field emissions are lower due to the efficient management of the nitrogen nutrient
application.
Land use and water consumption not surprisingly a burden directly related to the cotton
cultivation. These categories are linked to the yield of production, each means that for the
presented studies higher yields have less needs of land and water. Nevertheless, to have
higher yields using similar amounts of water, a proper drainage system, efficient irrigation
and use of organic fertilizer are needed.
Field emissions are a larger contributor to several environmental impact categories: human
toxicity and freshwater ecotoxicity due to the use of pesticides and eutrophication was
strongly influenced by nitrate and phosphorus emissions. Acidification potential was
influenced by ammonia and nitrogen oxides and climate change was influenced by nitrous
oxide. Precision management of nitrogen fertilizer will continue to be a high priority for the
cotton producers around the world.
Fertilizer production is another important issue on climate change, ozone depletion, and
acidification. Nitrogen fertilizer represents a major burden in the conventional grower
cultivation while organic fertilizers in the organic cultivation. It reinforces the need for a
careful management of nutrients applications to the soil (mainly of nitrogen).
4.2.2 Spinning
The contribution of each driver to the total impact in the two spinning mills that are
processing cotton is presented in Table 25. The calculation allowing for the comparison of
the relative contribution of each mill for each impact category is performed.
Table 25 - Results of spinning activity of each case study for the production of 1 kg of yarn and its relative
contribution to the maximum value calculated for each category
Impact category S1 S2 Relative contribution, %
S1 S2
Climate change, kg CO2 eq 2.50E+00 7.07E-01 100 28a)
Ozone depletion, kg CFC-11 eq 7.22E-08 9.74E-08 77 100
Human toxicity, cancer effects, CTUh 1.38E-08 3.01E-09 100 22
Human toxicity, non-cancer effects, CTUh 2.37E-07 4.09E-08 100 17
Acidification, molc H+ eq 2.64E-02 5.41E-03 100 20
Freshwater eutrophication, kg P eq 1.10E-04 5.11E-05 100 47
Marine eutrophication, kg N eq 5.30E-03 1.29E-03 100 24
Freshwater ecotoxicity, CTUe 4.51E-01 1.63E-01 100 36

Master Thesis LCA of Two Textile Products: Wool and Cotton
58
Water resource depletion, m3 water eq 1.35E-02 3.93E-03 100 29
a) Example of the procedure performed for the calculation of the relative contribution of each supplier in all
the categories is: for S2 in the climate change category = 7.07E-01 / 2.50E+00 * 100.
The supplier S1 presents the larger impacts for the overall categories. This is to say that in
general this company is using more resources to produce 1 kg of yarn. However the supplier
S2 has a bigger contribution in the category of ozone depletion due to the use of nuclear
energy on its national energy grid mix.
The relative contribution of each activity to the overall impact on cotton fibre production is
illustrated in Figure 12.
Figure 12 - Relative contribution of each activity to the total impact in spinning mills S1 and S2 for the
production of 1 kg of yarn.
Spinning mill activities were evaluated and its contribution for the environmental impacts is
presented per kilogram of cotton yarn at the spinning mill gate. Burdens have been grouped
by its causes as listed:
Water & Wastewater: consumption of water from aqueduct or well and wastewater
treatment in a municipal plant.
Chemicals: production of chemicals and auxiliaries.
Packaging: manufacture of packaging materials.
Electricity: generation of electricity in the power plant.
Heat: production of calorific energy within the facilities.
0% 20% 40% 60% 80% 100%
S2
Water res. depletion: S1
S2
Freshwater ecotox.: S1
S2
Marine eutroph.: S1
S2
Freshwater eutroph.: S1
S2
Acidification: S1
S2
Human toxicity (NCE):…
S2
Human toxicity (CE): S1
S2
Ozone depletion: S1
S2
Climate change: S1
Electricity Transports Water & Wastewater Heat Chemicals Packaging Solid Waste
Master Thesis LCA of Two Textile Products: Wool and Cotton
59
Transports: transport of fibres to be spun from cotton growers to the spinning mill.
Solid waste: waste disposal.
Most of the climate change contribution is due to the electricity generation (70 to 80%) and
transportation (15 to 25%) due to the combustion of fossil fuels and the consequent
emissions of CO2, CH4 and N2O in power plants and engines. The same activities are
identified as the main responsible for the potential of acidification due to the emissions of
SO2 and NOx.
Contributions to the ozone depletion are different in both case studies due to its sources of
heat and electricity production mix. In one hand, S1 is using natural gas (fossil fuel) for heat
production and S2 uses wood chips (wood fuel) burned in a district heating system. On the
other hand the electricity mix of S2 has a strong fraction of nuclear power which contributes
most to the ozone depletion (41%) as uranium enrichment plants are the main emitters of
chemicals which damage the ozone layer, specifically CFC-114 (Freon) used as coolant while
S1 has a small contribution from electricity production as its production mix is using mainly
coal. The emissions from road transports are also different, being in S1 two times larger than
S2. In summary, the processes using fossil or nuclear sources of energy have larger
contributions to this impact category.
The supplier S1 consumes more water on its activities than S2 and consequently Water &
Wastewater’ contributions in categories as human toxicity (cancer and non-cancer effects),
eutrophication (freshwater and marine), freshwater ecotoxicity and water resource depletion
are also higher due to the wastewater generated. The major contribution in water resource
depletion from S2’s activities has origin in electricity production because of the water use
(fresh and decarbonized) for cooling the nuclear reactors.
Human toxicity and freshwater ecotoxicity are mainly affected by heavy metals emissions to
air, water and soil from upstream activities of electricity generation as disposal of lignite and
hard coals ashes or the combustion of fossil fuels. Emissions of heavy metals in wastewater
after treatment in municipal plant also show an important burden in this impact category.
Responsible for human toxicity and freshwater ecotoxicity are the emissions to water, air and
soil of chromium, mercury, lead and zinc. For the latter category emissions of antimony and
vanadium are also observed.
Freshwater eutrophication is mainly caused by phosphate emissions from wastewater
treatment plant and the disposal of spoil from coil and lignite mining in upstream processes
of electricity production while marine eutrophication is mainly caused by emissions of NOx to
air from electricity production and transports use (combustion of fossil fuels) and emissions
of nitrates and ammonia (ion) to water from the wastewater treatment plant.
It summary, electricity and transport are the main responsible for spinning impacts due to
the extraction, processing and use of non-renewable sources of energy: as uranium and
fossil fuels for electricity production or diesel for transportation of raw fibre to the spinning

Master Thesis LCA of Two Textile Products: Wool and Cotton
60
mill. Results show that electricity consumption represents the largest contribution to the
overall categories. Its relative contribution is larger than 25% for the majority of the
indicators assessed (reaching figures larger than 40% for most of the categories). Road
transports show the larger impact. It represents more than 15% of the impact for the
categories climate change, ozone depletion, acidification (10% in S1), marine eutrophication
and freshwater ecotoxicity. seafreight has contributions up to 20% in categories as
acidification and marine eutrophication in S2’s impacts.
Another important issue is related to the contribution of water & wastewater in human
toxicity, eutrophication and freshwater ecotoxicity categories. These impacts are larger in S1
(around 3 times) due to its larger consumption of water. Heat, solid waste, packaging and
chemicals account for not more than 10% of the impacts in all indicators (exception for the
heat contribution to ozone depletion which has a contribution of 25%).
The spinning activity has very low direct impacts, as direct emissions from this activity are
almost none. The main environmental impacts of spinning mills are due to activities which
happen in upstream processes as electricity production. Therefore, possible improvements
are mainly depending on the supplier energy management. Direct impacts are mainly
coming from heat production and, the most visible one, from water consumption and its
releases.
4.2.3 Dyeing and bleaching
The contribution of each activity to the overall impact in the two dyeing & bleaching mills is
shown in Table 1Table 26.
Table 26 - Results of dyeing & bleaching activity of each case study for the production of 1 kg of dyed
product and its relative contribution to the maximum value calculated for each category
Impact category D&B 2 D&B 3 Relative contribution, %
D&B 2 D&B 3
Climate change, kg CO2 eq 2.27E+00 1.82E+00 100 80a)
Ozone depletion, kg CFC-11 eq 2.55E-07 1.37E-07 100 54
Human toxicity, cancer effects, CTUh 4.10E-08 1.07E-08 100 26
Human toxicity, non-cancer effects, CTUh 7.28E-07 1.91E-07 100 26
Acidification, molc H+ eq 1.03E-02 1.31E-02 79 100
Freshwater eutrophication, kg P eq 3.89E-04 1.10E-04 100 28
Marine eutrophication, kg N eq 8.68E-03 3.17E-03 100 37
Freshwater ecotoxicity, CTUe 1.14E+00 3.30E-01 100 29
Water resource depletion, m3 water eq 6.54E-02 1.61E-02 100 25
a) Example of the procedure performed for the calculation of the relative contribution of each supplier in all
the categories is: for D&B 3 in the climate change category = 1.82E+00 / 2.27E+00 * 100.

Master Thesis LCA of Two Textile Products: Wool and Cotton
61
The supplier D&B 2 has the largest impacts in the overall results except for the
environmental category of Acidification. In general this company has highest consumption of
energy (electricity, heat and transports), water and chemicals in order to dyed and bleach 1
kg of yarn than the D&B 3.
Dyeing mills activities were evaluated and its contribution for the environmental impacts is
presented per kilogram of dyed and bleached yarn at factory gate. Burdens have been
grouped along the lines of what has been done with the spinning mills. In this case the
group Chemicals comprises the production of dyestuffs and bleach.
The relative contribution of each driver to the total impact on cotton fibre production is
illustrated in Figure 13.
Figure 13 - Relative contribution of each activity to the total impact in both dyeing & bleaching mills for
the production of 1 kg of dyed product.
Energy consumption for heat and electricity production is the biggest contributor in the
potential impact categories of climate change, ozone depletion and acidification as well as
marine eutrophication but only in the supplier D&B 2. Heat contribution for ozone depletion
is around 90% in supplier D&B 3.
As dyeing & bleaching consumes high quantities of water and consequently generates big
amounts of wastewater, strong effects of water & wastewater are verified in the categories of
human toxicity, eutrophication (freshwater and marine), freshwater ecotoxicity end, of
course, water resource depletion – contributions larger than 45%.
0% 20% 40% 60% 80% 100%
D&B 3
Water res. depletion: D&B 2
D&B 3
Freshwater ecotox.: D&B 2
D&B 3
Marine eutroph.: D&B 2
D&B 3
Freshwater eutroph.: D&B 2
D&B 3
Acidification: D&B 2
D&B 3
Human toxicity (NCE): D&B 2
D&B 3
Human toxicity (CE): D&B 2
D&B 3
Ozone depletion: D&B 2
D&B 3
Climate change: D&B 2
Water & Wastewater Electricity Heat Chemicals Packaging Transports Solid Waste
Master Thesis LCA of Two Textile Products: Wool and Cotton
62
Chemicals have meaningful shares (around 10%) on the potential environmental impacts of
climate change, ozone depletion, human toxicity (cancer effects), acidification and freshwater
ecotoxicity as substantial amounts of dyes and other chemicals are used in this process.
Transports and solid waste account for not more than 3% of the impacts in all categories.
Packaging materials production has meaningful contributions (up to 30%) in the categories
of human toxicity (non-cancer effects) and freshwater ecotoxicity, especially in D&B 2.
Most of the climate change burdens are shared between electricity and heat production due
to the release to air of CO2, CH4 and N2O from fossil fuels combustion. The same drivers have
a similar share in ozone depletion in the supplier D&B 2 due to the emission of halon,
HCFC’s and CFC’s in upstream activities of natural gas processing for electricity and heat
generation. In the case of D&B 3 his share is coming from the processing of the light fuel
utilized for heat generation as its electricity production mix is mainly based on coal that has
smaller emissions of CFC’s.
The air emissions of SO2 and NOx from electricity power plants that are converting the
chemical energy of fossil fuels into electricity are the main cause for Acidification results.
Human toxicity (cancer and non-cancer effects) and freshwater ecotoxicity are mainly
affected by heavy metals emissions to air, water and soil from wastewater treatment plants
activity and its emissions of chromium, mercury, zinc and lead to the different environmental
compartments. For the latter category emissions of vanadium, zinc and copper, mercury and
lead are also contributors from electricity and heat production. The production of packaging
cardboard has some impact in freshwater ecotoxicity due to agriculture activities.
Freshwater eutrophication is mainly caused by phosphate emissions from wastewater
treatment plant and the disposal of spoil from coil and lignite mining in upstream processes
of electricity production. While marine eutrophication has origin in emissions of NOx to air
from electricity production (combustion of fossil fuels) and emissions of nitrates and
ammonia (ion) to water from the wastewater treatment plant.
Chemicals production also has an important contribution in categories as human toxicity
(cancer effects) and acidification. Human toxicity is mainly due to chromium and mercury
emissions from electricity use and disposal of waste. Acidification is due to the releases of
SO2 and NOx due to electricity generation.
Water & wastewater activities are the main cause of dyeing & bleaching. The establishment
of a roadmap fixing targets and procedures to reduce its consumption shall provide
opportunities to improve the overall results. Electricity and heat are also important drivers
due to the extraction, processing and use of non-renewable sources of energy for energy
production. Once more, the water and energy consumption is related so as energy is needed
to heat and handle the water used during processing activities.

Master Thesis LCA of Two Textile Products: Wool and Cotton
63
5 ANALYSING SCENARIOS FOR YARN PRODUCTION (COTTON
AND WOOL)
5.1 Identifying and assessing all scenarios
In the present section different scenarios of cotton and wool dyed yarn’s production have
been drawn. This is made assuming multiple combinations possible for the production of
each material (cotton and wool yarn) based on the practices from each supplier that
provided the data used in this work. In total 36 cases for wool and 8 for cotton are possible
to draw.
Based on the average losses of material reported by suppliers, the quantity of raw materials
needed in each life cycle stage to produce 1 kg of dyed yarn is calculated and illustrated in
Figure 14. To create a most likely scenario of a supply chain comprising the fibre production
until the production of a dyed yarn it is assumed that:
The dyeing processes are done after spinning so as:
- Dyeing mills are dyeing only yarns;
- Spinning mill only spun undyed and unbleached fibres;
All the case companies assessed can supply each other (e.g. greasy wool from F1 going
to the scouring mill and then S3 and D1.
Figure 14 - Supply chain for the production of cotton and wool dyed yarns regarding to the suppliers
assessed and its rate of raw fibre conversion.

Master Thesis LCA of Two Textile Products: Wool and Cotton
64
5.1.1 Wool yarns
The whole set of all the possible combinations to model the yarns from wool are presented
in Table 27 and the results are plotted in Figure 15.
Table 27 - Number of combinations possible for the production of dyed wool yarns.
Combinations Suppliers
W 1 F1 Scouring Wool S3 D1
W 2 F1 Scouring Wool S4 D1
W 3 F1 Scouring Wool S5 D1
W 4 F1 Scouring Wool S6 D1
W 5 F1 Scouring Wool S3 D2
W 6 F1 Scouring Wool S4 D2
W 7 F1 Scouring Wool S5 D2
W 8 F1 Scouring Wool S6 D2
W 9 F1 Scouring Wool S3 D3
W 10 F1 Scouring Wool S4 D3
W 11a)
F1 Scouring Wool S5 D3
W 12 F1 Scouring Wool S6 D3
W 13 F2 Scouring Wool S3 D1
W 14 F2 Scouring Wool S4 D1
W 15 F2 Scouring Wool S5 D1
W 16 F2 Scouring Wool S6 D1
W 17 F2 Scouring Wool S3 D2
W 18 F2 Scouring Wool S4 D2
W 19 F2 Scouring Wool S5 D2
W 20 b)
F2 Scouring Wool S6 D2
W 21 F2 Scouring Wool S3 D3
W 22 F2 Scouring Wool S4 D3
W 23 F2 Scouring Wool S5 D3
W 24 F2 Scouring Wool S6 D3
W 25 F3 Scouring Wool S3 D1
W 26 F3 Scouring Wool S4 D1
W 27 F3 Scouring Wool S5 D1
W 28 F3 Scouring Wool S6 D1
W 29 F3 Scouring Wool S3 D2
W 30 F3 Scouring Wool S4 D2
W 31 F3 Scouring Wool S5 D2
W 32 F3 Scouring Wool S6 D2
W 33 F3 Scouring Wool S3 D3
W 34 F3 Scouring Wool S4 D3
W 35 F3 Scouring Wool S5 D3
W 36 F3 Scouring Wool S6 D3
a) Best case scenario
b) Worst case scenario

Master Thesis LCA of Two Textile Products: Wool and Cotton
65
Figure 15 - Results for wool yarn combinations
0%
10%
20%
30%
40%
50%
60%
70%
80%
90%
100%
Climate change Ozone depletion Human toxicity (CE) Human toxicity
(NCE)
Freshwater
eutrophication
Marine
eutrophication
Freshwater
ecotoxicity
Water resource
depletion
W1 W2 W3 W4 W5 W6 W7 W8 W9 W10 W11 W12 W13 W14 W15 W16 W17 W18
W19 W20 W21 W22 W23 W24 W25 W26 W27 W28 W29 W30 W31 W32 W33 W34 W35 W36

Master Thesis LCA of Two Textile Products: Wool and Cotton
66
In general the raw fibre production is the major contributor to the overall results except in
ozone depletion and water resource depletion. Combinations which are using the supplier F2
present the worst results in most of the impact categories (ozone depletion, human toxicity
(NCE), freshwater eutrophication, marine eutrophication and freshwater ecotoxicity), F3 in
climate change and water resource depletion and F1 in human toxicity (CE). The lowest
results are observed in four distinct categories in the suppliers by F1 and F3 namely in
climate change, ozone depletion, marine eutrophication and water resource depletion for the
first one and in human toxicity (cancer and non-cancer effects), freshwater eutrophication
and freshwater ecotoxicity.
When the suppliers S6 and D2 are combined (yarn 8, 20 and 32) the largest contributions are
observed in most of the environmental categories. While the combination of the companies
S6 and D1 (yarn 4, 16 and 28) with the assessed sheep farmers (F1, F2 and F3) originates the
major contributors for climate change and ozone depletion. On the other hand when S5 and
D3 are combined (yarn 11, 23 and 35) with each one the sheep farmers the best results are
achieved in all the impact categories analysed.
5.1.2 Cotton yarns
Table 28 lists the number of combinations possible to model the cotton yarns and its results
are illustrated in Figure 16.
Table 28 - Number of combinations possible for the production of dyed cotton yarns
Combinations Suppliers
C 1 Conventional S1 D&B 2
C 2 Conventional S2 D&B 2
C 3 Conventional S1 D&B 3
C 4 Conventional S2 D&B 3
C 5 Organic S1 D&B 2
C 6 Organic S2 D&B 2
C 7 Organic S1 D&B 3
C 8 Organic S2 D&B 3

Master Thesis LCA of Two Textile Products: Wool and Cotton
67
Figure 16 - Results for cotton yarn combinations.
As raw fibre production is the major contributor in the overall results the results are mainly
influenced by this life cycle stage. That way the combinations for conventional cotton yarns
(1, 2, 3 and 4) have the largest contributions in the overall results with the exception in the
environmental impact category of human toxicity (cancer and non-cancer effects) due to the
use of organic fertilizers as mentioned in 4.2 and freshwater eutrophication due to the water
emissions in D&B 2. When the suppliers S1 and D&B 2 are joint (yarn 1 and 5) the impacts
are higher in most of the impact categories. For both cottons origins (conventional and
organic) the lowest contributions are found when the supplier S2 and D&B 3 are combined
(yarn 4 and 8).
In the following two cases are analysed: best and worst. Then, the life cycle stages of these
materials are assembled in order to create a supply chain from raw fibre to dyed yarn
production. This is done for wool and cotton products.
5.2 Analysing the best and worst results from scenarios
The best and worst case scenarios have been selected according to the results of the
possible combinations achieved in the present chapter and assuming that the best and worst
comprise a general behaviour. This, however, is not the ideal selection because there are
some impact categories which scores are not the best or the worst ones (e.g. the spinning
mill S2 has the lowest contributions in the overall results but it has a larger contribution in
the impact category of ozone depletion).
0%
10%
20%
30%
40%
50%
60%
70%
80%
90%
100%
C1 C2 C3 C4 C5 C6 C7 C8

Master Thesis LCA of Two Textile Products: Wool and Cotton
68
Here, just the conventional cotton product is assessed so as organic cotton product’s results
are only commented based on its life cycle stage results.
As only one supplier for conventional cotton and scouring is studied, its results are equal in
both cases (best and worst). Table 29 lists the case that perform best and worst for wool and
cotton.
Table 29 – Selected suppliers to draw the wool and cotton supply chains for each one of the defined cases:
best and worst.
Combination Material Performance in impact categories Suppliers
W 11 Wool
Best F1ScouringS5D3
W 20 Worst F2ScouringS6D2
C 4 Cotton
Best ConventionalS2D&B 3
C 1 Worst ConventionalS1D&B 2
The best farm (F1) was selected based on a simple criteria analysis where each impact
category was assumed to have the same weight and which calculus are explained in the
Appendix I.
5.2.1 Wool yarns
Figure 17 illustrates the results for the three selected case scenarios for the production of
dyed wool yarns and Figure 18 the relative contribution of each life cycle stage.
Figure 17 – LCA results for the worst and best cases studied for wool dyed yarn production. Results for the
production of 1 kg of dyed yarn.
As might be observed there is a considerable potential of improvement (around 50%) in the
overall results for the worst case scenario. An exception is made for the impact category of
human toxicity (cancer effects) for which the two cases have similar results. A potential
improvement might be expected if no fertilizers and pesticides would be used during the life
cycle stage of sheep farming as in the supplier F3.
0%
10%
20%
30%
40%
50%
60%
70%
80%
90%
100%
Worst Best

Master Thesis LCA of Two Textile Products: Wool and Cotton
69
Figure 18 – Relative contribution of each life cycle stage to the total impact in the wool case scenarios:
worst and best. Results for the production of 1 kg of dyed yarn.
Sheep farming emerges as the main contributor in most of the environmental impact
categories except in ozone depletion (all cases) and water resource depletion (worst case).
Ozone depletion has important contributions coming from the four life cycle stages. This
category is highlighted by spinning in worst case and by scouring in the best case. Water
resource depletion is a characteristic burden associated to dyeing and secondly to sheep
farming.
Comparing the results from the scouring, spinning and dyeing activities it is verified that:
In the worst scenario spinning is the major contributor in climate change, ozone
depletion and acidification mainly due to electricity related activities while dyeing is the
main contributor in the rest of the categories because of energy used to warm bowls,
water consumption and emissions.
In the best scenario spinning has very low contributions, dyeing has the larger
contributions in most of the impact categories with the exception of ozone depletion
and marine eutrophication where scouring contributes most.
0% 10% 20% 30% 40% 50% 60% 70% 80% 90% 100%
Best
Water resource depletion: Worst
Best
Freshwater ecotoxicity: Worst
Best
Marine eutrophication: Worst
Best
Freshwater eutrophication: Worst
Best
Acidification: Worst
Best
Human toxicity (NCE): Worst
Best
Human toxicity (CE): Worst
Best
Ozone depletion: Worst
Best
Climate change: Worst
Sheep Farming Scouring Spinning Dyeing

Master Thesis LCA of Two Textile Products: Wool and Cotton
70
5.2.2 Cotton yarns
In Figure 19 is illustrated the results for the three selected case scenarios for the production
of dyed cotton yarns and in Figure 20 the relative contribution of each life cycle stage in
these results.
Figure 19 - LCA results for the worst, average and best cases studied for cotton dyed yarn production.
Results for the production of 1 kg of dyed yarn.
Figure 20 - Relative contribution of each life cycle stage to the total impact in the cotton case scenarios:
worst, average and best. Results for the production of 1 kg of dyed yarn.
0%
10%
20%
30%
40%
50%
60%
70%
80%
90%
100%
Worst Best
0% 10% 20% 30% 40% 50% 60% 70% 80% 90% 100%
Best
Water resource depletion: Worst
Best
Freshwater ecotoxicity: Worst
Best
Marine eutrophication: Worst
Best
Freshwater eutrophication: Worst
Best
Acidification: Worst
Best
Human toxicity (NCE): Worst
Best
Human toxicity (CE): Worst
Best
Ozone depletion: Worst
Best
Climate change: Worst
Cotton cultivation Spinning Dyeing & Bleaching

Master Thesis LCA of Two Textile Products: Wool and Cotton
71
According to these results it is verified that significant potential improvements on the supply
chain might be observed for the environmental impact categories of climate change, human
toxicity (cancer effects) and acidification where reductions on its impacts might achieve
values around 30%. These impact categories are strongly influenced by the spinning and
dyeing & bleaching mills activities. For the overall results, cotton cultivation emerges as the
main contributor (with the exception but with similar figures in human toxicity and
acidification in the worst case scenario).
Comparing spinning and dyeing activities it is verified that:
In the worst scenario spinning is the major contributor in climate change (but with
similar figures as dyeing) and acidification while dyeing has the largest contributions in
all the other categories. Spinning as significant contribution in the categories of ozone
depletion and human toxicity (cancer effects)
In the best scenario dyeing is the major contributor in all the impact categories, spinning
has significant contribution in climate change, ozone depletion, human toxicity (cancer
effects) and acidification.
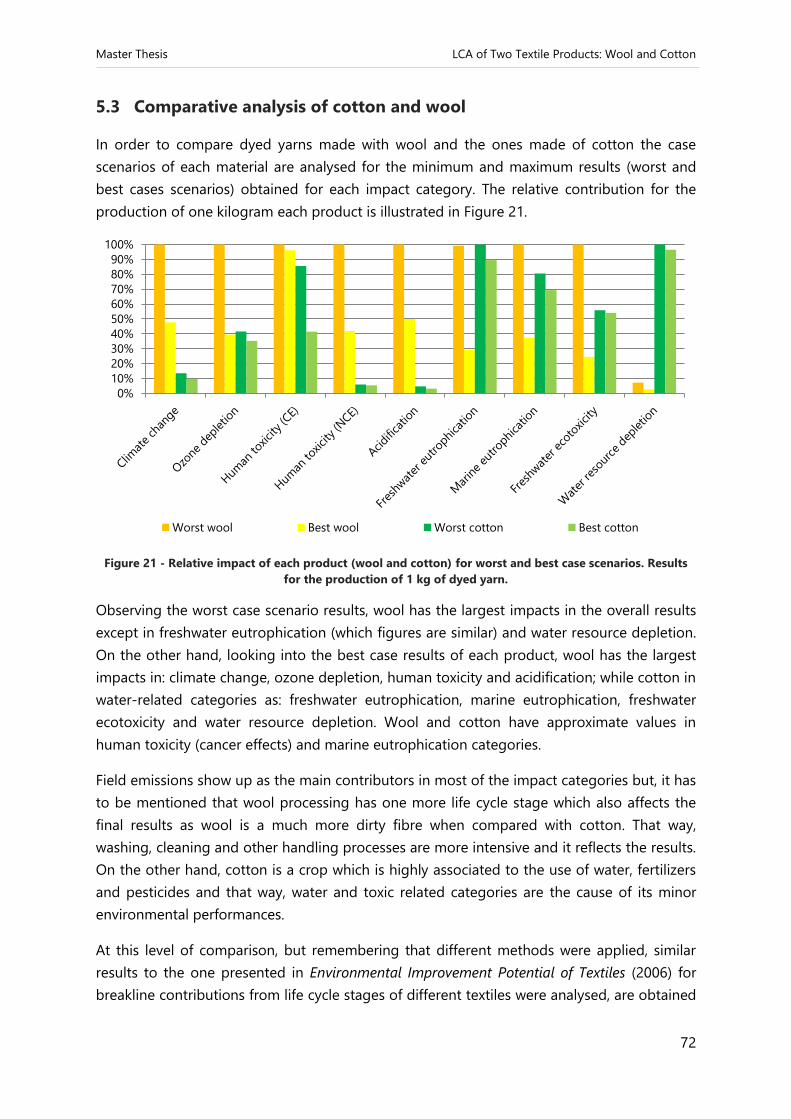
Master Thesis LCA of Two Textile Products: Wool and Cotton
72
5.3 Comparative analysis of cotton and wool
In order to compare dyed yarns made with wool and the ones made of cotton the case
scenarios of each material are analysed for the minimum and maximum results (worst and
best cases scenarios) obtained for each impact category. The relative contribution for the
production of one kilogram each product is illustrated in Figure 21.
Figure 21 - Relative impact of each product (wool and cotton) for worst and best case scenarios. Results
for the production of 1 kg of dyed yarn.
Observing the worst case scenario results, wool has the largest impacts in the overall results
except in freshwater eutrophication (which figures are similar) and water resource depletion.
On the other hand, looking into the best case results of each product, wool has the largest
impacts in: climate change, ozone depletion, human toxicity and acidification; while cotton in
water-related categories as: freshwater eutrophication, marine eutrophication, freshwater
ecotoxicity and water resource depletion. Wool and cotton have approximate values in
human toxicity (cancer effects) and marine eutrophication categories.
Field emissions show up as the main contributors in most of the impact categories but, it has
to be mentioned that wool processing has one more life cycle stage which also affects the
final results as wool is a much more dirty fibre when compared with cotton. That way,
washing, cleaning and other handling processes are more intensive and it reflects the results.
On the other hand, cotton is a crop which is highly associated to the use of water, fertilizers
and pesticides and that way, water and toxic related categories are the cause of its minor
environmental performances.
At this level of comparison, but remembering that different methods were applied, similar
results to the one presented in Environmental Improvement Potential of Textiles (2006) for
breakline contributions from life cycle stages of different textiles were analysed, are obtained
0%
10%
20%
30%
40%
50%
60%
70%
80%
90%
100%
Worst wool Best wool Worst cotton Best cotton

Master Thesis LCA of Two Textile Products: Wool and Cotton
73
for the best case scenario. In that study wool is pointed as the major contributor in climate
change and human toxicity (mainly due to the production of raw fiber), while cotton has the
largest impacts in the categories of freshwater ecotoxicity (mainly due to the production of
raw fiber).
It would be expected that the use of organic cotton would mainly reduce the impacts in
climate change, ozone depletion, eutrophication (freshwater and marine) and water resource
depletion while increases in human toxicity would be verified in both case scenarios for
cotton.


Master Thesis LCA of Two Textile Products: Wool and Cotton
75
6 CONCLUSIONS
The number of companies assessed cannot be seen as a representative sample of the
worldwide textile industry and it was possible to identify variations in the consumption of
electricity, heat and water among companies. Moreover, a small number of samples were
used in the inventory.
The results obtained have to analysed in accordance to that and the present study doesn’t
aim to represent the world production of each material but to give an overall overview of the
suppliers’ behaviour and, at the same time, to offer them the opportunity to benchmark
themselves and to understand how their environmental performance along all the life cycle
stages.
For the full supply chain for cotton and wool it was possible to conclude the following:
Raw fibre production is the main contributor to both raw fibre productions (wool and
cotton). This is in line with the results from Beton et al. (2006)[27].
Wool has the largest impacts for all the environmental impact categories (except in
freshwater eutrophication and water resource depletion). However, when a best case
scenario is regarded, cotton has the largest burdens in categories as freshwater
eutrophication, marine eutrophication, freshwater ecotoxicity and water resource
depletion mainly.
When comparing similar categories of impact studied in Beton et al. (2006)[27] for a
breakdown scenario with the results presented here for the best case scenario, the main
contributors are the same i.e.: wool is the major contributor to climate change and
human toxicity (mainly due to the production of raw fibre), while cotton has the largest
impacts in the category of freshwater ecotoxicity (mainly due to the production of raw
fibre).
Despite this fact the main conclusions drawn for each life cycle stage are similar to other life
cycle assessment studies. The following conclusion may be drawn:
Wool
Sheep farming belongs to one of the largest polluter sector worldwide: agriculture. Even
if small amounts of fertilizers or pesticides are applied, enteric fermentation and manure
management naturally ensure a large share on the environmental impacts of this
activity.
Wool is a much more dirty fibre when compared with cotton. That way, washing,
cleaning and other handling processes are more intensive and needed in order to obtain
a clean fibre ready to be processed. Consequently wool processing has one more life
cycle stage (scouring wool). As a wet process it adds extra burdens to the textile
products made of wool.

Master Thesis LCA of Two Textile Products: Wool and Cotton
76
Cotton
Raw cotton is a much cleaner raw fiber than wool and its initial operation of cleaning the
fibre (ginning) has low contributions.
Cotton is a crop that needs water, fertilizers and pesticides causing water and toxic
related categories.
Life cycle stages
Field emissions to the air, water or soil comprising the releases of fertilizer and
pesticides but mainly livestock emissions are identified to be major contributors to the
results. The production of fertilizers and the losses to environment due to its application
has also a significant burden.
Cotton cultivation: field emissions from fertilizers and pesticides application were a
major contributor to several environmental impact categories. The fertilizer production
also has significant impacts on the overall results. Such that an efficient management of
fertilizer use will allow a better best performance of the conventional farmer. Organic
cotton production has relatively smallest impacts; however, the use of poultry manure is
associated to the high release of heavy metals.
Spinning: due to its high energy demand, electricity production leads the major
contribution in the cotton and wool yarns production. Packaging materials (mainly in
spun wool) and water use might have significant burdens in some systems.
Dyeing (and bleaching): considerable amounts of water are used throughout these
processes. Associated to this consumption is the energy needed to process it. Water and
wastewater arises as the major hotspot of these processes for both wool and cotton
materials followed by the energy consumption (heat and electricity).
Scouring wool: this supplier follows the average consumption patterns for energy and
has a wet process consumes high amounts of water. That way, water consumption and
energy (mainly for heat the bowls) are the main contributors to this life cycle stage.
Activities which are not directly associated to the company activity as the production of
wire used for packaging and transoceanic transports emerge as important contributors
in toxicity categories.
Improvements
An efficient management of the fertilizers used in sheep farming and cotton cultivation
might improve environmental performance at two levels: reducing field emissions and
impacts from production.
The establishment of a roadmap by defining targets and procedures to reduce the
energy demand. Despite the fact that is a transversal issue to all the life cycle stages, the
focus remain mainly in mechanical and chemical processes for dyed yarn production.
Another issue for improvement is associated with the water consumption and its

Master Thesis LCA of Two Textile Products: Wool and Cotton
77
subsequent emissions. Furthermore, chemicals and packaging use shall also provide
opportunities to improve the overall results.
Benchmark results from this study as well as best available technologies shows that
improvements might be achieved from both material and in different life cycle stage.


Master Thesis LCA of Two Textile Products: Wool and Cotton
79
7 RECOMMENDATIONS FOR FUTURE WORKS
The limitation of the work performed as well as further improvements are identified below.
These include limitations related with data collection from the suppliers, datasets selection
and its geographical and temporal limitations, methods boundaries (made mainly for
European countries) and the worldwide representativeness of agricultural models.
The primary data supplied has a degree of uncertainty. In an ideal situation, team
member would have been able to visit each supplier and collect data directly from
machines and energy meters.
Secondary data from ecoinvent are sometimes not specific to the regions assessed as for
example the machinery utilized in agriculture or wastewater treatment is modelled using
Swiss data and electricity generation (not from standard grid) or chemicals and materials
are mainly modelled using European data. This may be overcome by using more
detailed data concerning the local realities, however it can be time consume.
Although the selection of datasets been carried out with the maximum care and selected
by experts, the datasets used are sometimes not specific or old. This is the example of
the chemicals and auxiliaries utilized because most of the times have no specific dataset
so that proxies are utilized (as presented in Table B.5 in Appendix B). Another example is
the datasets for energy production (standard grid) which are not updated to the
production mix of nowadays but, in some cases for 1995.
Most of the impact categories were created regarding the European reality while some
of the suppliers are located in other non-European countries.
Another action that may be performed is a sensitivity analysis to some parameters in
order to assess the robustness of the results and assess the sensivity of results to
changes in parameters or models. Some examples of this analysis would be on the
emissions factors utilized from IPCC for livestock emissions which have associated and
precision of ±20% or on the chemicals’ proxies used. Nevertheless comparing the
different emissions of each supplier it might be ascertained about the influence of these
parameters.
At the end it is important to refer that agricultural systems models are difficult to generalize
This is to say that differences in weather conditions, spatial variations in soil type,
topography, pasture types, species of animal and individual supplier management practices
have a large degree of variability and sometimes not easy to be monitored. The use of site
specific models capable to better understand what actually fate has the losses of fertilizers
and pesticides.
The models followed during the present study are part of the EcoLogTex project which stills
going on. Efforts are being done in order to continuously improve the models created so
that limitations may be overcome.


Master Thesis LCA of Two Textile Products: Wool and Cotton
81
Bibliographic references
1. Fan, J. and L. Hunter, Engineering apparel fabrics and garments. Vol. 96. 2009, Oxford,
Cambridge and New Delhi: Woodhead Publishing in Textiles in association with The
Textile Institute.
2. Group, W.B., Environmental, Health, and Safety Guidelines for Textile Manufacturing,
I.F. Corporation, Editor 2007.
3. Allwood, J.M., et al., Well dressed? The present and future sustainability of clothing and
textiles in the United Kingdom.2006: University of Cambridge Institute for
Manufacturing.
4. Consulting, T.F.Y., The Fiber Year 2013. World Survey on Textiles & Nonwovens, 2013,
The Fiber Year Consulting.
5. FAO. Production. 2011 16 January 2013 01-07-2012]; Available from:
http://faostat.fao.org/site/567/DesktopDefault.aspx?PageID=567#ancor.
6. FAO. Production. 2013 2013 01-07-2012]; Available from:
http://faostat3.fao.org/home/index.html#VISUALIZE.
7. Kant, R., Textile dyeing industry an environmental hazard. Natural Science, 2012. 3(1):
p. 22-26.
8. Bojarski, A.B., et al., Incorporating environmental impacts and regulations in a holistic
supply chains modeling: An LCA approach. Computers & Chemical Engineering, 2009.
3(10): p. 1747-1759.
9. Rizzoli, A.E., et al., EcoLogTex: a software tool supporting the design of sustainable
supply chains for textiles. on Information and Communication Technologies, 2013.
138.
10. ISO, ISO 14040: Environmental management - Life cycle assessment - Principles and
framework in ISO 14040:2006(E)2006, the International Organization for
Standardization: Switzerland.
11. JRC-IES, International Reference Life Cycle Data System (ILCD) Handbook-
Recommendations for Life Cycle Impact Assessment in the European context., ed. E.C.-
J.R.C.-I.f.E.a. Sustainability2011, Luxemburg: Publications Office of the European
Union.
12. Commission, E., Integrated Pollution Prevention and Control (IPPC), R.D.o.B.A.T. for
and t.T. Industry, Editors. 2003: Joint Research Centre.
13. Biswas, W.K., et al., Global warming contributions from wheat, sheep meat and wool
production in Victoria, Australia – a life cycle assessment. Journal of Cleaner
Production, 2010. 18(14): p. 1386-1392.
14. Kägi, T.N.T., Life Cycle Inventories of Agricultural Production Systems, in Final Report
ecoinvent V2.02007, Agroscope Reckenholz-Taenikon Research Station ART:
Ecoinvent, Swiss Centre for Life Cycle Inventories, Zurich and Dübendorf, CH.
15. Eady, S., A. Carre, and T. Grant, Life cycle assessment modelling of complex agricultural
systems with multiple food and fibre co-products. Journal of Cleaner Production, 2011.
28: p. 143-149.
16. Biswas, W., et al., Global warming contributions from wheat, sheep meat and wool
production in Victoria, Australia – a life cycle assessment. Journal of Cleaner
Production, 2010. 18(14): p. 1386–1392.

Master Thesis LCA of Two Textile Products: Wool and Cotton
82
17. Botkin, M.P., R.A. Field, and C.L. Johnson, Sheep and wool: science, production, and
management, ed. Prentice-Hall1988, University of Wisconsin - Madison.
18. Barber, A. and G. Pellow, Life Cycle Assessment: New Zealand Merino Industry Merino
Wool Total Energy Use and Carbon Dioxide Emissions2006 Pukekohe, Auckland: The
AgriBusiness Group.
19. Simpson, W.S., G.H. Crawshaw, and T. Institute, Wool: Science and Technology2002:
CRC Press.
20. AG, The biology of Gossypium hirsutum L. and Gossypium barbadense L. (cotton), in
Department of Health and Ageing Office of the Gene Technology Regulator2008: AG
(Australian Government).
21. USDA. Cotton Yield by Country in KG/HA. 2013 2013 10-07-2013]; Available from:
http://www.indexmundi.com/agriculture/?commodity=cotton&graph=yield.
22. IFC, Cotton Processing, 2004, Cotton Australia: IFC (International Fibre Centre)
Australia.
23. Perkins, W.S., A Review of Textile Dyeing Processes. Department of Textile Engineering,
Auburn University, Auburn., 1991.
24. ETPI, The Textile Sector - Environmental Report, E.T.P.f. Industry, Editor 1998.
25. TFS. What is knitting and weaving. Difference between knitting and weaving. Textile
Fashion Study (TFS) 2012 20-05-2012 [cited 2013 08-07-2013]; Textile
Expert:[Available from: http://textilefashionstudy.com/what-is-knitting-and-weaving-
difference-between-knitting-and-weaving/.
26. Umweltbundesamt, Environmental standards in the textile and shoe sector. A guideline
on the basis of the brefs - best available techniques reference documents of the EU.,
2011: Federal Environment Agency. Germany.
27. Beton, A., et al., Environmental Improvement Potential of Textiles (IMPRO-Textiles), O.
Wolf, et al., Editors. 2006: European Commission JRC – IPTS.
28. Modint Cotton and Wool - nature calls. CSR Planet Factsheet, 2010.
29. Wang, Z., et al., Textile Dyeing Wastewater Treatment, in Advances in Treating Textile
Effluent, P.J. Hauser, Editor 2011, InTech.
30. YST. Energy Consumption in Yarn Production. 2006; Available from:
http://textile2technology.com/yarnspinning.
31. IPCC, Climate Change 2007: Mitigation of Climate Change. Contribution of Working
Group III to the Fourth Assessment Report of the Intergovernmental Panel on Climate
Change., 2007, Cambridge University Press,: Cambridge, United Kingdom and New
York, NY, USA.
32. IPCC, Emissions From Livestock and Manure Management. Volume 4: Agriculture,
Forestry and Other Land Use., in Guidelines for National Greenhouse Gas Inventories,
I.P.o.C. Change, Editor 2006.
33. Nemecek, T. and T. Kägi, Life Cycle Inventories of Agricultural Production Systems, in
Final Report ecoinvent V2.02007, Agroscope Reckenholz-Taenikon Research Station
ART: Ecoinvent, Swiss Centre for Life Cycle Inventories, Zurich and Dübendorf, CH.
34. Sutter, J., Life Cycle Inventories of Pesticides, 2010: Swiss Centre for Life Cycle
Inventories, St. Gallen, 2010.
35. Babu, B.R., et al., Textile Technology: Cotton Textile Processing: Waste Generation and
Effluent Treatment. The Journal of Cotton Science. The cotton foundation., 2007.
11:141–153.

Master Thesis LCA of Two Textile Products: Wool and Cotton
83
36. Incorporated, C. and P. International, Life Cycle Assessment of Cotton Fiber & Fabric:
full report., ed. C. Incorporated and P. International2012, Cotton Incorporated.
37. Blackburn, R.S. and J.D. Payne, Life cycle analysis of cotton towels: impact of domestic
laundering and recommendations for extending periods between washing. The Royal
Society of Chemistry, 2004: p. 59-61.
38. Steinberger, J.K., et al., A spatially explicit life cycle inventory of the global textile chain.
Int J Life Cycle Assess, 2009(14): p. 443–455.
39. ISO, EN ISO 14044:2006 - Environmental management - Life cycle assessment -
Requirements and Guidelines, 2006, International Organisation for Standardisation
(ISO). Geneve. Switzerland.
40. Bauman, H. and A.-M. Tillman, The Hitch Hiker's Guide to LCA2004: Studentlitteratur
AB.
41. Sleeswijk, A.W., et al., Normalisation in product life cycle assessment: An LCA of the
global and European economic systems in the year 2000. Science of The Total
Environment, 2008. 390(1): p. 227-240.
42. Evans, D., Commonly used chemicals to treat sheep lice and blowflies, D.o.A.a. Food,
Editor 2008, Government of Western Australia: Farm Note.
43. NRCS. Soil Use: Global Soil Regions Map. 2005 17-11-2005 19-07-2013]; Available
from: http://soils.usda.gov/use/worldsoils/mapindex/order.html.
44. Walker, B., Vaccination programs for sheep. AGFacts. NSW Department of Primary
Industries. Australia., 2005. A3.9.47.
45. Stark, C., K. Penney, and A. Feng, 2012 Australian Energy Update, ed. B.o.R.a.E.
Economics2012, Canberra: Australian Governenment.
46. Markwick, G., Water requirements for sheep and cattle. PRIMEFACT. NSW Depatment
of Primary Industries. Australia., 2007. 326.
47. Cleemput, O.V., et al., Fertilisation for Sustainable Plant Production and Soil Fertility.
Proceedings of the 11th International World Fertilizer Congress. Gent, Belgium,
September 7-13, 1997. ISBN 3-933140-04-8., 1998. 3.
48. West, T.O. and G. Marland, A synthesis of carbon sequestration, carbon emissions, and
net carbon flux in agriculture: comparing tillage practices in the United States. . Agric.
Ecosyst. Environ., 2002. 91: p. 217-232.
49. IPCC, Guidelines for national greenhouse gas inventories. Volume 4: Agriculture,
forestry and other land use., L.B. Simon Eggleston, Kyoko Miwa, Todd Ngara and
Kiyoto Tanabe, Editor 2006: Kanagawa.
50. Etiope, G., et al., EMEP/EEA air pollutant emission inventory guidebook 2009:Technical
guidance to prepare national emission inventories, in EEA Technical report 2009, EEA:
European Environment Agency.
51. Faist Emmenegger, M., J. Reinhard, and R. Zah, SQCB - Sustainability Quick Check for
Biofuels. Second draft, 18th February 2009 - Intermediate Background Report. With
contributions from T. Ziep, R. Weichbrodt, Prof. Dr. V. Wohlgemuth, FHTW Berlin and A.
Roches, R. Freiermuth Knuchel, Dr. G. Gaillard, Agroscope Reckenholz-Tänikon. , 2009,
Empa: Dübendorf.
52. Nemecek, T., et al., Life Cycle Inventories of Agricultural Production Systems, in Final
report ecoinvent 2000 No 152004, Agrocope FAL Reckenholz and FAT Taenikon, Swiss
Centre for Life Cycle Inventories: Dübendorf, CH.

Master Thesis LCA of Two Textile Products: Wool and Cotton
84
53. Roy, R.N., R.V. Misra, J.P. Lesschen, E.M. Smaling, Assessment of soil nutrient balance.
Approaches and Methodologies, in Fertilizer and Plant Nutrition Bulletin 142003, Food
and Agriculture Organization of the United Nations: Rome.
54. Prasuhn, V., Erfassung der PO4-Austräge für die Ökobilanzierung. SALCA-Phosphor.,
2006, Agrocope FAL Reckenholz: Zürich, CH.
55. Jungbluth, N., et al., Life Cycle Inventories of Bioenergy, 2007: Swiss Centre for Life
Cycle Inventories, Dübendorf, CH.
56. Group, A., Technische Parameter Modell Agrammon, S.H.f.L. SHL, Editor 2009: Online
at: www.agrammon.ch.
57. Kazemeini, H., E. Rahimi, and A. Kharrattaherdel, Cadmium concentration in muscle,
liver and kidney of sheep slaughtered in Falavarjan abattoir, Iran. . Toxicol Ind Health
26:259–63, 2010.
58. Chapagain, A.K., et al., The water footprint of cotton consumption, in Value of Water
Research Report Series No. 182005: UNESCO-IHE Delft.
59. Melikyan, L.V. and H. Ghukassyan, PSIA Energy Tajikistan. Poverty and Social Impact
Assessment: Energy Sector in Tajikistan., ed. B. Slay2011: UNDP, the United Nations.
60. Althaus, H.-J., et al., Overview and Methodology, in Data v2.0 (2007), R. Frischknecht
and N. Jungbluth, Editors. 2007, Swiss Centre for Life Cycle Inventories: Dübendorf,
CH.
61. FSI. searates.com. 2013 [cited 2013 June]; Available from:
http://www.searates.com/reference/portdistance/.
62. Google. Google Maps. 2013 [cited 2013 June]; Available from:
https://maps.google.com/maps.
63. Casiday, R. and R. Frey Acid Rain - Inorganic Reactions Experiment. 1998.
64. Tewolde, H., et al., Mineral Nutrition of Cotton Fertilized with Poultry Litter or
Ammonium Nitrate. Agronomy Journal 2011. 103(6): p. 1704-1711.
65. Emmenegger, M.F., Specification of the EcoLogTex tool Quantis (Switzerland/Germany),
2013. (draft version).

Master Thesis LCA of Two Textile Products: Wool and Cotton
85
Appendixes


Master Thesis LCA of Two Textile Products: Wool and Cotton
87
Appendix A: ecoinvent datasets used for energy
ELECTRICITY
Table A. 1 – Electricity production and modelling correspondence in ecoinvent dataset.
Source ecoinvent dataset
Standard Grid
Country mix in ecoinvent Electricity, low voltage, at grid
Oil Electricity, oil, at power plant
Gas Electricity, natural gas, at turbine, 10MW
Coal Electricity, hard coal, at power plant
Hydro Electricity, hydropower, at run-of-river power plant
Solar Electricity, production mix photovoltaic, at plant
Nuclear Electricity, nuclear, at power plant
Renewables Electricity, pellets, allocation energy, at stirling cogen unit 3kwe, future
Own Production
Diesel Diesel, burned in diesel-electric generating set
Hydro Electricity, hydropower, at run-of-river power plant
HEAT
Heat is produced inside the facilities or is provided by district heating sources. Regarding to
the type of fuel used, boiler capacity and burner type utilized datasets was selected. As the
heat fuels are entered in several units, the conversion factor is used to transform the unit
given in the questionnaire into the unit (MJ) of the ecoinvent dataset.
Inventory flow heat = Quantity of fuel * conversion factor
Conversions factors as well as datasets selected per source of energy are presented in Table
A. 2
Table A. 2 - Heat datasets from ecoinvent utilised for each supplier.
Heat source Unit
reported
Conversion factor:
unit to MJ
ecoinvent dataset Suppliers
District heat MJ - Wood chips, from forest, mixed, burned
in furnace 1000kw/RER U S2
Diesel L 36.7 MJ/L Light fuel oil, burned in boiler 100kw,
non-modulating/CH U D3
Natural gas m3 36.5 MJ/m
3
Heat, natural gas, at boiler condensing
modulating <100kw/RER U S1 and D2
Heat, natural gas, at industrial furnace
>100kw/RER U
S4, S5, S6
and D1

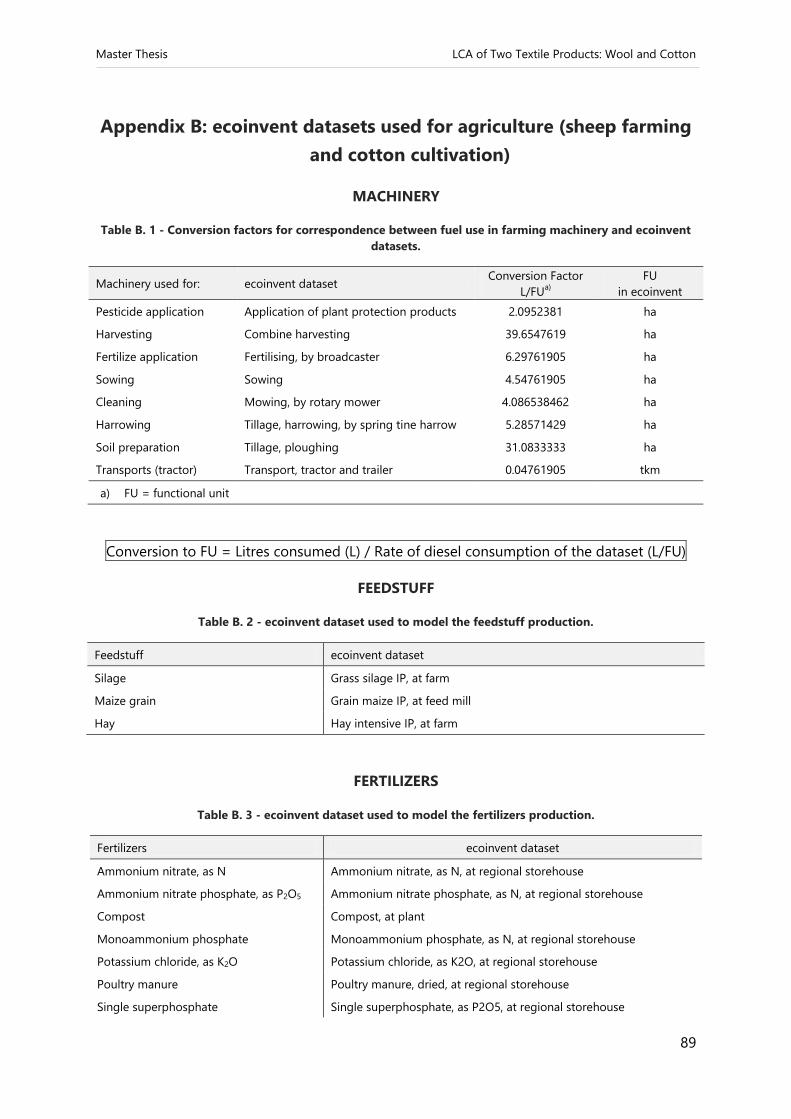
Master Thesis LCA of Two Textile Products: Wool and Cotton
89
Appendix B: ecoinvent datasets used for agriculture (sheep farming
and cotton cultivation)
MACHINERY
Table B. 1 - Conversion factors for correspondence between fuel use in farming machinery and ecoinvent
datasets.
Machinery used for: ecoinvent dataset Conversion Factor
L/FUa)
FU
in ecoinvent
Pesticide application Application of plant protection products 2.0952381 ha
Harvesting Combine harvesting 39.6547619 ha
Fertilize application Fertilising, by broadcaster 6.29761905 ha
Sowing Sowing 4.54761905 ha
Cleaning Mowing, by rotary mower 4.086538462 ha
Harrowing Tillage, harrowing, by spring tine harrow 5.28571429 ha
Soil preparation Tillage, ploughing 31.0833333 ha
Transports (tractor) Transport, tractor and trailer 0.04761905 tkm
a) FU = functional unit
Conversion to FU = Litres consumed (L) / Rate of diesel consumption of the dataset (L/FU)
FEEDSTUFF
Table B. 2 - ecoinvent dataset used to model the feedstuff production.
Feedstuff ecoinvent dataset
Silage Grass silage IP, at farm
Maize grain Grain maize IP, at feed mill
Hay Hay intensive IP, at farm
FERTILIZERS
Table B. 3 - ecoinvent dataset used to model the fertilizers production.
Fertilizers ecoinvent dataset
Ammonium nitrate, as N Ammonium nitrate, as N, at regional storehouse
Ammonium nitrate phosphate, as P2O5 Ammonium nitrate phosphate, as N, at regional storehouse
Compost Compost, at plant
Monoammonium phosphate Monoammonium phosphate, as N, at regional storehouse
Potassium chloride, as K2O Potassium chloride, as K2O, at regional storehouse
Poultry manure Poultry manure, dried, at regional storehouse
Single superphosphate Single superphosphate, as P2O5, at regional storehouse

Master Thesis LCA of Two Textile Products: Wool and Cotton
90
Urea ammonium nitrate Urea ammonium nitrate, as N, at regional storehouse
PESTICIDES
Table B. 4 - ecoinvent dataset used to model the pesticides production.
Pesticides reported ecoinvent datasets
Paraquat Pyridine-compounds
Glyphosate Glyphosate
Lambda-cyhalothrin Pyretroid-compounds
Prometryn Triazines
Diquat Herbicide, unspecified
CHEMICAL TREATMENTS OF SHEEP AND COTTON SEEDS
Table B. 5 - ecoinvent dataset used to model the production of the chemicals used for sheep and seed
treatments.
Chemical treatments ecoinvent datasets
Sheep treatments
Chlorpyrifos Organophosphorus-compounds
Cryomazine Triazine-compounds
Dicyclanil Growth regulators
Abamectin Organophosphorus-compounds
Albendazole oxide Benzimidazole-compounds
Levamasole hydrochloride Benzimidazole-compounds
Spinosad Insecticides, unspecified
Vaccines Chemicals organic
Seeds treatment
Bronopol Pesticide unspecified
Carboxin Fungicides
Thiram Dihitrocarbamate

Master Thesis LCA of Two Textile Products: Wool and Cotton
91
EMISSIONS
Table B. 6 – ecoinvent datasets and its categories and subcategories used to model emissions from grazing
sheep and cotton cultivation.
Emission Name Ecoinvent Category Sub-Category
To air
Ammonia Ammonia air unspecified
Methane (CH4) Methane, biogenic air unspecified
Nitrou oxide (N2O) Dinitrogen monoxide air unspecified
Nitrogen oxides NOx Nitrogen oxides air unspecified
To water
Nitrate Nitrate water ground-
Phosphate Phosphorus water river
Phosphate Phosphate water ground-
To soil
Heavy metals:
Cadmium (Cd) Cadmium soil agricultural
Chromium (Cr) Chromium soil agricultural
Copper (Cu) Copper soil agricultural
Lead (Pb) Lead soil agricultural
Nickel (Ni) Nickel soil agricultural
Zinc (Zn) Zinc soil agricultural
Pesticides:
Carboxin Carboxin soil agricultural
Bronopol Pesticide, unspecified soil agricultural
Diquat Diquat soil agricultural
Glyphosate Glyphosate soil agricultural
Lambda-cyhalothrin Lambda-cyhalothrin soil agricultural
Paraquat Paraquat soil agricultural
Prometryn Prometryn soil agricultural
Thiram Thiram soil agricultural


Master Thesis LCA of Two Textile Products: Wool and Cotton
93
Appendix C: ecoinvent datasets used for packaging materials
Table C. 1 - ecoinvent dataset used to model the packaging material production.
Packaging material, kg ecoinvent dataset
Cardboard Packaging, corrugated board, mixed fibre, single wall, at plant
Cotton Textile, woven cotton
Paper Kraft paper, bleached
PET Polyethylene terephthalate, granulate, amorphous, at plant
Polyester Polyester resin, unsaturated, at plant
Polyethylene HDPE Polyethylene, HDPE, granulate, at plant
Polylaminaten (plastics) Polyethylene terephthalate, granulate, amorphous, at plant
Polypropylne Polypropylene, granulate, at plant
Wire Steel, low-alloyed, at plant
Metal rings Steel, low-alloyed, at plant


Master Thesis LCA of Two Textile Products: Wool and Cotton
95
Appendix D: ecoinvent datasets used for water, wastewater
treatment and water emissions
WATER CONSUMPTION
Table D. 1 – ecoinvent dataset for type of water consumed
Water ecoinvent dataset
Decarbonized water, decarbonised, at plant
Rain water, unspecified natural origin
River water, river
For sheep (drinking) water, unspecified natural origin
Tap Water tap water, at user
Well Water water, well, in ground
WASTEWATER TREATMENT PLANT
Table D. 2 – ecoinvent dataset for wastewater treatment modelling process.
Wastewater treatment ecoinvent dataset
External treatment treatment, sewage, to wastewater treatment, class 3

Master Thesis LCA of Two Textile Products: Wool and Cotton
96
WATER EMISSIONS
Table D. 3 - Conversion factors and ecoinvent dataset for water emissions in Emmenneger (2013)
Type of water emission / parameters Unit of
measurement
Conversion
Factor WE
ecoinvent
(all in compartment "water,
unspecified")
Active chlorine, Cl (mg Cl/l) 1 Chlorine
Adsorbable Organic Halogens, AOX, as Cl (mg Cl/l) 1 AOX, Adsorbable Organic Halogen as
Cl
Aldehydes, like CH2O (mg/l) 1 aldehydes, unspecified
Ammonium, NH4-N (mg N/l) 1.285 Ammonium, ion
Arsenic and ist compounds, As (mg/l) 1 Arsenic, ion
Benzene-Toluene-Ethylbenzene-Xylene, BTEX (mg/l) 1 Proxy: Benzene
Biochemical Oxygen Demand in 5 days, BOD5 (mg O2/l) 1 BOD5, Biological Oxygen Demand
Cadmium and its compounds, Cd (mg/l) 1 Cadmium, ion
Chemical Oxigen Demand, COD (mg O2/l) 1 COD, Chemical Oxygen Demand
Chlorides, Cl- (mg Cl/l) 1 Chloride
Chlorinated solvents (mg/l) 1 Chlorinated solvents, unspecified
Chromium and its compounds, Cr (mg/l) 1 Chromium, ion
Copper and its compounds, Cu (mg/l) 1 Copper, ion
Dissolved solids (mg/l) 1 Dissolved solids
Hydrogen sulfide, H2S (mg/l) 1 Hydrogen sulfide
Iron and its compounds, Fe (mg/l) 1 Iron, ion
Lead and its compounds, Pb (mg/l) 1 Lead
Mercury and its compounds, Hg (mg/l) 1 Mercury
Nickel and its compounds, Ni (mg/l) 1 Nickel, ion
Nitrate, NO3-N (mg N/l) 4.43 Nitrate
Nitrite, NO2-N (mg N/l) 3.29 Nitrite
Organic nitrogen, N-org (mg N/l) 1 Nitrogen, organic bound
Phosphate (mg/l) 1 Phosphate
Polycylic Aromatic Hydrocarbon, PAH (mg/l) 1 PAH, polycyclic aromatic
hydrocarbons
Sulfates, SO4 (mg/l) 1 Sulfate
Sulfide, S2- (mg/l) 1 Sulfide
Sulfites, SO3 (mg/l) 1 Sulfite
Suspended solids (mg/l) 1 Suspended solids, unspecified
Total hydrocarbons (mg/l) 1 hydrocarbons, unspecified
Total Organic Carbon, TOC (mg/l) 1 TOC, Total Organic Carbon
Total phenols, Ph-OH (mg/l) 1 Phenol
Total phosphorus, P (mg P/l) 1 Phosphorus
Zinc and its compounds, Zn (mg/l) 1 Zinc, ion
Note: All the emissions are modelled as emitted to the ecoinvent category water and sub-category unspecified

Master Thesis LCA of Two Textile Products: Wool and Cotton
97
Appendix E: ecoinvent datasets used for chemicals, dyestuffs and
auxiliaries
Table E. 1 - ecoinvent dataset used to model the production of chemicals, dyestuffs and auxiliaries.
Chemicals ecoinvent dataset
Paraffin waxes Paraffin, at plant RER kg
Lubricants Lubricating oil, at plant, rer
Ester oils Chemicals organic, at plant/glo u
Fatty acid triglycerides Chemicals organic, at plant/glo u
Hydrogen peroxide (bleaching) Hydrogen peroxide, 50% in H2O, at plant/kg/RER
Sodium hypochlorite (bleaching) Sodium hypochlorite, 15% in H2O, at plant/kg/RER
Sodium chlorite (bleaching) Chlorine dioxide, at plant/kg/RER
Optical brightener (brightening agent) Optical brighteners, in paper production, at plant/RER U
Dyestuffs 50% Chemicals organic, at plant/GLO U + 50% Chemicals inorganic,
at plant/GLO
Sodium sulfate (dye auxiliarie) Sodium sulphate, powder, production mix, at plant
Magnesium sulfate (stabilizer) Magnesium sulphate, at plant/kg/R
Caustic Soda (washing) Sodium hydroxide, 50% in H2O, production mix, at plant/kg/RER
Alcohol ethoxylates (surfactant,
detergent or emulsifier) Ethoxylated alcohols, unspecified, at plant/RER U
Sodium carbonate (builder) Sodium carbonate from ammonium chloride production, at
plant/GLO
Antistatic agent Chemicals organic, at plant/glo u
Mono and diesters of phosphorus
pentoxides (antistatic agents) Chemicals organic, at plant/GLO U
Non-ionic surfactants Chemicals organic, at plant/GLO U
Acetic acid Acetic acid, 98% in H2O, at plant/RER U
Formic acid Formic acid, at plant
Ammonium sulfate Ammonium sulphate, as N, at regional storehouse
Salt Sodium chloride, powder, at plant
Water-repellent 50% Chemicals organic, at plant/GLO U + 50% Chemicals inorganic,
at plant/GLO
Softener 50% Chemicals organic, at plant/GLO U + 50% Chemicals inorganic,
at plant/GLO


Master Thesis LCA of Two Textile Products: Wool and Cotton
99
Appendix F: ecoinvent datasets used for transports
Table F. 1 - ecoinvent dataset utilized to model the transports
Mode of transports ecoinvent dataset
Sea Transport, freight, sea, transoceanic ship
Road Transport, lorry 3.5-16t, fleet average
Rail Transport, freight, rail


Master Thesis LCA of Two Textile Products: Wool and Cotton
101
Appendix G: ecoinvent datasets used for solid waste
Table G. 1 - ecoinvent dataset utilized to model the solid waste disposal
Final disposal ecoinvent dataset
Municipal landfill Disposal, municipal solid waste, 22.9% water, to sanitary landfill
Municipal incinerator (with energy
recovery)
Disposal, municipal solid waste, 22.9% water, to municipal
incineration
Special treatment for hazardous waste Disposal, hazardous waste, 25% water, to hazardous waste
incineration


Master Thesis LCA of Two Textile Products: Wool and Cotton
103
Appendix H: Heavy metal content in fertilizers, wool and cotton
HEAVY METALS IN WOOL
For sheep pasture we only consider external import of heavy metal due to application of
mineral fertilizers or organic fertilizer from other sources than sheep.
Table H. 1 - Allocation factor for the single heavy metals
Heavy Metals
Allocation factor Sources from literature
Wool
%
Meat
% Wool Meat
Cd 95 5 Kazemeini et al (2010)
Average from literature 5
Patkowska et al. (2009)
Smith et al. (2010)
Cu 82 18.
Nemecek et al. (2004)
Zn 64 36.
Pb 95 5
Ni - 100
Cr - 100.
Hg 99 0.64%
Table H. 2 - Heavy metal uptake of wool
Heavy metals
Concentration Sources from literature
Wool
kg/kg
Meat
kg/kg Wool Meat
Cd 2.57E-07 6.99E-09 Average from literature5 Average from literature
5
Cu 7.46E-06 9.00E-07 Nemecek et al. (2004) Average from literature5
Zn 7.51E-05 2.30E-05 Nemecek et al. (2004) Average from literature5
Pb 2.17E-06 6.50E-08 Nemecek et al. (2004) Average from literature5
Ni - 2.00E-08 Nemecek et al. (2004) Average from literature5
Cr - 4.00E-08 Nemecek et al. (2004) Average from literature5
Hg 1.45E-07 5.00E-10 Nemecek et al. (2004) Average from literature5
5 Average from values in Patkowska-Sokoła B, Dobrzański Z, Osman K, et al. (2009) The content of chosen chemical elements in
wool of sheep of different origins and breeds. Arch Tierz 4:410–418 and in Smith K, Dagleish M, Abrahams P (2010) The intake
of lead and associated metals by sheep grazing mining-contaminated floodplain pastures in mid-Wales, UK: II. Metal
concentrations in blood and wool. Sci Total Environ 408:1035–42. doi: doi: 10.1016/j.scitotenv.2009.10.023

Master Thesis LCA of Two Textile Products: Wool and Cotton
104
HEAVY METALS IN FERTILIZERS
Table H. 3 - Heavy metal content of synthetic fertilizers [33]
Mineral fertilisers (%N/%P2O5/%K2O/%Mg)
Cd
mg/kg
nutrient
Cu
mg/kg
nutrient
Zn
mg/kg
nutrient
Pb
mg/kg
nutrient
Ni
mg/kg
nutrient
Cr
mg/kg
nutrient
Urea (46/0/0) kg N 0.11 13.04 95.65 2.39 4.35 4.35
Calcium ammonium nitrate (20/0/0) kg N 0.25 60.00 155.00 5.50 90.00 10
Ammonium nitrate (27.5/0/0) kg N 0.18 25.45 181.82 6.91 47.27 14.55
Ammonium sulphate (21/0/0) kg N 0.24 19.05 142.86 5.24 8.57 9.52
Calcium ammonium nitrate (27/0/0) kg N 0.19 8.52 100.00 5.93 12.59 2.96
Magnesium ammonium nitrate (23/0/0/5) kg N 0.43 56.52 4.35 4.35 21.74 6.09
Generic mean N 0.21 22.25 121.43 5.37 17.17 7.81
Triple superphosphate (0/46/0) kg P2O5 113.04 97.83 650.00 7.61 95.65 567.39
Superphosphate (0/19/0) kg P2O5 52.63 121.05 852.63 578.95 105.26 342.11
Thomas meal (0/16/0) kg P2O5 1.56 250.00 425.00 75.00 125.00 1212.50
Hyperphosphate/raw phosphate (0/26/0) kg P2O5 50.00 115.38 915.38 23.85 76.92 611.54
Generic mean P 51.32 118.22 751.32 49.42 100.46 589.46
Potassium chloride (0/0/60) kg K2O 0.10 8.33 76.67 9.17 3.50 3.33
Potassium sulphate(0/26/50) kg K2O 0.10 4.00 64.00 6.60 1.60 4.00
Raw potassium (0/26/5) kg K2O 0.19 173.08 153.85 11.54 11.54 173.08
Lime kg CaO 0.12 4.00 8.00 3.60 12.20 314.00
Generic mean K 0.11 6.17 70.33 7.88 7.52 88.54
Table H. 4 - Heavy metal content of farmyard manure and organic fertilizers [33]
Farmyard manure
Cd
mg/kg
DM
Cu
mg/kg
DM
Zn
mg/kg
DM
Pb
mg/kg
DM
Ni
mg/kg
DM
Cr
mg/kg
DM
Hg
mg/kg
DM
DM
content
%
Cattle liquid slurry 0.178 37.1 162.2 3.77 4.3 3.9 0.4 9.0
Cattle slurry 0.16 19.1 123.3 2.92 3.1 2.1 0.6 7.5
Cattle staple manure 0.172 23.9 117.7 3.77 4.3 3.9 0.4 19.0
Cattle manure from loose housing 0.151 22.0 91.1 2.81 4.3 3.9 0.4 21.0
Pig liquid manure 0.21 115.3 746.5 1.76 8.6 6.7 0.8 5.0
Pig solid manure 0.21 115.3 746.5 1.76 8.6 6.7 0.8 27.0
Litter from broilers 0.292 43.8 349.2 2.92 40 10 0.2 65.0
Litter from belts from laying hens 0.2525 39.6 468.4 2.235 7.9 5.5 0.2 30.0
Litter from deep pits from laying hens 0.2525 39.6 468.4 2.235 7.9 5.5 0.2 45.0

Master Thesis LCA of Two Textile Products: Wool and Cotton
105
HEAVY METALS UPTAKE IN COTTON
Table H. 5 - Heavy metal content of biomass [33]
Heavy Metal Cd Cu Zn Pb Ni Cr Hg
Crop kg/kg kg/kg kg/kg kg/kg kg/kg kg/kg kg/kg
generic
mean/cotton 8.90E-08 5.87E-06 2.85E-05 4.81E-07 9.26E-07 4.90E-07 3.56E-08
grass / hay 1.17E-07 7.74E-06 3.60E-05 1.08E-06 1.51E-06 9.81E-07 1.35E-07
grain maize 2.58E-08 2.15E-06 1.85E-05 2.58E-07 9.98E-07 2.75E-07 0.00E+00
silage maize 8.60E-08 4.30E-06 2.97E-05 1.38E-06 4.13E-07 6.02E-07 8.60E-09
wheat grains 8.50E-08 2.81E-06 1.79E-05 1.70E-07 1.70E-07 1.70E-07 8.50E-09
wheat straw 1.70E-07 2.13E-06 8.16E-06 5.10E-07 5.10E-07 5.95E-07 0.00E+00
barley grains 2.55E-08 3.66E-06 2.26E-05 1.70E-07 8.50E-08 8.50E-08 0.00E+00
barley straw 8.50E-08 4.08E-06 9.44E-06 5.10E-07 6.80E-07 1.02E-06 0.00E+00
rye straw 8.50E-08 2.72E-06 1.11E-05 3.40E-07 5.95E-07 4.25E-07 0.00E+00
potatoes 8.80E-09 1.42E-06 3.30E-06 1.21E-07 7.26E-08 1.25E-07 1.98E-08
rape seed 1.50E-06 3.10E-06 4.51E-05 4.94E-06 2.44E-06 4.70E-07 9.40E-08
fava beans 3.48E-08 5.22E-06 2.62E-05 7.57E-07 1.13E-06 6.00E-07 0.00E+00
soy bean 5.34E-08 1.34E-05 4.25E-05 7.12E-08 4.73E-06 4.63E-07 0.00E+00
protein peas 7.83E-08 8.70E-06 6.35E-05 1.39E-07 7.22E-07 2.78E-07 8.70E-09
sugar beet 9.20E-08 2.76E-06 8.37E-06 2.67E-07 2.48E-07 4.08E-07 2.19E-08
oil palm 5.30E-08 3.50E-06 1.70E-05 2.86E-07 5.51E-07 2.92E-07 2.12E-08
sugar cane 5.13E-10 1.28E-08 6.41E-08 2.57E-09 5.13E-09 2.57E-09 0.00E+00
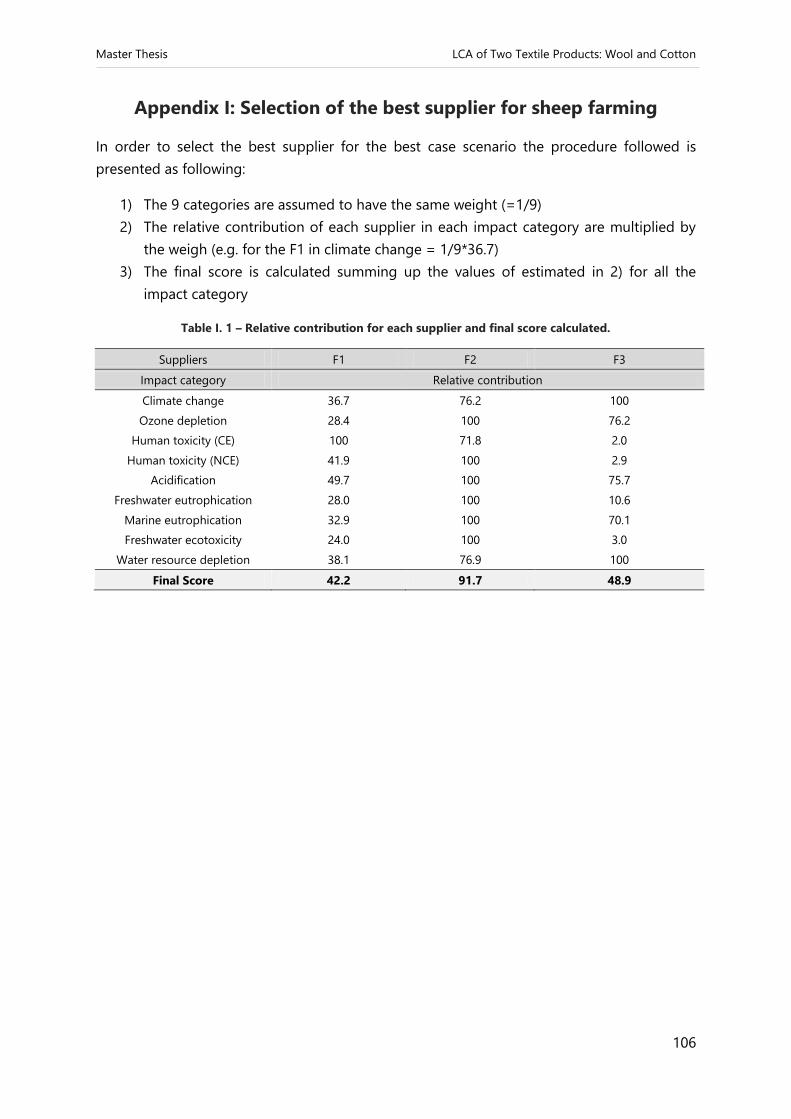
Master Thesis LCA of Two Textile Products: Wool and Cotton
106
Appendix I: Selection of the best supplier for sheep farming
In order to select the best supplier for the best case scenario the procedure followed is
presented as following:
1) The 9 categories are assumed to have the same weight (=1/9)
2) The relative contribution of each supplier in each impact category are multiplied by
the weigh (e.g. for the F1 in climate change = 1/9*36.7)
3) The final score is calculated summing up the values of estimated in 2) for all the
impact category
Table I. 1 – Relative contribution for each supplier and final score calculated.
Suppliers F1 F2 F3
Impact category Relative contribution
Climate change 36.7 76.2 100
Ozone depletion 28.4 100 76.2
Human toxicity (CE) 100 71.8 2.0
Human toxicity (NCE) 41.9 100 2.9
Acidification 49.7 100 75.7
Freshwater eutrophication 28.0 100 10.6
Marine eutrophication 32.9 100 70.1
Freshwater ecotoxicity 24.0 100 3.0
Water resource depletion 38.1 76.9 100
Final Score 42.2 91.7 48.9

Master Thesis LCA of Two Textile Products: Wool and Cotton
107