Embed Size (px)
Citation preview
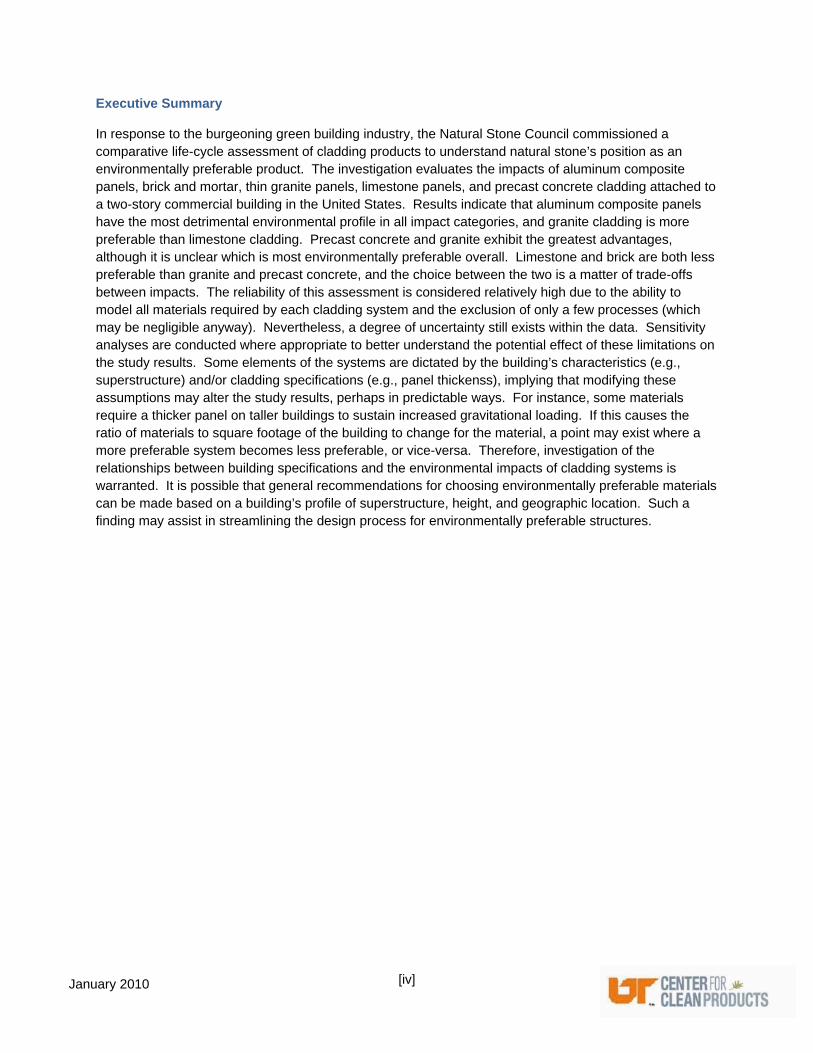
LIFE-CYCLE ASSESSMENT OF EXTERIOR CLADDING PRODUCTS A comparison of aluminum, brick, granite, limestone, and precast concrete
JANUARY 2010

[ii]
January 2010
This analysis and report were prepared for the Natural Stone Council by the University of Tennessee Center for Clean Products, a multi-disciplinary research center dedicated to the development, evaluation, and adoption of clean products and materials. The Center is housed within UT’s Institute for a Secure and Sustainable Environment. Please direct any inquiries about this report to the following: UT Center for Clean Products 600 Henley Street 311 Conference Center Building Knoxville, TN 37996-4134 [email protected] 865.974.4251

[iii]
January 2010
Acknowledgements The UT Center for Clean Products (CCP) would like to thank those companies and individuals who contributed their time to provide information for this analysis. The insight shared by architects, designers, engineers, manufacturers, and other experts has shaped this investigation into one that is realistic and defensible. Specifically, we would like to thank the Natural Stone Council for funding this study, as well as Eden Brukman, Adam Cone, Dan Dwight, Tim Feldhege, Jason McClennan, Joel Ray, Tom Smith, Allen Sparkman, members of the NSC Architectural Advisory Committee, and the NSC Sustainability Committee for providing much needed guidance and expertise.
[iv]
January 2010
Executive Summary In response to the burgeoning green building industry, the Natural Stone Council commissioned a comparative life-cycle assessment of cladding products to understand natural stone’s position as an environmentally preferable product. The investigation evaluates the impacts of aluminum composite panels, brick and mortar, thin granite panels, limestone panels, and precast concrete cladding attached to a two-story commercial building in the United States. Results indicate that aluminum composite panels have the most detrimental environmental profile in all impact categories, and granite cladding is more preferable than limestone cladding. Precast concrete and granite exhibit the greatest advantages, although it is unclear which is most environmentally preferable overall. Limestone and brick are both less preferable than granite and precast concrete, and the choice between the two is a matter of trade-offs between impacts. The reliability of this assessment is considered relatively high due to the ability to model all materials required by each cladding system and the exclusion of only a few processes (which may be negligible anyway). Nevertheless, a degree of uncertainty still exists within the data. Sensitivity analyses are conducted where appropriate to better understand the potential effect of these limitations on the study results. Some elements of the systems are dictated by the building’s characteristics (e.g., superstructure) and/or cladding specifications (e.g., panel thickenss), implying that modifying these assumptions may alter the study results, perhaps in predictable ways. For instance, some materials require a thicker panel on taller buildings to sustain increased gravitational loading. If this causes the ratio of materials to square footage of the building to change for the material, a point may exist where a more preferable system becomes less preferable, or vice-versa. Therefore, investigation of the relationships between building specifications and the environmental impacts of cladding systems is warranted. It is possible that general recommendations for choosing environmentally preferable materials can be made based on a building’s profile of superstructure, height, and geographic location. Such a finding may assist in streamlining the design process for environmentally preferable structures.
[v]
January 2010
Table of Contents Acknowledgements ....................................................................................................................................... iii
Executive Summary ..................................................................................................................................... iv
1 Introduction ................................................................................................................................................ 1
2 Overview of study ................................................................................................................................. 2
2.1 Cladding materials & systems ....................................................................................................... 2
2.2 Granite ........................................................................................................................................... 2
2.2.1 Granite cladding .................................................................................................................... 2
2.2.2 Life-cycle of granite cladding ................................................................................................. 3
2.3 Limestone ...................................................................................................................................... 4
2.3.1 Limestone cladding ............................................................................................................... 4
2.3.2 Life-cycle of limestone .......................................................................................................... 4
2.4 Precast concrete ........................................................................................................................... 4
2.4.1 Precast concrete cladding ..................................................................................................... 5
2.4.2 Life Cycle of precast concrete cladding ............................................................................... 5
2.5 Aluminum ...................................................................................................................................... 6
2.5.1 Aluminum cladding ................................................................................................................ 6
2.5.2 Life-cycle of aluminum ......................................................................................................... 6
2.6 Brick and mortar ............................................................................................................................ 8
2.6.1 Brick and mortar cladding ..................................................................................................... 8
2.6.2 Life-cycle of brick and mortar ................................................................................................ 8
3 Scope of LCA ..................................................................................................................................... 10
3.1 Scoping boundaries and data quality .......................................................................................... 10
3.2 Functional unit ............................................................................................................................. 10
3.3 Assumptions ................................................................................................................................ 11
3.3.1 System assumptions ........................................................................................................... 11
3.3.2 Cladding design assumptions ............................................................................................ 11
3.3.3 Granite cladding .................................................................................................................. 12
3.3.4 Limestone cladding ............................................................................................................. 14
3.3.5 Aluminum composite panels .............................................................................................. 14
3.3.6 Brick & mortar ...................................................................................................................... 15
3.3.7 Precast concrete cladding ................................................................................................... 15
4 Life-cycle assessment ........................................................................................................................ 16
4.1 Life-cycle impact assessment ..................................................................................................... 16
4.2 Life-cycle impact results .............................................................................................................. 16
4.2.1 Relationships between cladding systems ........................................................................... 17
4.2.2 Drivers of environmental impacts for natural stone ............................................................. 17
4.3 Discussion ................................................................................................................................... 18
4.3.1 Relationships between systems .......................................................................................... 18
[vi]
January 2010
4.3.2 Implications of results .......................................................................................................... 21
4.3.3 Future research ................................................................................................................... 22
5 Limitations and uncertainty ................................................................................................................. 23
References .................................................................................................................................................. 25
Appendices ............................................................................................................................................... A-1
Appendix A: Data and results ............................................................................................................... A-1
Appendix B: Sensitivity analyses .......................................................................................................... B-1
B.1 Air emissions during stone quarrying and panel production ...................................................... B-1
B.2 Aluminum degreasing ................................................................................................................ B-1
B.3 Transportation of quarried stone to processing ......................................................................... B-4
Appendix C: Sample calculations ......................................................................................................... C-1
C.1 Quantity of Insulation ................................................................................................................. C-1
[vii]
January 2010
List of Tables Table 1. Description of the cladding products evaluated in this study. ....................................................... 13 Table 2. Description of the cladding system materials assumed for this study. ......................................... 13 Table 3. Life-cycle environmental impacts of cladding assemblies affixed on the described commercial
building. .............................................................................................................................................. 18 Table 4. Life-cycle environmental benefits of cladding systems as compared to granite cladding. ........... 19 Table 5. Life-cycle environmental benefits of cladding systems as compared to limestone cladding. ....... 19 Table A1. Bill of materials for each cladding system. ............................................................................... A-1 Table A2. Impacts generated by each life-cycle stage for the aluminum cladding system. ..................... A-2 Table A3. Impacts generated by each life-cycle stage for the brick cladding system. ............................. A-2 Table A4. Impacts generated by each life-cycle stage for the granite cladding system. A-3 Table A5. Impacts generated by each life-cycle stage for the limestone cladding system. ..................... A-4 Table A6. Impacts generated by each life-cycle stage for the precast concrete cladding system. .......... A-4 Table B1. Life-cycle environmental impacts generated by stone cladding systems when an emissions
dataset is added to stone quarrying and processing. ....................................................................... B-1 Table B2. Life-cycle environmental benefits of cladding systems as compared to granite cladding when an
emissions dataset is added to stone quarrying and processing. ..................................................... B-2 Table B3. Life-cycle environmental benefits of cladding systems as compared to limestone cladding when
an emissions dataset is added to stone quarrying and processing. ................................................ B-2 Table B4. Environmental impacts generated by the aluminum cladding system when degreasing is
included in aluminum composite panel production. ......................................................................... B-3 Table B5. Environmental impacts generated by stone cladding systems assuming a transportation
distance of 0 miles for quarried stone. ............................................................................................. B-5 Table B6. Environmental benefits of cladding systems as compared to granite cladding when assuming a
transport distance of 0 miles for quarried stone. .............................................................................. B-5 Table B7. Environmental benefits of cladding systems as compared to limestone cladding when assuming
a transport distance of 0 miles for quarried stone. ........................................................................... B-6 Table C1. R-values assumed for the commercial building prescribed in this study. ................................ C-1
List of Figures
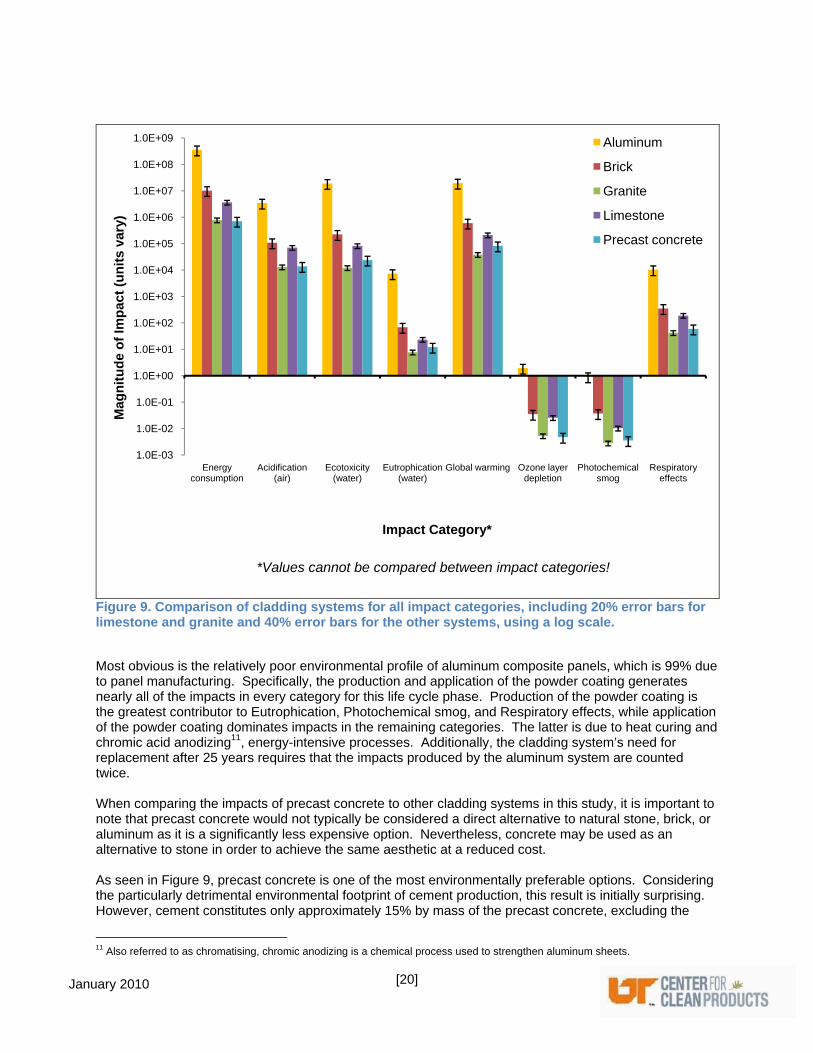
Figure 1. Production of natural stone cladding. ............................................................................................ 3 Figure 2. Production of precast concrete cladding. ...................................................................................... 5 Figure 3. Production of aluminum sheet. ...................................................................................................... 7 Figure 4. Production of aluminum composite panels. ................................................................................... 7 Figure 5. Production of fired clay brick. ......................................................................................................... 9 Figure 6. Production of masonry cement mortar........................................................................................... 9 Figure 7. Two-story commercial building to which the cladding systems are affixed. ................................ 12 Figure 8. Modeling approach used for the evaluation of each cladding system. ........................................ 15 Figure 9. Comparison of cladding systems for all impact categories, including 20% error bars for
limestone and granite and 40% error bars for the other systems, using a log scale. ........................ 20 Figure 10. Theoretical relationships of granite and precast concrete cladding systems. ........................... 23 Figure B1. Comparison of cladding systems for all impact categories, including 20% error bars for
limestone and granite and 40% error bars for the other systems, using a log scale when emissions for stone cladding are estimated. ..................................................................................................... B-3
Figure B2. Comparison of cladding systems for all impact categories, including 20% error bars for limestone and granite and 40% error bars for the other systems, using a log scale when raw material transport for stone cladding is zero. ................................................................................... B-6
[1]
January 2010
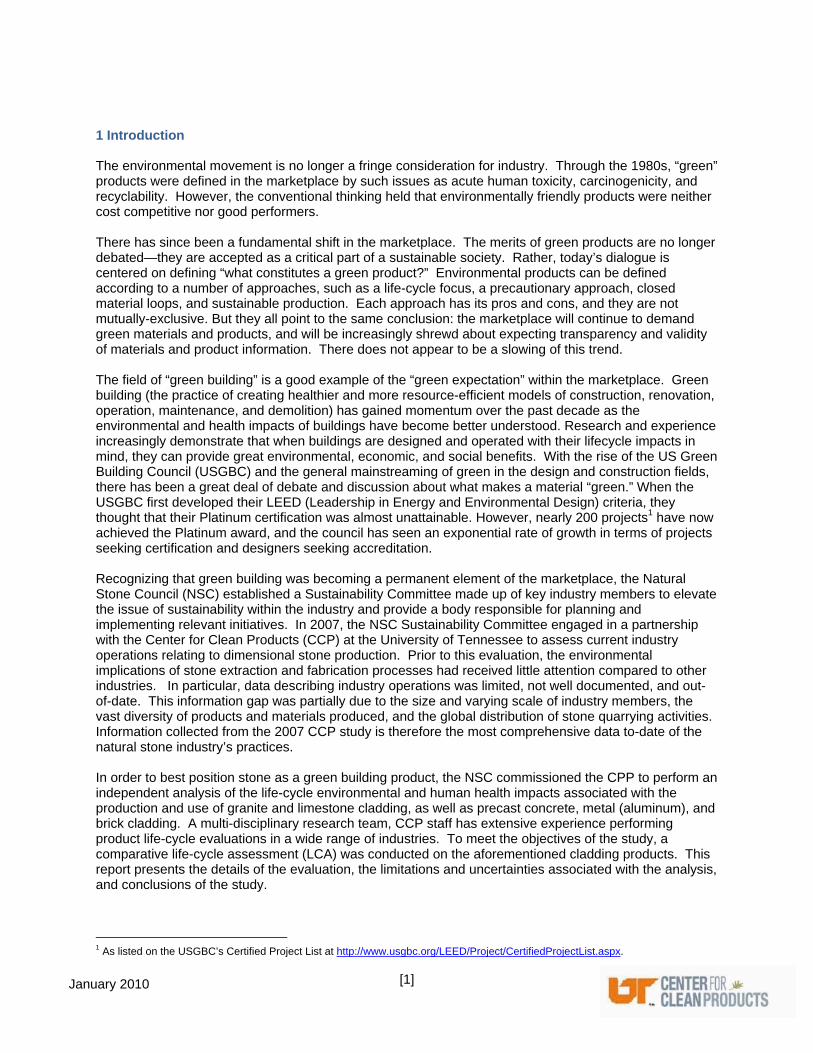
1 Introduction The environmental movement is no longer a fringe consideration for industry. Through the 1980s, “green” products were defined in the marketplace by such issues as acute human toxicity, carcinogenicity, and recyclability. However, the conventional thinking held that environmentally friendly products were neither cost competitive nor good performers. There has since been a fundamental shift in the marketplace. The merits of green products are no longer debated—they are accepted as a critical part of a sustainable society. Rather, today’s dialogue is centered on defining “what constitutes a green product?” Environmental products can be defined according to a number of approaches, such as a life-cycle focus, a precautionary approach, closed material loops, and sustainable production. Each approach has its pros and cons, and they are not mutually-exclusive. But they all point to the same conclusion: the marketplace will continue to demand green materials and products, and will be increasingly shrewd about expecting transparency and validity of materials and product information. There does not appear to be a slowing of this trend. The field of “green building” is a good example of the “green expectation” within the marketplace. Green building (the practice of creating healthier and more resource-efficient models of construction, renovation, operation, maintenance, and demolition) has gained momentum over the past decade as the environmental and health impacts of buildings have become better understood. Research and experience increasingly demonstrate that when buildings are designed and operated with their lifecycle impacts in mind, they can provide great environmental, economic, and social benefits. With the rise of the US Green Building Council (USGBC) and the general mainstreaming of green in the design and construction fields, there has been a great deal of debate and discussion about what makes a material “green.” When the USGBC first developed their LEED (Leadership in Energy and Environmental Design) criteria, they thought that their Platinum certification was almost unattainable. However, nearly 200 projects1 have now achieved the Platinum award, and the council has seen an exponential rate of growth in terms of projects seeking certification and designers seeking accreditation. Recognizing that green building was becoming a permanent element of the marketplace, the Natural Stone Council (NSC) established a Sustainability Committee made up of key industry members to elevate the issue of sustainability within the industry and provide a body responsible for planning and implementing relevant initiatives. In 2007, the NSC Sustainability Committee engaged in a partnership with the Center for Clean Products (CCP) at the University of Tennessee to assess current industry operations relating to dimensional stone production. Prior to this evaluation, the environmental implications of stone extraction and fabrication processes had received little attention compared to other industries. In particular, data describing industry operations was limited, not well documented, and out-of-date. This information gap was partially due to the size and varying scale of industry members, the vast diversity of products and materials produced, and the global distribution of stone quarrying activities. Information collected from the 2007 CCP study is therefore the most comprehensive data to-date of the natural stone industry’s practices. In order to best position stone as a green building product, the NSC commissioned the CPP to perform an independent analysis of the life-cycle environmental and human health impacts associated with the production and use of granite and limestone cladding, as well as precast concrete, metal (aluminum), and brick cladding. A multi-disciplinary research team, CCP staff has extensive experience performing product life-cycle evaluations in a wide range of industries. To meet the objectives of the study, a comparative life-cycle assessment (LCA) was conducted on the aforementioned cladding products. This report presents the details of the evaluation, the limitations and uncertainties associated with the analysis, and conclusions of the study.
1 As listed on the USGBC’s Certified Project List at http://www.usgbc.org/LEED/Project/CertifiedProjectList.aspx.
[2]
January 2010
2 Overview of study LCA is a data-driven approach to quantifying environmental and human health impacts of processes, products, and services. The method is comprised of four phases: definition of goals and scope, development of the life-cycle inventory (LCI, a list of all inputs and outputs to the system), assessment of impacts, and interpretation of results. Although LCA is data intensive, it should be noted that the quality of the results are a direct product of the quality of the data used in the analysis. Therefore, care should be taken when comparing results of LCA’s and attempting to make claims about the relative environmental impacts of products. This has been given paramount importance in the investigation presented herein.
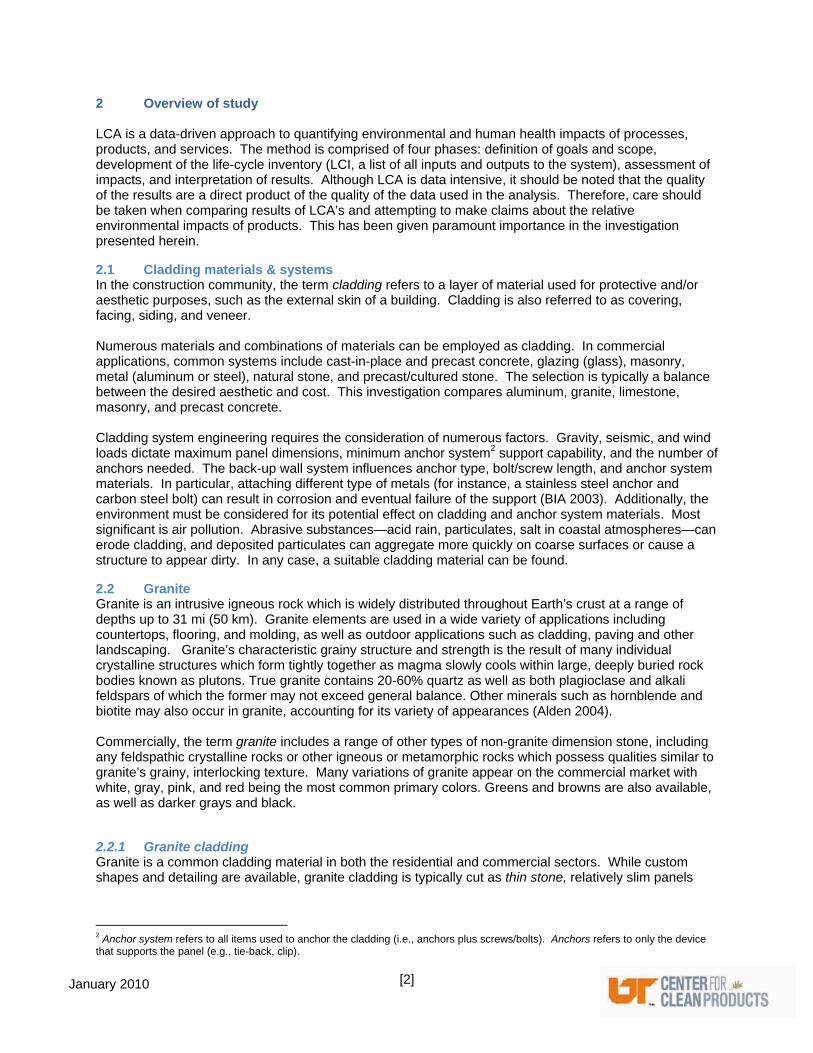
2.1 Cladding materials & systems In the construction community, the term cladding refers to a layer of material used for protective and/or aesthetic purposes, such as the external skin of a building. Cladding is also referred to as covering, facing, siding, and veneer. Numerous materials and combinations of materials can be employed as cladding. In commercial applications, common systems include cast-in-place and precast concrete, glazing (glass), masonry, metal (aluminum or steel), natural stone, and precast/cultured stone. The selection is typically a balance between the desired aesthetic and cost. This investigation compares aluminum, granite, limestone, masonry, and precast concrete. Cladding system engineering requires the consideration of numerous factors. Gravity, seismic, and wind loads dictate maximum panel dimensions, minimum anchor system2 support capability, and the number of anchors needed. The back-up wall system influences anchor type, bolt/screw length, and anchor system materials. In particular, attaching different type of metals (for instance, a stainless steel anchor and carbon steel bolt) can result in corrosion and eventual failure of the support (BIA 2003). Additionally, the environment must be considered for its potential effect on cladding and anchor system materials. Most significant is air pollution. Abrasive substances—acid rain, particulates, salt in coastal atmospheres—can erode cladding, and deposited particulates can aggregate more quickly on coarse surfaces or cause a structure to appear dirty. In any case, a suitable cladding material can be found.
2.2 Granite Granite is an intrusive igneous rock which is widely distributed throughout Earth’s crust at a range of depths up to 31 mi (50 km). Granite elements are used in a wide variety of applications including countertops, flooring, and molding, as well as outdoor applications such as cladding, paving and other landscaping. Granite’s characteristic grainy structure and strength is the result of many individual crystalline structures which form tightly together as magma slowly cools within large, deeply buried rock bodies known as plutons. True granite contains 20-60% quartz as well as both plagioclase and alkali feldspars of which the former may not exceed general balance. Other minerals such as hornblende and biotite may also occur in granite, accounting for its variety of appearances (Alden 2004). Commercially, the term granite includes a range of other types of non-granite dimension stone, including any feldspathic crystalline rocks or other igneous or metamorphic rocks which possess qualities similar to granite’s grainy, interlocking texture. Many variations of granite appear on the commercial market with white, gray, pink, and red being the most common primary colors. Greens and browns are also available, as well as darker grays and black.
2.2.1 Granite cladding Granite is a common cladding material in both the residential and commercial sectors. While custom shapes and detailing are available, granite cladding is typically cut as thin stone, relatively slim panels
2 Anchor system refers to all items used to anchor the cladding (i.e., anchors plus screws/bolts). Anchors refers to only the device that supports the panel (e.g., tie-back, clip).
[3]
January 2010
only 2-3 cm in thickness. The height and length of the panel usually span between 3 and 5 feet each, although both shorter and longer dimensions are possible.
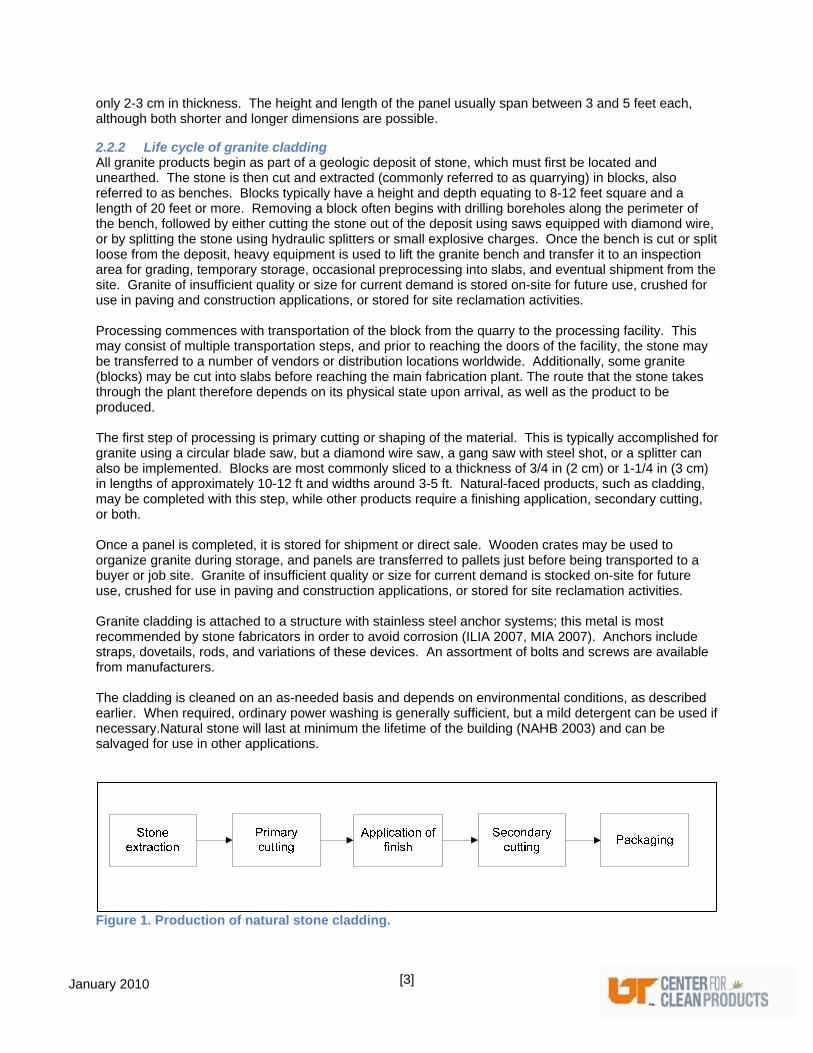
2.2.2 Life cycle of granite cladding All granite products begin as part of a geologic deposit of stone, which must first be located and unearthed. The stone is then cut and extracted (commonly referred to as quarrying) in blocks, also referred to as benches. Blocks typically have a height and depth equating to 8-12 feet square and a length of 20 feet or more. Removing a block often begins with drilling boreholes along the perimeter of the bench, followed by either cutting the stone out of the deposit using saws equipped with diamond wire, or by splitting the stone using hydraulic splitters or small explosive charges. Once the bench is cut or split loose from the deposit, heavy equipment is used to lift the granite bench and transfer it to an inspection area for grading, temporary storage, occasional preprocessing into slabs, and eventual shipment from the site. Granite of insufficient quality or size for current demand is stored on-site for future use, crushed for use in paving and construction applications, or stored for site reclamation activities. Processing commences with transportation of the block from the quarry to the processing facility. This may consist of multiple transportation steps, and prior to reaching the doors of the facility, the stone may be transferred to a number of vendors or distribution locations worldwide. Additionally, some granite (blocks) may be cut into slabs before reaching the main fabrication plant. The route that the stone takes through the plant therefore depends on its physical state upon arrival, as well as the product to be produced. The first step of processing is primary cutting or shaping of the material. This is typically accomplished for granite using a circular blade saw, but a diamond wire saw, a gang saw with steel shot, or a splitter can also be implemented. Blocks are most commonly sliced to a thickness of 3/4 in (2 cm) or 1-1/4 in (3 cm) in lengths of approximately 10-12 ft and widths around 3-5 ft. Natural-faced products, such as cladding, may be completed with this step, while other products require a finishing application, secondary cutting, or both. Once a panel is completed, it is stored for shipment or direct sale. Wooden crates may be used to organize granite during storage, and panels are transferred to pallets just before being transported to a buyer or job site. Granite of insufficient quality or size for current demand is stocked on-site for future use, crushed for use in paving and construction applications, or stored for site reclamation activities. Granite cladding is attached to a structure with stainless steel anchor systems; this metal is most recommended by stone fabricators in order to avoid corrosion (ILIA 2007, MIA 2007). Anchors include straps, dovetails, rods, and variations of these devices. An assortment of bolts and screws are available from manufacturers. The cladding is cleaned on an as-needed basis and depends on environmental conditions, as described earlier. When required, ordinary power washing is generally sufficient, but a mild detergent can be used if necessary.Natural stone will last at minimum the lifetime of the building (NAHB 2003) and can be salvaged for use in other applications.
Figure 1. Production of natural stone cladding.
[4]
January 2010
2.3 Limestone Limestone is a sedimentary rock composed primarily of calcium carbonate with the occasional presence of magnesium. Limestone elements are used in a wide variety of outdoor applications including cladding, coping, and other architectural details, landscaping applications such as paving and aggregate, and limited indoor applications like flooring. Most limestone is biochemical in origin meaning the calcium carbonate in the stone originated from shelled oceanic creatures. Limestone can also be chemical in origin as is the case with travertine. Chemical limestone forms when calcium and carbonate ions suspended in water chemically bond and precipitate from their aquatic sources. Because of its high calcium content, limestone is usually light in color, although many variations exist. Commercially, the term limestone includes dolomite, dolomitic limestone, oolitic limestone, and travertine (Dolley 2007), a porous calcitic rock that is commonly formed near hot springs.
2.3.1 Limestone cladding A limestone façade is common on residential and commercial structures and can be shaped to achieve a wide array of custom specifications. While thin limestone veneer is available, the Indiana Limestone Institute of America, Inc. recommends limestone cladding be at least 2 inches thick, noting that panels less than 3 inches must utilize special anchoring systems as conventional systems would cause failure (ILIA 2007).
2.3.2 Life cycle of limestone cladding Limestone is extracted and fabricated in a manner very similar to that of granite. Due to differences in geologic properties3, however, techniques vary. In the case of quarrying, limestone is extracted by employing saws equipped with diamond belts or by splitting the stone using hydraulic splitters. If bedding planes are visible, forklifts can be employed to pry up the blocks. During fabrication, primary cutting is accomplished most often using a circular blade saw, diamond wire saw, or a splitter. Limestone panels are, like granite products, stored and transported in wooden crates and pallets. Limestone of insufficient quality or size for current demand is stocked on-site for future use, crushed for use in paving and construction applications, or stored for site reclamation activities. Stainless steel anchor systems are used to attach the limestone panels to a building. Steel is the metal most recommended by stone fabricators in order to avoid corrosion (ILIA 2007, MIA 2007). Anchors include straps, dovetails, rods, and variations of these devices. An assortment of bolts and screws are available from manufacturers. Limestone cladding is cleaned on an as-needed basis and depends on environmental conditions, as described earlier. When required, ordinary power washing is generally sufficient. A mild detergent can be used if necessary. Natural stone veneer will last at minimum the lifetime of the building (NAHB 2003) and can be salvaged for use in other applications.
2.4 Precast concrete Precast concrete refers to any concrete building element that is cast in a mold or form, typically in a factory environment, before being moved to its final location. Precast concrete elements are used in a wide variety of applications including storm and wastewater management, site-work such as retaining walls and catchment basins, and as both structural and architectural building components. Architectural precast concrete refers to any precast element used in non-structural applications within a building while structural precast refers to a variety components used in walls, beams, columns, foundations and floors. Precast concrete production consists of the same components used for standard site-cast or cast-in-place concrete production. Portland cement, small and large aggregate (commonly sand and crushed stone, respectively) and water are combined with any number of additives to achieve concrete of a desired
3 Limestone is generally less dense than granite and exhibits a greater frequency of fracturing.
[5]
January 2010
strength, texture, and color as well as any number of desired technical characteristics including curing time and condition, form-filling properties, and vapor permeability among others. Additionally, various industrial byproducts such as fly ash and slag may be substituted for some or all of the cement, and recycled concrete, stone, and other materials may be substituted for virgin aggregate materials Precast elements take on the shape and texture the mold or form into which they are poured. Color and texture are determined by the color of the cement and aggregate used as well as any pigments or chemical admixtures. Upon removal from the mold or form, precast element can be finished using a variety of methods such as grinding and polishing, sandblasting, chemical etching, or staining. In this way, a variety of shapes and finishes can be achieved ranging from a smooth modern aesthetic to imitations of natural stone or brick.
2.4.1 Precast concrete cladding Precast cladding is used in a variety of commercial and residential building types. It can be of custom design or one of many proprietary systems. Precast panels range in size from small spandrel units to entire wall units and are limited only by available transportation and erection methods. Precast cladding is commonly used as a component of non-load-bearing curtain-wall assemblies. It may also be used as a veneer over load-bearing concrete or masonry walls or as a substrate for other finish materials.
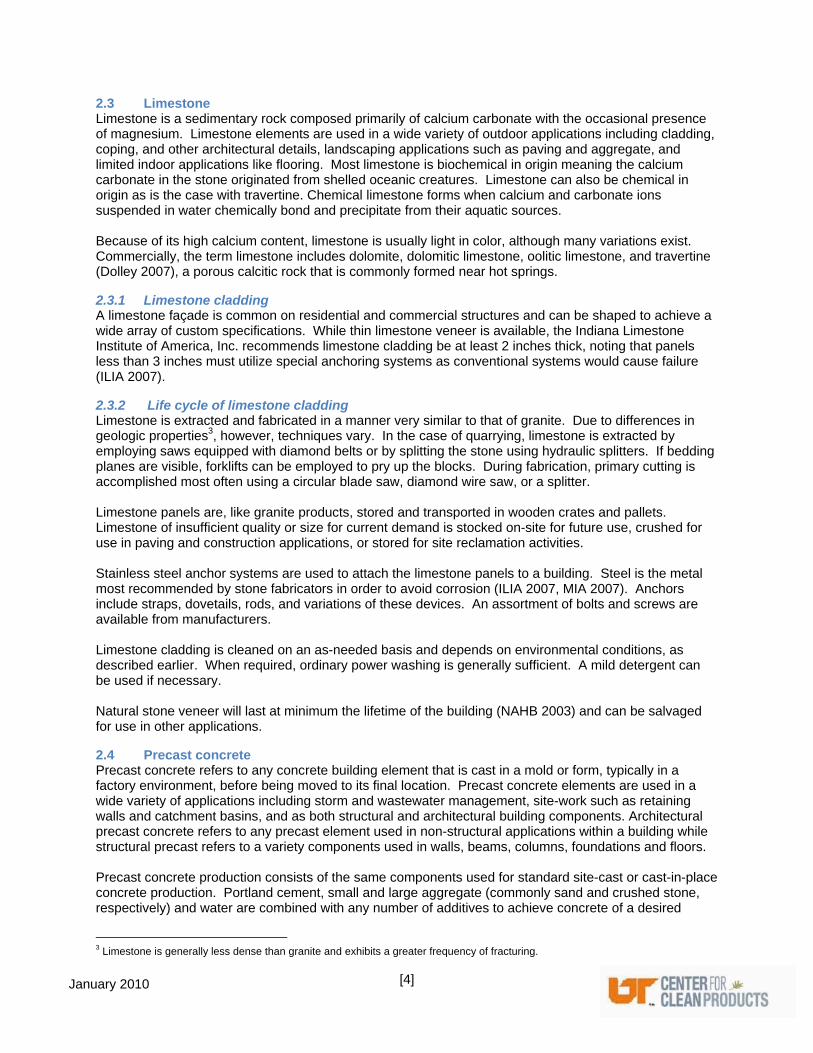
2.4.2 Life cycle of precast concrete cladding Precast concrete cladding begins as a concrete mixture which is poured into a mold around reinforcing materials. Bolts and other anchoring hardware are also cast into the concrete to assist in the fastening and transport of the panels. The panels are then allowed to cure before being removed from the mold. After curing, a surface finish may be applied before the panel is transported to the building site. In a curtain-wall assembly, panels are attached to a steel or concrete superstructure using a variety of fasteners, most often steel bolts and clips or other proprietary systems. In the case of veneer application, adhesives may also be used to affix the cladding directly to load-bearing concrete or masonry walls. Cleaning is on an as-needed basis and can be accomplished using ordinary pressure-washing with or without mild cleaning chemicals. Waste concrete is often crushed prior to disposal so that any steel reinforcing contained within can be magnetically removed and recycled. While the concrete itself can be used as aggregate in new concrete or as engineered fill in site-work, it is frequently disposed of in landfills.
Figure 2. Production of precast concrete cladding.
[6]
January 2010
2.5 Aluminum Aluminum, also known as aluminium, is one of the most abundant elements in Earth’s crust. Due to its reactivity with oxygen, aluminum is rarely found as a free metal. Instead, the material nearly always occurs as a component of silicate and oxide minerals. In fact, the primary economic source for aluminum ore is bauxite, a mixture of aluminum hydroxide and aluminum oxide hydroxide minerals. Aluminum is nonmagnetic and exhibits a silvery-white color. Aluminum is employed around the world in a multitude of applications and industries. Common uses of the metal include packaging, construction materials, and parts for vehicles and machinery. Aluminum compounds and aluminum alloys are frequently implemented in a host of consumer and industrial products, as well.
2.5.1 Aluminum cladding Aluminum is well suited to exterior building applications due to its inherent resistance to corrosion. Aluminum naturally oxidizes when exposed to weather forming a protective layer which prevents further corrosion. It is therefore widely used in commercial and residential building construction as an exterior cladding material. Aluminum cladding is most commonly available as a modular panel system for use in curtain-wall assemblies. Panels are available as single layers of aluminum or as composite panels with continuous or honeycomb insulation. The aluminum sheets can range from 0.020-0.028 inches (0.5-0.7mm) thick, while the insulating material is typically a minimum 1.5 inches thick and may increase depending on the desired magnitude of insulation. A broad span of lengths and widths are available to meet project specifications.
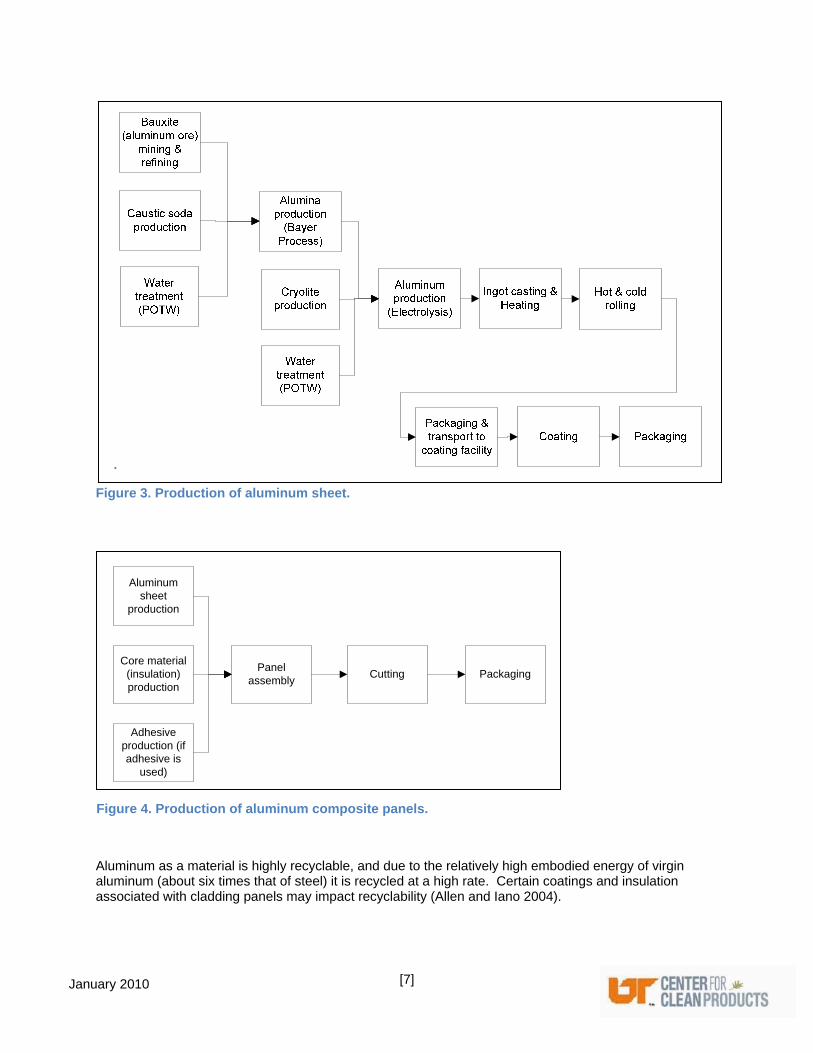
2.5.2 Life-cycle of aluminum cladding Aluminum begins as bauxite ore which is primarily strip mined. The bauxite is crushed and mixed with caustic soda at high temperature and pressure resulting in sodium aluminate and impurities. The result undergoes filtration and precipitation processes to yield alumina. Metallic aluminum is made by combining this alumina with cryolite and subjecting it to a low-voltage, high-amperage electrical current in a process known as electrolysis or smelting (AIA 1996). Unfinished aluminum may be used as exterior cladding, but is often finished for aesthetic reasons. Aluminum is commonly anodized through an electrolytic process which results in a thick layer of oxide. Anodized aluminum is extremely hard and resistant to weathering and may be pigmented to achieve a variety of colors. Other finishes include organic coatings, porcelain enamels, powder coatings or modified acrylic, polyester polymer, and polyvinyl chloride (PVC) coatings. Mechanical processes, such as wire brushing and belt polishing, as well as chemical etching or chemical conversion coatings, such as phosphates, chromates, or oxides, are also common (Allen and Iano 2004). Insulated cladding panels are made by sandwiching rigid insulating material between layers of aluminum. Methods of production include press injection, continuous lamination, and adhesive lamination. While most processes require an adhesive to bond the insulation and metal faces, urethanes (i.e., polyurethane and polyisocyanurate) are autohesive, inherently forming the bond during the manufacturing process (MCMRA 1995). Various aluminum profiles used for joining and attaching panel systems are manufactured through the process of extrusion. Techniques for fastening aluminum panels to a building’s structure include variety of custom and proprietary systems generally involving screws or bolts. Aluminum cladding rarely requires maintenance, and modular panel systems are generally easy to repair and replace as needed. While the cladding itself may last for up to 50 years (IAI 2009), the coatings deteriorate after only 10-25 years (MCMRA 1995) , necessitating replacement to maintain aesthetics.
[7]
January 2010
.
Figure 3. Production of aluminum sheet.
Aluminum as a material is highly recyclable, and due to the relatively high embodied energy of virgin aluminum (about six times that of steel) it is recycled at a high rate. Certain coatings and insulation associated with cladding panels may impact recyclability (Allen and Iano 2004).
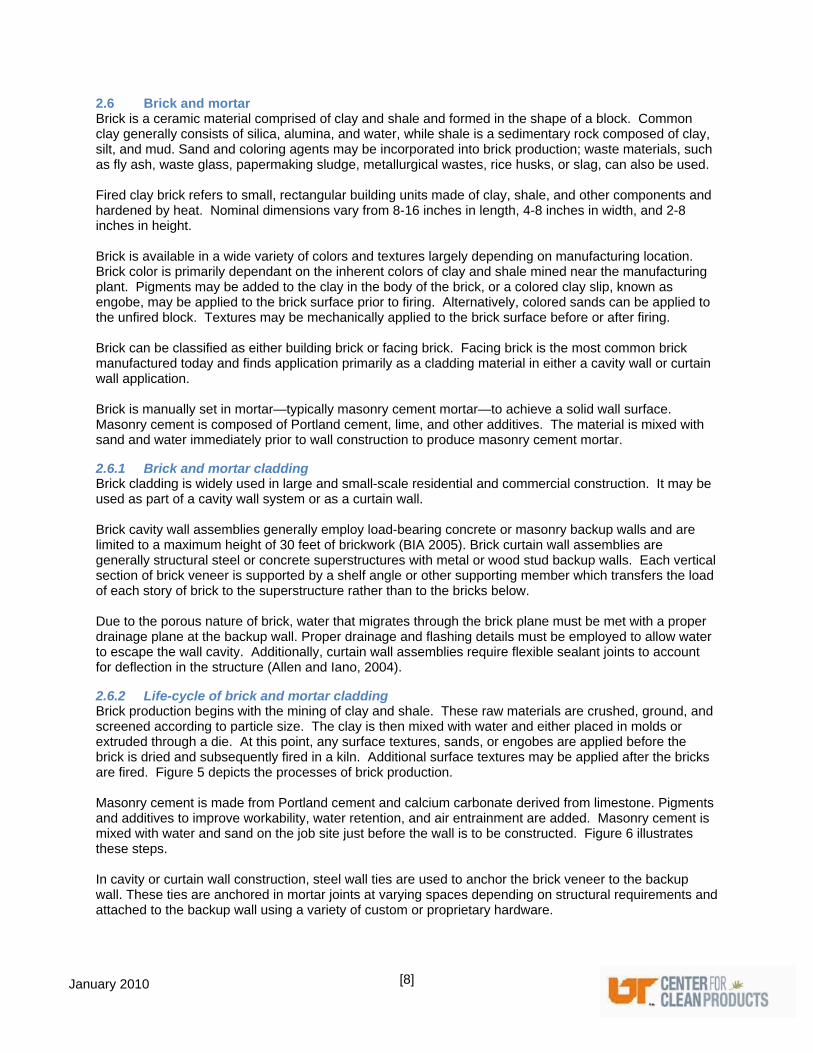
Panel assembly
Cutting Packaging
Aluminum sheet
production
Core material (insulation) production
Adhesive production (if adhesive is
used)
Figure 4. Production of aluminum composite panels.
[8]
January 2010
2.6 Brick and mortar Brick is a ceramic material comprised of clay and shale and formed in the shape of a block. Common clay generally consists of silica, alumina, and water, while shale is a sedimentary rock composed of clay, silt, and mud. Sand and coloring agents may be incorporated into brick production; waste materials, such as fly ash, waste glass, papermaking sludge, metallurgical wastes, rice husks, or slag, can also be used. Fired clay brick refers to small, rectangular building units made of clay, shale, and other components and hardened by heat. Nominal dimensions vary from 8-16 inches in length, 4-8 inches in width, and 2-8 inches in height. Brick is available in a wide variety of colors and textures largely depending on manufacturing location. Brick color is primarily dependant on the inherent colors of clay and shale mined near the manufacturing plant. Pigments may be added to the clay in the body of the brick, or a colored clay slip, known as engobe, may be applied to the brick surface prior to firing. Alternatively, colored sands can be applied to the unfired block. Textures may be mechanically applied to the brick surface before or after firing. Brick can be classified as either building brick or facing brick. Facing brick is the most common brick manufactured today and finds application primarily as a cladding material in either a cavity wall or curtain wall application. Brick is manually set in mortar—typically masonry cement mortar—to achieve a solid wall surface. Masonry cement is composed of Portland cement, lime, and other additives. The material is mixed with sand and water immediately prior to wall construction to produce masonry cement mortar.
2.6.1 Brick and mortar cladding Brick cladding is widely used in large and small-scale residential and commercial construction. It may be used as part of a cavity wall system or as a curtain wall. Brick cavity wall assemblies generally employ load-bearing concrete or masonry backup walls and are limited to a maximum height of 30 feet of brickwork (BIA 2005). Brick curtain wall assemblies are generally structural steel or concrete superstructures with metal or wood stud backup walls. Each vertical section of brick veneer is supported by a shelf angle or other supporting member which transfers the load of each story of brick to the superstructure rather than to the bricks below. Due to the porous nature of brick, water that migrates through the brick plane must be met with a proper drainage plane at the backup wall. Proper drainage and flashing details must be employed to allow water to escape the wall cavity. Additionally, curtain wall assemblies require flexible sealant joints to account for deflection in the structure (Allen and Iano, 2004).
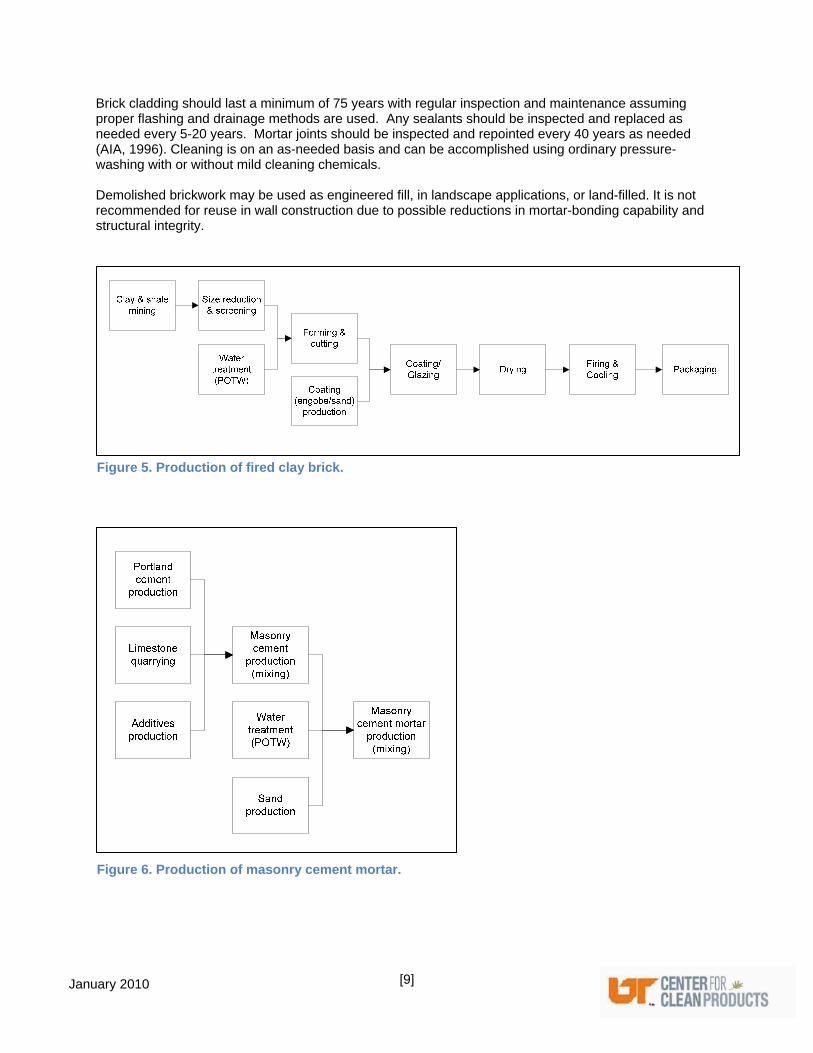
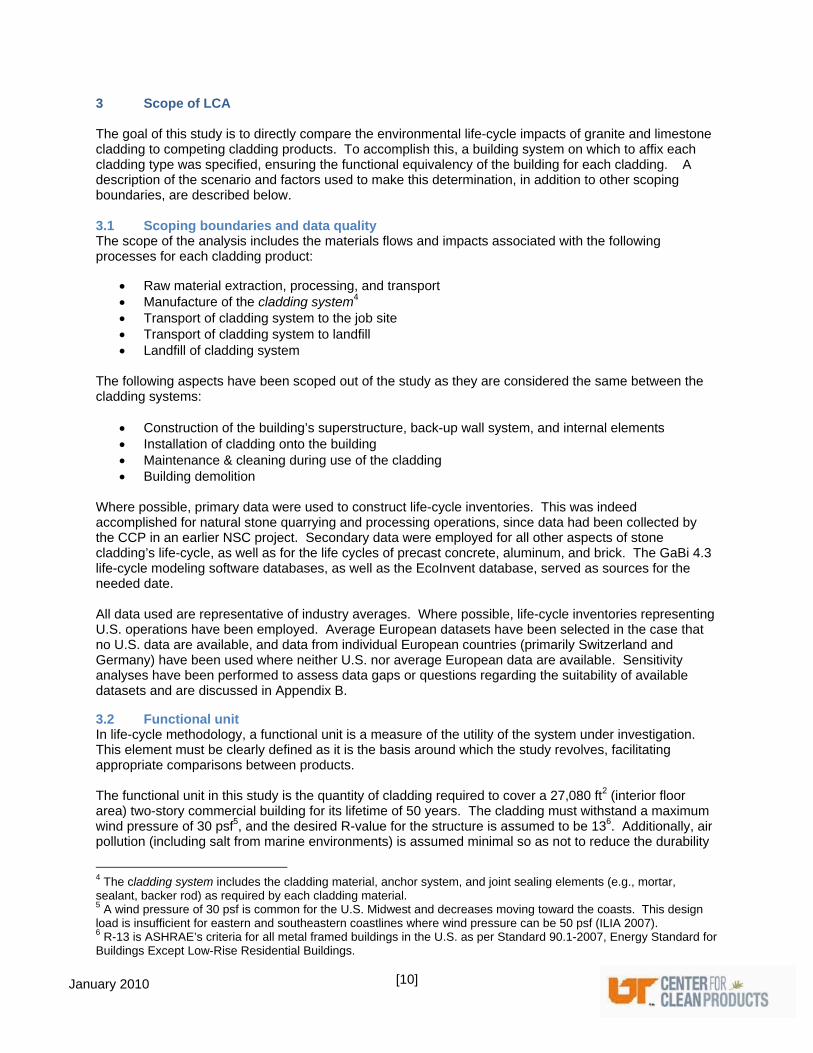
2.6.2 Life-cycle of brick and mortar cladding Brick production begins with the mining of clay and shale. These raw materials are crushed, ground, and screened according to particle size. The clay is then mixed with water and either placed in molds or extruded through a die. At this point, any surface textures, sands, or engobes are applied before the brick is dried and subsequently fired in a kiln. Additional surface textures may be applied after the bricks are fired. Figure 5 depicts the processes of brick production. Masonry cement is made from Portland cement and calcium carbonate derived from limestone. Pigments and additives to improve workability, water retention, and air entrainment are added. Masonry cement is mixed with water and sand on the job site just before the wall is to be constructed. Figure 6 illustrates these steps. In cavity or curtain wall construction, steel wall ties are used to anchor the brick veneer to the backup wall. These ties are anchored in mortar joints at varying spaces depending on structural requirements and attached to the backup wall using a variety of custom or proprietary hardware.
[9]
January 2010
Brick cladding should last a minimum of 75 years with regular inspection and maintenance assuming proper flashing and drainage methods are used. Any sealants should be inspected and replaced as needed every 5-20 years. Mortar joints should be inspected and repointed every 40 years as needed (AIA, 1996). Cleaning is on an as-needed basis and can be accomplished using ordinary pressure-washing with or without mild cleaning chemicals. Demolished brickwork may be used as engineered fill, in landscape applications, or land-filled. It is not recommended for reuse in wall construction due to possible reductions in mortar-bonding capability and structural integrity.
Figure 6. Production of masonry cement mortar.
Figure 5. Production of fired clay brick.
[10]
January 2010
3 Scope of LCA The goal of this study is to directly compare the environmental life-cycle impacts of granite and limestone cladding to competing cladding products. To accomplish this, a building system on which to affix each cladding type was specified, ensuring the functional equivalency of the building for each cladding. A description of the scenario and factors used to make this determination, in addition to other scoping boundaries, are described below. 3.1 Scoping boundaries and data quality The scope of the analysis includes the materials flows and impacts associated with the following processes for each cladding product:
Raw material extraction, processing, and transport Manufacture of the cladding system4 Transport of cladding system to the job site Transport of cladding system to landfill Landfill of cladding system
The following aspects have been scoped out of the study as they are considered the same between the cladding systems:
Construction of the building’s superstructure, back-up wall system, and internal elements Installation of cladding onto the building Maintenance & cleaning during use of the cladding Building demolition
Where possible, primary data were used to construct life-cycle inventories. This was indeed accomplished for natural stone quarrying and processing operations, since data had been collected by the CCP in an earlier NSC project. Secondary data were employed for all other aspects of stone cladding’s life-cycle, as well as for the life cycles of precast concrete, aluminum, and brick. The GaBi 4.3 life-cycle modeling software databases, as well as the EcoInvent database, served as sources for the needed date. All data used are representative of industry averages. Where possible, life-cycle inventories representing U.S. operations have been employed. Average European datasets have been selected in the case that no U.S. data are available, and data from individual European countries (primarily Switzerland and Germany) have been used where neither U.S. nor average European data are available. Sensitivity analyses have been performed to assess data gaps or questions regarding the suitability of available datasets and are discussed in Appendix B.
3.2 Functional unit In life-cycle methodology, a functional unit is a measure of the utility of the system under investigation. This element must be clearly defined as it is the basis around which the study revolves, facilitating appropriate comparisons between products. The functional unit in this study is the quantity of cladding required to cover a 27,080 ft2 (interior floor area) two-story commercial building for its lifetime of 50 years. The cladding must withstand a maximum wind pressure of 30 psf5, and the desired R-value for the structure is assumed to be 136. Additionally, air pollution (including salt from marine environments) is assumed minimal so as not to reduce the durability
4 The cladding system includes the cladding material, anchor system, and joint sealing elements (e.g., mortar, sealant, backer rod) as required by each cladding material. 5 A wind pressure of 30 psf is common for the U.S. Midwest and decreases moving toward the coasts. This design load is insufficient for eastern and southeastern coastlines where wind pressure can be 50 psf (ILIA 2007). 6 R-13 is ASHRAE’s criteria for all metal framed buildings in the U.S. as per Standard 90.1-2007, Energy Standard for Buildings Except Low-Rise Residential Buildings.
[11]
January 2010
of the cladding or anchoring system. These prescriptions apply for a building located in the majority of the non-coastal, contiguous United States. While aesthetics are very different between the cladding systems, a panelized appearance is the goal where possible (i.e., for all materials, except brick). The building is designed with simple rectangular walls.
3.3 Assumptions Due to commonalities between cladding systems and because this is a hypothetical construction project, several assumptions can be made. These not only simplify the analysis but create a baseline scenario from which specific projects can be modeled in the future.
3.3.1 System assumptions Since this assessment evaluates no real construction project, the following assumptions have been made to capture the impacts of each cladding system:
Transportation of all cladding system components to the job site is 100 miles by truck.
Each building is erected and demolished in the same manner such that differences in impacts between each building are negligible.
Each cladding system is installed and maintained in the same manner such that differences in impacts between each building are negligible.
All cladding system components are transported to and disposed of in an inert material landfill located 50 miles from the job site. Transportation to the landfill occurs by truck.
Under these assumptions, impacts generated during the building’s lifetime can be ignored, and impacts caused by transportation are based only on material weight.
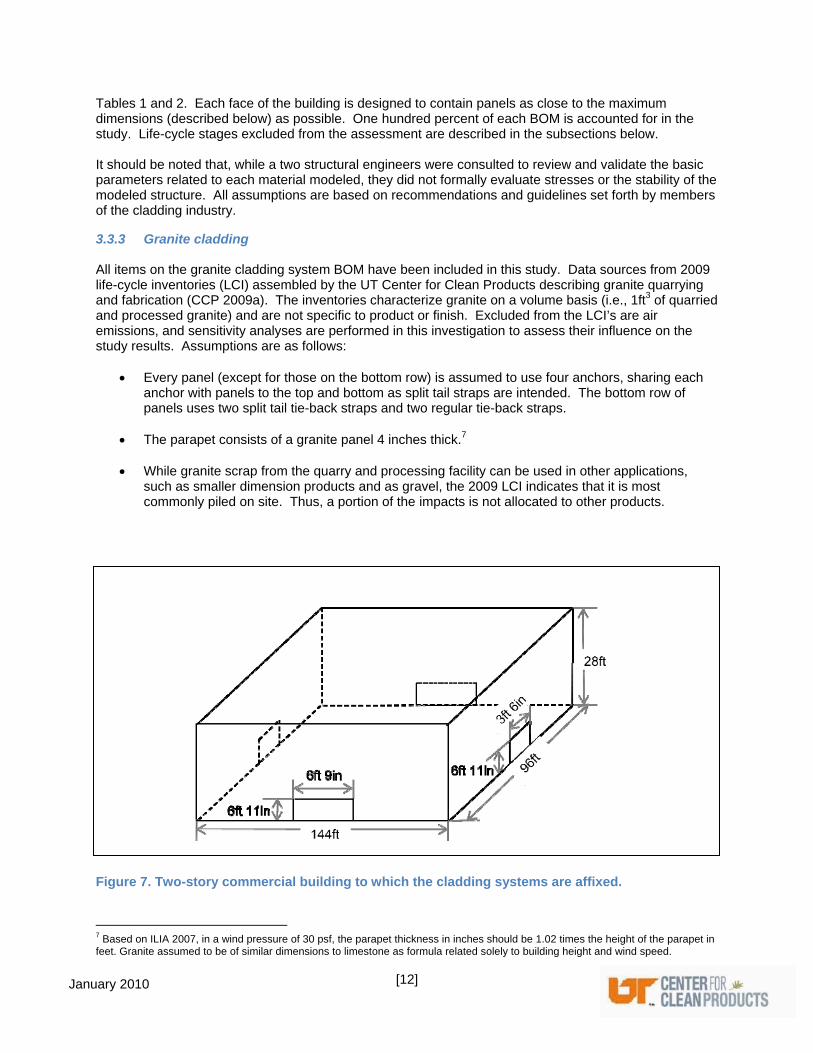
3.3.2 Cladding design assumptions Since the use phase is included in this model, buildings of equal functionality and performance have been selected for each product. A diagram of this building is shown in Figure 1. Unless otherwise described here, all aspects of the job site, building structure, building function, and building performance are the same for each cladding type.
The building is constructed with a concrete foundation and under the cavity wall strategy, a layered system consisting of an interior wall, a structural wall, exterior grade sheathing, insulation, a drainage plane, an air cavity, and finally the cladding. Also included is a 4-ft tall parapet. The rain screen concept is assumed with the bottom of the cladding and a joint midway to the top of the building left open for flashing.
All cladding types are attached to steel studs on a steel framed building with an anchoring system
suitable for the particular veneer. Attachment of the anchoring system, including drilling holes in panels as well as studs, has not been addressed in this study as it is likely negligible between and within each cladding system. Further, while each cladding material exhibits a different R-value, the insulating power provided by each material is virtually negligible compared to the desired value of 13, implying that all materials require essentially the same quantity and type of insulation. Therefore, only the life-cycles of the cladding system components are modeled. Foamed-in-place polyurethane is assumed for this building. See Appendix C for calculations.
Windows have been excluded for simplicity and can easily be added by future investigators by
adding and subtracting appropriate amounts of materials as necessary for each cladding product. Based on the design in Figure 1, a bill of materials (BOM) for each type of cladding assembly has been assembled and are presented in Appendix A (Table A1). A description of each assembly is provided in
[12]
January 2010
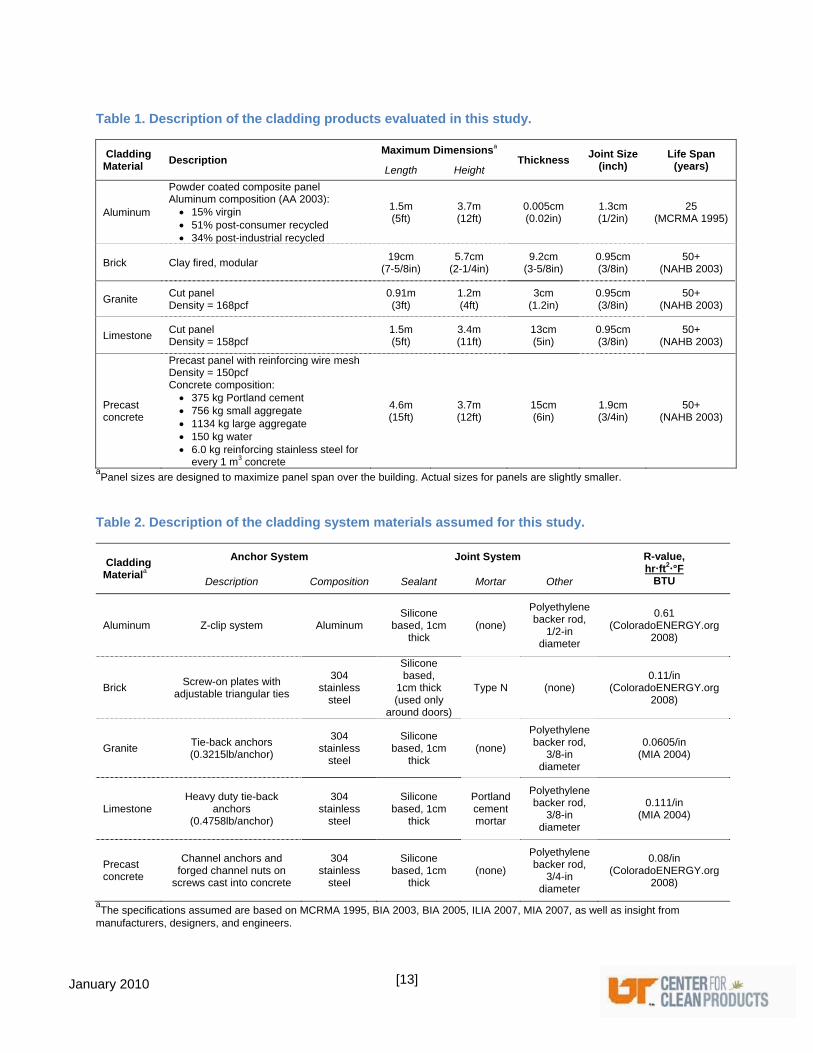
Tables 1 and 2. Each face of the building is designed to contain panels as close to the maximum dimensions (described below) as possible. One hundred percent of each BOM is accounted for in the study. Life-cycle stages excluded from the assessment are described in the subsections below. It should be noted that, while a two structural engineers were consulted to review and validate the basic parameters related to each material modeled, they did not formally evaluate stresses or the stability of the modeled structure. All assumptions are based on recommendations and guidelines set forth by members of the cladding industry.
3.3.3 Granite cladding All items on the granite cladding system BOM have been included in this study. Data sources from 2009 life-cycle inventories (LCI) assembled by the UT Center for Clean Products describing granite quarrying and fabrication (CCP 2009a). The inventories characterize granite on a volume basis (i.e., 1ft3 of quarried and processed granite) and are not specific to product or finish. Excluded from the LCI’s are air emissions, and sensitivity analyses are performed in this investigation to assess their influence on the study results. Assumptions are as follows:
Every panel (except for those on the bottom row) is assumed to use four anchors, sharing each anchor with panels to the top and bottom as split tail straps are intended. The bottom row of panels uses two split tail tie-back straps and two regular tie-back straps.
The parapet consists of a granite panel 4 inches thick.7
While granite scrap from the quarry and processing facility can be used in other applications, such as smaller dimension products and as gravel, the 2009 LCI indicates that it is most commonly piled on site. Thus, a portion of the impacts is not allocated to other products.
Figure 7. Two-story commercial building to which the cladding systems are affixed.
7 Based on ILIA 2007, in a wind pressure of 30 psf, the parapet thickness in inches should be 1.02 times the height of the parapet in feet. Granite assumed to be of similar dimensions to limestone as formula related solely to building height and wind speed.
[13]
January 2010
Table 1. Description of the cladding products evaluated in this study.
Cladding Material
Description Maximum Dimensionsa
Thickness Joint Size
(inch) Life Span
(years) Length Height
Aluminum
Powder coated composite panel Aluminum composition (AA 2003): 15% virgin 51% post-consumer recycled 34% post-industrial recycled
1.5m (5ft)
3.7m (12ft)
0.005cm (0.02in)
1.3cm (1/2in)
25 (MCRMA 1995)
Brick Clay fired, modular 19cm
(7-5/8in) 5.7cm
(2-1/4in) 9.2cm
(3-5/8in) 0.95cm (3/8in)
50+ (NAHB 2003)
Granite Cut panel Density = 168pcf
0.91m (3ft)
1.2m (4ft)
3cm (1.2in)
0.95cm (3/8in)
50+ (NAHB 2003)
Limestone Cut panel Density = 158pcf
1.5m (5ft)
3.4m (11ft)
13cm (5in)
0.95cm (3/8in)
50+ (NAHB 2003)
Precast concrete
Precast panel with reinforcing wire mesh Density = 150pcf Concrete composition: 375 kg Portland cement 756 kg small aggregate 1134 kg large aggregate 150 kg water 6.0 kg reinforcing stainless steel for
every 1 m3 concrete
4.6m (15ft)
3.7m (12ft)
15cm (6in)
1.9cm (3/4in)
50+ (NAHB 2003)
aPanel sizes are designed to maximize panel span over the building. Actual sizes for panels are slightly smaller.
Table 2. Description of the cladding system materials assumed for this study.
Cladding Materiala
Anchor System Joint System R-value, hrft2°F
BTU Description Composition Sealant Mortar Other
Aluminum Z-clip system Aluminum Silicone
based, 1cm thick
(none)
Polyethylene backer rod,
1/2-in diameter
0.61 (ColoradoENERGY.org
2008)
Brick Screw-on plates with
adjustable triangular ties
304 stainless
steel
Silicone based,
1cm thick
(used only around doors)
Type N (none) 0.11/in
(ColoradoENERGY.org 2008)
Granite Tie-back anchors (0.3215lb/anchor)
304 stainless
steel
Silicone based, 1cm
thick (none)
Polyethylene backer rod,
3/8-in diameter
0.0605/in (MIA 2004)
Limestone Heavy duty tie-back
anchors (0.4758lb/anchor)
304 stainless
steel
Silicone based, 1cm
thick
Portland cement mortar
Polyethylene backer rod,
3/8-in diameter
0.111/in (MIA 2004)
Precast concrete
Channel anchors and forged channel nuts on
screws cast into concrete
304 stainless
steel
Silicone based, 1cm
thick (none)
Polyethylene backer rod,
3/4-in diameter
0.08/in (ColoradoENERGY.org
2008)
aThe specifications assumed are based on MCRMA 1995, BIA 2003, BIA 2005, ILIA 2007, MIA 2007, as well as insight from
manufacturers, designers, and engineers.
[14]
January 2010
3.3.4 Limestone cladding All items on the limestone cladding system BOM have been included in this study. Data sources from 2009 life-cycle inventories assembled by the UT Center for Clean Products describing limestone quarrying and fabrication (CCP 2009b). The inventories characterize limestone on a volume basis (i.e., 1ft3 of quarried and processed limestone) and are not specific to product or finish. Excluded from the LCI’s are air emissions, and sensitivity analyses are performed in this investigation to assess their influence on the study results. Assumptions are as follows:
Panels are connected to steel studs using a heavy duty split tail tie-back strap fastened with a 3/8-in diameter, 2-in long bolt; both are stainless steel. The individual strap weight is 0.4758 lb. Each panel (except for those on the bottom row) is assumed to use four anchors, sharing each anchor with panels to the top and bottom as split tail straps are intended. The bottom row of panels uses two split tail tie-back straps and two regular tie-back straps.
The parapet consists of a final limestone panel 5 inches thick8.
While limestone scrap from the quarry and processing facility can be used in other applications,
such as smaller dimension products and as gravel, the 2000 LCI indicates that it is most commonly piled on site. Thus, a portion of the impacts is not allocated to other products.
3.3.5 Aluminum composite panels All items on the aluminum cladding system BOM have been included in this study. Data sources from the GaBi (PE Americas) database as well as EcoInvent. Assumptions are as follows:
Raw materials to produce sheet aluminum are assumed to consist of 15% virgin aluminum, 34% post-industrial aluminum, and 51% post-consumer aluminum. These values are consistent with statistics provided by The Aluminum Association (2003), a U.S.-based global trade association of the aluminum industry, describing domestic aluminum flat-rolled products for the construction industry
Production and application of a protective powder coating is included in this analysis. The data
for production of the coating represents a 1:1 mixture of epoxy and polyester resin with a titanium dioxide (TiO2) pigment.
Each panel requires two wall clips (one spanning the bottom and one spanning the top) and four
z-clips at quarter points (i.e., one in each corner).
The parapet includes a poured concrete masonry wall 4 inches thick to provide support to the panels.
Although aluminum may be salvaged for recycling at the end of its life as cladding, it is
considered to be sent to a landfill. As such, no feedback loop is considered in this model.
As previously discussed, insulation is excluded from this study; therefore, simulation of composite panel production excludes the combination of the aluminum sheeting and the insulating sandwich material. Since a polyurethane insulation is assumed in this study, only the energy used to roll out and press the metal sheets and insulation is excluded; an adhesive is not used in this method.
Aluminum degreasing is also barred. This is due to uncertainty that the available dataset
accurately reflects panel degreasing operations. A sensitivity analysis is conducted for further exploration; see Appendix B.
8 Based on ILIA 2007, in a wind pressure of 30 psf, the parapet thickness in inches should be 1.02 times the height of the parapet in feet.
[15]
January 2010
3.3.6 Brick & mortar All items on the aluminum cladding system BOM have been included in this study. Data sources from the GaBi (PE Americas) database as well as EcoInvent. Assumptions are as follows:
The dataset used for brick production includes limestone as a direct ingredient in the mixture. To perform the most parallel LCA’s between the cladding systems possible, the limestone (quarrying) dataset used in this study’s limestone cladding LCA is also employed here.
Waste disposal during brick production is not included in the dataset. It is unclear whether its
impacts are important in the analysis.
The brick is connected to steel studs using an adjustable triangular tie and screw-on anchor plate; both are stainless steel. The plated is bolted to the studs with a #10 self-tapping 2-in screw, and the tie has a diameter of 3/16 in. The anchors are placed every 2 ft2 (approximately every 16 in vertically and 16 in horizontally).
The parapet includes a poured concrete masonry wall 4 inches thick to provide structure to the
cladding.
3.3.7 Precast concrete cladding Precast concrete is generally considered the economic choice in the cladding arena. As such, in a project that is considering high quality materials like the four previously described, precast concrete would not typically be identified as an option. However, because it is still important to understand the relative environmental impacts of the cladding system, it is evaluated in this report. Precast concrete would most likely be considered an option when the aesthetics of stone is desired, yet the cost is prohibitive. It is for this reason that a panel size similar to the limestone is assumed, as opposed to the expansive wall units that precast concrete cladding is typically formed as. Concrete is very similar to limestone as it is comprised of similar constituents under a lithification process. Cladding experts confirm that precast concrete also behaves like limestone as the materials have comparable strength (tensile and compressive) properties.
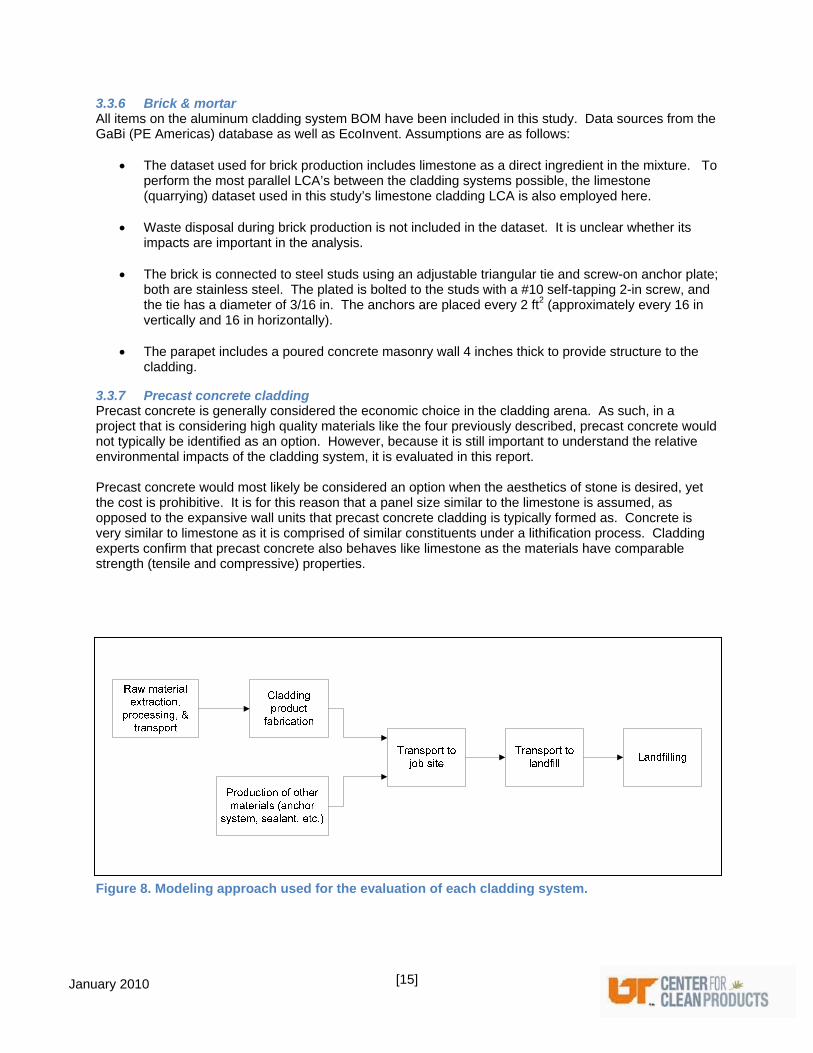
Figure 8. Modeling approach used for the evaluation of each cladding system.
[16]
January 2010
All items on the aluminum cladding system BOM have been included in this study. Data sources from the GaBi (PE Americas) database as well as EcoInvent. Assumptions are as follows:
Precast concrete is modeled with a dataset describing the production of ready-mix concrete using the ratio of materials previously described. This information was deemed appropriate as consultation with concrete experts has indicated that ready-mix concrete is indeed the precursor to precast. Impacts during the steps to cast cladding panels are assumed negligible because little to no energy, consumable materials, water, and waste is used and/or generated, particularly when curing does not include a chemical spray.
Each panel is assumed to use four anchors.
The parapet consists of a concrete panel 4 in thick.
4 Life-cycle assessment To determine the impacts and potential benefits of natural stone cladding, a cradle-to-grave LCA was conducted on aluminum, brick, granite, limestone, and precast concrete cladding systems. Results are expressed in the following key impact categories:
Resource Consumption--Energy Acidification (air) Ecotoxicity (water) Eutrophication (water) Global Warming Potential Ozone Layer Depletion Photochemical Smog Generation Respiratory Impacts
Impacts are calculated using the EPA’s TRACI9 methodology, except Energy Consumption and Respiratory Effects. Energy Consumption is simply a summation of all energy inputs required by the model, and Respiratory Effects are determined through the IMPACT2002+ methodology. Impacts are expressed in many different categories to capture and assess potential tradeoffs arising from the materials analyzed.
4.1 Life-cycle impact assessment GaBi version 4.3, a mainstream life-cycle design software program, is used to model the product life-cycles of all five cladding products. The modeling scheme is presented in Figure 8 and demonstrates how the Gabi toolkit is used to evaluate each cladding assembly. The model accounts for the production of each cladding product, anchoring system, and other items on the BOM’s, such as sealant. Transportation stages as well as end-of-life are also included. Two exceptions to this schematic exist. Due to ambiguity in the available data, brick and concrete combine extraction, processing, and transport of raw materials, plus panel production into one step. While this is not expected to have an effect on the actual results for each impact category, it can hinder the ability to identify the origin of impacts within the life-cycle system. The results are explored where necessary to better understand the source of any important impacts during these phases.
4.2 Life-cycle impact results A life-cycle assessment has been conducted on the product life-cycles of aluminum composite panels, modular brick and mortar, thin granite, limestone, and precast concrete cladding using the approach
9 Tools for the Reduction and Assessment of Chemicals and other environmental Impacts. See http://www.epa.gov/nrmrl/std/sab/traci/ for more information.
[17]
January 2010
described above. The environmental and resource impacts in key environmental impact categories for the assemblies are calculated and presented in Table 3. Tables 4 and 5 compare each cladding system’s impacts to those of granite and limestone. Results reflect impacts generated over the building’s entire lifetime (50 years). Before exploring the details of the study, it is critical to mention the inherent limitations to life-cycle assessment. Data uncertainty, data variability, and subjectivity (i.e., choices in assumptions) restrict the results of the analysis to the scope and boundaries presented in the earlier sections of this report. Further, due to constraints in funding and time, data uncertainty is represented using professional judgment, not detailed statistical analyses. An error range of 20% is assumed for the granite and limestone systems, while the other systems are assumed to have an error of 40%. The stone systems are given a smaller error range due to the fact that the investigators have intimate knowledge of the life cycle inventories used to represent stone quarry and processing. Conclusions can be made only within the context of these limitations.
4.2.1 Relationships between cladding systems Three conclusions are made clear by the results presented below.
The aluminum cladding system has the most environmentally detrimental profile. The granite and precast concrete systems are likely most preferable The brick veneer and limestone cladding system fall somewhere between aluminum and the
others, exhibiting impacts more similar to the latter than to the aluminum system.
Further data exploration has been performed to identify the causes of the results and is presented in Appendix B. These findings are presented below and are discussed in section 4.3 of this report. The relationship between aluminum composite panels and the other cladding systems is clear. However, the relationships between some of the other cladding systems vary depending on the impact category, particularly when uncertainty and variability are considered. This is depicted in Figure 7 by error bars. The absolute impacts computed for the granite and precast concrete systems indicate that granite has a better environmental profile in each category. For all categories, precast concrete is more environmentally preferable than limestone. This holds true when including the study’s limitations. At first glance, limestone may look to have a similar impact to precast concrete in Eutrophication, but magnifying the plot confirms that the error bars do not overlap. However, when accounting for uncertainty and variability, the results are somewhat less conclusive. For example, for every category, the range of impacts generated by granite falls within the range of impacts generated by precast concrete; in fact, for Energy consumption, Acidification, Ozone depletion, Photochemical smog, and Respiratory effects, granite’s impacts completely fall within the spectrum of precast concrete’s. It is therefore impossible in this study to conclude with certainty which product is most preferable given the likely trade-offs between the two systems. Likewise, while it is apparent that brick and mortar cladding is more environmentally burdensome than granite cladding, comparing brick’s profile with that of limestone cladding shows a somewhat less clear conclusion. The absolute values generated for brick and limestone indicate that limestone is preferable in every impact category. However, when uncertainty and variability are considered, limestone’s advantage in Acidification, Ozone depletion, and Respiratory effects is called into question. Selecting between brick and mortar and limestone is thus also a matter of trade-offs.
4.2.2 Drivers of environmental impacts for natural stone Transportation of quarried granite to the processing facility is the greatest contributor to environmental emissions cause by the granite cladding, except for Energy consumption which is greatest during granite extraction and Ecotoxicity which is greatest during production of other materials. The importance of the transportation step is predominantly a result of the long distance (300 mi) assumed. For instance, as reported in Appendix B (section B.3), if the stone is processed very near the quarry, the greatest impacts
[18]
January 2010
are a result of extraction (electricity and diesel consumption) and production of other materials (steel); the former dominates air emissions, while the latter generates the highest water emissions. Even with a transport distance of 300 miles, though, these phases of the life cycle are important contributors to granite’s environmental profile. Limestone cladding generates the greatest impacts during panel production. The exception to this is Eutrophication, which is mostly caused by transport of quarried limestone to the processing plant. Panel production is particularly detrimental because of the great electricity and potable water10 consumption at the fabrication facility. Additionally, transport to the processing facility is a somewhat notable source of impacts, particularly with regard to Eutrophication, as previously mentioned. When this step is reduced to a distance of zero miles, transport to the job site becomes a secondary driver in all categories.
4.3 Discussion Results of a life-cycle assessment are not always easily explicable and may in fact be due to unexpected elements of the study. It is therefore important that some exploration of the observed trends is performed to better understand not only the reasons for the results but their potential implications. This section of the report seeks to accomplish these tasks.
4.3.1 Relationships between systems Due to the complexity of the model in this study, it is difficult to predict any of this investigation’s results are predictable, yet the patterns that have emerged are indeed justifiable. This discussion focuses on the most evident and significant relationships between cladding systems in order to provide cause for the systems’ environmental advantages and shortcomings.
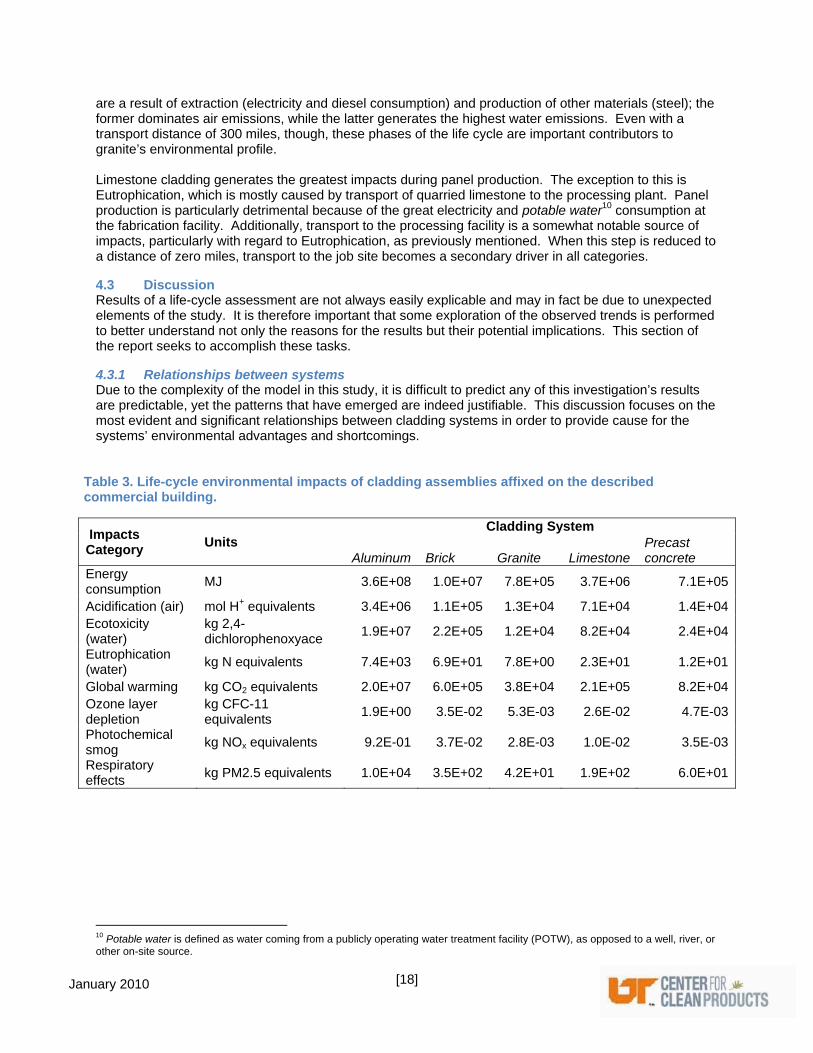
Table 3. Life-cycle environmental impacts of cladding assemblies affixed on the described commercial building.
Impacts Category
Units Cladding System
Aluminum Brick Granite Limestone Precast concrete
Energy consumption
MJ 3.6E+08 1.0E+07 7.8E+05 3.7E+06 7.1E+05
Acidification (air) mol H+ equivalents 3.4E+06 1.1E+05 1.3E+04 7.1E+04 1.4E+04Ecotoxicity (water)
kg 2,4-dichlorophenoxyace
1.9E+07 2.2E+05 1.2E+04 8.2E+04 2.4E+04
Eutrophication (water)
kg N equivalents 7.4E+03 6.9E+01 7.8E+00 2.3E+01 1.2E+01
Global warming kg CO2 equivalents 2.0E+07 6.0E+05 3.8E+04 2.1E+05 8.2E+04Ozone layer depletion
kg CFC-11 equivalents
1.9E+00 3.5E-02 5.3E-03 2.6E-02 4.7E-03
Photochemical smog
kg NOx equivalents 9.2E-01 3.7E-02 2.8E-03 1.0E-02 3.5E-03
Respiratory effects
kg PM2.5 equivalents 1.0E+04 3.5E+02 4.2E+01 1.9E+02 6.0E+01
10 Potable water is defined as water coming from a publicly operating water treatment facility (POTW), as opposed to a well, river, or other on-site source.
[19]
January 2010
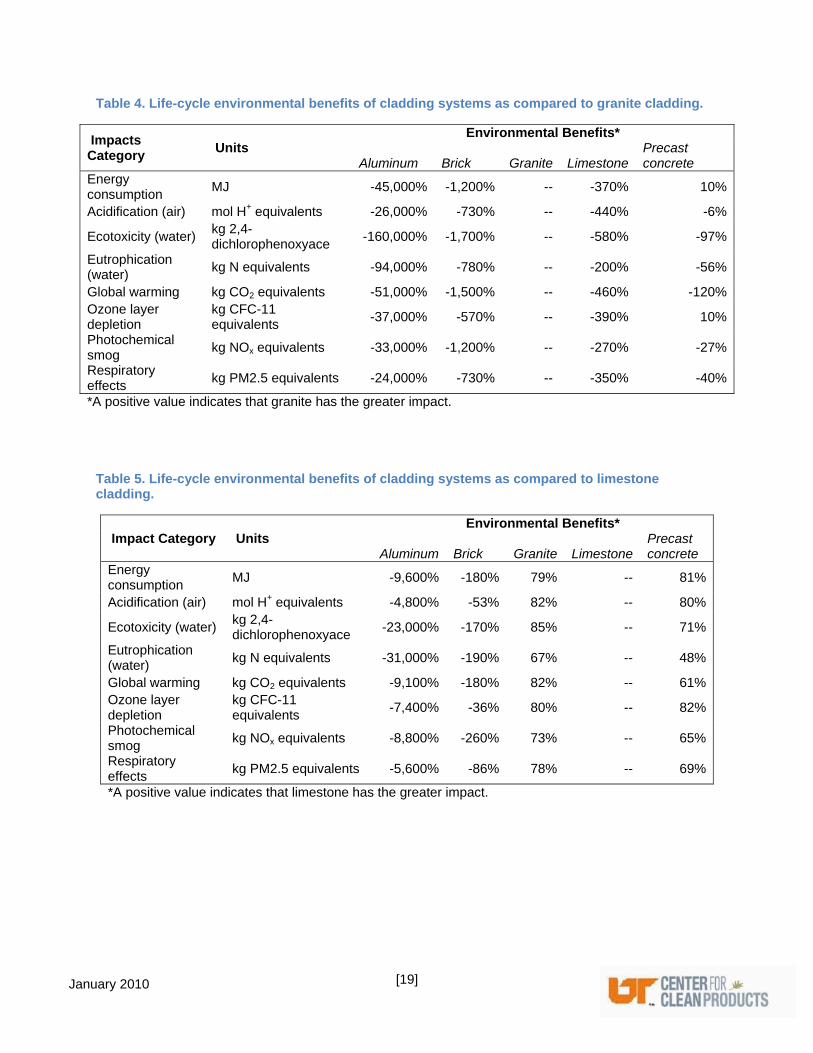
Table 4. Life-cycle environmental benefits of cladding systems as compared to granite cladding.
Impacts Category
Units Environmental Benefits*
Aluminum Brick Granite Limestone Precast concrete
Energy consumption
MJ -45,000% -1,200% -- -370% 10%
Acidification (air) mol H+ equivalents -26,000% -730% -- -440% -6%
Ecotoxicity (water) kg 2,4-dichlorophenoxyace
-160,000% -1,700% -- -580% -97%
Eutrophication (water)
kg N equivalents -94,000% -780% -- -200% -56%
Global warming kg CO2 equivalents -51,000% -1,500% -- -460% -120%Ozone layer depletion
kg CFC-11 equivalents
-37,000% -570% -- -390% 10%
Photochemical smog
kg NOx equivalents -33,000% -1,200% -- -270% -27%
Respiratory effects
kg PM2.5 equivalents -24,000% -730% -- -350% -40%
*A positive value indicates that granite has the greater impact.
Table 5. Life-cycle environmental benefits of cladding systems as compared to limestone cladding.
Impact Category Units Environmental Benefits*
Aluminum Brick Granite Limestone Precast concrete
Energy consumption
MJ -9,600% -180% 79% -- 81%
Acidification (air) mol H+ equivalents -4,800% -53% 82% -- 80%
Ecotoxicity (water) kg 2,4-dichlorophenoxyace
-23,000% -170% 85% -- 71%
Eutrophication (water)
kg N equivalents -31,000% -190% 67% -- 48%
Global warming kg CO2 equivalents -9,100% -180% 82% -- 61%Ozone layer depletion
kg CFC-11 equivalents
-7,400% -36% 80% -- 82%
Photochemical smog
kg NOx equivalents -8,800% -260% 73% -- 65%
Respiratory effects
kg PM2.5 equivalents -5,600% -86% 78% -- 69%
*A positive value indicates that limestone has the greater impact.
[20]
January 2010
Figure 9. Comparison of cladding systems for all impact categories, including 20% error bars for limestone and granite and 40% error bars for the other systems, using a log scale.
Most obvious is the relatively poor environmental profile of aluminum composite panels, which is 99% due to panel manufacturing. Specifically, the production and application of the powder coating generates nearly all of the impacts in every category for this life cycle phase. Production of the powder coating is the greatest contributor to Eutrophication, Photochemical smog, and Respiratory effects, while application of the powder coating dominates impacts in the remaining categories. The latter is due to heat curing and chromic acid anodizing11, energy-intensive processes. Additionally, the cladding system’s need for replacement after 25 years requires that the impacts produced by the aluminum system are counted twice. When comparing the impacts of precast concrete to other cladding systems in this study, it is important to note that precast concrete would not typically be considered a direct alternative to natural stone, brick, or aluminum as it is a significantly less expensive option. Nevertheless, concrete may be used as an alternative to stone in order to achieve the same aesthetic at a reduced cost. As seen in Figure 9, precast concrete is one of the most environmentally preferable options. Considering the particularly detrimental environmental footprint of cement production, this result is initially surprising. However, cement constitutes only approximately 15% by mass of the precast concrete, excluding the
11 Also referred to as chromatising, chromic anodizing is a chemical process used to strengthen aluminum sheets.
1.0E-03
1.0E-02
1.0E-01
1.0E+00
1.0E+01
1.0E+02
1.0E+03
1.0E+04
1.0E+05
1.0E+06
1.0E+07
1.0E+08
1.0E+09
Energy consumption
Acidification (air)
Ecotoxicity (water)
Eutrophication (water)
Global warming Ozone layer depletion
Photochemical smog
Respiratory effects
Mag
nit
ud
e o
f Im
pac
t (u
nit
s va
ry)
Impact Category*
*Values cannot be compared between impact categories!
Aluminum
Brick
Granite
Limestone
Precast concrete
[21]
January 2010
weight of the reinforcing steel. While cement may cause the greatest impacts during the precast concrete life-cycle, the total amount of cement is insufficient for its impacts to exceed those of other cladding systems, except granite. When compared to granite and limestone, precast concrete’s advantages are exhibited predominantly during raw material extraction, raw material transport, and panel production.12 This is likely the result of several factors. First, the dataset employed to describe aggregate, the main ingredient by weight (78%) in precast concrete, indicates that gravel requires much less energy to extract than dimension stone: 0.027 MJ/kg gravel versus 0.69MJ/kg granite and 0.26 MJ/kg limestone. (Note that the gravel dataset allocates 65% of mining operations to gravel and the remaining 35% to sand.) This appears logical as gravel can simply be dug from the ground and does not require hours of sawing, drilling, or other intensive operations. Additionally, the dataset employed for concrete production assumes a transport distance of approximately 17 mi for raw materials, much less than the 300 mi assumed for stone. Finally, casting concrete is simply less energy intensive than cutting through stone to form a panel as the former warrants essentially only a mold and cover. Coupling these items with the fact that cement is such a small portion of concrete, precast concrete cladding’s environmental advantage over other systems appears justified. However, since granite’s impacts are consistently lower than those of precast concrete during all other life cycle phases, the latter’s advantages during the early stages of its life cycle are inadequate to produce an overall definitive benefit in any impact category; instead, precast concrete can best be described as having similar impacts to granite. The environmental advantage that brick cladding has over limestone occurs only during raw material extraction, raw material transport, and panel production13 and is the case for all impact categories, except Energy consumption and Smog generation. During these phases, limestone quarrying14 is primarily responsible for environmental impacts, except for Ecotoxicity which is greatest during brick production. Since limestone quarrying is brick cladding’s primary driver of Energy consumption and Smog generation as well as the secondary driver of Acidification, Ecotoxicity, Global warming, Ozone depletion, and Respiratory effects, it is unsurprising that brick is preferable in its production stages; a much greater quantity of limestone is quarried in the production stages of the limestone cladding system. Regardless, the impacts generated during cement mortar production in addition to brick’s relatively high impacts during other life cycle phases are sufficient to surpass the impacts of limestone in nearly all environmental categories, barring Acidification, Ozone depletion, and Respiratory effects. Consequently, the choice between limestone cladding and brick cladding on the building specified in this study is a choice between impacts.
4.3.2 Implications of results In any life-cycle assessment, the results are only valid within the study’s prescribed boundaries and assumptions. It is therefore important to consider how results may differ under varying conditions and to reflect on the implications of these hypotheses. Some of this is accomplished through the sensitivity analyses detailed in Appendix B, as has been conducted here for natural stone transport and other aspects. However, because this investigation is particularly unique in that the model does not describe a product but a system, additional complexities exist to be examined. Variations in the system must be explored to better understand the implications of the results, as well as to direct future research. Numerous options exist for modifying the building that is simulated in this evaluation as many elements of the system are at least in part dictated by the structure’s specifications: geographic location, cladding aesthetics, type of superstructure, and building height. The latter may be particularly important as it can have a significant influence on the bill of materials and thus the calculated impacts.
12 The dataset employed aggregated the impacts of all three stages, and due to limitations in time and funding, this dataset was not separated into the individual steps. As a result, precast concrete’s advantage in this area may be due to one or more of the process stages. 13 The dataset employed aggregated the impacts of all three stages, and due to limitations in time and funding, this dataset was not separated into the individual steps. As a result, brick’s advantage in this area may be due to one or more of the process stages. 14 The limestone extraction dataset used here is the same limestone dataset used for the limestone cladding system.
[22]
January 2010
The significance of a building’s height is its control of loads for which the structure must be designed to withstand. More specifically, the cladding must be engineered to resist forces of gravity, wind, and earthquakes, and as buildings grow taller, these loads become greater. At a certain point, cladding must be designed in thicker panels and/or employ a stronger anchoring scheme to account for the load increase. If, due to this bulkier design scheme, the ratio of materials to surface area (i.e., square footage) of the building changes for one cladding system and not another, a point may exist where a more preferable system becomes less preferable, or vice-versa. To better illustrate this theory, an example of granite and precast concrete is provided. This example is constructed to be fundamentally simple, considering only a change in gravitational forces with height. In reality, additional wind loading must be considered, and seismic forces are important when the building is situated in geographic locations where earthquakes are probable. The precast concrete panels assumed in this study of a two-story building are 6 inches (150mm) thick, a dimension appropriate for a scenario where the panels bear relatively small gravitation loads. However, a taller building may require a panel thickness of 8 or 10 inches. This thicker precast concrete may also warrant more substantial reinforcing steel in order to achieve an appropriate tensile strength. In effect, the ratio of concrete and steel to building square footage may be different than for a shorter building. As a result, since cement production is an important driver of precast concrete’s environmental impacts, and the requisite quantity of cement increases with concrete, the environmental profile of the precast concrete system would likely become less preferable. The implications of this theory are important if this same ratio for granite does not change with height or changes at a different rate. If one of these is indeed the case, patterns may exist that will aid in determining environmentally preferable cladding systems. Theoretical plots of such trends are shown in Figure 10. Further, it may be possible to develop profiles for a spectrum of buildings and include additional variables in future research. Figure 10 is based on three assumptions. First, no part of either the precast concrete or granite cladding life-cycle has changed, except for the bill of materials. Second, the granite cladding system maintains a constant ratio of system materials to building height; additional granite, steel, sealant, and other materials are needed only because of the increased building surface to be covered. Finally, the precast concrete cladding system maintains consistent ratios of materials to building height across several categories of building height. This implies that at certain heights, gravity loads become sufficiently large to necessitate thicker panels, more reinforcing steel, and/or a greater number of anchors. Since transportation to the job site is also an important driver for precast concrete’s impacts, the greater quantity of materials will push the transportation impacts, as well. Perhaps, in reality, only one ratio jump exists for precast concrete, or perhaps many more exist. In any case, precast concrete’s environmental advantages depend on the rate that the environmental impacts of granite increase with building height. Granite could maintain a relatively low ratio, exhibiting great advantages over the precast concrete system as building height increases. Alternatively, the ratio of materials to building height for granite could be steep enough to generate much greater impacts than precast concrete with increased building height. The ratio for the granite system likely would lie somewhere between these extremities, generating particular regions where each cladding system is preferable.
4.3.3 Future research Investigation of the relationships between cladding system properties and their effects on the environmental impacts of cladding systems is warranted. It is possible that general recommendations for choosing environmentally preferable materials can be made based on a building’s profile of superstructure, height, and geographic location. Such a finding would assist in streamlining the design process for environmentally preferable structures by suggesting cladding materials likely dependent on specific key design parameters for a building.
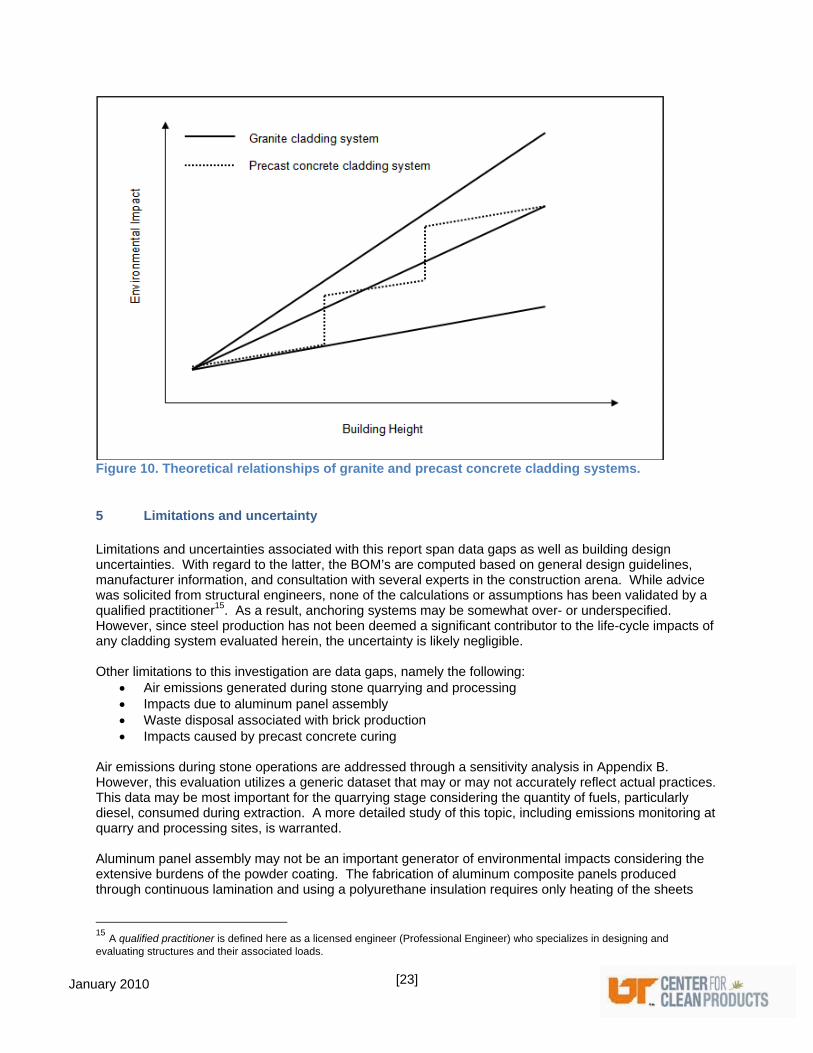
[23]
January 2010
Figure 10. Theoretical relationships of granite and precast concrete cladding systems.
5 Limitations and uncertainty Limitations and uncertainties associated with this report span data gaps as well as building design uncertainties. With regard to the latter, the BOM’s are computed based on general design guidelines, manufacturer information, and consultation with several experts in the construction arena. While advice was solicited from structural engineers, none of the calculations or assumptions has been validated by a qualified practitioner15. As a result, anchoring systems may be somewhat over- or underspecified. However, since steel production has not been deemed a significant contributor to the life-cycle impacts of any cladding system evaluated herein, the uncertainty is likely negligible. Other limitations to this investigation are data gaps, namely the following:
Air emissions generated during stone quarrying and processing Impacts due to aluminum panel assembly Waste disposal associated with brick production Impacts caused by precast concrete curing
Air emissions during stone operations are addressed through a sensitivity analysis in Appendix B. However, this evaluation utilizes a generic dataset that may or may not accurately reflect actual practices. This data may be most important for the quarrying stage considering the quantity of fuels, particularly diesel, consumed during extraction. A more detailed study of this topic, including emissions monitoring at quarry and processing sites, is warranted. Aluminum panel assembly may not be an important generator of environmental impacts considering the extensive burdens of the powder coating. The fabrication of aluminum composite panels produced through continuous lamination and using a polyurethane insulation requires only heating of the sheets
15 A qualified practitioner is defined here as a licensed engineer (Professional Engineer) who specializes in designing and evaluating structures and their associated loads.
[24]
January 2010
followed by lamination; the polyurethane expands and naturally attaches itself to the aluminum, eliminating the need for chemical adhesives. The importance of this process in the life-cycle of aluminum composite panels is therefore a function of its energy consumption. In any case, inclusion of panel assembly will only add to the already immense profile of the aluminum cladding system, enlarging the disparity between its impacts and those of the other systems. Precast concrete curing and waste disposal during brick production are likely insignificant contributors to environmental impacts. Since brick is produced in reusable molds and requires no process water (that does not become part of the final product), it is likely that very little waste is generated. Concrete curing is also an uneventful process that simply requires reusable forms, assuming no curing chemicals are employed. The lack of these datasets in this study is likely inconsequential to the results.
Other limitations involve the use of secondary data sources in lieu of data that could not be collected directly. Secondary data sources can vary significantly in quality and completeness, and it is not often easy to determine the representativeness of a data set. Every effort was made to evaluate secondary data sources for credibility. Ultimately, the accuracy of this data cannot be guaranteed. For these reasons, ranges of variability are assumed for each cladding system based upon the clarity of the available data. Aluminum, brick, and precast concrete are prescribed a range of 40%, while granite and limestone are assigned 20% uncertainty. The latter two are given a more narrow range because the investigators employed data that they collected, evaluated, and aggregated themselves. It is known that this information captures a substantial portion of the natural stone industry operations, whereas the representativeness of data describing the other cladding materials is not as clear. Professional judgment was implemented in selecting the values of 40% and 20%, and it is possible that a greater quantity of variability should be assumed. Finally, the authors do not make any claims to the accuracy of the data reported on the sources referenced for this evaluation. Where possible, multiple resources were checked and data compared for each product to verify information.
[25]
January 2010
References Alden, A. 2004. Granite. About.com: Geology. <http://geology.about.com/library/bl/images/blgranite.htm>. Allen, E. & J. Iano. 2004. Fundamentals of Building Construction: Materials and Methods. Fourth Edition. New York: John Wiley & Sons, Inc. The Aluminum Association. 2003. LEED Fact Sheet, Aluminum Sheet & Plate for the Building and Construction Market. <http://www.aluminum.org/Content/NavigationMenu/TheIndustry/SheetPlate/LEEDFactSheetForAluminuminBandC/default.htm>. The American Institute of Architects (AIA). 1996. Environmental Resource Guide. New York: John Wiley & Sons, Inc. The Brick Industry Association (BIA). 2003. Technical Notes on Brick Construction 44b: Wall Ties for Brick Masonry. Reston, VA. <http://www.gobrick.com/html/frmset_thnt.htm>. The Brick Industry Association (BIA). 2005. Technical Notes on Brick Construction 28B: Brick Veneer/Steel Stud Walls. Document no. 703-620-0010. Reston, VA. <http://www.gobrick.com/html/frmset_thnt.htm>. Center for Clean Products (CCP). 2009a. A Life-cycle inventory of granite dimension stone quarrying and processing. Version 2. The University of Tennessee. Knoxville, TN. <http://isse.utk.edu/ccp/projects/naturalstone/results_pubs.html>. Center for Clean Products (CCP). 2009b. A Life-cycle inventory of limestone dimension stone quarrying and processing. Version 2. The University of Tennessee. Knoxville, TN. <http://isse.utk.edu/ccp/projects/naturalstone/results_pubs.html>. ColoradoENERGY.org. 2008. R-Value Table, Insulation Values for Selected Materials. Professionals Corner. <http://www.coloradoenergy.org/procorner/stuff/r-values.htm>. Indiana Limestone Institute of America, Inc. (ILIA). 2007. Indiana Limestone Handbook. 22nded. Bedford, IN. International Aluminum Institute (IAI). 2009. About Aluminum. <http://www.world-aluminium.org/About+Aluminium/Applications+and+Products/Building+and+Constructions>. Marble Institute of America (MIA). 2004. R-Value for Natural Stone. Technical Bulletins. <http://www.marble-institute.com/industryresources/bulletins.cfm>. Marble Institute of America (MIA). 2007. Dimension Stone Design Manual VII. Cleveland, OH. The Metal Cladding and Roofing Manufacturers Association (MCRMA). 1995. Composite Roof and Wall Cladding Panel Design Guide. Technical Paper No. 9. Cheshire, UK. <http://www.mcrma.co.uk/pdf/mcrma_t08.pdf>. National Association of Home Builders (NAHB). 2003. Study of Life Expectancy of Home Components. <http://www.nahb.org/page.aspx/generic/sectionID=152>.
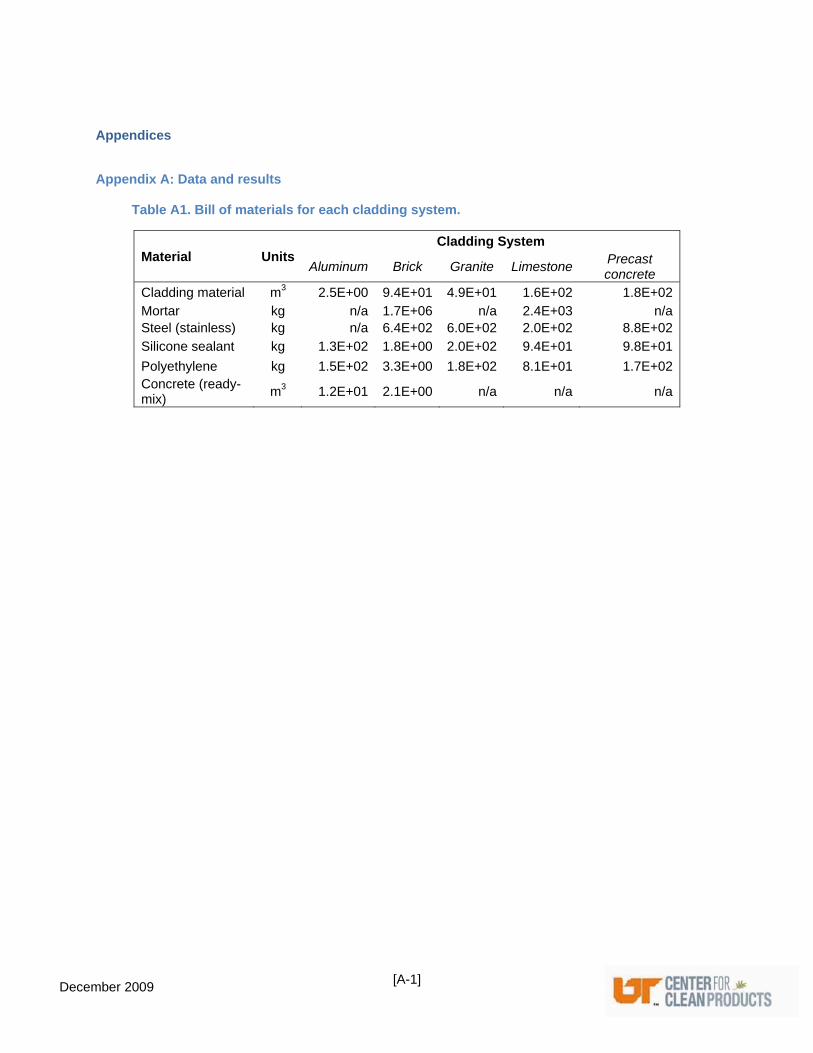
[A-1]
December 2009
Appendices
Appendix A: Data and results
Table A1. Bill of materials for each cladding system.
Material Units Cladding System
Aluminum Brick Granite Limestone Precast concrete
Cladding material m3 2.5E+00 9.4E+01 4.9E+01 1.6E+02 1.8E+02Mortar kg n/a 1.7E+06 n/a 2.4E+03 n/aSteel (stainless) kg n/a 6.4E+02 6.0E+02 2.0E+02 8.8E+02Silicone sealant kg 1.3E+02 1.8E+00 2.0E+02 9.4E+01 9.8E+01
Polyethylene kg 1.5E+02 3.3E+00 1.8E+02 8.1E+01 1.7E+02Concrete (ready-mix)
m3 1.2E+01 2.1E+00 n/a n/a n/a
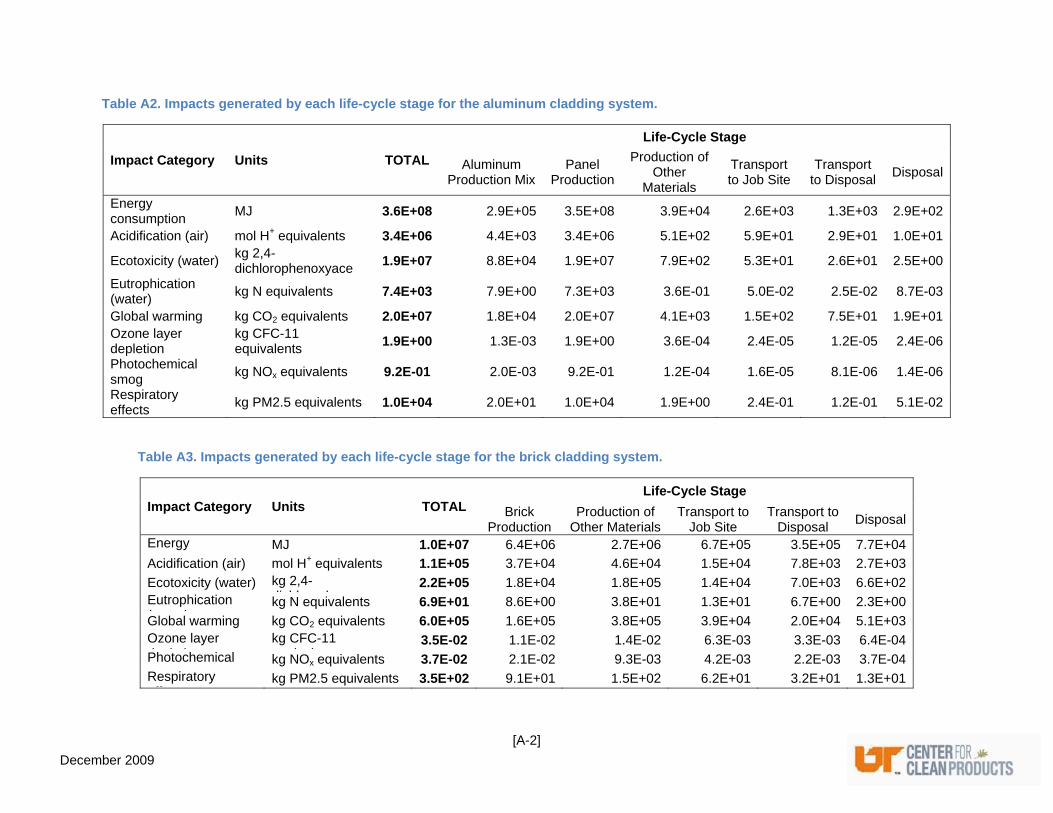
[A-2] December 2009
Table A2. Impacts generated by each life-cycle stage for the aluminum cladding system.
Impact Category Units TOTAL
Life-Cycle Stage
Aluminum Production Mix
Panel Production
Production of Other
Materials
Transport to Job Site
Transport to Disposal
Disposal
Energy consumption
MJ 3.6E+08 2.9E+05 3.5E+08 3.9E+04 2.6E+03 1.3E+03 2.9E+02
Acidification (air) mol H+ equivalents 3.4E+06 4.4E+03 3.4E+06 5.1E+02 5.9E+01 2.9E+01 1.0E+01
Ecotoxicity (water) kg 2,4-dichlorophenoxyace
1.9E+07 8.8E+04 1.9E+07 7.9E+02 5.3E+01 2.6E+01 2.5E+00
Eutrophication (water)
kg N equivalents 7.4E+03 7.9E+00 7.3E+03 3.6E-01 5.0E-02 2.5E-02 8.7E-03
Global warming kg CO2 equivalents 2.0E+07 1.8E+04 2.0E+07 4.1E+03 1.5E+02 7.5E+01 1.9E+01Ozone layer depletion
kg CFC-11 equivalents
1.9E+00 1.3E-03 1.9E+00 3.6E-04 2.4E-05 1.2E-05 2.4E-06
Photochemical smog
kg NOx equivalents 9.2E-01 2.0E-03 9.2E-01 1.2E-04 1.6E-05 8.1E-06 1.4E-06
Respiratory effects
kg PM2.5 equivalents 1.0E+04 2.0E+01 1.0E+04 1.9E+00 2.4E-01 1.2E-01 5.1E-02
Table A3. Impacts generated by each life-cycle stage for the brick cladding system.
Impact Category Units TOTAL Life-Cycle Stage
Brick Production
Production of Other Materials
Transport to Job Site
Transport to Disposal
Disposal
Energy ti
MJ 1.0E+07 6.4E+06 2.7E+06 6.7E+05 3.5E+05 7.7E+04
Acidification (air) mol H+ equivalents 1.1E+05 3.7E+04 4.6E+04 1.5E+04 7.8E+03 2.7E+03
Ecotoxicity (water) kg 2,4-di hl h
2.2E+05 1.8E+04 1.8E+05 1.4E+04 7.0E+03 6.6E+02Eutrophication ( t )
kg N equivalents 6.9E+01 8.6E+00 3.8E+01 1.3E+01 6.7E+00 2.3E+00
Global warming kg CO2 equivalents 6.0E+05 1.6E+05 3.8E+05 3.9E+04 2.0E+04 5.1E+03Ozone layer d l ti
kg CFC-11 i l t
3.5E-02 1.1E-02 1.4E-02 6.3E-03 3.3E-03 6.4E-04Photochemical kg NOx equivalents 3.7E-02 2.1E-02 9.3E-03 4.2E-03 2.2E-03 3.7E-04Respiratory
ff tkg PM2.5 equivalents 3.5E+02 9.1E+01 1.5E+02 6.2E+01 3.2E+01 1.3E+01
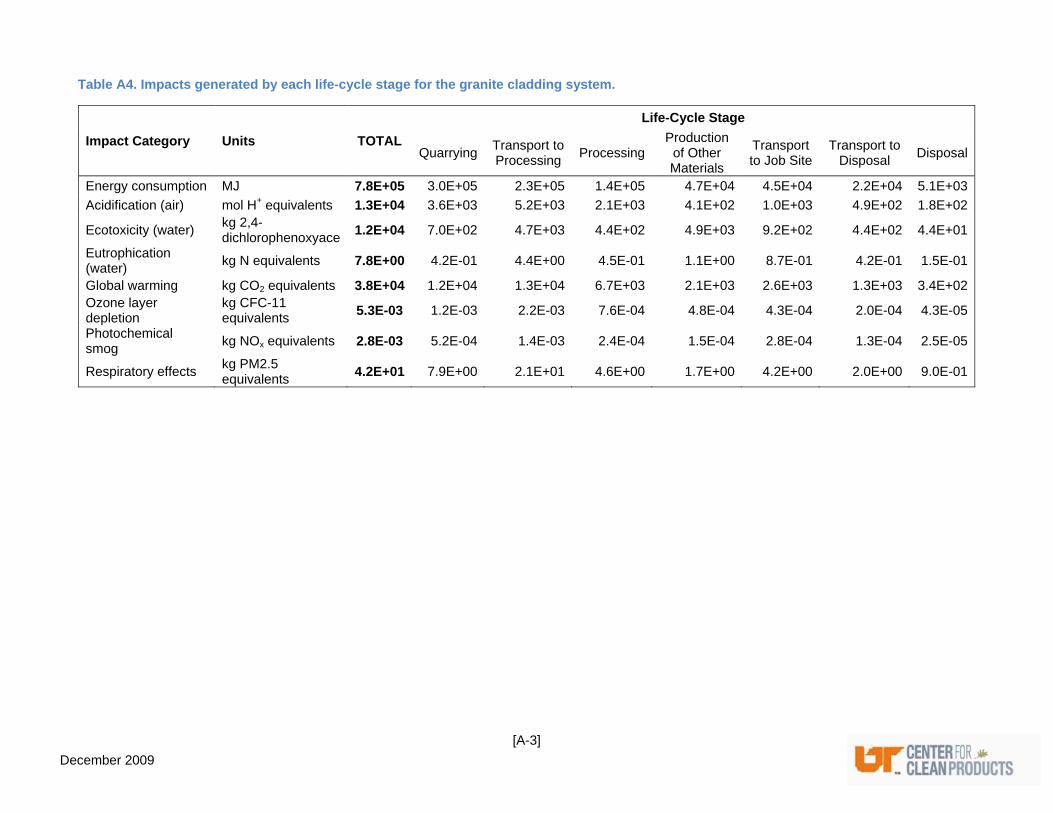
[A-3] December 2009
Table A4. Impacts generated by each life-cycle stage for the granite cladding system.
Impact Category Units TOTAL
Life-Cycle Stage
QuarryingTransport to Processing
Processing Production
of Other Materials
Transport to Job Site
Transport to Disposal
Disposal
Energy consumption MJ 7.8E+05 3.0E+05 2.3E+05 1.4E+05 4.7E+04 4.5E+04 2.2E+04 5.1E+03
Acidification (air) mol H+ equivalents 1.3E+04 3.6E+03 5.2E+03 2.1E+03 4.1E+02 1.0E+03 4.9E+02 1.8E+02
Ecotoxicity (water) kg 2,4-dichlorophenoxyace
1.2E+04 7.0E+02 4.7E+03 4.4E+02 4.9E+03 9.2E+02 4.4E+02 4.4E+01
Eutrophication (water)
kg N equivalents 7.8E+00 4.2E-01 4.4E+00 4.5E-01 1.1E+00 8.7E-01 4.2E-01 1.5E-01
Global warming kg CO2 equivalents 3.8E+04 1.2E+04 1.3E+04 6.7E+03 2.1E+03 2.6E+03 1.3E+03 3.4E+02Ozone layer depletion
kg CFC-11 equivalents
5.3E-03 1.2E-03 2.2E-03 7.6E-04 4.8E-04 4.3E-04 2.0E-04 4.3E-05
Photochemical smog
kg NOx equivalents 2.8E-03 5.2E-04 1.4E-03 2.4E-04 1.5E-04 2.8E-04 1.3E-04 2.5E-05
Respiratory effects kg PM2.5 equivalents
4.2E+01 7.9E+00 2.1E+01 4.6E+00 1.7E+00 4.2E+00 2.0E+00 9.0E-01
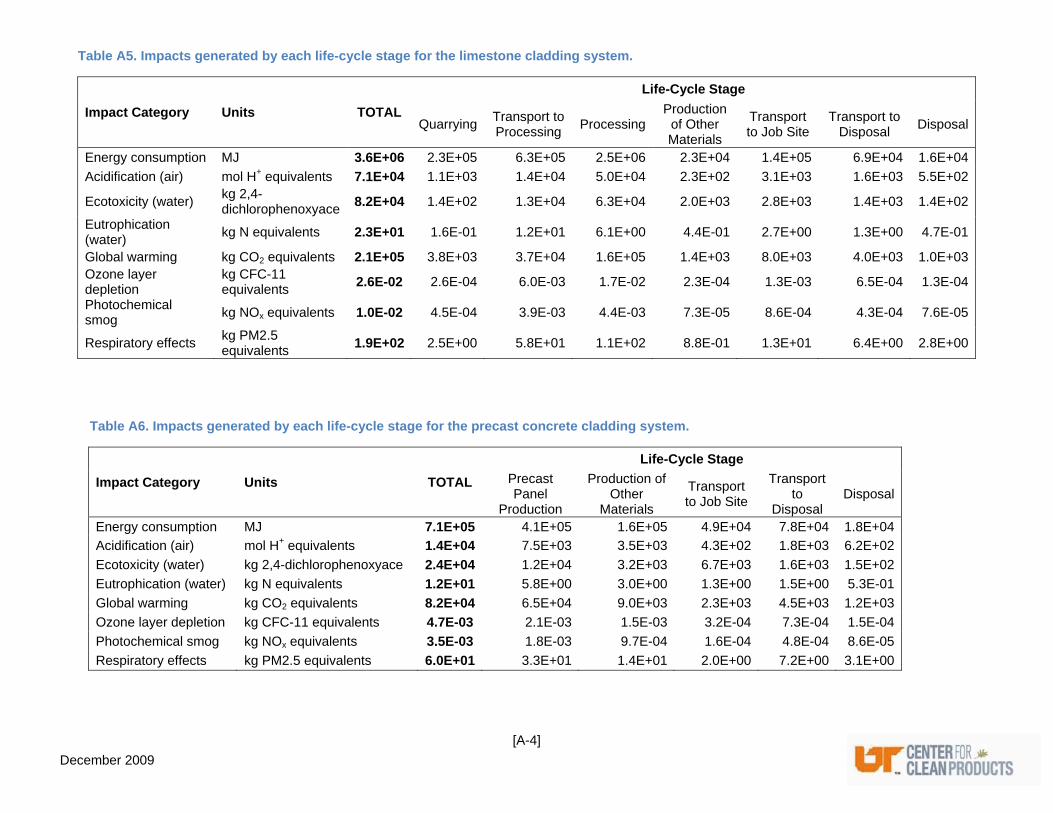
[A-4] December 2009
Table A5. Impacts generated by each life-cycle stage for the limestone cladding system.
Impact Category Units TOTAL
Life-Cycle Stage
QuarryingTransport to Processing
Processing Production
of Other Materials
Transport to Job Site
Transport to Disposal
Disposal
Energy consumption MJ 3.6E+06 2.3E+05 6.3E+05 2.5E+06 2.3E+04 1.4E+05 6.9E+04 1.6E+04
Acidification (air) mol H+ equivalents 7.1E+04 1.1E+03 1.4E+04 5.0E+04 2.3E+02 3.1E+03 1.6E+03 5.5E+02
Ecotoxicity (water) kg 2,4-dichlorophenoxyace
8.2E+04 1.4E+02 1.3E+04 6.3E+04 2.0E+03 2.8E+03 1.4E+03 1.4E+02
Eutrophication (water)
kg N equivalents 2.3E+01 1.6E-01 1.2E+01 6.1E+00 4.4E-01 2.7E+00 1.3E+00 4.7E-01
Global warming kg CO2 equivalents 2.1E+05 3.8E+03 3.7E+04 1.6E+05 1.4E+03 8.0E+03 4.0E+03 1.0E+03Ozone layer depletion
kg CFC-11 equivalents
2.6E-02 2.6E-04 6.0E-03 1.7E-02 2.3E-04 1.3E-03 6.5E-04 1.3E-04
Photochemical smog
kg NOx equivalents 1.0E-02 4.5E-04 3.9E-03 4.4E-03 7.3E-05 8.6E-04 4.3E-04 7.6E-05
Respiratory effects kg PM2.5 equivalents
1.9E+02 2.5E+00 5.8E+01 1.1E+02 8.8E-01 1.3E+01 6.4E+00 2.8E+00
Table A6. Impacts generated by each life-cycle stage for the precast concrete cladding system.
Impact Category Units TOTAL
Life-Cycle Stage
Precast Panel
Production
Production of Other
Materials
Transport to Job Site
Transport to
Disposal Disposal
Energy consumption MJ 7.1E+05 4.1E+05 1.6E+05 4.9E+04 7.8E+04 1.8E+04
Acidification (air) mol H+ equivalents 1.4E+04 7.5E+03 3.5E+03 4.3E+02 1.8E+03 6.2E+02
Ecotoxicity (water) kg 2,4-dichlorophenoxyace 2.4E+04 1.2E+04 3.2E+03 6.7E+03 1.6E+03 1.5E+02
Eutrophication (water) kg N equivalents 1.2E+01 5.8E+00 3.0E+00 1.3E+00 1.5E+00 5.3E-01
Global warming kg CO2 equivalents 8.2E+04 6.5E+04 9.0E+03 2.3E+03 4.5E+03 1.2E+03
Ozone layer depletion kg CFC-11 equivalents 4.7E-03 2.1E-03 1.5E-03 3.2E-04 7.3E-04 1.5E-04
Photochemical smog kg NOx equivalents 3.5E-03 1.8E-03 9.7E-04 1.6E-04 4.8E-04 8.6E-05
Respiratory effects kg PM2.5 equivalents 6.0E+01 3.3E+01 1.4E+01 2.0E+00 7.2E+00 3.1E+00
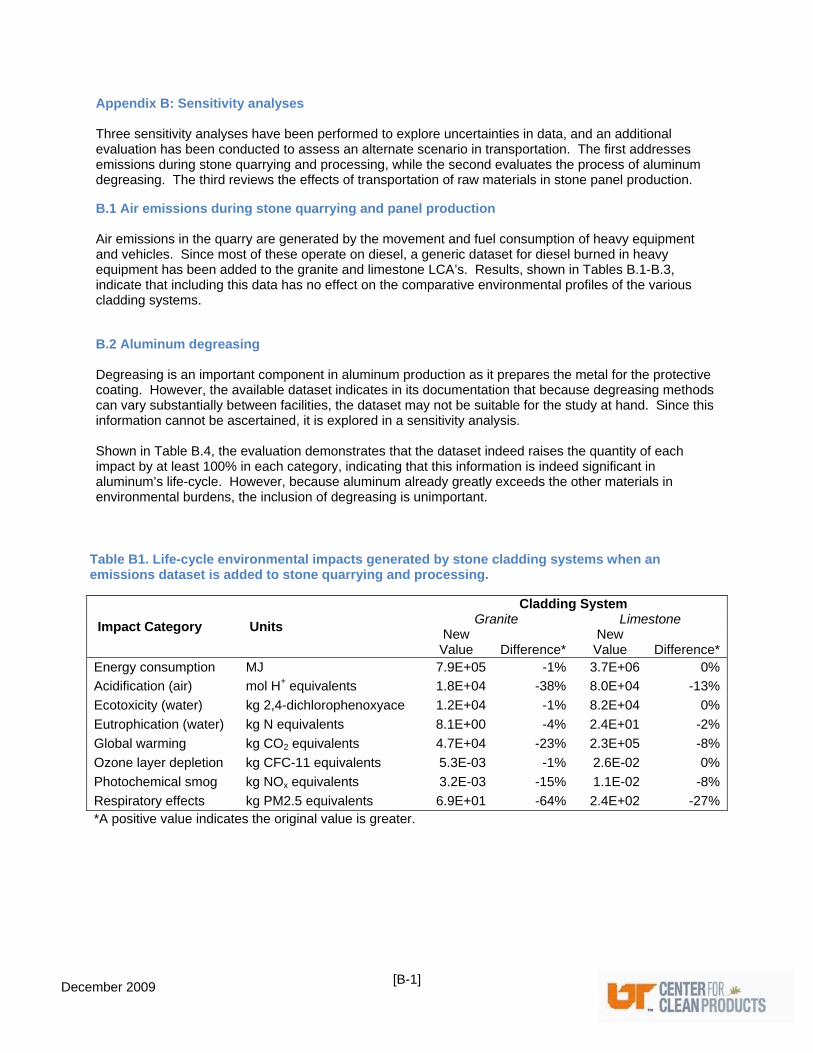
[B-1]
December 2009
Appendix B: Sensitivity analyses
Three sensitivity analyses have been performed to explore uncertainties in data, and an additional evaluation has been conducted to assess an alternate scenario in transportation. The first addresses emissions during stone quarrying and processing, while the second evaluates the process of aluminum degreasing. The third reviews the effects of transportation of raw materials in stone panel production.
B.1 Air emissions during stone quarrying and panel production Air emissions in the quarry are generated by the movement and fuel consumption of heavy equipment and vehicles. Since most of these operate on diesel, a generic dataset for diesel burned in heavy equipment has been added to the granite and limestone LCA’s. Results, shown in Tables B.1-B.3, indicate that including this data has no effect on the comparative environmental profiles of the various cladding systems.
B.2 Aluminum degreasing Degreasing is an important component in aluminum production as it prepares the metal for the protective coating. However, the available dataset indicates in its documentation that because degreasing methods can vary substantially between facilities, the dataset may not be suitable for the study at hand. Since this information cannot be ascertained, it is explored in a sensitivity analysis. Shown in Table B.4, the evaluation demonstrates that the dataset indeed raises the quantity of each impact by at least 100% in each category, indicating that this information is indeed significant in aluminum’s life-cycle. However, because aluminum already greatly exceeds the other materials in environmental burdens, the inclusion of degreasing is unimportant.
Table B1. Life-cycle environmental impacts generated by stone cladding systems when an emissions dataset is added to stone quarrying and processing.
Impact Category Units
Cladding System Granite Limestone
New Value Difference*
New Value Difference*
Energy consumption MJ 7.9E+05 -1% 3.7E+06 0%
Acidification (air) mol H+ equivalents 1.8E+04 -38% 8.0E+04 -13%
Ecotoxicity (water) kg 2,4-dichlorophenoxyace 1.2E+04 -1% 8.2E+04 0%
Eutrophication (water) kg N equivalents 8.1E+00 -4% 2.4E+01 -2%
Global warming kg CO2 equivalents 4.7E+04 -23% 2.3E+05 -8%
Ozone layer depletion kg CFC-11 equivalents 5.3E-03 -1% 2.6E-02 0%
Photochemical smog kg NOx equivalents 3.2E-03 -15% 1.1E-02 -8%
Respiratory effects kg PM2.5 equivalents 6.9E+01 -64% 2.4E+02 -27%*A positive value indicates the original value is greater.
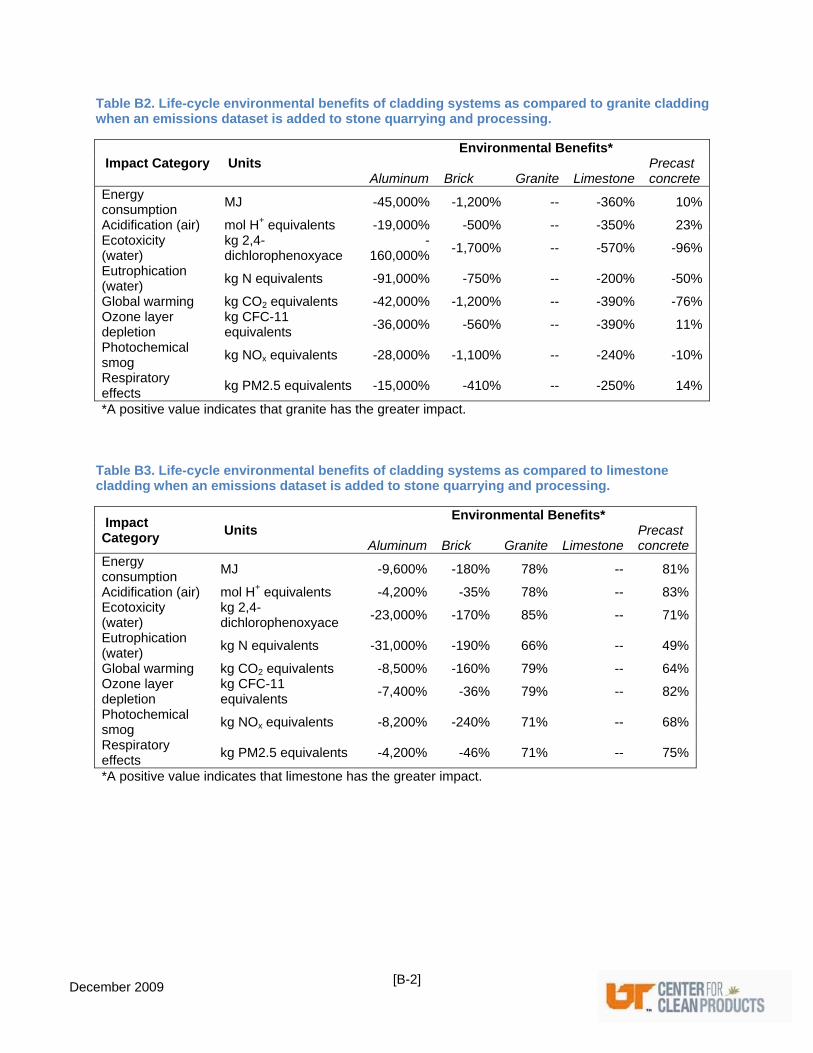
[B-2]
December 2009
Table B2. Life-cycle environmental benefits of cladding systems as compared to granite cladding when an emissions dataset is added to stone quarrying and processing.
Impact Category Units Environmental Benefits*
Aluminum Brick Granite Limestone Precast concrete
Energy consumption
MJ -45,000% -1,200% -- -360% 10%
Acidification (air) mol H+ equivalents -19,000% -500% -- -350% 23%Ecotoxicity (water)
kg 2,4-dichlorophenoxyace
-160,000%
-1,700% -- -570% -96%
Eutrophication (water)
kg N equivalents -91,000% -750% -- -200% -50%
Global warming kg CO2 equivalents -42,000% -1,200% -- -390% -76%Ozone layer depletion
kg CFC-11 equivalents
-36,000% -560% -- -390% 11%
Photochemical smog
kg NOx equivalents -28,000% -1,100% -- -240% -10%
Respiratory effects
kg PM2.5 equivalents -15,000% -410% -- -250% 14%
*A positive value indicates that granite has the greater impact. Table B3. Life-cycle environmental benefits of cladding systems as compared to limestone cladding when an emissions dataset is added to stone quarrying and processing.
Impact Category
Units Environmental Benefits*
Aluminum Brick Granite Limestone Precast concrete
Energy consumption
MJ -9,600% -180% 78% -- 81%
Acidification (air) mol H+ equivalents -4,200% -35% 78% -- 83%Ecotoxicity (water)
kg 2,4-dichlorophenoxyace
-23,000% -170% 85% -- 71%
Eutrophication (water)
kg N equivalents -31,000% -190% 66% -- 49%
Global warming kg CO2 equivalents -8,500% -160% 79% -- 64%Ozone layer depletion
kg CFC-11 equivalents
-7,400% -36% 79% -- 82%
Photochemical smog
kg NOx equivalents -8,200% -240% 71% -- 68%
Respiratory effects
kg PM2.5 equivalents -4,200% -46% 71% -- 75%
*A positive value indicates that limestone has the greater impact.
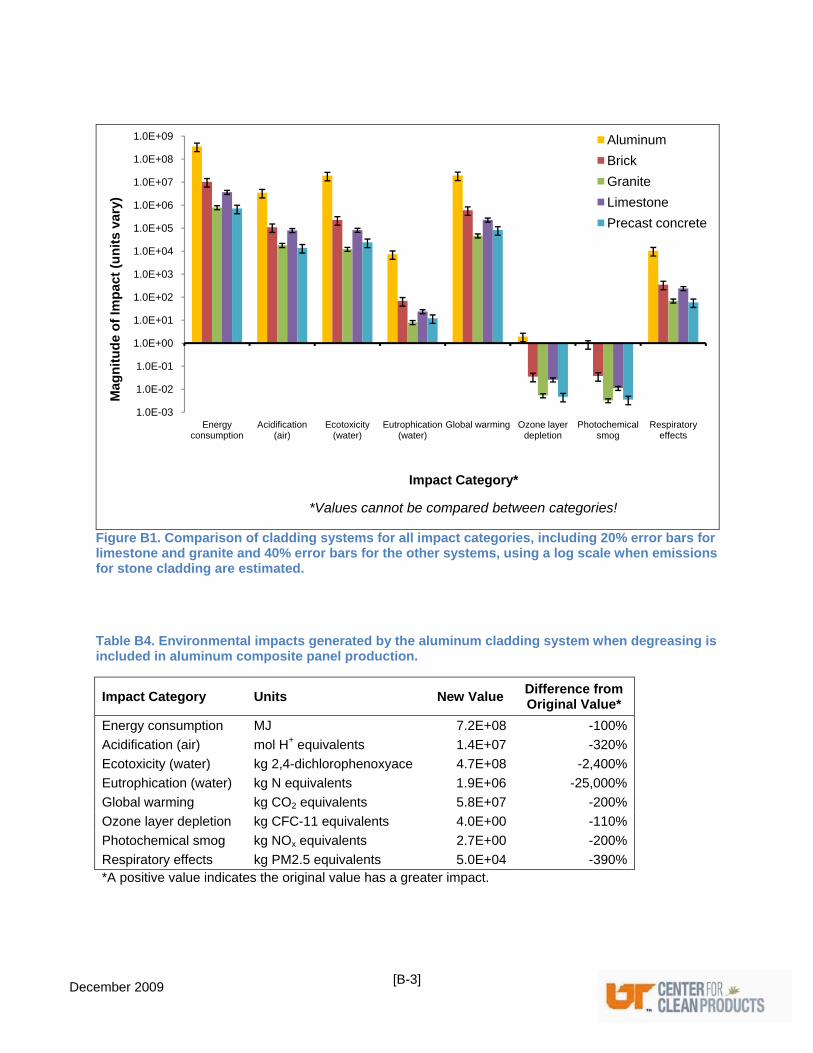
[B-3]
December 2009
Figure B1. Comparison of cladding systems for all impact categories, including 20% error bars for limestone and granite and 40% error bars for the other systems, using a log scale when emissions for stone cladding are estimated.
Table B4. Environmental impacts generated by the aluminum cladding system when degreasing is included in aluminum composite panel production.
Impact Category Units New Value Difference from Original Value*
Energy consumption MJ 7.2E+08 -100%
Acidification (air) mol H+ equivalents 1.4E+07 -320%
Ecotoxicity (water) kg 2,4-dichlorophenoxyace 4.7E+08 -2,400%
Eutrophication (water) kg N equivalents 1.9E+06 -25,000%
Global warming kg CO2 equivalents 5.8E+07 -200%
Ozone layer depletion kg CFC-11 equivalents 4.0E+00 -110%
Photochemical smog kg NOx equivalents 2.7E+00 -200%
Respiratory effects kg PM2.5 equivalents 5.0E+04 -390% *A positive value indicates the original value has a greater impact.
1.0E-03
1.0E-02
1.0E-01
1.0E+00
1.0E+01
1.0E+02
1.0E+03
1.0E+04
1.0E+05
1.0E+06
1.0E+07
1.0E+08
1.0E+09
Energy consumption
Acidification (air)
Ecotoxicity (water)
Eutrophication (water)
Global warming Ozone layer depletion
Photochemical smog
Respiratory effects
Mag
nit
ud
e o
f Im
pac
t (u
nit
s va
ry)
Impact Category*
*Values cannot be compared between categories!
Aluminum
Brick
Granite
Limestone
Precast concrete
[B-4]
December 2009
B.3 Transportation of quarried stone to processing The transportation of raw stone from the quarry to processing facility can vary by distance as well as mode, although truck transport is the most common in the U.S. To evaluate the significance of this life-cycle phase on the overall results of this study, a sensitivity analysis has been performed. The scenario assumes a transport distance of 0 miles, essentially simulating the situation where the quarry and processing facilities are in very close proximity or co-located. Reducing the raw material transport distance for stone indeed improves the environmental profiles of granite and limestone in all impact categories. With respect to limestone, precast concrete may no longer be advantageous in Eutrophication or Smog generation. Additionally, limestone is now most likely more preferable than brick in Respiratory effects. These are unsurprising phenomena considering the fact that trucking generates large quantities of particulate emissions due to diesel combustion and causes contaminated roadway runoff. Nevertheless, because transport to processing is not a particularly significant contributor to the impacts generated by limestone cladding, the reduction in transport distance does not earn limestone a radically improved environmental profile. The choice between it and brick is still a matter of trade-offs, and limestone’s impacts not fall below those of granite. Granite sees substantial increases in its benefits over other cladding materials when transport is minimal. Since its greatest driver is transportation to the processing facility, this trend is expected. In fact, the precast concrete system now most likely generates greater burdens in Ecotoxicity, Eutrophication, Global Warming, Photochemical Smog, and Respiratory Effects. These results indicate that transportation of the quarried stone is indeed an important aspect of the granite and limestone cladding life-cycles, and minimizing the transport distance significantly improves stone’s—especially granite’s—environmental footprint in some impact categories. However, granite quarrying and limestone panel processing are still chief contributors to these systems’ environmental profiles.
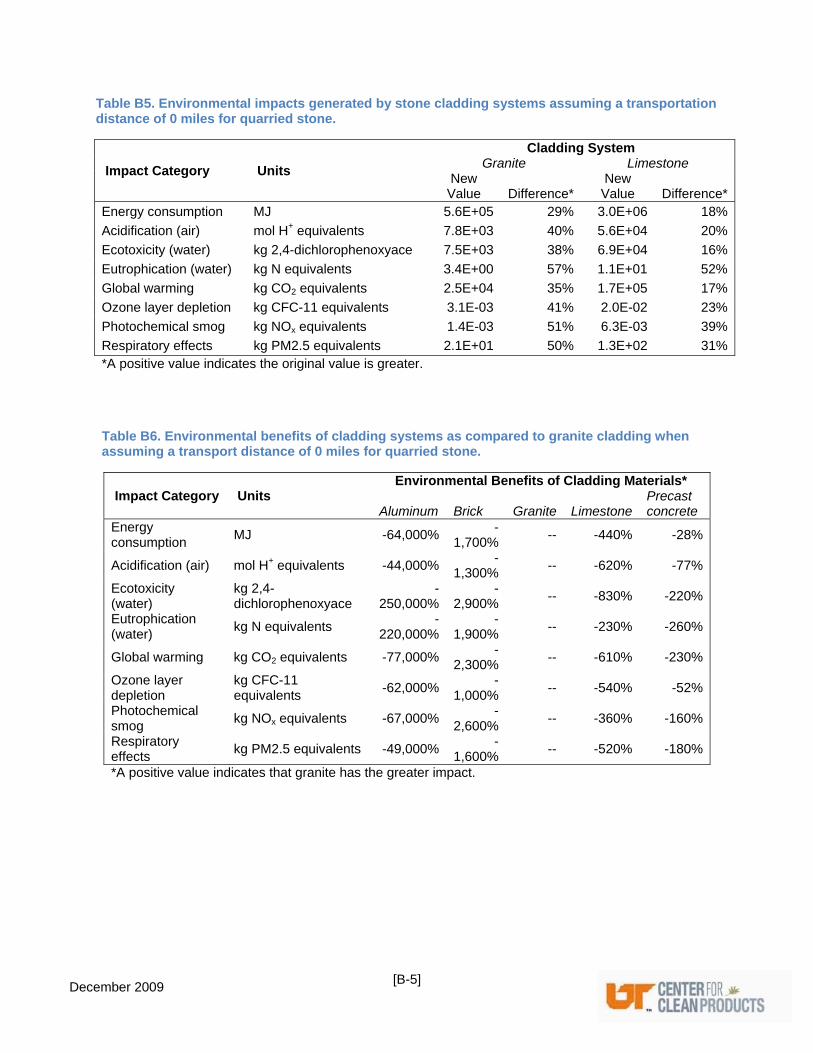
[B-5]
December 2009
Table B5. Environmental impacts generated by stone cladding systems assuming a transportation distance of 0 miles for quarried stone.
Impact Category Units
Cladding System Granite Limestone
New Value Difference*
New Value Difference*
Energy consumption MJ 5.6E+05 29% 3.0E+06 18%
Acidification (air) mol H+ equivalents 7.8E+03 40% 5.6E+04 20%
Ecotoxicity (water) kg 2,4-dichlorophenoxyace 7.5E+03 38% 6.9E+04 16%
Eutrophication (water) kg N equivalents 3.4E+00 57% 1.1E+01 52%
Global warming kg CO2 equivalents 2.5E+04 35% 1.7E+05 17%
Ozone layer depletion kg CFC-11 equivalents 3.1E-03 41% 2.0E-02 23%
Photochemical smog kg NOx equivalents 1.4E-03 51% 6.3E-03 39%
Respiratory effects kg PM2.5 equivalents 2.1E+01 50% 1.3E+02 31%*A positive value indicates the original value is greater.
Table B6. Environmental benefits of cladding systems as compared to granite cladding when assuming a transport distance of 0 miles for quarried stone.
Impact Category Units Environmental Benefits of Cladding Materials*
Aluminum Brick Granite Limestone Precast concrete
Energy consumption
MJ -64,000%-
1,700%-- -440% -28%
Acidification (air) mol H+ equivalents -44,000%-
1,300%-- -620% -77%
Ecotoxicity (water)
kg 2,4-dichlorophenoxyace
-250,000%
-2,900%
-- -830% -220%
Eutrophication (water)
kg N equivalents -
220,000%-
1,900%-- -230% -260%
Global warming kg CO2 equivalents -77,000%-
2,300%-- -610% -230%
Ozone layer depletion
kg CFC-11 equivalents
-62,000%-
1,000%-- -540% -52%
Photochemical smog
kg NOx equivalents -67,000%-
2,600%-- -360% -160%
Respiratory effects
kg PM2.5 equivalents -49,000%-
1,600%-- -520% -180%
*A positive value indicates that granite has the greater impact.
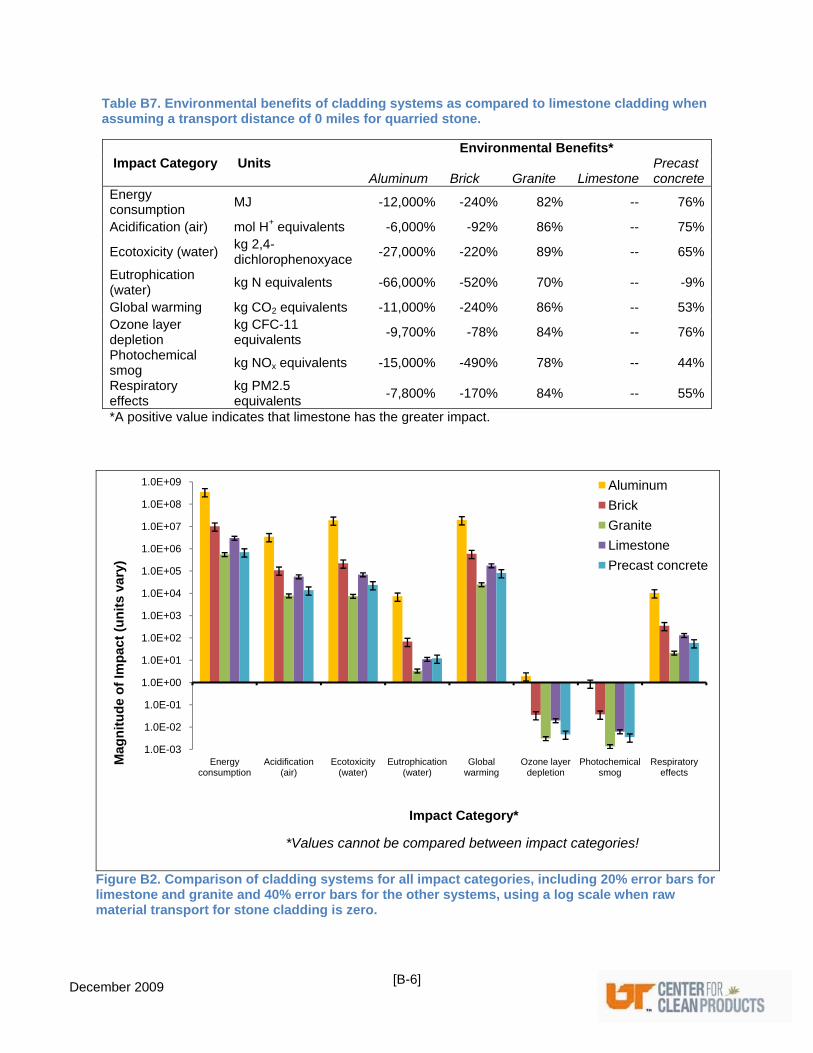
[B-6]
December 2009
Table B7. Environmental benefits of cladding systems as compared to limestone cladding when assuming a transport distance of 0 miles for quarried stone.
Impact Category Units Environmental Benefits*
Aluminum Brick Granite Limestone Precast concrete
Energy consumption
MJ -12,000% -240% 82% -- 76%
Acidification (air) mol H+ equivalents -6,000% -92% 86% -- 75%
Ecotoxicity (water) kg 2,4-dichlorophenoxyace
-27,000% -220% 89% -- 65%
Eutrophication (water)
kg N equivalents -66,000% -520% 70% -- -9%
Global warming kg CO2 equivalents -11,000% -240% 86% -- 53%Ozone layer depletion
kg CFC-11 equivalents
-9,700% -78% 84% -- 76%
Photochemical smog
kg NOx equivalents -15,000% -490% 78% -- 44%
Respiratory effects
kg PM2.5 equivalents
-7,800% -170% 84% -- 55%
*A positive value indicates that limestone has the greater impact.
Figure B2. Comparison of cladding systems for all impact categories, including 20% error bars for limestone and granite and 40% error bars for the other systems, using a log scale when raw material transport for stone cladding is zero.
1.0E-03
1.0E-02
1.0E-01
1.0E+00
1.0E+01
1.0E+02
1.0E+03
1.0E+04
1.0E+05
1.0E+06
1.0E+07
1.0E+08
1.0E+09
Energy consumption
Acidification (air)
Ecotoxicity (water)
Eutrophication (water)
Global warming
Ozone layer depletion
Photochemical smog
Respiratory effects
Mag
nit
ud
e o
f Im
pac
t (u
nit
s va
ry)
Impact Category*
*Values cannot be compared between impact categories!
Aluminum
Brick
Granite
Limestone
Precast concrete
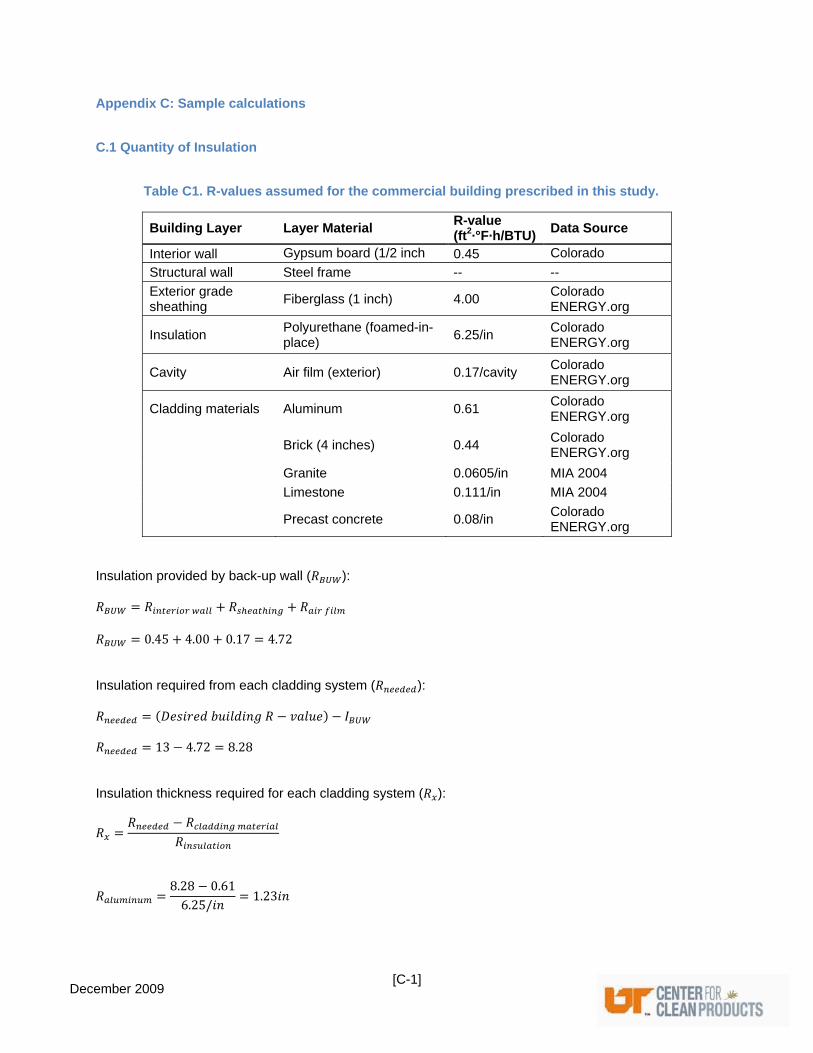
[C-1] December 2009
Appendix C: Sample calculations
C.1 Quantity of Insulation
Table C1. R-values assumed for the commercial building prescribed in this study.
Building Layer Layer Material R-value (ft2·°F·h/BTU)
Data Source
Interior wall Gypsum board (1/2 inch 0.45 Colorado
Structural wall Steel frame -- --
Exterior grade sheathing
Fiberglass (1 inch) 4.00 Colorado ENERGY.org
Insulation Polyurethane (foamed-in-place)
6.25/in Colorado ENERGY.org
Cavity Air film (exterior) 0.17/cavity Colorado ENERGY.org
Cladding materials Aluminum 0.61 Colorado ENERGY.org
Brick (4 inches) 0.44 Colorado ENERGY.org
Granite 0.0605/in MIA 2004
Limestone 0.111/in MIA 2004
Precast concrete 0.08/in Colorado ENERGY.org
Insulation provided by back-up wall ( ):
0.45 4.00 0.17 4.72 Insulation required from each cladding system ( ):
13 4.72 8.28 Insulation thickness required for each cladding system ( ):
8.28 0.616.25/
1.23
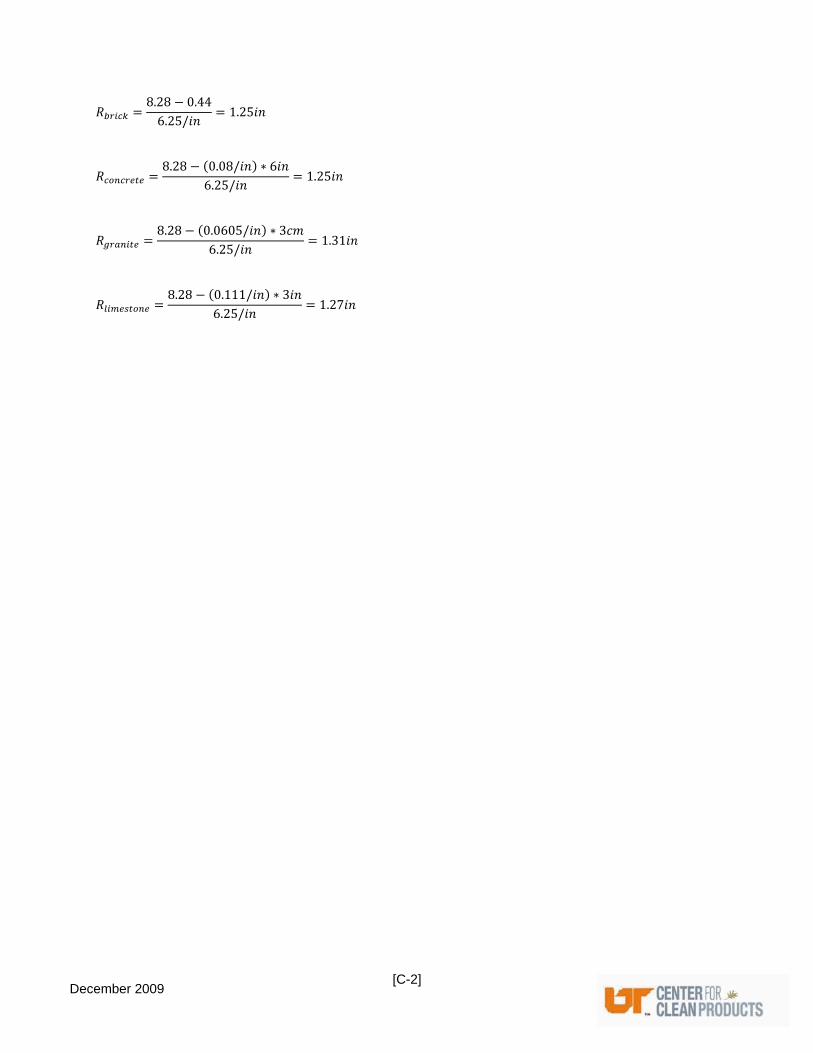
[C-2] December 2009
8.28 0.446.25/
1.25
8.28 0.08/ 66.25/
1.25
8.28 0.0605/ 36.25/
1.31
8.28 0.111/ 36.25/
1.27


![Policy B5: Medical - Queen Margaretsqueenmargarets.com/wp-content/uploads/2015/04/Policy-B5-Medical... · [QUEEN MARGARETS, YORK] Policy B5 Policy B5: Medical 1 Policy B5: Medical](https://img.pdfslide.us/doc/110x75/5b8a500b7f8b9a655f8e0e3f/policy-b5-medical-queen-mar-queen-margarets-york-policy-b5-policy-b5.jpg)