Embed Size (px)
Citation preview
Life Cycle Assessment & GHG Abatement by Chemical Products
Abdelhadi Sahnoune ExxonMobil Chemical Company
Texas Industrial Energy Management Forum Houston, May 1, 2014
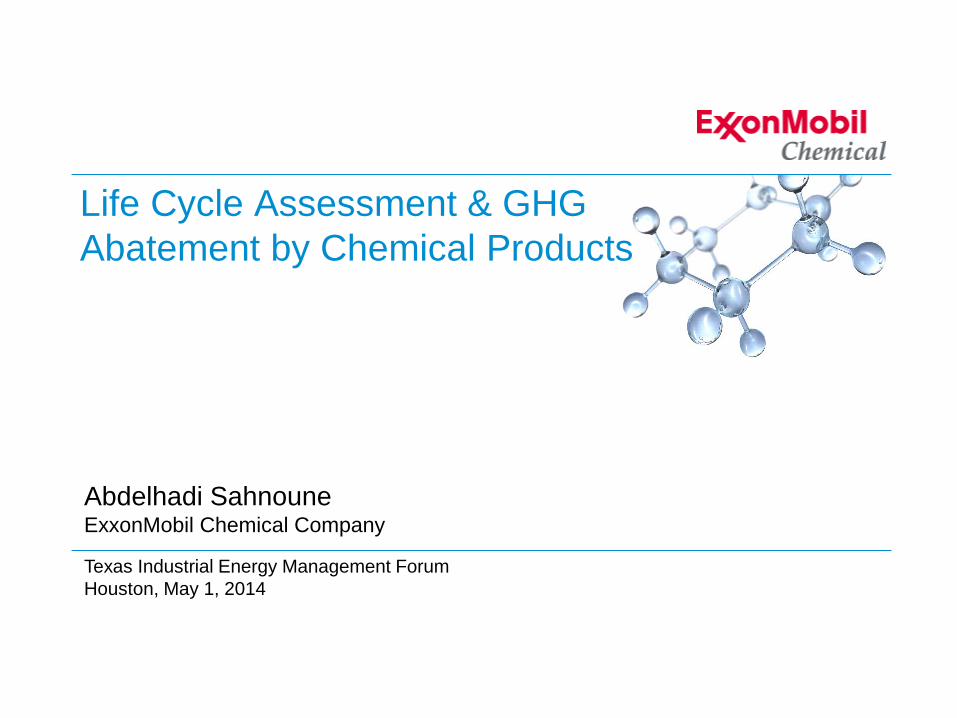
Products in our daily lives
Plastics Packaging - Protects and extends shelf life Building & Construction –
Insulation, design, flooring
Plastics in Automotive Applications - Light weighting of cars
Personal Care and Medical Applications
Photos used are representative of potential product applications only
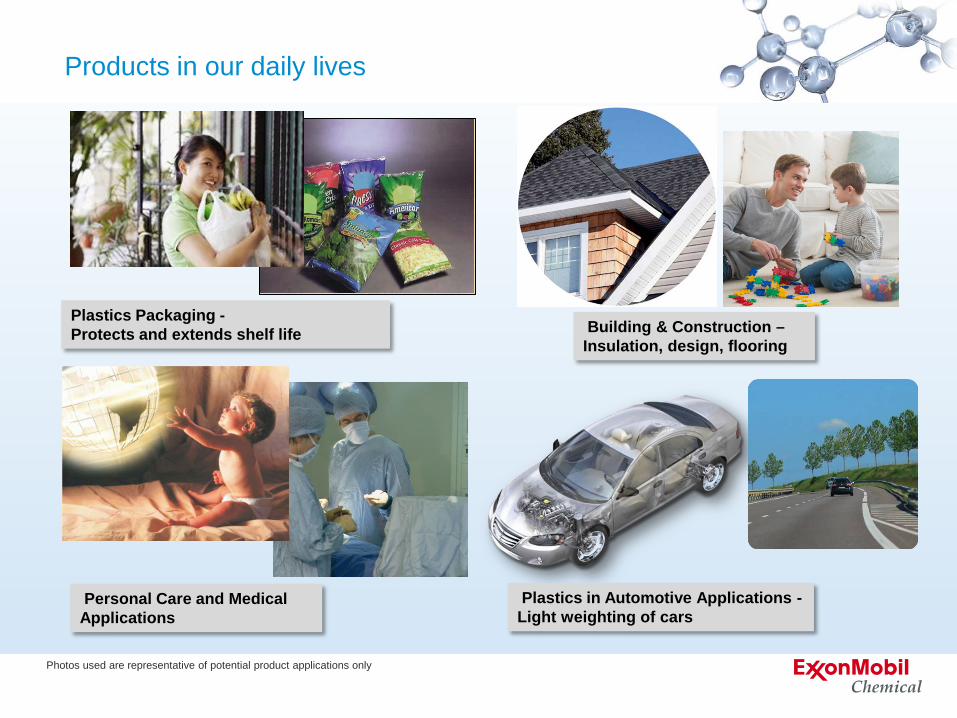
• In 2008, global sales exceeded $3 trillion1
• Four main categories
• Chemical products use approximately 6% of hydrocarbon resources (product content and manufacturing)2
• Demand for chemical products continues to grow, as does energy demand to produce them
1 “The Global Petrochemical Industry”, Nexant, (2008)
Specialties 51%
Commodities 49%
Chemical Industry
2 “Improving Energy Efficiency in the Chemical Industry”, US National Academy of Engineering (2009)
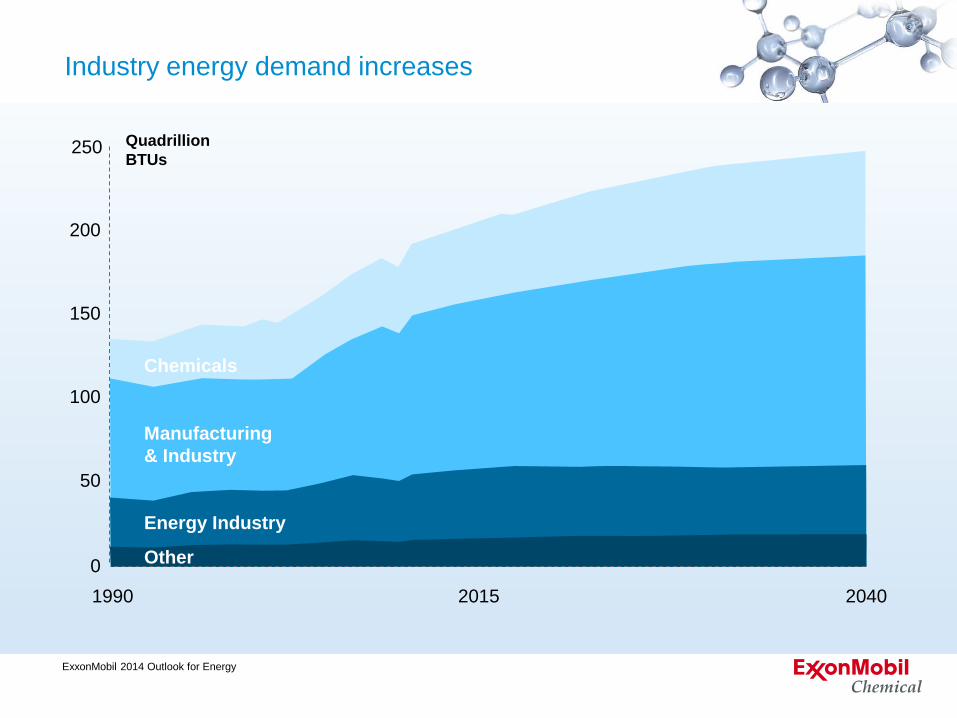
Chemicals
Manufacturing & Industry
Energy Industry
Other
Quadrillion BTUs
1990 2015 2040 0
50
100
150
200
250
Industry energy demand increases
ExxonMobil 2014 Outlook for Energy
Sustainability of chemical products
• Environment • Reduce resources consumption (energy, materials)
• Continue improvement of manufacturing processes & supply chain
• Reduce emissions; cleaner air, water and soil
• Economy • Produce economically viable and competitive products
• New employment, new business
• Enhanced quality of life and improved health • Access to affordable and safe products
• Respect of human rights and promote fair trade
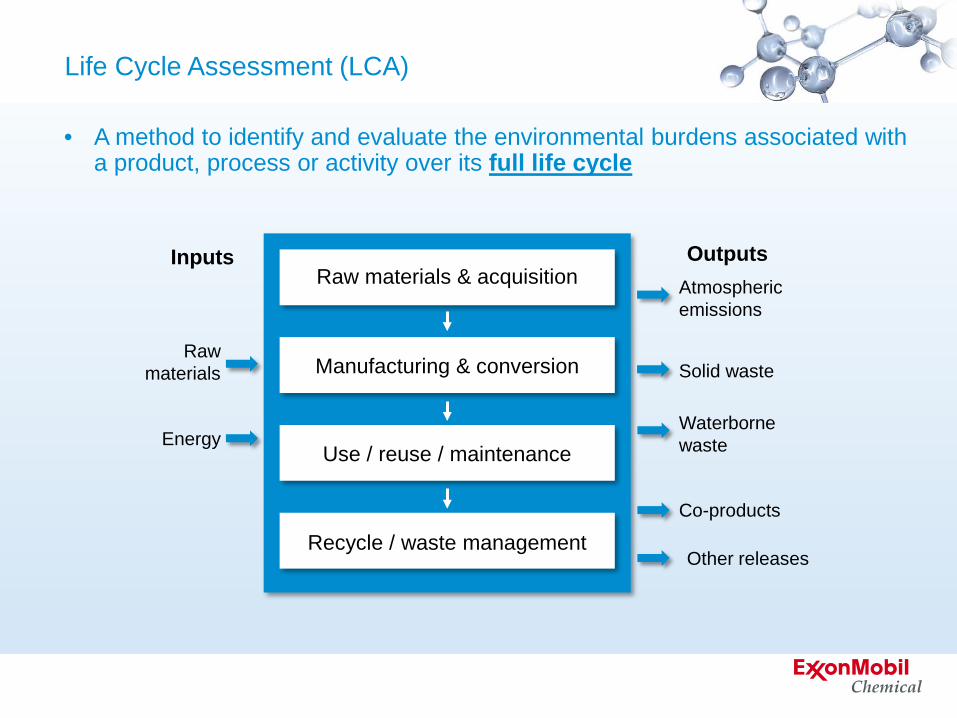
Life Cycle Assessment (LCA)
• A method to identify and evaluate the environmental burdens associated with a product, process or activity over its full life cycle
Raw materials & acquisition
Manufacturing & conversion
Use / reuse / maintenance
Recycle / waste management
Inputs Outputs
Raw materials
Energy
Atmospheric emissions
Solid waste
Waterborne waste
Co-products
Other releases
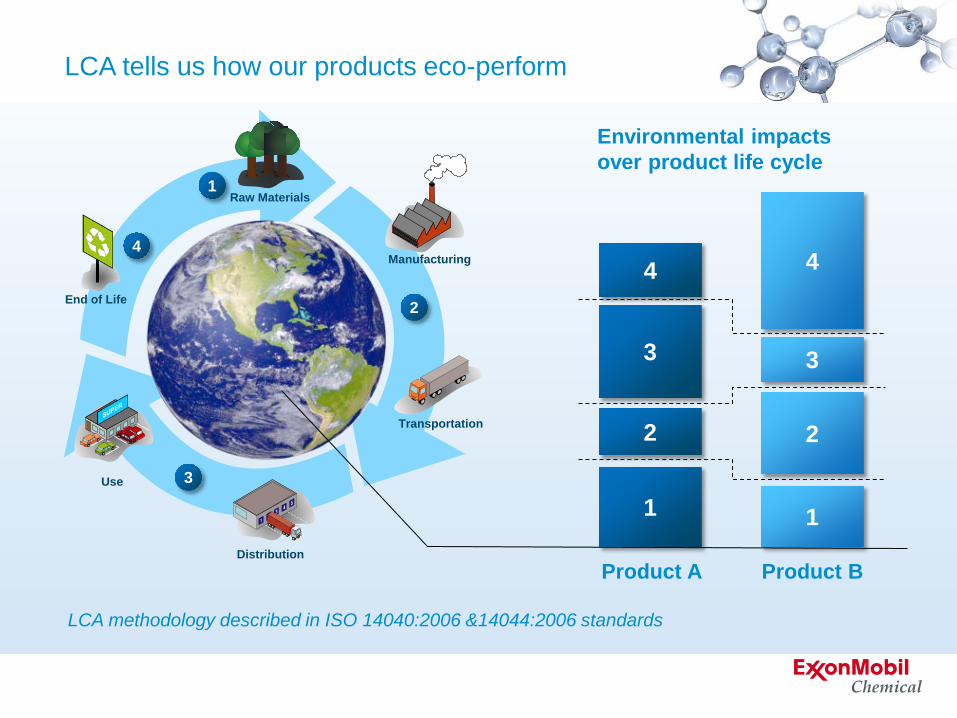
Raw Materials 1
Manufacturing
Transportation
2
Distribution
Use 3
Environmental impacts over product life cycle
4
End of Life
1
2
3
4
Product A
1
2
3
4
Product B
LCA tells us how our products eco-perform
LCA methodology described in ISO 14040:2006 &14044:2006 standards
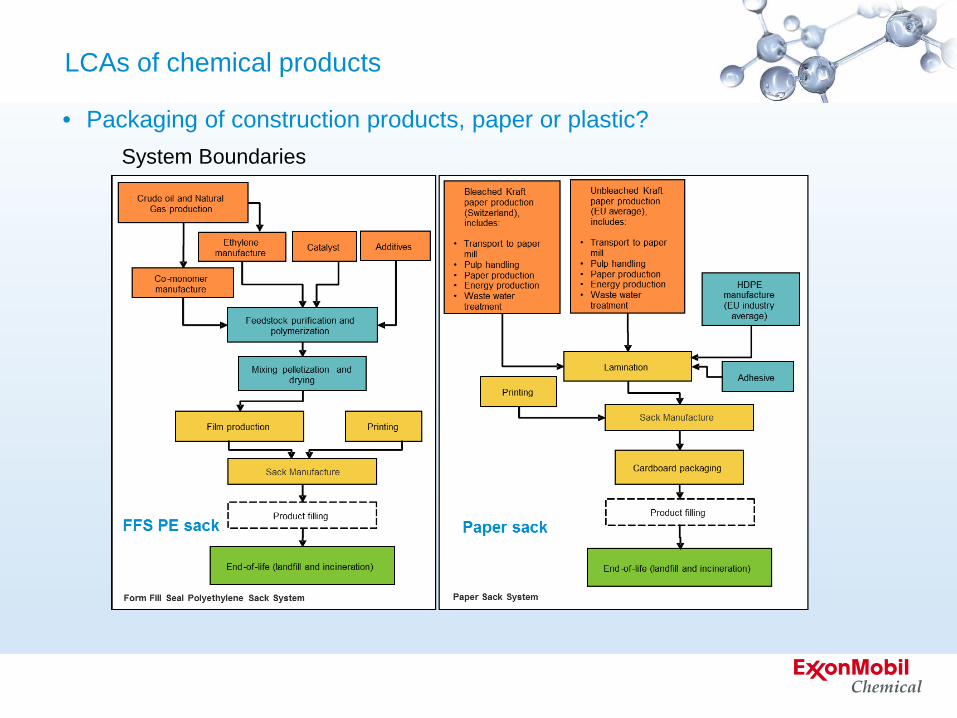
LCAs of chemical products
System Boundaries
• Packaging of construction products, paper or plastic?
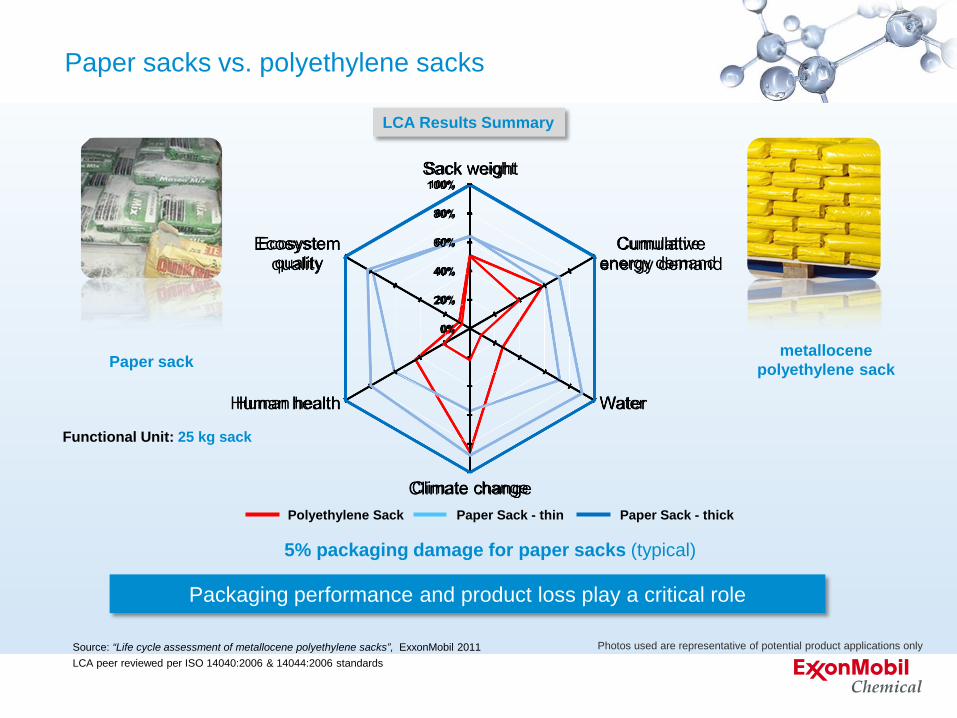
5% packaging damage for paper sacks (typical)
Photos used are representative of potential product applications only LCA peer reviewed per ISO 14040:2006 & 14044:2006 standards
Packaging performance and product loss play a critical role
Source: “Life cycle assessment of metallocene polyethylene sacks”, ExxonMobil 2011
Paper sack metallocene
polyethylene sack
Functional Unit: 25 kg sack
Polyethylene Sack Paper Sack - thin Paper Sack - thick
LCA Results Summary
Paper sacks vs. polyethylene sacks

GHG emissions abatement by chemical products
Study by the International Council of Chemical Associations (ICCA) • Quantify GHG reduction options and how chemical industry can best contribute to
global abatement • Production phase emissions using total life cycle approach
Total Disposal
0.5
Production
2.1
Extraction
0.3
0.4
High GWP gases
GHG life cycle emissions of chemical products, 2005 (GtCO2e)
3.3 Giga Tons
About 7% of global emissions
Source: ICCA, “Innovations for Greenhouse Gas Emission Reductions” (July 2009)
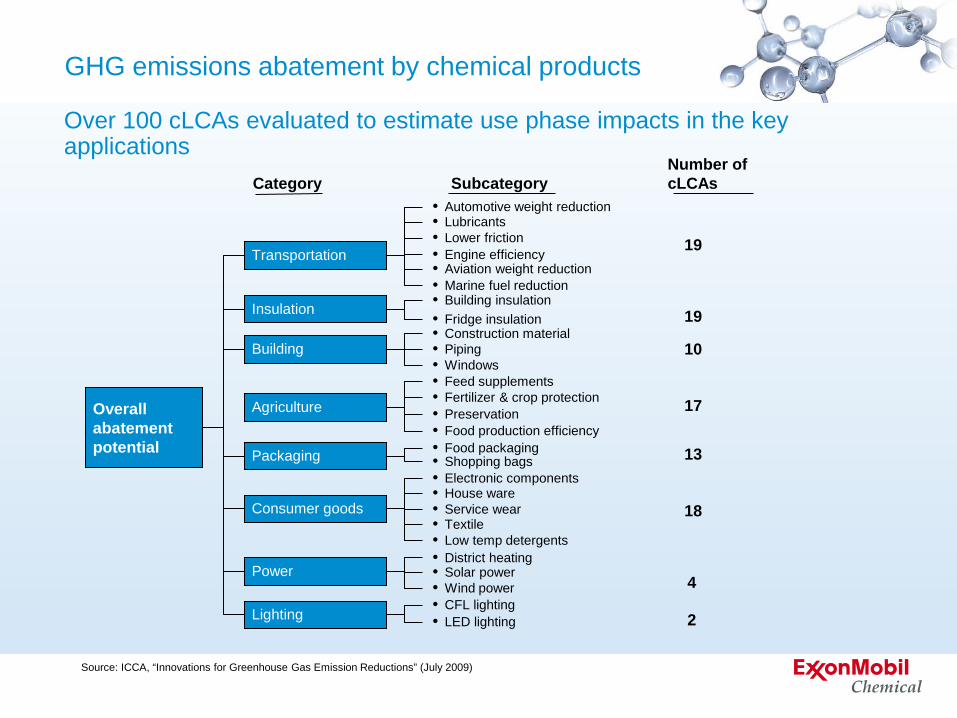
Number of cLCAs
19
19
10
17
13
4
2
Overall abatement potential
Subcategory • Automotive weight reduction • Lubricants • Lower friction • Engine efficiency • Aviation weight reduction • Marine fuel reduction • Building insulation • Fridge insulation • Construction material • Piping • Windows • Feed supplements • Fertilizer & crop protection • Preservation • Food production efficiency • Food packaging • Shopping bags
18
• Electronic components • House ware • Service wear • Textile • Low temp detergents • District heating • Solar power • Wind power • CFL lighting • LED lighting
Category
Transportation
Insulation
Building
Agriculture
Packaging
Consumer goods
Power
Lighting
Source: ICCA, “Innovations for Greenhouse Gas Emission Reductions” (July 2009)
GHG emissions abatement by chemical products
Over 100 cLCAs evaluated to estimate use phase impacts in the key applications
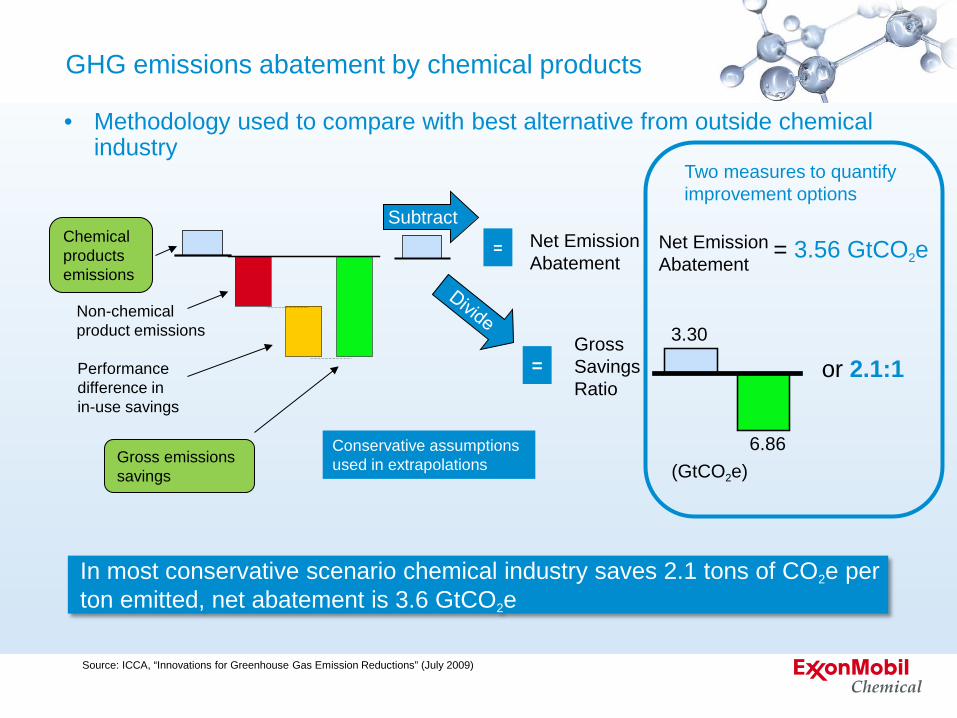
Two measures to quantify improvement options
In most conservative scenario chemical industry saves 2.1 tons of CO2e per ton emitted, net abatement is 3.6 GtCO2e
3.30
6.86
Net Emission Abatement
or 2.1:1
= 3.56 GtCO2e
Performance difference in in-use savings
Non-chemical product emissions
= Net Emission Abatement
= Gross Savings Ratio
Subtract
Conservative assumptions used in extrapolations Gross emissions
savings
Chemical products emissions
Source: ICCA, “Innovations for Greenhouse Gas Emission Reductions” (July 2009)
(GtCO2e)
GHG emissions abatement by chemical products
• Methodology used to compare with best alternative from outside chemical industry
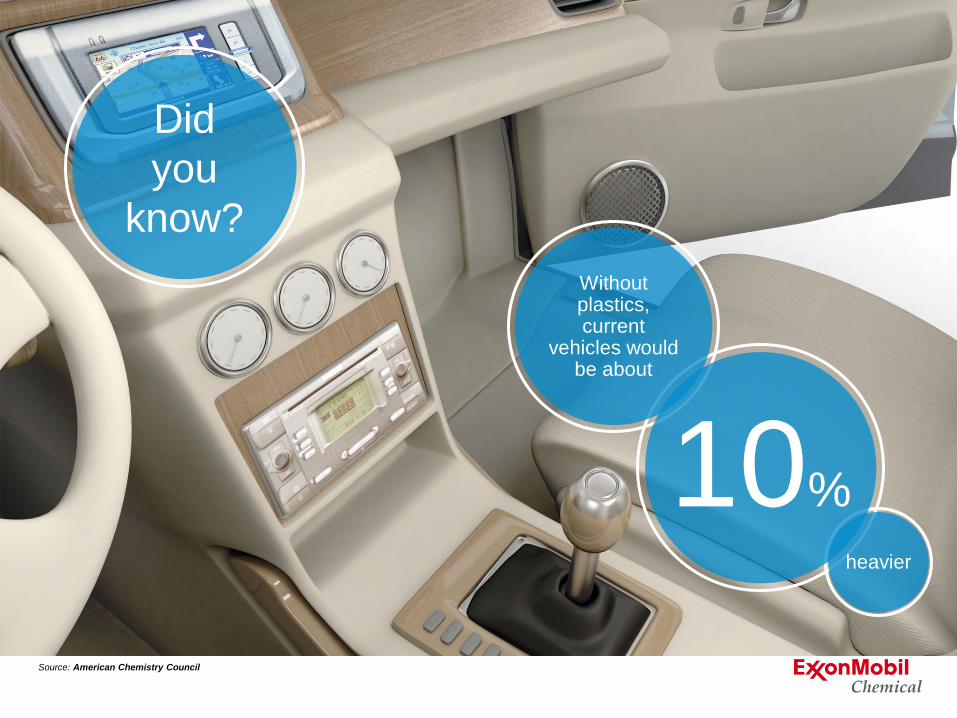
Source: American Chemistry Council
Did you
know?
10% heavier
Without plastics, current
vehicles would be about
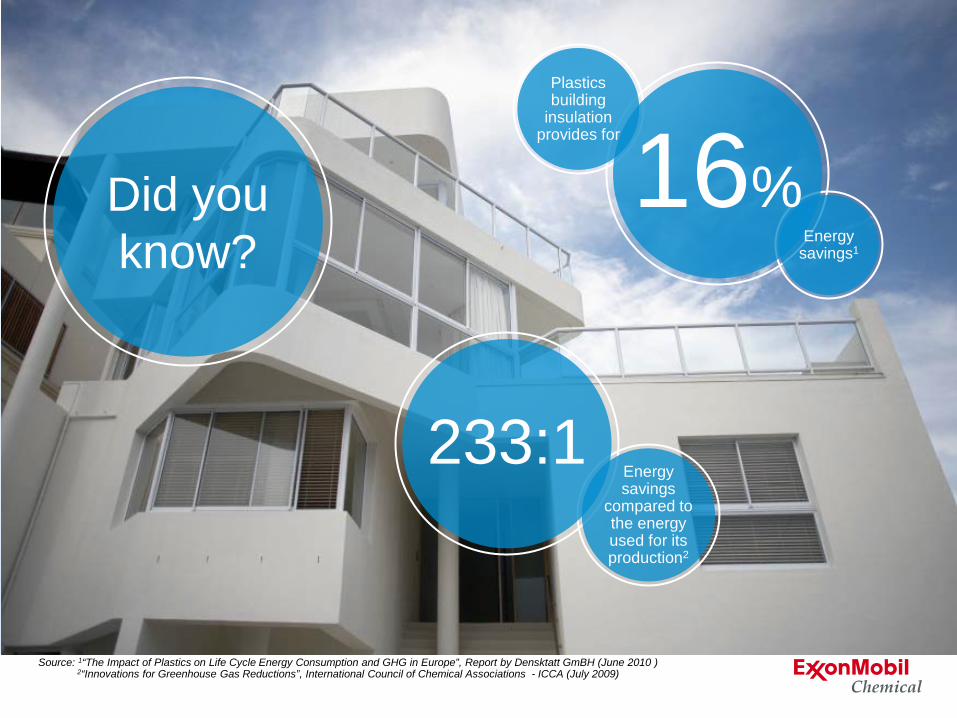
Did you know?
16%
Plastics building
insulation provides for
Energy savings1
233:1 Energy savings
compared to the energy used for its production2
Source: 1“The Impact of Plastics on Life Cycle Energy Consumption and GHG in Europe”, Report by Densktatt GmBH (June 2010 ) 2“Innovations for Greenhouse Gas Reductions”, International Council of Chemical Associations - ICCA (July 2009)
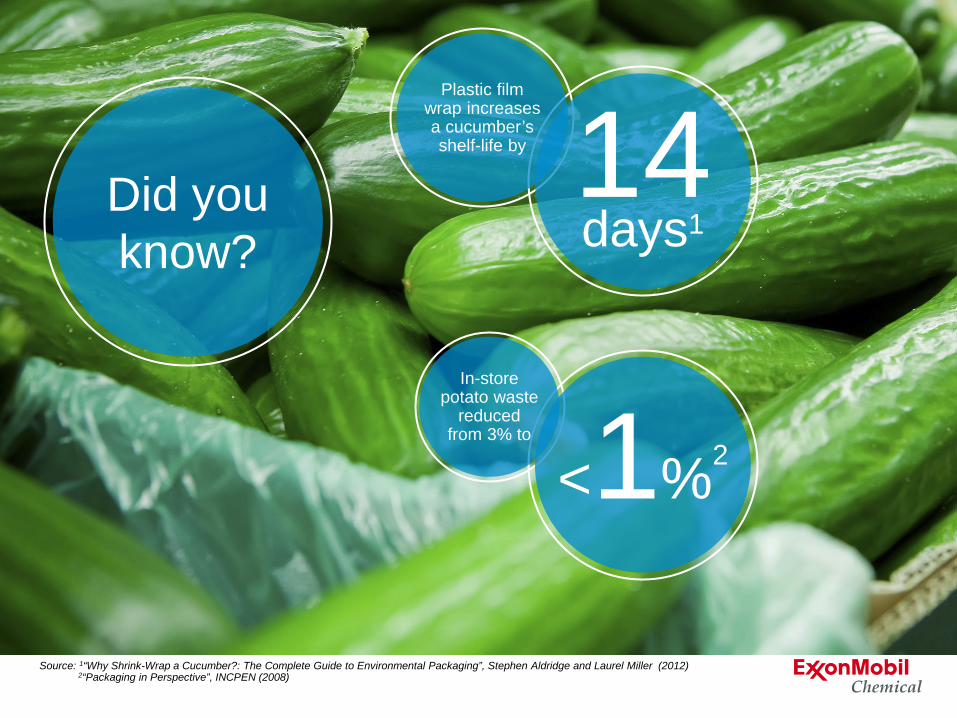
Source: 1“Why Shrink-Wrap a Cucumber?: The Complete Guide to Environmental Packaging”, Stephen Aldridge and Laurel Miller (2012) 2“Packaging in Perspective”, INCPEN (2008)
Plastic film wrap increases a cucumber’s shelf-life by 14
days1 Did you know?
In-store potato waste
reduced from 3% to
<1%2

Paper, cotton ... or plastic?
To have equivalent GWP* to that of a HDPE grocery bag, reusable bags need to be used:
Paper LDPE PP Cotton HDPE
3x 4x 11x 131x
•Source: Adapted from “Life cycle assessment of supermarket carrier bags: a review of the bags available in 2006”, UK Environment Agency (2011) *GWP: Global Warming Potential

Profit +
Benefit +
Waste
Research opportunities for sustainable products
Raw Materials
+ Energy
Bulk Product
End-Use Product Profit
+ Benefit
+ Waste
Other Raw Material
Mfg Conversion
Recycle
Recover/Regenerate
Degrade
Reuse
CO2 / Emissions Waste
CO2 / Emissions Waste
CO2 / Emissions Waste
Efficiency Efficiency Fit for
purpose
CO2 / Emissions Waste
Use
All can be active areas of research with opportunity for positive impact on sustainability
Opportunities for new processes and new products with enhanced physical properties, lower resource consumption and lower environmental impacts
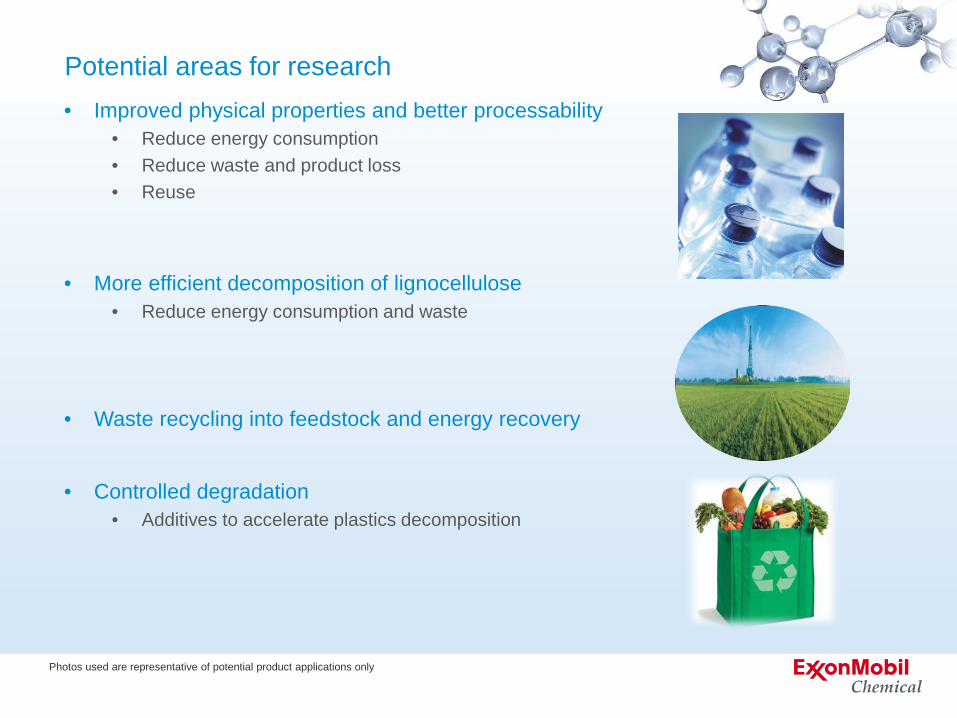
Potential areas for research • Improved physical properties and better processability
• Reduce energy consumption • Reduce waste and product loss • Reuse
• More efficient decomposition of lignocellulose • Reduce energy consumption and waste
• Waste recycling into feedstock and energy recovery
• Controlled degradation • Additives to accelerate plastics decomposition
Photos used are representative of potential product applications only
Summary
• The Chemical industry has and will continue to contribute to a sustainable future
• Chemical industry key enabler of solutions to reduce energy consumption and GHG emissions
• Incorporate a life cycle thinking approach • Efficiency of manufacturing and conversion processes, and of supply chain
• Innovation in new and high performance products
• LCA a globally accepted tool for evaluating environmental performance of technologies and products
• Science-based solutions that consider full life cycle impacts are key to reducing greenhouse gas emissions and energy consumption, and to sustainability
©2014 Exxon Mobil Corporation. To the extent the user is entitled to disclose and distribute this document, the user may forward, distribute, and/or photocopy this copyrighted document only if unaltered and complete, including all of its headers, footers, disclaimers, and other information. You may not copy this document to a Web site. ExxonMobil does not guarantee the typical (or other) values. Analysis may be performed on representative samples and not the actual product shipped. The information in this document relates only to the named product or materials when not in combination with any other product or materials. We based the information on data believed to be reliable on the date compiled, but we do not represent, warrant, or otherwise guarantee, expressly or impliedly, the merchantability, fitness for a particular purpose, suitability, accuracy, reliability, or completeness of this information or the products, materials, or processes described. The user is solely responsible for all determinations regarding any use of material or product and any process in its territories of interest. We expressly disclaim liability for any loss, damage, or injury directly or indirectly suffered or incurred as a result of or related to anyone using or relying on any of the information in this document. There is no endorsement of any product or process, and we expressly disclaim any contrary implication. The terms, “we”, “our”, "ExxonMobil Chemical", or "ExxonMobil" are used for convenience, and may include any one or more of ExxonMobil Chemical Company, Exxon Mobil Corporation, or any affiliates they directly or indirectly steward. The ExxonMobil Logo and Interlocking "X" Device are trademarks of ExxonMobil.
Disclaimer