Embed Size (px)
Citation preview

Life Course Markers, Independence from Parents and Locus of Control
among Young Adults in Greater Jakarta, Indonesia
Peter McDonald, Iwu Utomo and Anna Reimondos
Australian Demographic and Social Research Institute
The Australian National University

Concepts of adulthood
• 1. Biological
– Puberty
• 2. Legal
– Age at majority, voting age, signing contracts, driving a car, drinking alcohol, etc.
• 3. Socio-demographic markers
– Finishing education, leaving home, commencing employment, marriage, first birth
• 4. Psycho-social
– Sense of independence from parents, control over one’s life, ‘standing alone’.

Literature
• Extensive literature on socio-demographic markers and psycho-social measures as indicators of adulthood. Eg: – Shanahan, M. Porfeli, E, and J. Mortimer. 2005. Subjective age identity and the transition to
adulthood: when does one become an adult? In Settersten, R., Furstenberg, F. and Rumbaut, R. (eds). On the Frontier of Adulthood: Theory, Research, and Public Policy. Chicago: University of Chicago Press, pp.225-255.
– Arnett, J. 2001. ‘Conceptions of the transition to adulthood: perspectives from adolescence through midlife’, Journal of Adult Development, 8(2): 133-143.
– Lewis, S., Ross, C. And Mirowsky, J. 1999. “Establishing a sense of personal control in the
transition to adulthood’, Social Forces, 77(4): 1573-1599.
• Debate about the salience of markers V independence for parents V sense of control.
• Literature relates primarily to the United States.

Our research objective
• Can or how should ‘adulthood’ be defined for young Indonesians: markers, independence from parents or sense of control?
• Data Source: The 2010 Greater Jakarta Transition to Adulthood Survey.
• Representative sample survey of young adults aged 20-34 living in the city of Jakarta and the contiguous cities of Bekasi and Tangerang.

Why young adults in Jakarta?
• Subject to a wide range of socio-political influences: – Western individualism – Eastern Islamic fundamentalism – Modern Indonesian nationalism – The traditions of the many Indonesian ethnic groups from which
these young people are descendent.
Young Jakartans are: – not isolated in a traditional culture – live in a very dynamic environment where the pace of
change is considerable – are relatively highly educated:
• almost 70 per cent had completed or will soon complete senior high school (Year 12)
• 28 per cent have or will soon have a tertiary qualification.

Socio-demographic markers: Males
0.0
0.1
0.2
0.3
0.4
0.5
0.6
0.7
0.8
0.9
1.0
15 16 17 18 19 20 21 22 23 24 25 26 27 28 29 30 31 32 33 34
Pro
po
rtio
n s
urv
ivin
g
Age
Figure 1: Survival analysis of life course markers (Males)
Enter labour force
Leave home
Marriage
1st birth

Socio-demographic markers: Females
0
0.1
0.2
0.3
0.4
0.5
0.6
0.7
0.8
0.9
1
15 16 17 18 19 20 21 22 23 24 25 26 27 28 29 30 31 32 33 34
Pro
po
rtio
n s
urv
ivin
g
Age
Figure 2: Survival analysis of life course markers (Females)
Enter labour force
Leave home
Marriage
1st birth

Arnett’s scale of individualism
1. Accept responsibility for the consequences of your actions
2. Decide on personal beliefs and values independently of parents or other influences
3. Establish a relationship with parents as an equal adult
4. Financially independent from parents
5. No longer living in parents’ household.
• Item 5 is a marker. Measured, but probably the least best of all of the markers for our context.
• Items 2, 3 and 4 (relationship with parents) all considered to be problematic in this cultural context.

Our scale: degree of dependence on parents
1. I am still emotionally dependent on my parents
2. My parents treat me as if I was still a child
3. If I have a problem, I turn to my parents for help
4. I consider myself to be an independent person.

Scale items: dependence on parents
0
10
20
30
40
50
60
70
80
90
100
I am still dependent on my parents
My parents treat me as if I was still a child
If I have a problem, turn to my parents for help
I consider myself to be a fully independent person
Level of agreement to statements about dependence upon parents
Strongly disagree
Disagee
Mixed feelings
Agree
Strongly agree
Legend reversed

Sense of control
• Transition to adulthood in terms of the establishment of a sense of personal control (Lewis et al. 1999).
• Adulthood is associated with the development of a sense of control over one’s life and one’s destiny.
• Use is made of Rotter’s (1966) scale of the internal locus of control.
• Those with a greater sense of control are more adult.

Scale: sense of control
1. I have little control over the things that happen to me
2. What happens to be in the future mostly depends on me
3. I can do just about anything if I really set my mind to it
4. There is really no way I can solve the problems I have
5. Sometimes I feel that I continue to be directed by the environment around me.
• The sense of control scale and the dependence on parents scale are not correlated (0.23)

Scale items: sense of control
0
10
20
30
40
50
60
70
80
90
100
I have little control over the things that happen
to me
What happens to me in the future mostly depends on me *
I can do just about anything if I really set
my mind to it*
There is really no way I can solve some of the
problems I have
Sometimes I feel that I am being pushed around
in life
Level of agreement to statements about control over life
Strongly disagree
Disagee
Mixed feelings
Agree
Strongly agree
Legend reversed

Parental dependence Locus of control
Variable Males Females Males Females
Age group
20-24 -0.09** -0.11*** -0.09** 0.03
25-29 (ref) -- -- -- --
30-34 0.06 0.10*** -0.05 0.10***
Highest education
Primary school or less -0.13** 0.07* -0.27*** -0.23***
Junior high school -0.03 0.05 -0.10** -0.13***
Senior high school (ref) -- -- -- --
Certificate 0.11* 0 0.16*** 0.14***
University 0 0.07 0.06 0.23***
Religiosity
Not religious (ref)
Somewhat religious -0.02 0.02 -0.05 0.08**
Religious/Very religious 0.03 0.09* 0.06 0.09**
Migrated since 17
No -- -- -- --
Yes 0.12*** 0.10*** 0.01 0.00
Objective markers
Ever worked
No (ref) -- -- -- --
Yes 0.35*** 0.11*** 0.06 0.00
Left home
No (ref) -- -- -- --
Yes 0.31*** 0.15*** 0.09** -0.03
Married
No (ref) -- -- -- --
Yes 0.05 0.15*** 0.05 -0.07
Had a child
No (ref) -- -- -- --
Yes 0.00 0.04 -0.12* -0.02
Constant -0.48*** -0.41*** 0.03 0.01
Number of observations 1236 1743 1236 1743
Prob>F <0.001 <0.001 <0.001 <0.001
Adjusted R squared 0.19 0.13 0.04 0.09
OLS regression with scales as dependent variables

Observations from regressions • The dependence on parents scale is associated with
three of the four markers especially having ‘ever worked’ or ‘left home’.
• The sense of control measure is not associated with the markers.
• Sense of control is strongly associated with education but dependence on parents is not.
• More religious women have a stronger sense of control.
• Migrants are less dependent upon parents.
• Men are less dependent upon parents and have a higher sense of control than women (not shown in table).

Conclusions
• The association between entering the work force and a lower level of dependence upon parents may be the best way to define ‘adulthood’ in this cultural context.
• Adulthood seems more likely to be explained in terms of a person’s dependence on his or her parents than by sense of control over his or her life.
Education and Employment Outcomes of Young Migrants to Greater Jakarta
Peter McDonald, Iwu Dwisetyani Utomo, Anna
Reimondos, Ariane Utomo, Terry Hull and Gavin Jones
Greater Jakarta Transition to Adulthood Survey
Policy Background Paper No. 1
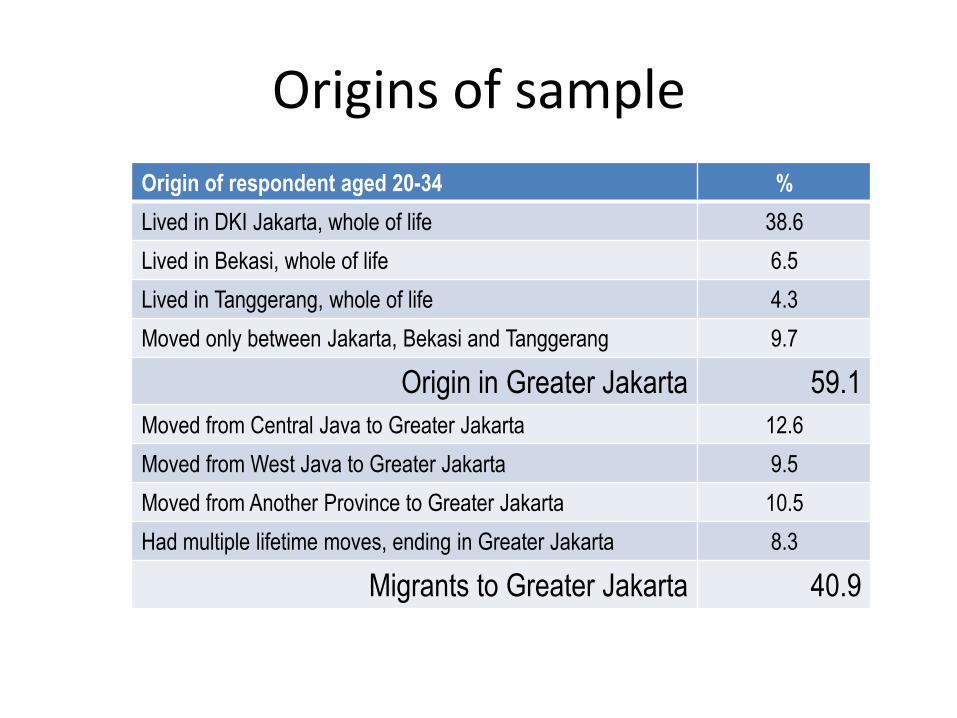
Origins of sample
Origin of respondent aged 20-34 %
Lived in DKI Jakarta, whole of life 38.6
Lived in Bekasi, whole of life 6.5
Lived in Tanggerang, whole of life 4.3
Moved only between Jakarta, Bekasi and Tanggerang 9.7
Origin in Greater Jakarta 59.1
Moved from Central Java to Greater Jakarta 12.6
Moved from West Java to Greater Jakarta 9.5
Moved from Another Province to Greater Jakarta 10.5
Had multiple lifetime moves, ending in Greater Jakarta 8.3
Migrants to Greater Jakarta 40.9

Those migrating at ages 10 and over are much more likely to have only
primary school education.

The 10 and over group
• With very few economic opportunities available in the village of origin, these early school leavers set out for Greater Jakarta on their own, that is, not with their parents.
• Men worked often as street sellers and women often as domestic servants.
• In general, they remain self employed or as casual workers, working very long hours at low wage rates.
• They had little or no opportunity to continue their education after they moved to the city.


Females migrating after age 10 married very early and
had their children very early

A low level occupation was defined as a process worker, an operator
or machinery assembly worker, or those in other elementary occupations.
Education is the key but evidence of discrimination against women migrating after age 10

The vulnerability of women migrating to Greater Jakarta from age 10 onwards
• Women who migrated to Jakarta from age 10 onwards are disadvantaged in multiple ways:
– Among all 20-34 year-olds in Greater Jakarta, both men and women, they had
by far the lowest levels of education and the lowest levels of employment.
– They were much more likely than other women to have married and had their children at early ages.
– Finally they were much more likely to be working in low level occupations than other women even after taking their low education level into account.
•
• More than 50% of employed women in this category were employed as domestic workers or as self-employed petty traders. Another 20% worked in factories.
Males migrating to Greater Jakarta at ages 10+
• Men who migrated to Greater Jakarta from age 10 onwards
were more likely to be employed than other men and also
worked much longer hours than other men.
• This is consistent with their need for income in order to
survive and remain in the city.
• However, after taking their level of education into account
and the type of work that they did, the hourly wage rate of
men who migrated from age 10 onwards was actually
higher than that of other men (positive discrimination).

Why is hourly income higher for migrants?
• Migrants may be prepared to work harder and this may be
recognized by employers.
• Migrants may work harder because they are:
– selective of persons wanting to get ahead
– they may be forced to work harder because of their lack of family
support in Jakarta
– they have demands upon them to provide remittances to family
members still in the village
– their wives are not earning

Future implications
• As education levels increase across Indonesia and young
people in villages do not drop out of school at an early age,
this pool of low-skilled migrants may start to diminish.
• There is increased competition for this segment of the
Indonesian labour force from international sources.
• This will have implications for the future of the low level
occupations in Jakarta that low-skilled migrants have filled
in the past.

Indicators of Poverty Among Young
Adults in Greater Jakarta
Peter McDonald, Anna Reimondos and Iwu Utomo Australian Demographic and Social Research Institute
The Australian National University

Three concepts of poverty
• 1. Wellbeing, including health and psychological
wellbeing
• 2. Capability, opportunity structure, human capital
• 3. Material standard of living
• We define poverty as a very low material living
standard. This is the standard convention.

Poverty at the household or individual level?
• Usually poverty is measured at the household level using household income or household expenditure adjusted for household composition.
• The 2010 Greater Jakarta Transition to Adulthood Survey is a survey of individuals and household income or expenditure were not collected.
• Is it possible to define material poverty using individual level variables? Use measures of ‘deprivation’.

Indicator Cut-off or category to be
considered deprived
Percentage
deprived
Valid
cases
Dwelling 1. Type of dwelling Tenement (rumah petak) 22.0 3,005
2. Metres2 per person Metres2 per person is less
than or equal to 7.5m2
25.2 2,817
3. Persons per bedroom Number of persons per
bedroom is greater than or
equal to 3
31.9 2,786
4. Floor material Soil, bamboo, wood, or
cement/brick.
12.5 2,983
5. Source of drinking water Tap or well outside of
house, or other
11.9 2,975
6. Ownership of house Rented or house built on
illegal land
24.5 2,805
Education and work 7. Number of years not working or
studying (from age 12-19)
3+ more years 15.7 2,944
8. Highest education level Never went to school, or
only completed primary
school
13.6 3,001
9. Unemployed Respondent is
unemployed
7.9 2,996
Table 1. Potential Indicators of Poverty and Percentages Deprived
2010 Greater Jakarta Transition to Adulthood Survey

Indicator Cut-off or category to be
considered deprived
Percentage
deprived
Valid cases
Finances and
assets 10. Satisfaction with finances Dissatisfied or very dissatisfied 30.1 2,986
11. Satisfaction with amount of
savings
Dissatisfied or very dissatisfied 42.3 2,981
12. Self-assessment of financial
situation
Inadequate or very inadequate 24.1 2,976
13. Mobile phone ownership Does not own a mobile 14.8 2,987
14. Car/motorbike ownership Does not own either a car or a
motorbike
46.4 2,980
15. Bill payment Unable to pay on time 15.9 2,995
16. Rent/mortgage payment Unable to pay on time 10.0 2,995
17. Sold or pawned something Sold or pawned something 15.6 2,992
18. Purchasing food Has gone without food 3.7 2,993
19. New clothes purchasing Unable to buy new clothes 10.9 2,993
Health 20. BMI Underweight (BMI<18.5) 21.3 2,991
21. Self-rated health Fair or poor 12.8 2,994
22. Chronic illness Has a chronic illness 6.1 2,988
23. Emotional support Has only two types of people or less
to provide them with emotional
support (of max 11)
16.4 2,959
24. Life satisfaction Dissatisfied or very dissatisfied 12.6 2,986
Table 1 cont’d. Potential Indicators of Poverty and Percentages Deprived
2010 Greater Jakarta Transition to Adulthood Survey

Tests of reliability
• A reliable indicator of poverty should:
– Not be associated with age and sex
– Should be associated with ‘economic status when
growing up, based on the theory of the intergenerational
transfer of disadvantage.
• The indicators in Table 1 were tested against these
reliability tests (in a multivariate model containing all three
variables).

Domain Indicator Economic situation when growing up: odds ratios
Good (reference) Fair Poor
Dwelling Type of dwelling 1.00 1.68*** 2.47***
Metres2 per person 1.00 2.03*** 2.76***
Persons per bedroom 1.00 1.93*** 2.94***
Floor material 1.00 1.70*** 2.69***
Source of drinking water 1.00 1.41** 2.41***
Ownership of house 1.00 1.63*** 2.12***
Finances and assets Satisfaction with finances 1.00 1.95*** 6.93***
Satisfaction with amount of
savings
1.00 2.14*** 5.82***
Self-assessment of financial
situation
1.00 1.76*** 4.45***
Mobile phone ownership 1.00 2.07*** 4.12***
Car/motorbike ownership 1.00 1.42*** 1.77***
Bill payment 1.00 1.46*** 4.13***
Rent/mortgage payment 1.00 1.82*** 3.15***
Sold or pawned something 1.00 1.60*** 3.15***
Purchasing food 1.00 1.43 5.20***
New clothes purchasing 1.00 1.74*** 4.47***
Table 2. Odds ratios for ‘economic situation while growing up’ as
a predictor of each indicator of disadvantage

Domain Indicator Economic situation when growing up: odds ratios
Good (reference) Fair Poor
Education and
employment Number of years not working
or studying (from age
12-19)
1.00 2.65*** 5.14***
Highest education level 1.00 2.62*** 9.43***
Unemployed 1.00 1.04 1.09
Health BMI 1.00 1.34*** 1.37*
Self-rated health 1.00 1.14 2.08***
Chronic illness 1.00 0.72* 1.23
Emotional support 1.00 1.35** 1.59**
Table 2 cont’d. Odds ratios for ‘economic situation while growing up’ as a
predictor of each indicator of disadvantage

Summary
• Being unemployed failed the indicator test.
• The health indicators failed the indicator test and they are
measures of wellbeing rather than material living standard.
• The education measures are measures of capability rather
than material living standard.
• Finally, two indicators, owning a motor vehicle and having
difficulty paying rent were related to age, so they also were
considered unacceptable.
• This leaves 14 indicators that are reliable.

Domain Indicator
Dwelling Type of dwelling
Metres2 per person
Persons per bedroom
Floor material
Source of drinking water
Ownership of house
Finances and assets Satisfaction with finances
Satisfaction with amount of
savings
Self-assessment of financial
situation
Mobile phone ownership
Bill payment
Sold or pawned something
Purchasing food
New clothes purchasing
14 reliable indicators

Distribution of number of indicators of disadvantage
Three groups
0-3: not disadvantaged (66.5%) 4-5: disadvantaged (19.0%) 6+: very disadvantaged (14.5%)

Percentage disadvantaged for each item, those with 4+ and 6+ deprivations
Desirable 1. Each red line is longer than each blue line Outcomes: 2. The rank orders of the blue and the red are very similar 3. The four lowest percentages relate to access to the most basic commodities: food, water, clothing and housing

Reliability: relationship of poverty categories
with education
31
47
71
90 93 30
26
19
9 6
39
27
10
1 1
0%
10%
20%
30%
40%
50%
60%
70%
80%
90%
100%
Primary school or below
Junior high school Senior high school Certificate Bachelors+
Highest level of education
6+ Very disadvantaged
4-5 Disadvantaged
0-3 Not disadvantaged

Reliability: relationship of poverty categories with economic situation when growing up
80
64
35
15
21
24
5
15
41
0%
10%
20%
30%
40%
50%
60%
70%
80%
90%
100%
Good Fair Poor
Economic situation growing up
6+ Very disadvantaged
4-5 Disadvantaged
0-3 Not disadvantaged

Reliability
• The three categories of disadvantage are independent of age and sex with the exception of mobile phone ownership which is somewhat related to sex.
• The disadvantage measure can be sub-divided into four factors or domains (dwelling, satisfaction with finances, access to basic necessities and ownership of basic amenities) each of which has the desirable characteristics of association with education and economic situation when growing up but little association with age and sex.

Applications of the measure
• 1. We shall use it in future analysis of the 2010 Greater
Jakarta Transition to Adulthood Survey. For example, we
can study the histories of those who came from a poor
economic background but are not disadvantaged today.
How did they achieve this?
• 2. When we collect our second round data in 2013, we can
determine the causes of remaining in poverty or escaping
poverty using longitudinal methods.
• 3. The measure might be replicated in surveys done by
others.