Embed Size (px)
DESCRIPTION
“The Future of Nuclear Power in a Post-Fukushima World”. Life After Fukushima: What is the Impact on Japan’s Economy. October 19, 2011 Kiichiro Sato JETRO New York. Japan Faces an Unprecedented Challenge. Earthquakes Main shock Magnitude : 9.0 (Mar. 11th) Aftershocks - PowerPoint PPT Presentation
Citation preview
Life After Fukushima: What is the Impact on Japan’s Economy
October 19, 2011Kiichiro Sato
JETRO New York
1
“The Future of Nuclear Power in a Post-Fukushima World”
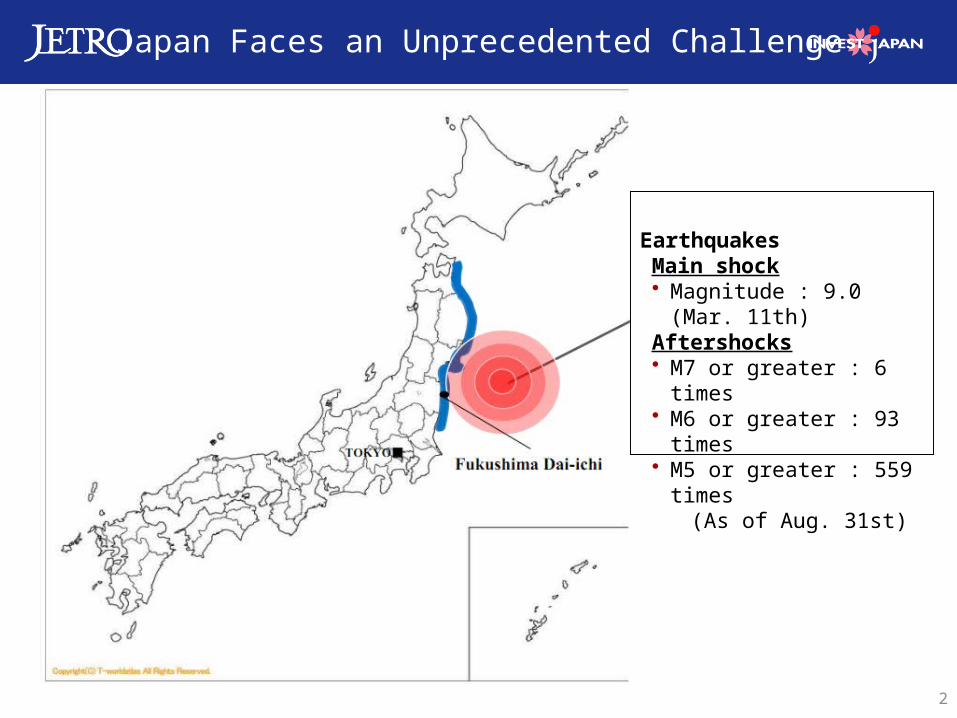
Japan Faces an Unprecedented Challenge
2
EarthquakesMain shock• Magnitude : 9.0 (Mar. 11th)Aftershocks• M7 or greater : 6 times• M6 or greater : 93 times• M5 or greater : 559 times (As of Aug. 31st)
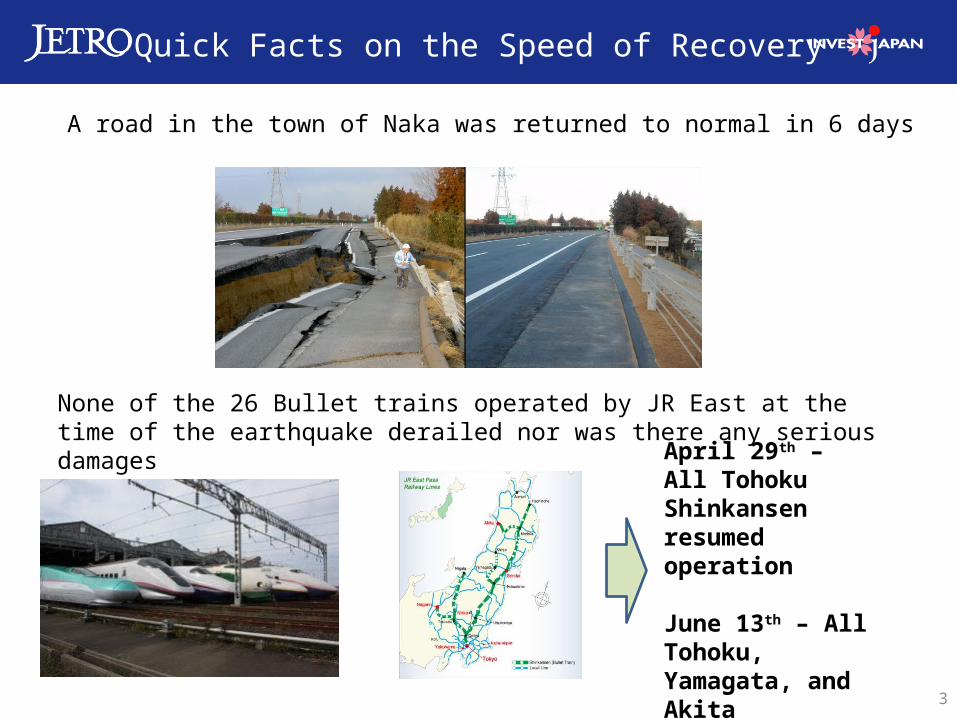
A road in the town of Naka was returned to normal in 6 days
None of the 26 Bullet trains operated by JR East at the time of the earthquake derailed nor was there any serious damages
April 29th – All Tohoku Shinkansen resumed operation
June 13th – All Tohoku, Yamagata, and Akita Shinkansen service has been restored
3
Quick Facts on the Speed of Recovery
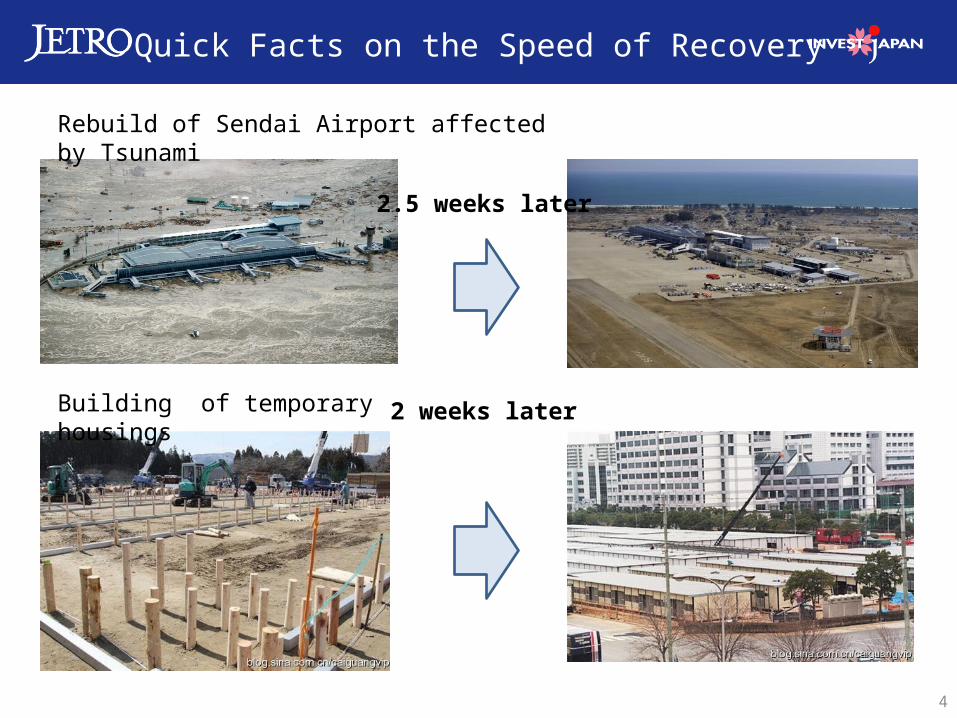
2.5 weeks later
Building of temporary housings
4
Quick Facts on the Speed of Recovery
Rebuild of Sendai Airport affected by Tsunami
2 weeks later
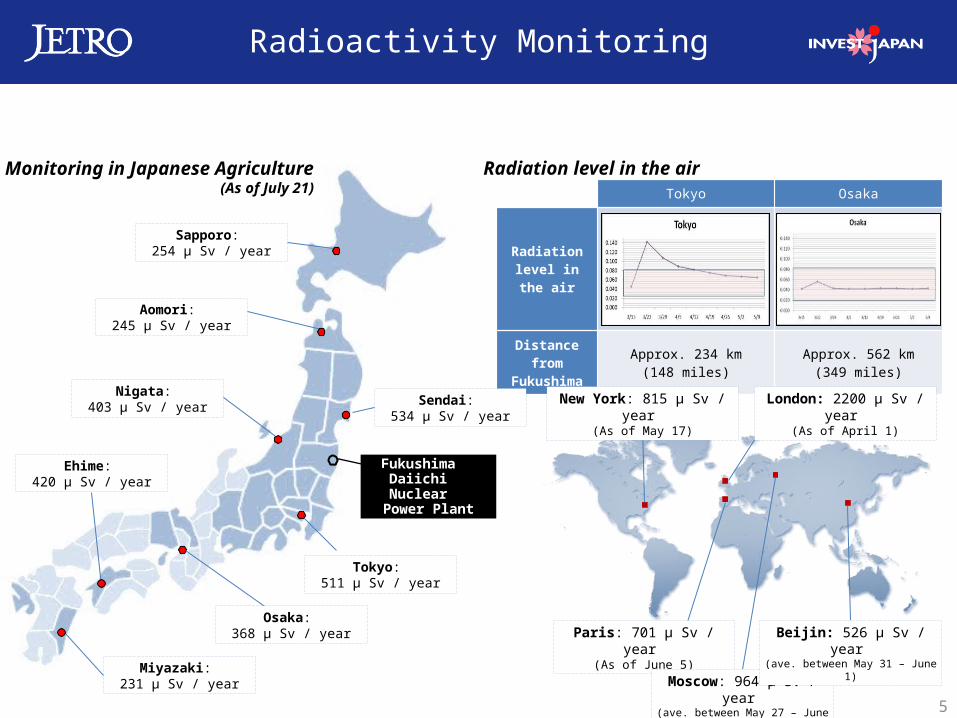
Tokyo Osaka
Radiation level in the air
Distance fromFukushima
Approx. 234 km(148 miles)
Approx. 562 km(349 miles)
Fukushima Daiichi
Nuclear Power Plant
Tokyo: 511 μ Sv / year
Sendai: 534 μ Sv / year
Aomori: 245 μ Sv / year
Sapporo: 254 μ Sv / year
Ehime: 420 μ Sv / year
Miyazaki: 231 μ Sv / year
New York: 815 μ Sv / year (As of May 17)
Paris: 701 μ Sv / year (As of June 5)
London: 2200 μ Sv / year (As of April 1)
Moscow: 964 μ Sv / year (ave. between May 27 – June 2)
Beijin: 526 μ Sv / year (ave. between May 31 – June 1)
Monitoring in Japanese Agriculture(As of July 21)
Radiation level in the air
Nigata: 403 μ Sv / year
Osaka: 368 μ Sv / year
5
Radioactivity Monitoring
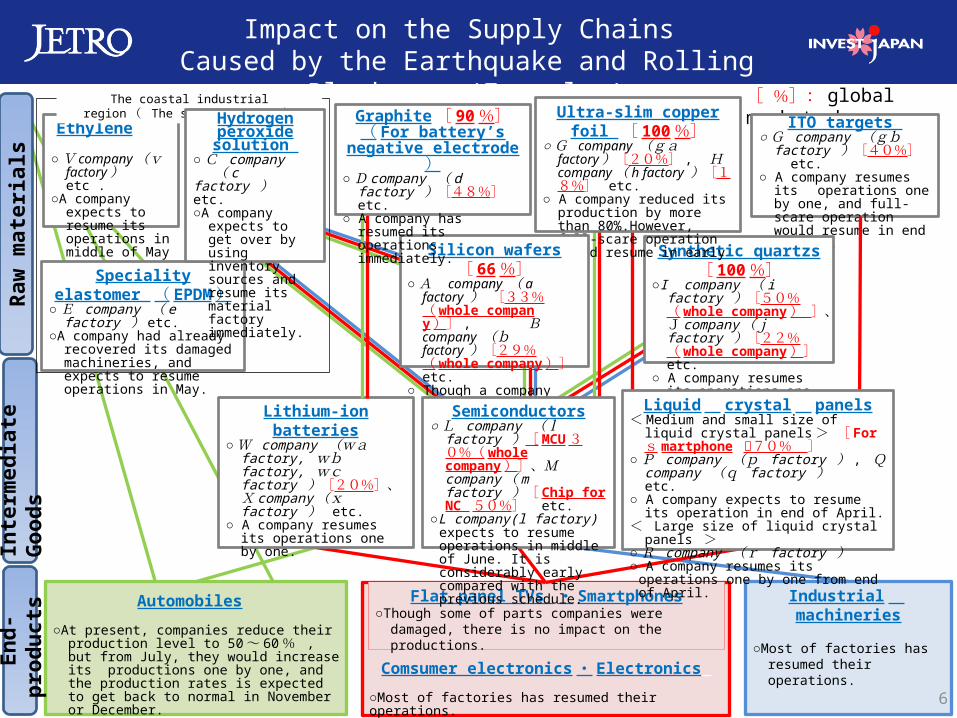
Impact on the Supply Chains Caused by the Earthquake and Rolling Blackouts (Examples)
6
Comsumer electronics ・ Electronics
○Most of factories has resumed their operations.
Automobiles ○At present, companies reduce their production
level to 50 ~ 60 % , but from July, they would increase its productions one by one, and the production rates is expected to get back to normal in November or December.
Flat panel TVs ・ Smartphones○Though some of parts companies were damaged, there
is no impact on the productions.
Industrial machineries
○Most of factories has resumed their operations.
Inte
rmed
iate
G
oods
En
d-pr
oduc
ts
Lithium-ion batteries○ W company (wa factory, wb factory, wc factory )[20%]、Xcompany (x factory ) etc.
○ A company resumes its operations one by one.
[ %]: global market share ITO targets ○ G company (gb
factory )[40%] etc.
○ A company resumes its operations one by one, and full-scare operation would resume in end of July.
Synthetic quartzs [ 100 %]○I company ( i factory )[50% ( whole
company ) ]、Jcompany (j factory )[22%( whole company )] etc.
○ A company resumes its operations one by one.
Ultra-slim copper foil [ 100 %]○ G company (ga factory )[20%] , H company ( h factory )[18%] etc.
○ A company reduced its production by more than 80%.However, full-scare operation would resume in early May.
Raw
mat
eria
ls
Ethylene ○ V company (v factory ) etc .
○A company expects to resume its operations in middle of May
Speciality elastomer ( EPDM )○ E company ( e factory )etc.
○A company had already recovered its damaged machineries, and expects to resume operations in May.
The coastal industrial region ( The stricken area )
Silicon wafers [ 66 %]○ A company ( a
factory ) [33%( whole company )] , B company (b factory )[29%( whole company )] etc.
○ Though a company reduced its production by about 40%, it resumes its operations one by one.
Graphite [ 90 %]( For battery’s negative electrode )○ D company ( d factory )[48%] etc.
○ A company has resumed its operations immediately.
Hydrogen peroxide solution ○ C company ( c factory )
etc.○A company expects
to get over by using inventory sources and resume its material factory immediately.
Semiconductors○ L company (l factory )[ MCU 30%( whole company )]、M company ( m factory )[ Chip for NC 50%] etc.
○L company(l factory) expects to resume operations in middle of June. It is considerably early compared with the previous schedule.
Liquid crystal panels< Medium and small size of liquid crystal panels > [ For s martphone 約70% ]○ P company (p factory ) , Q company (q factory ) etc.
○ A company expects to resume its operation in end of April.< Large size of liquid crystal panels >○ R company (r factory )
○ A company resumes its operations one by one from end of April.
6
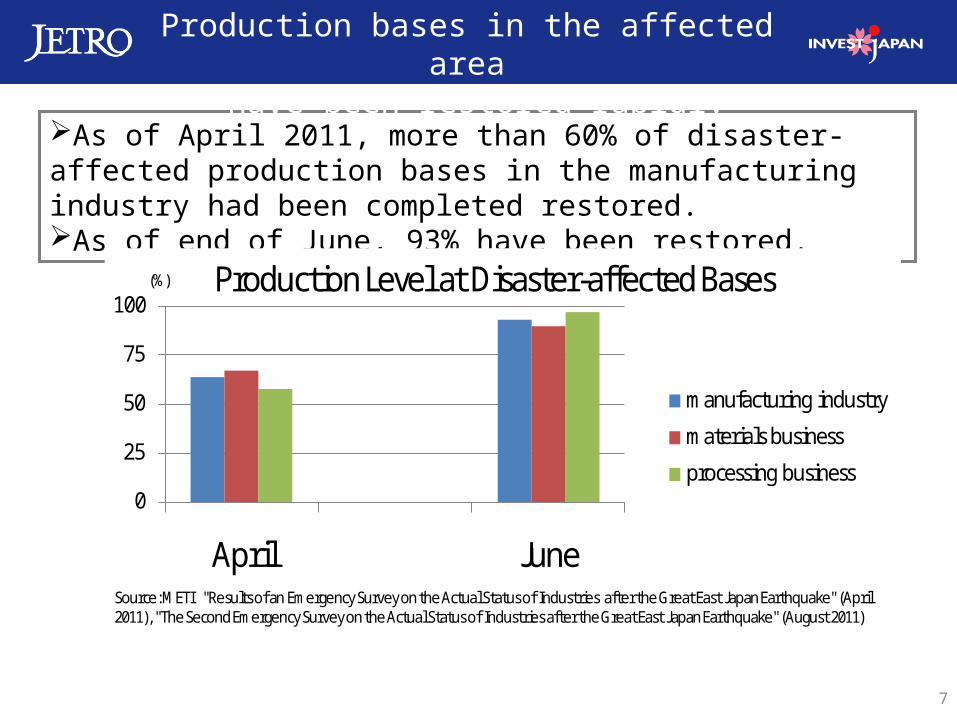
As of April 2011, more than 60% of disaster-affected production bases in the manufacturing industry had been completed restored. As of end of June, 93% have been restored.
0
25
50
75
100
April June
manufacturing industry
materials business
processing business
(%) Production Level at Disaster-affected Bases
Source: METI "Results of an Emergency Survey on the Actual Status of Industries after the Great East Japan Earthquake" (April 2011), "The Second Emergency Survey on the Actual Status of Industries after the Great East Japan Earthquake" (August 2011)
7
Production bases in the affected area have been restored rapidly
8
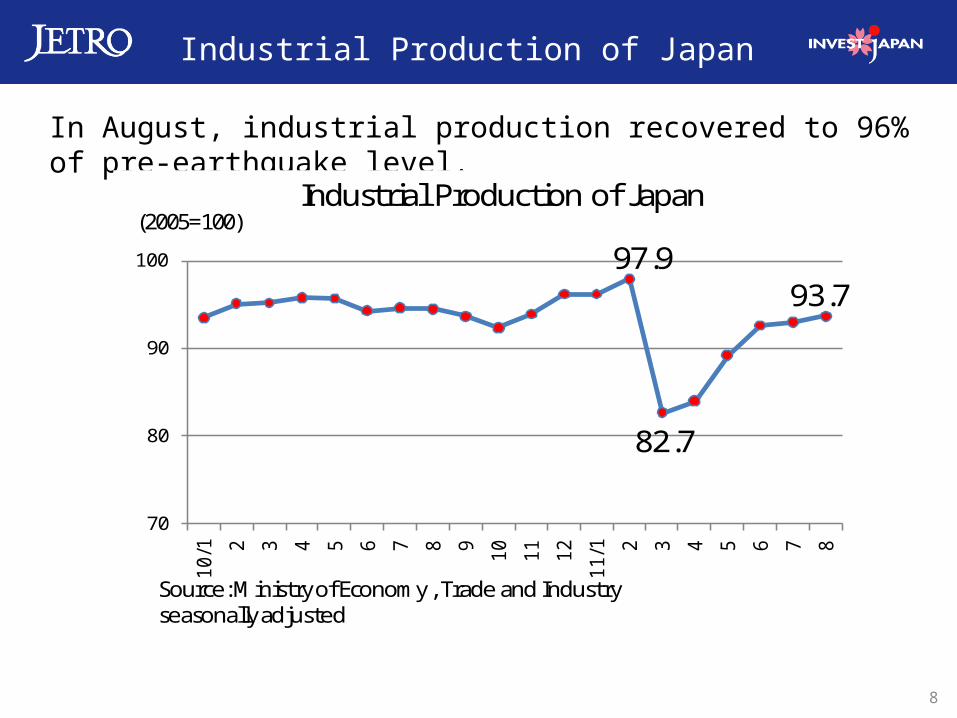
In August, industrial production recovered to 96% of pre-earthquake level.
70
80
90
100
10/1 2 3 4 5 6 7 8 9 10 11 12
11/1 2 3 4 5 6 7 8
(2005=100)
Source: Ministry of Economy , Trade and Industryseasonally adjusted
Industrial Production of Japan
97.9
82.7
93.7
Industrial Production of Japan
9
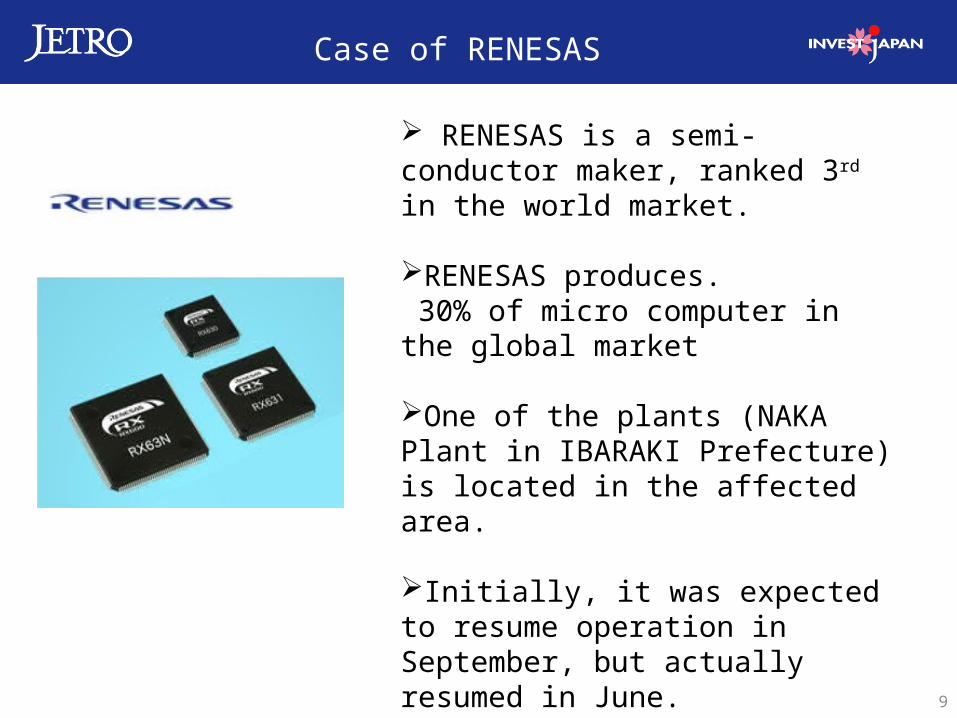
Case of RENESAS
RENESAS is a semi-conductor maker, ranked 3rd in the world market.
RENESAS produces. 30% of micro computer in the global market
One of the plants (NAKA Plant in IBARAKI Prefecture) is located in the affected area. Initially, it was expected to resume operation in September, but actually resumed in June.
10
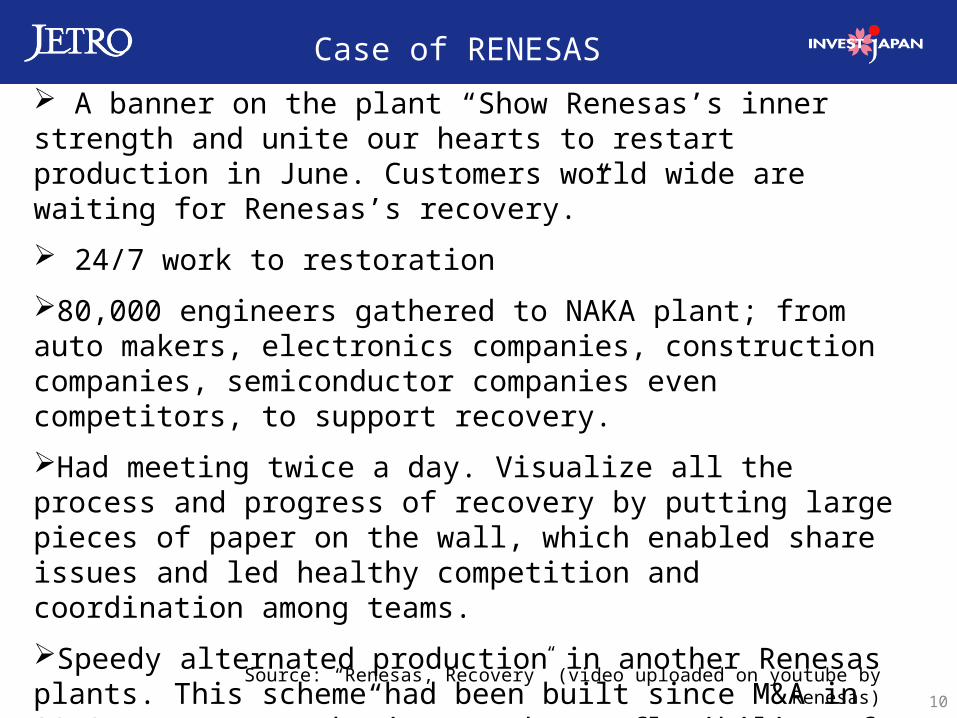
A banner on the plant “Show Renesas’s inner strength and unite our hearts to restart production in June. Customers world wide are waiting for Renesas’s recovery.” 24/7 work to restoration
80,000 engineers gathered to NAKA plant; from auto makers, electronics companies, construction companies, semiconductor companies even competitors, to support recovery. Had meeting twice a day. Visualize all the process and progress of recovery by putting large pieces of paper on the wall, which enabled share issues and led healthy competition and coordination among teams.Speedy alternated production in another Renesas plants. This scheme had been built since M&A in 2010. “FAB Network” is to enhance flexibility of production in response to sudden acceleration of demand or in emergency.
Source: “Renesas, Recovery” (video uploaded on youtube by Renesas)
Case of RENESAS
11
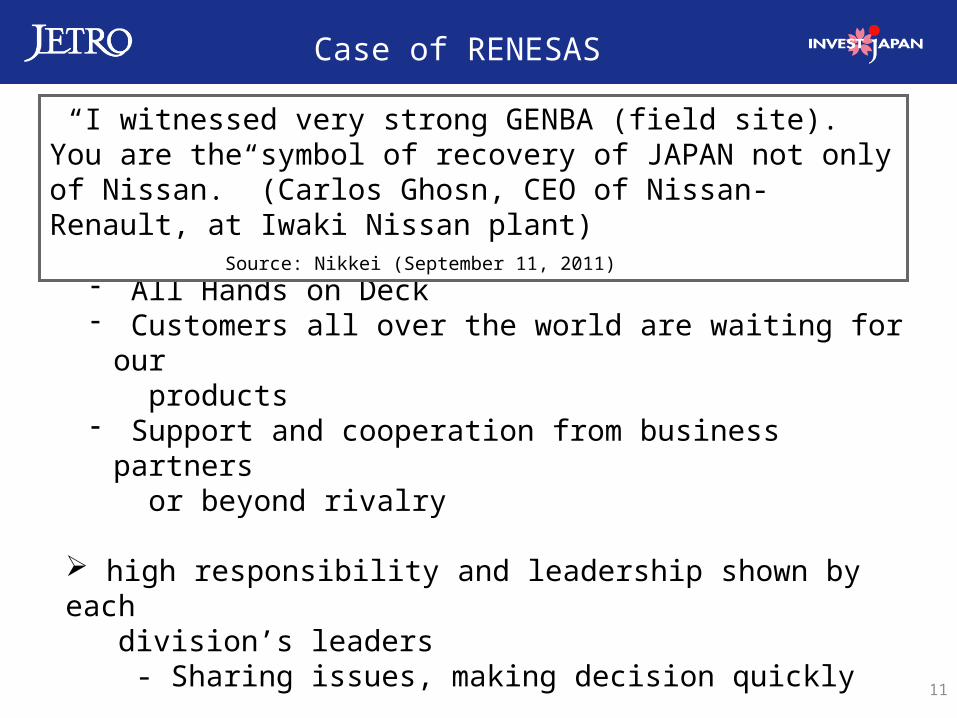
high morale toward recovery; - All Hands on Deck- Customers all over the world are waiting for our
products - Support and cooperation from business partners
or beyond rivalry
high responsibility and leadership shown by each division’s leaders - Sharing issues, making decision quickly exceeding technological capability
“I witnessed very strong GENBA (field site). You are the symbol of recovery of JAPAN not only of Nissan.” (Carlos Ghosn, CEO of Nissan-Renault, at Iwaki Nissan plant) Source: Nikkei (September 11, 2011)
Case of RENESAS
12
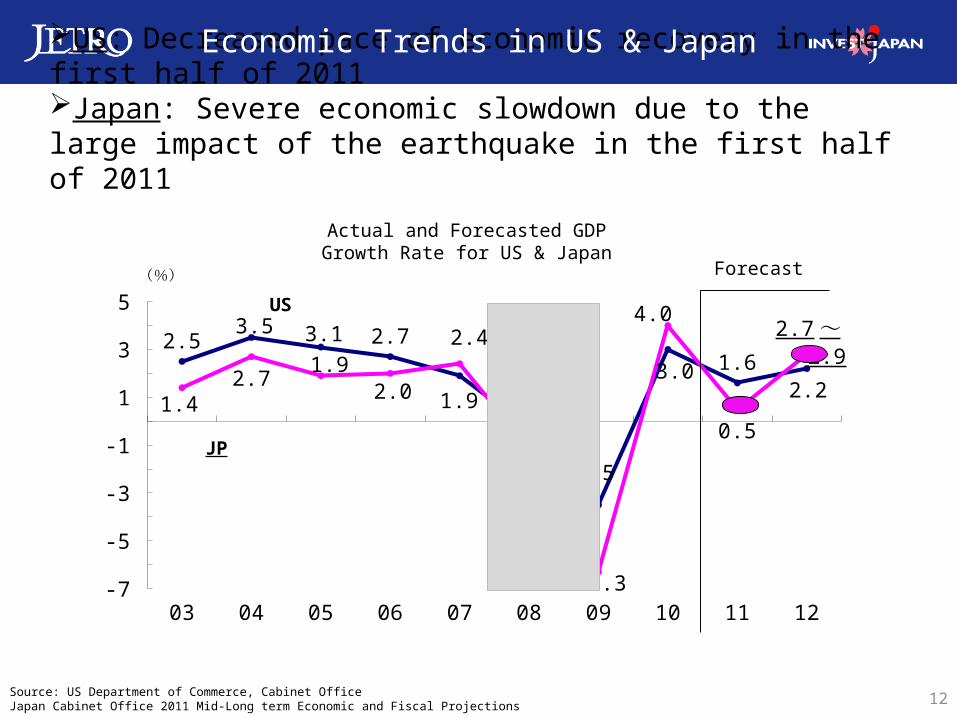
US: Decreased pace of economic recovery in the first half of 2011Japan: Severe economic slowdown due to the large impact of the earthquake in the first half of 2011
Economic Trends in US & Japan
03 04 05 06 07 08 09 10 11 12-7
-5
-3
-1
1
3
5
2.53.5 3.1 2.7
1.9 -0.3
-3.5
3.0 1.62.2
1.42.7 1.9
2.0
2.4
-1.2
-6.3
4.0
0.5JP
US見通し(%)
2.7 ~ 2.9
Actual and Forecasted GDP Growth Rate for US & Japan
Forecast
Source: US Department of Commerce, Cabinet OfficeJapan Cabinet Office 2011 Mid-Long term Economic and Fiscal Projections
2007 (Actual) 2030 (Estimate)0
2000
4000
6000
8000
10000
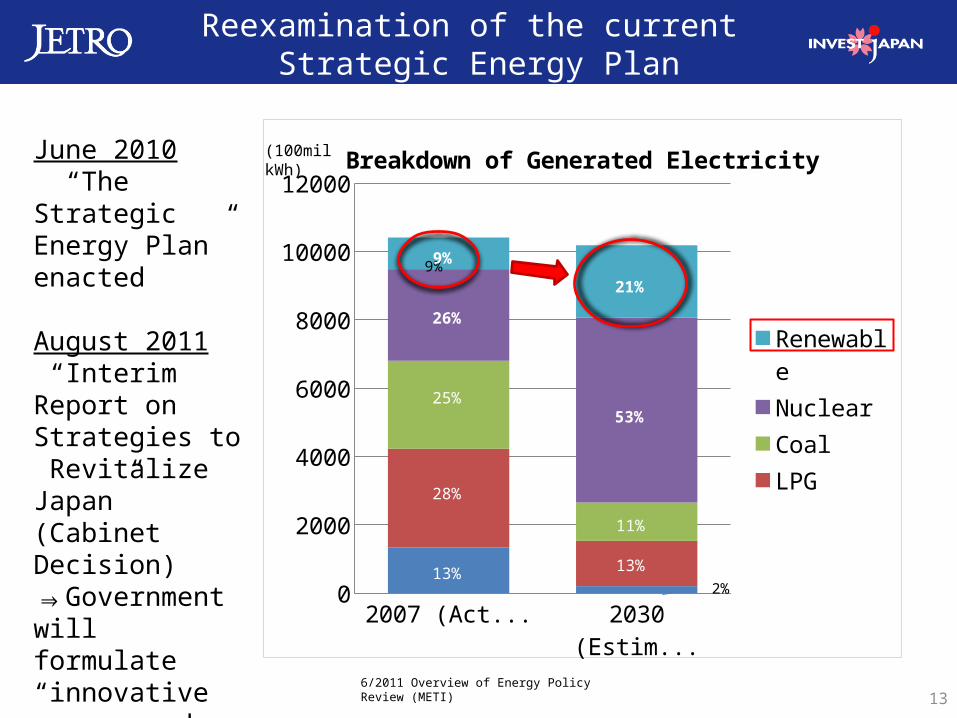
12000Breakdown of Generated Electricity
RenewableNuclearCoalLPGOil
9%
(100mil kWh)
9%
13%
28%
26%
21%
53%
11%
13%2%
25%
Reexamination of the current Strategic Energy Plan
6/2011 Overview of Energy Policy Review (METI)13
June 2010 “The Strategic Energy Plan” enacted August 2011 “Interim Report on Strategies to Revitalize Japan” (Cabinet Decision) ⇒Government will formulate “innovative energy and environmental strategies” in 2012
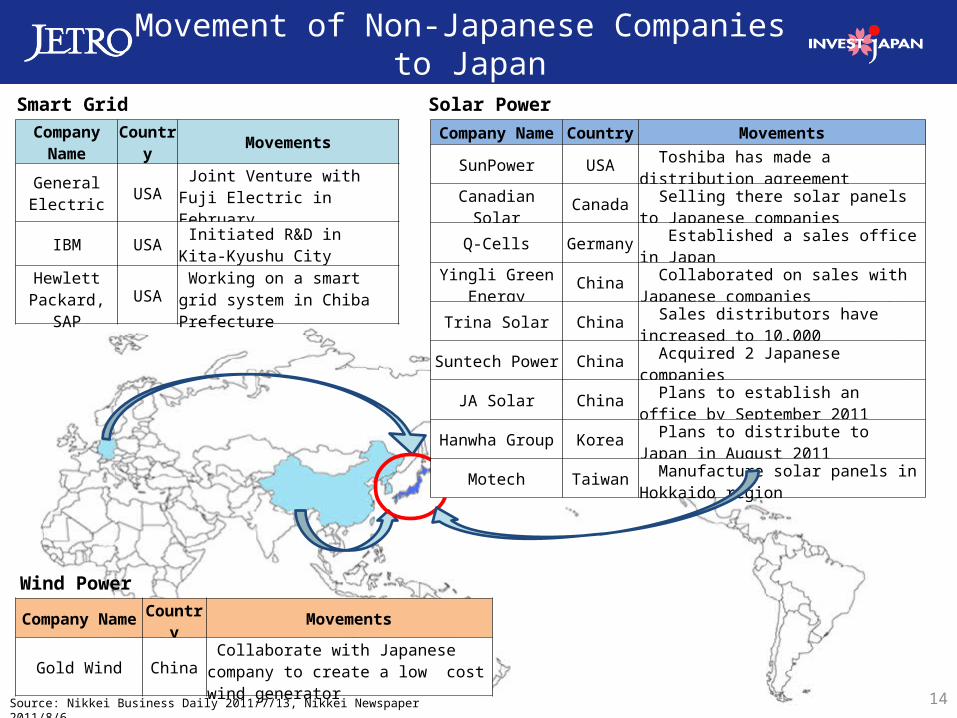
Solar PowerSmart Grid
Wind Power
Company Name Country MovementsSunPower USA Toshiba has made a distribution agreement
Canadian Solar Canada Selling there solar panels to Japanese companies
Q-Cells Germany Established a sales office in JapanYingli Green
Energy China Collaborated on sales with Japanese companies
Trina Solar China Sales distributors have increased to 10,000Suntech Power China Acquired 2 Japanese companies
JA Solar China Plans to establish an office by September 2011
Hanwha Group Korea Plans to distribute to Japan in August 2011
Motech Taiwan Manufacture solar panels in Hokkaido region
Company Name Country Movements
General Electric USA Joint Venture with Fuji Electric
in February
IBM USA Initiated R&D in Kita-Kyushu City
Hewlett Packard, SAP USA Working on a smart grid system
in Chiba Prefecture
Company Name Country Movements
Gold Wind China Collaborate with Japanese company to create a low cost wind generator
Movement of Non-Japanese Companies to Japan
Source: Nikkei Business Daily 2011/7/13, Nikkei Newspaper 2011/8/6 14
15
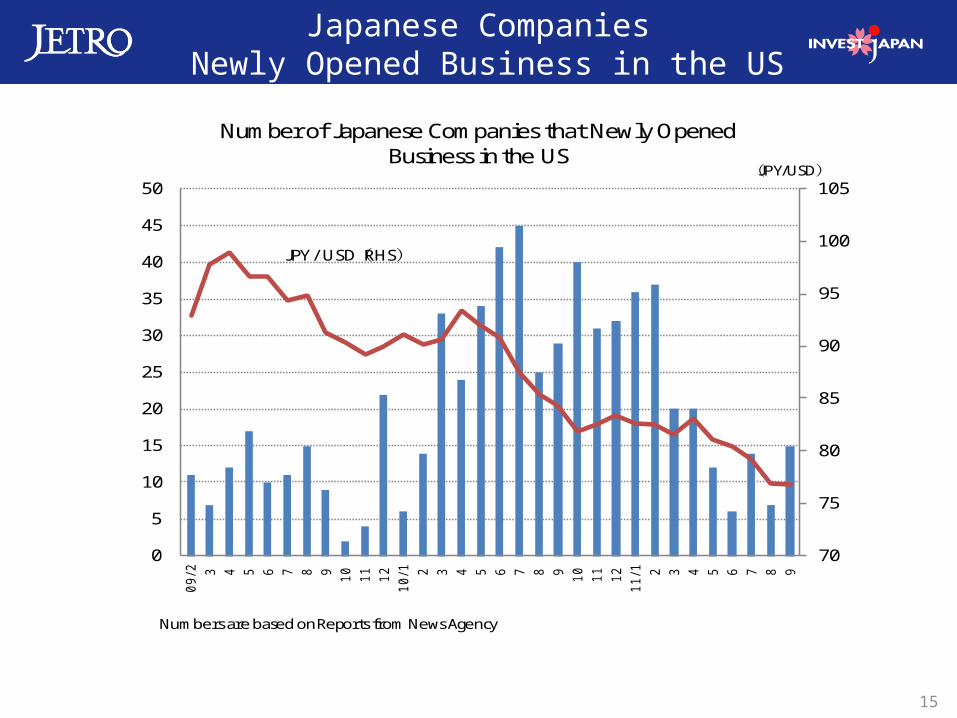
Japanese Companies Newly Opened Business in the US
70
75
80
85
90
95
100
105
0
5
10
15
20
25
30
35
40
45
5009
/2 3 4 5 6 7 8 9 10 11 1210
/1 2 3 4 5 6 7 8 9 10 11 1211
/1 2 3 4 5 6 7 8 9
Number of Japanese Companies that Newly Opened Business in the US
JPY / USD(RHS)
(JPY/USD)
Numbers are based on Reports from News Agency
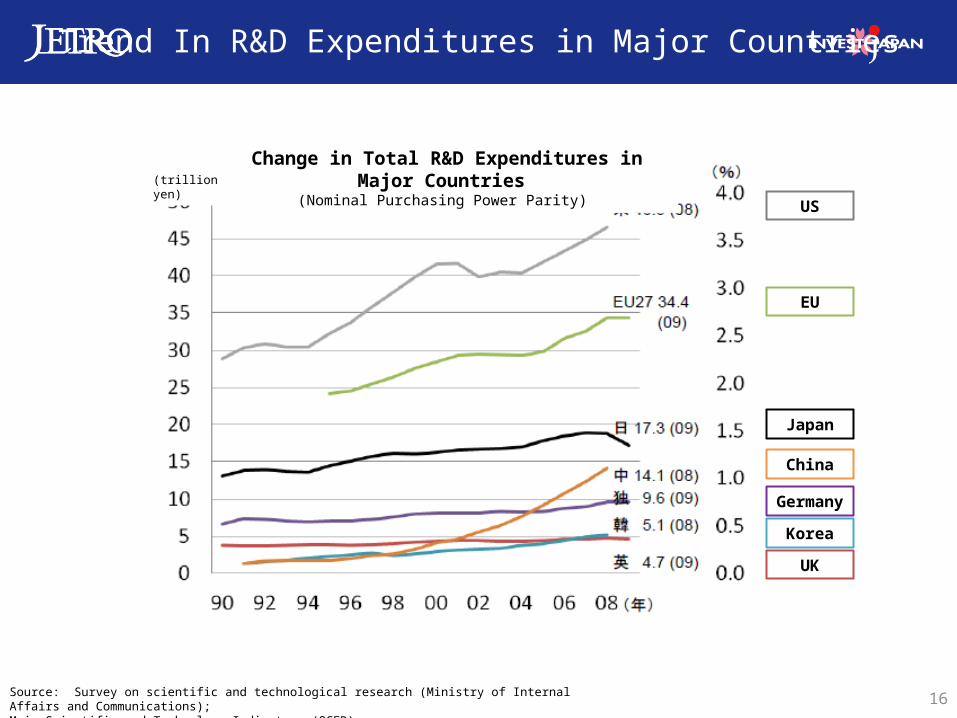
Change in Total R&D Expenditures in Major Countries (Nominal Purchasing Power Parity)
US
Japan
EU
China
Germany
Korea
UK
(trillion yen)
Source: Survey on scientific and technological research (Ministry of Internal Affairs and Communications); Main Scientific and Technology Indicators (OCED) 16
Trend In R&D Expenditures in Major Countries
THANK YOU
For more information, please visit www.jetro.org