Embed Size (px)
Citation preview
Liab
ility
Str
ateg
ies
Gro
up
Glo
bal M
arke
ts
CFO Views
January 2006
Authors
Henri Servaes Professor of Finance London Business School
Peter Tufano Sylvan C. Coleman Professor of Financial Management Harvard Business School
Editors
James Ballingall Capital Structure and Risk Management Advisory Deutsche Bank +44 20 7547 6738 [email protected]
Adrian Crockett Head of Capital Structure and Risk Management Advisory, Europe & Asia Deutsche Bank +44 20 7547 2779 [email protected]
Roger Heine Global Head of Liability Strategies Group Deutsche Bank +1 212 250 7074 [email protected]
CFO Views on the Importance and Execution of the Finance Function

CFO Views on the Importance and Execution of the Finance Functions January 2006
Liability Strategies Group2
Executive Summary
This paper discusses the views and attitudes of Corporate CFOs about the finance function. The major findings are:
The Value of the Finance Function
The finance function contributes approximately 11% to the value of the firm
The finance function contributes most value in high growth and in non-investment grade companies
CFOs see the lack of managerial resources as being the single greatest constraint on growth with the ability to raise external funds as the least limiting factor
The Relative Importance of Individual Functions
Overall, CFOs believe that most finance functions:
Create value
Are performing satisfactorily
Require the same or slightly more resources
There is generally a positive correlation between satisfaction and value creation. Specific finance activities that are both important and well executed include:
Bank relationships
Debt issuance and management
Capital structure
Investor relations
whereas activities that are important but less well executed include:
Working capital management
Decision making tools and processes, i.e.,
- Making investment decisions
- Merger, acquisition and disposal decisions
- Financial planning and analysis
- Management reporting/accounting
Risk management
CFOs want additional resources devoted especially to those activities which they judge to be important but less well executed
Shareholder Composition & Market Valuation
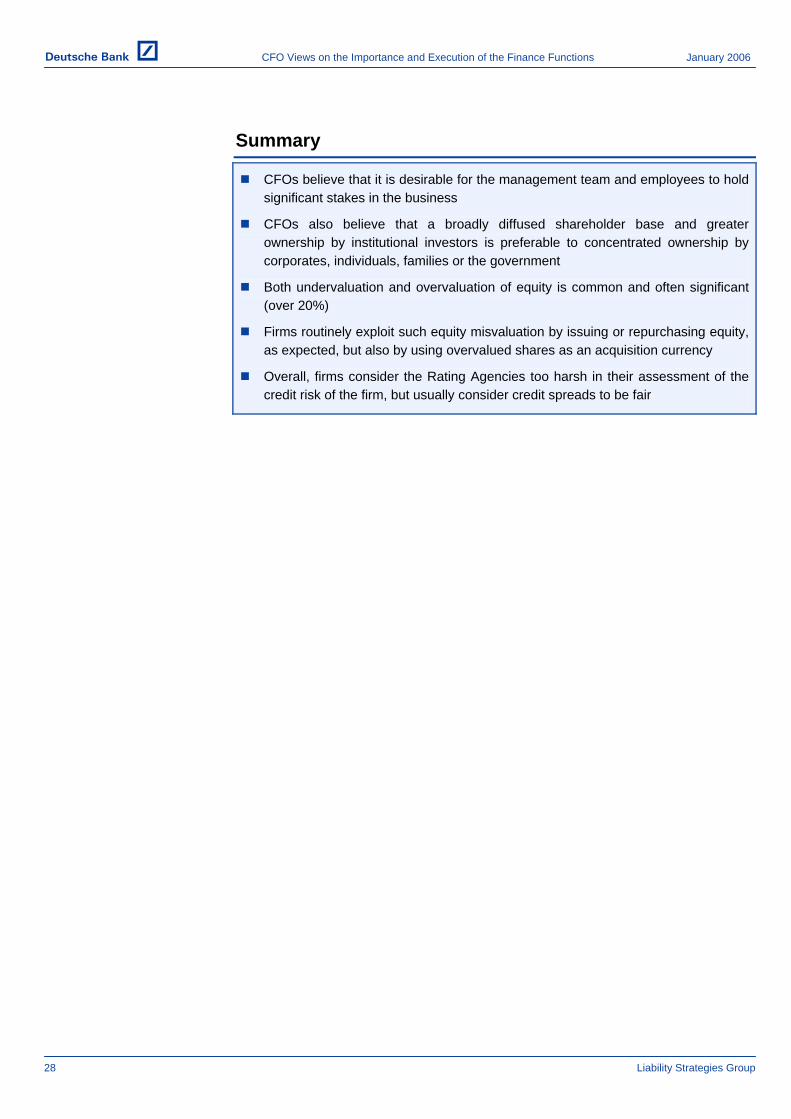
CFOs believe that it is desirable for the management team and employees to hold significant stakes in the business
CFOs also believe that, a broadly diffused shareholder base and greater ownership by institutional investors is preferable to concentrated ownership by corporates, individuals, families or the government

January 2006 CFO Views on the Importance and Execution of the Finance Functions
Liability Strategies Group 3
Both undervaluation and overvaluation of equity is common and often significant (over 20%)
Firms routinely exploit such equity misvaluation by issuing or repurchasing equity, as expected, but also by using overvalued shares as an acquisition currency
Overall, firms consider the Rating Agencies too harsh in their assessment of the credit risk of the firm, but usually consider credit spreads to be fair
Choosing Between Unpleasant Options
Globally, CFOs rank undesirable outcomes in the following order (most to least painful):
Succumb to a hostile takeover
Sell assets at a discount to their fair value
Raise new equity
Borrow and allow credit rating to fall
Cut strategic investment
Sell assets at their fair value
Borrow up to the limit of the credit rating
Cut deferrable investment
Cut dividends
In Europe and Asia, the willingness of firms to cut their dividends reduces their signalling power and hence investors are less likely to reward dividend increases with enhanced valuation
In the US, cutting dividends is considered more painful which implies that dividends continue to have notable signalling effects
The ordering of unpleasant corporate outcomes, and their mapping to credit rating changes, may offer managers and boards the ability to translate abstract risks and probabilities into likelihoods of tangible outcomes

CFO Views on the Importance and Execution of the Finance Functions January 2006
Liability Strategies Group4
Contents
Table of Contents Introduction .......................................................................................................................6
This Paper ....................................................................................................................6 Global Survey of Corporate Financial Policies & Practices..........................................6 Related Papers .............................................................................................................6 Notation and Typographical Conventions.....................................................................7
Overall Value of the Finance Function..............................................................................8 Theory...........................................................................................................................8 Overall Results .............................................................................................................8 Segmental Results......................................................................................................10 Additional Evidence ....................................................................................................11 Summary.....................................................................................................................12
Relative Importance of Individual Functions ...................................................................13 Overall Results ...........................................................................................................13
Value ......................................................................................................................14 Satisfaction.............................................................................................................14 Change in Resources Needed ...............................................................................16
Relationship between Value and Satisfaction ............................................................16 Important and Satisfactory .....................................................................................19 Opportunities: Important but in Need of Improvement ...........................................19 The “Less Important” Quadrants ............................................................................19
Relationship between Resources and Satisfaction ....................................................20 Summary.....................................................................................................................21
Shareholder Composition & Market Valuation................................................................22 Theory.........................................................................................................................22 Corporate Orientation .................................................................................................22 Shareholder Composition ...........................................................................................23 Fairness of Valuation ..................................................................................................23
Equity......................................................................................................................23 Debt ........................................................................................................................27
Summary.....................................................................................................................28 Choosing Between Unpleasant Outcomes .....................................................................29
Theory.........................................................................................................................29 Overall Results ...........................................................................................................29 Rating Downgrades ....................................................................................................29 Dividend Payments.....................................................................................................32 The Pain Index............................................................................................................33 Summary.....................................................................................................................35

January 2006 CFO Views on the Importance and Execution of the Finance Functions
Liability Strategies Group 5
Table of Figures Figure 1: CFO View of Value of Finance Functions..........................................................9 Figure 2: CFO View of Value of Finance Function - Segmental Breakdown..................10 Figure 3: Factors Limiting Investment.............................................................................11 Figure 4: Time Dedicated to Different Finance Functions ..............................................13 Figure 5: Value of Different Finance Functions ..............................................................14 Figure 6: Satisfaction with Different Finance Functions..................................................15 Figure 7: Change in Resources Needed ........................................................................16 Figure 8: Satisfaction versus Value ................................................................................18 Figure 9: Shareholder Orientation...................................................................................22 Figure 10: Preferred Change in Shareholder Mix ...........................................................23 Figure 11: Frequency of Equity Misvaluation..................................................................24 Figure 12: Average Equity Misvaluation .........................................................................24 Figure 13: Greatest Equity Misvaluation.........................................................................25 Figure 14: Response to Misvaluation..............................................................................26 Figure 15: Fairness of Credit Spread..............................................................................27 Figure 16: Fairness of Ratings........................................................................................27 Figure 17: Lowest Rating Accepted................................................................................30 Figure 18: Number of Notches of Downgrade Accepted ................................................31 Figure 19: Action if Unable to Maintain Dividends ..........................................................32 Figure 20: Action if Unable to Maintain Dividends (Mean Values by Region) ................33 Figure 21: Pain Index......................................................................................................34
Table of Appendices Appendix I: Detailed Results...........................................................................................37
Acknowledgments The thanks of the Authors and Editors are due to various parties who have assisted in the preparation and testing of the survey itself, the compilation of results and the preparation of these reports. We would specifically like to thank Sophia Harrison of Deutsche Bank for her extensive work on data analysis and presentation of materials and Steven Joyce of Harvard University for his research assistance. Our thanks are also due to the members of Deutsche Bank’s Liability Strategies Group and other specialists throughout Deutsche Bank for their useful insights throughout the process; to the project’s secondary sponsor, the Global Association of Risk Professionals (GARP), and GARP members for their assistance in preparing and testing the survey questions and website; and to the technology providers, Prezza Technologies, for developing the survey website and especially for accommodating last minute changes with very short deadlines. Finally, we would like to thank Deutsche Bank’s corporate clients who participated in the survey for their time and effort. Without them this project would not have been possible.

CFO Views on the Importance and Execution of the Finance Functions January 2006
Liability Strategies Group6
Introduction
This Paper This paper provides a synopsis of the views and evaluations of corporate Chief Financial Officers (CFOs) in four main areas:
Overall Value of the Finance Function: What is the contribution of the finance function to the value of the firm?
Relative Importance of Individual Functions: Where are the opportunities for improvement in areas within the finance function?
Shareholder Composition & Market Valuation: For whose benefit is the firm run? What is the ideal mix of shareholders? In the view of CFOs, how fairly does the market price their company’s equity and debt? How have CFOs reacted to perceived mispricing?
Choosing Between Unpleasant Outcomes: How do CFOs act when faced with a choice between various unpleasant options?
Global Survey of Corporate Financial Policies & Practices The empirical evidence in this paper is drawn from a survey conducted during mid 2005 by Professor Henri Servaes of London Business School and Professor Peter Tufano of Harvard Business School. The project was originated and sponsored by Deutsche Bank AG with the Global Association of Risk Professionals (GARP) acting as secondary sponsor.
334 companies globally participated with responses distributed widely by geography and by industry. Further details of the sample can be found in the note “Survey Questions and Sample” which is available at www.dbbonds.com/lsg/reports.jsp.
Related Papers In addition to this paper, five other papers drawing on the results of the survey include:
Corporate Capital Structure
Corporate Debt Structure
Corporate Liquidity
Corporate Dividend Policy
Corporate Risk Management
All these papers are available at www.dbbonds.com/lsg/reports.jsp. The website also contains a streaming video of Professors Servaes and Tufano presenting an overview of the results at a Deutsche Bank hosted conference.

January 2006 CFO Views on the Importance and Execution of the Finance Functions
Liability Strategies Group 7
Notation and Typographical Conventions
The symbol x denotes the mean of a dataset, while x~ denotes the median. N denotes the size of the dataset. All questions in the survey were optional and some questions were not asked directly, depending on the answers to previous questions. Therefore, the number of responses, N, to different questions varies and is shown for each question. Items in italics indicate that the term appeared as one of the answer options in the survey question. Items underlined indicate a reference to one of the other papers in this series. Due to rounding, the numbers in some figures may not add up to the 100% or the total shown.
Unless otherwise stated, all data in this document is drawn from the results of The Global Survey of Corporate Financial Policies and Practices.

CFO Views on the Importance and Execution of the Finance Functions January 2006
Liability Strategies Group8
Overall Value of the Finance Function
Theory Classical finance theory, exemplified by the pioneering work of Modigliani and Miller1, asserts that in the absence of imperfections or frictions (such as taxes, information asymmetries and financial distress costs) financial policies, such as capital structure, risk management or dividend policies, neither add nor destroy firm value. Over the past half century, academic work has considered how various imperfections make these financial policies value-relevant. Nevertheless, it is less obvious how much value these policies add to a firm, as it is not possible to strip out this contribution relative to the other elements of the corporation.
We would expect the value contribution made by these financial policies to be a result of the scope for possible contribution as well as the quality of the decision making and execution. In the simplest interpretation, the scope for value creation should be greatest in firms which face the most extreme imperfections yet have the greatest latitude for financial decision making. The quality of decision making can only be measured by the satisfaction with the choices made and executed.
Overall Results In the survey, we asked CFOs two questions to gauge their assessment of the contribution of the finance activities to the firm. In the first, we asked “How much value, as a percentage of market capitalization, does the finance function add or subtract to your company?” The respondents were offered the following options:
Adds 0%–2.5%
Adds 2.6%–5%
Adds 5.1%–7.5%
…
Adds 17.6%–20%
Adds Over 20%
together with options for subtracting value.
The figure below shows the distribution of responses. Each bar represents the proportion of CFOs who chose that particular range, so the percentages sum to 100%. The percentages along the horizontal axis show the beginning and end of each range with the far right bar being “Over 20%”.2
1 Modigliani, F. and M. Miller, 1958, The Cost of Capital, Corporation Finance and the Theory of Investment, American Economic Review 48 (June 1958), 261-297. 2 Similar figures in the remainder of this paper and series should be interpreted in the same manner.

January 2006 CFO Views on the Importance and Execution of the Finance Functions
Liability Strategies Group 9
Q2.4: "How much value, as a percentage of Market Capitalization, is the f inance function judged to add or subtract?" N=199
Figure 1: CFO View of Value of Finance Functions
14%
9%
3%
7%
11%
21%16%
13%
7%
0%
5%
10%
15%
20%
25%
Value of Finance Function
0% 2.5% 5% 7.5% 10% 12.5% 15% 17.5% 20%
Although the option of negative value was offered, all CFOs responded that the finance function added positive value, an unsurprising result. The mean value added is 10.8%3 with a median and mode of “7.6%–10%”.
We also asked CFOs to estimate how the Chief Executive Officer (CEO) of their firm might answer the same question. They felt that CEOs would have a slightly less favorable evaluation with a mean of 9.7% of firm value and 2% of CEOs judging that the finance function actually subtracts value.
3 The midpoint of each range was taken in the computation of the mean. 21.25% was used for observations in the 20%+ category.

CFO Views on the Importance and Execution of the Finance Functions January 2006
Liability Strategies Group10
Segmental Results In the following figure we segment4 the results of the CFO’s view of the overall finance function by listing, rating category, industry and region.5
Industry x x x NAll 11% 9% 199
ListingListed 11% 9% 126Unlisted 11% 9% 73
Rating CategoryNon-Investment Grade 13% 11% 23Investment Grade 10% 9% 60
IndustryTelecommunications 18% 23% 7Consumer 13% 11% 36Technology 13% 11% 14Business Services 12% 11% 5Transportation Services 11% 9% 13Metals and Mining 11% 9% 7Undisclosed & Other 10% 9% 17Chemicals 10% 9% 11Automobiles 9% 8% 6Oil and Gas 9% 9% 8Industrials & Materials 9% 9% 43Health Care Pharmaceuticals 9% 6% 9Media 9% 9% 8Utilities 9% 9% 10
RegionAustralia & New Zealand 16% 19% 5Asia excluding Japan 15% 14% 29North America 11% 11% 22Germany 10% 9% 39Latin America 10% 9% 9Western Europe ex. Germany 10% 9% 80Japan 8% 6% 10
Q2.4: "How much value, as a percentage of Market Capitalization, is the f inance function judged to add or subtract?"
Figure 2: CFO View of Value of Finance Function - Segmental Breakdown_ ~_
The finance function adds nearly identical value to both listed and unlisted firms. There is a marked difference between firms with investment grade ratings and non-investment
4 Generally, we will not show segmental breakdowns in the main text but have provided such breakdowns in Appendix I. 5 The results for the industries Consumer Finance and Diversified/Conglomerates and for the regions Eastern Europe, Middle East & Africa and Undisclosed are omitted because the sub-sample size was less than five. See the introduction to Appendix I for more details.

January 2006 CFO Views on the Importance and Execution of the Finance Functions
Liability Strategies Group 11
grade ratings, probably because CFOs judge that it is harder to manage the finances of a non-investment grade firm and so there is greater opportunity for value creation.
CFOs in high growth industries such as telecommunications, technology and business services, indicate a higher than average valuation for the finance function, probably reflecting a belief by CFOs that their function adds more value in relatively fast changing environments. Consistent with this interpretation, we find a significant positive correlation between expected capital raising needs over the next five years and the CFO’s estimate of the value of the finance function.
Additional Evidence Overall, the results of Question 2.4 (above) show that CFOs judge that the finance function adds approximately 11% to the value of the firm. We might suspect that CFOs would overstate the value of the finance function so we also examine the results of Question 2.9, which shows that CFOs exhibit a balanced view of the finance function within the overall business. We asked respondents to rank the factors that limit their firms’ ability to take on “substantial investment projects” on a six point scale, with 0 being “Not Limiting” and 5 being “Very Limiting”.
In the figure below, the first column shows the four different factors that were listed in the survey. The columns labeled 0, 1, 2, 3, 4 and 5 show the proportion of respondents who chose that option. These percentages sum to 100% across a given row. The final three columns show the mean, median and number of datapoints.6
Not Limiting Very Limiting0 1 2 3 4 5
Managerial Resources 20% 14% 15% 27% 22% 3% 2.3 3.0 235
Legal and regulatory requirements 23% 19% 20% 21% 13% 5% 2.0 2.0 232
Internal funds 32% 20% 13% 14% 18% 3% 1.8 1.0 230
Ability to raise external funds 38% 26% 13% 13% 10% 1% 1.3 1.0 230Q2.9: "Which of the follow ing factors have limited your ability to take on substantial investment projects?"
Figure 3: Factors Limiting Investment
x Nx_ ~
CFOs recognize that the scarcity of management skills, time and talent is often a more significant drag on business development than the inability to raise funds.
As expected, there were some differences in these results between subgroups. Both listed and unlisted firms rank the constraints similarly. However, the ability to raise internal and external funds was ranked as a much more severe impediment by firms with non-investment grade ratings7 compared to firms with investment grade ratings.
6 Similar figures in the rest of this paper should be interpreted in a similar manner. 7 Non-investment grade firms comprised a relatively small proportion of the sample with 25 non-investment grade companies answering this particular question. See Appendix I, Question 2.9 for more details.

CFO Views on the Importance and Execution of the Finance Functions January 2006
Liability Strategies Group12
Summary
The finance function contributes approximately 11% to the value of the firm
The finance function contributes most value in high growth and in non-investment grade companies
CFOs see the lack of managerial resources as being the single greatest constraint on growth with the ability to raise external funds as the least limiting factor

January 2006 CFO Views on the Importance and Execution of the Finance Functions
Liability Strategies Group 13
Relative Importance of Individual Functions Regardless of the CFO’s overall view of the value of the finance function, it is interesting to investigate which individual functions are judged to be well executed and which are poorly executed. There is little theory in this area so we proceed directly to the results.
Overall Results We asked CFOs to estimate how many hours per month they spent on various finance activities. Their responses indicate that they are busy people spending approximately 240 hours a month8 overseeing the various tasks that comprise the finance activities in their firm. The figure below shows how many hours per month CFOs spend on various tasks.
1h- 2d- 4d-1d 3d 5d
Management reporting/accounting 3% 20% 50% 21% 6% 20.8 20.0 215
Financial planning and analysis 3% 24% 45% 19% 9% 20.8 20.0 216
Investor relations 12% 24% 35% 20% 9% 19.0 20.0 190
Bank relationships 7% 33% 36% 10% 14% 18.2 20.0 221
Making investment decisions 10% 29% 42% 15% 3% 16.4 20.0 217
Merger, acquisition & disposal decisions 18% 29% 34% 16% 4% 15.3 20.0 202
External financial reporting/accounting 8% 39% 36% 16% 2% 15.2 20.0 212
Working capital management 13% 35% 35% 10% 7% 14.9 20.0 220
Risk management 7% 49% 26% 11% 7% 14.1 4.0 218
Cash management 25% 32% 24% 10% 9% 13.7 4.0 220
Debt issuance and management 22% 38% 23% 9% 7% 12.6 4.0 206
Tax management 13% 50% 31% 3% 2% 10.5 4.0 214
Regulatory compliance 20% 49% 19% 8% 3% 10.1 4.0 201
Internal audit 21% 53% 19% 5% 1% 8.3 4.0 206
Accounting policies 26% 49% 18% 5% 1% 8.0 4.0 212
Capital Structure 31% 49% 17% 2% 0% 6.5 4.0 207
Pension management 49% 41% 9% 1% 1% 4.5 4.0 175
Dividend & share buyback policy 55% 33% 11% 1% 1% 4.3 0.5 188
Equity Issuance 67% 24% 7% 2% 1% 3.5 0.5 166
Figure 4: Time Dedicated to Different Finance Functions
Q2.7: "How much time do you spend on each of the follow ing f inance functions over the course of a month?" h = hours, d = days. x and x are measured in hours
≤1h >5d Nx x_ ~
_ ~
This description of how CFOs spend their time does not necessarily indicate those areas that contribute the most value to the firm, work the best, or need additional
8 Assuming an 8 hour day and taking the midpoint of each range. “≤1 hour” is assumed to be 0.5 hours while “>5 days” is assumed to be 5.5 days (44 hours).

CFO Views on the Importance and Execution of the Finance Functions January 2006
Liability Strategies Group14
resources. Accordingly, we asked CFOs to rank the various finance sub-functions in three areas:
Value
Satisfaction
Change in Resources Required
The rankings are shown in the figures below.
Value
Finance Function x x x NCapital structure 3.3 4.0 238
Debt issuance and management 3.3 4.0 231
Working capital management 3.3 4.0 245
Bank relationships 3.3 4.0 244
Tax management 3.3 4.0 240
Making investment decisions 3.2 3.0 240
Financial planning and analysis 3.2 3.0 245
Risk management 3.2 3.0 245
Merger, acquisition and disposal decisions 3.2 3.0 227
Management reporting/accounting 3.2 3.0 241
Cash management 3.2 3.0 244
Investor relations 3.0 3.0 214
External financial reporting/accounting 2.9 3.0 239
Regulatory compliance 2.9 3.0 231
Accounting policies 2.8 3.0 240
Internal audit 2.7 3.0 230
Dividend & share buyback policy 2.6 3.0 214
Equity issuance 2.5 3.0 193
Pension management 2.4 2.0 197
Q2.5: "How valuable do you believe the follow ing f inance functions are to the company?" Scale w as Not Valuable (0) to Very Valuable (4).
Figure 5: Value of Different Finance Functions _ ~_
The figure shows that CFO’s view all finance functions as valuable. Of the top five, all of which had a median of 4.0, three relate to raising debt capital to support the firm:
Capital structure
Debt issuance and management
Bank relationships
Two of these areas will be discussed in significant detail in our papers on Corporate Capital Structure and Corporate Debt Structure.
Satisfaction

January 2006 CFO Views on the Importance and Execution of the Finance Functions
Liability Strategies Group 15
In a similar vein, we show the ranking of finance functions in terms of satisfaction.
Finance Function x x x NBank relationships 1.3 1.0 231
Debt issuance and management 1.1 1.0 218
Investor relations 0.9 1.0 200
External financial reporting/accounting 0.9 1.0 227
Tax management 0.9 1.0 226
Capital structure 0.8 1.0 221
Cash management 0.8 1.0 231
Regulatory compliance 0.8 1.0 207
Management reporting/accounting 0.8 1.0 228
Risk management 0.8 1.0 232
Financial planning and analysis 0.7 1.0 231
Accounting policies 0.7 1.0 225
Dividend & share buyback policy 0.7 1.0 197
Equity issuance 0.7 1.0 178
Making investment decisions 0.6 1.0 223
Merger, acquisition and disposal decisions 0.5 1.0 212
Working capital management 0.5 1.0 228
Internal audit 0.5 1.0 218
Pension management 0.4 0.0 185
Q2.6: "How satisf ied are you w ith the performance of the follow ing f inance function?" Scale w as Very Dissatisf ied (-2) to Very Satisf ied (2).
Figure 6: Satisfaction with Different Finance Functions_ ~_
In terms of satisfaction, CFOs indicate that they are broadly satisfied with all finance functions, with positive means and medians for all functions. There are, however, notable differences in the ordering of the CFO’s view of value and satisfaction. This implies that there are areas where the CFO perceives possible value but is less satisfied with actual performance. These are areas of possible improvement.

CFO Views on the Importance and Execution of the Finance Functions January 2006
Liability Strategies Group16
Change in Resources Needed
Finance Function x x x N
Risk management 0.7 1.0 221
Working capital management 0.6 0.0 220
Financial planning and analysis 0.4 0.0 221
Making investment decisions 0.4 0.0 216
Tax management 0.4 0.0 216
Cash management 0.3 0.0 219
Merger, acquisition and disposal decisions 0.3 0.0 207
Investor relations 0.3 0.0 192
Management reporting/accounting 0.2 0.0 217
Capital structure 0.2 0.0 212
Internal audit 0.2 0.0 207
Debt issuance and management 0.2 0.0 207
Bank relationships 0.2 0.0 219
Pension management 0.1 0.0 176
Accounting policies 0.1 0.0 213
Dividend & share buyback policy 0.1 0.0 190
External financial reporting/accounting 0.1 0.0 213
Regulatory compliance 0.0 0.0 201
Equity issuance 0.0 0.0 171
Q2.8: "Do you think your company should be devoting more, less, or about the same resources to the follow ing f inance functions?" Scale w as Substantially Less (-2) to Substantially More (2).
Figure 7: Change in Resources Needed _ ~_
Overall, these results indicate that CFOs would like more resources for all finance functions. However, Risk management clearly stands out as an area requiring the largest increase in resources and our paper on Corporate Risk Management explores this area in more detail. In addition, the working capital function is identified as another function that needs additional resources, consistent with the judgment that it was a high-value but low satisfaction activity.
Relationship between Value and Satisfaction Although the analysis of which functions rank relatively higher or lower than others shows some interesting results, when we cross tabulate the results of each question against one another more valuable insights emerge.
Figure 8 plots the mean level of value against the levels of satisfaction for each of the functions. The horizontal and vertical lines represent the mean levels for each of these functions. The upper right quadrant represents functions that add more value and with which CFOs are more satisfied; it can be thought of as the best-performing segment of the finance functions. The bottom right quadrant represents functions with above average value potential, but below average satisfaction; these functions are ones that

January 2006 CFO Views on the Importance and Execution of the Finance Functions
Liability Strategies Group 17
have the most opportunity for improvement. The remaining two quadrants represent successful, but less valuable functions (top left), and less satisfactory and less important functions (bottom left.).
We would hope to see an upward sloping trend in the diagram, with higher satisfaction associated with higher value. Indeed, the results presented in Figure 8 do generally follow an upward sloping line, but the exceptions to this pattern provide opportunities for CFOs.

January 2006
Liability Strategies Group
CFO Views on the Importance and Execution of the Finance Function
18
Figure 8: Satisfaction versus Value
Capital structure
Debt issuance and management
Equity issuance Dividend & share buyback policy
Tax management
Risk management
Investor relations
Bank relationships
Pension management
Cash management
Working capital management
Making investment decisions
Merger, acquisition and disposal decisions
Internal audit
Management reporting/accounting
External financial reporting/accounting
Accounting policiesFinancial planning and analysis
Regulatory compliance
0.00
0.25
0.50
0.75
1.00
1.25
1.50
1.75
2.25 2.50 2.75 3.00 3.25 3.50Value
Sat
isfa
ctio
n
Above Average Satisfaction, Below Average Value
Above Average Satisfaction,Above Average Value
Below Average Satisfaction,Above Average Value
Below Average Satisfaction, Below Average Value

January 2006 CFO Views on the Importance and Execution of the Finance Functions
Liability Strategies Group 19
Important and Satisfactory
Debt capital raising activities have value creating potential and satisfactory execution. They include:
Bank relationships
Debt issuance and management
Capital structure
Investor relations, while slightly less valuable, also falls into this quadrant as do the Cash management and Tax management functions. CFOs have identified a large segment of the traditional treasury functions as being important and having satisfactory performance. Other papers in this series provide detailed survey results on many of these subjects.
Opportunities: Important but in Need of Improvement
Three classes of finance functions are considered to have above average value creation potential but below average satisfaction:
Working capital management
Decision making tools and processes, i.e.,
Making investment decisions
Merger, acquisition and disposal decisions
Financial planning and analysis
Management reporting/accounting
Risk management
We cannot know directly why these functions are considered less than optimal but we can use data from other parts of the survey, as well as other research and anecdotes to suggest some possibilities.
The importance and dissatisfaction with Working capital management was a surprise, given its lack of attention in finance and management education programs and, until recently, by financial services firms. Its importance to CFOs probably reflects an appreciation for the cash flow implications of a well-run working capital function and the timely information that can be gained through an appreciation of the speed with which your customers pay and how long your suppliers are willing to wait to be paid.
The fact that decision making tools and processes are important, but not as satisfying reflects a drive by firms to make better decisions and a recognition of the possible value destruction caused by, for example, reckless acquisitions. The CFO also spends an above average amount of time on these areas (see Figure 4) indicating both their importance but also the need to develop efficient decision making processes.
Our paper on Corporate Risk Management will provide some insights into why this function might be less satisfying than others and identifies possible areas for improvement.
The “Less Important” Quadrants
The accounting and compliance functions (External financial reporting/accounting, Regulatory compliance, and Accounting policies) all score as adding less value, but

CFO Views on the Importance and Execution of the Finance Functions January 2006
Liability Strategies Group20
having satisfaction levels about equal to or slightly above other functions. Our interpretation is that these are essential functions, but not ones where a firm can stand out.
Equity functions (Dividend & share buyback policy as well as Equity issuance) are judged to add considerably less value, and have slightly below average levels of satisfaction. Their relatively low scores may reflect the episodic nature of equity issuances and repurchases, especially for certain types of firms.
The surprises in these quadrants are the two functions with the lowest satisfaction and with low value-added as judged by CFOs: Internal audit and Pension management. The low value-added scores may reflect a perception that neither function is one that adds value to the firm, although if mismanaged can severely destroy value. The low satisfaction likely reflects the CFO’s assessment of the costs of failing to spot internal fraud and their fear of a looming pension crisis.
In addition to comparing the mean satisfaction with mean value, as in Figure 8, we calculate the correlation between value and satisfaction across the dataset. That is, we examine whether the CFOs who report that a function is valuable are more or less likely to find that function satisfactory. Overall, there is a positive correlation between value and satisfaction for all but four of the functions.9 Debt issuance and management shows the strongest correlation, consistent with its position in the top right hand corner of Figure 8. Strong correlations are also seen for:
Cash management
Dividend & share buyback policy
Management reporting & accounting
Relationship between Resources and Satisfaction If we look at the six “opportunities” activities (Risk management, Working capital management and the decision making functions), it is no surprise that they collectively rank high on CFO’s lists of functions that could benefit from additional resources. Indeed, Figure 7 shows that the top three functions slated for additional resources are Risk management, Working capital management and Financial planning and analysis, all of which have high value potential but average or lower satisfaction. See our paper Corporate Risk Management for a discussion of the resources that firms currently allocate to this area.
9 Internal audit, External finance reporting/accounting, Accounting policies and Financial planning and analysis show negative but statistically insignificant correlation.

January 2006 CFO Views on the Importance and Execution of the Finance Functions
Liability Strategies Group 21
Summary
Overall, CFOs believe that most finance functions:
Create value
Are performing satisfactorily
Require the same or slightly more resources
There is generally a positive correlation between satisfaction and value creation. Specific finance activities that are both important and well executed include:
Bank relationships
Debt issuance and management
Capital structure
Investor relations
whereas activities that are important but less well executed include:
Working capital management
Decision making tools and processes, i.e.,
- Making investment decisions
- Merger, acquisition and disposal decisions
- Financial planning and analysis
- Management reporting/accounting
Risk management
CFOs want additional resources devoted especially to those activities which they judge to be important but less well executed

CFO Views on the Importance and Execution of the Finance Functions January 2006
Liability Strategies Group22
Shareholder Composition & Market Valuation
Theory Academic finance theory often argues that managers should seek to maximize shareholder value exclusively and that the needs of other stakeholders are only relevant to the extent that they ultimately affect shareholders. There is an extensive literature addressing possible agency costs10 but it does not focus on the needs of employees or other stakeholders.
Regarding valuation, efficient markets theories hold that markets evaluate all publicly available information to arrive at a noisy, but unbiased estimate of firm value. An emerging literature on behavioral corporate finance suggests that corporate managers do not believe that markets are efficient, and take actions to exploit perceived inefficiencies.
Corporate Orientation The companies in our sample span the globe and, understandably, have different orientations towards governance. In question 2.2, we asked CFOs to identify for whose benefit the business is run.
Q2.2: "Which of the follow ing statements best describes your business philosophy?"
Figure 9: Shareholder Orientation
N =271
The business is run for the benefit of shareholders but taking into account the needs of employees, customers, suppliers and other stakeholders, 74%
The business is run primarily for the benefit of shareholders, 13%
The business is run primarily for the benefit of the people of the country, 2%
The business is run for the benefit of many stakeholders, 10%
The results suggest a full or partial shareholder orientation for most companies although it is clear that CFOs are concerned about the impact of their actions on the wider stakeholders. One explanation for CFOs mixed orientation could be due to their genuine
10 Costs arising when the managers of a firm (the agents) take decisions in their own best interests rather than in the best interest of the shareholders (the principals).

January 2006 CFO Views on the Importance and Execution of the Finance Functions
Liability Strategies Group 23
interest in the various stakeholders of the firm. Alternatively, they might perceive that various stakeholders—like employees, governments, or lenders—can have an indirect influence on shareholders.
Shareholder Composition We asked CFOs to identify the breakdown of the types of shareholders owning their shares. The results are shown in Appendix I, Q2.14.
In addition, and perhaps more interestingly, we asked them to imagine that they could change their shareholder mix to achieve an “ideal” shareholder base. There is much talk about the role of informed, long-term investors versus broadly diffused (and short-term) investors, and we sought to understand if CFOs held strong views about what types of shareholders were more attractive.
Lower Same Higher NTop management team & board 3% 52% 45% 157
Other employees 3% 54% 42% 145
Broadly diffused shareholder base 6% 53% 40% 161
Large institutional investors 9% 58% 33% 169
Domestic shareholders 10% 64% 26% 163
Large corporate holders 13% 70% 17% 163
Large family or private shareholders 19% 72% 9% 168
Government 12% 86% 2% 137Q2.17: "If you could change the mix of shareholders, w hat w ould it be compared to your current mix?"
Figure 10: Preferred Change in Shareholder Mix
Broadly speaking, CFOs are pleased with their shareholder mix. The majority of CFOs indicate Same for each category. However, at the margin, CFOs would like to see top management teams, boards and other employees as larger shareholders in the firm. This might reflect managers’ preference for greater personal wealth, greater alignment between management and shareholder interests, or reduced risk of a hostile takeover. More informatively, the next choice was to increase holdings by a Broadly diffused shareholder base. Conversely, the two groups that respondents wish had smaller ownership stakes11 are Large family or private stakeholders and the Government.
Fairness of Valuation
Equity
Given the survey respondent’s keen interest in having more shares held by a Broadly diffused shareholder base, it is interesting to see how CFOs judged the ability of financial markets to value their shares. To gauge CFOs’ opinions on how well markets worked, we asked about the frequency and extent of misvaluation, over the previous five years.
11 We define shareholder categories which firms wish had “lower ownership stakes” as being those where the proportion of firms responding Lower is greater than the proportion responding Higher.

CFO Views on the Importance and Execution of the Finance Functions January 2006
Liability Strategies Group24
Q2.10: "Do you feel, on average, your company's equity is mis-valued by investors?"
Figure 11: Frequency of Equity Misvaluation
Rarely, 23%
Frequently, 21%
Occass ionally, 49%
Never, 7%
N = 182
70% of CFOs judged that, on average, their equity was misvalued frequently or occasionally. Among the 93% of firms whose equity was sometimes misvalued, we asked them to determine the average level of misvaluation over the prior five years. The figure below shows the frequency distribution of responses.
Q2.11: "What is the average degree of mis-valuation over the last 5 years?" N=141
Figure 12: Average Equity Misvaluation
4% 4%
1% 1%0%
1%
16%
9%
4%
9%
12%
10% 11%
5%
6%
4% 3% 3%
0%
2%
4%
6%
8%
10%
12%
14%
16%
18%
20%
Average Misvaluation
20%
-20%
-17.
5%
-15%
-12.
5%
-10%
-7.5
%
-5%
-2.5
% 0%
2.5% 5%
7.5% 10
%
12.5
%
15%
17.5
%
Undervaluation: 82% Overvaluation: 18%
Although 82% of those CFOs believed that their shares were undervalued, a significant 18% believed that their shares were overvalued, on average. This result is somewhat surprising and perhaps something that CFOs would only admit in an anonymous survey. We initially thought that the 18% of companies indicating an average overvaluation could have been impacted by the end of the dot com valuation era being included the

January 2006 CFO Views on the Importance and Execution of the Finance Functions
Liability Strategies Group 25
“last five years” period. However, further investigation showed that the overvaluation was more concentrated in industrials rather than in the technology or telecom sectors.
Because CFOs don’t face “average” conditions on a day-to-day basis but are also faced with extremes, we asked CFOs to indicate the greatest degree of undervaluation over the last five years and, separately, the greatest degree of overvaluation over the last five years.
Greatest Equity Undervaluation Greatest Equity Overvaluation
Q2.12: "What is the greatest degree of mis-valuation in the last 5 years?"
Figure 13: Greatest Equity Misvaluation
28%
10%
4%7%
13%
6%4%
3%
25%
0%
10%
20%
30%
40%
50%
Greatest Degree of Overvaluation
47%
10%8%11%
3%
10%
4%2%
5%
0%
10%
20%
30%
40%
50%
Greatest Degree of Undervaluation
N = 133 N = 710%
2.5% 5%
7.5% 10
%
12.5
%
15%
17.5
%
20% 0%
2.5% 5%
7.5% 10
%
12.5
%
15%
17.5
%
20%
The greatest overvaluation is usually considered to be negligible (the 0%–2.5% range) or very significant (Over 20%). However, the greatest undervaluation is usually very significant (Over 20%) with little weight given to the negligible option.
Overall, CFOs think that equity prices are not infrequently wrong and are sometimes very wrong. Despite all of this misvaluation, by a margin of 6.7 to one,12 CFOs would rather have more of their shares held by broadly diffused shareholders than have these shareholders hold less.
Perhaps one reason why misvaluation has a silver lining is that CFOs report that they take advantage of misvaluation in a variety of ways. Of the CFOs that indicated misvaluation, about 60% reported doing something to exploit that misvaluation. Figure 14 shows the actions that CFOs undertook. Note that CFOs could select more than one option so the figures do not add to 100%.
12 40% of firms wanted more Broadly diffused shareholder base while 6% wanted less, giving a ratio of 6.7:1. See Figure 11 for details.

CFO Views on the Importance and Execution of the Finance Functions January 2006
Liability Strategies Group26
Q2.13: "What (if anything) have you done to take advantage of this situation?" N = 102
Figure 14: Response to Misvaluation
2%
8%
8%
10%
11%
13%
15%
17%
24%
46%
51%
0% 10% 20% 30% 40% 50% 60%
Changed size of M&A
Changed timing of equity issue
Changed size of equity issue
Changed timing of M&A
Changed the method of M&A payment
Issued equity
Changed timing of repurchases
Changed size of repurchases
Undertook M&A
Changed dividend policy
Repurchased equity
There are three types of activity that CFOs undertook to address misvaluation:
Equity Repurchases and Dividend Increases
These activities seek to address undervaluation of the shares by returning cash to shareholders. Additionally, in the case of repurchases the number of shares outstanding would be decreased while in the case of dividends the payment would send a positive signal to the market about management’s expectation of being able to sustain the payment. These were, as expected, the most common actions undertaken
M&A Activity There are two rationales for M&A activity to exploit misvaluation. To exploit overvaluation, the firm can undertake a merger or acquisition using its equity to pay for the target cheaply. To address undervaluation, the firm may consider purchasing or merging with a company in a sector that is considered more attractive in the hope of triggering a reassessment of the equity valuation by investors. This activity was more common than we had expected, probably reflecting the frequency with which M&A activity in general is undertaken and hence the ease with which it can be used to help exploit misvaluation
Equity Issues These are the opposite of equity repurchases. The firm issues new equity to capitalize on the overvaluation of the equity in the market

January 2006 CFO Views on the Importance and Execution of the Finance Functions
Liability Strategies Group 27
In general, this evidence suggests that CFOs admit to routinely trading their own equity against market misperceptions of firm value.
Debt
While CFOs judge that equity markets often misvalue their shares, they seem much more confident in the ability of debt markets to correctly price their debt.
Q:3.12 "Do you feel that the average credit spread currently paid on your debt is a fair ref lection of the default risk that investors are incurring?"
Figure 15: Fairness of Credit Spread
Credit spread is too narrow , 4%Credit spread is
too w ide, 19%
Credit spread is fair, 77%
N = 163
More than three quarters of all firms judged that their credit spread was “fair”. When mispricing occurred it tended to be that credit spreads were too wide. Importantly, CFOs differentiate their view of the fairness of the credit spread from the fairness of credit ratings, with a significantly lower portion of firms indicating that their rating is fair.
S&P Moody's Fitch
N = 84 N = 76 N = 38Q:3.13 "If you are rated, do you believe that your current long-term rating is fair?"
Figure 16: Fairness of Ratings
Fair54%
Too low46%
Fair51%
Too low49% Fair
55%
Too low45%
Interestingly, although an option of The rating is too high was included for each agency, not a single respondent chose it.
CFO Views on the Importance and Execution of the Finance Functions January 2006
Liability Strategies Group28
Summary
CFOs believe that it is desirable for the management team and employees to hold significant stakes in the business
CFOs also believe that a broadly diffused shareholder base and greater ownership by institutional investors is preferable to concentrated ownership by corporates, individuals, families or the government
Both undervaluation and overvaluation of equity is common and often significant (over 20%)
Firms routinely exploit such equity misvaluation by issuing or repurchasing equity, as expected, but also by using overvalued shares as an acquisition currency
Overall, firms consider the Rating Agencies too harsh in their assessment of the credit risk of the firm, but usually consider credit spreads to be fair
January 2006 CFO Views on the Importance and Execution of the Finance Functions
Liability Strategies Group 29
Choosing Between Unpleasant Outcomes
Theory Managing a firm sometimes involves making difficult decisions where all the options are unpleasant, such as choosing whether to cut the dividend or accept a credit rating downgrade. Some decisions are seen as worse than others, and firms would prefer to avoid these more so than others. Finance theory is often concerned with trading off various desirable and undesirable outcomes. Much theory discusses how the ordering of preferences drives financing structures, either in the form of a static trade off theory or a “pecking order” theory, which we discuss in our report Corporate Capital Structure.
Overall Results In this survey, we sought to understand how firms would judge the trade offs between certain financial and operational choices. In particular, we asked:
What is the lowest debt rating you would be willing to tolerate in order to take certain actions?
If your operating cash flows were weak and you had insufficient liquid resources to pay regular dividends at the most recent level, how likely would you be to take each of the following activities?
We calibrated these questions against common financial decisions that are perceived in business or in theory to signal financial weakness (lower credit rating or cutting of dividends). Together, these questions help us to calibrate the relative “pain” of various decisions. They paint a consistent picture of a sort of pecking order of unattractive decisions.
Rating Downgrades In our Corporate Capital Structure paper, we report that rating considerations are important to many CFOs. We leverage the perceived importance of ratings to measure the relative unpleasantness of various outcomes. Figures 17 & 18 show the responses to the question of how many rating notch downgrades CFOs would voluntarily tolerate to avoid certain unpleasant outcomes. For consistency the Moody’s rating were translated onto the same scale as the S&P and Fitch ratings (AAA, AA+, AA, …, B-) and ratings from different agencies were plotted separately. For example, a firm rated A- by S&P, Baa1 by Moody’s and Not Rated by Fitch would appear once in the A- column and once in the BBB+ column while contributing 2 to N. Similarly, a firm rated BBB/Baa2/BBB would appear three times in the BBB column and contribute 3 to N.

CFO Views on the Importance and Execution of the Finance Functions January 2006
Liability Strategies Group30
To Maintain Dividend To Take on Investments
To Undertake Strategic M&A To Avoid Hostile Takeover
Figure 17: Lowest Rating Accepted
Q 3.7: "If you are rated, w hat is the low est long-term rating you w ould be w illing to tolerate in order to:- Take on value-enhancing investment opportunities- Engage in strategic merger and acquisition activities- Maintain your current dividend policy- Avoid a hostile takeover"
3% 1% 0%3%
0% 0% 1% 0%3%
11% 14
%15
%14
%31
%4%
0%0%
10%
20%
30%
40%
AAA
AA+ AA AA-
A+ A A-BB
B+ BBB
BBB-
BB+ BB BB-
B+ B B-
3%
0% 1%3%3%3%
32%
21%
9%11%
10%
4%0%0%0%0%
0%
10%
20%
30%
40%
AAA
AA+ AA AA-
A+ A A-BB
B+ BBB
BBB-
BB+ BB BB-
B+ B B-
3% 1% 0%3%
0%
4%31
%14
%15%
14%
11%
3%0%1%0%0%
0%
10%
20%
30%
40%
AAA
AA+ AA AA-
A+ A A-BB
B+ BBB
BBB-
BB+ BB BB-
B+ B B-
8%
1% 2%4%
0% 0% 1% 1%4%
11%
8% 9%15
%28
%8%
2%
0%
10%
20%
30%
40%
AAA
AA+ AA AA-
A+ A A-BB
BBB
B BBB
+ BB BB-
B+ B B-
N=142 N=146
N=145 N=125

January 2006 CFO Views on the Importance and Execution of the Finance Functions
Liability Strategies Group 31
To Maintain Dividend To Take on Investments
To Undertake Strategic M&A To Avoid Hostile Takeover
Figure 18: Number of Notches of Downgrade Accepted
Results are a comparison of Question 3.7 (see Figure 17) and Question 1.20 "If your company is rated, w hat are the ratings on your long term debt?"
56%
19%16%
7%2% 0% 0%
0%
10%
20%
30%
40%
50%
60%
0 1 2 3 4 5 >5
43%
29%
18%
7%2% 1% 0%
0%
10%
20%
30%
40%
50%
60%
0 1 2 3 4 5 >5
0%0%5%8%
23%
33%31%
0%
10%
20%
30%
40%
50%
60%
0 1 2 3 4 5 >536%
22% 21%15%
3% 3% 1%
0%
10%
20%
30%
40%
50%
60%
0 1 2 3 4 5 >5
N=119 N=126
N=123 N=102
By either measure, CFOs would “pay” considerably more in rating downgrades to avoid a hostile takeover than to maintain their dividend, take on a value-enhancing investments or undertake strategic M&A. In the extreme, 13% of firms admitted that they would give up their investment grade rating to avoid a hostile takeover bid13 but not a single firm would accept a transition from investment grade to non-investment grade for any other reason. This probably reflects the high value that CFOs place on fending off a hostile takeover, or more cynically, the use of a defensive tactic that makes the firm less attractive to a potential buyer. Unfortunately, such actions may not be shareholder value enhancing.
13 This is an additional result which cannot be inferred from the figures displayed.

CFO Views on the Importance and Execution of the Finance Functions January 2006
Liability Strategies Group32
Dividend Payments In Figure 19, we use a different yardstick to establish the index of pain, asking CFOs how likely they would be to take certain actions to protect their current level of dividends, if they had insufficient resources to pay regular dividends. Their ordering of alternatives is shown below, from most to least acceptable.
Never Very Likely0 1 2 3 4 5
Cut dividends 9% 14% 17% 20% 22% 19% 2.9 3.0 162
Cut deferrable investment 10% 27% 15% 20% 17% 10% 2.4 2.0 157
Borrow up to the limit of the credit rating 26% 22% 11% 15% 20% 6% 2.0 2.0 159
Sell assets at their fair value 25% 31% 12% 16% 12% 2% 1.6 1.0 153
Cut strategic investment 29% 30% 18% 9% 11% 3% 1.5 1.0 157
Borrow and allow credit rating to fall 48% 26% 12% 10% 4% 0% 1.0 1.0 156
Raise new equity 48% 31% 8% 8% 5% 0% 0.9 1.0 153
Sell assets at a discount to their fair value 59% 23% 12% 4% 2% 0% 0.7 0.0 157
Q5.8: "Suppose that your operating cashf low s w ere w eak and you had insuf f icient liquid resources to pay Regular Dividends at the most recent level. How likely w ould you be to take each of these actions?"
Figure 19: Action if Unable to Maintain Dividends
Nx x_ ~
We were surprised by the relative willingness of CFOs to say they would cut their dividends rather than take relatively simple actions like borrowing up to the limit of the firm’s credit rating, especially because academic research has long held that firms would be very reluctant to cut their level of dividends.14 It is important to note, however, that the results vary significantly by region. Higher numbers in Figure 20 represent a greater willingness to allow an action to occur.
14 See our paper on Corporate Dividend Policy for references.

January 2006 CFO Views on the Importance and Execution of the Finance Functions
Liability Strategies Group 33
All
Asia
ex.
Jap
an
Ger
man
y
Japa
n
Latin
Am
eric
a
Nort
h Am
eric
a
Wes
tern
Eur
ope
ex. G
erm
any
Cut dividends 2.9 3.2 3.5 2.1 3.0 2.2 2.8
Cut deferrable investment 2.4 2.5 1.9 2.3 2.0 3.8 2.3
Borrow up to the limit of the credit rating 2.0 1.8 1.6 1.6 2.6 3.2 2.0
Sell assets at their fair value 1.6 1.7 1.3 2.1 1.1 2.7 1.6
Cut strategic investment 1.5 1.7 1.2 1.8 0.4 2.5 1.5
Borrow and allow the credit rating to fall 1.0 1.1 0.7 1.0 0.8 1.8 0.8
Raise new equity 0.9 1.3 0.7 0.9 0.3 0.8 0.9
Sell assets at a discount to their fair value 0.7 0.8 0.4 1.2 0.4 1.2 0.5Q5.8: "Suppose that your operating cashf low s w ere w eak and you had insuf f icient liquid resources to pay Regular Dividends at the most recent level. How likely w ould you be to take each of these actions?"A more detailed breakdow n of regional results can be found in Appendix I under Question 5.8
Figure 20: Action if Unable to Maintain Dividends (Mean Values by Region)
Notice that in North America, which forms the sample universe for much of the current academic research, protecting dividends is more important than for the overall sample. However, our survey results suggest that world-wide dividends may not be as sacrosanct as previous academic evidence would suggest. Possible implications of these results for dividend policy are contained in our paper Corporate Dividend Policy.
The Pain Index While results may differ by region, our results suggest an interesting application of the survey responses. Below, we consolidate the worldwide results of the ratings and dividend questions into a single list, with the most painful items at the top to create a “Pain Index”:

CFO Views on the Importance and Execution of the Finance Functions January 2006
Liability Strategies Group34
Action Dividend Order
Ratings Order
Succumb to a hostile takeover 1
Sell assets at a discount to their fair value 1
Raise new equity 2
Borrow and allow credit rating to fall 3 2
Cut strategic investment 4 3†
Sell assets at their fair value 5
Borrow up to the limit of the credit rating 6
Cut deferrable investment 7 3†
Least Painful Cut dividends 8 4
Figure 21: Pain Index
Most Painful*
* We can not determine w hether a hostile takeover is more or less painful than selling assets at a discount† The ratings order does not distinguish betw een strategic and deferrable investment
As a practical matter, it may be useful for firms to calibrate their own pain indices based on specific actions that they would prefer to protect or avoid. These indices can be useful to transform risk measures like Cash Flow at Risk into more managerially-relevant measures. For example, a Cash Flow at Risk analysis tells management probabilities that cash flows will fall below a certain level. By mapping cash flows to ratings, one could apply these probabilities to unpleasant outcomes. The ordering of these outcomes would be determined by the types of questions we ask here, and the mapping would relate observable firm traits (like cash flow) to ratings and in turn to managerial decisions. For example, if keyed off the notch downgrade index, a risk management scheme that answered "What is the probability of getting a certain rating?" would essentially provide insight into the likelihood of having to cut dividends, cut projects or sell assets.

January 2006 CFO Views on the Importance and Execution of the Finance Functions
Liability Strategies Group 35
Summary
Globally, CFOs rank undesirable outcomes in the following order (most to least painful):
Succumb to a hostile takeover
Sell assets at a discount to their fair value
Raise new equity
Borrow and allow credit rating to fall
Cut strategic investment
Sell assets at their fair value
Borrow up to the limit of the credit rating
Cut deferrable investment
Cut dividends
In Europe and Asia, the willingness of firms to cut their dividends reduces their signalling power and hence investors are less likely to reward dividend increases with enhanced valuation
In the US, cutting dividends is considered more painful which implies that dividends continue to have notable signalling effects
The ordering of unpleasant corporate outcomes, and their mapping to credit rating changes, may offer managers and boards the ability to translate abstract risks and probabilities into likelihoods of tangible outcomes

CFO Views on the Importance and Execution of the Finance Functions January 2006
Liability Strategies Group36
Appendices

January 2006 CFO Views on the Importance and Execution of the Finance Functions
Liability Strategies Group 37
Appendix I: Detailed Results In this Appendix we present the results of the questions asked in the CFO section, plus other relevant questions and full segmental breakdowns.
As before, the symbol x denotes the mean of a dataset, while x~ denotes the median. N denotes the size of the dataset. All questions in the survey were optional and some questions were not asked directly, depending on the answers to previous questions. Therefore, the number of responses, N, to different questions varies and is shown for each question.
This was an anonymous survey and to further protect the confidentiality of participants, results are shown on an aggregated basis and the statistics are only displayed if there are at least 5 datapoints in the sub-sample. Sub-samples without five datapoints are marked “<5” and the statistics are shown as “na”.

January 2006
2.1: Board Membership by Region, Ratings and ListingQuestion:
Yes No N
34% 66% 278
24% 76% 38
0% 100% 6
50% 50% 6
51% 49% 55
32% 68% 25
30% 70% 10
3% 97% 30
39% 61% 104
na na <5
28% 72% 88
30% 70% 27
na na <5
37% 63% 159
31% 69% 179
41% 59% 95
na na <5
Liability Strategies Group 38
CFO Views on the Importance and Execution of Finance Functions
Results of 2.1: Board Membership by Region, Ratings and Listing
Region
Asia excluding Japan
Australia & New Zealand
All
Not Rated
North America
Western Europe excluding Germany
Undisclosed
Ratings
Investment Grade
Non-investment Grade
Eastern Europe, Middle East & Africa
Germany
Japan
Latin America
Listed
Not Listed
Undisclosed
Are you a member of your company's Board of Directors?
Undisclosed
Listing

January 2006
2.1: Board Membership by IndustryQuestion:
Yes No N
34% 66% 278
36% 64% 11
40% 60% 5
28% 72% 18
43% 57% 44
38% 63% 8
80% 20% 5
0% 100% 12
37% 63% 57
27% 73% 11
38% 63% 8
27% 73% 11
30% 70% 20
25% 75% 8
26% 74% 19
27% 73% 15
42% 58% 26
Liability Strategies Group 39
Are you a member of your company's Board of Directors?
Transportation Services
Utilities
Undisclosed & Other
Chemicals
Consumer
Consumer Finance
Diversified & Conglomerates
Telecommunications
Health Care & Pharmaceuticals
Industrials and Materials
Media
Metals & Mining
Oil & Gas
Technology
Industry
Automobiles
Business Services
All
CFO Views on the Importance and Execution of Finance Functions
Results of 2.1: Board Membership by Industry

January 2006
2.2: Business Philosophy by Region, Ratings and ListingQuestion:
13% 74% 10% 2% 0% 271
5% 76% 11% 8% 0% 37
0% 100% 0% 0% 0% 6
0% 83% 17% 0% 0% 6
15% 80% 6% 0% 0% 54
4% 64% 16% 12% 4% 25
10% 90% 0% 0% 0% 10
21% 64% 14% 0% 0% 28
18% 73% 9% 0% 0% 101
na na na na na <5
7% 76% 13% 4% 0% 83
11% 63% 19% 7% 0% 27
na na na na na <5
17% 75% 8% 0% 1% 157
11% 75% 11% 2% 1% 177
16% 72% 10% 2% 0% 92
na na na na na <5
* The exact wording of each option was:
- The business is run primarily for the benefit of shareholders
- The business is run for the benefit of shareholders but taking into account the needs of employees, customers, suppliers and other stakeholders
- The business is run for the benefit of many stakeholders
Liability Strategies Group
Results of Question 2.2: Business Philosophy by Region, Ratings and Listing
Region
Asia excluding Japan
Stak
ehold
ers*
Peop
le of
Coun
try*
Investment Grade
Shar
ehold
ers*
Shar
ehold
ers &
Othe
rs*
Othe
r
Undisclosed
Ratings
Japan
Latin America
Not Listed
Non-investment Grade
Eastern Europe, Middle East & Africa
Undisclosed
- The business is run primarily for the benefit of the people of the country
Germany
Not Rated
North America
Western Europe excluding Germany
CFO Views on the Importance and Execution of Finance Functions
Undisclosed
Listing
Listed
Australia & New Zealand
All
Which of the following statements best describe your business philosophy?
N
40

January 2006
2.2: Business Philosophy by IndustryQuestion:
13% 74% 10% 2% 0% 271
9% 64% 18% 0% 9% 11
33% 67% 0% 0% 0% 6
17% 67% 11% 6% 0% 18
7% 84% 9% 0% 0% 43
13% 75% 13% 0% 0% 8
0% 100% 0% 0% 0% 5
8% 83% 8% 0% 0% 12
16% 71% 9% 4% 0% 55
27% 73% 0% 0% 0% 11
13% 63% 25% 0% 0% 8
9% 73% 9% 9% 0% 11
16% 74% 11% 0% 0% 19
13% 75% 13% 0% 0% 8
5% 74% 16% 5% 0% 19
7% 71% 14% 7% 0% 14
17% 74% 9% 0% 0% 23
Liability Strategies Group
Industry
Automobiles
Business Services
All
Consumer Finance
Which of the following statements best describe your business philosophy?
NStak
ehold
ers*
Peop
le of
Coun
try*
Shar
ehold
ers*
Media
Metals & Mining
Diversified & Conglomerates
Technology
CFO Views on the Importance and Execution of Finance Functions
Oil & Gas
Chemicals
Results of Question 2.2: Business Philosophy by Industry
Othe
r
Consumer
Telecommunications
Health Care & Pharmaceuticals
Industrials and Materials
Transportation Services
Utilities
Undisclosed & Other
Shar
ehold
ers &
Othe
rs*
41
* The exact wording of each option was:
The business is run for the benefit of many stakeholders
The business is run primarily for the benefit of the people of the country
The business is run primarily for the benefit of shareholders
The business is run for the benefit of shareholders but taking into account the needs of employees, customers, suppliers and other stakeholders

January 2006
2.4: Value Contribution of the Finance FunctionQuestion:
0% -2.5%
2.6% -5%
5.1% -7.5%
7.6% -10%
10.1% -12.5%
12.6% -15%
15.1% -17.5%
17.6% -20% Over 20%
1.25% 3.75% 6.25% 8.75% 11.25% 13.75% 16.30% 18.75% 22.50%
8% 19% 14% 21% 11% 8% 3% 4% 12% 10% 9% 185
na na na na na na na na na na na <5
7% 13% 16% 21% 11% 7% 3% 9% 14% 11% 9% 199
na na na na na na na na na na na <5
Liability Strategies Group 42
How much value, as a percentage of Market Capitalization, is the finance function judged to add or subtract?
N
Range offered
Midpoint used for mean & median
CEO judges finance function subtracts
CFO judges finance function adds
CFO judges finance function subtracts
CEO judges finance function adds
CFO Views on the Importance and Execution of Finance Functions
Results of Question 2.4: Value Contribution of the Finance Function
x x~

January 2006
2.4: Value Contribution of the Finance Function by RegionQuestion:
N N N N N N N N N N
10 9 185 13 11 29 15 14 5 na na <5 9 9 35 6 4 7 9 9 8 10 10 22 9 9 74 na na <5
na na <5 na na <5 na na <5 na na <5 na na <5 na na <5 na na <5 na na <5 na na <5 na na <5
11 9 199 15 14 29 16 19 5 na na <5 10 9 39 8 6 10 10 9 9 11 11 22 10 9 80 na na <5
na na <5 na na <5 na na <5 na na <5 na na <5 na na <5 na na <5 na na <5 na na <5 na na <5
Liability Strategies Group
Undis
close
d
CFO Views on the Importance and Execution of Finance Functions
How much value, as a percentage of Market Capitalization, is the finance function judged to add or subtract?
Easte
rn E
urop
e, Mi
ddle
East
& Af
rica
Germ
any
Japa
n
Wes
tern E
urop
e ex
cludin
g Ger
many
Results of Question 2.4: Value Contribution of the Finance Function by Region
All
Latin
Ame
rica
North
Ame
rica
CEO judges finance function adds
43
Asia
exclu
ding J
apan
Austr
alia &
New
Ze
aland
CEO judges finance function subtracts
CFO judges finance function adds
CFO judges finance function subtracts
Means and Medians in Percent
x x~ x x~ x x~ x x~ x x~ x x~ x x~ x x~x x~ x x~

January 2006
2.4: Value Contribution of the Finance Function by IndustryQuestion:
N N N N N N N N N N N N N N N N N
10 9 185 9 8 6 10 11 5 9 9 11 11 9 33 na na <5 na na <5 8 5 8 9 6 41 7 4 8 11 9 5 9 9 7 12 13 12 16 18 6 8 6 12 9 11 10 10 9 16
na na <5 na na <5 na na <5 na na <5 na na <5 na na <5 na na <5 na na <5 na na <5 na na <5 na na <5 na na <5 na na <5 na na <5 na na <5 na na <5 na na <5
11 9 199 9 8 6 12 11 5 10 9 11 13 11 36 na na <5 na na <5 9 6 9 9 9 43 9 9 8 11 9 7 9 9 8 13 11 14 18 23 7 11 9 13 9 9 10 10 9 17
na na <5 na na <5 na na <5 na na <5 na na <5 na na <5 na na <5 na na <5 na na <5 na na <5 na na <5 na na <5 na na <5 na na <5 na na <5 na na <5 na na <5
Liability Strategies Group 44
Telec
ommu
ni ca
tions
Tran
spor
tation
Se
rvice
s
Media
Metal
s and
Mini
ng
Utilit
ies
Undis
close
d & O
ther
CFO Views on the Importance and Execution of Finance Functions
Chem
icals
Cons
umer
Cons
umer
Fina
nce
Oil a
nd G
as
Tech
nolog
y
Indus
trials
and
Mater
ials
Results of Question 2.4: Value Contribution of the Finance Function by Industry
What net value do you perceive that the CEO and the CFO judge the finance function to add to your company?
All
Dive
rsifie
d/Con
glo
mera
tes
Healt
h Car
e &
Phar
mace
utica
ls
CEO judges finance function adds
CFO judges finance function adds
CFO judges finance function subtracts
Means and Medians in PercentAu
tomob
iles
Busin
ess S
ervic
es
CEO judges finance function subtracts
x x~ x x~ x x~ x x~ x x~ x x~ x x~ x x~x x~ x x~ x x~ x x~ x x~ x x~ x x~ x x~ x x~

January 2006
2.4: Value Contribution of the Finance Function by Rating and ListingQuestion:
N N N N N N N N
10 9 185 9 9 58 12 11 19 na na <5 10 9 104 10 9 116 10 9 69 na na <5
na na <5 na na <5 na na <5 na na <5 na na <5 na na <5 na na <5 na na <5
11 9 199 10 9 60 13 11 23 na na <5 11 9 112 11 9 126 11 9 73 na na <5
na na <5 na na <5 na na <5 na na <5 na na <5 na na <5 na na <5 na na <5
Liability Strategies Group 45
CEO judges finance function adds
Means and Medians in Percent
How much value, as a percentage of Market Capitalization, is the finance function judged to add or subtract?
CEO judges finance function subtracts
CFO judges finance function adds
CFO judges finance function subtractsInv
estm
ent G
rade
Non-
inves
tmen
t Gr
ade
Not R
ated
All
CFO Views on the Importance and Execution of Finance Functions
Undis
close
d
Listed
Not L
isted
Undis
close
d
RatingsResults of Question 2.4: Value Contribution of the Finance Function by Rating and Listing
Listing
x x~ x x~ x x~ x x~ x x~ x x~x x~ x x~

January 2006
2.5: Value Contribution of Specific Finance FunctionsQuestion:
Not Valuable Very Valuable
0 1 2 3 4
1% 2% 13% 31% 53% 3.3 4.0 238
2% 4% 10% 29% 55% 3.3 4.0 231
7% 13% 28% 26% 25% 2.5 3.0 193
9% 11% 21% 33% 27% 2.6 3.0 214
1% 3% 16% 30% 50% 3.3 4.0 240
0% 4% 15% 33% 47% 3.2 3.0 245
4% 5% 16% 33% 42% 3.0 3.0 214
0% 3% 15% 29% 52% 3.3 4.0 244
6% 18% 26% 29% 21% 2.4 2.0 197
0% 6% 17% 32% 45% 3.2 3.0 244
1% 4% 11% 33% 51% 3.3 4.0 245
0% 3% 15% 35% 47% 3.2 3.0 240
1% 6% 14% 30% 49% 3.2 3.0 227
0% 10% 34% 31% 24% 2.7 3.0 230
0% 4% 19% 36% 42% 3.2 3.0 241
1% 10% 20% 34% 36% 2.9 3.0 239
2% 8% 27% 38% 26% 2.8 3.0 240
0% 4% 13% 37% 46% 3.2 3.0 245
1% 9% 26% 31% 33% 2.9 3.0 231
Liability Strategies Group
Results of Question 2.5: Value Contribution of Specific Finance Functions
46
How valuable do you believe the following finance functions are to the company?
N
Investor relations
Bank relationships
Debt issuance and management
Equity issuance
Dividend & share buyback policy
Capital structure
Tax management
Risk management
Management reporting/accounting
Pension management
Cash management
Working capital management
Making investment decisions
CFO Views on the Importance and Execution of Finance Functions
External financial reporting/accounting
Accounting policies
Financial planning and analysis
Regulatory compliance
Merger, acquisition and disposal decisions
Internal audit
x x~

January 2006
2.5: Value Contribution of Specific Finance Functions by RegionQuestion:
N N N N N N N N N N
3.3 4.0 238 3.7 4.0 30 3.8 4.0 6 4.0 4.0 5 3.2 3.0 49 2.8 3.0 22 3.5 4.0 10 3.6 4.0 25 3.3 3.0 88 na na <5
3.3 4.0 231 3.5 4.0 30 3.7 4.0 6 na na <5 3.0 3.0 47 3.5 4.0 22 3.5 4.0 10 3.5 4.0 26 3.3 4.0 84 na na <5
2.5 3.0 193 2.7 3.0 30 na na <5 na na <5 2.4 3.0 37 2.6 2.0 15 2.9 3.0 7 2.5 2.0 23 2.4 2.0 71 na na <5
2.6 3.0 214 2.9 3.0 32 na na <5 na na <5 2.4 3.0 38 2.7 3.0 19 2.5 3.0 10 3.2 3.0 26 2.3 3.0 79 na na <5
3.3 4.0 240 3.5 4.0 31 3.8 4.0 6 3.2 3.0 5 3.2 4.0 51 2.8 3.0 18 3.3 4.0 9 3.5 4.0 26 3.2 3.0 91 na na <5
3.2 3.0 245 3.8 4.0 31 3.7 4.0 6 3.4 3.0 5 3.1 3.0 50 2.6 3.0 24 3.4 3.0 10 3.3 3.5 26 3.2 3.0 90 na na <5
3.0 3.0 214 3.3 4.0 32 3.2 3.0 5 na na <5 3.1 3.5 36 2.6 3.0 22 2.8 3.0 10 3.3 3.0 26 2.9 3.0 77 na na <5
3.3 4.0 244 3.5 4.0 31 3.0 3.0 6 3.0 3.0 5 3.1 3.5 48 3.6 4.0 24 3.2 3.0 10 3.1 3.0 26 3.3 4.0 91 na na <5
2.4 2.0 197 2.4 2.0 27 1.8 2.0 5 na na <5 2.4 2.0 42 2.5 3.0 15 1.4 1.0 7 3.1 3.0 23 2.3 2.0 72 na na <5
3.2 3.0 244 3.6 4.0 31 2.8 2.5 6 2.8 3.0 5 3.1 3.0 51 3.5 4.0 22 3.0 3.0 9 2.8 3.0 26 3.1 3.0 91 na na <5
3.3 4.0 245 3.7 4.0 31 2.5 2.5 6 3.2 3.0 5 3.3 4.0 50 3.5 4.0 23 3.1 3.0 10 3.3 3.0 26 3.2 3.0 91 na na <5
3.2 3.0 240 3.7 4.0 31 3.7 4.0 6 3.2 4.0 5 3.2 3.0 50 2.7 2.0 21 3.4 4.0 10 3.0 3.0 25 3.3 3.0 89 na na <5
3.2 3.0 227 3.3 4.0 31 3.7 4.0 6 na na <5 3.2 4.0 45 2.5 3.0 20 3.4 3.5 10 3.6 4.0 26 3.1 3.0 83 na na <5
2.7 3.0 230 3.4 4.0 32 2.7 2.5 6 3.0 3.0 5 2.2 2.0 48 2.0 2.0 13 2.8 3.0 9 3.1 3.0 25 2.6 2.0 89 na na <5
3.2 3.0 241 3.5 4.0 31 2.8 3.0 6 3.0 3.0 5 3.2 3.0 51 2.5 2.0 19 3.0 3.0 10 3.3 4.0 26 3.1 3.0 90 na na <5
2.9 3.0 239 3.5 4.0 31 2.5 2.5 6 2.6 3.0 5 2.8 3.0 51 2.3 2.0 18 3.3 3.0 10 3.5 4.0 26 2.8 3.0 89 na na <5
2.8 3.0 240 3.5 4.0 31 2.5 2.5 6 2.2 2.0 5 2.4 3.0 50 2.4 2.5 18 3.1 3.0 10 3.3 3.5 26 2.7 3.0 91 na na <5
3.2 3.0 245 3.7 4.0 31 3.0 3.0 6 3.4 3.0 5 3.0 3.0 50 2.9 3.0 22 3.2 3.5 10 3.5 4.0 26 3.2 3.0 92 na na <5
2.9 3.0 231 3.5 4.0 32 2.6 2.0 5 3.0 3.0 5 2.5 2.0 47 2.2 2.0 18 3.2 3.5 10 3.4 4.0 25 2.8 3.0 86 na na <5
Liability Strategies Group 47
Undis
close
d
CFO Views on the Importance and Execution of Finance Functions
How valuable do you believe the following finance functions are to the company?
Easte
rn E
urop
e, Mi
ddle
East
& Af
rica
Germ
any
Japa
n
Wes
tern E
urop
e ex
cludin
g Ger
many
Results of Question 2.5: Value Contribution of Specific Finance Functions by Region
All
Latin
Ame
rica
North
Ame
rica
Capital structure
Financial planning and analysis
Internal audit
Management reporting/accounting
External financial reporting/accounting
Accounting policies
Working capital management
Making investment decisions
Merger, acquisition and disposal decisions
Regulatory compliance
Investor relations
Bank relationships
Pension management
Cash management
Equity issuance
Dividend & share buyback policy
Tax management
Risk management
Asia
exclu
ding J
apan
Austr
alia &
New
Ze
aland
Debt issuance and management
x x~ x x~ x x~ x x~ x x~ x x~ x x~ x x~x x~ x x~

January 2006
2.5: Value Contribution of Specific Finance Functions by IndustryQuestion:
N N N N N N N N N N N N N N N N N
3.3 4.0 238 3.6 4.0 8 3.2 3.0 5 3.2 3.0 17 3.2 3.0 41 3.3 4.0 6 na na <5 3.1 3.0 10 3.3 4.0 49 3.3 3.0 10 3.6 4.0 7 3.6 4.0 10 3.4 3.0 13 3.4 3.5 8 3.2 3.0 17 3.5 4.0 11 3.6 4.0 22
3.3 4.0 231 3.8 4.0 8 3.0 3.0 5 3.2 3.0 16 3.3 3.0 39 3.7 4.0 7 na na <5 3.4 3.5 10 3.3 3.5 48 2.8 2.0 9 3.3 4.0 7 3.7 4.0 10 3.4 4.0 13 3.7 4.0 7 3.1 4.0 17 3.7 4.0 12 3.2 4.0 19
2.5 3.0 193 3.2 3.0 5 na na <5 2.4 2.5 12 2.5 3.0 34 2.6 3.0 5 na na <5 2.0 2.0 9 2.2 2.0 42 2.6 3.0 5 2.8 3.0 6 2.7 2.5 6 3.2 3.0 11 3.4 4.0 7 2.4 2.5 14 2.1 2.0 11 2.5 2.5 18
2.6 3.0 214 2.8 3.0 8 na na <5 2.5 2.5 14 2.4 3.0 35 na na <5 na na <5 2.7 2.5 10 2.2 2.0 44 3.3 3.0 8 3.2 4.0 6 3.0 3.0 10 2.9 3.0 12 3.3 3.0 8 2.3 3.0 16 2.9 3.0 11 2.7 3.0 20
3.3 4.0 240 3.7 4.0 10 3.4 4.0 5 3.2 3.0 17 3.0 3.0 41 na na <5 na na <5 3.7 4.0 11 3.1 3.0 52 3.0 3.0 10 3.6 4.0 7 3.3 4.0 9 3.3 3.0 13 3.1 3.0 7 3.4 4.0 15 3.3 4.0 12 3.4 4.0 23
3.2 3.0 245 3.3 3.5 10 3.4 3.0 5 3.2 3.0 17 3.0 3.0 42 3.4 4.0 7 na na <5 3.1 3.0 11 3.3 3.0 51 2.5 2.5 10 2.9 3.0 7 3.4 3.5 10 3.4 3.0 12 3.0 3.0 8 3.8 4.0 16 3.4 4.0 12 3.3 4.0 23
3.0 3.0 214 2.8 3.0 6 3.8 4.0 5 3.2 3.0 13 2.7 3.0 35 3.2 3.0 6 na na <5 3.5 4.0 11 2.7 3.0 44 3.0 4.0 7 2.8 3.0 6 3.4 4.0 10 3.3 3.5 12 3.4 3.5 8 2.9 3.0 16 3.4 3.0 12 3.0 3.0 19
3.3 4.0 244 3.7 4.0 9 2.8 3.0 5 3.5 4.0 17 3.1 3.0 42 4.0 4.0 7 na na <5 3.0 3.0 11 3.6 4.0 52 2.8 2.5 10 3.7 4.0 7 3.3 4.0 10 3.4 3.5 12 3.3 4.0 8 3.0 4.0 16 2.9 3.0 12 3.2 3.0 23
2.4 2.0 197 3.3 3.0 8 1.8 2.0 5 2.9 3.0 13 2.1 2.0 29 na na <5 na na <5 2.6 2.5 8 2.5 3.0 46 2.1 2.0 8 1.6 2.0 7 2.5 2.5 8 2.7 3.0 12 3.0 3.0 5 2.5 2.0 13 2.1 2.5 12 2.2 2.0 19
3.2 3.0 244 3.5 4.0 10 3.4 4.0 5 2.9 3.0 17 3.1 3.0 42 3.9 4.0 7 na na <5 2.8 3.0 11 3.3 4.0 52 2.6 2.5 10 3.2 3.0 6 2.9 3.0 10 3.2 4.0 13 3.4 4.0 8 3.3 4.0 16 2.4 2.5 10 3.3 3.0 23
3.3 4.0 245 3.8 4.0 10 3.6 4.0 5 3.2 3.0 17 3.3 3.5 42 3.7 4.0 7 na na <5 2.9 3.0 11 3.5 4.0 52 2.8 3.0 9 3.4 3.0 7 3.0 3.0 10 3.5 4.0 13 3.4 4.0 8 3.3 3.0 16 2.2 3.0 11 3.2 4.0 23
3.2 3.0 240 3.3 4.0 10 3.4 4.0 5 3.3 3.0 17 3.3 4.0 41 2.4 2.0 5 na na <5 2.3 2.0 10 3.2 3.0 52 3.2 3.0 10 3.1 3.0 7 3.8 4.0 10 3.3 3.0 13 3.5 4.0 8 3.5 4.0 17 3.1 3.0 11 3.4 4.0 20
3.2 3.0 227 3.3 4.0 9 3.6 4.0 5 3.3 3.5 16 3.2 4.0 38 na na <5 na na <5 3.4 3.0 11 3.0 3.0 49 3.5 4.0 10 3.3 4.0 7 3.2 3.0 9 3.2 3.5 12 3.9 4.0 8 3.1 3.0 17 3.2 3.0 11 3.3 3.5 18
2.7 3.0 230 2.9 3.0 8 2.6 3.0 5 2.7 3.0 17 2.6 3.0 40 na na <5 na na <5 2.9 3.0 11 2.7 3.0 50 2.3 2.0 9 2.5 2.0 6 2.6 3.0 9 2.7 3.0 13 3.2 3.0 6 3.0 3.0 17 2.2 2.0 10 2.5 2.5 22
3.2 3.0 241 3.2 3.0 10 3.0 3.0 5 3.6 4.0 17 3.0 3.0 41 na na <5 na na <5 3.1 3.0 11 3.2 3.0 51 2.9 3.0 10 3.3 3.0 7 3.3 3.0 10 3.3 3.0 13 3.6 4.0 7 3.3 3.5 16 2.7 3.0 12 3.0 3.0 23
2.9 3.0 239 2.6 3.0 10 3.4 3.0 5 3.1 3.0 16 2.5 3.0 39 na na <5 na na <5 3.4 4.0 11 2.9 3.0 53 2.9 3.0 10 2.7 3.0 7 3.2 3.0 9 3.5 4.0 13 3.4 4.0 7 3.1 3.0 16 3.2 3.0 12 2.8 3.0 23
2.8 3.0 240 2.6 3.0 10 3.4 4.0 5 2.8 3.0 17 2.6 3.0 41 na na <5 na na <5 2.9 3.0 11 2.8 3.0 52 2.6 3.0 10 2.3 2.0 7 3.0 3.0 9 3.4 4.0 13 3.1 3.0 7 2.6 3.0 16 2.8 3.0 12 2.7 3.0 23
3.2 3.0 245 3.6 4.0 9 3.2 3.0 5 3.4 4.0 17 3.1 3.0 42 3.2 3.0 6 na na <5 3.5 4.0 11 3.3 4.0 53 2.8 3.0 10 2.9 3.0 7 3.4 3.5 10 3.6 4.0 13 3.6 4.0 8 3.1 3.5 16 2.8 3.0 11 3.3 4.0 23
2.9 3.0 231 3.0 3.0 9 na na <5 2.9 3.0 16 2.6 2.0 38 3.0 3.0 5 na na <5 3.3 3.0 11 2.7 3.0 49 2.5 3.0 10 2.7 3.0 7 3.1 3.0 9 3.3 3.0 12 3.6 4.0 7 3.0 3.0 17 3.0 3.0 11 2.8 3.0 22
Liability Strategies Group 48
Telec
ommu
ni ca
tions
Tran
spor
tation
Se
rvice
s
Media
Metal
s and
Mini
ng
Utilit
ies
Undis
close
d & O
ther
CFO Views on the Importance and Execution of Finance Functions
Chem
icals
Cons
umer
Cons
umer
Fina
nce
Oil a
nd G
as
Tech
nolog
y
Indus
trials
and
Mater
ials
Results of Question 2.5: Value Contribution of Specific Finance Functions by Industry
How valuable do you believe the following finance functions are to the company?
All
Dive
rsifie
d/Con
glo
mera
tes
Healt
h Car
e &
Phar
mace
utica
ls
Capital structure
Financial planning and analysis
Internal audit
Management reporting/accounting
External financial reporting/accounting
Accounting policies
Working capital management
Making investment decisions
Merger, acquisition and disposal decisions
Regulatory compliance
Investor relations
Bank relationships
Pension management
Cash management
Equity issuance
Dividend & share buyback policy
Tax management
Risk management
Autom
obile
s
Busin
ess S
ervic
es
Debt issuance and management
x x~ x x~ x x~ x x~ x x~ x x~ x x~ x x~x x~ x x~ x x~ x x~ x x~ x x~ x x~ x x~ x x~

January 2006
2.5: Value Contribution of Specific Finance Functions by Ratings and ListingQuestion:
N N N N N N N N
3.3 4.0 238 3.5 4.0 73 3.3 4.0 25 na na <5 3.3 4.0 136 3.4 4.0 152 3.3 3.0 83 na na <5
3.3 4.0 231 3.4 4.0 74 3.7 4.0 25 na na <5 3.2 3.5 128 3.4 4.0 150 3.2 4.0 79 na na <5
2.5 3.0 193 2.6 3.0 60 2.8 3.0 21 na na <5 2.4 2.5 108 2.7 3.0 131 2.1 2.0 60 na na <5
2.6 3.0 214 2.9 3.0 69 2.4 2.0 24 na na <5 2.5 3.0 117 2.9 3.0 147 1.9 2.0 65 na na <5
3.3 4.0 240 3.2 4.0 71 3.4 3.5 24 na na <5 3.2 3.0 141 3.3 3.5 150 3.2 4.0 87 na na <5
3.2 3.0 245 3.2 3.0 76 3.2 3.0 25 na na <5 3.3 3.0 140 3.3 3.0 156 3.2 3.0 86 na na <5
3.0 3.0 214 3.1 3.0 72 3.3 3.0 24 na na <5 2.9 3.0 115 3.3 3.0 154 2.4 2.5 58 na na <5
3.3 4.0 244 3.0 3.0 76 3.5 4.0 25 na na <5 3.4 4.0 139 3.2 3.0 155 3.4 4.0 86 na na <5
2.4 2.0 197 2.6 3.0 68 2.8 3.0 19 na na <5 2.2 2.0 107 2.6 3.0 133 1.9 2.0 62 na na <5
3.2 3.0 244 2.8 3.0 75 3.3 4.0 24 na na <5 3.3 4.0 141 3.1 3.0 155 3.2 3.0 86 na na <5
3.3 4.0 245 3.0 3.0 74 3.5 4.0 25 na na <5 3.4 4.0 142 3.3 4.0 156 3.4 4.0 86 na na <5
3.2 3.0 240 3.2 3.0 73 3.1 3.0 25 na na <5 3.3 4.0 138 3.3 3.0 151 3.2 3.0 87 na na <5
3.2 3.0 227 3.3 4.0 73 3.0 3.0 25 na na <5 3.2 3.0 125 3.4 4.0 148 2.9 3.0 77 na na <5
2.7 3.0 230 2.6 2.5 70 3.0 3.0 22 na na <5 2.7 3.0 134 2.7 3.0 143 2.6 3.0 84 na na <5
3.2 3.0 241 2.9 3.0 73 3.4 3.5 24 na na <5 3.2 3.0 140 3.1 3.0 151 3.2 3.0 87 na na <5
2.9 3.0 239 3.1 3.0 72 3.5 4.0 24 na na <5 2.8 3.0 139 3.1 3.0 151 2.6 3.0 85 na na <5
2.8 3.0 240 2.8 3.0 72 3.3 3.0 24 na na <5 2.7 3.0 140 2.9 3.0 150 2.6 3.0 87 na na <5
3.2 3.0 245 3.1 3.0 73 3.4 4.0 25 na na <5 3.3 3.0 143 3.2 3.0 155 3.2 3.0 87 na na <5
2.9 3.0 231 3.0 3.0 70 3.1 3.0 23 na na <5 2.7 3.0 134 3.0 3.0 148 2.7 3.0 80 na na <5
Liability Strategies Group 49
External financial reporting/accounting
Accounting policies
Financial planning and analysis
Regulatory compliance
Tax management
Risk management
Investor relations
Bank relationships
Management reporting/accounting
Pension management
Cash management
Working capital management
Making investment decisions
Merger, acquisition and disposal decisions
Internal audit
How valuable do you believe the following finance functions are to the company?
Debt issuance and management
Equity issuance
Dividend & share buyback policyInv
estm
ent G
rade
Non-
inves
tmen
t Gr
ade
Not R
ated
All
Capital structure
CFO Views on the Importance and Execution of Finance Functions
Undis
close
d
Listed
Not L
isted
Undis
close
d
RatingsResults of Question 2.5: Value Contribution of Specific Finance Functions by Ratings and Listing
Listing
x x~ x x~ x x~ x x~ x x~ x x~x x~ x x~

January 2006
2.6: Satisfaction by Finance FunctionQuestion:
Very Dissatisfied Dissatisfied Indifferent Satisfied Very Satisfied
-2 -1 0 1 2
0% 10% 13% 60% 16% 0.8 1.0 221
0% 2% 11% 59% 28% 1.1 1.0 218
1% 4% 39% 42% 14% 0.7 1.0 178
1% 7% 28% 51% 14% 0.7 1.0 197
0% 6% 13% 66% 15% 0.9 1.0 226
0% 11% 16% 60% 13% 0.8 1.0 232
2% 3% 17% 60% 20% 0.9 1.0 200
0% 1% 6% 58% 35% 1.3 1.0 231
3% 6% 44% 39% 7% 0.4 0.0 185
1% 5% 15% 67% 12% 0.8 1.0 231
1% 16% 19% 57% 6% 0.5 1.0 228
0% 13% 26% 54% 8% 0.6 1.0 223
1% 9% 31% 52% 7% 0.5 1.0 212
0% 10% 37% 47% 6% 0.5 1.0 218
0% 10% 15% 63% 12% 0.8 1.0 228
0% 3% 17% 63% 17% 0.9 1.0 227
0% 5% 26% 61% 8% 0.7 1.0 225
0% 9% 18% 64% 9% 0.7 1.0 231
0% 3% 28% 56% 13% 0.8 1.0 207
Liability Strategies Group 50
Debt issuance and management
Equity issuance
Dividend & share buyback policy
How satisfied are you with the performance of the following finance functions?
Results of Question 2.6: Satisfaction by Finance Function
N
Choices offered
Numerical Interpretation
Capital structure
Tax management
Risk management
Management reporting/accounting
Pension management
Cash management
Working capital management
Making investment decisions
Investor relations
Bank relationships
CFO Views on the Importance and Execution of Finance Functions
External financial reporting/accounting
Accounting policies
Financial planning and analysis
Regulatory compliance
Merger, acquisition and disposal decisions
Internal audit
x x~

January 2006
2.6: Satisfaction by Finance Function by RegionQuestion:
N N N N N N N N N N
0.8 1.0 221 0.5 1.0 29 1.0 1.0 6 1.4 2.0 5 0.8 1.0 44 0.5 1.0 21 0.9 1.0 10 1.4 1.0 21 0.8 1.0 82 na na <5
1.1 1.0 218 1.0 1.0 29 1.3 1.0 6 na na <5 1.0 1.0 43 1.1 1.0 22 1.4 2.0 10 1.5 1.5 22 1.1 1.0 80 na na <5
0.7 1.0 178 0.4 0.0 28 na na <5 na na <5 0.8 1.0 33 0.4 0.5 14 0.9 1.0 7 0.7 1.0 19 0.7 1.0 67 na na <5
0.7 1.0 197 0.5 1.0 31 na na <5 na na <5 0.7 1.0 33 0.6 1.0 16 0.5 1.0 10 1.1 1.0 22 0.7 1.0 75 na na <5
0.9 1.0 226 0.8 1.0 30 0.8 1.0 6 1.0 1.0 5 0.8 1.0 48 0.6 1.0 17 1.0 1.0 9 1.4 1.0 22 0.8 1.0 86 na na <5
0.8 1.0 232 0.6 1.0 30 0.7 1.0 6 1.4 1.0 5 0.7 1.0 47 0.6 1.0 23 0.7 1.0 10 1.2 1.0 22 0.7 1.0 86 na na <5
0.9 1.0 200 1.0 1.0 31 1.2 1.0 5 na na <5 1.0 1.0 31 0.5 1.0 22 0.9 1.0 10 1.1 1.0 22 0.9 1.0 73 na na <5
1.3 1.0 231 1.2 1.0 30 1.0 1.0 6 1.4 1.0 5 1.4 2.0 45 1.2 1.0 23 1.5 1.5 10 1.2 1.0 22 1.3 1.0 87 na na <5
0.4 0.0 185 0.5 0.0 26 na na <5 na na <5 0.3 0.0 39 0.6 1.0 15 0.4 0.0 7 0.9 1.0 20 0.2 0.0 68 na na <5
0.8 1.0 231 0.9 1.0 30 0.5 1.0 6 0.8 1.0 5 0.7 1.0 48 1.0 1.0 21 0.9 1.0 9 1.0 1.0 22 0.8 1.0 87 na na <5
0.5 1.0 228 0.7 1.0 30 0.0 0.0 5 0.0 0.0 5 0.5 1.0 46 1.1 1.0 20 0.4 0.5 10 0.5 1.0 22 0.4 1.0 87 na na <5
0.6 1.0 223 0.6 1.0 29 0.6 1.0 5 0.6 0.0 5 0.5 1.0 46 0.4 1.0 19 0.9 1.0 9 0.7 1.0 22 0.5 1.0 85 na na <5
0.5 1.0 212 0.3 1.0 28 0.7 1.0 6 na na <5 0.5 1.0 42 0.3 1.0 19 0.8 1.0 10 0.9 1.0 22 0.5 1.0 79 na na <5
0.5 1.0 218 0.5 1.0 31 0.3 0.5 6 1.2 1.0 5 0.4 1.0 45 0.2 0.0 13 0.6 1.0 9 1.0 1.0 21 0.4 0.0 85 na na <5
0.8 1.0 228 0.7 1.0 30 0.3 0.5 6 1.2 1.0 5 0.9 1.0 48 0.2 1.0 19 0.7 1.0 10 1.0 1.0 22 0.8 1.0 85 na na <5
0.9 1.0 227 1.0 1.0 30 0.8 1.0 6 1.4 2.0 5 1.0 1.0 48 0.5 1.0 18 0.9 1.0 10 1.3 1.0 22 0.8 1.0 85 na na <5
0.7 1.0 225 0.9 1.0 29 0.8 1.0 5 1.0 1.0 5 0.6 1.0 47 0.3 1.0 18 0.5 1.0 10 1.1 1.0 22 0.7 1.0 86 na na <5
0.7 1.0 231 0.8 1.0 30 0.4 1.0 5 0.6 1.0 5 0.7 1.0 47 0.5 1.0 22 0.6 1.0 10 0.6 1.0 22 0.8 1.0 87 na na <5
0.8 1.0 207 1.1 1.0 31 na na <5 1.0 1.0 5 0.6 1.0 43 0.3 0.5 12 1.0 1.0 9 1.1 1.0 20 0.7 1.0 80 na na <5
Liability Strategies Group 51
Undis
close
d
CFO Views on the Importance and Execution of Finance Functions
How satisfied are you with the performance of the following finance functions?
Easte
rn E
urop
e, Mi
ddle
East
& Af
rica
Germ
any
Japa
n
Wes
tern E
urop
e ex
cludin
g Ger
many
Results of Question 2.6: Satisfaction by Finance Function by Region
All
Latin
Ame
rica
North
Ame
rica
Capital structure
Financial planning and analysis
Internal audit
Management reporting/accounting
External financial reporting/accounting
Accounting policies
Working capital management
Making investment decisions
Merger, acquisition and disposal decisions
Regulatory compliance
Investor relations
Bank relationships
Pension management
Cash management
Equity issuance
Dividend & share buyback policy
Tax management
Risk management
Asia
exclu
ding J
apan
Austr
alia &
New
Ze
aland
Debt issuance and management
x x~ x x~ x x~ x x~ x x~ x x~ x x~ x x~x x~ x x~

January 20065
2.6: Satisfaction by Finance Function by IndustryQuestion:
N N N N N N N N N N N N N N N N N
0.8 1.0 221 1.1 1.0 8 0.6 1.0 5 0.9 1.0 16 0.7 1.0 38 0.8 1.0 5 na na <5 0.9 1.0 10 0.9 1.0 44 0.2 1.0 10 0.9 1.0 7 1.1 1.0 9 0.6 1.0 12 0.9 1.0 8 0.8 1.0 16 0.8 1.0 10 0.8 1.0 19
1.1 1.0 218 1.4 1.0 8 1.0 1.0 5 1.1 1.0 15 1.0 1.0 37 1.3 1.0 7 na na <5 1.2 1.0 10 1.1 1.0 45 0.8 1.0 9 1.1 2.0 7 1.6 2.0 9 1.0 1.0 12 1.6 2.0 7 1.0 1.0 16 1.5 2.0 11 1.1 1.0 16
0.7 1.0 178 0.8 1.0 5 na na <5 0.5 0.0 11 0.7 1.0 32 0.8 1.0 5 na na <5 1.2 1.0 9 0.6 0.5 38 0.4 0.0 5 1.0 1.5 6 1.2 1.0 5 0.6 1.0 10 1.0 1.0 7 0.5 0.0 13 0.6 0.0 9 0.5 1.0 15
0.7 1.0 197 1.0 1.0 7 na na <5 0.8 1.0 13 0.7 1.0 33 na na <5 na na <5 0.9 1.0 10 0.7 1.0 40 0.8 1.0 8 1.0 1.5 6 0.6 1.0 9 0.5 1.0 11 1.0 1.0 8 0.6 0.5 14 0.7 1.0 9 0.8 1.0 17
0.9 1.0 226 1.1 1.0 10 0.6 1.0 5 0.9 1.0 16 0.6 1.0 39 na na <5 na na <5 0.9 1.0 11 0.9 1.0 49 0.9 1.0 10 1.4 2.0 7 1.4 1.0 8 0.8 1.0 12 1.3 1.0 7 0.9 1.0 14 0.9 1.0 10 0.8 1.0 20
0.8 1.0 232 0.7 1.0 10 0.8 1.0 5 0.6 1.0 16 0.6 1.0 39 1.1 1.0 7 na na <5 0.6 1.0 11 0.7 1.0 49 0.2 0.0 10 1.0 1.0 7 1.2 1.0 9 0.8 1.0 11 0.9 1.0 8 1.1 1.0 15 0.9 1.0 11 0.8 1.0 20
0.9 1.0 200 0.8 1.0 6 1.0 1.0 5 1.1 1.0 12 0.8 1.0 32 0.7 1.0 6 na na <5 1.3 1.0 11 0.8 1.0 41 1.0 1.0 7 0.8 1.0 6 1.3 1.0 9 0.9 1.0 11 1.3 1.0 8 0.7 1.0 15 1.1 1.0 11 1.0 1.0 16
1.3 1.0 231 1.4 1.0 9 1.2 1.0 5 1.3 1.0 16 1.3 1.0 40 1.0 1.0 7 na na <5 0.8 1.0 11 1.4 1.0 50 1.0 1.0 10 1.7 2.0 7 1.8 2.0 9 1.2 1.0 11 1.4 1.5 8 0.9 1.0 15 1.3 1.0 10 1.4 1.0 20
0.4 0.0 185 0.9 1.0 8 0.4 0.0 5 0.5 0.5 12 0.3 0.0 27 na na <5 na na <5 0.5 1.0 8 0.5 0.5 44 0.3 1.0 8 0.3 0.0 7 1.1 1.0 7 0.0 0.0 11 0.6 1.0 5 0.3 0.0 12 0.4 1.0 11 0.3 0.0 16
0.8 1.0 231 0.6 1.0 10 0.6 1.0 5 0.8 1.0 16 0.9 1.0 40 1.1 1.0 7 na na <5 0.5 1.0 11 0.8 1.0 49 0.3 0.5 10 1.2 1.0 6 0.9 1.0 9 0.8 1.0 12 1.3 1.0 8 0.9 1.0 15 0.8 1.0 9 1.0 1.0 20
0.5 1.0 228 0.4 1.0 9 0.4 1.0 5 0.5 1.0 16 0.4 1.0 39 0.8 1.0 6 na na <5 0.8 1.0 11 0.5 1.0 48 0.1 0.0 9 0.4 0.0 7 0.9 1.0 9 0.7 1.0 12 0.8 1.0 8 0.5 0.0 15 0.5 1.0 10 0.4 1.0 20
0.6 1.0 223 0.5 1.0 10 0.2 0.0 5 0.5 1.0 15 0.4 1.0 37 na na <5 na na <5 0.5 1.0 10 0.4 1.0 49 0.3 0.5 10 1.0 1.0 7 1.2 1.0 9 0.5 1.0 12 0.9 1.0 8 0.9 1.0 16 0.9 1.0 9 0.7 1.0 18
0.5 1.0 212 0.2 1.0 9 0.6 1.0 5 0.5 1.0 14 0.5 1.0 36 na na <5 na na <5 0.8 1.0 11 0.3 0.0 46 0.6 1.0 10 1.0 1.0 7 0.6 1.0 8 0.4 0.0 11 1.1 1.0 8 0.4 0.0 16 1.0 1.0 9 0.6 1.0 15
0.5 1.0 218 0.5 0.5 8 0.4 1.0 5 0.4 0.0 16 0.4 1.0 38 na na <5 na na <5 0.6 1.0 11 0.5 0.0 48 0.4 1.0 9 0.5 0.5 6 0.3 0.5 8 0.5 0.5 12 0.5 0.5 6 0.6 1.0 16 0.8 1.0 9 0.4 0.0 19
0.8 1.0 228 0.4 1.0 10 0.4 1.0 5 0.6 1.0 16 0.7 1.0 39 na na <5 na na <5 1.0 1.0 11 0.8 1.0 48 0.6 1.0 10 1.3 1.0 7 1.2 1.0 9 0.6 1.0 12 1.1 1.0 7 0.8 1.0 15 0.7 1.0 11 0.8 1.0 20
0.9 1.0 227 0.7 1.0 10 1.2 1.0 5 1.1 1.0 15 0.8 1.0 37 na na <5 na na <5 1.0 1.0 11 0.9 1.0 51 0.8 1.0 10 1.4 2.0 7 1.1 1.0 8 1.0 1.0 12 1.1 1.0 7 0.9 1.0 15 0.8 1.0 11 0.9 1.0 20
0.7 1.0 225 0.6 1.0 10 0.8 1.0 5 0.8 1.0 16 0.5 1.0 37 na na <5 na na <5 0.8 1.0 11 0.7 1.0 50 0.8 1.0 10 0.9 1.0 7 0.9 1.0 8 1.0 1.0 12 0.3 0.0 6 0.9 1.0 15 0.9 1.0 11 0.8 1.0 20
0.7 1.0 231 0.8 1.0 9 0.4 1.0 5 0.8 1.0 15 0.6 1.0 39 0.3 1.0 6 na na <5 0.8 1.0 11 0.6 1.0 51 0.6 1.0 10 1.0 1.0 7 1.1 1.0 9 0.8 1.0 12 1.3 1.0 8 0.8 1.0 15 0.9 1.0 10 0.7 1.0 20
0.8 1.0 207 0.9 1.0 9 na na <5 0.9 1.0 13 0.7 1.0 33 na na <5 na na <5 0.7 1.0 11 0.8 1.0 44 0.8 1.0 10 0.9 1.0 7 1.1 1.0 7 1.1 1.0 11 0.7 1.0 7 0.5 1.0 15 1.0 1.0 9 0.5 0.0 19
Liability Strategies Group 52
Telec
ommu
ni ca
tions
Tran
spor
tation
Se
rvice
s
Media
Metal
s and
Mini
ng
Utilit
ies
Undis
close
d & O
ther
CFO Views on the Importance and Execution of Finance Functions
Chem
icals
Cons
umer
Cons
umer
Fina
nce
Oil a
nd G
as
Tech
nolog
y
Indus
trials
and
Mater
ials
Results of Question 2.6: Satisfaction by Finance Function by Industry
How satisfied are you with the performance of the following finance functions?
All
Dive
rsifie
d/Con
glo
mera
tes
Healt
h Car
e &
Phar
mace
utica
ls
Capital structure
Financial planning and analysis
Internal audit
Management reporting/accounting
External financial reporting/accounting
Accounting policies
Working capital management
Making investment decisions
Merger, acquisition and disposal decisions
Regulatory compliance
Investor relations
Bank relationships
Pension management
Cash management
Equity issuance
Dividend & share buyback policy
Tax management
Risk management
Autom
obile
s
Busin
ess S
ervic
es
Debt issuance and management
x x~ x x~ x x~ x x~ x x~ x x~ x x~ x x~x x~ x x~ x x~ x x~ x x~ x x~ x x~ x x~ x x~

January 2006
2.6: Satisfaction by Finance Function by Ratings and ListingQuestion:
N N N N N N N N
0.8 1.0 221 1.0 1.0 67 1.1 1.0 25 na na <5 0.7 1.0 125 0.8 1.0 141 0.8 1.0 78 na na <5
1.1 1.0 218 1.4 1.0 68 1.4 1.0 25 na na <5 0.9 1.0 121 1.2 1.0 141 1.0 1.0 76 na na <5
0.7 1.0 178 0.8 1.0 53 0.7 1.0 21 na na <5 0.5 1.0 100 0.8 1.0 121 0.4 0.0 56 na na <5
0.7 1.0 197 0.9 1.0 62 0.7 1.0 23 na na <5 0.6 1.0 108 0.8 1.0 135 0.4 0.0 61 na na <5
0.9 1.0 226 0.9 1.0 64 1.0 1.0 24 na na <5 0.8 1.0 134 0.9 1.0 139 0.8 1.0 85 na na <5
0.8 1.0 232 0.8 1.0 69 0.8 1.0 25 na na <5 0.7 1.0 134 0.8 1.0 146 0.6 1.0 84 na na <5
0.9 1.0 200 1.1 1.0 66 1.2 1.0 24 na na <5 0.8 1.0 107 1.1 1.0 145 0.6 1.0 54 na na <5
1.3 1.0 231 1.2 1.0 69 1.4 1.0 25 na na <5 1.3 1.0 133 1.3 1.0 145 1.3 1.0 84 na na <5
0.4 0.0 185 0.6 1.0 63 0.5 1.0 19 na na <5 0.3 0.0 100 0.5 1.0 124 0.2 0.0 60 na na <5
0.8 1.0 231 0.8 1.0 69 0.9 1.0 23 na na <5 0.8 1.0 135 0.9 1.0 145 0.7 1.0 84 na na <5
0.5 1.0 228 0.4 1.0 67 0.8 1.0 24 na na <5 0.5 1.0 133 0.6 1.0 143 0.4 1.0 83 na na <5
0.6 1.0 223 0.7 1.0 67 0.4 1.0 23 na na <5 0.5 1.0 129 0.6 1.0 138 0.4 1.0 83 na na <5
0.5 1.0 212 0.8 1.0 66 0.5 1.0 24 na na <5 0.4 1.0 118 0.6 1.0 138 0.3 0.0 73 na na <5
0.5 1.0 218 0.6 1.0 64 0.6 1.0 22 na na <5 0.4 1.0 128 0.6 1.0 134 0.4 0.0 82 na na <5
0.8 1.0 228 0.7 1.0 67 0.8 1.0 24 na na <5 0.8 1.0 133 0.8 1.0 141 0.8 1.0 85 na na <5
0.9 1.0 227 1.0 1.0 66 1.0 1.0 24 na na <5 0.9 1.0 133 1.0 1.0 142 0.8 1.0 83 na na <5
0.7 1.0 225 0.8 1.0 66 0.6 1.0 23 na na <5 0.7 1.0 132 0.8 1.0 139 0.6 1.0 84 na na <5
0.7 1.0 231 0.7 1.0 67 0.6 1.0 25 na na <5 0.8 1.0 135 0.7 1.0 145 0.7 1.0 84 na na <5
0.8 1.0 207 0.9 1.0 58 0.8 1.0 20 na na <5 0.7 1.0 125 0.9 1.0 131 0.6 1.0 74 na na <5
Liability Strategies Group 53
External financial reporting/accounting
Accounting policies
Financial planning and analysis
Regulatory compliance
Tax management
Risk management
Investor relations
Bank relationships
Management reporting/accounting
Pension management
Cash management
Working capital management
Making investment decisions
Merger, acquisition and disposal decisions
Internal audit
How satisfied are you with the performance of the following finance functions?
Debt issuance and management
Equity issuance
Dividend & share buyback policyInv
estm
ent G
rade
Non-
inves
tmen
t Gr
ade
Not R
ated
All
Capital structure
CFO Views on the Importance and Execution of Finance Functions
Undis
close
d
Listed
Not L
isted
Undis
close
d
RatingsResults of Question 2.6: Satisfaction by Finance Function by Ratings and Listing
Listing
x x~ x x~ x x~ x x~ x x~ x x~x x~ x x~
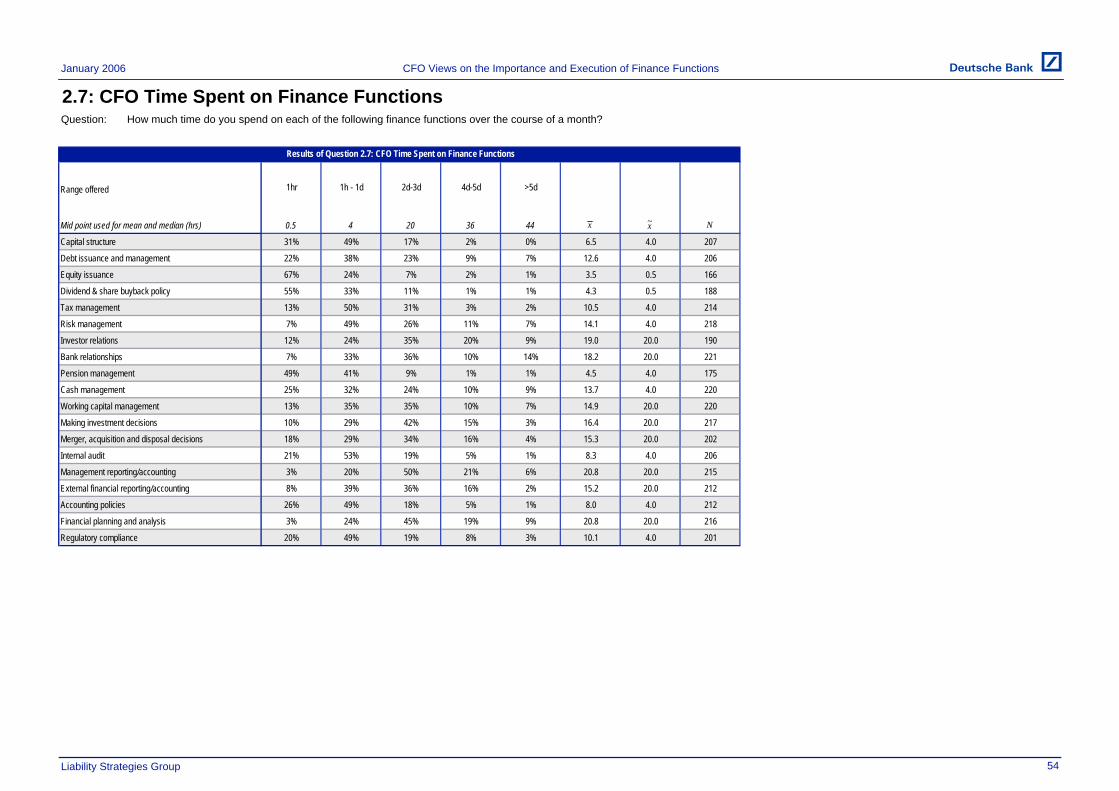
January 2006
2.7: CFO Time Spent on Finance FunctionsQuestion:
1hr 1h - 1d 2d-3d 4d-5d >5d
0.5 4 20 36 44
31% 49% 17% 2% 0% 6.5 4.0 207
22% 38% 23% 9% 7% 12.6 4.0 206
67% 24% 7% 2% 1% 3.5 0.5 166
55% 33% 11% 1% 1% 4.3 0.5 188
13% 50% 31% 3% 2% 10.5 4.0 214
7% 49% 26% 11% 7% 14.1 4.0 218
12% 24% 35% 20% 9% 19.0 20.0 190
7% 33% 36% 10% 14% 18.2 20.0 221
49% 41% 9% 1% 1% 4.5 4.0 175
25% 32% 24% 10% 9% 13.7 4.0 220
13% 35% 35% 10% 7% 14.9 20.0 220
10% 29% 42% 15% 3% 16.4 20.0 217
18% 29% 34% 16% 4% 15.3 20.0 202
21% 53% 19% 5% 1% 8.3 4.0 206
3% 20% 50% 21% 6% 20.8 20.0 215
8% 39% 36% 16% 2% 15.2 20.0 212
26% 49% 18% 5% 1% 8.0 4.0 212
3% 24% 45% 19% 9% 20.8 20.0 216
20% 49% 19% 8% 3% 10.1 4.0 201
Liability Strategies Group
CFO Views on the Importance and Execution of Finance Functions
54
Accounting policies
Financial planning and analysis
Regulatory compliance
Internal audit
External financial reporting/accounting
Tax management
Risk management
Management reporting/accounting
Pension management
Cash management
Working capital management
Making investment decisions
Investor relations
Bank relationships
How much time do you spend on each of the following finance functions over the course of a month?
Results of Question 2.7: CFO Time Spent on Finance Functions
N
Range offered
Mid point used for mean and median (hrs)
Capital structure
Debt issuance and management
Equity issuance
Merger, acquisition and disposal decisions
Dividend & share buyback policy
x x~
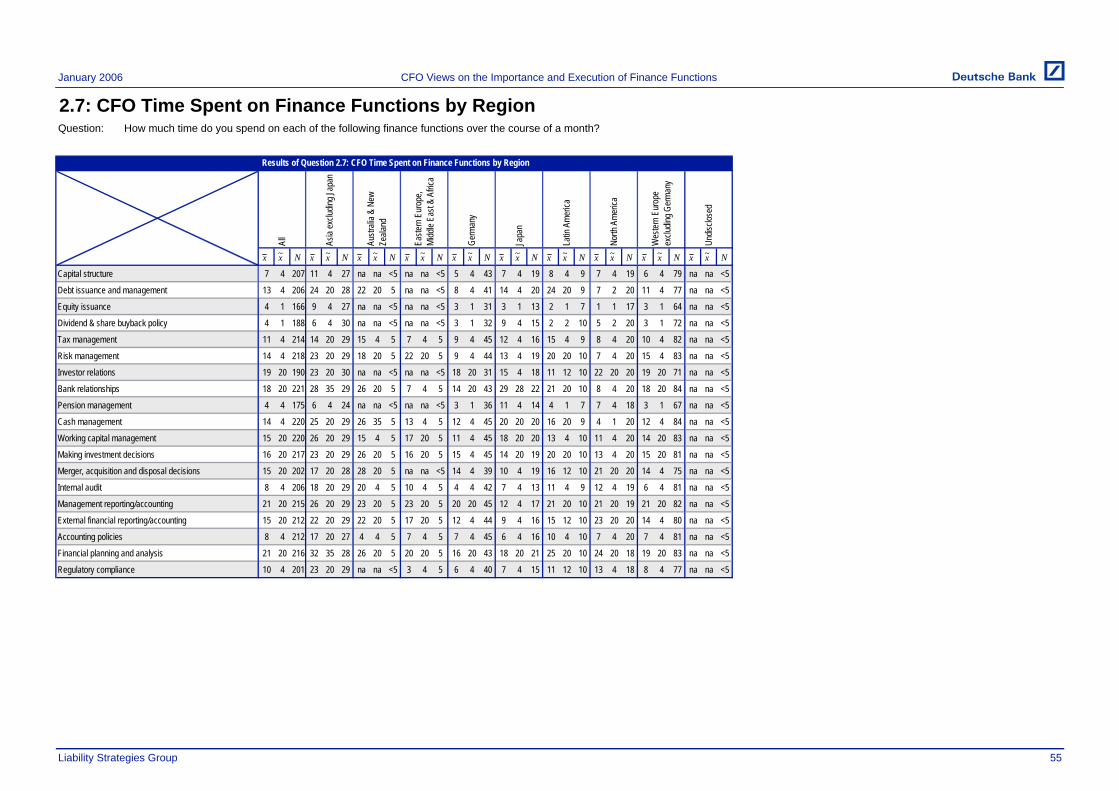
January 2006
2.7: CFO Time Spent on Finance Functions by RegionQuestion:
N N N N N N N N N N
7 4 207 11 4 27 na na <5 na na <5 5 4 43 7 4 19 8 4 9 7 4 19 6 4 79 na na <5
13 4 206 24 20 28 22 20 5 na na <5 8 4 41 14 4 20 24 20 9 7 2 20 11 4 77 na na <5
4 1 166 9 4 27 na na <5 na na <5 3 1 31 3 1 13 2 1 7 1 1 17 3 1 64 na na <5
4 1 188 6 4 30 na na <5 na na <5 3 1 32 9 4 15 2 2 10 5 2 20 3 1 72 na na <5
11 4 214 14 20 29 15 4 5 7 4 5 9 4 45 12 4 16 15 4 9 8 4 20 10 4 82 na na <5
14 4 218 23 20 29 18 20 5 22 20 5 9 4 44 13 4 19 20 20 10 7 4 20 15 4 83 na na <5
19 20 190 23 20 30 na na <5 na na <5 18 20 31 15 4 18 11 12 10 22 20 20 19 20 71 na na <5
18 20 221 28 35 29 26 20 5 7 4 5 14 20 43 29 28 22 21 20 10 8 4 20 18 20 84 na na <5
4 4 175 6 4 24 na na <5 na na <5 3 1 36 11 4 14 4 1 7 7 4 18 3 1 67 na na <5
14 4 220 25 20 29 26 35 5 13 4 5 12 4 45 20 20 20 16 20 9 4 1 20 12 4 84 na na <5
15 20 220 26 20 29 15 4 5 17 20 5 11 4 45 18 20 20 13 4 10 11 4 20 14 20 83 na na <5
16 20 217 23 20 29 26 20 5 16 20 5 15 4 45 14 20 19 20 20 10 13 4 20 15 20 81 na na <5
15 20 202 17 20 28 28 20 5 na na <5 14 4 39 10 4 19 16 12 10 21 20 20 14 4 75 na na <5
8 4 206 18 20 29 20 4 5 10 4 5 4 4 42 7 4 13 11 4 9 12 4 19 6 4 81 na na <5
21 20 215 26 20 29 23 20 5 23 20 5 20 20 45 12 4 17 21 20 10 21 20 19 21 20 82 na na <5
15 20 212 22 20 29 22 20 5 17 20 5 12 4 44 9 4 16 15 12 10 23 20 20 14 4 80 na na <5
8 4 212 17 20 27 4 4 5 7 4 5 7 4 45 6 4 16 10 4 10 7 4 20 7 4 81 na na <5
21 20 216 32 35 28 26 20 5 20 20 5 16 20 43 18 20 21 25 20 10 24 20 18 19 20 83 na na <5
10 4 201 23 20 29 na na <5 3 4 5 6 4 40 7 4 15 11 12 10 13 4 18 8 4 77 na na <5
Liability Strategies Group 55
Undis
close
d
CFO Views on the Importance and Execution of Finance Functions
How much time do you spend on each of the following finance functions over the course of a month?
Easte
rn E
urop
e, Mi
ddle
East
& Af
rica
Germ
any
Japa
n
Wes
tern E
urop
e ex
cludin
g Ger
many
Results of Question 2.7: CFO Time Spent on Finance Functions by Region
All
Latin
Ame
rica
North
Ame
rica
Capital structure
Financial planning and analysis
Internal audit
Management reporting/accounting
External financial reporting/accounting
Accounting policies
Working capital management
Making investment decisions
Merger, acquisition and disposal decisions
Regulatory compliance
Investor relations
Bank relationships
Pension management
Cash management
Equity issuance
Dividend & share buyback policy
Tax management
Risk management
Asia
exclu
ding J
apan
Austr
alia &
New
Ze
aland
Debt issuance and management
x x~ x x~ x x~ x x~ x x~ x x~ x x~ x x~x x~ x x~

January 2006
2.7: CFO Time Spent on Finance Functions by IndustryQuestion:
N N N N N N N N N N N N N N N N N
7 4 207 3 4 6 6 4 5 5 4 16 6 4 36 na na <5 na na <5 3 4 10 6 4 45 11 4 9 9 4 6 9 4 9 9 4 12 12 4 6 6 4 15 10 4 9 3 4 16
13 4 206 15 12 6 9 4 5 5 4 15 12 4 35 26 20 7 na na <5 6 1 10 10 4 45 7 4 8 14 4 7 25 35 9 15 12 12 30 35 6 13 4 15 25 20 9 12 4 14
4 1 166 2 1 5 na na <5 1 1 11 4 4 29 na na <5 na na <5 1 1 9 3 1 38 8 1 5 1 1 5 11 4 5 9 4 10 na na <5 1 1 12 2 2 8 1 1 14
4 1 188 10 1 7 na na <5 2 1 13 4 1 31 na na <5 na na <5 4 2 10 3 1 40 10 4 7 8 4 6 8 4 9 4 4 11 6 4 6 2 1 14 9 4 9 2 2 14
11 4 214 13 4 8 7 4 5 8 4 16 12 4 37 na na <5 na na <5 10 4 11 10 4 48 5 4 9 13 4 7 16 12 8 10 4 12 9 4 6 13 20 13 15 12 10 6 4 17
14 4 218 11 4 8 17 20 5 8 4 16 14 4 38 13 4 6 na na <5 5 4 11 15 4 48 10 4 9 15 20 7 18 12 8 18 20 11 21 20 6 16 12 14 25 20 10 12 4 18
19 20 190 16 20 5 23 20 5 20 20 12 16 20 31 15 4 6 na na <5 21 20 11 16 12 40 22 20 7 15 12 6 22 20 8 24 20 11 32 35 6 18 20 14 27 20 10 19 20 15
18 20 221 17 20 7 22 20 5 12 4 16 18 20 38 39 44 7 na na <5 9 4 11 16 20 49 15 20 9 22 20 7 23 20 9 21 20 11 28 35 7 19 20 14 23 20 10 17 12 18
4 4 175 11 4 7 2 1 5 2 2 12 4 1 26 na na <5 na na <5 4 2 8 4 4 43 2 1 7 5 4 7 12 4 7 5 1 11 na na <5 6 4 11 5 4 9 1 1 16
14 4 220 10 4 8 11 4 5 10 4 16 13 4 38 31 44 7 na na <5 9 1 11 14 4 49 11 4 9 12 12 6 13 4 9 15 20 12 11 4 6 14 4 14 15 20 9 16 4 18
15 20 220 16 20 8 16 20 5 12 4 16 13 4 38 27 32 6 na na <5 8 4 11 17 20 48 10 4 9 16 20 7 15 4 9 18 20 12 14 12 6 12 4 14 14 12 10 19 20 18
16 20 217 13 4 8 20 20 5 13 12 16 15 20 37 na na <5 na na <5 7 4 10 15 20 48 18 20 9 25 20 7 26 20 9 17 20 12 24 20 7 19 20 15 19 20 10 20 20 17
15 20 202 14 20 7 16 20 5 13 20 15 15 12 34 na na <5 na na <5 15 4 11 12 4 45 19 20 9 19 20 7 19 20 8 20 20 11 28 20 7 18 20 15 11 4 9 15 20 14
8 4 206 3 4 7 3 4 5 6 4 16 7 4 36 na na <5 na na <5 7 4 11 7 4 47 5 4 8 11 4 6 13 4 8 15 20 12 20 20 5 9 4 15 10 4 8 7 4 17
21 20 215 14 4 8 21 20 5 20 20 16 17 20 37 na na <5 na na <5 18 20 11 23 20 47 20 20 9 23 20 7 21 20 9 30 35 12 29 28 6 23 20 14 15 20 10 23 20 18
15 20 212 16 12 8 19 20 5 17 20 15 10 4 35 na na <5 na na <5 17 20 11 13 4 49 14 20 8 15 4 7 21 20 8 24 28 12 26 28 6 18 20 14 15 12 10 16 20 18
8 4 212 9 4 8 9 4 5 6 4 15 7 4 35 na na <5 na na <5 6 1 11 6 4 48 3 4 9 10 4 7 14 4 8 10 4 12 17 12 6 9 4 14 14 4 10 7 4 18
21 20 216 20 20 7 13 4 5 20 20 16 17 20 37 28 35 5 na na <5 17 20 11 20 20 47 23 20 9 17 20 7 28 20 8 26 20 12 28 35 7 20 20 14 25 28 10 25 20 18
10 4 201 12 4 7 na na <5 7 4 15 7 4 31 na na <5 na na <5 8 4 10 9 4 46 7 4 9 8 4 7 15 20 8 17 20 11 19 20 6 10 4 15 14 4 10 8 4 17
Liability Strategies Group 56
Telec
ommu
ni ca
tions
Tran
spor
tation
Se
rvice
s
Media
Metal
s and
Mini
ng
Utilit
ies
Undis
close
d & O
ther
CFO Views on the Importance and Execution of Finance Functions
Chem
icals
Cons
umer
Cons
umer
Fina
nce
Oil a
nd G
as
Tech
nolog
y
Indus
trials
and
Mater
ials
Results of Question 2.7: CFO Time Spent on Finance Functions by Industry
How much time do you spend on each of the following finance functions over the course of a month?
All
Dive
rsifie
d/Con
glo
mera
tes
Healt
h Car
e &
Phar
mace
utica
ls
Capital structure
Financial planning and analysis
Internal audit
Management reporting/accounting
External financial reporting/accounting
Accounting policies
Working capital management
Making investment decisions
Merger, acquisition and disposal decisions
Regulatory compliance
Investor relations
Bank relationships
Pension management
Cash management
Equity issuance
Dividend & share buyback policy
Tax management
Risk management
Autom
obile
s
Busin
ess S
ervic
es
Debt issuance and management
x x~ x x~ x x~ x x~ x x~ x x~ x x~ x x~x x~ x x~ x x~ x x~ x x~ x x~ x x~ x x~ x x~

January 2006
2.7: CFO Time Spent on Finance Functions by Ratings and ListingQuestion:
N N N N N N N N
7 4 207 7 4 62 10 4 22 na na <5 6 4 119 7 4 131 6 4 74 na na <5
13 4 206 12 4 63 19 20 23 na na <5 12 4 116 12 4 132 14 4 73 na na <5
4 1 166 3 1 47 5 1 18 na na <5 3 1 97 4 1 111 2 1 54 na na <5
4 1 188 7 4 58 3 1 21 na na <5 3 1 105 6 4 128 1 1 59 na na <5
11 4 214 11 4 60 12 4 23 na na <5 10 4 127 11 4 132 11 4 80 na na <5
14 4 218 13 4 64 13 4 23 na na <5 14 4 127 14 4 137 14 4 79 na na <5
19 20 190 23 20 62 20 20 22 na na <5 16 20 103 22 20 135 10 4 54 na na <5
18 20 221 16 12 66 20 20 24 na na <5 18 20 127 18 20 140 19 20 79 na na <5
4 4 175 6 4 58 8 4 18 na na <5 3 1 96 5 4 118 2 1 56 na na <5
14 4 220 10 4 66 9 4 22 na na <5 15 4 128 12 4 139 17 20 79 na na <5
15 20 220 11 4 66 16 12 22 na na <5 16 20 128 14 4 138 16 20 80 na na <5
16 20 217 17 20 64 16 20 24 na na <5 16 20 125 17 20 135 16 20 80 na na <5
15 20 202 18 20 61 17 20 24 na na <5 13 4 113 17 20 132 12 4 69 na na <5
8 4 206 8 4 59 12 4 21 na na <5 7 4 122 9 4 129 8 4 75 na na <5
21 20 215 18 20 61 21 20 23 na na <5 22 20 127 21 20 134 21 20 79 na na <5
15 20 212 17 20 61 17 20 23 na na <5 14 4 124 17 20 134 12 4 76 na na <5
8 4 212 9 4 61 10 4 23 na na <5 7 4 124 8 4 133 7 4 77 na na <5
21 20 216 21 20 62 22 20 23 na na <5 20 20 127 21 20 135 20 20 79 na na <5
10 4 201 12 4 58 11 4 22 na na <5 9 4 117 11 4 129 8 4 70 na na <5
Liability Strategies Group 57
CFO Views on the Importance and Execution of Finance Functions
Undis
close
d
Listed
Not L
isted
Undis
close
d
RatingsResults of Question 2.7: CFO Time Spent on Finance Functions by Ratings and Listing
Listing
How much time do you spend on each of the following finance functions over the course of a month?
Non-
inves
tmen
t Gr
ade
Debt issuance and management
Equity issuance
Dividend & share buyback policyInv
estm
ent G
rade
Not R
ated
All
Capital structure
Management reporting/accounting
Pension management
Cash management
Working capital management
Making investment decisions
Merger, acquisition and disposal decisions
Internal audit
Tax management
Risk management
Investor relations
Bank relationships
External financial reporting/accounting
Accounting policies
Financial planning and analysis
Regulatory compliance
x x~ x x~ x x~ x x~ x x~ x x~x x~ x x~

January 2006
2.8: Desired Resource Levels for Finance FunctionsQuestion:
Substantially Less Same Level
Substantially More
-2 -1 0 1 2
1% 1% 76% 18% 4% 0.2 0.0 212
0% 2% 83% 13% 2% 0.2 0.0 207
2% 4% 87% 7% 1% 0.0 0.0 171
1% 3% 83% 12% 2% 0.1 0.0 190
0% 1% 63% 31% 5% 0.4 0.0 216
0% 0% 43% 45% 12% 0.7 1.0 221
1% 6% 64% 23% 7% 0.3 0.0 192
0% 3% 80% 13% 3% 0.2 0.0 219
3% 5% 70% 21% 1% 0.1 0.0 176
0% 1% 68% 26% 4% 0.3 0.0 219
0% 1% 49% 40% 10% 0.6 0.0 220
0% 1% 61% 32% 6% 0.4 0.0 216
0% 5% 61% 29% 5% 0.3 0.0 207
0% 6% 71% 18% 5% 0.2 0.0 207
0% 5% 68% 24% 3% 0.2 0.0 217
0% 7% 80% 12% 1% 0.1 0.0 213
0% 7% 77% 14% 2% 0.1 0.0 213
0% 2% 59% 32% 7% 0.4 0.0 221
1% 10% 78% 8% 2% 0.0 0.0 201
Liability Strategies Group 58
Debt issuance and management
Equity issuance
Dividend & share buyback policy
Do you think your company should be devoting more, less or about the same resources to the following finance functions?
Results of Question 2.8: Desired Resource Levels for Finance Functions
N
Capital structure
Tax management
Risk management
Management reporting/accounting
Pension management
Cash management
Working capital management
Making investment decisions
Investor relations
Bank relationships
CFO Views on the Importance and Execution of Finance Functions
External financial reporting/accounting
Accounting policies
Financial planning and analysis
Regulatory compliance
Merger, acquisition and disposal decisions
Internal audit
x x~
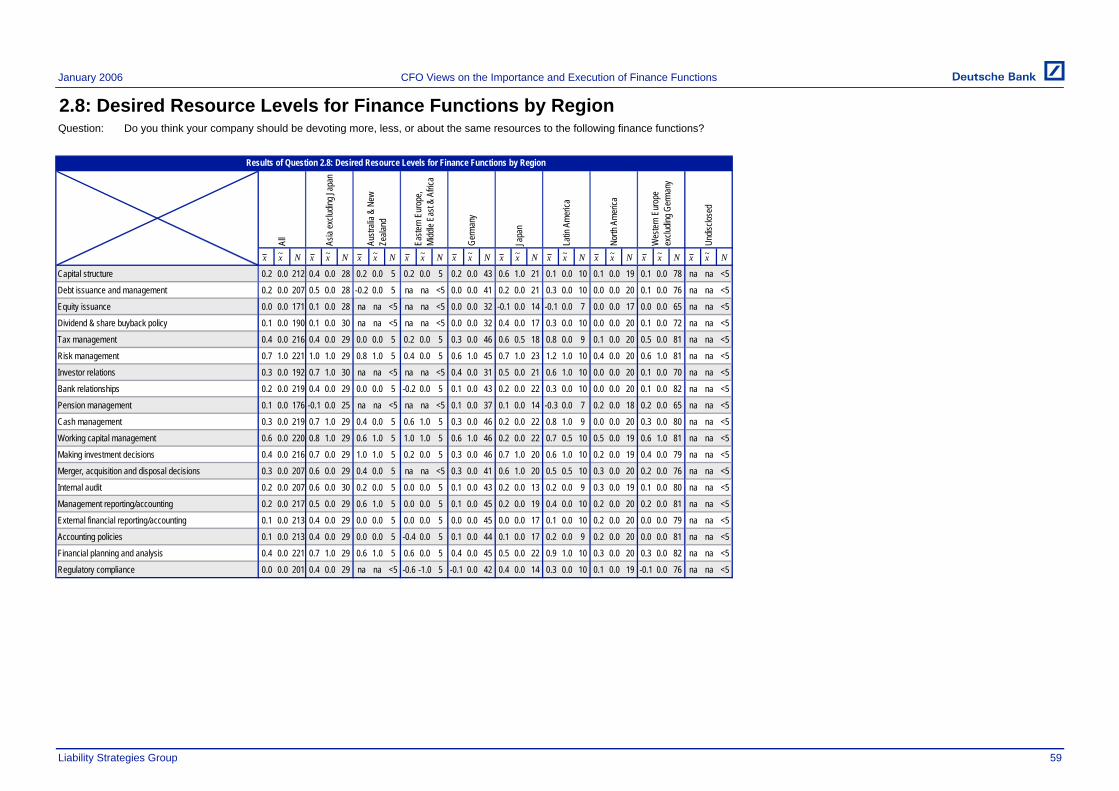
January 2006
2.8: Desired Resource Levels for Finance Functions by RegionQuestion:
N N N N N N N N N N
0.2 0.0 212 0.4 0.0 28 0.2 0.0 5 0.2 0.0 5 0.2 0.0 43 0.6 1.0 21 0.1 0.0 10 0.1 0.0 19 0.1 0.0 78 na na <5
0.2 0.0 207 0.5 0.0 28 -0.2 0.0 5 na na <5 0.0 0.0 41 0.2 0.0 21 0.3 0.0 10 0.0 0.0 20 0.1 0.0 76 na na <5
0.0 0.0 171 0.1 0.0 28 na na <5 na na <5 0.0 0.0 32 -0.1 0.0 14 -0.1 0.0 7 0.0 0.0 17 0.0 0.0 65 na na <5
0.1 0.0 190 0.1 0.0 30 na na <5 na na <5 0.0 0.0 32 0.4 0.0 17 0.3 0.0 10 0.0 0.0 20 0.1 0.0 72 na na <5
0.4 0.0 216 0.4 0.0 29 0.0 0.0 5 0.2 0.0 5 0.3 0.0 46 0.6 0.5 18 0.8 0.0 9 0.1 0.0 20 0.5 0.0 81 na na <5
0.7 1.0 221 1.0 1.0 29 0.8 1.0 5 0.4 0.0 5 0.6 1.0 45 0.7 1.0 23 1.2 1.0 10 0.4 0.0 20 0.6 1.0 81 na na <5
0.3 0.0 192 0.7 1.0 30 na na <5 na na <5 0.4 0.0 31 0.5 0.0 21 0.6 1.0 10 0.0 0.0 20 0.1 0.0 70 na na <5
0.2 0.0 219 0.4 0.0 29 0.0 0.0 5 -0.2 0.0 5 0.1 0.0 43 0.2 0.0 22 0.3 0.0 10 0.0 0.0 20 0.1 0.0 82 na na <5
0.1 0.0 176 -0.1 0.0 25 na na <5 na na <5 0.1 0.0 37 0.1 0.0 14 -0.3 0.0 7 0.2 0.0 18 0.2 0.0 65 na na <5
0.3 0.0 219 0.7 1.0 29 0.4 0.0 5 0.6 1.0 5 0.3 0.0 46 0.2 0.0 22 0.8 1.0 9 0.0 0.0 20 0.3 0.0 80 na na <5
0.6 0.0 220 0.8 1.0 29 0.6 1.0 5 1.0 1.0 5 0.6 1.0 46 0.2 0.0 22 0.7 0.5 10 0.5 0.0 19 0.6 1.0 81 na na <5
0.4 0.0 216 0.7 0.0 29 1.0 1.0 5 0.2 0.0 5 0.3 0.0 46 0.7 1.0 20 0.6 1.0 10 0.2 0.0 19 0.4 0.0 79 na na <5
0.3 0.0 207 0.6 0.0 29 0.4 0.0 5 na na <5 0.3 0.0 41 0.6 1.0 20 0.5 0.5 10 0.3 0.0 20 0.2 0.0 76 na na <5
0.2 0.0 207 0.6 0.0 30 0.2 0.0 5 0.0 0.0 5 0.1 0.0 43 0.2 0.0 13 0.2 0.0 9 0.3 0.0 19 0.1 0.0 80 na na <5
0.2 0.0 217 0.5 0.0 29 0.6 1.0 5 0.0 0.0 5 0.1 0.0 45 0.2 0.0 19 0.4 0.0 10 0.2 0.0 20 0.2 0.0 81 na na <5
0.1 0.0 213 0.4 0.0 29 0.0 0.0 5 0.0 0.0 5 0.0 0.0 45 0.0 0.0 17 0.1 0.0 10 0.2 0.0 20 0.0 0.0 79 na na <5
0.1 0.0 213 0.4 0.0 29 0.0 0.0 5 -0.4 0.0 5 0.1 0.0 44 0.1 0.0 17 0.2 0.0 9 0.2 0.0 20 0.0 0.0 81 na na <5
0.4 0.0 221 0.7 1.0 29 0.6 1.0 5 0.6 0.0 5 0.4 0.0 45 0.5 0.0 22 0.9 1.0 10 0.3 0.0 20 0.3 0.0 82 na na <5
0.0 0.0 201 0.4 0.0 29 na na <5 -0.6 -1.0 5 -0.1 0.0 42 0.4 0.0 14 0.3 0.0 10 0.1 0.0 19 -0.1 0.0 76 na na <5
Liability Strategies Group 59
Undis
close
d
CFO Views on the Importance and Execution of Finance Functions
Do you think your company should be devoting more, less, or about the same resources to the following finance functions?
Easte
rn E
urop
e, Mi
ddle
East
& Af
rica
Germ
any
Japa
n
Wes
tern E
urop
e ex
cludin
g Ger
many
Results of Question 2.8: Desired Resource Levels for Finance Functions by Region
All
Latin
Ame
rica
North
Ame
rica
Capital structure
Financial planning and analysis
Internal audit
Management reporting/accounting
External financial reporting/accounting
Accounting policies
Working capital management
Making investment decisions
Merger, acquisition and disposal decisions
Regulatory compliance
Investor relations
Bank relationships
Pension management
Cash management
Equity issuance
Dividend & share buyback policy
Tax management
Risk management
Asia
exclu
ding J
apan
Austr
alia &
New
Ze
aland
Debt issuance and management
x x~ x x~ x x~ x x~ x x~ x x~ x x~ x x~x x~ x x~

'January 2006
2.8: Desired Resource Levels for Finance Functions by IndustryQuestion:
N N N N N N N N N N N N N N N N N
0.2 0.0 212 0.6 0.0 7 0.0 0.0 5 0.1 0.0 16 0.4 0.0 5 0.3 0.0 36 na na <5 0.1 0.0 10 0.3 0.0 44 0.4 0.0 9 0.1 0.0 7 0.1 0.0 9 0.2 0.0 12 -0.1 0.0 7 0.1 0.0 15 0.5 0.0 10 0.2 0.0 16
0.2 0.0 207 0.1 0.0 7 0.0 0.0 5 0.1 0.0 15 0.1 0.0 7 0.1 0.0 34 na na <5 0.1 0.0 10 0.2 0.0 44 0.1 0.0 8 0.1 0.0 7 0.3 0.0 9 0.1 0.0 12 0.2 0.0 6 0.3 0.0 15 0.4 0.0 10 0.1 0.0 14
0.0 0.0 171 -0.2 0.0 5 na na <5 0.0 0.0 11 na na <5 0.0 0.0 29 na na <5 0.0 0.0 9 0.0 0.0 38 0.0 0.0 5 0.2 0.0 6 -0.4 0.0 5 0.0 0.0 10 -0.4 0.0 5 0.1 0.0 12 0.1 0.0 10 0.0 0.0 14
0.1 0.0 190 0.0 0.0 7 na na <5 0.1 0.0 13 na na <5 0.2 0.0 31 na na <5 0.1 0.0 10 0.1 0.0 40 0.1 0.0 7 0.2 0.0 6 0.4 0.0 9 -0.2 0.0 11 0.0 0.0 7 0.0 0.0 14 0.0 0.0 9 0.2 0.0 14
0.4 0.0 216 0.3 0.0 9 0.0 0.0 5 0.5 0.0 16 na na <5 0.5 0.0 36 na na <5 0.5 0.0 11 0.4 0.0 48 0.3 0.0 9 0.4 0.0 7 0.6 0.0 8 0.4 0.0 12 0.2 0.0 6 0.4 0.0 13 0.2 0.0 11 0.1 0.0 17
0.7 1.0 221 1.1 1.0 9 0.2 0.0 5 0.7 1.0 16 0.7 0.5 6 0.8 1.0 37 na na <5 0.3 0.0 11 0.8 1.0 48 0.4 0.0 9 0.6 1.0 7 1.0 1.0 9 0.7 1.0 11 0.3 0.0 7 0.5 0.5 14 0.8 1.0 11 0.6 0.0 17
0.3 0.0 192 0.3 0.0 6 0.0 0.0 5 0.4 0.0 12 0.7 0.5 6 0.1 0.0 30 na na <5 0.2 0.0 11 0.3 0.0 40 -0.1 0.0 7 -0.2 0.0 6 0.8 1.0 9 0.5 1.0 11 0.1 0.0 7 0.3 0.0 14 0.5 0.0 10 0.4 0.0 14
0.2 0.0 219 0.1 0.0 8 0.2 0.0 5 0.0 0.0 16 0.5 0.0 6 0.1 0.0 37 na na <5 0.1 0.0 11 0.2 0.0 49 0.1 0.0 9 0.0 0.0 7 0.3 0.0 9 0.2 0.0 11 0.4 0.0 7 0.4 0.0 14 -0.3 0.0 10 0.1 0.0 17
0.1 0.0 176 0.4 0.0 7 0.0 0.0 5 0.4 0.0 12 na na <5 0.1 0.0 25 na na <5 0.1 0.0 8 0.2 0.0 43 0.0 0.0 7 -0.3 0.0 7 -0.1 0.0 7 0.0 0.0 11 na na <5 -0.1 0.0 11 -0.2 0.0 10 0.2 0.0 15
0.3 0.0 219 1.0 1.0 8 0.4 0.0 5 0.3 0.0 16 0.1 0.0 7 0.2 0.0 37 na na <5 0.2 0.0 11 0.3 0.0 49 0.1 0.0 9 0.5 0.5 6 0.7 1.0 9 0.6 1.0 12 0.4 0.0 7 0.4 0.0 13 0.2 0.0 9 0.2 0.0 17
0.6 0.0 220 1.1 1.0 8 0.4 1.0 5 0.6 0.5 16 0.3 0.0 7 0.5 0.0 37 na na <5 0.2 0.0 11 0.7 1.0 47 0.8 1.0 9 0.6 0.0 7 0.6 0.0 9 0.6 1.0 12 0.3 0.0 7 0.8 1.0 14 0.2 0.0 10 0.7 1.0 17
0.4 0.0 216 0.7 1.0 9 0.4 0.0 5 0.3 0.0 16 na na <5 0.3 0.0 36 na na <5 0.2 0.0 10 0.6 0.0 47 0.4 0.0 9 0.1 0.0 7 0.7 1.0 9 0.6 0.5 12 0.3 0.0 7 0.5 0.0 15 0.6 0.0 10 0.1 0.0 16
0.3 0.0 207 0.8 1.0 8 0.4 0.0 5 0.4 0.0 15 na na <5 0.3 0.0 34 na na <5 0.4 0.0 11 0.4 0.0 46 0.2 0.0 9 0.6 0.0 7 0.3 0.5 8 0.5 0.0 11 0.4 0.0 7 0.1 0.0 15 0.3 0.0 10 0.0 0.0 14
0.2 0.0 207 -0.1 0.0 7 -0.4 0.0 5 0.2 0.0 16 na na <5 0.3 0.0 35 na na <5 0.5 0.0 11 0.1 0.0 47 0.0 0.0 8 0.0 0.0 6 0.4 0.0 8 0.5 0.0 12 0.2 0.0 5 0.5 0.0 15 0.1 0.0 9 0.2 0.0 16
0.2 0.0 217 -0.2 0.0 9 0.0 0.0 5 0.3 0.0 16 na na <5 0.3 0.0 36 na na <5 0.0 0.0 11 0.2 0.0 48 0.0 0.0 8 0.0 0.0 7 0.3 0.0 9 0.5 0.5 12 0.5 0.0 6 0.6 0.0 14 0.4 0.0 11 0.2 0.0 17
0.1 0.0 213 -0.2 0.0 9 0.0 0.0 5 0.1 0.0 15 na na <5 0.1 0.0 34 na na <5 0.0 0.0 11 0.0 0.0 49 -0.1 0.0 8 0.0 0.0 7 0.0 0.0 8 0.3 0.0 12 0.3 0.0 6 0.2 0.0 14 0.2 0.0 10 0.1 0.0 17
0.1 0.0 213 0.1 0.0 9 -0.2 0.0 5 0.1 0.0 16 na na <5 0.2 0.0 36 na na <5 0.0 0.0 11 0.0 0.0 47 0.1 0.0 9 -0.1 0.0 7 0.1 0.0 7 0.5 0.5 12 0.3 0.0 6 0.3 0.0 14 0.2 0.0 10 0.0 0.0 17
0.4 0.0 221 0.8 0.5 8 0.4 0.0 5 0.5 0.0 16 0.0 0.0 6 0.4 0.0 37 na na <5 0.0 0.0 11 0.4 0.0 49 0.3 0.0 9 0.3 0.0 7 0.8 1.0 9 0.6 1.0 12 0.1 0.0 7 0.5 0.0 14 0.5 0.0 10 0.5 0.0 17
0.0 0.0 201 -0.3 0.0 7 na na <5 -0.1 0.0 13 na na <5 0.0 0.0 32 na na <5 0.1 0.0 11 0.0 0.0 44 -0.1 0.0 9 -0.1 0.0 7 0.1 0.0 8 0.2 0.0 11 0.2 0.0 6 0.1 0.0 15 0.1 0.0 9 -0.1 0.0 17
Liability Strategies Group 60
All
Autom
obile
s
Busin
ess S
ervic
es
Debt issuance and management
Equity issuance
Dividend & share buyback policy
Tax management
Risk management
Investor relations
Bank relationships
Pension management
Cash management
Working capital management
Making investment decisions
Merger, acquisition and disposal decisions
Internal audit
External financial reporting/accounting
Accounting policies
Financial planning and analysis
Regulatory compliance
Do you think your company should be devoting more, less, or about the same resources to the following finance functions?
Dive
rsifie
d/Con
glo
mera
tes
Healt
h Car
e &
Phar
mace
utica
ls
Capital structure
Management reporting/accounting
Utilit
ies
Undis
close
d & O
ther
CFO Views on the Importance and Execution of Finance Functions
Chem
icals
Cons
umer
Cons
umer
Fina
nce
Oil a
nd G
as
Tech
nolog
y
Indus
trials
and
Mater
ials
Results of Question 2.8: Desired Resource Levels for Finance Functions by Industry
Telec
ommu
ni ca
tions
Tran
spor
tation
Se
rvice
s
Media
Metal
s and
Mini
ng
x x~ x x~ x x~ x x~ x x~ x x~ x x~ x x~x x~ x x~ x x~ x x~ x x~ x x~ x x~ x x~ x x~

January 2006
2.8: Desired Resource Levels for Finance Functions by Ratings and ListingQuestion:
N N N N N N N N
0.2 0.0 212 0.2 0.0 63 0.2 0.0 24 na na <5 0.2 0.0 121 0.3 0.0 136 0.2 0.0 74 na na <5
0.2 0.0 207 0.1 0.0 63 0.1 0.0 24 na na <5 0.2 0.0 116 0.1 0.0 135 0.2 0.0 71 na na <5
0.0 0.0 171 -0.1 0.0 50 0.0 0.0 20 na na <5 0.1 0.0 97 0.0 0.0 115 0.0 0.0 55 na na <5
0.1 0.0 190 0.1 0.0 58 0.0 0.0 23 na na <5 0.1 0.0 105 0.1 0.0 131 0.1 0.0 58 na na <5
0.4 0.0 216 0.4 0.0 61 0.3 0.0 23 na na <5 0.4 0.0 128 0.4 0.0 135 0.4 0.0 79 na na <5
0.7 1.0 221 0.7 1.0 65 0.5 0.5 24 na na <5 0.7 1.0 128 0.6 1.0 141 0.9 1.0 78 na na <5
0.3 0.0 192 0.3 0.0 62 0.2 0.0 23 na na <5 0.3 0.0 104 0.3 0.0 139 0.3 0.0 52 na na <5
0.2 0.0 219 0.1 0.0 64 0.1 0.0 24 na na <5 0.2 0.0 127 0.1 0.0 139 0.2 0.0 78 na na <5
0.1 0.0 176 0.2 0.0 58 0.3 0.0 18 na na <5 0.1 0.0 97 0.2 0.0 119 -0.1 0.0 56 na na <5
0.3 0.0 219 0.3 0.0 64 0.3 0.0 23 na na <5 0.4 0.0 128 0.3 0.0 139 0.5 0.0 78 na na <5
0.6 0.0 220 0.4 0.0 65 0.5 0.0 23 na na <5 0.6 1.0 128 0.5 0.0 139 0.8 1.0 79 na na <5
0.4 0.0 216 0.5 0.0 63 0.4 0.0 23 na na <5 0.4 0.0 126 0.4 0.0 135 0.4 0.0 79 na na <5
0.3 0.0 207 0.3 0.0 63 0.4 0.0 24 na na <5 0.3 0.0 116 0.4 0.0 135 0.3 0.0 71 na na <5
0.2 0.0 207 0.1 0.0 60 0.3 0.0 21 na na <5 0.3 0.0 122 0.2 0.0 129 0.2 0.0 76 na na <5
0.2 0.0 217 0.1 0.0 63 0.3 0.0 23 na na <5 0.3 0.0 127 0.2 0.0 137 0.3 0.0 78 na na <5
0.1 0.0 213 0.0 0.0 61 0.2 0.0 23 na na <5 0.1 0.0 125 0.1 0.0 135 0.1 0.0 76 na na <5
0.1 0.0 213 0.0 0.0 61 0.2 0.0 23 na na <5 0.2 0.0 125 0.1 0.0 133 0.2 0.0 78 na na <5
0.4 0.0 221 0.4 0.0 63 0.5 0.0 24 na na <5 0.4 0.0 130 0.4 0.0 140 0.5 0.0 79 na na <5
0.0 0.0 201 0.0 0.0 56 0.3 0.0 22 na na <5 0.0 0.0 119 0.0 0.0 128 0.0 0.0 71 na na <5
Liability Strategies Group 61
External financial reporting/accounting
Accounting policies
Financial planning and analysis
Regulatory compliance
Tax management
Risk management
Investor relations
Bank relationships
Management reporting/accounting
Pension management
Cash management
Working capital management
Making investment decisions
Merger, acquisition and disposal decisions
Internal audit
Do you think your company should be devoting more, less, or about the same resources to the following finance functions?
Debt issuance and management
Equity issuance
Dividend & share buyback policyInv
estm
ent G
rade
Non-
inves
tmen
t Gr
ade
Not R
ated
All
Capital structure
CFO Views on the Importance and Execution of Finance Functions
Undis
close
d
Listed
Not L
isted
Undis
close
d
RatingsResults of Question 2.8: Desired Resource Levels for Finance Functions by Ratings and Listing
Listing
x x~ x x~ x x~ x x~ x x~ x x~x x~ x x~

January 2006
2.9: Limits to InvestingQuestion:
Not Limiting Very Limiting
0 1 2 3 4 5
20% 14% 15% 27% 22% 3% 2.3 3.0 235
32% 20% 13% 14% 18% 3% 1.8 1.0 230
38% 26% 13% 13% 10% 1% 1.3 1.0 230
23% 19% 20% 21% 13% 5% 2.0 2.0 232
Liability Strategies Group 62
Results of Question 2.9: Limits to Investing
Which of the following factors have limited your ability to take on substantial investment projects?
N
Internal funds
Ability to raise external funds
Legal and regulatory requirements
Managerial resources
CFO Views on the Importance and Execution of Finance Functions
x x~
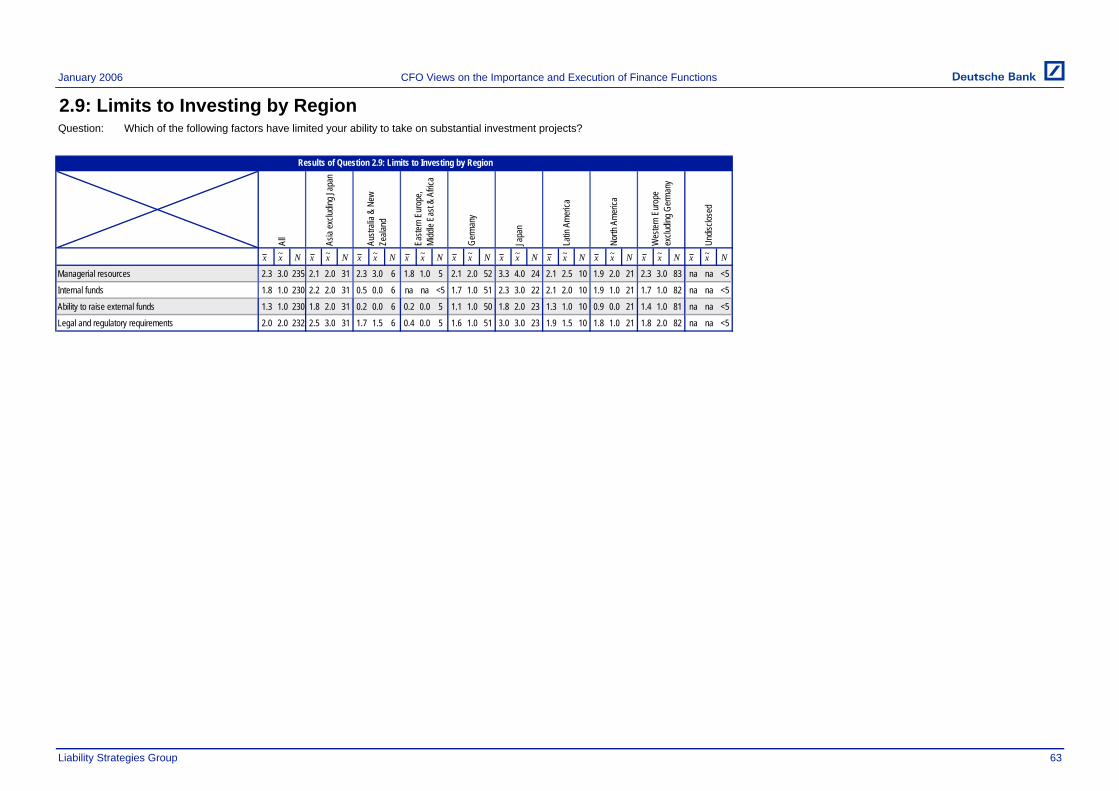
January 2006
2.9: Limits to Investing by RegionQuestion:
N N N N N N N N N N
2.3 3.0 235 2.1 2.0 31 2.3 3.0 6 1.8 1.0 5 2.1 2.0 52 3.3 4.0 24 2.1 2.5 10 1.9 2.0 21 2.3 3.0 83 na na <5
1.8 1.0 230 2.2 2.0 31 0.5 0.0 6 na na <5 1.7 1.0 51 2.3 3.0 22 2.1 2.0 10 1.9 1.0 21 1.7 1.0 82 na na <5
1.3 1.0 230 1.8 2.0 31 0.2 0.0 6 0.2 0.0 5 1.1 1.0 50 1.8 2.0 23 1.3 1.0 10 0.9 0.0 21 1.4 1.0 81 na na <5
2.0 2.0 232 2.5 3.0 31 1.7 1.5 6 0.4 0.0 5 1.6 1.0 51 3.0 3.0 23 1.9 1.5 10 1.8 1.0 21 1.8 2.0 82 na na <5
Liability Strategies Group 63
Undis
close
d
CFO Views on the Importance and Execution of Finance Functions
Which of the following factors have limited your ability to take on substantial investment projects?
Easte
rn E
urop
e, Mi
ddle
East
& Af
rica
Germ
any
Japa
n
Wes
tern E
urop
e ex
cludin
g Ger
many
Results of Question 2.9: Limits to Investing by Region
Latin
Ame
rica
North
Ame
rica
Managerial resources
Internal funds
Ability to raise external funds
Legal and regulatory requirements
All
Asia
exclu
ding J
apan
Austr
alia &
New
Ze
aland
x x~ x x~ x x~ x x~ x x~ x x~ x x~ x x~x x~ x x~

January 2006
2.9: Limits to Investing by IndustryQuestion:
N N N N N N N N N N N N N N N N N
2.3 3.0 235 1.6 1.0 10 1.2 0.0 5 1.7 1.0 16 2.3 3.0 38 2.9 3.0 7 na na <5 2.5 3.0 12 2.7 3.0 51 2.4 3.0 9 2.6 3.0 7 2.9 2.0 9 2.2 2.0 13 2.3 2.0 8 1.9 2.5 16 1.9 2.0 11 1.8 1.0 19
1.8 1.0 230 0.8 0.5 10 0.2 0.0 5 1.4 1.0 16 1.8 1.5 38 1.9 3.0 7 na na <5 2.3 2.5 12 2.3 2.0 48 2.1 3.0 9 0.9 1.0 7 2.2 1.0 9 1.5 0.0 13 2.1 2.0 7 1.6 1.5 16 1.9 2.0 10 1.4 1.0 19
1.3 1.0 230 0.7 0.5 10 0.8 0.0 5 0.8 0.0 16 1.2 1.0 38 2.3 3.0 7 na na <5 1.5 1.0 12 1.7 1.0 49 1.3 1.0 9 0.4 0.0 7 1.4 1.0 9 1.5 0.0 13 1.6 2.0 8 1.1 1.0 15 1.1 1.0 10 1.3 1.0 18
2.0 2.0 232 1.9 2.0 10 1.2 0.0 5 1.3 1.0 16 1.5 1.0 38 2.7 3.0 7 na na <5 2.0 2.0 12 1.8 2.0 50 3.3 4.0 9 2.0 2.0 7 2.9 3.0 8 1.7 2.0 13 2.5 3.0 8 2.4 2.5 16 3.0 3.0 10 1.9 2.0 19
Liability Strategies Group 64
Telec
ommu
ni ca
tions
Tran
spor
tation
Se
rvice
s
Media
Metal
s and
Mini
ng
Utilit
ies
Undis
close
d & O
ther
CFO Views on the Importance and Execution of Finance Functions
Chem
icals
Cons
umer
Cons
umer
Fina
nce
Oil a
nd G
as
Tech
nolog
y
Indus
trials
and
Mater
ials
Results of Question 2.9: Limits to Investing by Industry
Which of the following factors have limited your ability to take on substantial investment projects?
All
Dive
rsifie
d/Con
glo
mera
tes
Healt
h Car
e &
Phar
mace
utica
ls
Managerial resources
Ability to raise external funds
Legal and regulatory requirementsAu
tomob
iles
Busin
ess S
ervic
es
Internal funds
x x~ x x~ x x~ x x~ x x~ x x~ x x~ x x~x x~ x x~ x x~ x x~ x x~ x x~ x x~ x x~ x x~

January 2006
2.9: Limits to Investing by Ratings and ListingQuestion:
N N N N N N N N
2.3 3.0 235 2.2 3.0 71 2.2 3.0 25 na na <5 2.3 3.0 135 2.2 3.0 151 2.3 3.0 82 na na <5
1.8 1.0 230 1.6 1.0 69 2.5 3.0 25 na na <5 1.7 1.0 132 1.8 1.0 146 1.8 1.0 82 na na <5
1.3 1.0 230 1.0 1.0 69 1.8 2.0 25 na na <5 1.4 1.0 132 1.3 1.0 148 1.4 1.0 80 na na <5
2.0 2.0 232 2.1 2.0 70 1.7 1.0 25 na na <5 1.9 2.0 133 2.1 2.0 148 1.7 2.0 82 na na <5
Liability Strategies Group 65
CFO Views on the Importance and Execution of Finance Functions
Undis
close
d
Listed
Not L
isted
Undis
close
d
RatingsResults of Question 2.9: Limits to Investing by Ratings and Listing
Listing
Which of the following factors have limited your ability to take on substantial investment projects?
Non-
inves
tmen
t Gr
ade
Internal funds
Ability to raise external funds
Legal and regulatory requirementsInv
estm
ent G
rade
Not R
ated
All
Managerial resources
x x~ x x~ x x~ x x~ x x~ x x~x x~ x x~

January 2006
2.10: Frequency of Share Misvaluation by Region, Ratings and ListingQuestion:
21% 49% 23% 7% 182
30% 30% 26% 13% 23
na na na na <5
na na na na <5
13% 61% 19% 6% 31
13% 52% 30% 4% 23
0% 43% 43% 14% 7
36% 50% 9% 5% 22
21% 48% 23% 8% 66
na na na na <5
22% 53% 22% 3% 64
8% 67% 17% 8% 24
na na na na <5
23% 41% 26% 10% 91
20% 54% 21% 5% 149
23% 26% 32% 19% 31
na na na na <5
Liability Strategies Group 66
Occa
siona
lly
CFO Views on the Importance and Execution of Finance Functions
Undisclosed
Listing
Listed
Not Listed
Investment Grade
Undisclosed
Eastern Europe, Middle East & Africa
Germany
Not Rated
North America
Western Europe excluding Germany
Undisclosed
Ratings
Japan
Latin America
Non-investment Grade
Do you feel, on average, your company's equity is mis-valued by investors?
Rare
ly
N
Results of Question 2.10: Frequency of Share Misvaluation by Region, Ratings and Listing
Asia excluding Japan
Australia & New Zealand
All
Neve
r
Freq
uentl
yRegion

January 2006
2.10: Frequency of Share Misvaluation by IndustryQuestion:
21% 49% 23% 7% 182
29% 43% 29% 0% 7
0% 100% 0% 0% <5
27% 55% 18% 0% 11
14% 45% 28% 14% 29
0% 50% 50% 0% 6
33% 67% 0% 0% <5
33% 58% 8% 0% 12
13% 56% 26% 5% 39
29% 29% 29% 14% 7
25% 50% 0% 25% <5
17% 17% 50% 17% 6
36% 36% 18% 9% 11
13% 75% 0% 13% 8
14% 36% 36% 14% 14
30% 40% 30% 0% 10
45% 45% 9% 0% 11
Liability Strategies Group 67
Occa
siona
lly
CFO Views on the Importance and Execution of Finance Functions
Transportation Services
Utilities
Undisclosed & Other
Oil & Gas
Chemicals
Consumer
Telecommunications
Health Care & Pharmaceuticals
Industrials and Materials
Media
Metals & Mining
Consumer Finance
Diversified & Conglomerates
Technology
Business Services
All
Do you feel, on average, your company's equity is mis-valued by investors?
Rare
ly
Neve
r
Results of Question 2.10: Frequency of Share Misvaluation by Industry
N
Industry
AutomobilesFr
eque
ntly
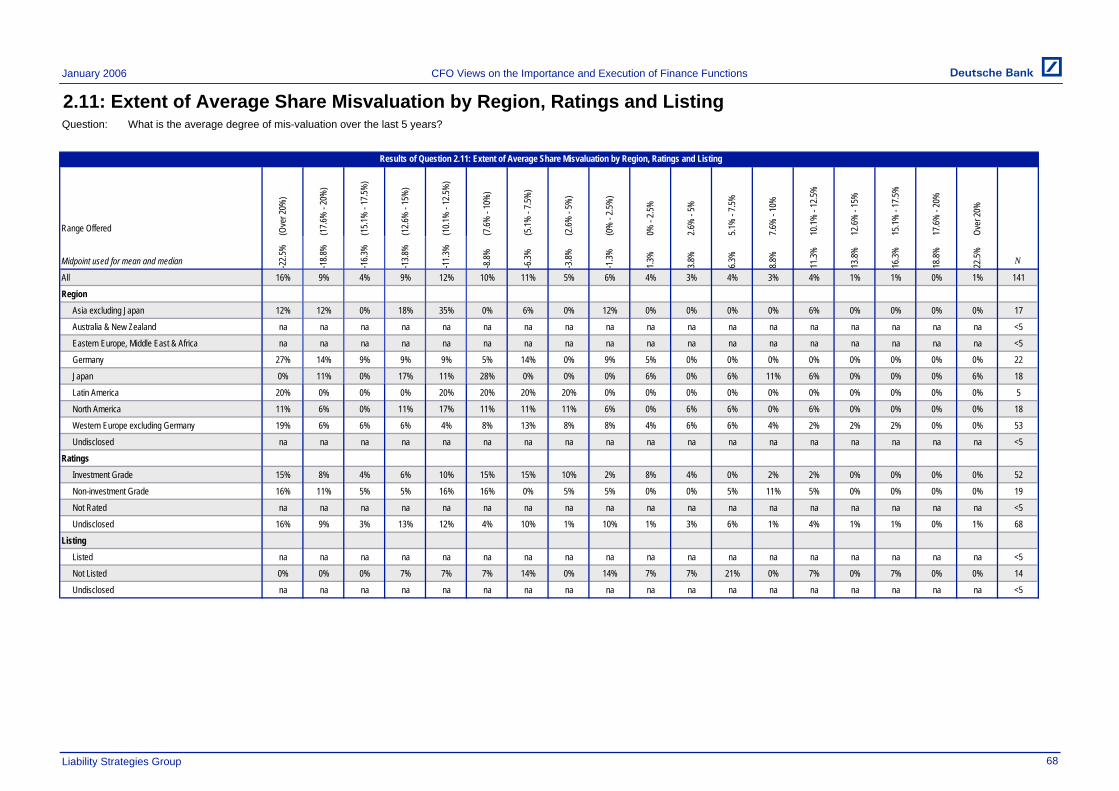
January 2006
2.11: Extent of Average Share Misvaluation by Region, Ratings and ListingQuestion:
(Ove
r 20%
)
(17.6
% -
20%
)
(15.1
% -
17.5%
)
(12.6
% -
15%
)
(10.1
% -
12.5%
)
(7.6%
- 10
%)
(5.1%
- 7.5
%)
(2.6%
- 5%
)
(0%
- 2.5
%)
0% -
2.5%
2.6%
- 5%
5.1%
- 7.5
%
7.6%
- 10
%
10.1%
- 12
.5%
12.6%
- 15
%
15.1%
- 17
.5%
17.6%
- 20
%
Over
20%
-22.5
%
-18.8
%
-16.3
%
-13.8
%
-11.3
%
-8.8%
-6.3%
-3.8%
-1.3%
1.3%
3.8%
6.3%
8.8%
11.3%
13.8%
16.3%
18.8%
22.5%
16% 9% 4% 9% 12% 10% 11% 5% 6% 4% 3% 4% 3% 4% 1% 1% 0% 1% 141
12% 12% 0% 18% 35% 0% 6% 0% 12% 0% 0% 0% 0% 6% 0% 0% 0% 0% 17
na na na na na na na na na na na na na na na na na na <5
na na na na na na na na na na na na na na na na na na <5
27% 14% 9% 9% 9% 5% 14% 0% 9% 5% 0% 0% 0% 0% 0% 0% 0% 0% 22
0% 11% 0% 17% 11% 28% 0% 0% 0% 6% 0% 6% 11% 6% 0% 0% 0% 6% 18
20% 0% 0% 0% 20% 20% 20% 20% 0% 0% 0% 0% 0% 0% 0% 0% 0% 0% 5
11% 6% 0% 11% 17% 11% 11% 11% 6% 0% 6% 6% 0% 6% 0% 0% 0% 0% 18
19% 6% 6% 6% 4% 8% 13% 8% 8% 4% 6% 6% 4% 2% 2% 2% 0% 0% 53
na na na na na na na na na na na na na na na na na na <5
15% 8% 4% 6% 10% 15% 15% 10% 2% 8% 4% 0% 2% 2% 0% 0% 0% 0% 52
16% 11% 5% 5% 16% 16% 0% 5% 5% 0% 0% 5% 11% 5% 0% 0% 0% 0% 19
na na na na na na na na na na na na na na na na na na <5
16% 9% 3% 13% 12% 4% 10% 1% 10% 1% 3% 6% 1% 4% 1% 1% 0% 1% 68
na na na na na na na na na na na na na na na na na na <5
0% 0% 0% 7% 7% 7% 14% 0% 14% 7% 7% 21% 0% 7% 0% 7% 0% 0% 14
na na na na na na na na na na na na na na na na na na <5
Liability Strategies Group
CFO Views on the Importance and Execution of Finance Functions
Undisclosed
Listing
Listed
Australia & New Zealand
All
What is the average degree of mis-valuation over the last 5 years?
Range Offered
Midpoint used for mean and median
Eastern Europe, Middle East & Africa
Undisclosed
Germany
Not Rated
North America
Western Europe excluding Germany
Latin America
Not Listed
Non-investment Grade
N
68
Results of Question 2.11: Extent of Average Share Misvaluation by Region, Ratings and Listing
Region
Asia excluding Japan
Investment Grade
Undisclosed
Ratings
Japan

January 2006
2.11: Extent of Average Share Misvaluation by IndustryQuestion:
(Ove
r 20%
)
(17.6
% -
20%
)
(15.1
% -
17.5%
)
(12.6
% -
15%
)
(10.1
% -
12.5%
)
(7.6%
- 10
%)
(5.1%
- 7.5
%)
(2.6%
- 5%
)
(0%
- 2.5
%)
0% -
2.5%
2.6%
- 5%
5.1%
- 7.5
%
7.6%
- 10
%
10.1%
- 12
.5%
12.6%
- 15
%
15.1%
- 17
.5%
17.6%
- 20
%
Over
20%
-22.5
%
-18.8
%
-16.3
%
-13.8
%
-11.3
%
-8.8%
-6.3%
-3.8%
-1.3%
1.3%
3.8%
6.3%
8.8%
11.3%
13.8%
16.3%
18.8%
22.5%
16% 9% 4% 9% 12% 10% 11% 5% 6% 4% 3% 4% 3% 4% 1% 1% 0% 1% 141
0% 0% 17% 0% 17% 33% 0% 17% 17% 0% 0% 0% 0% 0% 0% 0% 0% 0% 6
na na na na na na na na na na na na na na na na na na <5
11% 11% 11% 0% 0% 22% 0% 22% 11% 0% 0% 0% 11% 0% 0% 0% 0% 0% 9
6% 6% 6% 6% 11% 6% 11% 17% 11% 6% 6% 11% 0% 0% 0% 0% 0% 0% 18
na na na na na na na na na na na na na na na na na na <5
na na na na na na na na na na na na na na na na na na <5
9% 27% 0% 9% 36% 9% 0% 0% 0% 0% 9% 0% 0% 0% 0% 0% 0% 0% 11
15% 6% 3% 12% 9% 9% 9% 3% 3% 3% 3% 9% 9% 6% 3% 0% 0% 0% 34
33% 0% 0% 0% 0% 0% 33% 0% 17% 0% 0% 0% 0% 17% 0% 0% 0% 0% 6
na na na na na na na na na na na na na na na na na na <5
22% 11% 0% 33% 11% 0% 0% 0% 0% 11% 0% 0% 0% 11% 0% 0% 0% 0% 9
17% 33% 0% 0% 17% 17% 0% 0% 0% 0% 0% 0% 0% 0% 0% 17% 0% 0% 6
27% 0% 9% 0% 18% 0% 18% 0% 18% 0% 9% 0% 0% 0% 0% 0% 0% 0% 11
20% 0% 0% 10% 10% 20% 30% 0% 0% 10% 0% 0% 0% 0% 0% 0% 0% 0% 10
11% 22% 0% 33% 11% 0% 22% 0% 0% 0% 0% 0% 0% 0% 0% 0% 0% 0% 9
Liability Strategies Group
N
Results of Question 2.11: Extent of Average Share Misvaluation by Industry
Range Offered
Midpoint used for mean and median
Consumer Finance
Diversified & Conglomerates
Industry
Automobiles
Technology
Chemicals
Consumer
Telecommunications
Health Care & Pharmaceuticals
Industrials and Materials
CFO Views on the Importance and Execution of Finance Functions
Transportation Services
Utilities
Undisclosed & Other
Business Services
All
What is the average degree of mis-valuation over the last 5 years?
Oil & Gas
Media
Metals & Mining
69

January 2006
2.12: Extent of Extreme MisvaluationQuestion:
0% - 2.5% 2.6% - 5% 5.1% - 7.5% 7.6% -10% 10.1% - 12.5% 12.6% - 15% 15.1% - 17.5% 17.6% - 20% Over 20%
1.25% 3.75% 6.25% 8.75% 11.25% 13.75% 16.30% 18.75% 22.50%
28% 10% 4% 7% 13% 6% 4% 3% 25% 11% 11% 71
5% 2% 4% 10% 3% 11% 8% 10% 47% 17% 19% 133
Liability Strategies Group 70
Results of Question 2.12: Extent of Extreme Misvaluation
N
CFO Views on the Importance and Execution of Finance Functions
Undervaluation
Overvaluation
What is the greatest degree of mis-valuation in the last 5 years?
Midpoint used for mean & median
Range offered
x x~
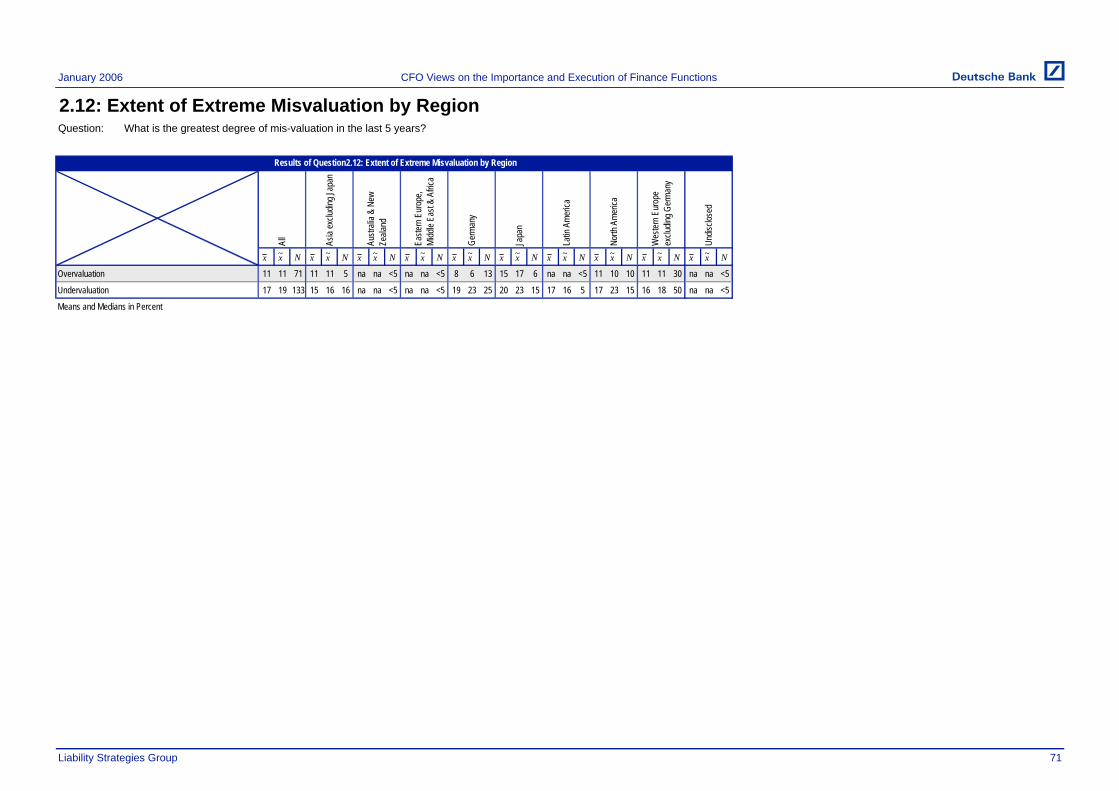
January 2006
2.12: Extent of Extreme Misvaluation by RegionQuestion:
N N N N N N N N N N
11 11 71 11 11 5 na na <5 na na <5 8 6 13 15 17 6 na na <5 11 10 10 11 11 30 na na <5
17 19 133 15 16 16 na na <5 na na <5 19 23 25 20 23 15 17 16 5 17 23 15 16 18 50 na na <5
Liability Strategies Group 71
Undis
close
d
CFO Views on the Importance and Execution of Finance Functions
What is the greatest degree of mis-valuation in the last 5 years?
Easte
rn E
urop
e, Mi
ddle
East
& Af
rica
Germ
any
Japa
n
Wes
tern E
urop
e ex
cludin
g Ger
many
Results of Question2.12: Extent of Extreme Misvaluation by Region
All
Latin
Ame
rica
North
Ame
rica
Overvaluation
Means and Medians in Percent
Asia
exclu
ding J
apan
Austr
alia &
New
Ze
aland
Undervaluation
x x~ x x~ x x~ x x~ x x~ x x~ x x~ x x~x x~ x x~

January 2006
2.12: Extent of Extreme Misvaluation by Ratings and ListingQuestion:
N N N N N N N N
11 11 71 9 5 24 10 9 11 na na <5 13 11 33 11 11 56 9 6 15 na na <5
17 19 133 17 19 47 19 23 19 na na <5 16 19 64 17 19 114 14 14 19 na na <5
Liability Strategies Group 73
CFO Views on the Importance and Execution of Finance Functions
Undis
close
d
Listed
Not L
isted
Undis
close
d
RatingsResults of Question 2.12: Extent of Extreme Misvaluation by Ratings and Listing
Listing
What is the greatest degree of mis-valuation in the last 5 years?
Non-
inves
tmen
t Gr
ade
Undervaluation
Means and Medians in PercentInv
estm
ent G
rade
Not R
ated
All
Overvaluation
x x~ x x~ x x~ x x~ x x~ x x~x x~ x x~

January 2006
2.12: Extent of Extreme Misvaluation by IndustryQuestion:
N N N N N N N N N N N N N N N N N
11 11 71 na na <5 na na <5 na na <5 9 6 11 na na <5 na na <5 na na <5 14 14 19 na na <5 na na <5 na na <5 16 19 5 na na <5 4 1 5 6 4 7 na na <5
17 19 133 17 19 5 na na <5 16 19 9 16 19 19 na na <5 na na <5 18 23 11 16 19 30 18 23 5 na na <5 na na <5 18 19 9 18 23 6 15 14 11 16 15 8 20 23 9
Liability Strategies Group 72
All
Autom
obile
s
Busin
ess S
ervic
es
Undervaluation
Means and Medians in Percent
What is the greatest degree of mis-valuation in the last 5 years?
Dive
rsifie
d/Con
glo
mera
tes
Healt
h Car
e &
Phar
mace
uticla
s
Overvaluation
Utilit
ies
Undis
close
d & O
ther
CFO Views on the Importance and Execution of Finance Functions
Chem
icals
Cons
umer
Cons
umer
Fina
nce
Oil a
nd G
as
Tech
nolog
y
Indus
trials
and
Mater
ials
Results of Question 2.12: Extent of Extreme Misvaluation by Industry
Telec
ommu
ni ca
tions
Tran
spor
tation
Se
rvice
s
Media
Metal
s and
Mini
ng
x x~ x x~ x x~ x x~ x x~ x x~ x x~ x x~x x~ x x~ x x~ x x~ x x~ x x~ x x~ x x~ x x~

January 2006
2.13: Actions to Exploit MisvaluationQuestion:
% N
13 102
8 102
8 102
51 102
15 102
17 102
11 102
46 102
24 102
10 102
2 102
Liability Strategies Group
Issued equity
Altered the timing of equity issue
Altered the size of equity issue
Repurchased equity
What (if anything) have you done to take advantage of this situation?
Results of Question 2.13: Actions to Exploit Misvaluation
Altered the timing of repurchases
Altered the size of repurchases
Undertaken M&A
Altered timing of M&A
Altered size of M&A
Changed the method of payment in M&A
Changed dividend policy
CFO Views on the Importance and Execution of Finance Functions
74

January 2006
2.13: Actions to Exploit Misvaluation by RegionQuestion:
% N % N % N % N % N % N % N % N % N % N
13 102 23 13 na <5 na <5 6 16 12 17 na <5 8 13 15 34 na <5
8 102 31 13 na <5 na <5 0 16 0 17 na <5 8 13 6 34 na <5
8 102 31 13 na <5 na <5 13 16 0 17 na <5 8 13 3 34 na <5
51 102 23 13 na <5 na <5 31 16 71 17 na <5 92 13 50 34 na <5
15 102 8 13 na <5 na <5 0 16 6 17 na <5 69 13 6 34 na <5
17 102 8 13 na <5 na <5 6 16 6 17 na <5 62 13 12 34 na <5
11 102 8 13 na <5 na <5 6 16 12 17 na <5 31 13 3 34 na <5
46 102 54 13 na <5 na <5 50 16 41 17 na <5 62 13 32 34 na <5
24 102 15 13 na <5 na <5 38 16 41 17 na <5 0 13 18 34 na <5
10 102 15 13 na <5 na <5 6 16 0 17 na <5 8 13 15 34 na <5
2 102 0 13 na <5 na <5 0 16 0 17 na <5 8 13 3 34 na <5
Liability Strategies Group
Altered the timing of equity issue
All
Asia
exclu
ding J
apan
Austr
alia &
New
Ze
aland
Altered the size of equity issue
Repurchased equity
Altered the timing of repurchases
Altered the size of repurchases
Changed the method of payment in M&A
Changed dividend policy
Undertaken M&A
Altered timing of M&A
Altered size of M&A
Means and Medians in Percent
CFO Views on the Importance and Execution of Finance Functions
What (if anything) have you done to take advantage of this situation?
Issued equity
75
North
Ame
rica
Wes
tern E
urop
e ex
cludin
g Ger
many
Undis
close
d
Results of Question 2.13: Actions to Exploit Misvaluation by Region
Easte
rn E
urop
e, Mi
ddle
East
& Af
rica
Germ
any
Japa
n
Latin
Ame
rica

January 2006
2.13: Actions to Exploit Misvaluation by IndustryQuestion:
% N % N % N % N % N % N % N % N % N % N % N % N % N % N % N % N % N
13 102 na <5 na <5 13 8 8 13 na <5 na <5 0 6 13 23 na <5 na <5 na <5 0 5 na <5 38 8 13 8 na <5
8 102 na <5 na <5 0 8 8 13 na <5 na <5 0 6 4 23 na <5 na <5 na <5 40 5 na <5 13 8 0 8 na <5
8 102 na <5 na <5 0 8 8 13 na <5 na <5 0 6 9 23 na <5 na <5 na <5 20 5 na <5 25 8 0 8 na <5
51 102 na <5 na <5 50 8 38 13 na <5 na <5 67 6 39 23 na <5 na <5 na <5 60 5 na <5 38 8 38 8 na <5
15 102 na <5 na <5 25 8 8 13 na <5 na <5 17 6 13 23 na <5 na <5 na <5 60 5 na <5 0 8 0 8 na <5
17 102 na <5 na <5 25 8 8 13 na <5 na <5 17 6 9 23 na <5 na <5 na <5 60 5 na <5 0 8 0 8 na <5
11 102 na <5 na <5 0 8 8 13 na <5 na <5 33 6 9 23 na <5 na <5 na <5 20 5 na <5 0 8 0 8 na <5
46 102 na <5 na <5 50 8 62 13 na <5 na <5 50 6 52 23 na <5 na <5 na <5 20 5 na <5 25 8 63 8 na <5
24 102 na <5 na <5 13 8 38 13 na <5 na <5 0 6 39 23 na <5 na <5 na <5 20 5 na <5 13 8 25 8 na <5
10 102 na <5 na <5 0 8 15 13 na <5 na <5 0 6 17 23 na <5 na <5 na <5 0 5 na <5 13 8 13 8 na <5
2 102 na <5 na <5 0 8 0 13 na <5 na <5 0 6 9 23 na <5 na <5 na <5 0 5 na <5 0 8 0 8 na <5
Liability Strategies Group
Busin
ess S
ervic
es
Chem
icals
Cons
umer
Altered the timing of equity issue
All
Autom
obile
sAltered the size of equity issue
Repurchased equity
Altered the timing of repurchases
Altered the size of repurchases
Changed the method of payment in M&A
Changed dividend policy
Undertaken M&A
Altered timing of M&A
Altered size of M&A
Means and Medians in Percent
CFO Views on the Importance and Execution of Finance Functions
What (if anything) have you done to take advantage of this situation?
Issued equity
76
Cons
umer
Fina
nce
Dive
rsifie
d/Con
glo
mera
tes
Healt
h Car
e &
Phar
mace
utica
ls
Indus
trials
and
Mater
ials
Tran
spor
tation
Se
rvice
s
Utilit
ies
Undis
close
d & O
ther
Media
Metal
s and
Mini
ng
Oil a
nd G
as
Tech
nolog
y
Results of Question 2.13: Actions to Exploit Misvaluation by Industry
Telec
ommu
ni ca
tions

January 2006
2.13: Actions to Exploit Misvaluation by Ratings and ListingQuestion:
% N % N % N % N % N % N % N % N
13 102 5 37 21 14 16 49 na <5 10 88 31 13 na <5
8 102 5 37 14 14 8 49 na <5 8 88 8 13 na <5
8 102 3 37 21 14 8 49 na <5 8 88 8 13 na <5
51 102 68 37 21 14 47 49 na <5 57 88 15 13 na <5
15 102 19 37 7 14 12 49 na <5 15 88 8 13 na <5
17 102 24 37 7 14 12 49 na <5 17 88 8 13 na <5
11 102 11 37 0 14 14 49 na <5 10 88 15 13 na <5
46 102 68 37 36 14 33 49 na <5 49 88 31 13 na <5
24 102 22 37 29 14 24 49 na <5 24 88 23 13 na <5
10 102 8 37 29 14 6 49 na <5 10 88 8 13 na <5
2 102 3 37 7 14 0 49 na <5 na <5 0 13 na <5
Liability Strategies Group
Altered the timing of repurchases
Altered the size of repurchases
Changed the method of payment in M&A
Changed dividend policy
Undertaken M&A
Altered timing of M&A
Altered size of M&A
Means and Medians in Percent
Altered the timing of equity issue
Altered the size of equity issue
Repurchased equity
All
Issued equity
CFO Views on the Importance and Execution of Finance Functions
What (if anything) have you done to take advantage of this situation?
Inves
tmen
t Gra
de
Non-
inves
tmen
t Gr
ade
Not R
ated
Undis
close
d
Ratings Listing
77
Results of Question 2.13: Actions to Exploit Misvaluation by Ratings and Listing
Listed
Not L
isted
Undis
close
d

January 2006
2.14: Composition of Shareholder BaseQuestion:
0% 1- 5% 6 - 10% 11 - 25% 26 - 50%Greater than
50%
0.0% 2.5% 7.5% 17.5% 37.5% 75.0%
44% 5% 9% 11% 12% 19% 22% 8% 181
17% 4% 7% 27% 23% 22% 30% 18% 181
16% 22% 11% 9% 14% 28% 29% 18% 180
25% 13% 12% 21% 18% 12% 21% 18% 159
80% 8% 1% 1% 1% 7% 7% 0% 138
28% 56% 8% 4% 2% 2% 5% 3% 164
34% 55% 5% 5% 1% 0% 3% 3% 149
76% 8% 5% 5% 3% 3% 4% 0% 38
Liability Strategies Group 78
Results of Question 2.14: Composition of Shareholder Base
On a fully diluted basis, what fraction of your common stock is held by or on behalf of:
N
Other employees
Don't know
Large institutional investors
Range offered
Midpoint used for mean & median
Broadly diffused shareholder base
Large corporate holders
Government
Large family or private shareholders
CFO Views on the Importance and Execution of Finance Functions
Top management team & board
x x~
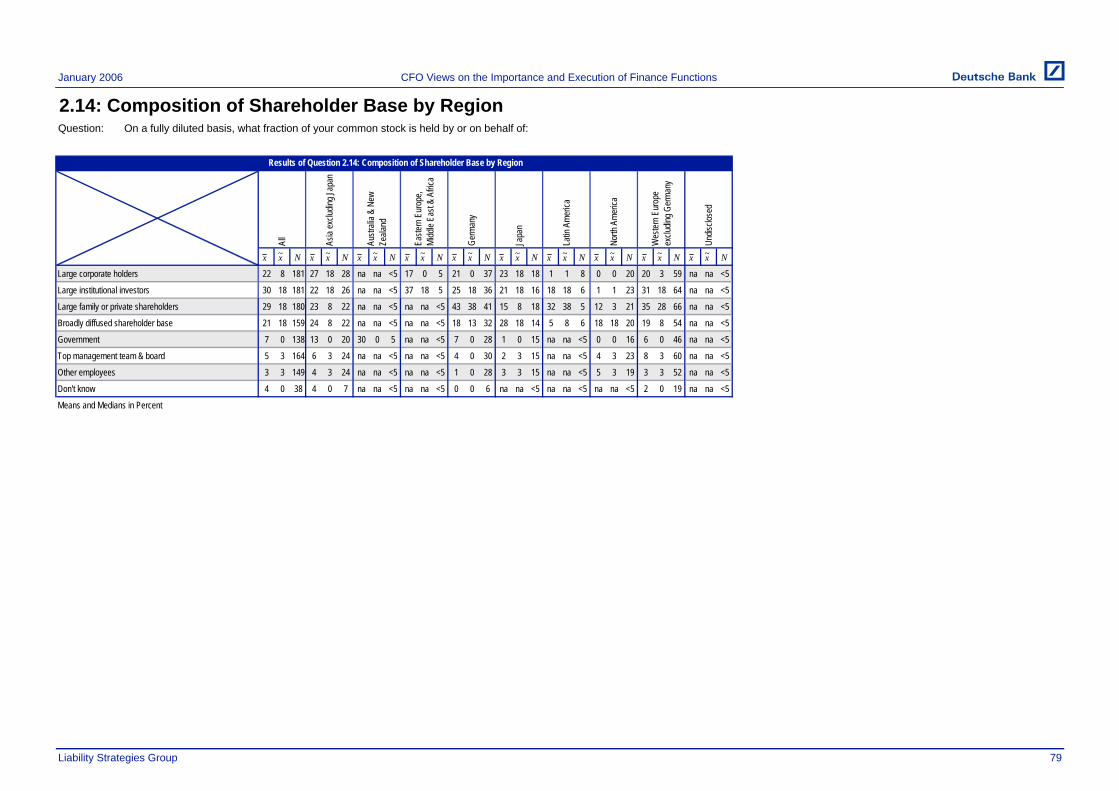
January 2006
2.14: Composition of Shareholder Base by RegionQuestion:
N N N N N N N N N N
22 8 181 27 18 28 na na <5 17 0 5 21 0 37 23 18 18 1 1 8 0 0 20 20 3 59 na na <5
30 18 181 22 18 26 na na <5 37 18 5 25 18 36 21 18 16 18 18 6 1 1 23 31 18 64 na na <5
29 18 180 23 8 22 na na <5 na na <5 43 38 41 15 8 18 32 38 5 12 3 21 35 28 66 na na <5
21 18 159 24 8 22 na na <5 na na <5 18 13 32 28 18 14 5 8 6 18 18 20 19 8 54 na na <5
7 0 138 13 0 20 30 0 5 na na <5 7 0 28 1 0 15 na na <5 0 0 16 6 0 46 na na <5
5 3 164 6 3 24 na na <5 na na <5 4 0 30 2 3 15 na na <5 4 3 23 8 3 60 na na <5
3 3 149 4 3 24 na na <5 na na <5 1 0 28 3 3 15 na na <5 5 3 19 3 3 52 na na <5
4 0 38 4 0 7 na na <5 na na <5 0 0 6 na na <5 na na <5 na na <5 2 0 19 na na <5
Liability Strategies Group
Top management team & board
Large institutional investors
Large family or private shareholders
Broadly diffused shareholder base
Government
79
All
Asia
exclu
ding J
apan
Austr
alia &
New
Ze
aland
Undis
close
d
Other employees
Don't know
Means and Medians in Percent
Latin
Ame
rica
North
Ame
rica
Large corporate holders
CFO Views on the Importance and Execution of Finance Functions
On a fully diluted basis, what fraction of your common stock is held by or on behalf of:
Easte
rn E
urop
e, Mi
ddle
East
& Af
rica
Germ
any
Japa
n
Wes
tern E
urop
e ex
cludin
g Ger
many
Results of Question 2.14: Composition of Shareholder Base by Region
x x~ x x~ x x~ x x~ x x~ x x~ x x~ x x~x x~ x x~

January 2006
2.14: Composition of Shareholder Base by IndustryQuestion:
N N N N N N N N N N N N N N N N N
22 8 181 29 18 7 na na <5 26 5 12 20 8 27 na na <5 na na <5 3 0 10 20 8 39 48 1 7 10 3 5 25 8 7 10 0 13 28 10 6 24 10 14 32 28 8 27 4 16
30 18 181 17 18 7 45 38 5 44 38 11 27 18 28 22 18 5 na na <5 35 18 11 35 38 39 26 18 7 na na <5 22 18 7 29 18 13 24 18 7 27 18 10 42 38 9 18 18 14
29 18 180 23 8 8 na na <5 33 18 11 38 38 31 25 18 6 na na <5 27 18 12 29 8 41 25 3 7 1 1 5 18 3 7 16 3 11 25 38 5 27 18 10 na na <5 33 38 15
21 18 159 11 5 6 na na <5 12 8 10 24 18 26 na na <5 na na <5 25 18 10 18 8 34 18 18 6 na na <5 10 8 7 28 18 12 30 18 7 16 18 9 31 38 7 31 18 13
7 0 138 0 0 7 na na <5 0 0 6 4 0 22 na na <5 na na <5 1 0 9 5 0 29 na na <5 na na <5 19 0 6 0 0 9 19 0 5 25 1 12 20 5 6 0 0 11
5 3 164 2 0 6 3 3 5 1 3 9 7 3 27 na na <5 na na <5 5 3 12 5 3 37 3 3 5 na na <5 2 3 7 8 3 12 4 3 7 2 1 10 na na <5 9 3 13
3 3 149 3 3 6 na na <5 2 3 8 1 3 23 na na <5 na na <5 3 3 9 4 3 34 na na <5 na na <5 2 3 6 7 3 12 6 3 6 2 1 10 2 3 6 4 3 13
4 0 38 na na <5 na na <5 na na <5 4 0 5 na na <5 na na <5 na na <5 14 0 8 na na <5 na na <5 na na <5 0 0 5 na na <5 na na <5 na na <5 na na <5
Liability Strategies Group 80
All
Autom
obile
s
Busin
ess S
ervic
es
Large institutional investors
Large family or private shareholders
Broadly diffused shareholder base
Government
Top management team & board
Other employees
Don't know
Means and Medians in Percent
On a fully diluted basis, what fraction of your common stock is held by or on behalf of:
Dive
rsifie
d/Con
glo
mera
tes
Healt
h Car
e &
Phar
mace
utica
ls
Large corporate holders
Utilit
ies
Undis
close
d & O
ther
CFO Views on the Importance and Execution of Finance Functions
Chem
icals
Cons
umer
Cons
umer
Fina
nce
Oil a
nd G
as
Tech
nolog
y
Indus
trials
and
Mater
ials
Results of Question 2.14: Composition of Shareholder Base by Industry
Telec
ommu
ni ca
tions
Tran
spor
tation
Se
rvice
s
Media
Metal
s and
Mini
ng
x x~ x x~ x x~ x x~ x x~ x x~ x x~ x x~x x~ x x~ x x~ x x~ x x~ x x~ x x~ x x~ x x~
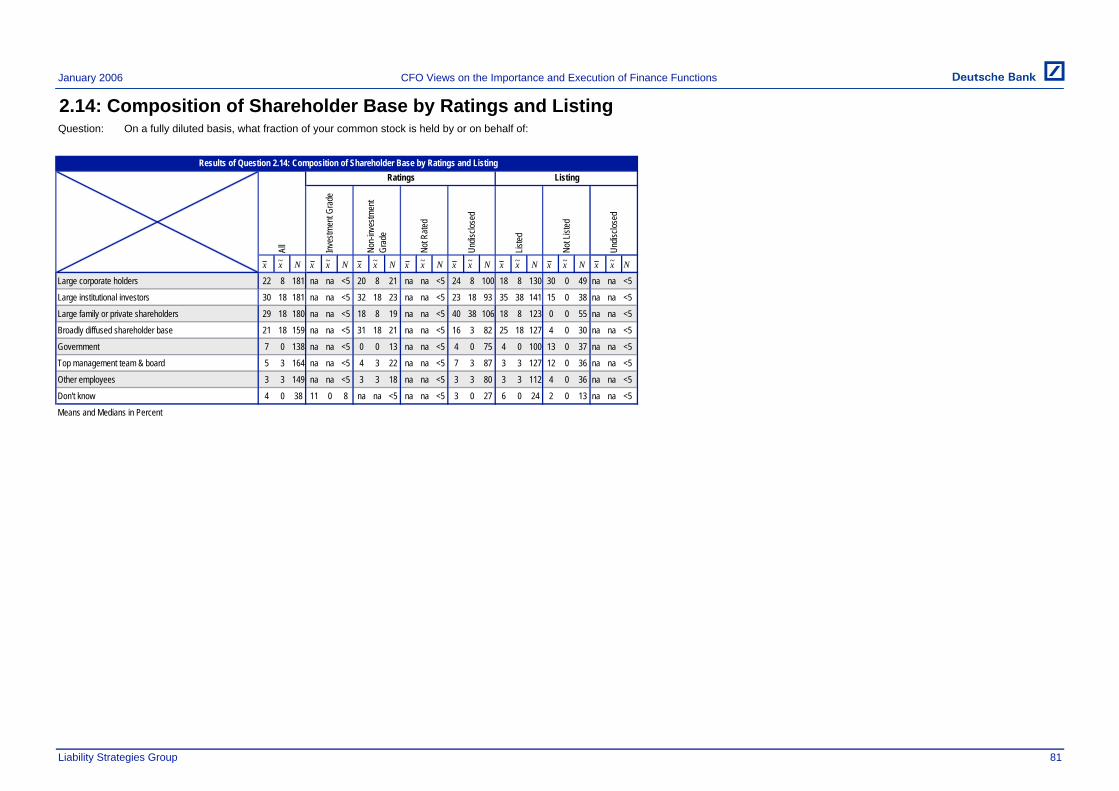
January 2006
2.14: Composition of Shareholder Base by Ratings and ListingQuestion:
N N N N N N N N
22 8 181 na na <5 20 8 21 na na <5 24 8 100 18 8 130 30 0 49 na na <5
30 18 181 na na <5 32 18 23 na na <5 23 18 93 35 38 141 15 0 38 na na <5
29 18 180 na na <5 18 8 19 na na <5 40 38 106 18 8 123 0 0 55 na na <5
21 18 159 na na <5 31 18 21 na na <5 16 3 82 25 18 127 4 0 30 na na <5
7 0 138 na na <5 0 0 13 na na <5 4 0 75 4 0 100 13 0 37 na na <5
5 3 164 na na <5 4 3 22 na na <5 7 3 87 3 3 127 12 0 36 na na <5
3 3 149 na na <5 3 3 18 na na <5 3 3 80 3 3 112 4 0 36 na na <5
4 0 38 11 0 8 na na <5 na na <5 3 0 27 6 0 24 2 0 13 na na <5
Liability Strategies Group 81
Government
Top management team & board
Other employees
Don't know
Means and Medians in Percent
On a fully diluted basis, what fraction of your common stock is held by or on behalf of:
Large institutional investors
Large family or private shareholders
Broadly diffused shareholder baseInv
estm
ent G
rade
Non-
inves
tmen
t Gr
ade
Not R
ated
All
Large corporate holders
CFO Views on the Importance and Execution of Finance Functions
Undis
close
d
Listed
Not L
isted
Undis
close
d
RatingsResults of Question 2.14: Composition of Shareholder Base by Ratings and Listing
Listing
x x~ x x~ x x~ x x~ x x~ x x~x x~ x x~

January 2006
2.15: Comparison of Economic Ownership and Voting Rights by Region, Ratings and ListingQuestion:
Yes No N
90% 10% 230
96% 4% 28
100% 0% 6
na na <5
98% 2% 50
95% 5% 22
89% 11% 9
78% 22% 23
82% 18% 85
na na <5
89% 11% 72
84% 16% 25
na na <5
91% 9% 129
89% 11% 151
91% 9% 77
na na <5
Liability Strategies Group 82
Is the distribution of shareholder voting rights the same as the distribution of share holdings as reported above?
Undisclosed
Listing
Listed
Not Listed
Undisclosed
Eastern Europe, Middle East & Africa
Germany
Japan
Latin America
Not Rated
North America
Western Europe excluding Germany
Undisclosed
Ratings
Investment Grade
Non-investment Grade
Region
Asia excluding Japan
Australia & New Zealand
All
CFO Views on the Importance and Execution of Finance Functions
2.15 by Region, Ratings and Listing

January 2006
2.15: Comparison of Economic Ownership and Voting Rights by IndustryQuestion:
Yes No N
90% 10% 230
88% 13% 8
60% 40% 5
87% 13% 15
84% 16% 38
83% 17% 6
100% 0% 5
75% 25% 12
98% 2% 50
90% 10% 10
100% na 6
88% 13% 8
80% 20% 15
86% 14% 7
100% na 15
91% 9% 11
95% 5% 19
Liability Strategies Group 83
CFO Views on the Importance and Execution of Finance Functions
2.15 by Industry
IndustryAutomobiles
Business Services
All
Telecommunications
Health Care & Pharmaceuticals
Industrials and Materials
Media
Metals & Mining
Oil & Gas
Technology
Chemicals
Consumer
Consumer Finance
Diversified & Conglomerates
Undisclosed & Other
Is the distribution of shareholder voting rights the same as the distribution of share holdings as reported above?
Transportation Services
Utilities

January 2006
2.16: Voting and cashflow rightsQuestion:
% N
33 82
21 82
44 82
10 82
7 82
17 82
Liability Strategies Group
CFO Views on the Importance and Execution of Finance Functions
84
Government
Top management team & board
Which category has more voting rights than cashflow rights?
Results of Question 2.16: Voting and cashflow rights
Large corporate holders
Large institutional investors
Large family or private shareholders
Broadly diffused shareholder base
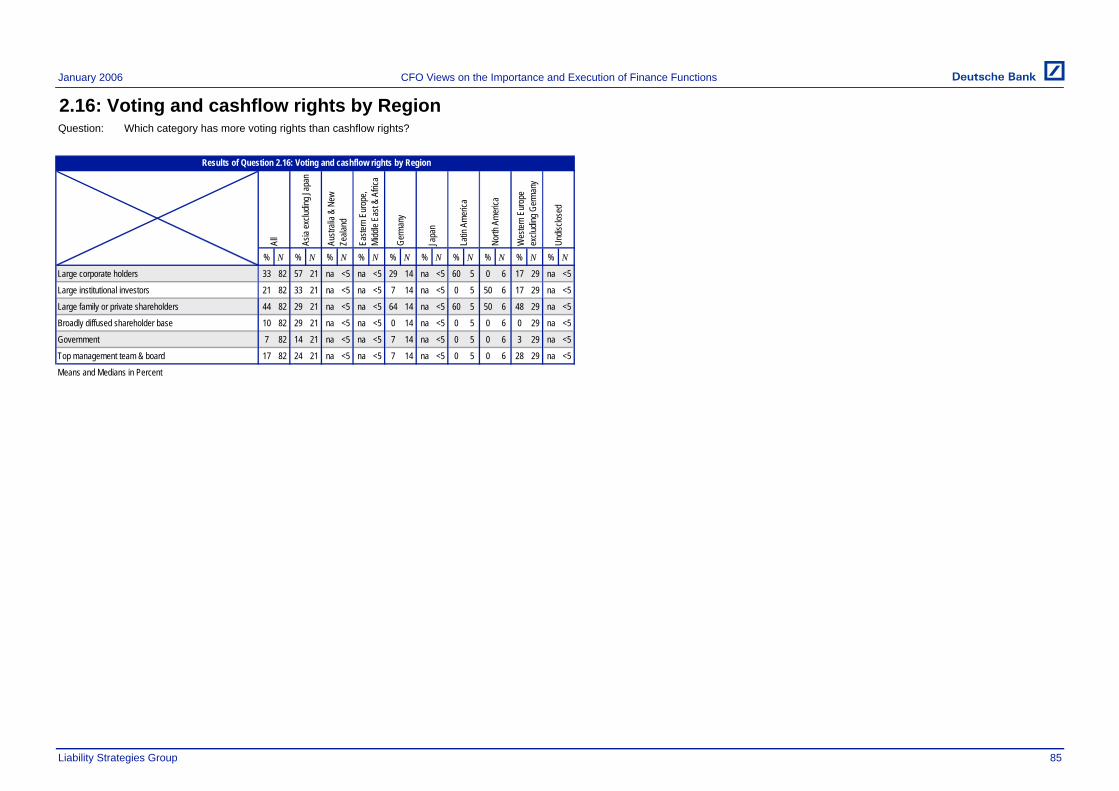
January 2006
2.16: Voting and cashflow rights by RegionQuestion:
% N % N % N % N % N % N % N % N % N % N
33 82 57 21 na <5 na <5 29 14 na <5 60 5 0 6 17 29 na <5
21 82 33 21 na <5 na <5 7 14 na <5 0 5 50 6 17 29 na <5
44 82 29 21 na <5 na <5 64 14 na <5 60 5 50 6 48 29 na <5
10 82 29 21 na <5 na <5 0 14 na <5 0 5 0 6 0 29 na <5
7 82 14 21 na <5 na <5 7 14 na <5 0 5 0 6 3 29 na <5
17 82 24 21 na <5 na <5 7 14 na <5 0 5 0 6 28 29 na <5
Liability Strategies Group
North
Ame
rica
Wes
tern E
urop
e ex
cludin
g Ger
many
Undis
close
d
Results of Question 2.16: Voting and cashflow rights by Region
Easte
rn E
urop
e, Mi
ddle
East
& Af
rica
Germ
any
Japa
n
Latin
Ame
rica
85
CFO Views on the Importance and Execution of Finance Functions
Which category has more voting rights than cashflow rights?
Large corporate holders
Means and Medians in Percent
Large family or private shareholders
Broadly diffused shareholder base
Government
Top management team & board
Large institutional investors
All
Asia
exclu
ding J
apan
Austr
alia &
New
Ze
aland

January 2006
2.16: Voting and cashflow rights by IndustryQuestion:
% N % N % N % N % N % N % N % N % N % N % N % N % N % N % N % N % N
33 82 na <5 na <5 na <5 29 17 na <5 na <5 na <5 27 15 na <5 na <5 na <5 30 10 na <5 na <5 na <5 na <5
21 82 na <5 na <5 na <5 12 17 na <5 na <5 na <5 27 15 na <5 na <5 na <5 30 10 na <5 na <5 na <5 na <5
44 82 na <5 na <5 na <5 41 17 na <5 na <5 na <5 27 15 na <5 na <5 na <5 50 10 na <5 na <5 na <5 na <5
10 82 na <5 na <5 na <5 12 17 na <5 na <5 na <5 7 15 na <5 na <5 na <5 40 10 na <5 na <5 na <5 na <5
7 82 na <5 na <5 na <5 0 17 na <5 na <5 na <5 13 15 na <5 na <5 na <5 10 10 na <5 na <5 na <5 na <5
17 82 na <5 na <5 na <5 18 17 na <5 na <5 na <5 20 15 na <5 na <5 na <5 40 10 na <5 na <5 na <5 na <5
Liability Strategies Group
Results of Question 2.16: Voting and cashflow rights by Industry
Telec
ommu
ni ca
tions
Tran
spor
tation
Se
rvice
s
Utilit
ies
Undis
close
d & O
ther
Media
Metal
s and
Mini
ng
Oil a
nd G
as
Tech
nolog
y
Cons
umer
Fina
nce
Dive
rsifie
d/Con
glo
mera
tes
Healt
h Car
e &
Phar
mace
utica
ls
Indus
trials
and
Mater
ials
86
CFO Views on the Importance and Execution of Finance Functions
Which category has more voting rights than cashflow rights?
Large corporate holders
Broadly diffused shareholder base
Government
Top management team & board
Means and Medians in Percent
Large institutional investors
All
Autom
obile
sLarge family or private shareholders
Busin
ess S
ervic
es
Chem
icals
Cons
umer

January 2006
2.16: Voting and cashflow rights by Ratings and ListingQuestion:
% N % N % N % N % N % N % N % N
33 82 30 20 50 10 27 49 na <5 45 40 20 41 na <5
21 82 30 20 40 10 14 49 na <5 33 40 10 41 na <5
44 82 30 20 30 10 55 49 na <5 43 40 46 41 na <5
10 82 10 20 20 10 8 49 na <5 15 40 5 41 na <5
7 82 10 20 0 10 8 49 na <5 5 40 10 41 na <5
17 82 10 20 10 10 22 49 na <5 20 40 15 41 na <5
Liability Strategies Group
Results of Question 2.16: Voting and cashflow rights by Ratings and Listing
Listed
Not L
isted
Undis
close
d
87
CFO Views on the Importance and Execution of Finance Functions
Which category has more voting rights than cashflow rights?
Inves
tmen
t Gra
de
Non-
inves
tmen
t Gr
ade
Not R
ated
Undis
close
d
Ratings Listing
Large institutional investors
Large family or private shareholders
Broadly diffused shareholder base
All
Large corporate holders
Government
Top management team & board
Means and Medians in Percent
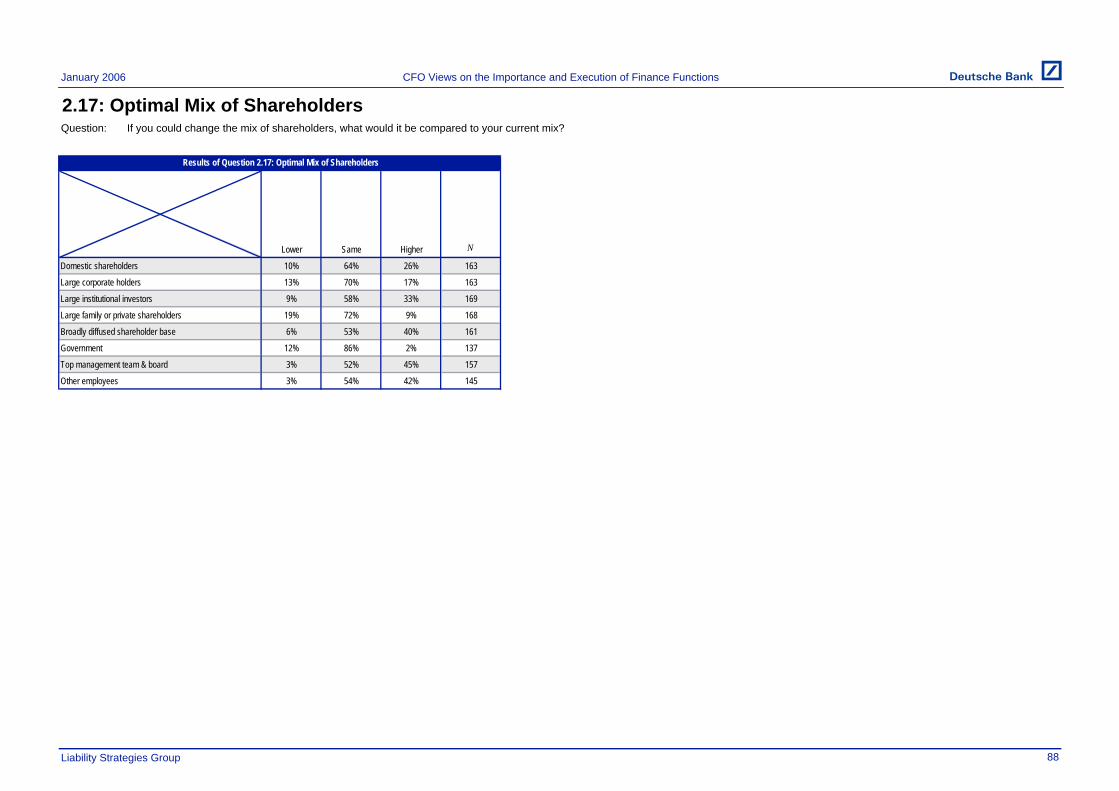
January 2006
2.17: Optimal Mix of ShareholdersQuestion:
Lower Same Higher N
10% 64% 26% 163
13% 70% 17% 163
9% 58% 33% 169
19% 72% 9% 168
6% 53% 40% 161
12% 86% 2% 137
3% 52% 45% 157
3% 54% 42% 145
Liability Strategies Group
Results of Question 2.17: Optimal Mix of Shareholders
88
Government
CFO Views on the Importance and Execution of Finance Functions
Large family or private shareholders
Domestic shareholders
Broadly diffused shareholder base
If you could change the mix of shareholders, what would it be compared to your current mix?
Top management team & board
Other employees
Large corporate holders
Large institutional investors

January 2006
2.17: Optimal Mix of Shareholders by RegionQuestion:
N N N N N N N N N N
0.2 0.0 163 0.2 0.0 24 na na <5 -0.2 0.0 5 0.1 0.0 30 0.4 0.0 20 0.1 0.0 8 -0.1 0.0 17 0.2 0.0 54 na na <5
0.0 0.0 163 0.1 0.0 24 na na <5 na na <5 0.1 0.0 30 0.2 0.0 20 -0.4 0.0 9 0.0 0.0 15 0.1 0.0 56 na na <5
0.2 0.0 169 0.6 1.0 25 na na <5 na na <5 0.1 0.0 34 0.3 0.0 20 0.4 0.0 8 -0.1 0.0 18 0.2 0.0 57 na na <5
-0.1 0.0 168 -0.1 0.0 22 na na <5 na na <5 -0.1 0.0 36 0.0 0.0 22 0.1 0.0 8 0.0 0.0 16 -0.2 0.0 58 na na <5
0.3 0.0 161 0.1 0.0 22 na na <5 na na <5 0.1 0.0 28 0.5 1.0 22 0.3 0.0 6 0.6 1.0 18 0.4 0.0 56 na na <5
-0.1 0.0 137 -0.2 0.0 19 na na <5 na na <5 -0.1 0.0 26 0.0 0.0 17 -0.1 0.0 7 0.0 0.0 15 -0.1 0.0 47 na na <5
0.4 0.0 157 0.2 0.0 21 na na <5 na na <5 0.4 0.0 28 0.3 0.0 19 0.6 1.0 8 0.3 0.0 18 0.5 1.0 56 na na <5
0.4 0.0 145 0.5 1.0 22 na na <5 na na <5 0.2 0.0 25 0.4 0.0 16 0.5 0.5 6 0.2 0.0 17 0.4 0.0 53 na na <5
Liability Strategies Group 89
Undis
close
d
CFO Views on the Importance and Execution of Finance Functions
If you could change the mix of shareholders, what would it be compared to your current mix?
Easte
rn E
urop
e, Mi
ddle
East
& Af
rica
Germ
any
Japa
n
Wes
tern E
urop
e ex
cludin
g Ger
many
Results of Question 2.17: Optimal Mix of Shareholders by Region
All
Latin
Ame
rica
North
Ame
rica
Domestic shareholders
Top management team & board
Other employees
Large institutional investors
Large family or private shareholders
Broadly diffused shareholder base
Government
Asia
exclu
ding J
apan
Austr
alia &
New
Ze
aland
Large corporate holders
x x~ x x~ x x~ x x~ x x~ x x~ x x~ x x~x x~ x x~
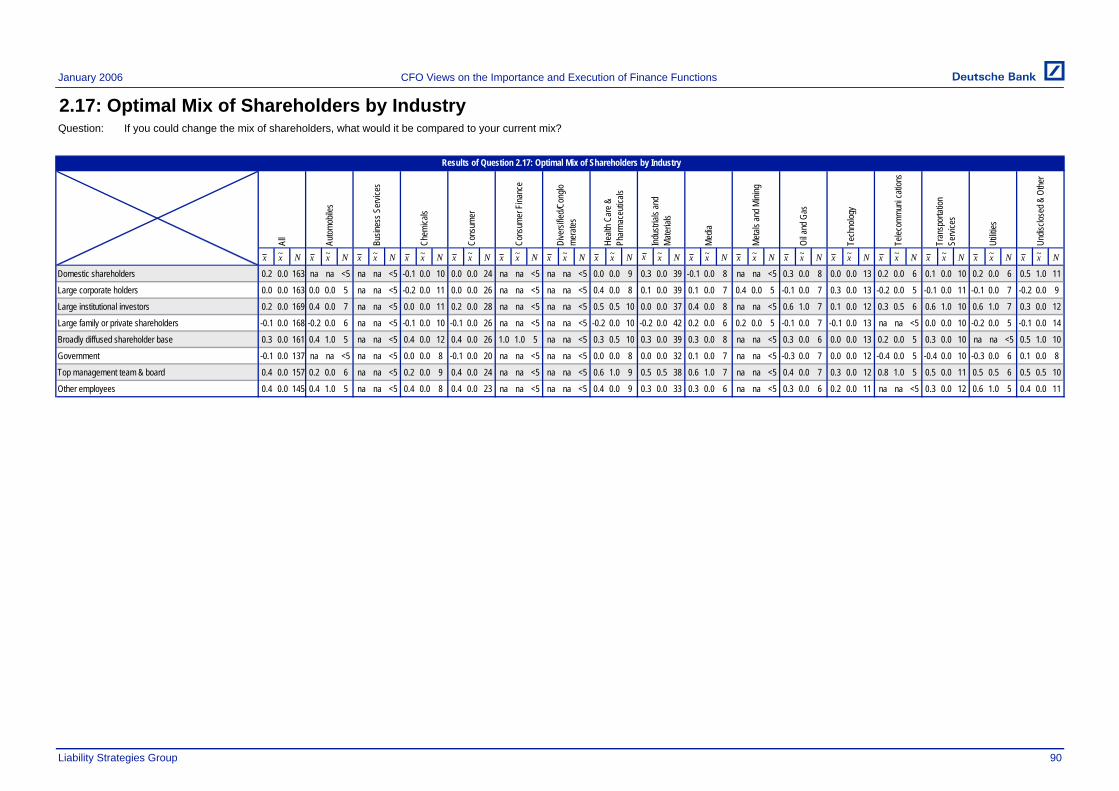
January 2006
2.17: Optimal Mix of Shareholders by IndustryQuestion:
N N N N N N N N N N N N N N N N N
0.2 0.0 163 na na <5 na na <5 -0.1 0.0 10 0.0 0.0 24 na na <5 na na <5 0.0 0.0 9 0.3 0.0 39 -0.1 0.0 8 na na <5 0.3 0.0 8 0.0 0.0 13 0.2 0.0 6 0.1 0.0 10 0.2 0.0 6 0.5 1.0 11
0.0 0.0 163 0.0 0.0 5 na na <5 -0.2 0.0 11 0.0 0.0 26 na na <5 na na <5 0.4 0.0 8 0.1 0.0 39 0.1 0.0 7 0.4 0.0 5 -0.1 0.0 7 0.3 0.0 13 -0.2 0.0 5 -0.1 0.0 11 -0.1 0.0 7 -0.2 0.0 9
0.2 0.0 169 0.4 0.0 7 na na <5 0.0 0.0 11 0.2 0.0 28 na na <5 na na <5 0.5 0.5 10 0.0 0.0 37 0.4 0.0 8 na na <5 0.6 1.0 7 0.1 0.0 12 0.3 0.5 6 0.6 1.0 10 0.6 1.0 7 0.3 0.0 12
-0.1 0.0 168 -0.2 0.0 6 na na <5 -0.1 0.0 10 -0.1 0.0 26 na na <5 na na <5 -0.2 0.0 10 -0.2 0.0 42 0.2 0.0 6 0.2 0.0 5 -0.1 0.0 7 -0.1 0.0 13 na na <5 0.0 0.0 10 -0.2 0.0 5 -0.1 0.0 14
0.3 0.0 161 0.4 1.0 5 na na <5 0.4 0.0 12 0.4 0.0 26 1.0 1.0 5 na na <5 0.3 0.5 10 0.3 0.0 39 0.3 0.0 8 na na <5 0.3 0.0 6 0.0 0.0 13 0.2 0.0 5 0.3 0.0 10 na na <5 0.5 1.0 10
-0.1 0.0 137 na na <5 na na <5 0.0 0.0 8 -0.1 0.0 20 na na <5 na na <5 0.0 0.0 8 0.0 0.0 32 0.1 0.0 7 na na <5 -0.3 0.0 7 0.0 0.0 12 -0.4 0.0 5 -0.4 0.0 10 -0.3 0.0 6 0.1 0.0 8
0.4 0.0 157 0.2 0.0 6 na na <5 0.2 0.0 9 0.4 0.0 24 na na <5 na na <5 0.6 1.0 9 0.5 0.5 38 0.6 1.0 7 na na <5 0.4 0.0 7 0.3 0.0 12 0.8 1.0 5 0.5 0.0 11 0.5 0.5 6 0.5 0.5 10
0.4 0.0 145 0.4 1.0 5 na na <5 0.4 0.0 8 0.4 0.0 23 na na <5 na na <5 0.4 0.0 9 0.3 0.0 33 0.3 0.0 6 na na <5 0.3 0.0 6 0.2 0.0 11 na na <5 0.3 0.0 12 0.6 1.0 5 0.4 0.0 11
Liability Strategies Group 90
All
Autom
obile
s
Busin
ess S
ervic
es
Large corporate holders
Large institutional investors
Large family or private shareholders
Broadly diffused shareholder base
Government
Top management team & board
Other employees
If you could change the mix of shareholders, what would it be compared to your current mix?
Dive
rsifie
d/Con
glo
mera
tes
Healt
h Car
e &
Phar
mace
utica
ls
Domestic shareholders
Utilit
ies
Undis
close
d & O
ther
CFO Views on the Importance and Execution of Finance Functions
Chem
icals
Cons
umer
Cons
umer
Fina
nce
Oil a
nd G
as
Tech
nolog
y
Indus
trials
and
Mater
ials
Results of Question 2.17: Optimal Mix of Shareholders by Industry
Telec
ommu
ni ca
tions
Tran
spor
tation
Se
rvice
s
Media
Metal
s and
Mini
ng
x x~ x x~ x x~ x x~ x x~ x x~ x x~ x x~x x~ x x~ x x~ x x~ x x~ x x~ x x~ x x~ x x~

January 2006
2.17: Optimal Mix of Shareholders by Ratings and ListingQuestion:
N N N N N N N N
0.2 0.0 163 0.1 0.0 51 0.2 0.0 21 na na <5 0.1 0.0 88 0.2 0.0 122 0.1 0.0 40 -0.4 -1.0 40
0.0 0.0 163 0.0 0.0 51 0.0 0.0 21 na na <5 0.1 0.0 87 0.0 0.0 118 0.1 0.0 44 -0.4 -1.0 44
0.2 0.0 169 0.2 0.0 55 0.1 0.0 20 na na <5 0.3 0.0 91 0.2 0.0 127 0.2 0.0 41 -0.4 -1.0 41
-0.1 0.0 168 0.1 0.0 46 -0.2 0.0 20 na na <5 -0.2 0.0 100 -0.1 0.0 119 -0.1 0.0 48 -0.3 -1.0 48
0.3 0.0 161 0.4 0.0 53 0.4 0.0 20 na na <5 0.3 0.0 86 0.4 0.0 123 0.2 0.0 37 -0.4 -1.0 37
-0.1 0.0 137 -0.2 0.0 47 0.0 0.0 17 na na <5 -0.1 0.0 70 -0.1 0.0 100 -0.1 0.0 37 -0.5 0.0 37
0.4 0.0 157 0.4 0.0 52 0.5 0.0 20 na na <5 0.4 0.0 83 0.4 0.0 114 0.6 1.0 43 -0.4 0.0 43
0.4 0.0 145 0.4 0.0 46 0.3 0.0 19 na na <5 0.4 0.0 77 0.4 0.0 109 0.3 0.0 36 -0.5 0.0 36
Liability Strategies Group 91
CFO Views on the Importance and Execution of Finance Functions
Undis
close
d
Listed
Not L
isted
Undis
close
d
RatingsResults of Question 2.17: Optimal Mix of Shareholders by Ratings and Listing
Listing
If you could change the mix of shareholders, what would it be compared to your current mix?
Non-
inves
tmen
t Gr
ade
Large corporate holders
Large institutional investors
Large family or private shareholdersInv
estm
ent G
rade
Not R
ated
All
Domestic shareholders
Broadly diffused shareholder base
Government
Top management team & board
Other employees
x x~ x x~ x x~ x x~ x x~ x x~x x~ x x~
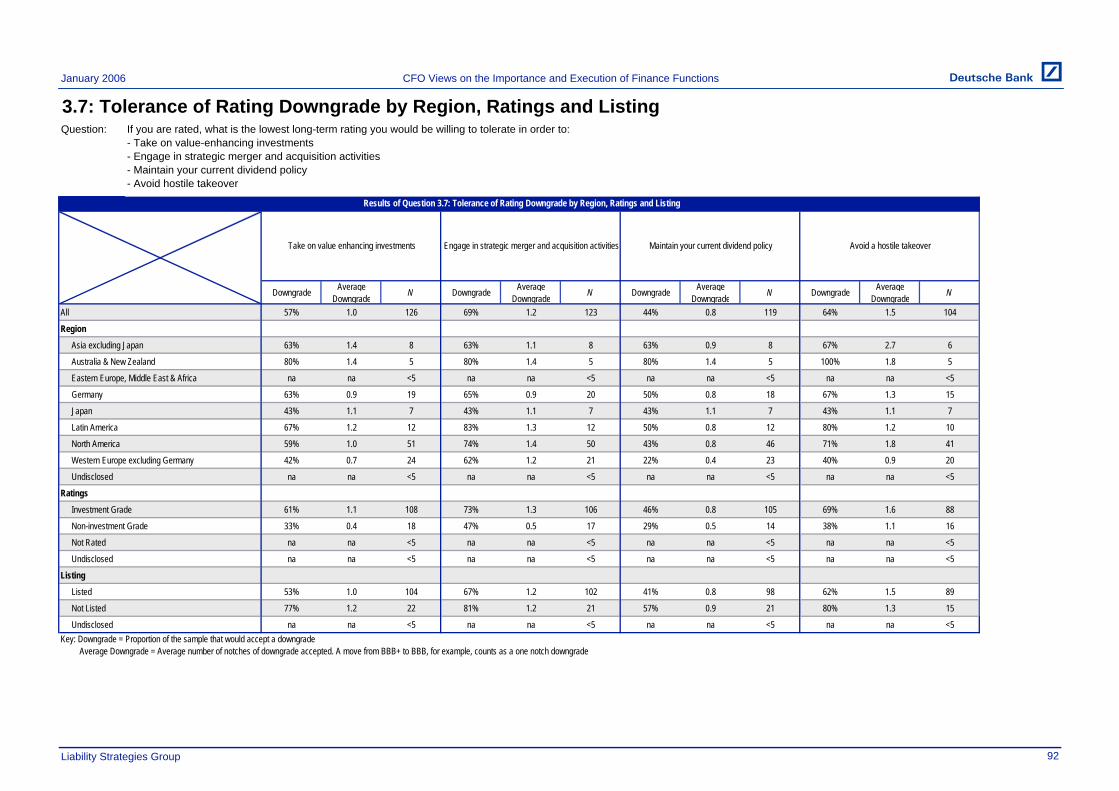
January 2006
3.7: Tolerance of Rating Downgrade by Region, Ratings and ListingQuestion:
Downgrade Average Downgrade N Downgrade Average
Downgrade N Downgrade Average Downgrade N Downgrade Average
Downgrade N
57% 1.0 126 69% 1.2 123 44% 0.8 119 64% 1.5 104
63% 1.4 8 63% 1.1 8 63% 0.9 8 67% 2.7 6
80% 1.4 5 80% 1.4 5 80% 1.4 5 100% 1.8 5
na na <5 na na <5 na na <5 na na <5
63% 0.9 19 65% 0.9 20 50% 0.8 18 67% 1.3 15
43% 1.1 7 43% 1.1 7 43% 1.1 7 43% 1.1 7
67% 1.2 12 83% 1.3 12 50% 0.8 12 80% 1.2 10
59% 1.0 51 74% 1.4 50 43% 0.8 46 71% 1.8 41
42% 0.7 24 62% 1.2 21 22% 0.4 23 40% 0.9 20
na na <5 na na <5 na na <5 na na <5
61% 1.1 108 73% 1.3 106 46% 0.8 105 69% 1.6 88
33% 0.4 18 47% 0.5 17 29% 0.5 14 38% 1.1 16
na na <5 na na <5 na na <5 na na <5
na na <5 na na <5 na na <5 na na <5
53% 1.0 104 67% 1.2 102 41% 0.8 98 62% 1.5 89
77% 1.2 22 81% 1.2 21 57% 0.9 21 80% 1.3 15
na na <5 na na <5 na na <5 na na <5
Liability Strategies Group
If you are rated, what is the lowest long-term rating you would be willing to tolerate in order to:- Take on value-enhancing investments- Engage in strategic merger and acquisition activities- Maintain your current dividend policy- Avoid hostile takeover
Australia & New Zealand
All
Eastern Europe, Middle East & Africa
Region
Asia excluding Japan
Listed
Ratings
Japan
Latin America
Not Listed
Undisclosed
CFO Views on the Importance and Execution of Finance Functions
Investment Grade
Non-investment Grade
Germany
North America
Western Europe excluding Germany
Undisclosed
92
Key: Downgrade = Proportion of the sample that would accept a downgrade Average Downgrade = Average number of notches of downgrade accepted. A move from BBB+ to BBB, for example, counts as a one notch downgrade
Results of Question 3.7: Tolerance of Rating Downgrade by Region, Ratings and Listing
Take on value enhancing investments Engage in strategic merger and acquisition activities Maintain your current dividend policy Avoid a hostile takeover
Not Rated
Undisclosed
Listing

January 2006
3.7: Tolerance of Rating Downgrade by IndustryQuestion:
Downgrade Average Downgrade N Downgrade Average
Downgrade N Downgrade Average Downgrade N Downgrade Average
Downgrade N
57% 1.0 126 69% 1.2 123 44% 0.8 119 64% 1.5 104
na na <5 na na <5 na na <5 na na <5
na na <5 na na <5 na na <5 na na <5
25% 0.6 8 63% 1.9 8 50% 0.9 8 67% 2.2 6
79% 1.2 14 93% 1.4 14 69% 1.1 13 100% 2.4 11
na na <5 na na <5 na na <5 na na <5
na na <5 na na <5 na na <5 na na <5
75% 1.7 12 75% 1.7 12 67% 1.2 12 75% 1.6 12
41% 0.5 27 59% 0.7 27 17% 0.2 23 44% 0.7 25
100% 1.5 8 100% 2.3 8 38% 1.3 8 100% 3.7 6
40% 0.8 5 40% 0.8 5 0% 0.0 5 na na <5
67% 1.3 6 67% 1.2 6 33% 0.5 6 80% 1.2 5
44% 1.1 9 44% 0.9 9 38% 0.8 8 44% 2.2 9
17% 0.3 6 60% 1.0 5 17% 0.3 6 na na <5
80% 1.4 5 83% 1.3 6 80% 1.4 5 na na <5
60% 1.0 15 75% 1.3 12 53% 0.9 15 80% 1.4 10
na na <5 na na <5 na na <5 na na <5
Liability Strategies Group 93
Key: Downgrade = Proportion of the sample that would accept a downgrade Average Downgrade = Average number of notches of downgrade accepted. A move from BBB+ to BBB, for example, counts as a one notch downgrade
Results of Question 3.7: Tolerance of Rating Downgrade by Industry
Take on value enhancing investments Engage in strategic merger and acquisition activities Maintain your current dividend policy Avoid a hostile takeover
Telecommunications
Transportation Services
Utilities
CFO Views on the Importance and Execution of Finance Functions
Oil & Gas
Technology
Consumer
Health Care & Pharmaceuticals
Industrials and Materials
Media
Metals & Mining
Consumer Finance
Chemicals
Industry
Automobiles
Undisclosed & Other
Diversified & Conglomerates
If you are rated, what is the lowest long-term rating you would be willing to tolerate in order to:- Take on value-enhancing investments- Engage in strategic merger and acquisition activities- Maintain your current dividend policy- Avoid hostile takeover
Business Services
All

January 2006
3.12: Fairness of Credit Spread by Region, Ratings and ListingQuestion:
N
77% 19% 4% 163
64% 32% 5% 22
100% 0% 0% 5
na na na <5
86% 8% 6% 36
65% 29% 6% 17
100% 0% 0% 9
70% 30% 0% 23
79% 17% 4% 47
na na na <5
85% 14% 2% 66
60% 35% 5% 20
na na na <5
76% 19% 5% 74
76% 21% 3% 119
79% 14% 7% 43
na na na <5
Liability Strategies Group
CFO Views on the Importance and Execution of Finance Functions
Fair Wide Narrow
Germany
Undisclosed
Listed
Not Listed
Listing
Undisclosed
Asia excluding Japan
Australia & New Zealand
All
Eastern Europe, Middle East & Africa
Not Rated
North America
Western Europe excluding Germany
Undisclosed
Ratings
Investment Grade
Non-investment Grade
94
Results of Question 3.12: Fairness of Credit Spread by Region, Ratings and Listing
Do you feel that the average credit spread currently paid on your debt is a fair reflection of the default risk that investors are incurring?
Japan
Latin America
Region

January 2006
3.12: Fairness of Credit Spread by IndustryQuestion:
N
77% 19% 4% 163
75% 25% 0% 8
na na na <5
77% 15% 8% 13
91% 4% 4% 23
na na na <5
na na na <5
78% 22% 0% 9
75% 22% 3% 36
80% 20% 0% 5
80% 20% 0% 5
90% 10% 0% 10
80% 10% 10% 10
40% 60% 0% 5
85% 15% 0% 13
90% 10% 0% 10
67% 22% 11% 9
Liability Strategies Group
CFO Views on the Importance and Execution of Finance Functions
Consumer
Transportation Services
Utilities
Undisclosed & Other
Chemicals
Telecommunications
Health Care & Pharmaceuticals
Industrials and Materials
Media
Metals & Mining
Oil & Gas
Technology
Results of Question 3.12: Fairness of Credit Spread by Industry
Business Services
All
Fair Wide Narrow
95
Do you feel that the average credit spread currently paid on your debt is a fair reflection of the default risk that investors are incurring?
Consumer Finance
Diversified & Conglomerates
Industry
Automobiles

January 2006
3.13: Fairness of Credit RatingQuestion:
No, the rating is too low
Yes, the rating is fair
No, the rating is too high
-1 0 1
46% 54% 0% 84
49% 51% 0% 76
45% 55% 0% 38
Liability Strategies Group
CFO Views on the Importance and Execution of Finance Functions
Fitch
S&P
If you are rated, do you believe
96
Results of Question 3.13: Fairness of Credit Rating
N
Moody's

January 2006
3.13: Fairness of Credit Rating by RegionQuestion:
N N N N N N N N N N
-0.5 0.0 84 -0.7 -1.0 6 na na <5 na na <5 -0.3 0.0 14 -0.8 -1.0 12 -0.5 -0.5 8 -0.4 0.0 22 -0.4 0.0 19 na na <5
-0.5 0.0 76 -0.6 -1.0 7 na na <5 na na <5 -0.2 0.0 13 -0.6 -1.0 11 -0.6 -1.0 5 -0.5 -1.0 22 -0.5 0.0 17 na na <5
-0.4 0.0 38 na na <5 na na <5 na na <5 na na <5 na na <5 -0.5 -0.5 6 -0.3 0.0 15 -0.8 -1.0 6 na na <5
Liability Strategies Group
CFO Views on the Importance and Execution of Finance Functions
If you are rated, do you believe that your current long-term rating is fair?
Easte
rn E
urop
e, Mi
ddle
East
& Af
rica
Germ
any
Japa
n
Wes
tern E
urop
e ex
cludin
g Ger
many
Results of Question 3.13: Fairness of Credit Rating by Region
Latin
Ame
rica
North
Ame
rica
S&P
97
All
Asia
exclu
ding J
apan
Austr
alia &
New
Ze
aland
Undis
close
d
Moody's
Fitch
x x~ x x~ x x~ x x~ x x~ x x~ x x~ x x~x x~ x x~

January 2006
3.13: Fairness of Credit Rating by IndustryQuestion:
N N N N N N N N N N N N N N N N N
-0.5 0.0 84 na na <5 na na <5 -0.1 0.0 7 -0.3 0.0 10 na na <5 na na <5 -0.8 -1.0 5 -0.4 0.0 15 na na <5 na na <5 -0.5 -0.5 6 na na <5 -0.8 -1.0 5 -0.2 0.0 6 -0.7 -1.0 10 na na <5
-0.5 0.0 76 na na <5 na na <5 0.0 0.0 6 -0.3 0.0 8 na na <5 na na <5 -1.0 -1.0 5 -0.5 -0.5 12 na na <5 na na <5 -0.6 -1.0 5 -0.4 0.0 5 -0.8 -1.0 5 na na <5 -0.5 -0.5 10 na na <5
-0.4 0.0 38 na na <5 na na <5 na na <5 0.0 0.0 5 na na <5 na na <5 -0.4 0.0 5 -0.3 0.0 6 na na <5 na na <5 -0.8 -1.0 5 na na <5 na na <5 na na <5 -0.8 -1.0 5 na na <5
Liability Strategies Group
Telec
ommu
ni ca
tions
Tran
spor
tation
Se
rvice
s
Media
Metal
s and
Mini
ng
Utilit
ies
Undis
close
d & O
ther
Healt
h Car
e &
Phar
mace
utica
ls
CFO Views on the Importance and Execution of Finance Functions
Chem
icals
Cons
umer
Cons
umer
Fina
nce
Oil a
nd G
as
Tech
nolog
y
Indus
trials
and
Mater
ials
Results of Question 3.13: Fairness of Credit Rating by Industry
If you are rated, do you believe that your current long-term rating is fair?
Dive
rsifie
d/Con
glo
mera
tes
S&P
98
All
Autom
obile
s
Busin
ess S
ervic
es
Moody's
Fitch
x x~ x x~ x x~ x x~ x x~ x x~ x x~ x x~x x~ x x~ x x~ x x~ x x~ x x~ x x~ x x~ x x~

January 2006
3.13: Fairness of Credit Rating by Ratings and ListingQuestion:
N N N N N N N N
-0.5 0.0 84 -0.4 0.0 64 -0.7 -1.0 20 na na <5 na na <5 -0.5 0.0 72 -0.3 0.0 12 na na <5
-0.5 0.0 76 -0.4 0.0 55 -0.7 -1.0 21 na na <5 na na <5 -0.5 0.0 67 -0.4 0.0 9 na na <5
-0.4 0.0 38 -0.4 0.0 31 -0.7 -1.0 7 na na <5 na na <5 -0.5 0.0 33 -0.4 0.0 5 na na <5
Liability Strategies Group
CFO Views on the Importance and Execution of Finance Functions
Undis
close
d
Listed
Not L
isted
Undis
close
d
RatingsResults of Question 3.13: Fairness of Credit Rating by Ratings and Listing
Listing
If you are rated, do you believe that your current long-term rating is fair?
Moody's
FitchInv
estm
ent G
rade
Non-
inves
tmen
t Gr
ade
Not R
ated
All
S&P
99
x x~ x x~ x x~ x x~ x x~ x x~x x~ x x~

January 2006
5.8: Actions to Avoid a Dividend CutQuestion:
Never Slightly Likely Very Likely
0 1 2 3 4 5
26% 22% 11% 15% 20% 6% 2.0 2.0 159
48% 26% 12% 10% 4% 0% 1.0 1.0 156
10% 27% 15% 20% 17% 10% 2.4 2.0 157
29% 30% 18% 9% 11% 3% 1.5 1.0 157
25% 31% 12% 16% 12% 2% 1.6 1.0 153
59% 23% 12% 4% 2% 0% 0.7 0.0 157
48% 31% 8% 8% 5% 0% 0.9 1.0 153
9% 14% 17% 20% 22% 19% 2.9 3.0 162
Liability Strategies Group
CFO Views on the Importance and Execution of Finance Functions
Sell assets at a discount to their fair value
Borrow up to the limit of the credit rating
Sell assets at their fair value
Cut deferrable investment
Cut strategic investment
100
Results of Question 5.8: Actions to Avoid a Dividend Cut
Suppose that your operating cashflows were weak and you had insufficient liquid resources to pay Regular Dividends at the most recent level. How likely would you be to take each of these actions?
N
Raise new equity
Cut dividends
Borrow and allow the credit rating to fall
x x~

January 2006
5.8: Actions to Avoid a Dividend Cut by RegionQuestion:
N N N N N N N N N N
2.0 2.0 159 1.8 1.0 24 na na <5 na na <5 1.6 1.0 34 1.6 1.0 21 2.6 3.0 9 3.2 4.0 14 2.0 2.0 50 na na <5
1.0 1.0 156 1.1 1.0 24 na na <5 na na <5 0.7 0.0 34 1.0 1.0 21 0.8 0.0 9 1.8 2.0 13 0.8 0.0 49 na na <5
2.4 2.0 157 2.5 2.5 24 na na <5 na na <5 1.9 1.0 34 2.3 2.0 21 2.0 1.0 9 3.8 4.0 13 2.3 2.0 50 na na <5
1.5 1.0 157 1.7 2.0 24 na na <5 na na <5 1.2 1.0 34 1.8 2.0 21 0.4 0.0 9 2.5 2.0 13 1.5 1.0 49 na na <5
1.6 1.0 153 1.7 1.0 24 na na <5 na na <5 1.3 1.0 32 2.1 2.0 21 1.1 1.0 9 2.7 3.0 13 1.6 1.0 48 na na <5
0.7 0.0 157 0.8 0.0 24 na na <5 na na <5 0.4 0.0 33 1.2 1.0 21 0.4 0.0 9 1.2 1.0 13 0.5 0.0 50 na na <5
0.9 1.0 153 1.3 1.0 24 na na <5 na na <5 0.7 0.0 32 0.9 1.0 21 0.3 0.0 7 0.8 1.0 13 0.9 1.0 48 na na <5
2.9 3.0 162 3.2 3.0 24 na na <5 na na <5 3.5 4.0 34 2.1 2.0 21 3.0 4.0 9 2.2 2.0 14 2.8 3.0 53 na na <5
Liability Strategies Group
Asia
exclu
ding J
apan
Austr
alia &
New
Ze
aland
Borrow and allow the credit rating to fall
Cut deferrable investment
Cut strategic investment
Sell assets at their fair value
Sell assets at a discount to their fair value
Raise new equity
Cut dividends
Latin
Ame
rica
North
Ame
rica
Borrow up to the limit of the credit rating
Undis
close
d
CFO Views on the Importance and Execution of Finance Functions
Suppose that your operating cashflows were weak and you had insufficient liquid resources to pay Regular Dividends at the most recent level. How likely would you be to take each of these actions?
Easte
rn E
urop
e, Mi
ddle
East
& Af
rica
Germ
any
Japa
n
Wes
tern E
urop
e ex
cludin
g Ger
many
Results of Question 5.8: Actions to Avoid a Dividend Cut by Region
All
101
x x~ x x~ x x~ x x~ x x~ x x~ x x~ x x~x x~ x x~

January 2006
5.8: Actions to Avoid a Dividend Cut by IndustryQuestion:
N N N N N N N N N N N N N N N N N
2.0 2.0 159 1.2 0.5 6 na na <5 2.7 2.5 10 na na <5 2.0 1.5 26 na na <5 2.1 2.0 9 2.1 2.5 28 2.4 3.0 7 1.0 1.0 7 2.9 3.5 10 2.1 2.0 8 na na <5 1.5 1.0 13 1.8 1.0 8 1.6 1.0 13
1.0 1.0 156 0.0 0.0 6 na na <5 1.1 0.5 10 na na <5 1.1 1.0 25 na na <5 1.2 1.0 9 1.0 0.5 28 1.3 1.0 7 0.8 0.5 6 1.0 0.5 10 1.3 1.0 8 na na <5 0.3 0.0 12 1.0 0.5 8 0.7 0.0 13
2.4 2.0 157 1.3 1.0 6 na na <5 3.0 3.5 10 na na <5 2.1 2.0 25 1.4 1.0 5 2.7 2.0 9 2.9 3.0 28 2.5 2.5 6 1.7 1.0 6 1.8 1.0 10 2.5 2.5 8 na na <5 2.0 1.5 12 2.4 2.5 8 2.8 3.0 13
1.5 1.0 157 0.8 1.0 6 na na <5 1.9 1.5 10 na na <5 1.4 1.0 25 0.8 1.0 5 2.0 2.0 9 2.0 2.0 28 1.3 1.0 6 1.4 1.0 7 0.8 0.0 9 1.6 1.0 8 na na <5 1.4 1.0 12 1.1 1.0 8 1.6 1.0 13
1.6 1.0 153 1.8 2.0 6 na na <5 1.0 1.0 9 na na <5 2.2 2.0 24 1.0 1.0 5 2.0 1.5 8 1.9 1.5 28 1.6 1.0 5 1.0 1.0 7 1.2 1.0 10 2.0 1.0 8 na na <5 1.5 1.0 11 1.5 1.5 8 1.5 1.0 13
0.7 0.0 157 0.3 0.0 6 na na <5 0.3 0.0 10 na na <5 0.9 1.0 25 0.0 0.0 5 1.0 1.0 9 0.9 0.5 28 0.3 0.0 6 0.6 0.0 7 0.6 0.0 10 1.0 1.0 8 na na <5 0.4 0.0 11 0.5 0.0 8 0.5 0.0 13
0.9 1.0 153 0.3 0.0 6 na na <5 0.2 0.0 10 na na <5 1.2 1.0 26 0.2 0.0 5 1.0 1.0 9 1.1 1.0 27 0.3 0.0 6 0.6 0.0 7 0.6 0.0 8 2.0 2.0 8 na na <5 0.8 1.0 10 1.4 1.0 8 0.8 0.5 12
2.9 3.0 162 3.2 4.0 6 na na <5 2.1 2.0 10 na na <5 3.5 4.0 26 3.4 3.0 5 2.7 3.0 9 3.0 3.5 28 2.3 2.0 6 3.0 3.0 7 2.9 3.0 10 3.1 3.5 8 na na <5 2.7 3.0 13 3.5 4.5 10 2.5 3.0 13
Liability Strategies Group
Telec
ommu
ni ca
tions
Tran
spor
tation
Se
rvice
s
Media
Metal
s and
Mini
ng
CFO Views on the Importance and Execution of Finance Functions
Chem
icals
Cons
umer
Cons
umer
Fina
nce
Oil a
nd G
as
Tech
nolog
y
Indus
trials
and
Mater
ials
Results of Question 5.8: Actions to Avoid a Dividend Cut by Industry
Suppose that your operating cashflows were weak and you had insufficient liquid resources to pay Regular Dividends at the most recent level. How likely would you be to take each of these actions?
Borrow up to the limit of the credit rating
Borrow and allow the credit rating to fall
Cut deferrable investment
Cut strategic investment
102
Sell assets at their fair value
Sell assets at a discount to their fair value
Raise new equity
Cut dividends
Undis
close
d & O
ther
All
Autom
obile
s
Busin
ess S
ervic
es
Utilit
ies
Dive
rsifie
d/Con
glo
mera
tes
Healt
h Car
e &
Phar
mace
utica
ls
x x~ x x~ x x~ x x~ x x~ x x~ x x~ x x~x x~ x x~ x x~ x x~ x x~ x x~ x x~ x x~ x x~

7 September 2005
5.8: Actions to Avoid a Dividend Cut by Ratings and ListingQuestion:
N N N N N N N N
2.0 2.0 159 2.4 2.0 64 2.9 3.0 15 na na <5 1.6 1.0 76 2.2 2.0 120 1.4 1.0 39 na na <5
1.0 1.0 156 1.1 1.0 64 1.5 1.0 15 na na <5 0.7 0.0 73 1.1 1.0 117 0.5 0.0 39 na na <5
2.4 2.0 157 2.7 3.0 64 2.7 3.0 15 na na <5 2.0 2.0 74 2.6 3.0 119 1.7 1.0 38 na na <5
1.5 1.0 157 1.5 1.0 64 2.2 3.0 15 na na <5 1.4 1.0 74 1.7 1.0 119 0.9 1.0 38 na na <5
1.6 1.0 153 1.9 2.0 61 2.1 2.0 15 na na <5 1.3 1.0 73 1.9 1.5 116 0.9 1.0 37 na na <5
0.7 0.0 157 0.7 0.0 63 1.3 1.0 15 na na <5 0.5 0.0 75 0.8 0.0 119 0.3 0.0 38 na na <5
0.9 1.0 153 0.7 0.0 60 1.5 1.0 15 na na <5 1.0 1.0 74 1.0 1.0 117 0.8 0.0 36 na na <5
2.9 3.0 162 2.4 2.0 67 3.6 4.0 15 na na <5 3.2 3.0 76 2.8 3.0 124 3.2 3.5 38 na na <5
Liability Strategies Group
Sell assets at their fair value
Sell assets at a discount to their fair value
Raise new equity
Cut dividends
Not R
ated
All
Borrow up to the limit of the credit rating
Borrow and allow the credit rating to fall
Cut deferrable investment
Cut strategic investmentInv
estm
ent G
rade
CFO Views on the Importance and Execution of Finance Functions
Undis
close
d
Listed
Not L
isted
Undis
close
d
RatingsResults of Question 5.8: Actions to Avoid a Dividend Cut by Ratings and Listing
Listing
Suppose that your operating cashflows were weak and you had insufficient liquid resources to pay Regular Dividends at the most recent level. How likely would you be to take each of these actions?
Non-
inves
tmen
t Gr
ade
103
x x~ x x~ x x~ x x~ x x~ x x~x x~ x x~

Corporate Financial Policies and Practices Series
Following an extensive survey of Global Corporate Financial Policies and Practices, undertaken jointly with Professor Henri Servaes (London Business School) and Professor Peter Tufano (Harvard Business School), along with our secondary project sponsors, the Global Association of Risk Professionals (GARP), we are pleased to provide corporate clients with extensive information covering:
Research Papers Published
CFO Views on the Importance and Execution of the Finance Function Jan 2006
The Theory and Practice of Corporate Capital Structure Jan 2006
The Theory and Practice of Corporate Debt Structure Feb 2006
The Theory and Practice of Corporate Liquidity Policy Jan 2006
The Theory and Practice of Corporate Dividend and Share Repurchase Policy Feb 2006
The Theory and Practice of Corporate Risk Management Policy Feb 2006
The Questions and Sample of the Global Survey of Corporate Financial Policies and Practices Jan 2006
The above reports can be accessed, free of charge, online at: www.dbbonds.com/lsg/reports.jsp. Alternatively you can order a CD by sending an email to: [email protected].
In addition to the abovementioned research papers, both the website and CD contain streaming video of Professors Servaes and Tufano presenting an overview of the results at a Deutsche Bank hosted conference.
Disclaimer
This information is provided as an accommodation for educational purpose only and does not create any legally binding obligations on Deutsche Bank AG London and/or its affiliates (collectively "DB"). DB’s provision of this information does not constitute an offer to sell or a solicitation of an offer to buy any instrument or service. This document and the information contained herein does not constitute investment advice and DB is not acting in a fiduciary capacity with respect to any party. The information contained in this document is based on material we believe to be reliable; however, we do not represent that it is accurate, current, complete, or error free. The information used was taken from a sample group and may not be indicative of the market as a whole. Results were produced from survey participants and DB is relying on their statements. Assumptions, estimates and opinions contained in this document are as of the date of the document and are subject to change without notice. The reliability, accuracy, completeness or timeliness of the information contained in this document cannot be guaranteed and therefore you should not use this information to make any investment decision. The information contained herein is made available to you on the basis that DB retains all respective intellectual property and other rights in and to the information. You may not engage in any secondary distribution of this document without the express written permission of DB. DB SPECIFICALLY DISCLAIMS ALL LIABILITY FOR ANY DIRECT, INDIRECT, CONSEQUENTIAL OR OTHER LOSSES OR DAMAGES INCLUDING LOSS OF PROFITS INCURRED BY YOU OR ANY THIRD PARTY THAT MAY ARISE FROM ANY RELIANCE ON THIS DOCUMENT OR FOR THE RELIABILITY, ACCURACY, COMPLETENESS OR TIMELINESS THEREOF. Deutsche Bank Securities, Inc., a member of the NYSE, NASD and SIPC, a subsidiary of Deutsche Bank AG, conducts investment banking and securities activities in the United States. Deutsche Bank AG London Branch is a member of the LSE and regulated by the FSA.
Copyright© 2006 Deutsche Bank AG.