Embed Size (px)
Citation preview
CO2/H2O Analyzer
®
Environmental Division
Instruction Manual
LI-7500

Open Path CO2/H2O AnalyzerInstruction Manual

ii
LI-
CO
R, i
nc.
Env
iron
men
tal D
ivis
ion
4421
Sup
erio
r St
reet
P.O
. Box
442
5L
inco
ln, N
ebra
ska
6850
4 U
SA
Phon
e: 4
02-4
67-3
576
FAX
: 402
-467
-281
9In
form
atio
n: 1
-800
-447
-357
6 (T
oll-
free
U.S
. & C
anad
a)E
-mai
l: en
vsal
es@
env.
licor
.com
®
SERVING RESEARCHERS IN
BIOLOGICAL SCIENCES
ENVIRONMENTAL DIVISION
Man
ufac
ture
r’s
Nam
e: L
I-C
OR
, Inc
.
Man
ufac
ture
r’s
Add
ress
: 4
421
Supe
rior
Str
eet
L
inco
ln, N
ebra
ska
USA
685
04
decl
ares
tha
t th
e pr
oduc
t
Pro
duct
Nam
e: O
pen
Path
CO
2/H
2O I
nfra
red
Gas
Ana
lyze
r
Mod
el N
umbe
r(s)
: L
I-75
00
Pro
duct
Opt
ions
: N
one
conf
orm
s to
the
fol
low
ing
Pro
duct
Spe
cifi
cati
ons:
Supp
lem
enta
ry I
nfor
mat
ion:
T
he p
rodu
ct h
erew
ith c
ompl
ies
with
the
requ
irem
ents
of
the
EM
C D
irec
tive
89/3
36/E
EC
.
Dav
id L
. Dill
eyD
irec
tor
of E
ngin
eeri
ngE
nvir
onm
enta
l Div
isio
n
Dec
lara
tion
of C
onfo
rmity
EM
C:
CIS
PR 1
1: 1
990
/ EN
550
11:1
991
- G
roup
1, C
lass
AE
N50
082-
1 : 1
992
IEC
801
-2 :
1991
- 1
5kV
Air
Dis
char
ge, 4
kV C
onta
ct D
isch
arge
IEC
801
-3 :
1984
- 1
0V/m
IEC
801
-4 :
1988
- 0
.5kV
I/O
Lin
es
1
kV P
ower
Lin
es
Oct
ober
21,
199
9D
ocum
ent #
53-0
6167

iii
NOTICEThe information contained in this document is subject to change without notice.
LI-COR MAKES NO WARRANTY OF ANY KIND WITH REGARD TO THIS MATERIAL, INCLUDING, BUT NOT LIMITED TO THEIMPLIED WARRANTIES OF MERCHANTABILITY AND FITNESS FOR A PARTICULAR PURPOSE. LI-COR shall not be liable forerrors contained herein or for incidental or consequential damages in connection with the furnishing, performance, or use of this material.
This document contains proprietary information which is protected by copyright. All rights are reserved. No part of this document may bephotocopied, reproduced, or translated to another language without prior written consent of LI-COR, Inc.
© Copyright 1999, LI-COR, Inc.Publication Number 9908-125
Printing HistoryNew editions of this manual will incorporate all material since the previous editions. Update packages may be used between editions whichcontain replacement and additional pages to be merged into the manual by the user.
The manual printing date indicates its current edition. The printing date changes when a new edition is printed. (Minor corrections and updateswhich are incorporated at reprint do not cause the date to change).
Microsoft® and Windows® are registered trademarks of Microsoft Corporation. Eurofast® is a registered trademark of Turck Inc.
LI-COR, Inc. ● 4421 Superior Street ● Lincoln, Nebraska 68504Phone: 402-467-3576 ● FAX: 402-467-2819Toll-free: 1-800-447-3576 (U.S. & Canada)e-mail: [email protected] ● www.licor.com

iv
Table of Contents
Section 1. Introduction
Overview of the LI-7500 .............................................................................................................................................................. 1-1Getting Started Tutorial ................................................................................................................................................................ 1-3
Section 2. Theory of Operation
Relating Absorptance to Concentration........................................................................................................................................ 2-1Measuring Absorptance ................................................................................................................................................................ 2-3Cross Sensitivity ........................................................................................................................................................................... 2-4Zero Drift ...................................................................................................................................................................................... 2-5Equation Summary ....................................................................................................................................................................... 2-6LI-7500 Implementation ............................................................................................................................................................... 2-9A Note About Pressure and Temperature ..................................................................................................................................... 2-10

v
Section 3. Setup and Operation
Installing the LI-7500 ................................................................................................................................................................... 3-1Mounting the Control Box .................................................................................................................................................... 3-1Mounting the Sensor Head .................................................................................................................................................... 3-4
Serial Cable Connection ............................................................................................................................................................... 3-56-Pin Eurofast Serial Cable ................................................................................................................................................... 3-5LI-7500 Serial Adapter Cable ............................................................................................................................................... 3-6Standard Serial Cable ............................................................................................................................................................ 3-7
DAC Cable Connection ................................................................................................................................................................ 3-9Installing the PC Communications Software on Your Computer ................................................................................................ 3-10Operation - Using the LI7500 Software ....................................................................................................................................... 3-10
Connect Page - Establishing Communications ..................................................................................................................... 3-11Calibration Page - Setting the Zero and Span ....................................................................................................................... 3-13Cal Coefficients Page ............................................................................................................................................................ 3-15
Changing Sensor Heads ................................................................................................................................................. 3-17Inputs Page - Temperature, Pressure, and Auxiliary Inputs .................................................................................................. 3-19Outputs Page - Setting DAC and SDM Outputs ................................................................................................................... 3-21RS-232 Page - Setting RS-232 Output .................................................................................................................................. 3-28PC Logging Page - Choosing the Values to Log .................................................................................................................. 3-31Strip Charts Page................................................................................................................................................................... 3-33Diagnostics Page ................................................................................................................................................................... 3-36Menu Description .................................................................................................................................................................. 3-37
vi
Operational Considerations .......................................................................................................................................................... 3-41
Section 4. Calibration
Introduction................................................................................................................................................................................... 4-1How Stable are Zero and Span? ................................................................................................................................................... 4-2Checking the Zero - Considerations ............................................................................................................................................. 4-3Checking the Span - Considerations ............................................................................................................................................. 4-3What Actually Happens................................................................................................................................................................ 4-4Complete Step-by-Step Calibration Instructions .......................................................................................................................... 4-7
Section 5. Maintenance
Cleaning the Optical Path ............................................................................................................................................................. 5-1Changing the Fuse ........................................................................................................................................................................ 5-2Replacing the Internal Chemicals ................................................................................................................................................. 5-3

vii
Section 6. Troubleshooting
Power On Problems ...................................................................................................................................................................... 6-1PC Connection Problems.............................................................................................................................................................. 6-2Bad Temperature or Pressure Readings ....................................................................................................................................... 6-3Bad CO2 or H2O Readings ........................................................................................................................................................... 6-4Diagnostic Messages .................................................................................................................................................................... 6-5LI7500 Error Messages ................................................................................................................................................................ 6-8
Appendix A. SpecificationsAppendix B. Pin AssignmentsAppendix C. List of SuppliersAppendix D. Configuration GrammarWarranty

Introduction 1-1
Introduction
Overview of the LI-7500
The LI-7500 is a high performance, non-dispersive, open path infrared CO2/H2O analyzerdesigned for use in eddy covariance flux measurement systems. Some of the LI-7500'simportant features include:● Simultaneous measurements of CO2 and H2O in the free atmosphere.● High speed measurements. Internal 150 Hz measurements are digitally filtered to provide
a true 5, 10, or 20 Hz bandwidth.● Withstands exposure to rain or snow without damage or calibration shift.● Versatile output options: DACs, SDM, and RS-232.● Simple Windows® software provides for easy user calibration and configuration.

Section 1
1-2 Introduction
If you have just taken delivery of your LI-7500, check the packing list to verify that you havereceived everything that was ordered and that you have also received the following items:
● Standard Spare Parts Kit - (part #9975-007). This kit contains replacement parts foryour LI-7500. Among other items, the spares kit contains cables and fuses, spare internalchemical bottles, soda lime, serial adapter cable, tubing, and control box mountingbrackets. As you become familiar with the analyzer you will learn which items to keepclose at hand and which items can be stored away.
● RS-232 Cables - (see step 4 in the Getting Started Tutorial which follows for informationon connecting the LI-7500 to a computer). Three RS-232 cables are included:
Part #9975-015 - short cable, to connect the internal RS-232 connector to yourcomputer, using #9975-016 (below).Part #9975-016 - 9 pin to 9 pin RS-232 cable.Part #392-05620 - 4m RS-232 cable, unterminated on one end, to connect to theexternal port on the LI-7500 control box.
● Power Cable - (part #392-05619). 4m cable used to connect the LI-7500 to your 10.5-30VDC power supply.
● SDM Interface Cable - (part #392-05618). Used to connect the LI-7500 in aSynchronous Device for Measurement (SDM) loop, such as those used by CampbellScientific data recording devices. Longer cables can be ordered from Turck Inc. (seeAppendix C).

Section 1
Introduction 1-3
● Analog Input Cable - (part #392-05621). Used to connect external temperature and/orpressure transducers to the LI-7500. See Calibration Section 4 for details.
● DAC Output Cable - (part #392-05622). Used for DAC outputs from the LI-7500.
● LI7500 Data Communications Software - (part #7500-50). This Windows® 95 andWindows® NT compatible software allows your computer to communicate with theLI-7500. The software is provided on CD. A complete description of this software canbe found in Section 3, Setup and Operation.
● Calibration Accessory - (part #9975-012). Contains a calibration tube required forsetting the zero and span of the LI-7500. Complete calibration instructions can be foundin Section 4.
● Calibration Sheet - Contains the calibration coefficients for your LI-7500 sensor head.These values are unique to each sensor head, and have been entered into the control boxat the factory. Keep this sheet in case you need to re-enter these values.
Getting Started Tutorial
The following section briefly covers the basic steps you might follow to set up the LI-7500 tocollect and record data. Many of these steps are described in greater detail elsewhere in thismanual.

Section 1
1-4 Introduction
1 Connect the Sensor Head
The LI-7500 sensor head is connected to the control module via a 3m (10') shielded cable.The cable has a circular connector which is attached to the sensor head as shown in Figure 1-2. Align the red marks on the cable connector and the sensor head, and push straight in. Tounplug the connector, pull straight out. Do Not Twist!

Section 1
Introduction 1-5
Figure 1-1. Align the marks and insert the cable connector.

Section 1
1-6 Introduction
2 Connect the Power Supply
The power supply cable (#392-05619) has a circular connector that attaches to the LI-7500control unit front panel at the location shown in Figure 1-2. The other end has bare wire leadsfor connection to a 10.5-30VDC supply (2A or greater). Connect the red lead to the positiveterminal of the power supply, and the black lead to the negative terminal.
3 Install the LI7500 PC Communications Software
This software is required for communicating with a computer. Installation instructions can befound in Section 3, Installing the PC Communications Software on Your Computer.
4 Connect the RS-232 Cables
For convenience when operating the LI-7500 in the laboratory, a short adapter cable (#9975-015) is provided for connecting the instrument to your computer.
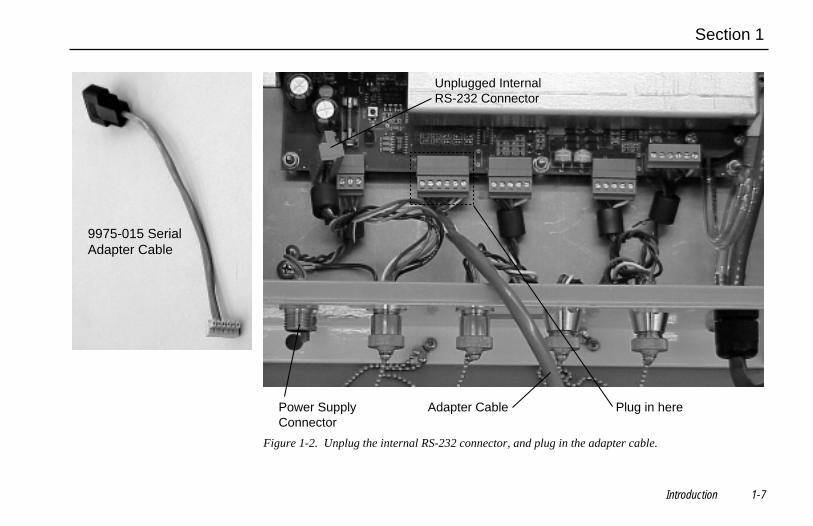
a. Open the control box.b. Unplug the internal RS-232 connector from the board, as shown in Figure 1-2.c. Plug the 9975-015 adapter cable (Figure 1-2) into this connector.d. Connect the DB-9 end of the adapter cable to your computer using the 9975-016 cable.
Section 1
Introduction 1-7
9975-015 Serial Adapter Cable
Adapter Cable
Unplugged InternalRS-232 Connector
Power SupplyConnector
Plug in here
Figure 1-2. Unplug the internal RS-232 connector, and plug in the adapter cable.

Section 1
1-8 Introduction
5 Start the LI-7500 Communications Program
Open the LI7500 Windows Communications program. Choose the COM (serial) port towhich the RS-232 cable (Step 4) is connected to the computer, select a baud rate, and click onConnect. After a few seconds, you should see "live" numbers on the display.
6 Verify Calibration Coefficients
Click on the Cal Coeffs tab in the LI7500 program and verify that the information on thispage matches what is printed on the calibration sheet for the sensor head being used. (Sensorheads are interchangeable, but the calibration coefficients, as well as the zero and spanparameters on the Calibration page, are unique to each sensor head).
7 Verify Temperature and Pressure
Click on the Calibration tab, and verify that reasonable values are being displayed for'Temperature (°C)' and 'Pressure (kPa)'. If there appears to be a problem, see "BadTemperature or Pressure Readings" in the Troubleshooting section.

Section 1
Introduction 1-9
8 Verify CO2 and H2O Response
If the sensor is indoors, it may be reading very high values of CO2; if you exhale toward thesensor head, CO2 and H2O should show a sudden spike upward.
9 Verify AGC
Click on the Diagnostics tab, and view the AGC value. You might want to make a note of thisvalue, as it represents the "clean window" baseline value (assuming your instrument is new).Typical values are 50 or 60%. As dirt accumulates on the windows (or anywhere in theoptical path), the AGC value will increase to 100%. The instrument will still functioncorrectly at 100%, but there is not much room for further compensation, so the windowsshould be cleaned before it gets to 100%.
10 (Optional) Verify Calibration
If you have facilities to check zero and span, do so now (see Section 4, Calibration). This wasdone at the factory prior to shipping, so should not be necessary on new instruments*. Notethe zero values for CO2 and H2O, if this is a new instrument. As the internal chemicalsbecome depleted, these values will decrease (when you re-zero).
* If you find the span needs re-setting, it is possible that your CO2 (or H2O) standards differfrom LI-COR's.
Theory of Operation 2-1
Theory of Operation
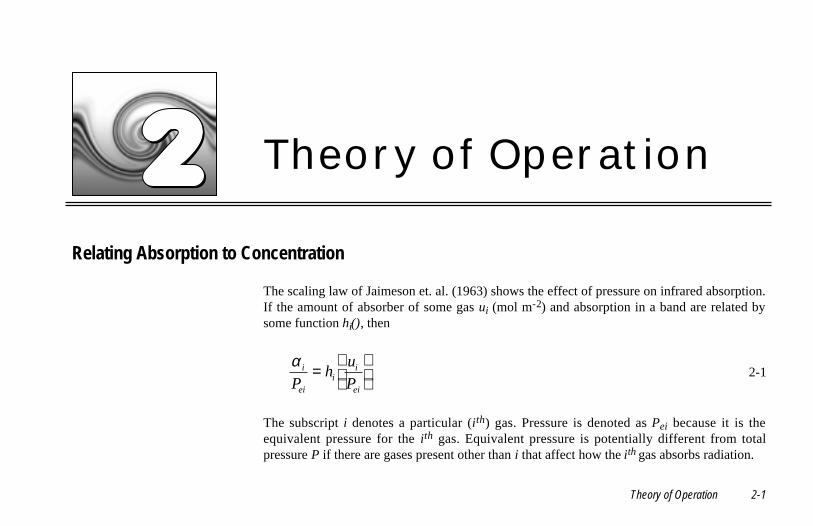
Relating Absorption to Concentration
The scaling law of Jaimeson et. al. (1963) shows the effect of pressure on infrared absorption.If the amount of absorber of some gas ui (mol m-2) and absorption in a band are related bysome function hi(), then
α i
eiP=
hu
Pii
ei
2-1
The subscript i denotes a particular (ith) gas. Pressure is denoted as Pei because it is theequivalent pressure for the ith gas. Equivalent pressure is potentially different from totalpressure P if there are gases present other than i that affect how the ith gas absorbs radiation.

Section 2
2-2 Theory of Operation
We rewrite this in terms of number density (mol m-3) by introducing a path length λ, andnoting that ui = ρiλ. Substituting this into Equation 2-1, and solving for the number density ρiof gas i yields
ρλ
αi
eii
i
ei
Ph
P=
−1 2-2
We rewrite Equation 2-2 as
ρ αi ei i
i
ei
PP
=
f 2-3
by combining λ and the inverse h() functions into a new function fi(). The calibration functionfi() is generated by measuring a range of known densities ρi and fitting a curve to ρi/Peiplotted against αi/Pei. Since gas standards are not available in “known densities”, the ρivalues are computed from known concentrations mi (moles of gas per mole of air) using theideal gas law
ρi imP
RT= 2-4
Section 2
Theory of Operation 2-3
Measuring Absorptance
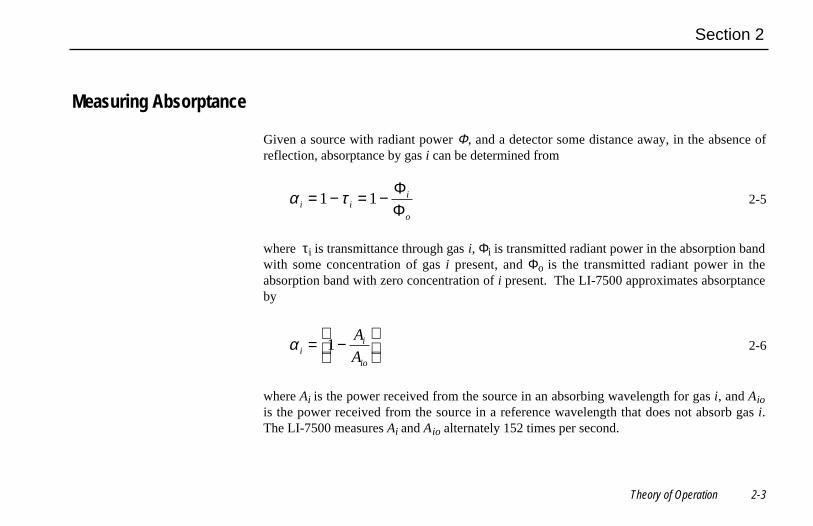
Given a source with radiant power Φ, and a detector some distance away, in the absence ofreflection, absorptance by gas i can be determined from
α τi ii
o
= − = −1 1ΦΦ
2-5
where τi is transmittance through gas i, Φi is transmitted radiant power in the absorption bandwith some concentration of gas i present, and Φo is the transmitted radiant power in theabsorption band with zero concentration of i present. The LI-7500 approximates absorptanceby
α ii
io
A
A= −
1 2-6
where Ai is the power received from the source in an absorbing wavelength for gas i, and Aiois the power received from the source in a reference wavelength that does not absorb gas i.The LI-7500 measures Ai and Aio alternately 152 times per second.

Section 2
2-4 Theory of Operation
If we combine Equations (2-6) and (2-3), we can write the full equation for computing molardensity from absorptance.
ρi ei ii
ioi
i
ei
PA
Az
S
P= −
f 1 2-7
Note the zeroing term zi and the span adjustment term Si in Equation (2-7).
Cross Sensitivity
Because the LI-7500 uses one detector for measuring Ac, Aco, Aw, and Awo, there is a slightcross-sensitivity between gases due to imperfections in the detector's frequency (time)response. This varies from detector to detector, but is measured during calibration, and iscorrected in software. Equation 2-6 is written as
α ii
ioji
j
jo
A
AX
A
A= − + −
1 1 2-8
where Xji is the cross sensitivity response of gas j on gas i (determined during calibration), andAj and Ajo are the absorbed and non-absorbed power for gas j. Equation 2-7 becomes

Section 2
Theory of Operation 2-5
ρi ei ii
ioij
j
joi
i
ei
P fA
AX
A
Az
S
P= − + −
1 1 2-9
Zero Drift
Even though the detector and filters are temperature controlled in the LI-7500, the detector issubject to slight temperature drift as ambient temperature changes. This error is directlyrelated to the detector cooler control voltage, which is measured, and thus provides amechanism for a software "fine tuning".
The zero term zi is computed from
zi = Zio + ZiVd 2-10
where Vd is detector cooler voltage, Zi is the slope of the relationship between Vd and zi(determined during calibration), and Zio is the zero factor determined when setting the zero.

Section 2
2-6 Theory of Operation
Equation Summary
H2OIn the atmosphere, the absorption of radiation by water vapor is not significantly influencedby any other gas, so the effective pressure for water vapor Pew is simply the total pressure P.
Pew = P 2-11
H2O absorptance αw is (from Equations 2-8 and 2-10)
α ww
wocw
c
cowo w d
A
AX
A
AZ Z V= − + −
+( )
1 1 2-12
where Xcw is the cross sensitivity factor for CO2 on water vapor ("H2O XS" on the calibrationsheet), Zw is the zero drift coefficient ("H2O Z" on the calibration sheet).
H2O number density ρw is given by
ρ αw w
w wPfS
P=
2-13

Section 2
Theory of Operation 2-7
The coefficients for the 3rd order polynomial fw( ) are given on the calibration sheet.
CO2The absorption of radiation by CO2 molecules is influenced by several other gases, includingO2 and H2O. Since the concentration of H2O is most variable, it must be accounted for in theequivalent pressure of Pec CO2 A method of doing this (LI-COR Application Note #116) is
Pec = Pψ(mw) 2-14
where
ψ(mw) = 1 + (aw - 1)mw 2-15
and mw is the mole fraction of water vapor. aw has been determined to be 1.15 for theLI-7500.
CO2 Absorptance αc is given by
α cc
cowc
w
woco c d
A
AX
A
AZ Y V= − + −
+( )
1 1 2-16

Section 2
2-8 Theory of Operation
where Xwc is the cross sensitivity factor for H2O on CO2 ("CO2 XS" on the calibration sheet),Zc is the zero drift coefficient ("CO2 Z" on the calibration sheet).
CO2 molar density ρc (mmol m-3) is
ρ αc ec c
c c
ec
P fS
P=
2-17
The coefficients for the 5th order polynomial fc( ) are given on the calibration sheet.

Section 2
Theory of Operation 2-9
LI-7500 Implementation
Atmospheric pressure Pg (kPa) and temperature Tg (°C) are measured by sensors in thecontrol box. Their values are displayed on the Calibrations page. Vd (volts) is measured, andis displayed as "Cooler Voltage" on the Diagnostics page.
Table 2-1. Fundamental equations used in the LI-7500 calculations.
Label Description Equation
H2O mmol/m3 H2O number densityW P f
S
Pg ww w
g
=
α
2-18
H2O g/m3 H2O mass densityW Wm = 18
10002-19
H2O mmol/mol H2O mole fractionW
WR T
Pfg
g
=+( . )273 15
10002-20
Dew Point (°C) Dew point temperatureT
x
xd =−
240 9717 502
..
2-21
xW
Pfg=
ln.613 65

Section 2
2-10 Theory of Operation
Label Description Equation
CO2 mmol/m3 CO2 number density
C PW
fS
PWg
fc
c c
gf
=
ψ α
ψ10001000
2-22
CO2 mg/m3 CO2 mass density Cm = 44C 2-23
CO2 µmol/mol CO2 mole fractionC
CR T
Pfg
g
=+( . )273 15
2-24
R = 8.314 N • M • mole-1 • K-1
A Note About Pressure And Temperature
Since the LI-7500 is calibrated for number density, temperature is not required for thecalculation, and accurate pressure measurement is not needed either (Equations 2-18 and 2-22). For example, a 5% error in pressure typically leads to a 1% error in density for CO2. Ifband broadening effects of water vapor are to be included in the CO2 number densitycomputation, however, the concentration of water vapor must be known, and this also requiresknowing temperature (Equation 2-20). But again, it needn’t be known very accurately, sincethe band broadening correction is fairly small. For example, under the worst conditions (50°C

Section 2
Theory of Operation 2-11
and saturated), a 10 °C error in the temperature measurement would make less than a 0.01%error in the CO2 number density.
When computing mole fraction, however, temperature and pressure do need to be known asaccurately as possible. Here, errors in pressure and temperature are directly proportional toerrors in mole fraction. For example, in typical conditions, a 1% error in pressure (1 kPa) or a1% error in temperature (3 °C) will result in a 1% error in concentration (3 to 4 µmol mol-1).

Setup and Operation 3-1
Setup and Operation
Installing the LI-7500
Mounting the Control BoxBrackets are included that can be used to mount the control box using bolts or U-clamps tosecure the box to a tripod or other post. There are holes in the four corners of the box, as well,that can be used to attach the box directly to a flat surface, if desired.
The mounting brackets are fashioned to accomodate a square or circular mounting post of upto 1 1/4" in width (diameter). Use a 3/16" hex key to attach the mounting brackets to thecontrol box. The U-bolt can then be inserted through the holes in the mounting bracket, andtightened around the post, as shown in Figure 3-1.

Section 3
3-2 Setup and Operation
Control Box
Socket Head Screws (4)
Side View
Top View
PostU-bolt
NutLI-7500 Control Box
Mounting Bracket
Figure 3-1. Attach mounting brackets to control box, and secure to mounting post.

Section 3
Setup and Operation 3-3
There are some additional considerations that should be taken into account when locating thecontrol box, including:
1. The cable that connects to the sensor head is 3m in length; determine the height at whichthe sensor head will be mounted, and plan to mount the control box accordingly.
2. The thermal properties of the control box are such that it is OK to place the box in directsun.
3. The power cord provided is 4m in length. Longer cables can be purchased throughdistributors of Turck, Inc. (see List of Suppliers in Appendix C). Note, however, thatlonger cables may require a larger power source.

Section 3
3-4 Setup and Operation
Mounting Post
U-Rail Holder
3/8-16 Bolt
Mounting the Sensor HeadThe LI-7500 sensor head has a mounting post that can be used to mount the analyzer. Themount is threaded to accept standard 3/8-16 tripod screws (a 1/4-20 adapter is also included,which can be threaded into the mounting post).
Figure 3-2. Mount the sensor head downwind of the sonic anemometer.
The sensor head mounting post can also be attached to a U-rail type holder and fastened with a3/8-16 screw (or a 1/4-20 screw, when using the adapter bushing), as shown at left.

Section 3
Setup and Operation 3-5
A vertical mounting orientation provides 360° acceptance for wind direction (neglecting thesonic anemometer location, of course), and this is the recommended orientation. Note,however, that the LI-7500 will function just fine in any orientation (horizontal, upside down,etc.). A horizontal orientation limits the acceptable wind direction, but reduces problems ofrain and dew droplets sitting on the windows.
However it is oriented, the sensor head should be placed as close to (and downwind of) thesonic anemometer as possible, and at equal heights, as shown in Figure 3-2.
Serial Cable Connection
There are three serial cables provided for various connection schemes (Figure 3-1). Adescription of these cables and how to use them is given below.
6-Pin Eurofast® Serial Cable (PN 310-05615)This 4m cable has a 6-pin circular connector that plugs into the 'Serial Interface' port on theLI-7500 control unit front panel. The other end has bare wire leads that can be soldered to astandard DB-9 female connector (not included) for direct connection to a computer. Thiscable is unterminated so that it can be inserted through a hole in a weatherproof box, forexample, that contains the logging device. The wire leads should be soldered to a 9-pinconnector as shown below (see Figure 3-1).

Section 3
3-6 Setup and Operation
Wire Lead Color 9-Pin Female Connector 9-Pin Male Connector
Black Pin 5 Pin 5Brown 3 2Red 8 7Blue 2 3Gray 7 8White 6 4
LI-7500 Serial Adapter Cable (PN 9975-015)The Serial Adapter Cable is used to connect to the internal RS-232 connector, located on thePC board, as shown in Figure 1-2. This cable can be used for "in the laboratory" convenience.The Serial Adapter Cable has a 6-pin connector on one end, and a 9-pin DB type connector onthe other end, which plugs into the Standard Serial Cable (below). Should one or more of thewires on the 6-pin end become detached, they can be reattached as shown below.
Wire Lead Color 6-Pin Connector
Black 1Brown 2Red 3Blue 4Gray 5White 6

Section 3
Setup and Operation 3-7
Standard Serial Cable (PN 9975-016)This is a null modem cable that is used to interface with devices such as computers, serialprinters, and terminals with 9-pin serial ports. If you want to interface to a device with a 25-pin serial port, then a 9-pin to 25-pin adapter (in the spares kit) must be used.

Section 3
3-8 Setup and Operation
Serial Adapter Cable
9-Pin Serial Port
9-Pin Female Connector
9-Pin Male Connector
25-Pin Serial Port
Standard Serial Cable
LI-7500
InternalConnector
9-Pin to 25-Pin Adapter
6-Pin Eurofast Cable
Standard Serial Cable
LI-7500
ExternalConnector
or
or
Figure 3-3. Schematic diagram of typical LI-7500 RS-232 cable configurations.
Section 3
Setup and Operation 3-9
DAC Cable (PN 392-05622) Connection
The DAC cable included is a 4m 5-pin Eurofast® cable with a circular connector thatconnects to the DAC Outputs connector on the control box front panel. There is a wiringdiagram on the inside of the control box that shows wire connections (it can also be found inAppendix B). Connect the Ground wire (black) to the negative input on your dataloggingdevice, and the DAC1 (brown) or DAC2 (blue) wire to the positive input on your device.
There is also a Ready Out wire (gray) that goes high when the LI-7500 has finished its warm-up period. This can be connected to a digital input on your logging device to indicate whenthe LI-7500 is sending "good" data.

Section 3
3-10 Setup and Operation
Installing the PC Communications Software on Your Computer
The LI7500 software is shipped on CD. It requires your computer to have an RS-232 serial(COM) interface, and Windows® 95/98 or Windows® NT.
Insert the CD into your CD-ROM drive. If installation does not automatically start, selectRun from the Windows Start menu, and select the Setup.exe file on the CD. When thesoftware has finished the installation procedure, the LI7500 program icon will be placed in thePrograms menu.
NOTE: To remove the software, go to the Control Panel and select Add/RemovePrograms. Choose LI7500 from the list of programs and click the Add/Remove button.
Operation - Using the LI7500 Software
Data from the LI-7500 can be transferred to a computer for analysis, printing or storage usingthe RS-232 interface. The LI-7500 RS-232 port is configured as Data Terminal Equipment(DTE) with no hardware handshaking, and is bi-directional, meaning information can betransferred both into and out of the LI-7500.
The LI7500 PC Communication Software that comes with the LI-7500 is used to transfer dataand setup files between the analyzer and the PC.
Section 3
Setup and Operation 3-11
Connect Page - Establishing Communications
The Connect page is the area in which you select the communication parameters forconnecting the LI-7500 to your computer. The serial (COM) port, baud rate, and dataacquisition frequency (in Hz) are chosen in this page. Click on the Connect button toestablish communications with the LI-7500. Click on Disconnect to terminatecommunications.
It usually takes about 5 seconds before the connection is established. If something is wrong, itwill time out after about 15 seconds. If this happens, make sure you've got the correct COMport, and retry.

Section 3
3-12 Setup and Operation

Section 3
Setup and Operation 3-13
COM PortUse the arrow buttons to select the serial port on your computer to which the LI-7500 RS-232cable is connected. Valid numbers are between 1 and 38.
Baud RateUse the Baud Rate pull-down menu to select the baud rate at which to communicate with theLI-7500 through the LI-7500 serial port. The rate of data transfer is also dependent upon themaximum rate available with your computer's serial port, and the update frequency (see DataAcquisition Frequency below) to be used while the program communicates with the LI-7500.Select from 9600, 19200, or 38400.
Data Acquisition FrequencyThis is the update frequency to be used while the LI7500 program communicates with theLI-7500. Select from 1, 2, 5, 10, or 20 Hz, or enter your own value (≥ 0 and ≤ 20.0). Notethat at 9600 baud, the maximum update frequency is 5 Hz; at 19200 baud, 10 Hz; and at38400 baud, 20 Hz.
Calibration Page - Setting the Zero and Span
The Calibration page allows you to view current values of CO2, H2O, pressure, andtemperature in real time for the purpose of calibrating the analyzer. Complete instructions forcalibrating the LI-7500 can be found in Section 4.

Section 3
3-14 Setup and Operation

Section 3
Setup and Operation 3-15
The CO2 Page shows the time and date of the last zero and/or span calibration, and containsbuttons to set the zero and span. There is also an entry field to set the target value for the spangas that is being used to set the span of the instrument.
The H2O Page is identical to the CO2 page, with the exception that the target value for theH2O span is given in degrees C dewpoint.
The Current Value for zero (CO2 and H2O) is typically between 0.9 and 1.1 (Zwo and Zco, seeEquations 2-12 and 2-16). It is recommended that you track this value over time as you re-zero the instrument. As the internal chemicals lose their effectiveness, this value willdecrease. Also, the CO2 current value will become somewhat temperature dependent.
The Current Value for span (CO2 and H2O) should be close to 1.0 (0.95 to 1.05).
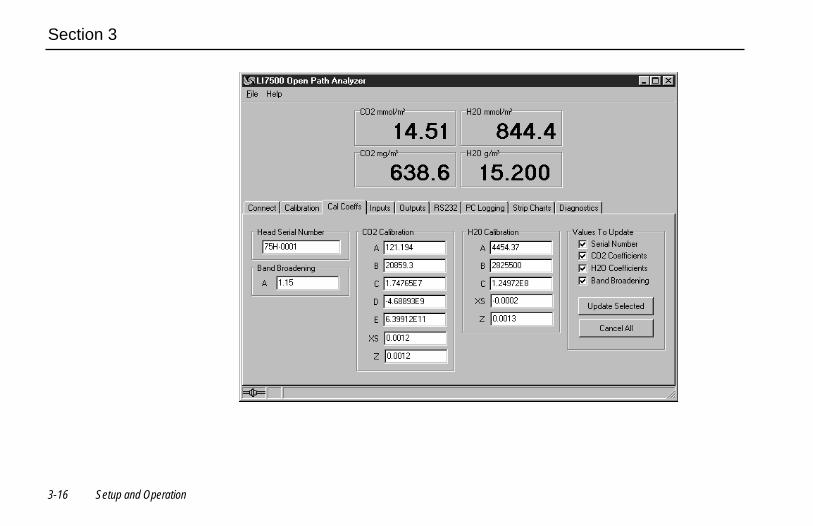
Cal Coefficients Page
The LI-7500 uses a fifth order polynomial for the CO2 calibration, and a third orderpolynomial for H2O calibration. The Calibration Coefficients page displays these factory-determined calibration coefficients, as well as a factor for correcting CO2 measurements forband broadening due to the presence of water vapor, and a zero drift correction factor (Z).The coefficient shown as XS (Cross Sensitivity) compensates for slight cross sensitivitybetween CO2 and H2O signals absorbed by the detector (see Cross Sensitivity on page 2-4,and Zero Drift on page 2-5).
Section 3
3-16 Setup and Operation

Section 3
Setup and Operation 3-17
The calibration coefficients, XS, and Z values are unique to each sensor head, and may befound on the calibration sheet shipped from the factory. The Band Broadening coefficient is1.15 for all sensor heads.
The calibration coefficients are stored in the LI-7500 control box. To change these values,edit them and then click the check boxes under Values to Update. Click on the UpdateSelected button to send these values to the LI-7500 for implementation. Click the Cancel Allbutton to change any edited values in the window back to the state they were in before editing.
The Head Serial Number displays the serial number of the LI-7500 sensor head that isassociated with the coefficients.
When exchanging sensor heads, it is necessary to change calibration coefficients, and to redothe zero and span.
HINT: The easiest way to get the calibration coefficients, zero, and span updated for a sensorhead is to make use of the “Save Configuration” and “Open Configuration” (see File Menustarting on page 3-33).
Changing Sensor Heads
Sensor heads are freely interchangeable between control boxes. However, the control boxmust have the correct calibration coefficients, and current zero and span information, for thesensor head attached to it. This can be done by hand, or "automatically".

Section 3
3-18 Setup and Operation
By Hand1. Attach the new sensor head.2. Connect to the computer and establish communications.3. Enter the calibration coefficients on the Cal Coeffs page.4. Zero and span the IRGA.
AutomaticBefore removing a calibrated analyzer from its control box, use the "Save Configuration As"entry in the File menu to store the configuration information in a file. Then, to move this headto another control box:1. Attach the sensor head to the control box.2. Connect to the computer, and establish communications.3. Go to the File menu and select "Open Configuration".4. Make sure "Calibration", "Cal Coeffs", and "Update LI-7500" are checked in the "Select"
dialog, and click "Continue".

Section 3
Setup and Operation 3-19
Inputs Page - Temperature, Pressure, and Auxiliary Inputs

Section 3
3-20 Setup and Operation
Temperature and pressure values are required by this program for converting CO2 and H2Odensity to mole fraction. In addition, the LI-7500 needs a pressure value to compute CO2 orH2O mole density, and a temperature value to do the band broadening correction for H2O onCO2.
The Inputs window allows you to specify where the temperature and pressure values areobtained; they can be measured with the on-board sensors, via a custom sensor measured atthe Aux Input port, or hand-entered.
For temperature or pressure measured via the auxiliary input, there are two fields that allowyou to enter values for the multiplier (A) and offset (B). Linearized voltage inputs (0-5V) usean equation of the form
Y = AV + B
where Y is the sensor output, V is the voltage output of the sensor, B is the Y-axis intercept(offset), and A is the calibration multiplier, which is the slope of the line representing thesensor's response (Figure 3-3).

Section 3
Setup and Operation 3-21
Y
Slope = A
B
0 VFigure 3-3. Response curve for external pressure or temperature sensors.
Use the temperature and pressure radio buttons to select the method for measuring thesevalues. If you are using the auxiliary input, enter the values for the multipler (A) and offset(B). If you have updated user-entered values, you need to send them to the LI-7500 forimplementation using the Update Selected button. Click on Cancel All to restore any editedvalues in this page to their original state.
Outputs Page - Setting DAC and SDM Outputs
The Outputs page allows you to configure the DAC output channels, as well as configure theinstrument for SDM (Synchronous Device for Measurement) output, for use with CampbellScientific Inc. (Logan, UT) dataloggers.

Section 3
3-22 Setup and Operation

Section 3
Setup and Operation 3-23
DAC ConfigurationEach DAC is configured by specifying the source channel (e.g. CO2 mmol/m3) which willdrive the analog signal, the source channel value which corresponds to zero volts, and thesource channel value which corresponds to full scale voltage (5V).
For example, to configure DAC #1 to output a voltage signal proportional to CO2 mmol/m3,20 mmol/m3 full scale, select CO2 mmol/m3 under DAC1 'Source', and set 0V = 0, and 5V =20.
0V → 0 (Xo, zero volts corresponds to 0 mmol/m3)5V → 20 (XF, full scale corresponds to 20 mmol/m3)
When a voltage range R is selected, the DAC output voltage V resulting from a CO2 molarvalue X is given by
V RX X
X Xo
F o=
−−
where R = 5V.
Delay TimeThe LI-7500 has a fixed throughput delay of 230 milliseconds. This delay can be increased inincrements of 1/152 seconds, to minimize offsets between the LI-7500 and other sensors. Forexample, suppose you are sampling the LI-7500 with a Campbell Scientific CR23X

Section 3
3-24 Setup and Operation
datalogger at 10 Hz. Setting the delay count of the LI-7500 to 11 yields a total delay of .302seconds, which means the LI-7500 data will have a delay of 3 execution intervals (0.302 s/0.1s), which the logger can allow for in synchronizing the data to the sonic anemometer or otheranalog measurements made by the datalogger. Thus, the “unaccounted for” lag will be 0.002seconds. Without this extra delay, the lag time would be .230 seconds, which is 2 executionintervals (0.2 seconds) plus .03 seconds unaccounted for. A 0.03 second offset between thesonic anemometer and the IRGA can significantly reduce the apparent flux in somecircumstances.
NOTE: The delay time applies to all LI-7500 outputs (SDM, DACs, and RS-232).
BandwidthBandwidth (5, 10 or 20 Hz) determines the signal averaging done by the digital filter. Toavoid aliasing (only a concern for co-spectra, not for fluxes), one should sample the LI-7500at a frequency greater than or equal to 2 times the bandwidth. Thus, if you are sampling at 10Hz, set Bandwidth to 5 Hz.
NOTE: Bandwidth applies to all LI-7500 outputs (SDM, DACs, and RS-232).
Bandwidth is the frequency at which the indicated amplitude is 0.707 of the real amplitude(Figure 3-4).

Section 3
Setup and Operation 3-25
Con
cent
ratio
nTime
Actual concentration
Measured concentration
.707
Figure 3-4. Bandwidth = 1/oscillation period.
Bandwidth is a useful indicator for characterizing real-world behavior in which there arefluctuating gas concentrations. Given a sinusoidal oscillation of concentration, theinstrument's ability to measure the full oscillation amplitude diminishes as the oscillationfrequency increases.
SDM AddressSDM communications are enabled in Campbell Scientific dataloggers with the SDM-LI7500instruction (Instruction 189, see the datalogger or the LI-7500 manual published by CampbellScientific). Parameter 3 in the SDM-LI7500 instruction defines what data are sent to the

Section 3
3-26 Setup and Operation
datalogger from the LI-7500. Parameter 3 can take on values between 0 and 5. See Table 3-1for parameter 3 value definitions.
Table 3-1. Parameter 3 value definitions.
Mode Items Sent
0 CO2 mmol/m3
H2O mmol/m3
1 CO2 absorptanceH2O absorptance
2 Pressure (kPa)Temperature (C)Aux channel (user units)Cooler signal (Volts)
3 Diagnostic value (see below)Bandwidth (Hz)Delay interval

Section 3
Setup and Operation 3-27
Mode Items Sent
4 CO2 mmol/m3
H2O mmol/m3
CO2 absorptanceH2O absorptancePressure (kPa)Temperature (C)Aux channel (user units)Cooler signal (Volts)Diagnostic value (see below)Bandwidth (Hz)Delay interval
5 CO2 mmol/m3
H2O mmol/m3
Pressure (kPa)
Section 3
3-28 Setup and Operation
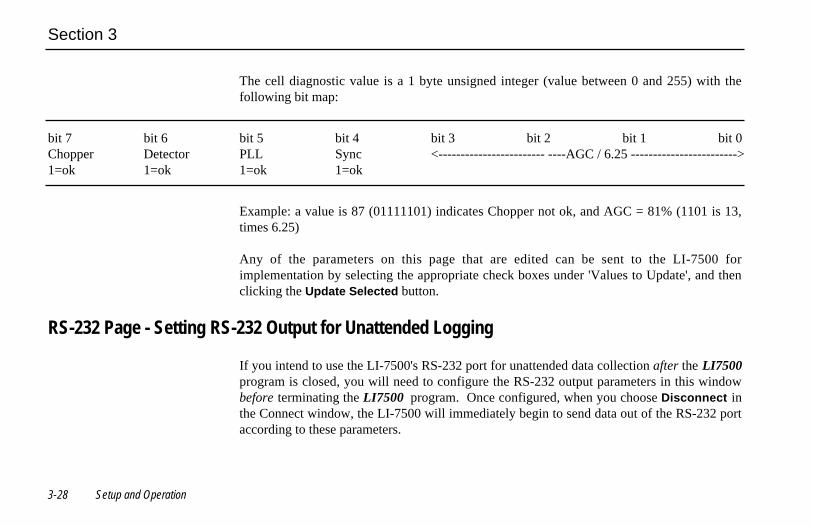
The cell diagnostic value is a 1 byte unsigned integer (value between 0 and 255) with thefollowing bit map:
bit 7 bit 6 bit 5 bit 4 bit 3 bit 2 bit 1 bit 0Chopper Detector PLL Sync <------------------------ ----AGC / 6.25 ------------------------>1=ok 1=ok 1=ok 1=ok
Example: a value is 87 (01111101) indicates Chopper not ok, and AGC = 81% (1101 is 13,times 6.25)
Any of the parameters on this page that are edited can be sent to the LI-7500 forimplementation by selecting the appropriate check boxes under 'Values to Update', and thenclicking the Update Selected button.
RS-232 Page - Setting RS-232 Output for Unattended Logging
If you intend to use the LI-7500's RS-232 port for unattended data collection after the LI7500program is closed, you will need to configure the RS-232 output parameters in this windowbefore terminating the LI7500 program. Once configured, when you choose Disconnect inthe Connect window, the LI-7500 will immediately begin to send data out of the RS-232 portaccording to these parameters.

Section 3
Setup and Operation 3-29
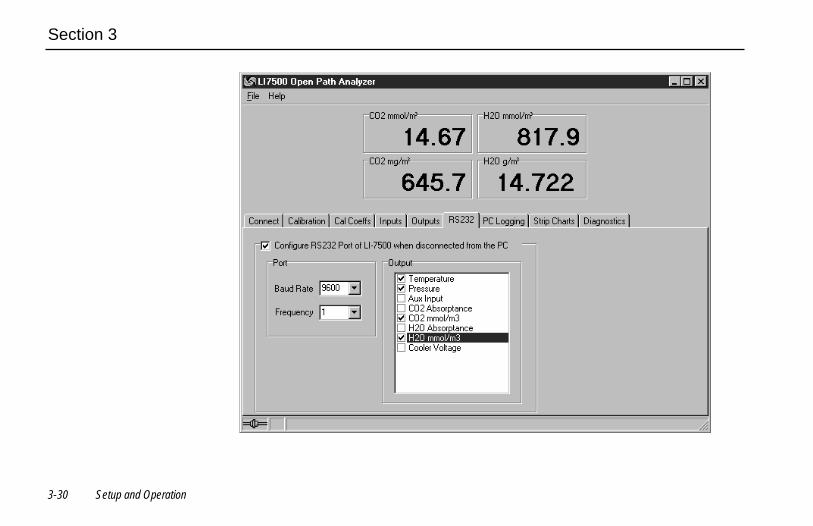
When the 'Configure RS232 Port of LI-7500 when disconnected from the PC' check box isselected, the fields on this page become active. The parameters selected under Output will besent to the RS-232 port at the baud rate and frequency selected.
Use the 'Baud Rate' pull-down menu to select from 9600, 19200, or 38400 baud.
Use the 'Frequency' pull-down menu to select from 0, 1, 2, 3, 5, 10, or 20 Hz. Note that youcan also type a frequency that does not appear in this list; the instrument range checks thevalue, and will force it to be ≥ 0.0 and ≤ 20.0. Note too, that at 9600 baud, the maximumoutput frequency is 5 Hz, if outputting all 8 data items.
Section 3
3-30 Setup and Operation
Section 3
Setup and Operation 3-31
If you do not intend to use unattended RS-232 data output, simply leave the Configure RS232Port of LI-7500 when disconnected from the PC check box unchecked.
The PC Logging page (below) is used to collect data while the LI7500 program is running.
PC Logging Page - Choosing the Values to Log
The PC Logging Page is used to configure the data output parameters used while the LI7500program is active. On this page you specify the destination file, information to appear in thefile header, the type of delimiter to be used between data records, and the values to be logged.

Section 3
3-32 Setup and Operation

Section 3
Setup and Operation 3-33
File HeaderThe file header is output each time the Start button is pressed and can contain a time stamp(derived from the computer's system time), calibration zero and span values, and user-enteredremarks.
DestinationEnter a file name for the output file; the extension .TXT will be added automatically (althoughno extension is required). Click on the Browse button to change drives and/or directories.
DelimiterData can be output using tab- or space-delimited text.
Log ValuesClick on the 'Log Values' check boxes to choose the variables to be output. ‘Relative Time’ isseconds since the Start button was pressed.
Strip Charts Page - Viewing Data Output
The Strip Chart page allows real time graphics display of one or two variables plotted againsttime. The Y-Axes (left and right) display the value chosen in the respective pull-down menusagainst time on the X-Axis. Choose the value in the pull-down menu, and enter values for theY-Axis maximum and minimum. Choose the X-Axis maximum value, and select the secondsor minutes button. The scrolling buttons determine the rate of refresh of the strip chart;

Section 3
3-34 Setup and Operation
smooth scrolling refreshes the chart after each data point is added (after data run off the rightedge of the chart), and coarse scrolling moves the chart approximately 1/2 page at a time.

Section 3
Setup and Operation 3-35
When you have configured the strip chart parameters, press the Start button. The chart willappear at the top of the page. Press Pause to temporarily stop plotting; press Stop to quitplotting. To update any of the strip chart parameters you must first press Stop. After makingchanges, press Start again.
The physical size of the strip chart will follow the window size, so for a bigger chart, enlargeor maximize the program’s window.
TIP: You can rescale both Y axes of an active strip chart “on the fly”. Here’s how:
To change Max and Min together, a fixed amount: right click the mouse button on the chart,hold, and drag up or down.
To change Max and Min differentially: left click the mouse button on the chart, hold, and dragto the top left (increase) or bottom right (decrease).

Section 3
3-36 Setup and Operation
Diagnostics PageThe Diagnostics page allows you to view the current operational state of the LI-7500,including values of CO2 and H2O absorptance, optical bench properties, and the currentanalyzer configuration. See Section 6, Troubleshooting for more information about thediagnostic indicators.
Section 3
Setup and Operation 3-37
‘Current Configuration’ parametersThis window provides an alternative method of viewing (but not setting) the LI-7500configuration status.
Menu Description
File MenuThe File menu contains commands that allow you to open and save existing configurationfiles, and to exit the program.
When you choose Open Configuration, the Open dialog appears (below), where you cansearch for existing LI-7500 configuration files (denoted by a .L75 file extension).

Section 3
3-38 Setup and Operation
After you have selected a configuration file and clicked Open, the Select dialog appears(below).

Section 3
Setup and Operation 3-39
This dialog allows you to select only certain portions of the configuration file to be opened(useful if you don’t want to overwrite some of your present settings in the LI-7500 software).

Section 3
3-40 Setup and Operation
For example, to select only the strip chart portion of a configuration file, check the ‘StripCharts’ box only.
Some of the configuration items pertain to the LI7500 PC program only, while others are partof the LI-7500 instrument configuration. This latter group is:
• Cal Coeffs• Zero and Span• Inputs• Outputs and RS-232
If any of the above items are checked, you can use the “Update LI-7500” check box to havethese items sent to the LI-7500 as well.
NOTE: If you leave “Update LI-7500” unchecked, the selected configuration items willstill show up on the PC program’s windows, from where you can update the LI-7500 ifyou choose.
Example: To view the calibration coefficients found in a configuration file without changingthose currently in use in the instrument, follow these steps:
1. Open the Configuration file.2. Check only the 'Cal Coeffs' check box.3. Clear the “Update LI-7500” check box.

Section 3
Setup and Operation 3-41
4. Click Continue.5. Go to the “Cal Coeffs” tab, and view them.
To “get back” the current calibration coefficients in the instrument, go to the Connect pageand click Disconnect, then reconnect.
Similarly, selecting Save Configuration As opens a dialog where you can save the currentconfiguration file with a different name.
Help MenuAbout displays a screen showing the current version number of the LI7500 software. HelpTopics opens the LI-7500 Help file, where you can select from a list of help topics.
Operational Considerations
DewThe LI-7500 can tolerate droplets on the windows to a certain extent; the AGC value willincrease, but the calibration is unchanged. If the droplets coalesce and get big enough, theAGC will go to 100%, and eventually the readings will become bad. This can be minimizedby sensor orientation, and by coating the windows with a wax such as RainX®.

Section 3
3-42 Setup and Operation
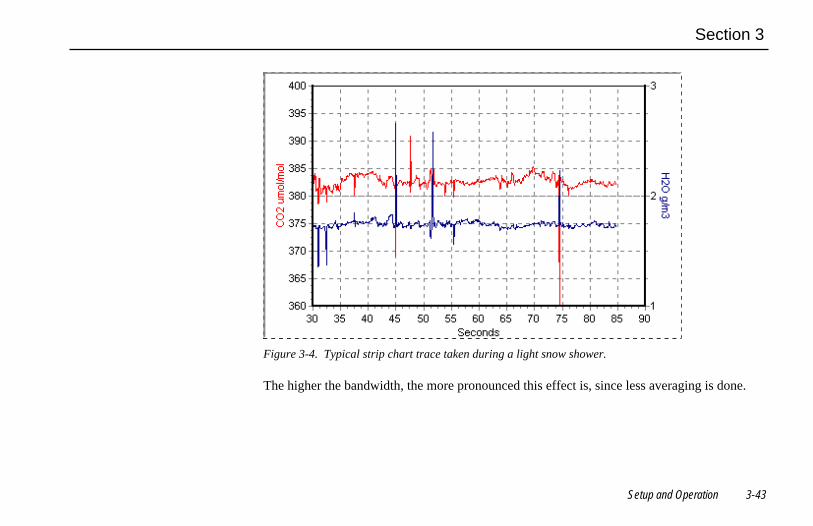
Rain/SnowFlying droplets and flakes in the optical path will affect the performance of the LI-7500, evenif the total light blockage is small enough that the AGC does not reach 100%. The reason isthat the objects are moving, and if a droplet or flake is in the path for a sample measurment,but out of the path for a reference measurement (or vice versa), it will influence the resultingreading. Figure 3-4 illustrates a strip chart trace made during a light snow shower. Theoccasional spikes are due to blockage changes between sample and reference readings.Notice that in some cases both CO2 and H2O are affected, and sometimes just one. Also, thespikes are equally likely to be up or down.
Section 3
Setup and Operation 3-43
Figure 3-4. Typical strip chart trace taken during a light snow shower.
The higher the bandwidth, the more pronounced this effect is, since less averaging is done.

Section 3
3-44 Setup and Operation
Dust and PollenThe LI-7500 is quite tolerant of small particulates on the windows, as long as they are small,and spectrally neutral. Pollen is a problem because it is sticky and can accumulate, so monitorthe AGC values and clean the windows as needed.
VibrationsThe LI-7500 is vibration sensitive to frequencies of 152 Hz ± the bandwidth. Thus, if thebandwidth is 10Hz, the frequency problem range is 142 to 162 Hz (and upper harmonics).The instrument is completely insensitive to vibrations slower than this, and very slightlysensitive at frequencies higher than this.
For land-based installations, probably the most likely source of vibrational problems would beon a tower with tight guy wires. For other settings (aircraft, ships, etc.) where there may bevibrations in the problem range, you should try to minimize the problem through alternativemounting attachments.

Calibration 4-1
Calibration
Introduction
The LI-7500’s measurement accuracy depends upon its calibration. There are two majorcomponents to the calibration: 1) determining the values of calibration coefficients, and 2)setting zero and span. During a factory calibration, both of these steps are performed. Thevalues of the coefficients that are determined should be valid for several years. The zero andspan adjustments are used to bring the LI-7500's actual response into line with its previouslydetermined factory response, at least at two points. It is the user's responsibility to do this stepat regular intervals (weekly or monthly).

Section 4
4-2 Calibration
How Stable are Zero and Span?
The analyzer's zero is primarily affected by temperature, and the state of the internalchemicals. The internal chemicals should be changed annually (see Section 5, Maintenance).The zero's response to temperature is relatively small (typically 0.1 or 0.2 ppm per °C forCO2, or 0.01 mmol/mol/°C for H2O). Also, this drift is measured at the factory, andsubsequently compensated for in software (Equation 2-10), so the effective zero drift shouldbe quite small. Therefore, the zero should be quite stable over a several month period, butyou might want to check it after an extreme temperature change (>30 °C).
The analyzer's span is affected by temperature, pressure, and the state of the internalchemicals. Temperature: A 10 °C change will typically change the H2O span by 1 to 2%.For CO2 at ambient concentrations, the span is very insensitive to temperature, however.Pressure: A large pressure change (40 kPa) will affect the CO2 and H2O spans by <1%, forambient CO2 concentrations (≈ 400 ppm) and high humidities (20 mmol/mol). So, diurnalpressure variations should not be a concern. Chemicals: Reduced internal chemicaleffectiveness will affect the span, but the effect on the zero will be much more pronounced.In summary, span stability is mostly a concern with H2O, when there are large temperaturechanges.

Section 4
Calibration 4-3
Checking the Zero - Considerations
The zero is checked with dry CO2-free air within the optical path of the analyzer. A suitablesource of air for setting the zero can be generated with chemical scrubbers (such as soda limefor removing CO2 and magnesium perchlorate or Drierite® for removing water), or obtainedfrom a cylinder of zero grade gas. When using chemical scrubbers, it is important to makesure that the chemicals are fresh, and that air goes through the chemicals in the right order;soda lime first, desiccant last (if the desiccant is Drierite®, allow time for the CO2 to "washout" of it). When using a cylinder, it is important to make sure that the air in the cylinderreally is CO2-free since a typical cylinder of standard grade nitrogen might have as much as20 ppm of CO2 in it. Compressed cylinders may be at pressures of several thousand poundsper square inch; before using them for calibration, they should be fitted with a regulator toreduce the pressure down to a range of around thirty pounds per square inch.
Checking the Span - Considerations
For checking the CO2 span, use a cylinder of CO2 in air with a concentration that is at thehigher end of the range of concentrations which may be encountered during measurements.For example, a 500 to 1000 PPM cylinder of CO2 in air, which has been verified to beaccurate to within at least 1% would be a suitable choice for many applications. Be cautious,as the stated value of the calibration cylinder may be significantly different from the actualgas concentration.
Section 4
4-4 Calibration
For the water vapor span, a convenient standard to use is a dew point generator such as theLI-COR LI-610. To avoid condensation problems choose a dew point temperature that isabout 3 to 5 °C below the ambient temperature. Also, since water vapor sorbs and desorbsfrom surfaces, allow plenty of time for the reading to stabilize. It is important not to rushthrough the water vapor calibration. If it is more convenient, CO2 and water vapor zero andspan calibrations can be done separately. In general, if reliable calibration standards are notavailable or if there is not enough time to do the job properly, it is better to leave the zero andspan settings alone than to rush through the procedure and make incorrect settings.
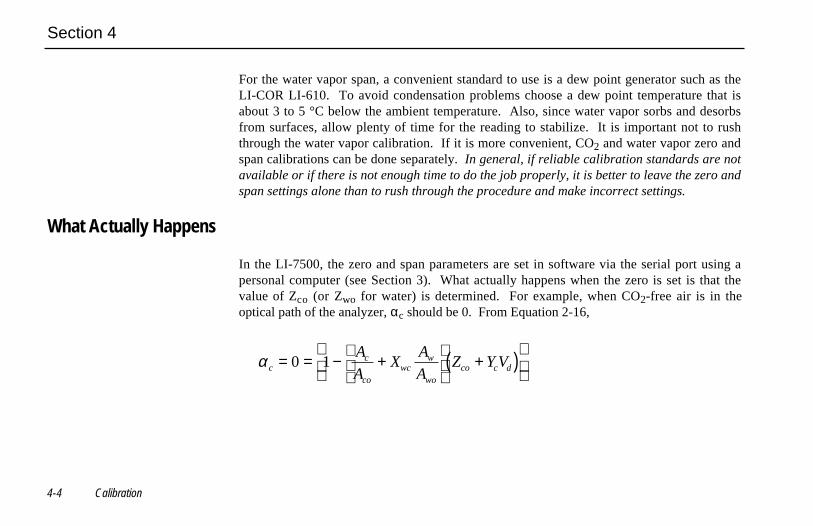
What Actually Happens
In the LI-7500, the zero and span parameters are set in software via the serial port using apersonal computer (see Section 3). What actually happens when the zero is set is that thevalue of Zco (or Zwo for water) is determined. For example, when CO2-free air is in theoptical path of the analyzer, αc should be 0. From Equation 2-16,
α cc
cowc
w
woco c d
A
AX
A
AZ Y V= = − +
+( )
0 1

Section 4
Calibration 4-5
so
Z A
AX
A
A
Y Vcoc
cowc
w
wo
c d=+
−14-1
Similarly,
Z A
AX
A
A
Y Vwow
wocw
c
co
w d=+
−14-2
When the span is set, the value of Sc (or Sw for water) is determined. For example, if there isa known CO2 density ρ'c in the optical path, then from Equation 2-17,
ρ ρ αc c ec c
c
eccP f
PS= =
'

Section 4
4-6 Calibration
so
S
fP
P
c
cc
ecec
c
=
−1 ρ
α
'
4-3
ρc is given by 2-16.
In terms of a known mole fraction m'c, instead of a known density,
S
fm P
P RTP
c
c
ecec
c
=
−1 '
α4-4
If the CO2 concentration is dry, then Pec = P, so
S fm
RT
Pc c
c
c
=
−1 'α
4-5
Section 4
Calibration 4-7
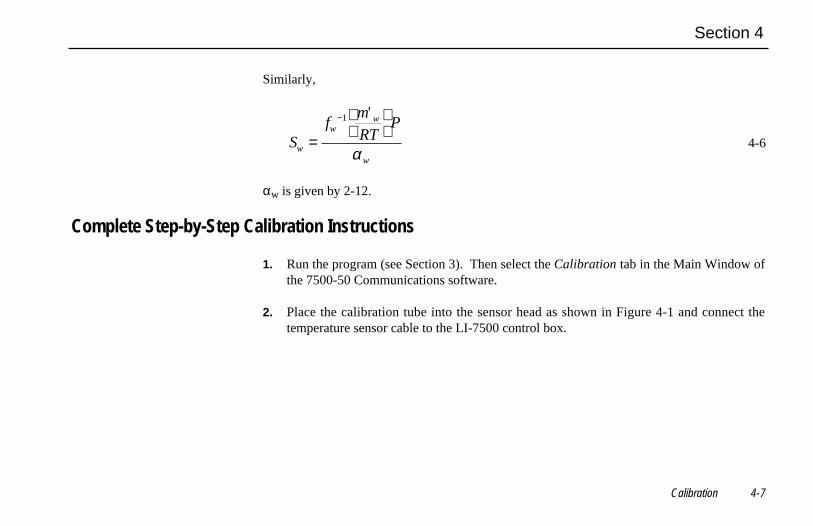
Similarly,
Sf
m
RTP
w
ww
w
=
−1 '
α4-6
αw is given by 2-12.
Complete Step-by-Step Calibration Instructions
1. Run the program (see Section 3). Then select the Calibration tab in the Main Window ofthe 7500-50 Communications software.
2. Place the calibration tube into the sensor head as shown in Figure 4-1 and connect thetemperature sensor cable to the LI-7500 control box.

Section 4
4-8 Calibration
Calibration Tube(insert this end first)
Air In
Air Out
Pressure(optional)
Thermistor
Figure 4-1. Flow calibration gas at the Air In port shown.

Section 4
Calibration 4-9
Insert the top of the fixture first, and slide the bottom into place. It is very important thatthe fixture is centered between the windows covering the source and detector modules. Itcan be helpful to click on the Diagnostics tab in the 7500-50 software, and view the AGCvalue while centering the fixture; if the AGC value increases when the fixture is in place,it indicates that one or both of the windows are partially or totally obscured. Move thefixture back and forth until the AGC value reads the same value as before the fixture wasinserted. The fixture is very easy to center; if it looks centered, it probably is.
NOTE: The three ports are entirely interchangeable.
3. Click on the Calibration tab, and verify that temperature and pressure are working OK.(If you are using an alternate source for temperature and pressure, click on the Inputs taband set that up).
IMPORTANT NOTE: Always zero the instrument before spanning (don’t span,then zero).
4. Flow CO2-free air through the calibration fixture at a rate of about 0.5 to 1.0 LPM.Attach the zero gas to the calibration fixture at one of the ports shown in Figure 4-1.
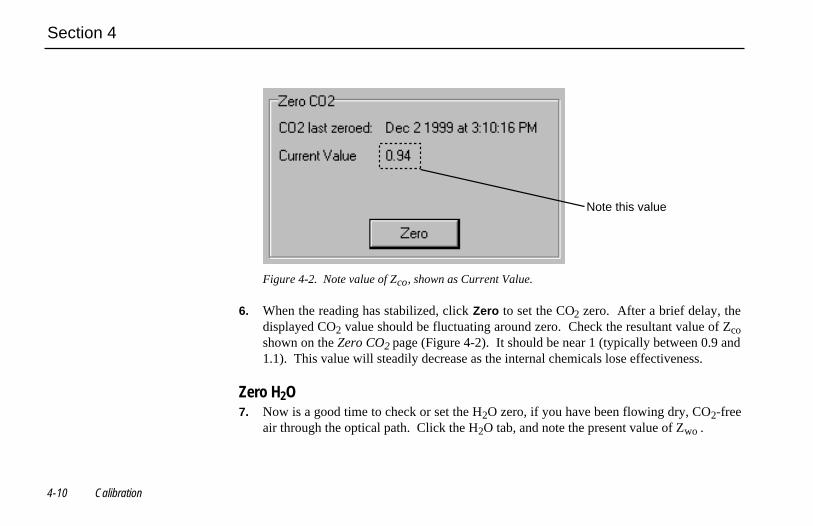
Zero CO25. Observe the CO2 concentration and wait for it to stabilize (typically 1 minute). Also,
note the present value of Zco (Figure 4-2).
Section 4
4-10 Calibration
Note this value
Figure 4-2. Note value of Zco, shown as Current Value.
6. When the reading has stabilized, click Zero to set the CO2 zero. After a brief delay, thedisplayed CO2 value should be fluctuating around zero. Check the resultant value of Zcoshown on the Zero CO2 page (Figure 4-2). It should be near 1 (typically between 0.9 and1.1). This value will steadily decrease as the internal chemicals lose effectiveness.
Zero H2O7. Now is a good time to check or set the H2O zero, if you have been flowing dry, CO2-free
air through the optical path. Click the H2O tab, and note the present value of Zwo .

Section 4
Calibration 4-11
8. Wait for the H2O reading to stabilize (3 or 4 minutes).
9. Click Zero. Note the new value of Zwo (typically between 0.9 and 1.1).
Span CO210. Flow a CO2 span gas through the calibration tube at 0.5 to 1 liter/minute.
11. Click on the CO2 Cal tab. Enter the mole fraction in the target entry.
12. When stable (1-2 minutes) click Span. Check the value of Sc (typically 0.9-1.1).
Span H2O13. To set the H2O span, flow air of known dew point through the calibration tube at about
0.5 to 1.0 LPM. To avoid condensation, use a dew point temperature several degreesbelow the ambient temperature.
14. Click the H2O tab, and note the present value of Sw. Enter the span gas dew pointtemperature in the target entry.
15. Observe the H2O dew point and wait for it to stabilize. This may take up to 15 or 20minutes.
16. When the reading has stabilized, click Span. Note the value of Sw (typically 0.9-1.1).

Maintenance 5-1
Maintenance
Cleaning the Optical Path
The LI-7500 optical windows should be cleaned when necessary (when the AGC valueapproaches 100%). If the windows become dirty it may become difficult to calibrate theanalyzer. Excessive zero drift may also be observed if the optical path becomes obstructed.
The windows are sapphire, and are extremely durable and resistant to scratches; clean thewindows with any mild detergent or glass cleaner. Also, coating the windows with a waterresistant windshield type coating (such as Rain-X®) or a high quality automobile type waxmay help prevent droplets from remaining on the windows during rainstorms.

Section 5
5-2 Maintenance
Changing the Fuse
The LI-7500 power supply is protected by a 5A 250V, 5 × 20 mm fast-blow type fuse locatedon the main circuit board inside the control unit case (Figure 5-1). If the battery or otherpower source fails to power the LI-7500, check to see if the fuse has blown.
Fuse5A Fast-blow
Power LED
Reset Button
Figure 5-1. LI-7500 fuse location.

Section 5
Maintenance 5-3
To check the fuse, power the unit off, disconnect the power to the unit, and open the case ofthe LI-7500 control unit. The fuse is located on the main circuit board, in the lower lefthandcorner, as shown in Figure 5-1. Replacement fuses (part #439-04214, in the spares kit) pluginto the fuse holder; no soldering is required. Replace the fuse and close the LI-7500 case.
Replacing the Internal Chemicals
There are two small plastic bottles, each containing soda lime and magnesium perchlorate,inserted into the analyzer housing that keep the detectors free of CO2 and water vapor. Thesebottles should be recharged with fresh chemicals on an annual basis. See Appendix C,Suppliers, for a list of suppliers of soda lime and magnesium perchlorate.
NOTE: Calibration shifts will occur if CO2 or H2O are not kept out of the analyzerhousing.
■ To change the sensor head soda lime/desiccant bottles:
1. The plastic bottles are located in the analyzer housing in the sensor head. They areaccessed by removing the mounting bracket from the analyzer housing (Figure 5-2).Remove the two screws on the bottom of the mount; be careful not to lose the spacers andwashers.

Section 5
5-4 Maintenance
Mounting Bracket
Removethese 2screws
Washer
Washer
Spacers
Figure 5-2. Remove the 2 screws on the base of the mounting bracket.

Section 5
Maintenance 5-5
Filter Paper
Mg(ClO4)2
Soda Lime
Figure 5-3. Fill the bottles with soda lime,followed by magnesium perchlorate.
2. Before removing the bottles, prepare the new bottles (in spares kit) by filling themwith equal parts soda lime and magnesium perchlorate (Figure 5-3). Fill the bottleshalf full with soda lime first, followed by the magnesium perchlorate. Place a filterpaper disk in the lid to keep the chemicals from spilling into the detector housing.
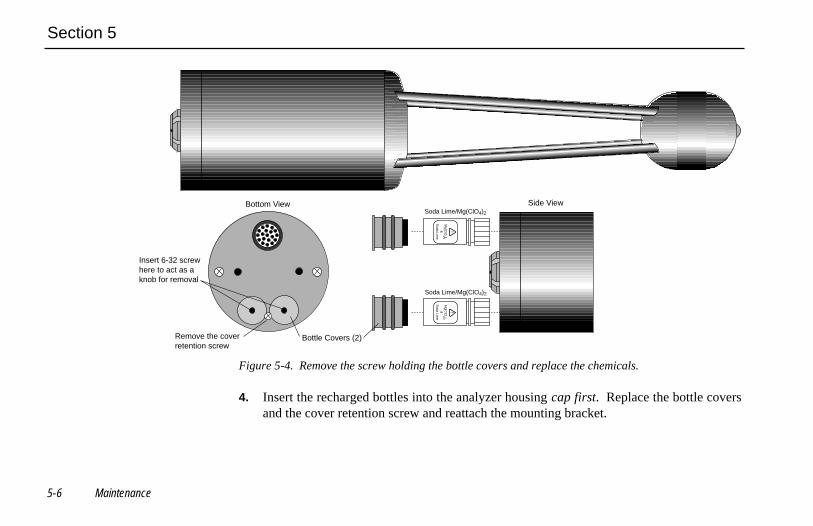
3. There are two bottle covers, each with an O-ring seal, at the base of the sensor head(Figure 5-4). Remove the cover retention screw. Thread a 6/32" screw (there is one2 inches long in the spares kit) into each cover and pull straight out.
Section 5
5-6 Maintenance
Mg[C
lO4 ]2
&S
oda Lime
!M
g[ClO
4 ]2&
Soda Lim
e
!
Bottle Covers (2)
Soda Lime/Mg(ClO4)2
Soda Lime/Mg(ClO4)2
Remove the coverretention screw
Insert 6-32 screwhere to act as aknob for removal
Bottom View Side View
Figure 5-4. Remove the screw holding the bottle covers and replace the chemicals.
4. Insert the recharged bottles into the analyzer housing cap first. Replace the bottle coversand the cover retention screw and reattach the mounting bracket.

Section 5
Maintenance 5-7
5. After installing, allow at least 4 hours (preferably with the instrument powered on) toscrub the housing. This should be followed by setting the CO2 and H2O zeros. Checkthe zero again, if possible, after one or two days.

Troubleshooting 6-1
Troubleshooting
Power On Problems
The instrument requires between 10 and 30 VDC, at 2 Amps, to operate (a LI-COR LI-6020battery charger, for example, will not by itself power the LI-7500). When adequate power isfirst applied to the instrument, the LED in the box near the fuse (Fig 5-1) will light up forabout 5 seconds, then (if operating correctly) go off and remain off. If any of the diagnosticslisted below become true during the operation of the instrument, then the LED will come backon.
LED does not light at power onThis can be due to a blown fuse, or inadequate power supply, or faulty wiring (make sure theblack wire on the power cable goes to ground, and the red wire to power).

Section 6
6-2 Troubleshooting
PC Connection Problems
When the Connect button in the LI7500 Windows program is pressed, the program sets abreak condition on the communication line, signaling the LI-7500 to change to 9600 baud andsend its current configuration. The PC then sends the desired configuration (update rate, baudrate, etc.) back to the LI-7500. Both units then change to the desired baud rate, and operationsbegin. When the Disconnect button is pressed, the PC signals to LI-7500 to change its RS-232 configuration back to what it was originally (or to that set up in the RS-232 panel).
"Port in use or does not exist" when connectingThis message indicates that the COM port setting on the Connect page is either incorrect, orelse that COM port is already in use by some other program running on the PC. If you are surethat the COM port is correct, and there is nothing else running, try rebooting.
"Not able to connect to the LI-7500 successfully" when connectingPress Connect again. Sometimes it takes a couple of attempts. If repeated attempts fail, thenmake sure the COM port is in fact the one into which you are connected. Review Figure 3-1,and make sure you are connected according to one of the methods indicated there. Make surethe LI-7500 is in fact powered and running (press the Reset button (Fig. 5-1) and see if theLED lights for about 5 seconds).

Section 6
Troubleshooting 6-3
Bad Temperature or Pressure Readings
The source of the values of temperature and pressure displayed on the Calibration page aredetermined by the setting on the Inputs page. If the source is "Measured", the readings comefrom the LI-7500's on-board sensors (or the thermistor on the calibration tube, if that isconnected). If the source is "Aux Input", then the temperature or pressure (but not both) arecoming from an external sensor that you have wired and connected. This signal is modifiedaccording to the Auxiliary Coefficients that appear on that same page. If the source is "User-Entered", then whatever you enter in the text boxes is used for the value.
Temperature is Measured, and reads -65 (or so)The thermistor is broken, or disconnected. Check the 6 pin connector on right of the board tomake sure it is plugged in, and to make sure the thermistor wires are both attached to theconnector at pins 4 and 5.
Pressure is Measured, and doesn't match my barometerThe pressure sensor in the LI-7500 is good to about 1%. For operating purposes, it doesn'tneed to be very good (See "Note on Temperature and Pressure" on page 2-9). When settingthe span of the LI-7500, however, it is important. If you know the pressure better than theLI-7500 does, then use the "User-Entered" option and enter it.

Section 6
6-4 Troubleshooting
Bad CO2 or H2O Readings
Section 2 details what the LI-7500 measures, and how it computes. Most of the relevantparameters are available for viewing with the LI7500 program, such as calibrationcoefficients, absorptances, and zero and span values. The first thing to check when trackingdown bad readings is to make sure all of the coefficients on the "Cal Coeffs" page match thoseon the calibration sheet for the head in use. The Band Broadening coefficient should be 1.15.After that, go to the "Diagnostics" page and check the values of AGC, and also the CO2 andH2O absorptances. Are any of the diagnostics flags (PLL, etc.) set? Finally, go to the"Calibration" page and make sure the temperature and pressure make sense, and that thecurrent values of zero and span are near 1.
Absorptances make sense, densities don'tIf the absorptance value displayed on the Diagnostics page seem correct (rough rule of thumb:absorptance = 0 when density = 0, CO2 absorptance is about 0.1 with a mole fraction of about400 ppm, and H2O absorptance is about 0.1 with a mole fraction of about 20 mmol/mol), butif the displayed values of density or mole fraction are obviously bad, then the problem is inone of the following: calibration coefficients, span parameter, pressure value, and the bandbroadening value (CO2 only).
Readings very noisyPut the calibration tube in place, just to dampen natural fluctuations. You don't necessarilyneed to have anything flowing through the tube. The noise in absorptance values

Section 6
Troubleshooting 6-5
("Diagnostics" page, below) should be stable, with only the 4th decimal place changing oncein a while. If density or mole fraction is still noisy, watch the temperature and pressure valuesto see if they are the source of the noise (or change to a hand entered, constant value to trythis). Check the calibration coefficients and band broadening value (if the problem is withCO2) to make sure they are correct.
Diagnostic Messages
The Diagnostics page allows you to view the current operational state of the LI-7500,including values of CO2 and H2O absorptance, optical bench properties, and the currentanalyzer configuration.
Section 6
6-6 Troubleshooting
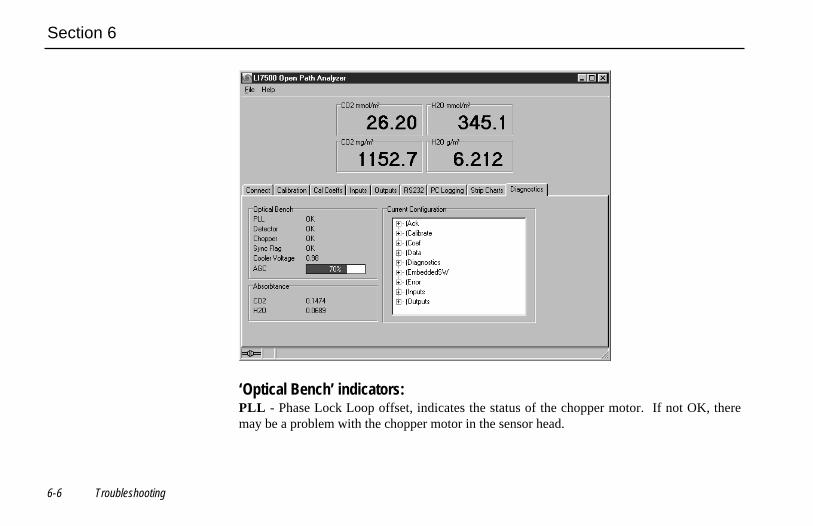
‘Optical Bench’ indicators:PLL - Phase Lock Loop offset, indicates the status of the chopper motor. If not OK, theremay be a problem with the chopper motor in the sensor head.

Section 6
Troubleshooting 6-7
Detector - If not OK, indicates the detector cooler is not maintaining the proper temperature:this will happen at temperatures above 50 °C. Note that this does not always indicate aserious problem; the cooler may simply have not yet reached the target temperature duringinstrument startup, or it may be out of range due to external environmental conditions.Readings may still be OK. Check cables and wiring.
Chopper - If not OK, indicates the chopper temperature controller is out of range, hot or cold.As with the Detector indicator above, this may or may not indicate a serious problem. Thechopper should be able to temperature control when ambient is between +50 and -25 °C.
Sync Flag - If not OK, indicates that the LI-7500 embedded software and the digital signalprocessor (DSP) receiving the signal from the chopper motor in the sensor head are out ofsync. Check cabling.
Absorptance values - CO2: computed according to Equation 2-16.H2O: computed according to Equation 2-12.
Cooler Voltage - Displays voltage of detector cooler. If this value gets below 0.05, you maybe too cold; the detector may not be temperature controlling. This will typically be at -30 °Cor below.
AGC - Note this value when you first operate the LI-7500. Typical values are 50-60%. Asdirt accumulates on the sensor head windows the value of AGC will increase, so you can usethis value to indicate when it is necessary to clean the windows.

Section 6
6-8 Troubleshooting
LI7500 Error Messages
The following error messages may be encountered in the LI7500 Communications Softwareprogram.
Error Message Description
The file was opened but could not be sent to the LI-7500. An error occurred when transmitting the file to the LI-7500.Not being connected is the most probable cause.
Please enter a positive floating point value. None
Please enter a faster baud rate. The baud rate selected is not fast enough to keep up with thedata acquisition frequency.
Not able to connect to the LI-7500 successfully. Initial data exchange did not occur successfully. Check tosee if connections are secure.
The port you have selected, COMx, is either in use or does notexist.
The communications port is busy with another piece ofhardware or does not exist on the system.
Please enter a positive integer. None
Make sure you have at least 1 log value and have specified afilename.
In order to log data on the PC you must have a file name andhave at least one value checked in the "Log Values" list box.

Section 6
Troubleshooting 6-9
Error Message Description
A confirmation for your last action was not received. Resultsare questionable.
Each action or update sent to the LI-7500 requires anacknowledgement. One was not received for your lastaction. It is unknown if the action was successful or not.
An error occurred on the LI-7500. Internal Error.
The configuration sent from the LI-7500 contained errors. The configuration sent from the LI-7500 did not parsecorrectly. Attempt to reconnect.
Enter a valid DAC Source. Select a DAC source from the list
Error found in configuration file! The file could not be opened. The data in the configuration file is corrupt.
Auxiliary Input can only be selected for Temperature orPressure.
The auxiliary input can only be selected for one item.
Select a valid Log Value for the left Y-axis. Choose a value from the list to plot.
Select a valid Log Value for the right Y-axis. Choose a value from the list to plot.
Please enter a floating-point number. None

Appendix A A-1
Specifications*
Type: Absolute, open-path, non-dispersive infrared gas analyzer.Detector: Thermo-electrically cooled lead selenide.Bandwidth: 5, 10, or 20 Hz, software selectable.Path Length: 12.5 cm (4.72").Operating Temperature Range: -25 to 50°C.User Interface: Windows® based software supports all setup, configuration and calibration functions through the RS-232 serialport.Outputs: RS-232 (20 Hz Maximum)
SDM (>40Hz)2 user scalable 16 bit DACs updated at 300 Hz.
Auxiliary Inputs: 2 channels for temperature and pressure sensors (during calibration).Auxiliary Input with pressure sensor: 0-4.096V (±5V common mode rejection).
Power Requirements: 10.5 to 30 volts DC.Power Consumption: 30 W during warm-up, 10 W in steady state.Dimensions:

Appendix A
A-2 Appendix A
Head: Dia 6.5 cm, Length 30 cm. Designed for minimal wind flow disturbance. Control Box: 35 cm × 30 cm × 15 cm (external dimensions). IRGA cable: 3 meters (between sensor head and electronics control box). Power, Serial, DAC, Auxiliary Input and SDM cables: 4 metersWeight: Head: 0.75 kg (1.65 lb.)
Control Box and Cables: 4.8 kg (10.5 lb.)
* Specifications subject to change without notice.

Appendix B B-1
Pin Assignments
Gro
und
- (B
LK)
RT
S -
(R
ED
)
TX
D -
(B
LU)
CT
S -
(G
RY
)
DT
R (
WH
T)
Gro
und
(GR
N)
Gro
und
(RE
D/B
LK)
+10
-30V
DC
(R
ED
/WH
T)
RX
D -
(B
RN
)
Power1 3
SD
M G
roun
d (B
LK)
SD
M E
nabl
e (B
RN
)
SD
M C
lock
(B
LU)
SD
M D
ata
(GR
Y)
Ear
th G
roun
d (W
HT
)
SDM InterfaceSerial Interface 1 5
Gro
und
(BLK
)
DA
C 1
(B
RN
)
DA
C 2
(B
LU)
Rea
dy O
ut (
GR
Y)
Ear
th G
roun
d (W
HT
)
DAC Outputs1 5
Gro
und
(BLK
)
Diff
In -
(B
RN
)
Diff
In +
(R
ED
)
The
rmis
tor
2.5V
(B
LU)
The
rmis
tor
In (
GR
Y)
Ear
th G
roun
d (W
HT
)
Auxiliary Inputs1 61 6
The sensor head is connected to two terminal strips at the upper righthand corner of the main circuit board, underneath theprotective cover. Under normal circumstances you will not need to alter any of the sensor head connections. If, however, any ofthe wires should pull loose, refer to the diagram below for proper wiring connections. The protective cover can be removed byunscrewing the four screws at the corners of the cover.

Appendix B
B-2 Appendix B
Green/White & Orange
Yellow & Blue/White
Yellow/White & Orange/White
Gray/White & Violet/WhiteSen
sor
Hea
d
1
4
Black/White
Brown/White
Gray
Black
White
Brown
Blue
Green
Violet
Red/White
Red
Shield
Sen
sor
Hea
d
1
12

Appendix C C-1
Suppliers
The company names, addresses, and phone numbers are the most current we have at the time of this printing. In some cases theinformation may change without notice.
Soda Lime (6-12 mesh) and Magnesium Perchlorate (Anhydrous) Mg(ClO4)2
GFS ChemicalsP.O. Box 245Powell, OH 43065Phone: 614-881-5501FAX: 614-881-5989Toll free: 800-858-9682
Soda Lime: Part #66352
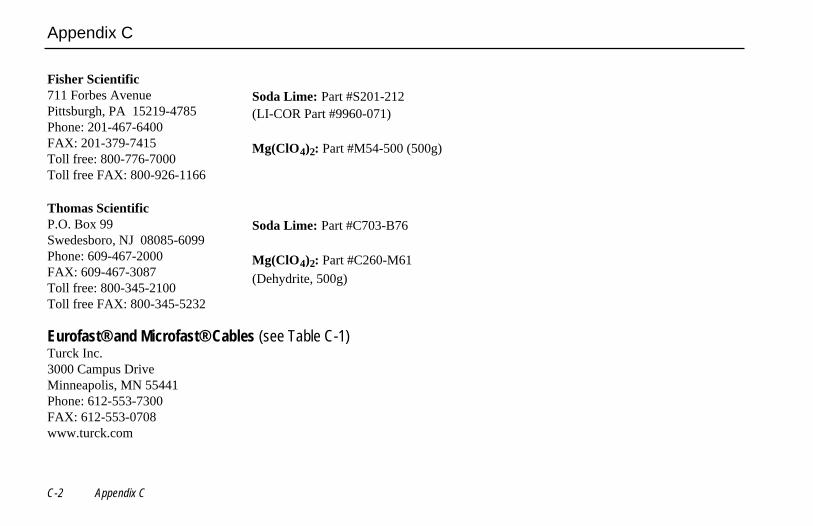
Appendix C
C-2 Appendix C
Fisher Scientific711 Forbes AvenuePittsburgh, PA 15219-4785Phone: 201-467-6400FAX: 201-379-7415Toll free: 800-776-7000Toll free FAX: 800-926-1166
Soda Lime: Part #S201-212(LI-COR Part #9960-071)
Mg(ClO4)2: Part #M54-500 (500g)
Thomas ScientificP.O. Box 99Swedesboro, NJ 08085-6099Phone: 609-467-2000FAX: 609-467-3087Toll free: 800-345-2100Toll free FAX: 800-345-5232
Soda Lime: Part #C703-B76
Mg(ClO4)2: Part #C260-M61
(Dehydrite, 500g)
Eurofast® and Microfast® Cables (see Table C-1)Turck Inc.3000 Campus DriveMinneapolis, MN 55441Phone: 612-553-7300FAX: 612-553-0708www.turck.com

Appendix C
Appendix C C-3
Table C-1. Eurofast® and Microfast® cables used to connect to the LI-7500.
LI-COR Part Number LI-7500 Control BoxConnector
Cable ConnectorType
Turck Part Number
392-05618 SDM Interface 5-pin female RK 4.5T-*/S90
392-05619 Power 3-pin female KB 3T-*/S90
392-05620 Serial Interface 6-pin female RKC 6T-*/S90
392-05621 Auxiliary Inputs 6-pin male RSC 6T-*/S90
392-05622 DAC Outputs 5-pin male RS 4.5T-*/S90
* = cable length; 2, 4, or 6 meters. Other lengths available by request from Turck Inc.

Appendix D D-1
Configuration Grammar
Introduction
This section describes the protocol used by the LI-7500 to communicate via RS-232, for bothconfiguration and data output purposes. Commands sent to the LI-7500 have a certainstructure that must be followed, and data sent by the LI-7500 comes packaged in a particularway. For example, to set the Bandwidth to 10Hz, the following string
(Outputs(BW 10))
should be sent followed by a line feed character (decimal 10). Each command begins with aleft paranthesis ‘(‘, and ends with a right paranthesis ‘)’. Some commands, such as(BW...) contain a single value, while other commands, such as (Outputs...), can containone or more commands. The parentheses mark the start and stop of the command, and extra

Appendix D
D-2 Appendix D
characters before or after are ignored, as well as white space (spaces and tabs) before or afterthe parantheses. This string would work equally as well, for example:
This is ignored ( Outputs (BW 10 )) and so is this
The LI-7500 does not try parsing a command string until a line feed is received. Since "extra"characters are ignored, commands can be terminated with carriage return and line feedsequally as well.
Another example of a command string is
(Outputs(RS232(Freq 10)(Pres TRUE))(BW 5))
In this case, we are setting the RS-232 output frequency to 10Hz, requesting that Pressure beincluded in the output records, and that the bandwidth be 5 Hz. Notice the 2 parentheses at theend of (Pres TRUE)). This is because (Pres..) and (Freq..) are (RS232..) commands,while (BW..) is not. (BW..) and (RS232..) are both (Outputs..) commands, however, andthe “extra” paranthesis at the end of (BW 5)) signals the end of the (Outputs..) command.
An illegal command string would be
(BW 5)

Appendix D
Appendix D D-3
because the (BW...) command is only recognized within the context of an (Outputs...)command.
The LI-7500 configuration grammar is case sensitive. That is, (Outputs(BW 10)) will work,while (outputs(bw 10)) will not.
Who Sends What
Not all of the commands in the LI-7500’s grammar are really commands. Some are designedto be used by the LI-7500 to package outgoing data. The (Data..) command, or record,might look like this
(Data (CO2D 2.2083146e1)(H2OD 3.5485935e2)(Temp 2.5886261e1)(Pres
9.8157062e1))
This record is showing the latest values of CO2 and H2O mole density (mmol m-3),temperature (°C), and pressure (kPa). The fields present in a (Data..) record, and how oftenthey are output, is determined by the (Outputs..) command.
Once it has established communications with a host computer (discussed in the next section),the LI-7500’s RS-232 communications is largely made of up of outgoing (Data..) and(Diagnostics..) records. The only other type of records it might send are (Error..) and(Ack..). The (Error..) record is sent whenever the LI-7500 receives a command it cannot

Appendix D
D-4 Appendix D
parse or recognize, and the (Ack..) record acknowledges a configuration change. It is alsoused to pass back the new zero or span setting after a (Calibrate..) command.
Command Summary
In the following sections, some abbreviations are used:
{int} means an integer value, such as 0, 10, 452, etc.{float} means any integer or floating point value, such as 0, 3.14159, 1E-7, -3.47e-09, etc.{string} means anything (< 40 characters) contained by double quotes, such as "Hey, you!"{ item1 | item2 | item3 } means you must include one of the items in the list.{bool} - { TRUE | FALSE }

Appendix D
Appendix D D-5
The (Outputs..) Command
(Outputs..) is used to configure the items pertaining to data output, including thebandwidth, delay time, DACs (digital to analog convertors), and the RS-232 port. The actualRS-232 output uses the (Data..) record described in Table 2.
Table 1: The Outputs Command
Command Subcommands Remarks
(BW {5 | 10 | 20}) Sets instrument bandwidth to 5, 10, or 20 Hz.
(Delay {int}) Output delay interval (0 to 32), where eachinterval is 1/152 seconds. This is added to the230 ms system delay.
(Outputs (Source {Lista}) ) The variable that drives the DACs (digital toanalog converters)
(Dac1(Dac2
(Zero {float}) ) Value that corresponds to 0 Volts output
(Full {float}) Value that corresponds to 5 Volts output(SDM (Address {int}) ) SDM address (0 thru 14).

Appendix D
D-6 Appendix D
Command Subcommands Remarks
(Baud {9600 | 19200 | 38400 })
Baud rate for RS-232
(Freq {float}) Output frequency of (Data..) records in Hz.Usable values: 0.0 thru 20.0
(Pres {bool})
(Temp{bool}) ) )(Outputs (RS232 (Aux {bool})
(CO2Raw {bool}) These commands determine what is includedin the (Data output record
(CO2D {bool})
(H2ORaw {bool})
(H2OD {bool})
(Cooler {bool})
a. One of { CO2A | CO2MMOL | H2OA | H2OMMOL | TEMPERATURE | PRESSURE | AUX | NONE}
Examples:1. To set the LI-7500 to output only CO2 and H2O molar densities once every 2 seconds:

Appendix D
Appendix D D-7
(Outputs(RS232(Freq .5)(Pres FALSE)(Temp FALSE)(Aux FALSE)(CO2Raw
FALSE)(CO2D TRUE)(H2ORaw FALSE)(H2OD TRUE)(Cooler FALSE)))
2. To configure DAC #1 to output CO2 mole density with this scaling: 0V = 12 mmol m-3,and 5V = 15 mmol m-3.
(Outputs(Dac1(Source CO2MMOL)(Zero 12)(Full 15)))
Data and Status Records
The (Data..) and (Diagnostics..) records are the vehicles with which the LI-7500 outputsdata through its RS-232 port. The frequency with which it outputs (Data..) records is deter-mined by the (Outputs(RS232(Freq..))) command, shown in Table 1.

Appendix D
D-8 Appendix D
Table 2: Data and Diagnostics Records
Record Subcommands Remarks
(Ndx {int}) Index value. Always present. Increments every 6.5 ms (1/152). Resets to 0 whenever the configuration changes, or(with no changes) about every 163 days.
(Temp {float}) Temperature, °C
(Press {float}) Pressure, kPa(Data (Aux {float}) ) Auxiliary input value
(CO2Raw {float}) CO2 absorptance
(CO2D {float}) CO2 density (mmol†m-3) Which values are included areset by (Outputs(RS232..)).How often this is output isdetermined by(Outputs(Freq..)).
(H2ORaw {float}) H2O absorptance
(H2OD {float}) H2O density (mmol m-3)
(Cooler {float}) Detector cooler (Volts)

Appendix D
Appendix D D-9
Record Subcommands Remarks
(PLL {bool}) Phase lock loop status
(DetOK {bool}) Detector temperature con-trol
(Diagnostics (Chopper {bool}) ) Chopper temperature con-trol
Diagnostics are always outputat 1 Hz
(Path {float}) The AGC value in %(0-100)
(Ack(Received TRUE) Sent by the LI-7500 to aknowledge any incoming command.
(Val {float}) ) Only sent after zeroing and spanning commands. Containsthe new, computed value of zero or span.
(Error (Received TRUE)) Sent by the LI-7500 when it cannot parse or recognize acommand.
(EmbeddedSW(Version {quotedstring}) Output by the LI-7500 during synchronization.
(Model {quotedstring})
)
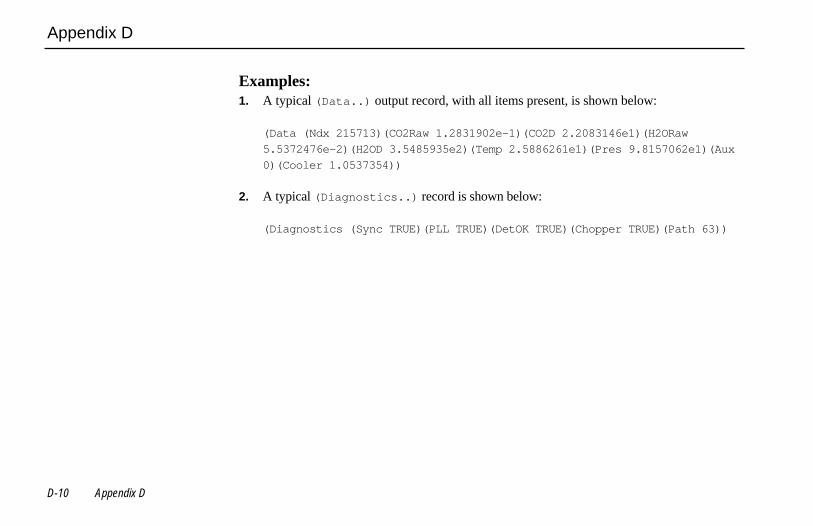
Appendix D
D-10 Appendix D
Examples:1. A typical (Data..) output record, with all items present, is shown below:
(Data (Ndx 215713)(CO2Raw 1.2831902e-1)(CO2D 2.2083146e1)(H2ORaw
5.5372476e-2)(H2OD 3.5485935e2)(Temp 2.5886261e1)(Pres 9.8157062e1)(Aux
0)(Cooler 1.0537354))
2. A typical (Diagnostics..) record is shown below:
(Diagnostics (Sync TRUE)(PLL TRUE)(DetOK TRUE)(Chopper TRUE)(Path 63))
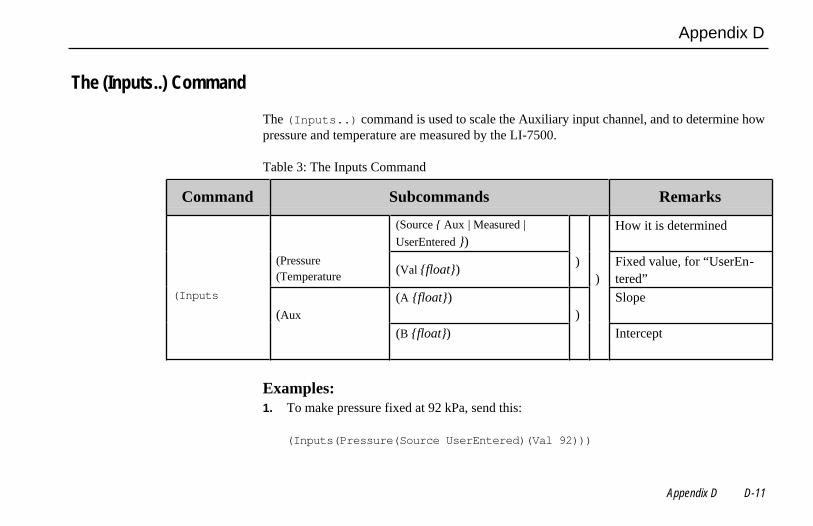
Appendix D
Appendix D D-11
The (Inputs..) Command
The (Inputs..) command is used to scale the Auxiliary input channel, and to determine howpressure and temperature are measured by the LI-7500.
Table 3: The Inputs Command
Command Subcommands Remarks
(Source { Aux | Measured |
UserEntered })How it is determined
(Pressure(Temperature (Val {float})
))
Fixed value, for “UserEn-tered”
(Inputs
(Aux
(A {float}))
Slope
(B {float}) Intercept
Examples:1. To make pressure fixed at 92 kPa, send this:
(Inputs(Pressure(Source UserEntered)(Val 92)))

Appendix D
D-12 Appendix D
2. To measure temperature from a linearized thermistor connected to the Auxiliary input,where 0 volts is 0°C, and 5 volts is 50°C, send this:
(Inputs(Aux(A 10)(B 0))(Temperature(Source Aux)))
3. To measure pressure and temperature normally, using the built-in sensors, send this:
(Inputs(Pressure(Source Measured))(Temperature(Source Measured)))
The (Calibrate..) and (Coeffs..) Commands
The (Calibrate..) and (Coeffs..) commands control zeroing, spanning, and factorycalibration coefficients.
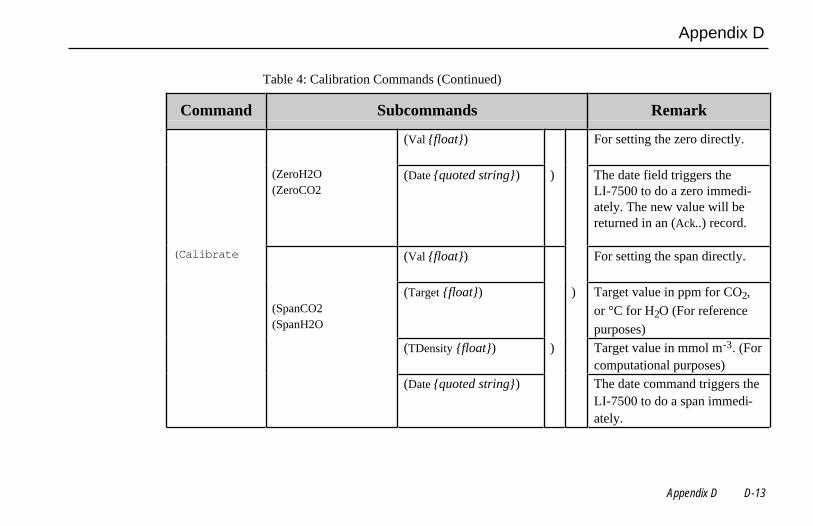
Appendix D
Appendix D D-13
Table 4: Calibration Commands (Continued)
Command Subcommands Remark
(Val {float}) For setting the zero directly.
(ZeroH2O(ZeroCO2
(Date {quoted string}) ) The date field triggers theLI-7500 to do a zero immedi-ately. The new value will bereturned in an (Ack..) record.
(Calibrate (Val {float}) For setting the span directly.
(SpanCO2(SpanH2O
(Target {float}) ) Target value in ppm for CO2,
or °C for H2O (For reference
purposes)
(TDensity {float}) ) Target value in mmol m-3. (Forcomputational purposes)
(Date {quoted string}) The date command triggers theLI-7500 to do a span immedi-ately.

Appendix D
D-14 Appendix D
Command Subcommands Remark
(SerialNo {quoted string}) The 75H-xxxx head number.
(Band (A {float})) The band broadening coeffi-cient (1.15 for the LI-7500).
(A {float})
(B {float})
(C {float})
(CO2 (D {float}) )
(Coeffs (Current (E {float}) ) These values are found on the
(XS {float}) LI-7500’s calibration sheet.
(Z {float})
(A {float})
(B {float})
(H2O (C {float}) )
(XS {float})
(Z {float})

Appendix D
Appendix D D-15
Examples:1. To set the CO2 zero right now (with the calibration tube in place and CO2-free gas
flowing though it, of course), send this:
(Calibrate(ZeroCO2(Date “11 Aug 1999 at 2:15”)))
Note 1: The data value can be any string, so “My Birthday” is equally valid.Note 2: The new value of zero will be sent in the next (Ack(Val..)) record. (See Table 2).
2. To force the H2O channel to use the value 0.96 for its zero, send this:
(Calibrate(ZeroH2O(Val 0.96)))
3. To make the LI-7500 set its CO2 span right now, with 400 µmol†mol-1 flowing through
the calibration tube, first compute the target density using Equation 2-24 (solved for C). Ifthe temperature is 23°C, and the pressure 98kPa, then the mode density is 15.92 mmolCO2 m-3. Then send the following:
(Calibrate(SpanCO2(Target 400)(TDensity 15.92)(Date “3 June 2000”)))
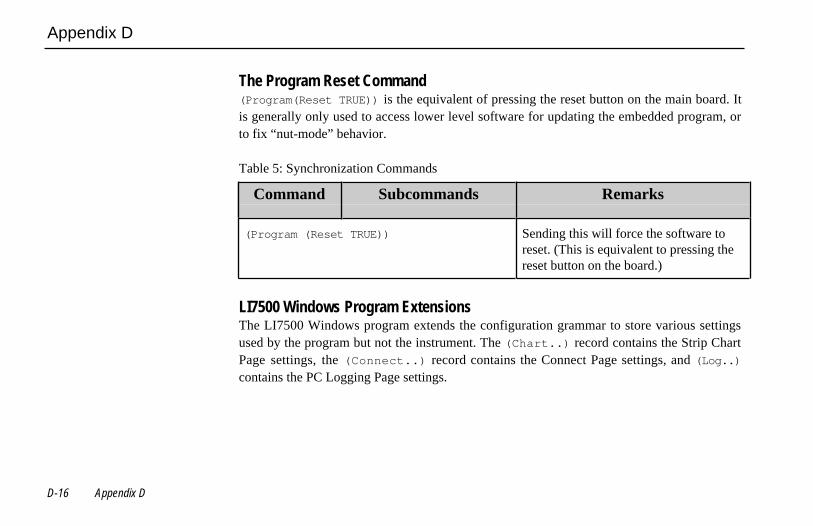
Appendix D
D-16 Appendix D
The Program Reset Command(Program(Reset TRUE)) is the equivalent of pressing the reset button on the main board. Itis generally only used to access lower level software for updating the embedded program, orto fix “nut-mode” behavior.
Table 5: Synchronization Commands
Command Subcommands Remarks
(Program (Reset TRUE)) Sending this will force the software toreset. (This is equivalent to pressing thereset button on the board.)
LI7500 Windows Program ExtensionsThe LI7500 Windows program extends the configuration grammar to store various settingsused by the program but not the instrument. The (Chart..) record contains the Strip ChartPage settings, the (Connect..) record contains the Connect Page settings, and (Log..)contains the PC Logging Page settings.

Appendix D
Appendix D D-17
Table 6: LI7500 Windows Program Extensions (Continued)
Command Subcommands Remarks
(LV {quoted string}) Strip chart left variable
(LMax {float}) Left axis max value
(Lmin {float}) Left axis min value
(RV {quoted string}) Strip chart right variable
(Chart (Rmax {float}) ) Right axis max value
(Rmin {float}) Right axis min value
(Scroll (Coarse {bool }))
Time axis scrolling
(Smooth {bool })(Units (Mins {bool })
)Time axis units
(Secs {bool })(Xmax {int}) Time axis range

Appendix D
D-18 Appendix D
Command Subcommands Remarks
(Baud { 9600 | 19200 | 38400 })
(Connect (Freq {float}) ) Value between 0 and 20.0
(Port {int}) Value between 1 and 38.
(CI {bool }) Include cal information?
(Del (Space {bool }))
Which delimiter?
(Tab {bool })(Log (Name { quoted string }) ) Log file name
(Rem {bool }) Include remarks?
(TS {bool }) Include time stamp?

Appendix D
Appendix D D-19
Command Subcommands Remarks
(CV {bool }) Cooler voltage (V)(Cabs {bool }) CO2 absorption(Cden{bool }) CO2 mmol m-3
(CdenMg {bool }) CO2 mg m-3
(Cmf {bool }) CO2 µmol mol-1
(Dew {bool }) H2O Dew point (°C)(Log (LogVals (Habs {bool }) ) ) H2O absorptance
(Hden {bool }) H2O mmol m-3
(HdenMg {bool }) H2O g m-3
(Hmf{bool }) H2O mmol mol-1
(PortB {bool }) Auxiliary input channel(Pres {bool }) Pressure (kPa)(Temp{bool }) Temperature (°C)(RelTime {bool}) Relative Time (s)

Appendix D
D-20 Appendix D
The Connection Protocol
IntroductionThe purpose of this section is to describe the protocol used to establish communications withthe LI-7500 when it is operating in an “unknown” mode. That is, when the baud rate is notknown, nor any other details about the instrument’s configuration.
Note: For simple data collection, the LI-7500 can be configured with the LI7500 Windowsprogram, and you will not have to deal with this protocol at all. If you wish to write your owninterface program or driver for the LI-7500, and you wish to get the LI-7500 to send it’sconfiguration to you, then this protocol must be used.
Establishing Communications: Step by Step1. Set a break condition on the RS-232 line. 500 ms should be sufficient.
2. The LI-7500 will cease normal activity, change its baud rate to 9600 baud, and begin tosend ascii ENQ characters (decimal 05) at a rate of 2 Hz for up to 10 seconds. Before 10seconds is up, the host should:
3. Send an ascii ACK character (decimal 06) to the LI-7500.

Appendix D
Appendix D D-21
4. Upon receipt of an ACK, the LI-7500 will output its current configuration, terminatedwith a line feed (decimal 10). A sample configuration is shown below. After this is sent,the LI-7500 will resume it’s normal operation, except it will remain at 9600 baud.
5. The host can then send the desired configuration changes, if any, to the LI-7500. If theconfiguration change involves a baud rate change, the LI-7500 will send its (Ack..)record before changing baud rates.
A typical configuration dump as generated by the above protocol is shown below.
(Outputs (BW 5)(Delay 4)(SDM (Address 0))(Dac1 (Source NONE)(Zero
-107479104)(Full -107867704))(Dac2 (Source NONE)(Zero 1)(Full 0))(RS232
(Baud 9600)(Freq 1)(Pres TRUE)(Temp TRUE)(Aux TRUE)(Cooler TRUE)(CO2Raw
TRUE)(CO2D TRUE)(H2ORaw TRUE)(H2OD TRUE)))(Inputs (Pressure (Source
Measured)(UserVal 98))(Temperature (Source Measured)(UserVal 25))(Aux (A
0)(B 0)))(Calibrate (ZeroH2O (Val 1)(Date "Nov 29 1999 at 3:20:10
PM"))(ZeroCO2 (Val 1)(Date "Nov 29 1999 at 3:20:26 PM"))(SpanH2O (Val
1.0394150)(Target 1.5130000e1)(Tdensity 6.9584007e2)(Date "Nov 29 1999
at 3:34:34 PM"))(SpanCO2 (Val 1.0130575)(Target 218)(Tdensity
8.4684810)(Date "Dec 7 1999 at 2:17:47 PM")))(Coef (Current (SerialNo
"75H-0001")(CO2 (XS 0)(Z 0)(A 1.2149099e2)(B 18999)(C 18695300)(D
-5.0145597e9)(E 6.7517800e11))(H2O (XS 0)(Z 0)(A 4.3826398e3)(B
3033170)(C 7851150))(Band (A 1.1499999))))(EmbeddedSW (Model "LI-7500
CO2/H2O Analyzer Application")(Version "1.2.0"))

Appendix D
D-22 Appendix D
This is more clearly readable if parsed as shown below:
(Outputs(BW 5)(Delay 4)(SDM (Address 0))(Dac1
(Source NONE)(Zero -107479104)(Full -107867704))
(Dac2(Source NONE)(Zero 1)(Full 0))
(RS232(Baud 9600)(Freq 1)(Pres TRUE)(Temp TRUE)(Aux TRUE)(Cooler TRUE)(CO2Raw TRUE)(CO2D TRUE)(H2ORaw TRUE)(H2OD TRUE)))
(Inputs(Pressure
(Source Measured)(UserVal 98))
(Temperature

Appendix D
Appendix D D-23
(Source Measured)(UserVal 25))
(Aux(A 0)(B 0)))
(Calibrate(ZeroH2O
(Val 1)(Date "Nov 29 1999 at 3:20:10 PM"))
(ZeroCO2(Val 1)(Date "Nov 29 1999 at 3:20:26 PM"))
(SpanH2O(Val 1.0394150)(Target 1.5130000e1)(Tdensity 6.9584007e2)(Date "Nov 29 1999 at 3:34:34 PM"))
(SpanCO2(Val 1.0130575)(Target 218)(Tdensity 8.4684810)(Date "Dec 7 1999 at 2:17:47 PM")))
(Coef(Current
(SerialNo "75H-0001")(CO2
(XS 0)(Z 0)(A 1.2149099e2)(B 18999)(C 18695300)(D -5.0145597e9)
Appendix D
D-24 Appendix D
(E 6.7517800e11))(H2O
(XS 0)(Z 0)(A 4.3826398e3)(B 3033170)(C 7851150))
(Band(A 1.1499999))))
(EmbeddedSW(Model "LI-7500 CO2/H2O Analyzer Application")(Version "1.2.0"))

Warranty
Each LI-COR, inc. instrument is warranted by LI-COR, inc. to be free from defects in material and workmanship; however, LI-COR, inc.'s soleobligation under this warranty shall be to repair or replace any part of the instrument which LI-COR, inc.'s examination discloses to have beendefective in material or workmanship without charge and only under the following conditions, which are:
1. The defects are called to the attention of LI-COR, inc. in Lincoln, Nebraska, in writing within one year after the shipping date of theinstrument.2. The instrument has not been maintained, repaired, or altered by anyone who was not approved by LI-COR, inc.3. The instrument was used in the normal, proper, and ordinary manner and has not been abused, altered, misused, neglected, involved in anaccident or damaged by act of God or other casualty.4. The purchaser, whether it is a DISTRIBUTOR or direct customer of LI-COR or a DISTRIBUTOR'S customer, packs and ships or deliversthe instrument to LI-COR, inc. at LI-COR inc.'s factory in Lincoln, Nebraska, U.S.A. within 30 days after LI-COR, inc. has received writtennotice of the defect. Unless other arrangements have been made in writing, transportation to LI-COR, inc. (by air unless otherwise authorizedby LI-COR, inc.) is at customer expense.5. No-charge repair parts may be sent at LI-COR, inc.'s sole discretion to the purchaser for installation by purchaser.6. LI-COR, inc.'s liability is limited to repair or replace any part of the instrument without charge if LI-COR, inc.'s examination disclosed thatpart to have been defective in material or workmanship.
There are no warranties, express or implied, including but not limited to any implied warranty of merchantability of fitness for aparticular purpose on underwater cables or on expendables such as batteries, lamps, thermocouples and calibrations.
Other than the obligation of LI-COR, inc. expressly set forth herein, LI-COR, inc. disclaims all warranties of merchantability or fitnessfor a particular purpose. The foregoing constitutes LI-COR, inc.'s sole obligation and liability with respect to damages resulting from

the use or performance of the instrument and in no event shall LI-COR, inc. or its representatives be liable for damages beyond theprice paid for the instrument, or for direct, incidental or consequential damages.
The laws of some locations may not allow the exclusion or limitation on implied warranties or on incidental or consequential damages, so thelimitations herein may not apply directly. This warranty gives you specific legal rights, and you may already have other rights which vary fromlocation to location. All warranties that apply, whether included by this contract or by law, are limited to the time period of this warranty whichis a twelve-month period commencing from the date the instrument is shipped to a user who is a customer or eighteen months from the date ofshipment to LI-COR, inc.'s authorized distributor, whichever is earlier.
This warranty supersedes all warranties for products purchased prior to June 1, 1984, unless this warranty is later superseded.
DISTRIBUTOR or the DISTRIBUTOR'S customers may ship the instruments directly to LI-COR if they are unable to repair the instrumentthemselves even though the DISTRIBUTOR has been approved for making such repairs and has agreed with the customer to make such repairsas covered by this limited warranty.
Further information concerning this warranty may be obtained by writing or telephoning Warranty manager at LI-COR, inc.
IMPORTANT: Please return the User Registration Card enclosed with your shipment so that we have an accurate record of your address.Thank you.

®
LI-COR, inc. � Environmental Division � 4421 Superior Street � P.O. Box 4425 � Lincoln, Nebraska 68504 USAPhone: 402-467-3576 � FAX: 402-467-2819
Toll-free 1-800-447-3576 (U.S. & Canada)E-mail: [email protected]: http://www.licor.com