Embed Size (px)
Citation preview

Executive Summary
Lessons from the Green Lanes:
Evaluating Protected Bike Lanes in the U.S.
By
Portland State University Chris Monsere
Jennifer Dill Nathan McNeil
Kelly Clifton Nick Foster
Tara Goddard
Alta Planning Matt Berkow
Joe Gilpin Kim Voros
Drusilla van Hengel Independent Consultant
Jamie Parks NATIONAL
INSTITUTE FOR
TRANSPORTATION AND
COMMUNITIES
NITC-RR-583
June 2014
Executive Summary 1
As cities move to increase levels of bicycling
for transportation, many practitioners and
advocates have promoted the use of
protected bike lanes (also known as “cycle
tracks” or “protected bikeways”) as an
important component in providing high-
quality urban infrastructure for cyclists.
These on-street lanes provide more space
and physical separation between the bike
lane and motor vehicle lane compared with
traditional striped bike lanes. However, few
U.S. cities have direct experiences with their
design and operations, in part because of the
limited design guidance provided in the past.
Until recently there was limited research on
protected bike lanes in North American.
Researchers have been working to make up
for this shortfall, with findings suggesting
that protected bike lanes can both improve
bicyclists’ level of comfort and safety, and
potentially increase the number of people
cycling.
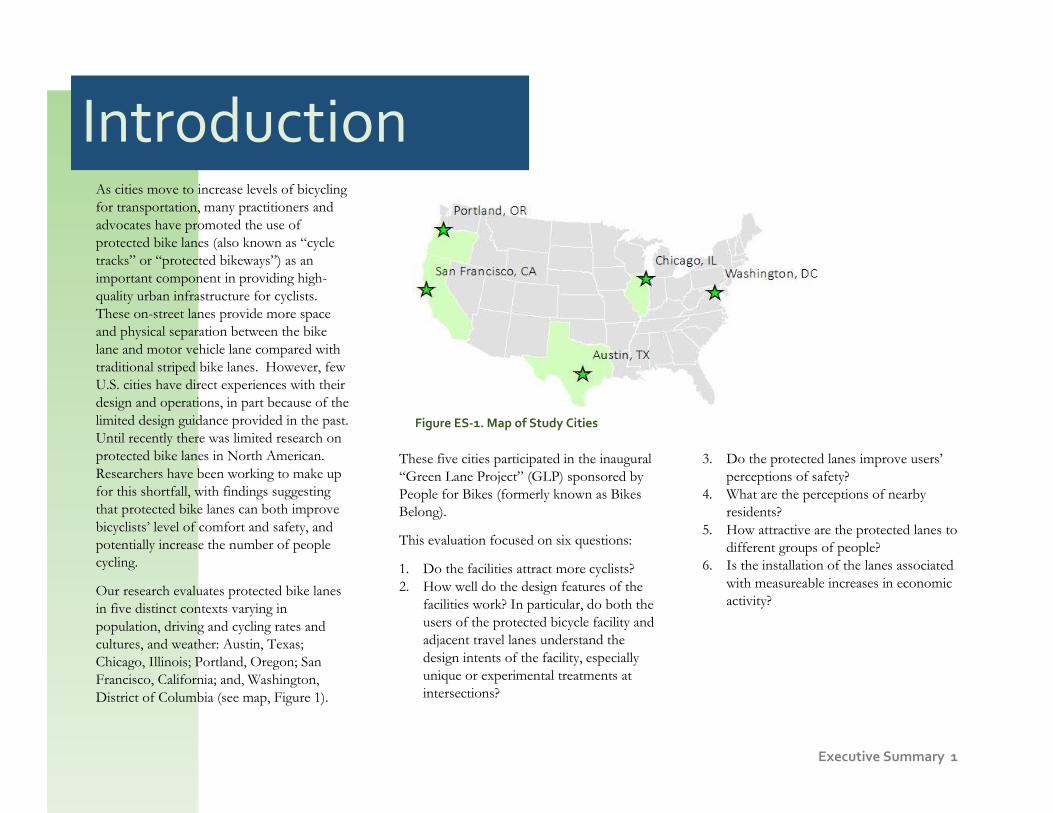
Our research evaluates protected bike lanes
in five distinct contexts varying in
population, driving and cycling rates and
cultures, and weather: Austin, Texas;
Chicago, Illinois; Portland, Oregon; San
Francisco, California; and, Washington,
District of Columbia (see map, Figure 1).
These five cities participated in the inaugural
“Green Lane Project” (GLP) sponsored by
People for Bikes (formerly known as Bikes
Belong).
This evaluation focused on six questions:
1. Do the facilities attract more cyclists?
2. How well do the design features of the
facilities work? In particular, do both the
users of the protected bicycle facility and
adjacent travel lanes understand the
design intents of the facility, especially
unique or experimental treatments at
intersections?
3. Do the protected lanes improve users’
perceptions of safety?
4. What are the perceptions of nearby
residents?
5. How attractive are the protected lanes to
different groups of people?
6. Is the installation of the lanes associated
with measureable increases in economic
activity?
Figure ES-1. Map of Study Cities
Introduction

Executive Summary 2
The study includes nine new protected bike
lanes in the five cities (Figure ES-2 and
Table ES-1). The projects were completed
between spring 2012 and summer 2013.
Austin, Texas
The Barton Springs Road protected bike
lane is a one-way, half-mile long lane
separated by flexposts and a 1.5’ buffer.
Space was created by narrowing the motor
vehicle lanes. There is a shared-use path on
the other side of the street.
The Bluebonnet Lane protected bike lane
is a two-way lane on a low-traffic primarily
residential two-way street with an elementary
school. The 0.7 mile lane is separated by
flexposts and a 2’ buffer, and provides an
alternative commuter route to the busy
Lamar Boulevard. On-street parking was
removed to provide room for the protected
lane.
The Rio Grande Street protected bike lane
is a two-way, half-mile long lane on the left
side of a one-way street a few blocks the
University of Texas-Austin campus. The
street has a mix of residential, retail, and
office uses. A motor vehicle lane and
limited on-street parking were removed to
provide room for the protected lanes and 4’
buffer with flexposts.
Chicago, Illinois
The Dearborn Street protected bike lane is
a two-way lane on a one-way street through
Chicago’s ‘Loop.’ One motor vehicle lane
was removed to provide space for the lane,
which is separated by parking, flexposts, and
a 3’ buffer zone, with bicycle signals at each
intersection.
The N. Milwaukee Avenue protected bike
lanes, along a major radial route between
central Chicago with neighborhoods to the
northwest connect existing protected bike
lanes on W. Kinzie Street and N. Elston
Avenue. The protected bike lanes are on
both sides of the street along the 0.8 mile
route, buffered by a mix of a 2-3’ painted
buffers with posts and parking protected
areas.
Portland, Oregon
The NE Multnomah Street protected bike
lanes run 0.8 miles along a commercial
street. The five-lane street with standard bike
lanes and no on-street parking was “dieted”
down to one travel lane in each direction, a
two-way left-turn lane, and bike lanes
protected by a mix of parking, painted
buffers, flexible bollards, and/or planters,
depending on the road segment.
San Francisco, California
The Oak and Fell Street protected bike
lanes run three blocks along a one-way street
couplet, connecting bike routes from
downtown to Golden Gate Park and
neighborhoods to the west. Parking was
removed to accommodate the lanes with 5’
buffers and flexposts.
Washington, District of Columbia
The L Street protected bike lane is half of a
planned protected bike lane couplet along
two one-way streets in downtown. L Street
was decreased from 4 to 3 motor vehicle
lanes in places, to make room for the 1.12-
mile long, one-way left-side lane separated
by a 3’ striped buffer zone with plastic flex-
posts.
Study Sites

Executive Summary 3
Figure ES-2. Protected Bike Lanes included in the research
Austin, TX: Barton Springs Road
One-way protected bike lane on the south side of the road
Bluebonnet Lane
Two-way protected bike lane on a two-way street
Rio Grande Street
Two-way protected bike lane on one-way street
Chicago, IL: N/S Dearborn Street
Two-way protected bike lane on one-way street
N Milwaukee Avenue
Pair of one-way protected bike lanes on a two-way street
Portland, OR: NE Multnomah Street
Pair of one-way protected bike lanes on a two-way street
San Francisco, CA: Oak Street
One-way right-side lane on a one-way street
Fell Street
One-way left-side protected lane on a one-way street
Washington, DC: L Street NW
One-way protected bike lane on a one-way street

Executive Summary 4
Table ES-1. Protected Bike Lane Elements
Data Element
Austin Chicago Portland San Francisco Washington DC
Barton Springs Road
Bluebonnet Lane
Rio Grande St N/S
Dearborn St N Milwaukee
Ave NE Multnomah
St Fell St Oak St L Street NW
Protected Lane Description
One-way EB protected
lane on south side (+WB
shared path on north side)
Two-way protected
lanes on two-way street
Two-way protected
lanes on one-way street
Two-way protected lanes on one-way
street
Pair of one-way protected lanes on either
side of two-way street
Pair of one-way protected lanes on either side of two-way street
One-way protected
lane on one- way street
One-way protected
lane on one- way street
One-way protected lane on
one-way street
Standard / Striped Bike Lanes (pre)
None 1 nb, 1 sb 1 nb None 1 nb, 1 sb 1 eb, 1 wb 1 wb None None
Standard Traffic Lanes (pre)
2 eb, 1 ctr turn lane, 2 wb
1 nb, 1 sb 2 nb 3-4 nb 1 nb, 1 sb 2 eb, 1 center
turn lane, 2 wb 3 wb 3 eb 3 eb
Loss of MV Travel Lane
No No In places One lane Dedicated turn or bus lane in
places
One lane in each direction
No No In places
Parking Allowed (pre)
No Both sides Left Side Left side Both sides No Both sides Both sides Right side, Left
side (flex)
Net Loss of Parking
No ~150 No 21 69 +27 gained ~28 ~27 ~150
Length (miles) 0.5 0.7 0.4 1.2 0.8 0.8 0.3 0.3 1.12
# Signalized Intersections
4 0 2 12 to 13 7 10 4 4 15
# Unsignalized Intersections
2 15 5 0 5 3 0 0 0
ADT (pre) 23-28,000 3,500 5,000 8-18,000 11,000 10,000 10-20,000 10-20,000 10,000
Construction Timeframe
Spring 2013 August 2012 April 2012 Nov./ Dec. 2012, May
2013 April/May 2013
Fall 2012/ Winter 2013
Spring /summer 2013
Spring /summer 2013
October 2012
Bike Lane Width (representative)
5'-7' 5' + 5' 6.5' + 5.5' 5' + 4' 7' 4'-7' 7'3" 7'3" 8'
Buffer Type Flexposts Flexposts Flexposts Flexposts;
MV parking Flexposts; MV
Parking
Concrete Planters;
MV Parking Flexposts Flexposts Flexposts
Typical Buffer Width
1.5' 3' 4' 3'; 8' parking
strip 2-4'; 9' parking
strip 2'-8' 5' 5' 3'
# Bicycle Signals 2 0 1 12 to 13 1 0 0 0 0
Typical MV Lane Width
10'-10.5’ 10' 14’ 9'-10' 10'-11' 10' 9'6" 9'6" 11'
# Mixing or Turning zones
0 0 0 0 0 11 3 3 11

Executive Summary 5
The primary data collection methods
were video collection and observation at
selected intersections, surveys of
intercepted bicyclists, and mail-out
surveys of nearby residents. The data
sources were supplemented with count
data provided by each city. Due to
facility characteristics and available data,
some protected lanes only lent
themselves to certain types of data
collection and analysis (Table ES-2).
The video data help to assess actual
behavior of bicyclists and motor vehicle
drivers to determine how well each user type
understands the design of the facility and to
identify potential conflicts between
bicyclists, motor vehicles and pedestrians.
Cameras were mounted for a minimum of 2
days at 16 locations. A total of 168 hours of
video were analyzed, in which 16,393
bicyclists and 19,724 turning vehicles were
observed.
Data & Methods Table ES-2. Data used in Analysis, by Site
Austin Chicago Portland San
Francisco Washington
DC
Barton Springs
Bluebonnet Lane
Rio Grande
Dearborn Milwaukee NE
Multnomah Fell Oak L Street
Video Data
Bicyclist Survey
Resident Survey
Count Data
Note: Due to construction activity and routes with relatively low traffic volumes at intersections, no video data were collected for the Austin locations
A total of 168 hours of video were
analyzed, in which 16,393 bicyclists and
19,724 turning vehicles were observed.

Executive Summary 6
The resident survey (n=2,283 or 23% of
those who received the survey in the mail)
provided the perspective of people who live,
drive, and walk near the new lanes, as well as
residents who bike on the new lanes. The
bicyclist intercept survey (n= 1,111 or 33%
of those invited to participate) focused more
on people’s experiences riding in the
protected lanes. Selected demographic
information from survey respondents in
shown in Figure ES-3. The intercepted
bicyclists were younger and more likely to be
male than the residents.
In contrast to the video data, the surveys
collect data on stated behavior and
perceptions. In instances where the two
analyses overlap, the video review and
survey results can be contrasted to compare
how individuals behave to how they say they
do, or should, act (Table ES-3).
Table ES-3. Overview of Data used in Analysis
Research Element Video Data Bicyclist Survey Resident Survey Count Data
Change in Ridership
Design Evaluation
Safety
Perceptions of Residents
Appeal to Different Groups
Economic Activity
Figure ES-3. Resident and Bicyclist Survey Respondent Demographics
55%
64%
15%
96%
50%
18%
81%
67%
53%
26%
40%
34%
81%
5%
5%
6%
66%
15%
41%
83%
0% 20% 40% 60% 80% 100%
Home Owners
2+ Adults in HH
Children in HH
Driver's License
Transit Pass
Car Share Membership
Own/Lease a car
Own working bicycle
Female
<35 years of age
35 to 54 years
55 + years
White
Black
Hispanic or Latino/a
Asian
Work Outside Home
Work From Home
Income >$100k
Four year degree +
Residents
78%
25%
97%
72%
28%
73%
32%
56%
37%
6%
89%
1%
5%
7%
93%
7%
48%
89%
0% 20% 40% 60% 80% 100%
Intercepted Bicyclists

Executive Summary 7
We found a measured increase in observed
ridership on all facilities within one year of
installation of the protected bike lanes,
ranging from +21% to +171% (Figure ES-
4). The increases appear to be greater than
overall increases in bicycle commuting in
each city. Some of the increase in ridership
at each facility likely came from new riders
(i.e. riders who, absent the protected bike
lane, would have travelled via a different
mode or would not have taken the trip) and
some from riders diverted from other nearby
streets (i.e. riders who were attracted to the
route because of the facility, but would have
chosen to ride a bicycle for that trip
regardless).
Findings:
Changes in Ridership
Figure ES-4. Change in Observed Bicycle Volumes
126%
68%
46% 46%
21%
171%
65%58%
0%
20%
40%
60%
80%
100%
120%
140%
160%
180%
Rio Grande Multnomah Bluebonnet Fell Milwaukee Dearborn L Street BartonSprings
Pe
rce
nt
Incr
ea
se
Two-way
One-way
Bike lanes prior No bike lanes prior

Executive Summary 8
Our intercept survey of bicyclists found that
10% would have made the trip by another
mode and 1% would not have made the trip,
indicating that there are some new riders
attracted to the facilities. The remainder
would have bicycled on a different route
(24%) or the same route (65%).
Bicyclists self-reported that they rode
more frequently on the facility after
installation. Just over 49% of bicyclists
indicated that they are traveling on the
respective routes more frequently than
they were prior to protected lanes. The
percentage ranged between 28% for Fell
Street in San Francisco to 86% for
Dearborn Street
Nearly a quarter of bicyclists intercepted
on the facilities stated that their overall
frequency of bicycling increased because
of the new protected lanes. The increase
was higher among women.
Figure ES-5. Before the new facility was built, how would you have made this trip?
60%
38% 34% 32% 29%18%
11% 6%
21%
7%10% 10%
6%
6%7%
10%
17%
55% 56% 56%65%
75%80% 83%
0%
20%
40%
60%
80%
100%
Dearborn Rio Grande Multnomah L Street Barton Springs Oak Street Fell Street Milwaukee
By bicycle, usingthis same route
Would not havetaken trip
By other mode
By bicycle, usinganother route
Findings: Changes in Ridership (continued)
Executive Summary 9
A primary focus of our analysis was on
intersection design—a critical component of
making the protected lane concept function.
Each of the facilities evaluated used different
designs for through bicycles to mix with
turning motor vehicle traffic. Three different
design approaches were evaluated. First,
some designs require the bicycles and
turning vehicles to “mix” in the same space.
These designs are called “mixing zones.”
The second approach moves the through
bicycle from the protected lane near the curb
to the left or right of the turning traffic into
a narrow through bike lane. These are called
“turning zones.” There is a defined
turn/merge gap for this maneuver and the
lanes are marked with dotted lines
recognizing that larger vehicles may
encroach on the bike lane due to the narrow
widths of the turning lanes. The third design
involves signalization to separate the bicycle
and turning vehicle movements.
With some exceptions noted below and in
the main text, the large majority of drivers
and bicyclists stated that they understood the
intent of the mixing zone designs and were
observed to use them as intended. In
addition, a majority of bicyclists using the
intersections stated feeling safe.
For the turning zones, the design using
the through bike lane (TBL) works well
for its intended purpose. The TBLs
help position cyclists and reduce
confusion compared to sharrows in
mixing zones. The design in
Washington D.C. (where vehicles have a
limited entry into the turning lane) had
high correct lane use by turning vehicles
(87%) and by through bicyclists (91%,
Table ES-4). This suggests a clear
benefit of the restricted entry approach
and creating a semi-protected through
bicycle lane.
For the mixing zones, the highest
compliance of any design was at the
Mixing Zone with Yield Markings design in
Portland, OR, where nearly all (93%) of
the turning vehicles used the lane as
intended. However, only 63% of
observed bicycles correctly used the
mixing zone when a car was present
(they chose to go around vehicle in
the buffer space to left). This is not
necessarily a critical issue and
hatching this space would likely
change this observed behavior.
However, the observed behavior
does suggest a preference of giving
cyclists space with a TBL.
A low of 1% to a high of 18% of the
turning vehicles at mixing zones actually
turned from the wrong lane. The Mixing
Zone with Yield Markings design in
Portland and the Turning Zone with Post-
Restricted Entry and TBL in Washington,
D.C. had the fewest vehicles observed
turning from the wrong lanes, indicating
that clear marking of the vehicle entry
point to the turning lane is beneficial.
Based on observed behaviors, green
pavement marking is effective at
communicating the space that should be
used by bicycles and that over use of
green marking may result in some
drivers avoiding the space.
Findings: Effectiveness of
Intersection Designs
…the large majority of drivers and
bicyclists stated that they understood
the intent of the mixing zone designs and
were observed to use them as intended.

Executive Summary 10
Table ES-4. Turning Motor Vehicle and Through Bicycle Use of Intersections
Video: Correct Lane Use Survey: % of Bicyclists
Agreeing They Feel Safe
Turning Motorist
Through Bicyclist
Turning Zone with Post Restricted Entry and Through Bike Lane
(TBL): L Street
87% 91% 64%
Mixing Zone with Yield Entry Markings: NE
Multnomah / 9th 93% 63% 73%
Turning Zone with Unrestricted Entry and
Through Bike Lane (TBL): Oak/ Divisadero
66% 81% 74%
Mixing Zone with Sharrow Marking:
Oak/Broderick 48% 30% 79%
Mixing Zone with Green Skip Coloring:
Fell/Baker 49% - 84%
Executive Summary 11
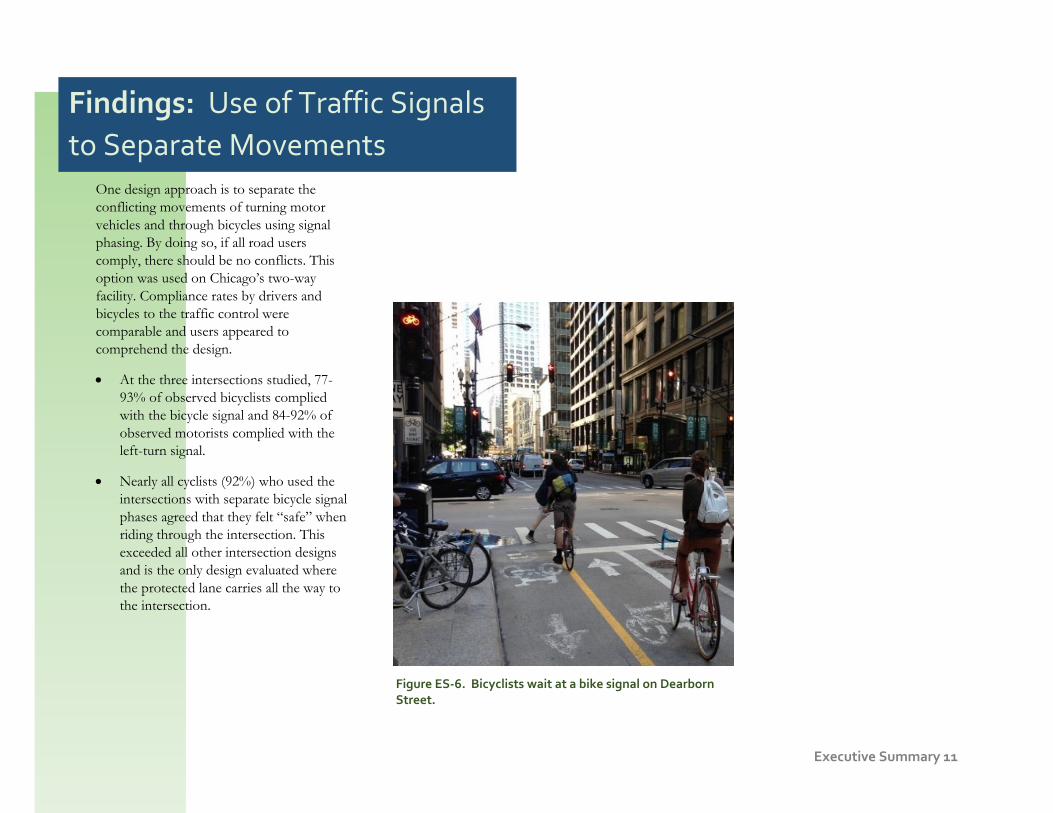
One design approach is to separate the
conflicting movements of turning motor
vehicles and through bicycles using signal
phasing. By doing so, if all road users
comply, there should be no conflicts. This
option was used on Chicago’s two-way
facility. Compliance rates by drivers and
bicycles to the traffic control were
comparable and users appeared to
comprehend the design.
At the three intersections studied, 77-
93% of observed bicyclists complied
with the bicycle signal and 84-92% of
observed motorists complied with the
left-turn signal.
Nearly all cyclists (92%) who used the
intersections with separate bicycle signal
phases agreed that they felt “safe” when
riding through the intersection. This
exceeded all other intersection designs
and is the only design evaluated where
the protected lane carries all the way to
the intersection.
Figure ES-6. Bicyclists wait at a bike signal on Dearborn Street.
Findings: Use of Traffic Signals
to Separate Movements

Executive Summary 12
We assessed bicyclists’ perceptions of
different buffer designs based upon their
stated preferences for the actual facilities
where they rode and some hypothetical
designs presented in diagrams. One clear
takeaway is that designs of protected
lanes should seek to provide as much
protection as possible to increase cyclists’
comfort.
Designs with more physical
separation had the highest scores.
Buffers with objects (e.g. flexposts,
planters, curbs, or parked cars) had
higher comfort levels than buffers
created only with paint (Figure ES-7).
Flexpost buffers got very high ratings
even though they provide little actual
physical protection
Any type of buffer shows a
considerable increase in self-reported
comfort levels over a striped bike
lane.
Figure ES-7. Bicyclists’ Stated Comfort Level with Hypothetical Buffer Options
0% 25% 50% 75% 100%
With a solidpainted buffer
With a painted2-3 foot buffer
With a painted bufferand parked cars
With a raisedconcrete curb
With a 2-3 foot bufferand plastic flexposts
With plantersseparating the bikeway
With a striped bike lane(no buffer)
(1) Very Uncomfortable (2) (3) (4) (5) (6) Very Comfortable
Findings: Buffer Designs
Influence Cyclist Comfort

Executive Summary 13
There was consistent evidence that the
protected facilities improved the perception
of safety for people on bicycles. Perceptions
of the change to the safety of driving and
walking on the facility were more varied.
Nearly every intercepted bicyclist (96%)
and 79% of residents stated that the
installation of the protected lane
increased the safety of bicycling on the
street. These strong perceptions of
improved safety did not vary
substantially between the cities, despite
the different designs used (Figure ES-8).
Nearly nine out of 10
(89%) intercepted
bicyclists agreed that the
protected facilities were
“safer” than other
facilities in their city.
Perceptions of the safety
of driving on the facility
were more varied.
Overall, 37% thought the
safety of driving had
increased; 30% thought
there had been no
change; 26% thought
safety decreased; and
7% had no opinion.
The perceptions varied by facility
(Figure ES-9).
Perceptions of the safety of the
walking environment after the
installation of the protected lanes
were also varied, but were more
positive than negative. Overall, 33%
thought safety increased; 48%
thought there had been no change;
13% thought safety decreased; and
6% had no opinion. These
perceptions varied by facility.
Figure ES-8. Bicyclists: "I feel the safety of bicycling on ______ has . . ."
66%
81%
59%
65%
82%
66%
56%
29%
18%
33%
31%
18%
27%
33%
0% 20% 40% 60% 80% 100%
DC L Street
SF Oak / Fell
Portland Multnomah
Chicago Milwuakie
Chicago Dearborn
Austin Rio Grande
Austin Barton Springs
Increased a Lot Increased Somewhat
Figure ES-9. Residents: “Because of the protected bike lanes, the safety of _____ on the street has increased”
0% 20% 40% 60% 80% 100%
Washington, D.C. - L St.
Chicago, Dearborn
Chicago, Milwaukee
Austin, Barton Springs
Austin, Bluebonnet
San Francisco, Oak
Portland, Multnomah
Percent of Residents Stating "safety increased"
Walking
Driving
Bicycling
Findings:
Perceived Safety for All Users

Executive Summary 14
Due to the very recent installation dates,
reported crash data were not available for
analysis on most of the facilities. Overall, we
did not observe any notable safety problems
and survey respondents had strong feelings
that safety had improved. Taken together,
these findings (when combined with the
results of prior work) suggest that concerns
about safety should not inhibit the
installation and development of protected
bike lanes—though intersection design does
matter, and must therefore be carefully
considered.
In the 144 hours of video analyzed
for safety in this research, studying
nearly 12,900 bicycles through the
intersections, no collisions or near
collisions were observed. This
included both intersections with
turn lanes and intersections with
signals for bicycles.
In the same video analysis, only 6
minor conflicts (defined as
precautionary braking and/or
change of direction of either the
bicycle or motor vehicle) were
observed. At the turning and
mixing zones analyzed there were 5
minor conflicts in 6,100 though
bicycles or 1 minor conflict for
every 1,200 though bicycles.
There was generally a higher rate of
conflicts observed in the mixing
zone designs than in the turning
zone designs.
Findings:
Observed Safety
In the 144 hours of video analyzed for
safety in this research, studying nearly
12,900 bicycles through the intersections,
no collisions or near collisions were
observed.

Executive Summary 15
Overall, residents supported the protected
lanes.
Three in four residents (75%) said they
would support building more protected
bike lanes at other locations (Figure ES-
10). This support was strong even
among residents who reported
“car/truck” as their primary commute
mode —69% agreement)
Overall, 91% of surveyed residents
agreed with the statement “I support
separating bikes from cars”. This
includes primary users of all modes
(driving, walking, transit, and bicycling).
Over half the residents surveyed (56%)
felt that the street works better for “all
people” due to the protected bike lanes,
while only 26% felt the street works less
well.
Figure ES 1. Residents’ Opinions of Protected Bike Lanes, by Commute Mode
I would support building
more protected bike
lanes at other locations
Because of the protected
bike lanes, how well the
street works for all people
has increased
All residents
Findings: Overall Support for
the Protected Lane Concept
Three in four residents (75%) said they
would support building more protected
bike lanes at other locations.

Executive Summary 16
On the resident and bicycle surveys,
questions were asked to provide insight into
the impact of the protected lanes on
neighborhood desirability and economic
activity.
Nearly three times as many residents felt
that the protected bike lanes had led to
an increase in the desirability of living in
their neighborhood, as opposed to a
decrease in desirability (43% vs 14%) -
the remainder stated there had been no
change in desirability.
Approximately 19% of intercepted
bicyclists and 20% of residents who
bicycled on the street stated that how
often they stop at shops and businesses
increased after the installation of the
protected bike lanes. Few respondents
indicated their frequency decreased (1%
and 6%, respectively)—most indicated
no change.
Similarly, approximately 12% of the
residents stated that they are more likely
to visit a business on the corridor since
the protected bike lanes were built—9%
indicated they were less likely, most self-
reported no change.
The specific impacts
to motor vehicle
travel vary between the cities, depending on
the before-and-after context.
Over half (53%) of residents who had
driven a motor vehicle on the street
stated the predictability of bicycles and
motorists had increased – only 12% felt
predictability had decreased. We
interpret this as support for the clear
ordering of the street space for all users.
Only 14% of respondents indicated that
they ever avoided driving on the street
because of the protected bikeway.
About 31% of residents who drove on
the street stated that since the protected
bike lanes were built the amount of time
it takes to drive on this street has
increased, 10% indicated it decreased,
and 59% indicated no change.
Parking is a key issue when street space
is reassigned and cities. The impact to
parking was the most negative
perception, with about 30-55% of
residents indicating the impacts to
parking were negative, even in cases
where a minimal amount of parking was
removed, or parking was increased.
Findings: Neighborhood Desirability
and Economic Activity
Findings: Perceptions of
People Driving on the Street

Executive Summary 17
Protected bike lanes could increase bicycling
among people who do not currently ride
regularly for transportation.
Nearly 2 in 3 residents agreed with the
statement “I would be more likely to
ride a bicycle if motor vehicles and
bicycles were physically separated by a
barrier.” Agreement was higher for
residents in the Interested but Concerned
segment (Figure ES-11). Interested but
Concerned residents had the highest
perception of improved safety due to
the installation of the protected lanes
and the highest agreement with the
statement, “I support separating bikes
from cars.
Figure ES-2. Residents’ Likelihood of Riding with Physical Separation by Type of Cyclist
Strong and Fearless,
5%
Enthused and Confident,
27%
Interested but Concerned,
43%
No Way No How, 25%
Share of Residents
43%
62%
85%
37%
Strong and Fearless Enthused andConfident
Interested butConcerned
No Way No How
I would be more likely to ride a bicycle if motor vehicles and bicycles were physically separated by a barrier.
Findings:
Potential to Attract New Riders