Embed Size (px)
Citation preview
Lessons from Economic History
for Green Growth
Roger Fouquet and Ralph Hippe
Grantham Research Institute on Climate Change and Environment
London School of Economics (LSE)
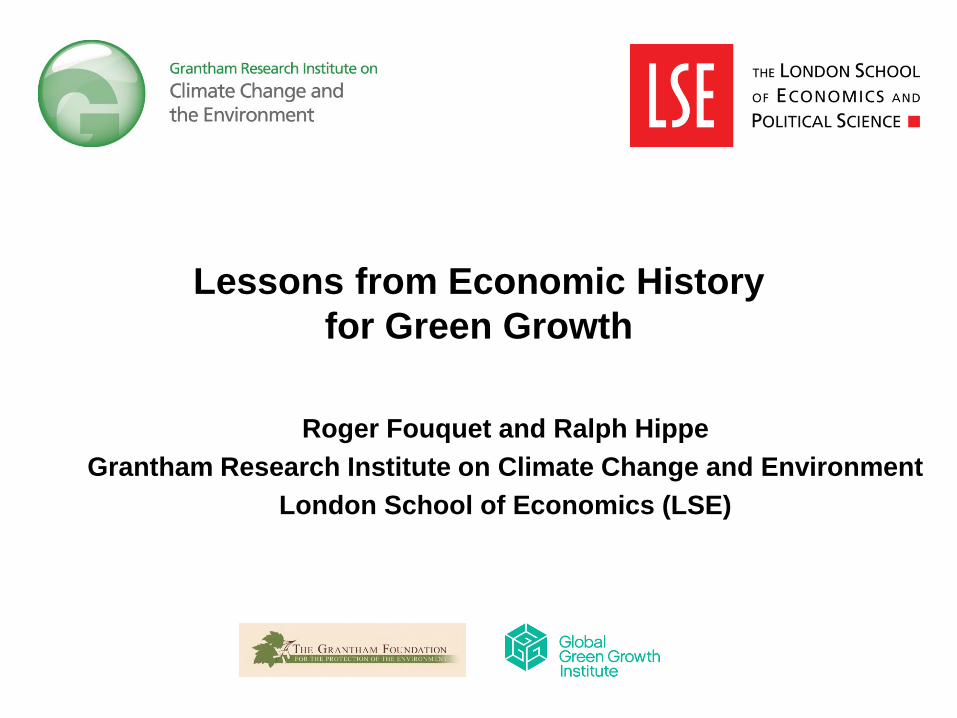
The Importance of History
• “Those who cannot remember the past, are condemned to repeat it” George Santayana
• Long Run and Very Long Run Trends
• Experiences to Learn from (Shocks, Transitions)
• Generalizable from Many Experiences
• History Matters: Past Technologies, Institutions and Culture matter to Present Behaviour and Development (Acemoglu et al. 2001, Nunn 2009)
• Yet, Lack of Historical Lessons for Policy
• History of Economic Growth and Development
– Broad Understanding of Trends and Drivers
• Energy and Environmental History
– LR Relationship with Economic Growth
– Role of Technologies in Economic Development and Welfare
• The Development of the Knowledge Economy
– Future Key Source of Low-Energy Growth?
– Understand and Learn LR Development
Outline
Part 1
History of Economic Growth and Development
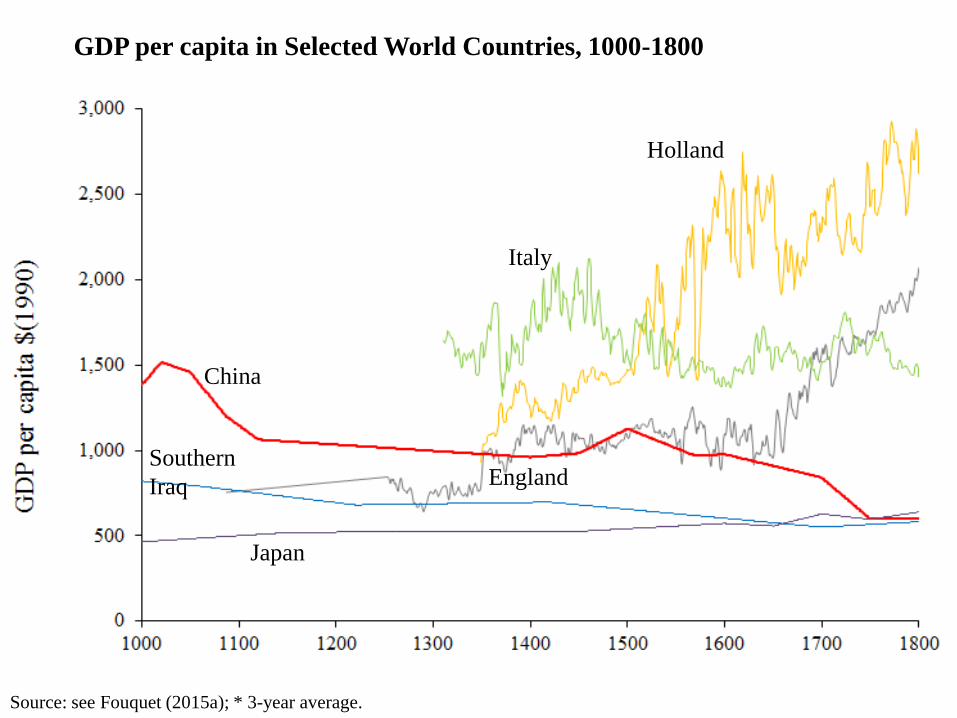
Holland
England Southern
Iraq
China
Italy
Japan
Source: see Fouquet (2015a); * 3-year average.
GDP per capita in Selected World Countries, 1000-1800
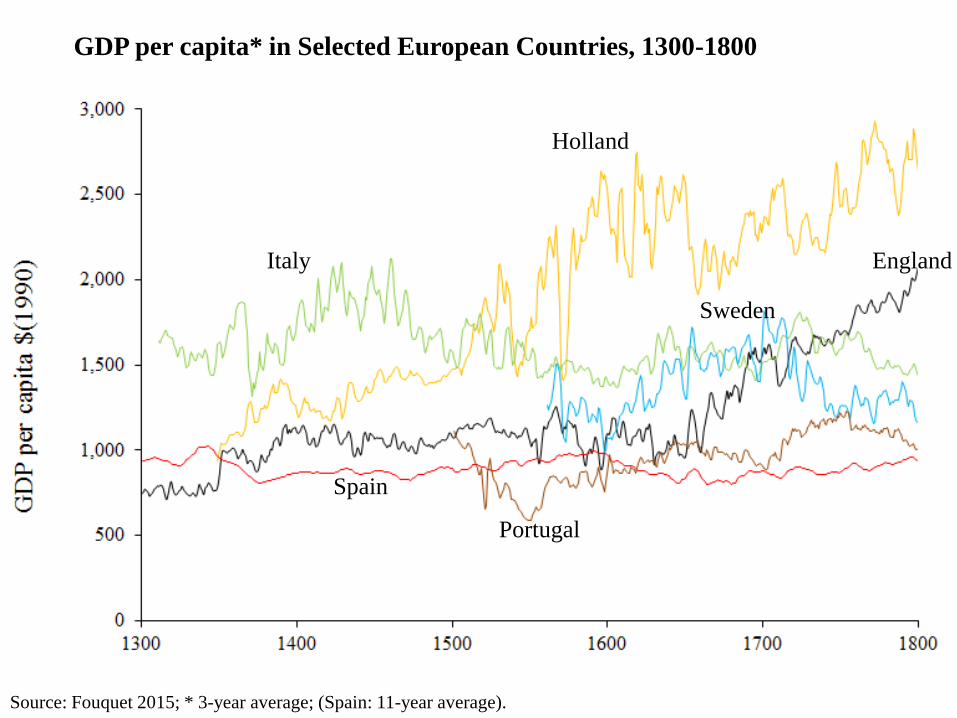
Holland
England
Spain
Italy
Sweden
Portugal
Source: Fouquet 2015; * 3-year average; (Spain: 11-year average).
GDP per capita* in Selected European Countries, 1300-1800
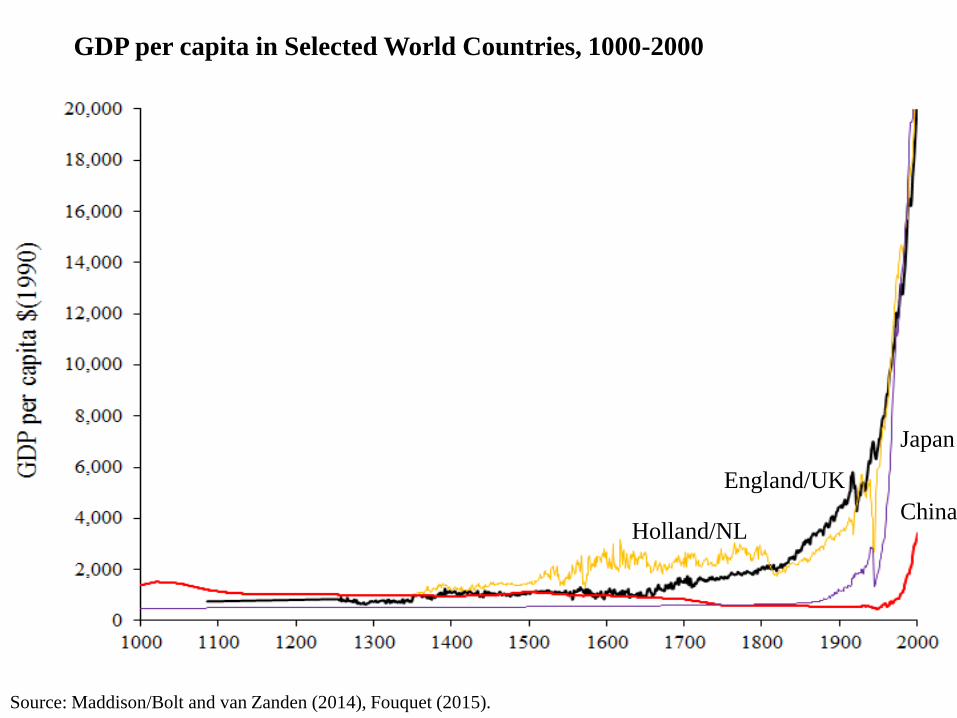
Holland/NL
England/UK
Japan
China
Source: Maddison/Bolt and van Zanden (2014), Fouquet (2015).
GDP per capita in Selected World Countries, 1000-2000
Part 2
Energy and Environmental History
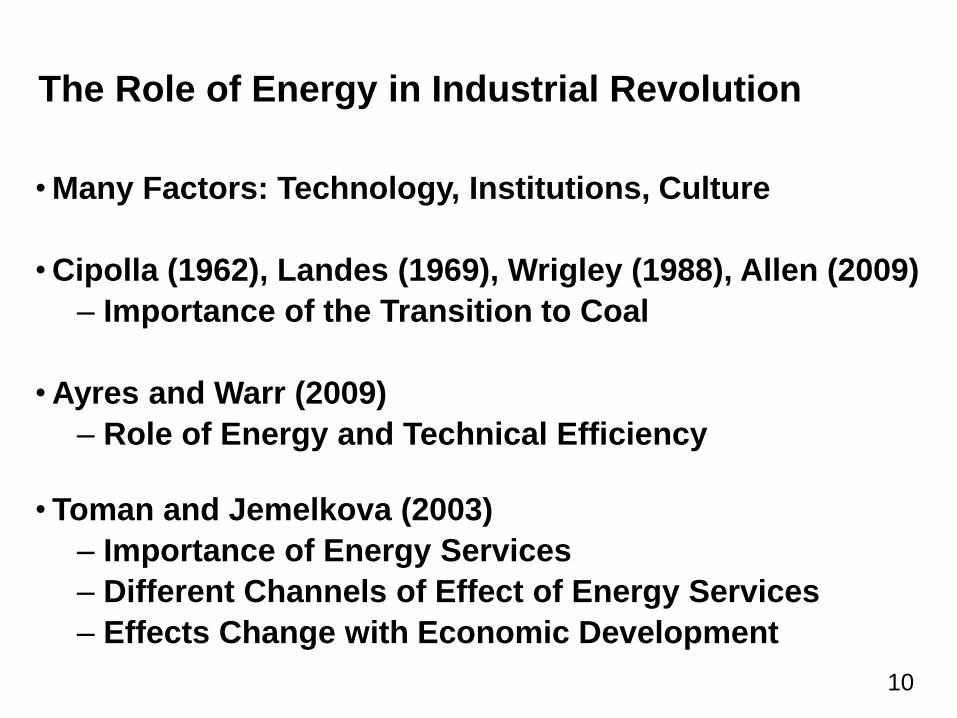
The Role of Energy in Industrial Revolution
•Many Factors: Technology, Institutions, Culture
•Cipolla (1962), Landes (1969), Wrigley (1988), Allen (2009)
– Importance of the Transition to Coal
•Ayres and Warr (2009)
– Role of Energy and Technical Efficiency
• Toman and Jemelkova (2003)
– Importance of Energy Services
– Different Channels of Effect of Energy Services
– Effects Change with Economic Development
10
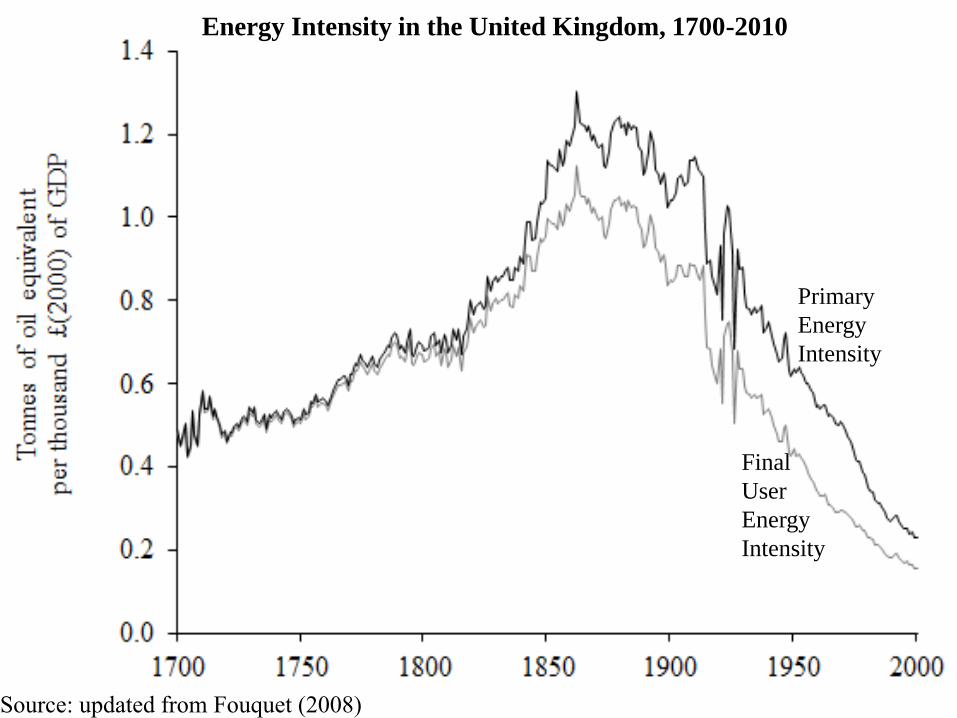
Primary
Energy
Intensity
Final
User
Energy
Intensity
Source: updated from Fouquet (2008)
Energy Intensity in the United Kingdom, 1700-2010
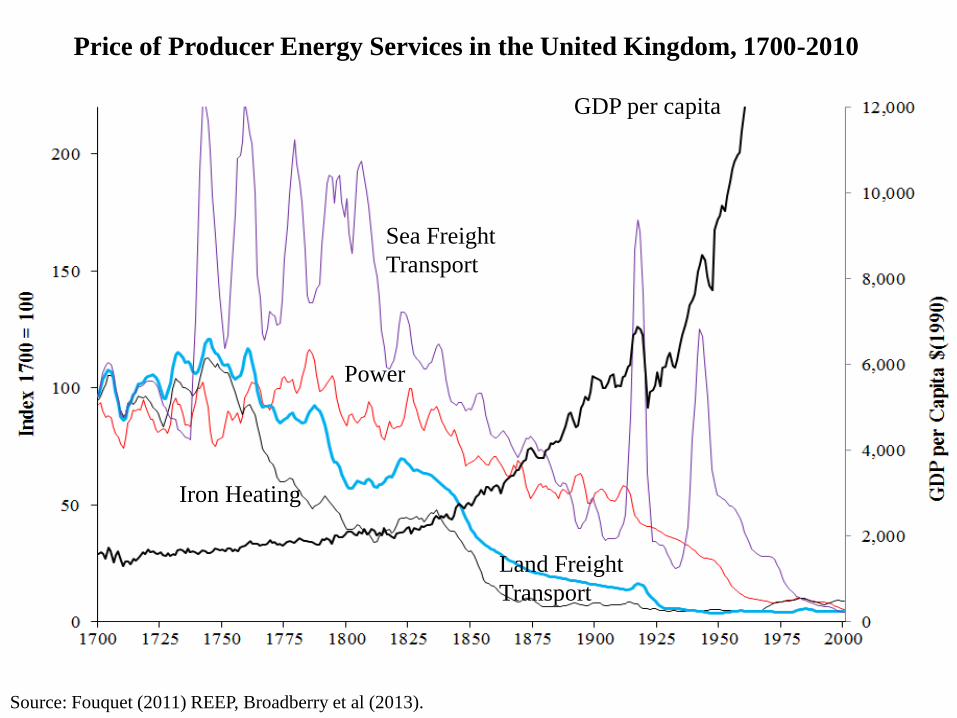
GDP per capita
Power
Iron Heating
Sea Freight
Transport
Land Freight
Transport
Source: Fouquet (2011) REEP, Broadberry et al (2013).
Price of Producer Energy Services in the United Kingdom, 1700-2010
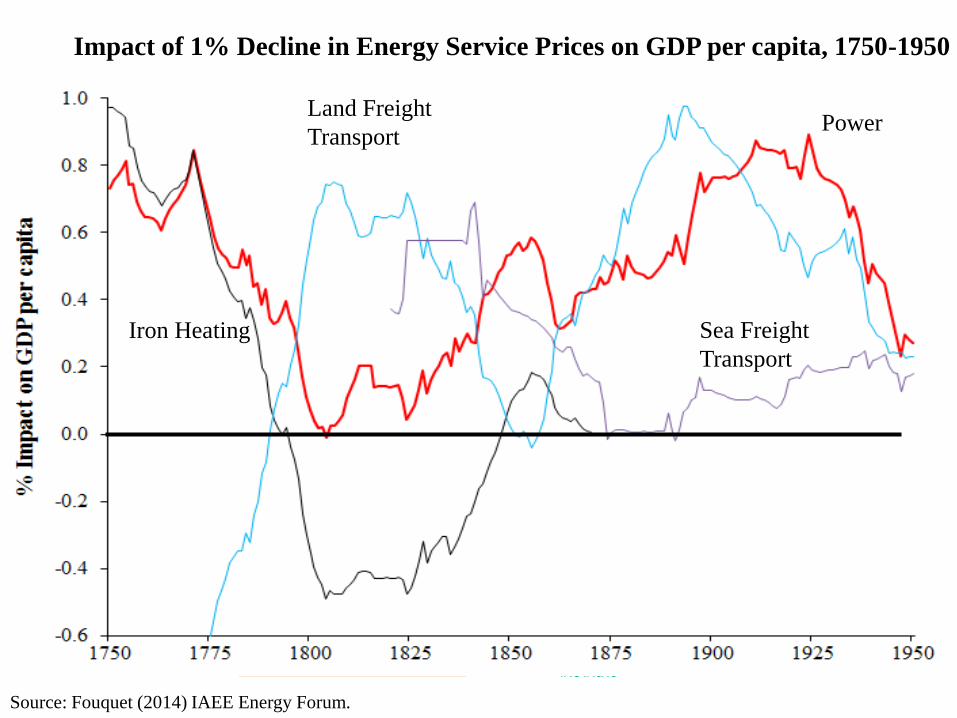
Power
Iron Heating
Land Freight
Transport
Sea Freight
Transport
Source: Fouquet (2014) IAEE Energy Forum.
Impact of 1% Decline in Energy Service Prices on GDP per capita, 1750-1950
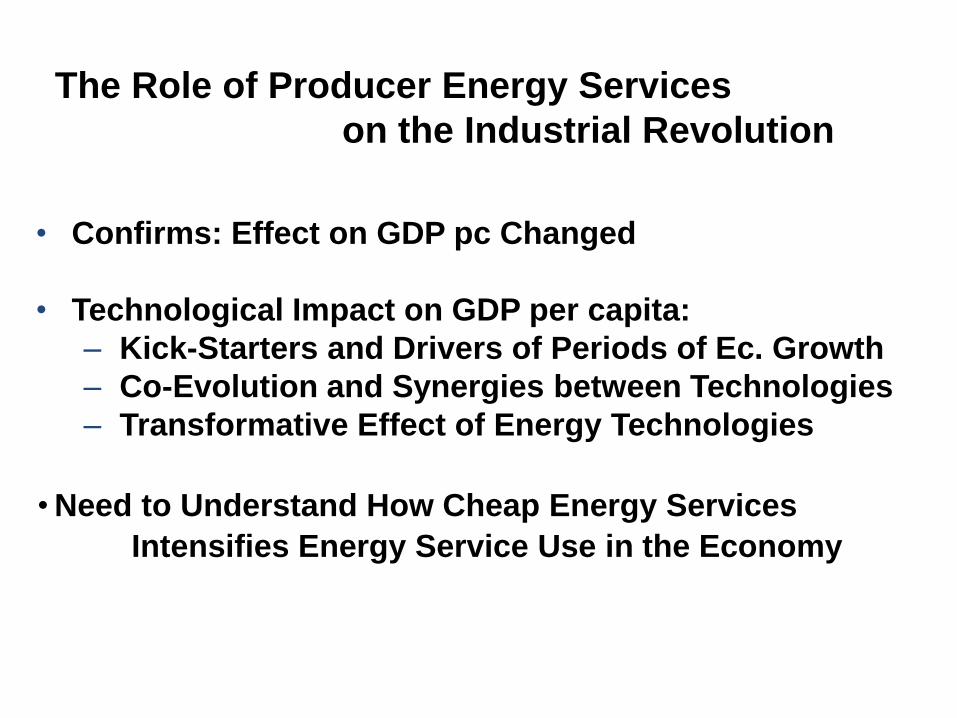
The Role of Producer Energy Services
on the Industrial Revolution
• Confirms: Effect on GDP pc Changed
• Technological Impact on GDP per capita:
– Kick-Starters and Drivers of Periods of Ec. Growth
– Co-Evolution and Synergies between Technologies
– Transformative Effect of Energy Technologies
•Need to Understand How Cheap Energy Services
Intensifies Energy Service Use in the Economy
The Importance of Energy Price Shocks
on Economic Growth
• Kilian (2009), etc..:
Since 1948, Declining Impact of Energy Price Shocks
• Our Hypothesis:
Impact of Energy Price Shocks declined
as Economies Developed
• Separate Shocks into:
– Supply Shocks
– Aggregate Demand Shocks
– Residual/’Speculative’/Energy-Specific Shocks
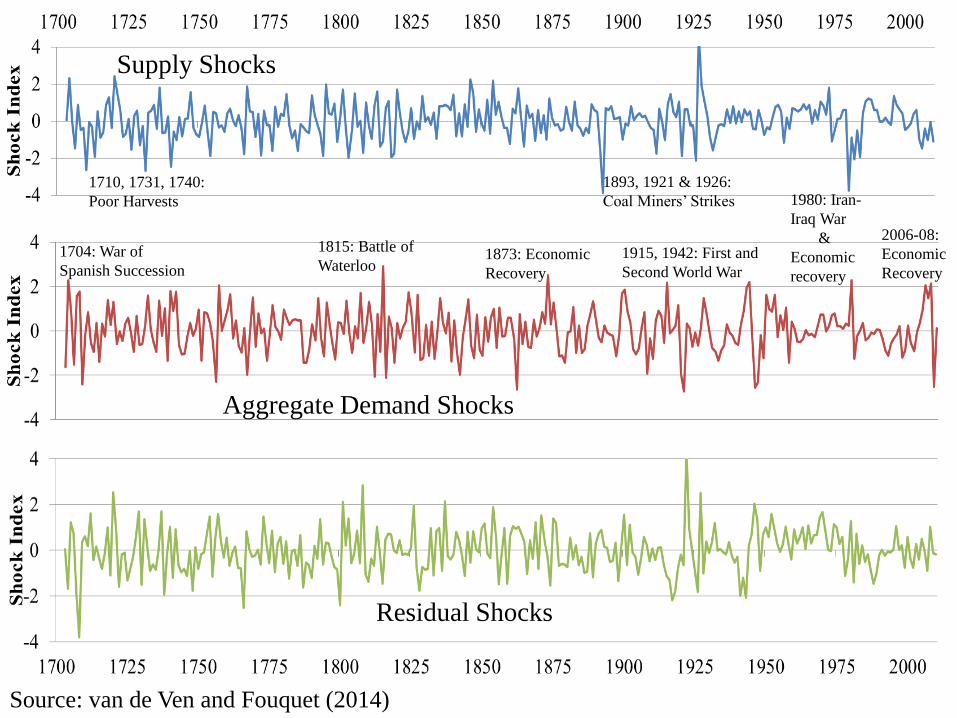
1893, 1921 & 1926:
Coal Miners’ Strikes 1980: Iran-
Iraq War
&
Economic
recovery
1710, 1731, 1740:
Poor Harvests
1815: Battle of
Waterloo 1873: Economic
Recovery
Supply Shocks
Aggregate Demand Shocks
Residual Shocks
Source: van de Ven and Fouquet (2014)
1915, 1942: First and
Second World War
2006-08:
Economic
Recovery
1704: War of
Spanish Succession
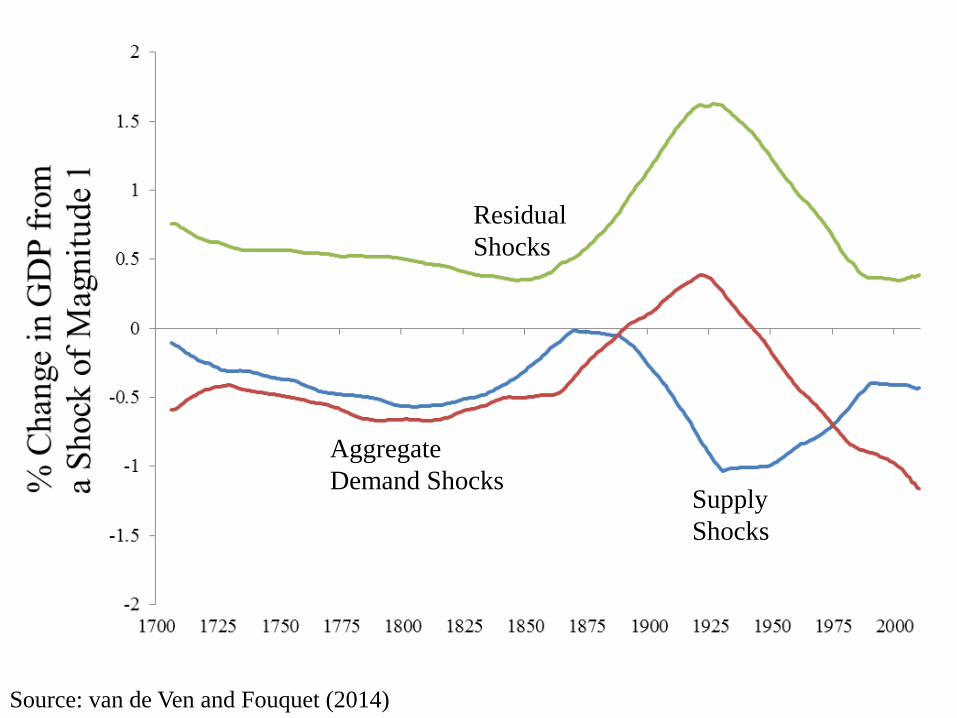
Residual
Shocks
Supply
Shocks
Aggregate
Demand Shocks
Source: van de Ven and Fouquet (2014)
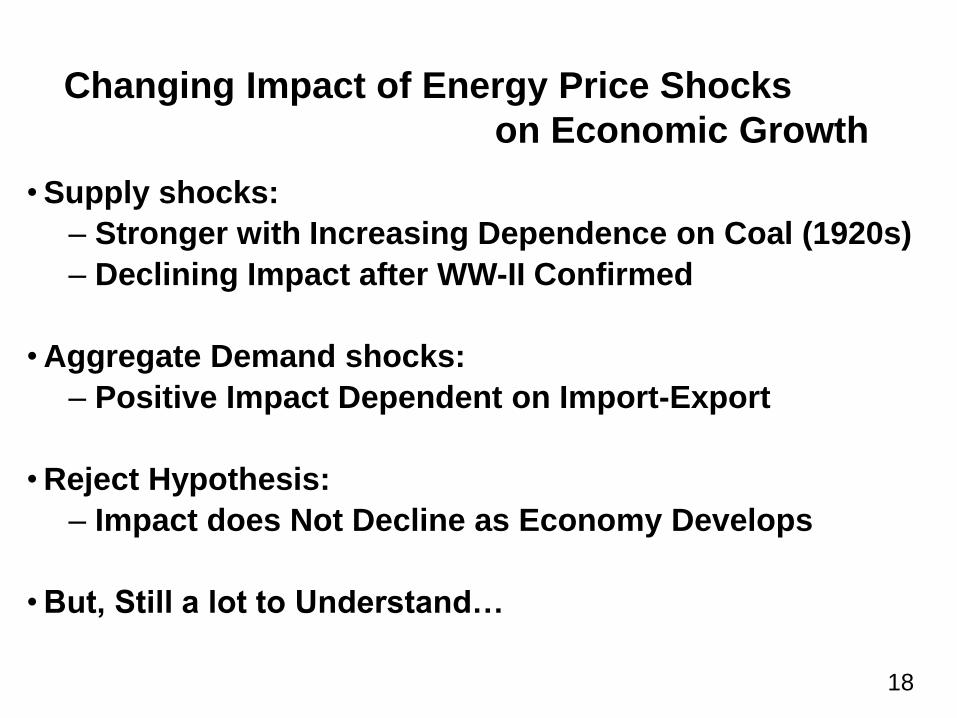
•Supply shocks:
– Stronger with Increasing Dependence on Coal (1920s)
– Declining Impact after WW-II Confirmed
•Aggregate Demand shocks:
– Positive Impact Dependent on Import-Export
•Reject Hypothesis:
– Impact does Not Decline as Economy Develops
•But, Still a lot to Understand…
18
Changing Impact of Energy Price Shocks
on Economic Growth
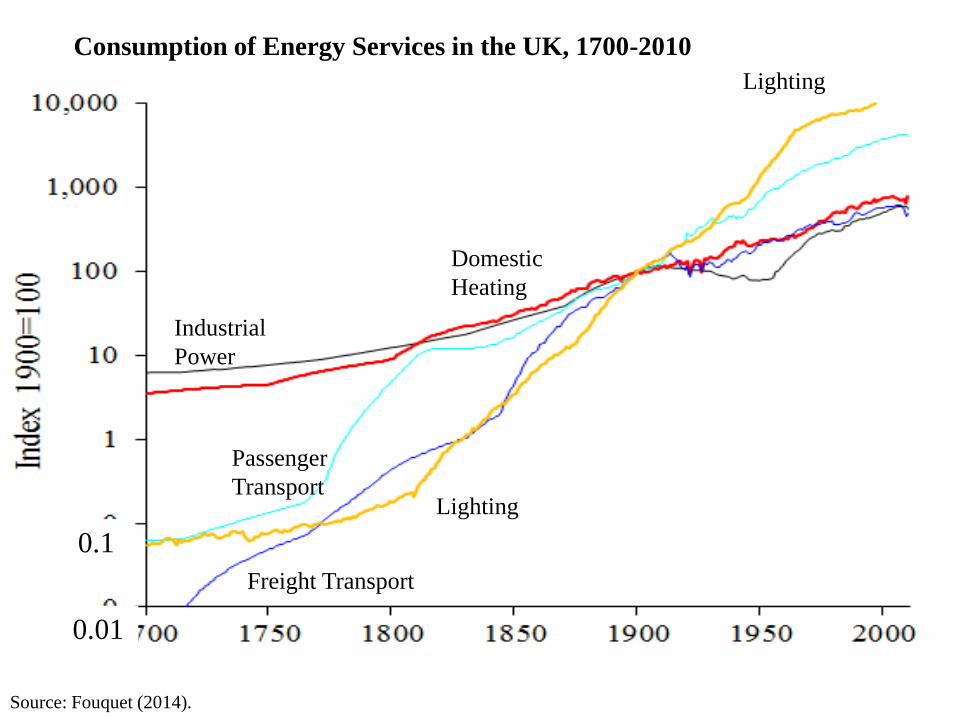
0.1
Domestic
Heating
Industrial
Power
Passenger
Transport
Freight Transport
Lighting
Lighting
0.01
Source: Fouquet (2014).
Consumption of Energy Services in the UK, 1700-2010
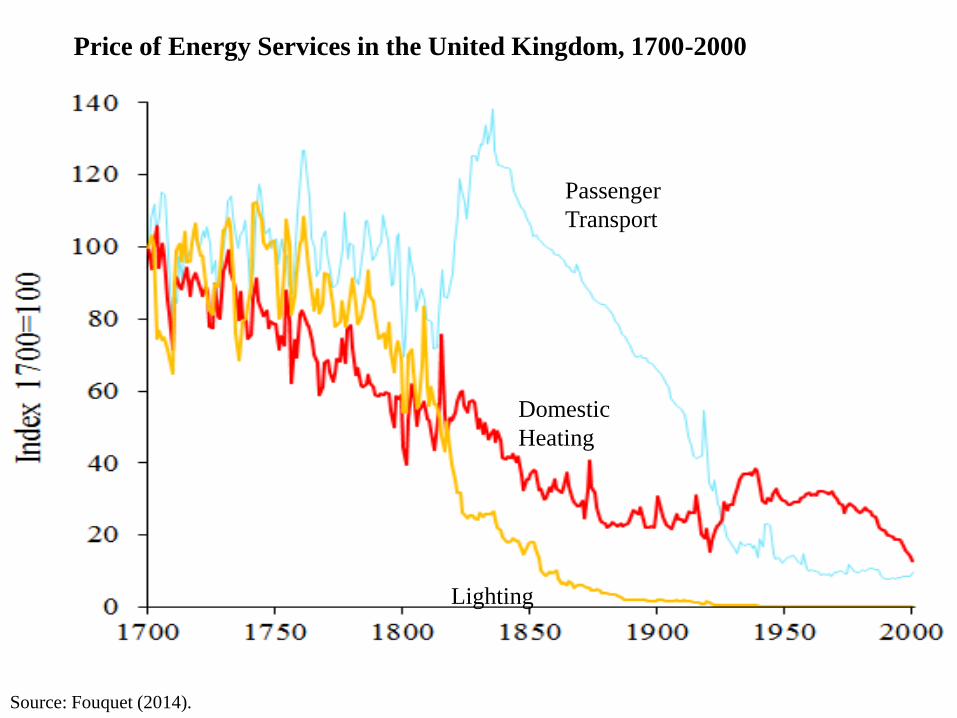
Domestic
Heating
Passenger
Transport
Lighting
Price of Energy Services in the United Kingdom, 1700-2000
Source: Fouquet (2014).
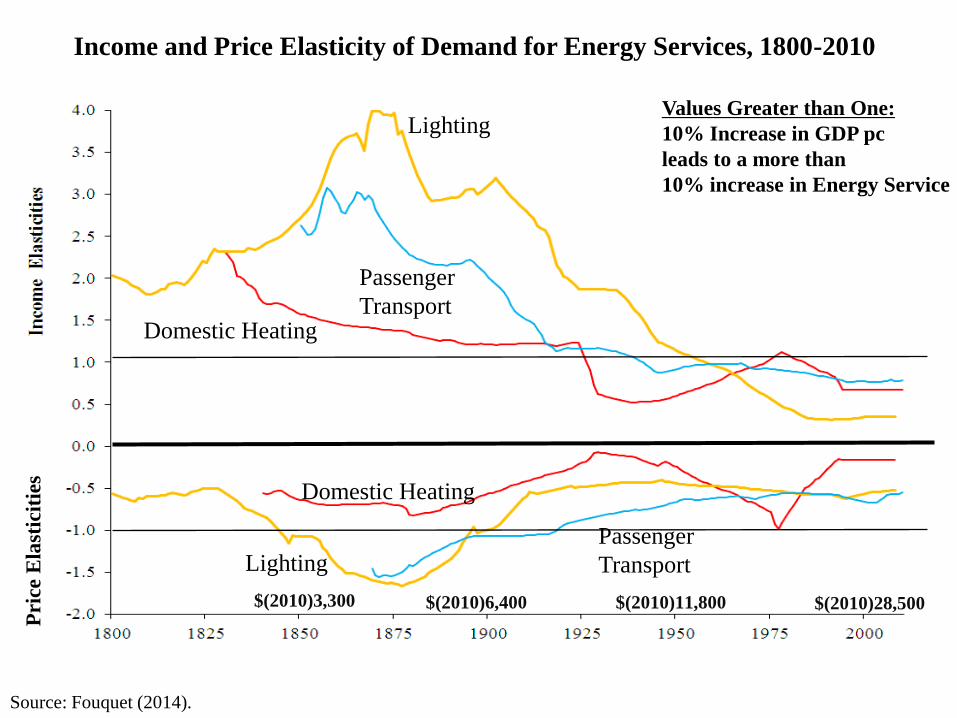
Pri
ce E
last
icit
ies
Domestic Heating
Domestic Heating
Passenger
Transport
Passenger
Transport
Lighting
Lighting
Values Greater than One:
10% Increase in GDP pc
leads to a more than
10% increase in Energy Service
$(2010)3,300 $(2010)6,400 $(2010)11,800 $(2010)28,500
Source: Fouquet (2014).
Income and Price Elasticity of Demand for Energy Services, 1800-2010
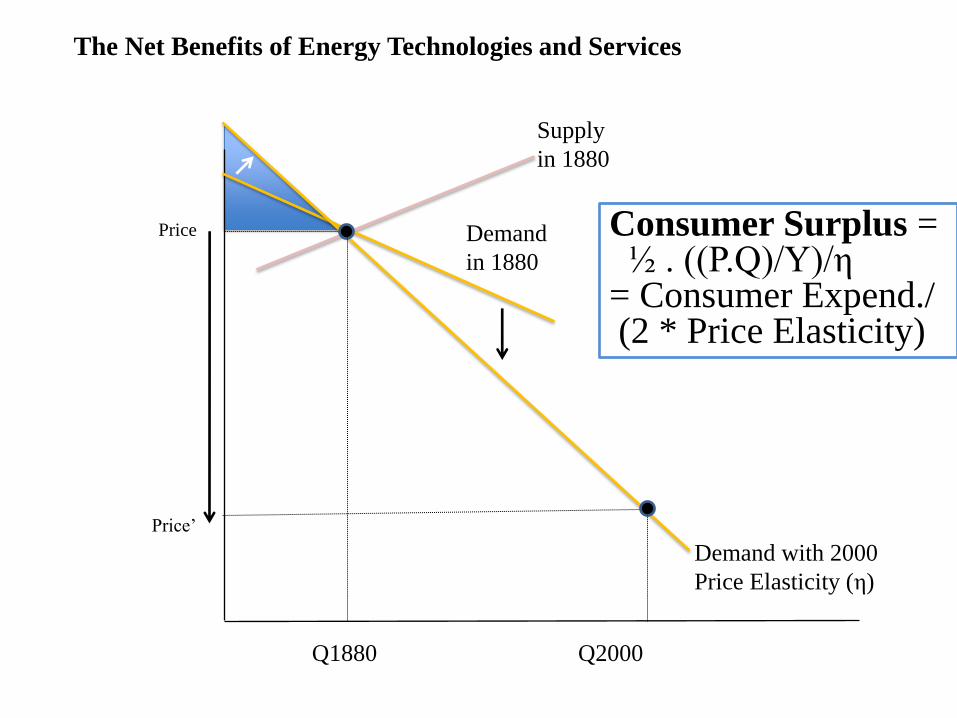
Demand with 2000
Price Elasticity (η)
Demand
in 1880
Price
Price’
Q1880 Q2000
Supply
in 1880
Consumer Surplus = ½ . ((P.Q)/Y)/η = Consumer Expend./ (2 * Price Elasticity)
The Net Benefits of Energy Technologies and Services
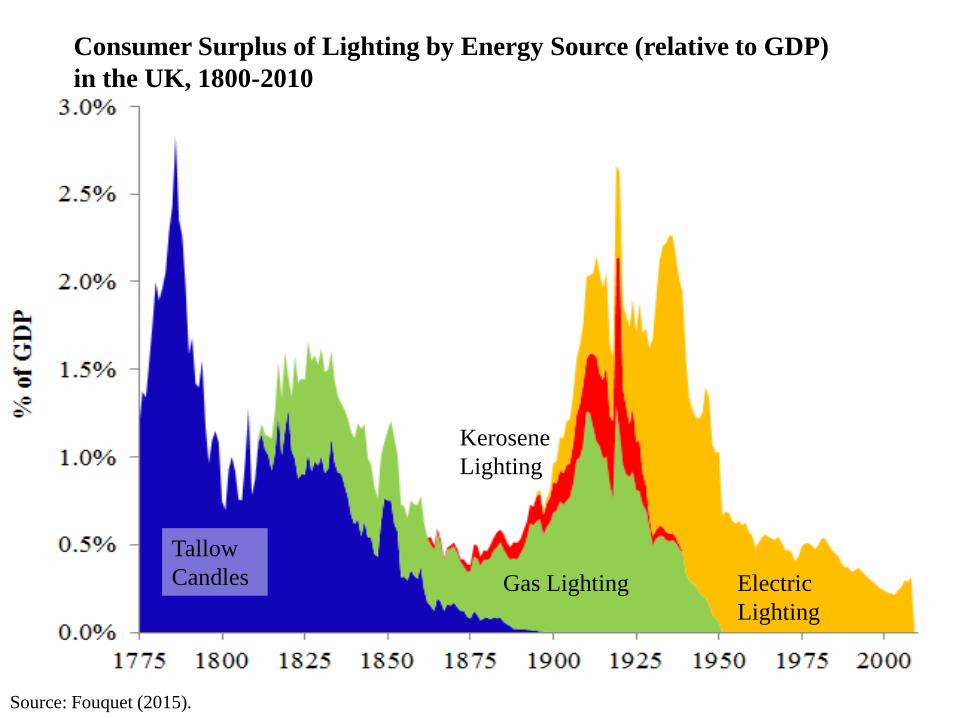
Electric
Lighting
Gas Lighting
Tallow
Candles
Kerosene
Lighting
Source: Fouquet (2015).
Consumer Surplus of Lighting by Energy Source (relative to GDP)
in the UK, 1800-2010
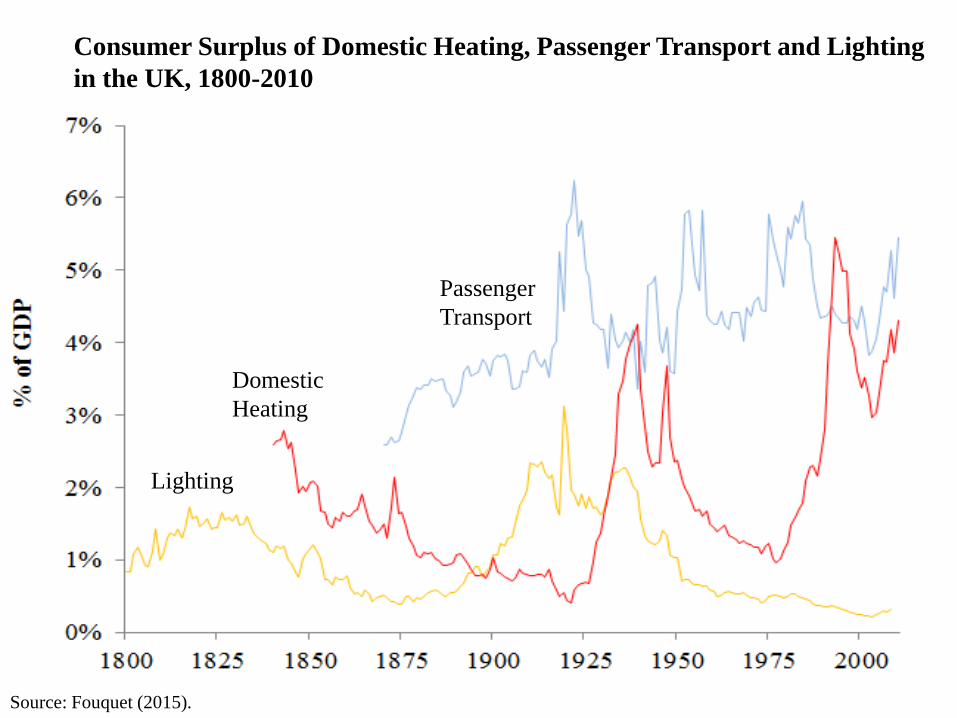
Passenger
Transport
Domestic
Heating
Lighting
Source: Fouquet (2015).
Consumer Surplus of Domestic Heating, Passenger Transport and Lighting
in the UK, 1800-2010
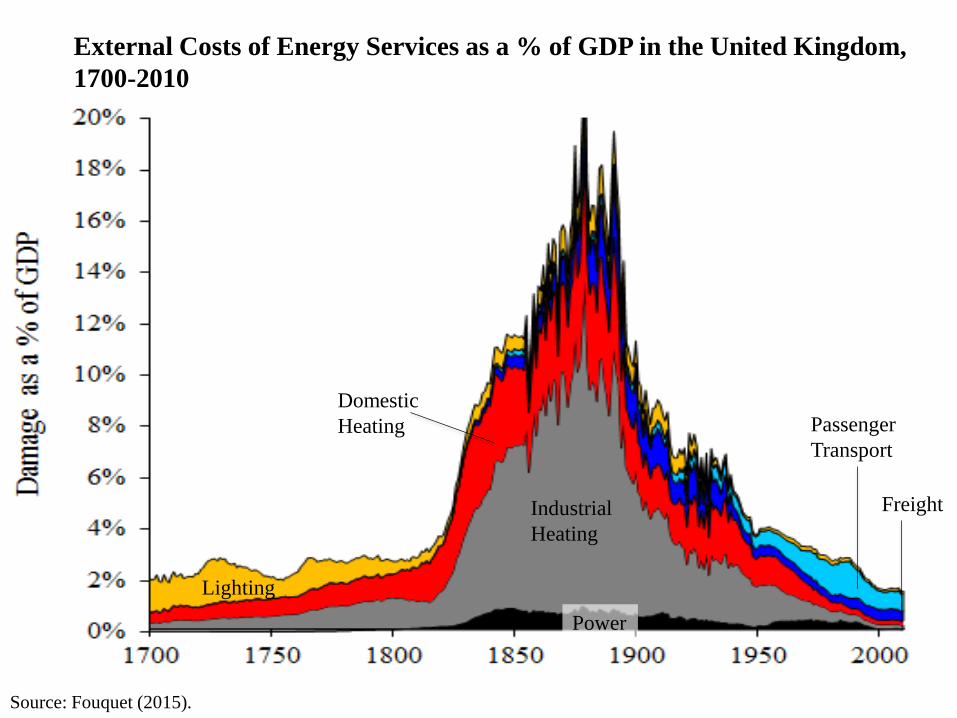
Power
Industrial
Heating
Passenger
Transport
Domestic
Heating
Lighting
Freight
External Costs of Energy Services as a % of GDP in the United Kingdom,
1700-2010
Source: Fouquet (2015).
Passenger
Transport
Domestic
Heating
Lighting
Source: Fouquet (2015).
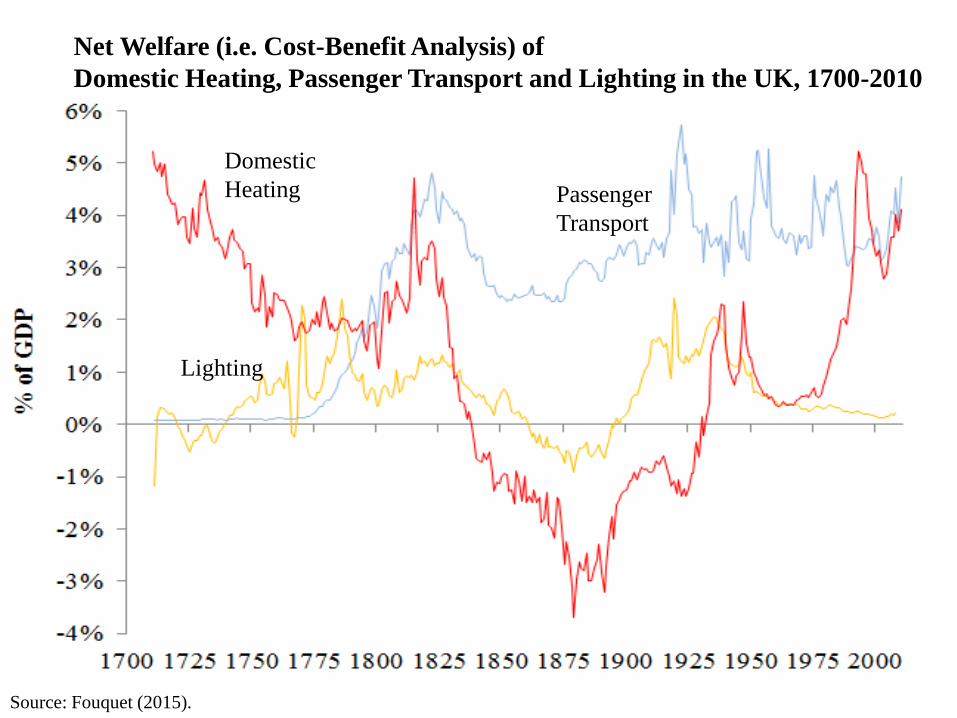
Net Welfare (i.e. Cost-Benefit Analysis) of
Domestic Heating, Passenger Transport and Lighting in the UK, 1700-2010
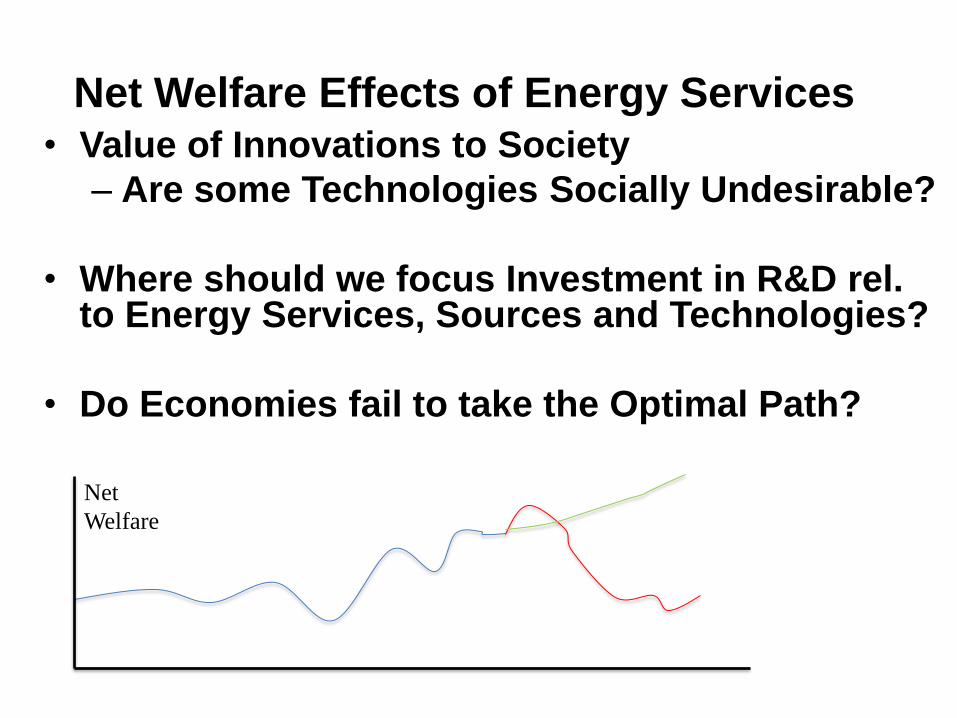
Net Welfare Effects of Energy Services
• Value of Innovations to Society
– Are some Technologies Socially Undesirable?
• Where should we focus Investment in R&D rel. to Energy Services, Sources and Technologies?
• Do Economies fail to take the Optimal Path?
Net
Welfare
Part 3
The Development of the Knowledge Economy
Sweden
Finland
Denmark
Netherlands
Norway
New Zealand
Canada
Germany
Australia
Switzerland
Ireland
United States
United Kingdom
BelgiumIceland
Austria
Hong Kong SAR, China
Estonia
Luxembourg
Spain
Japan
Singapore
France
Israel
Czech Republic
Hungary
SloveniaKorea, Rep.
Italy
Malta
LithuaniaSlovak RepublicPortugal
CyprusGreece
LatviaPolandCroatiaChileBarbados
United Arab Emirates
Bahrain
RomaniaBulgaria
Uruguay
Oman
Malaysia
Serbia
Saudi Arabia
Costa Rica
Trinidad and Tobago
Qatar
Russian Federation
UkraineMacedonia, FYRJamaicaBelarus
Brazil
DominicaMauritius
Argentina
Kuwait
Panama
ThailandSouth AfricaGeorgia
Turkey
Bosnia and HerzegovinaArmenia
MexicoKazakhstan
PeruJordanColombia
MoldovaGuyanaAzerbaijanTunisia
Lebanon
AlbaniaMongoliaChinaBotswana
Venezuela, RB
El SalvadorNamibiaDominican Republic
ParaguayPhilippinesFijiIran, Islamic Rep.
Kyrgyz RepublicAlgeriaEgypt, Arab Rep.EcuadorGuatemalaBoliviaSri LankaMoroccoVietnamUzbekistanTajikistan
SwazilandIndonesiaHondurasIndiaKenyaGhanaSenegalNicaraguaZambiaPakistanUgandaNigeriaZimbabweLesothoYemen, Rep.MalawiBurkina FasoBeninMaliRwandaTanzaniaMadagascarMozambiqueLao PDRCambodiaCameroonMauritaniaNepalCote d'IvoireBangladeshSudanDjiboutiEthiopiaGuineaEritrea
Angola
Sierra Leone0
200
00
400
00
600
00
800
00
100
00
0
GD
P p
er
ca
pita
(cu
rren
t U
S$
)
0 2 4 6 8 10KEI
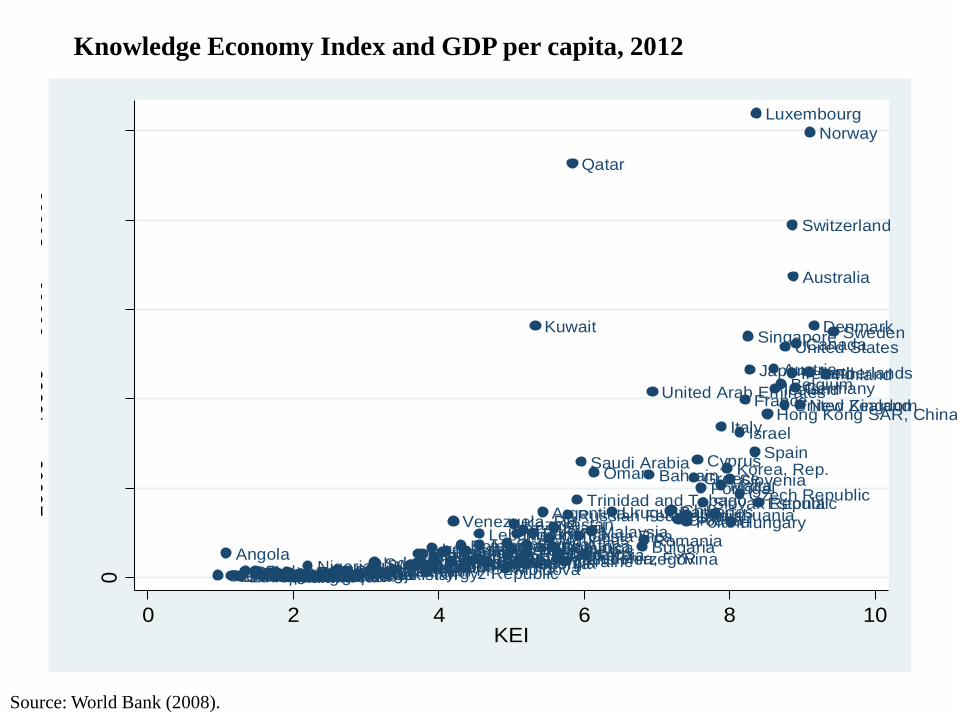
Knowledge Economy Index and GDP per capita, 2012
Source: World Bank (2008).

Pillars of the Knowledge Economy
• Human Capital
• Information and Communication Technologies and Infrastructure
• Knowledge Production and Innovation System
• Seeking to Understand
the Development of Knowledge Economy
The Role of the Knowledge Economy
in Green Growth
• Potential for Low-Energy/Resource Growth
• Dematerialisation of the Economy
• Lessons from History of Governance
– Openness to Change
– Investments in Public Goods
• Why the Shift from Low to High Human Capital?
• Was it Demand- or Supply (ICT)-Driven?
• Were there Market or Government Failures?
• What Role did Government Play?
• What Lessons does the Transition offer?
The Human Capital Transition
• Gutenberg Press (Late 1440s)
– Responding to Demand
– Revolutionised
• Government/Authorities Response
– Europe:
• Church Initially Positive
• Governments: Lack of Power to Control
– Ottoman Empire: Effective Ban
– Korea: Strong State Control
The Printing Press (ICT) and Government
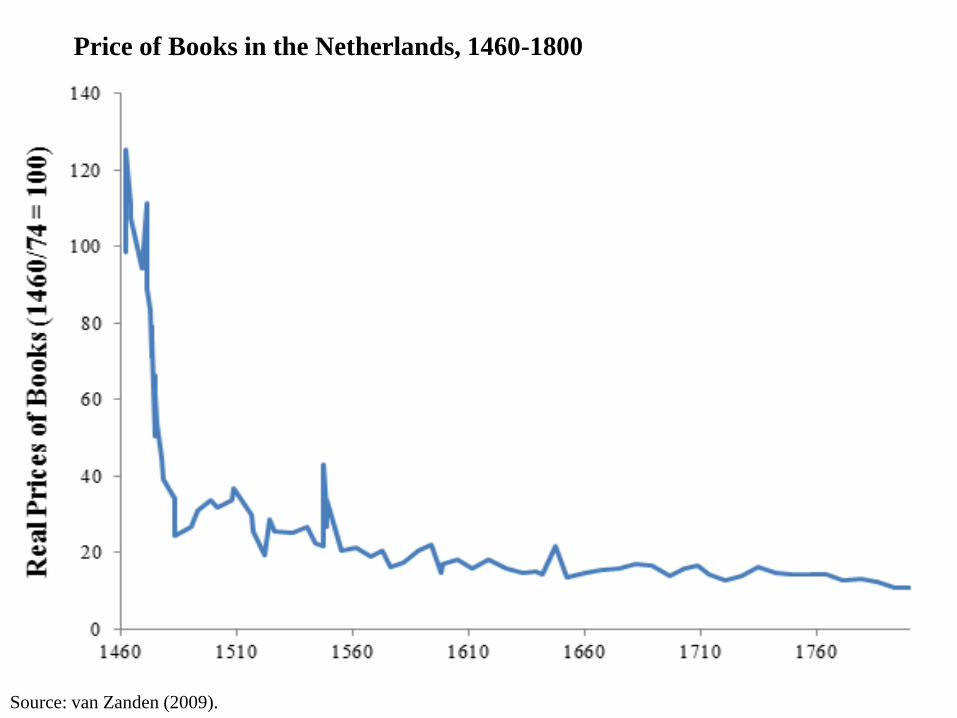
Source: van Zanden (2009).
Price of Books in the Netherlands, 1460-1800
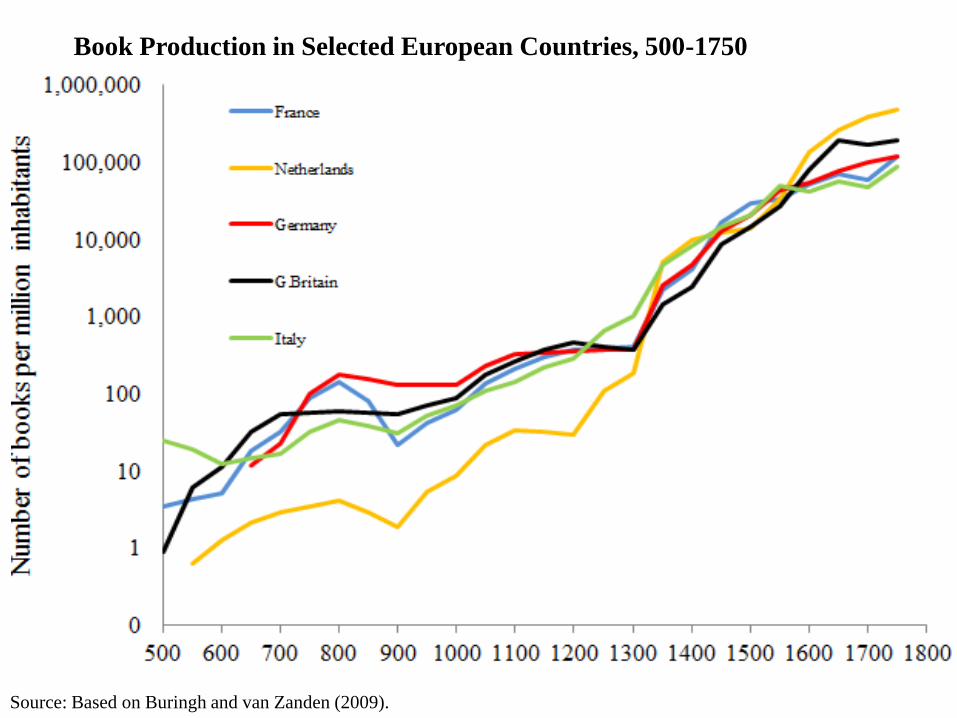
Source: Based on Buringh and van Zanden (2009).
Book Production in Selected European Countries, 500-1750

European Human Capital Transition
• Supply
– Cheaper Books (1460-1600, 1800s)
– Church Provider of Education
• Private Demand (Religious, Political, ...)
– Broader Interest amongst Wealthier Pop.
• ‘Public’ Demand
– Military: Educated Soldiers
– Industrialists: Educated Worker
• Public Education
– Direct Benefit: Moulding Minds of Nation State
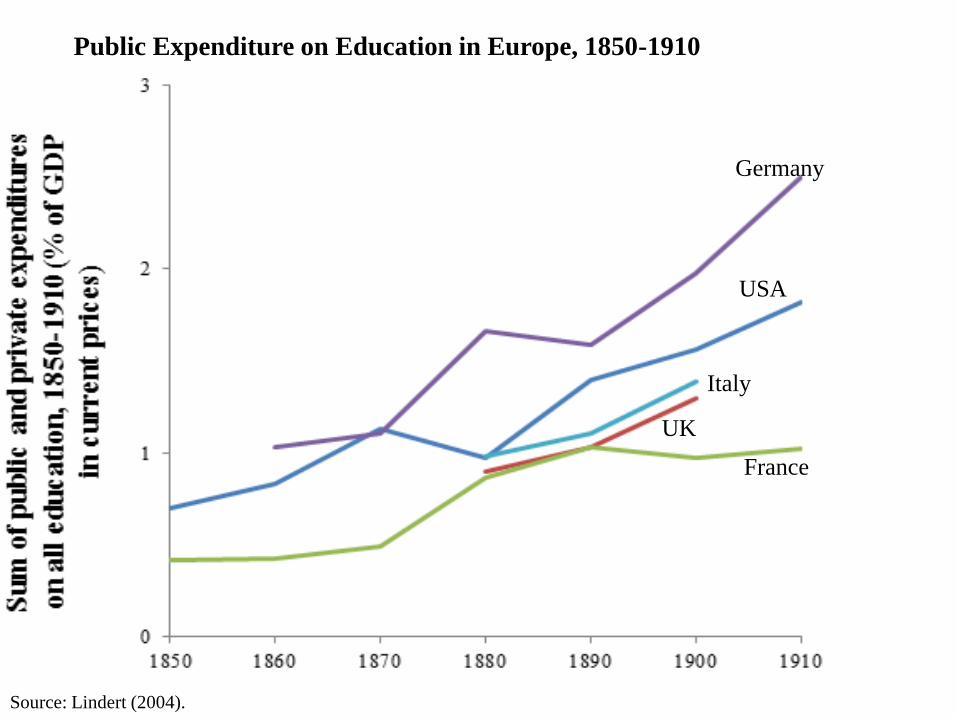
Public Expenditure on Education in Europe, 1850-1910
Source: Lindert (2004).
Germany
UK
Italy
USA
France
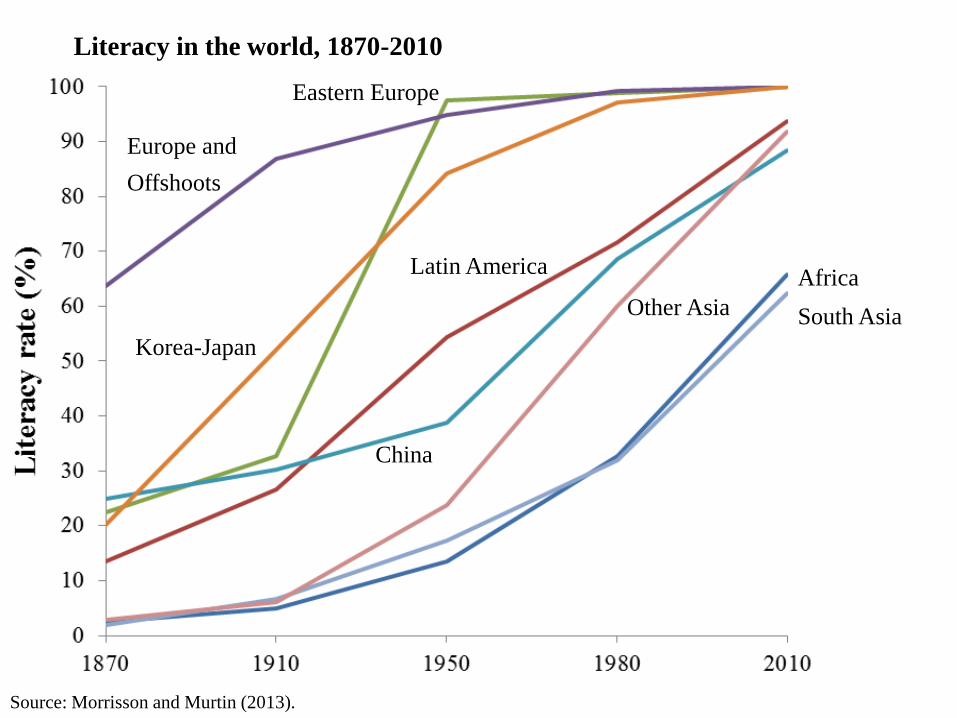
Literacy in the world, 1870-2010
Source: Morrisson and Murtin (2013).
Africa Latin America
Eastern Europe
Korea-Japan
Europe and
Offshoots
China
Other Asia South Asia
Creating a Learning Society
• Mokyr (2009): “Economic Change in all periods depends […] on What People Believe”
• Stiglitz and Greenwald (2014):
– Attitudes to Change are Crucial
– Social Construction of Learning
Belief Systems
– Government Needs to Correct Market Failures to Create Dynamic Learning Economy
Towards a Dematerialised Economy?
• ICT: Pillar of the Knowledge Economy
• What Insights from ICT for Dematerialisation?
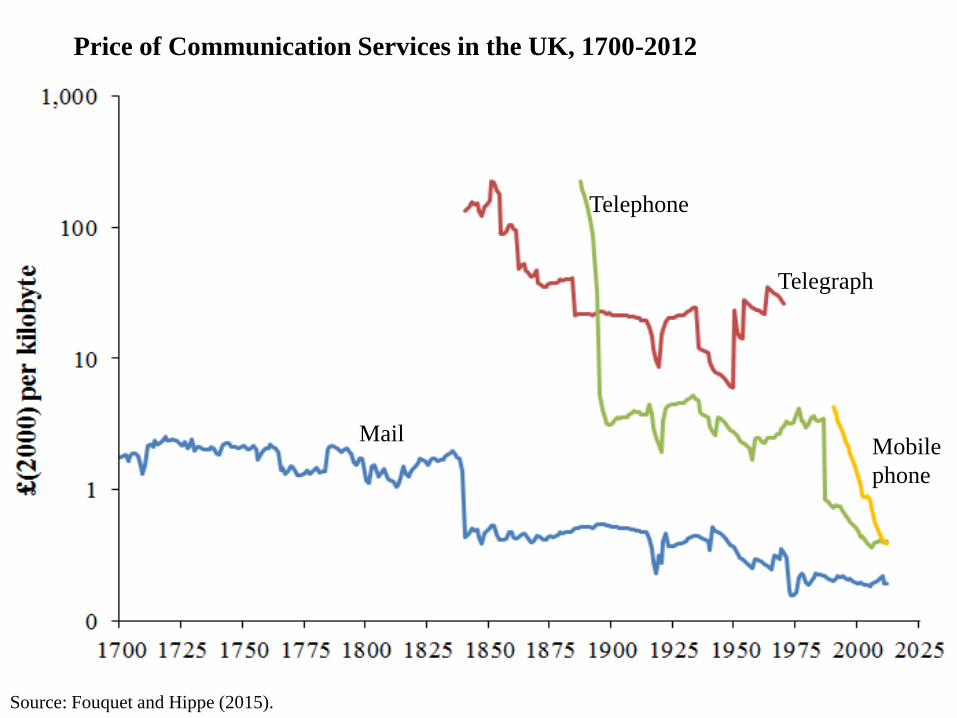
Telegraph
Telephone Mobile
Phone
Source: Fouquet and Hippe (2015).
Price of Communication Services in the UK, 1700-2012
Telegraph
Telephone
Mail Mobile
phone
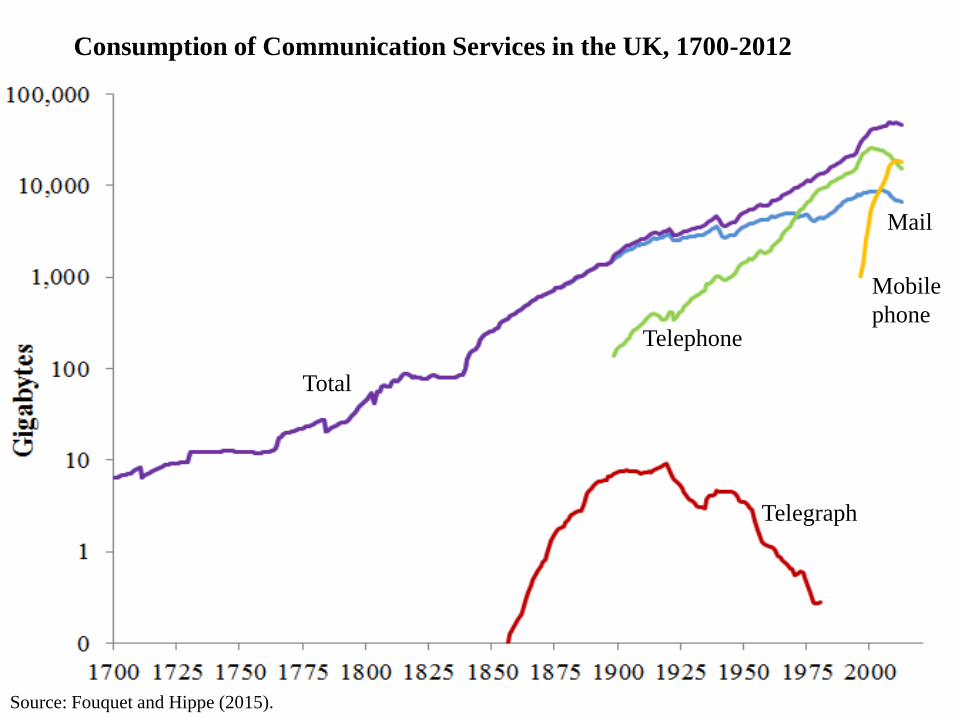
Source: Fouquet and Hippe (2015).
Consumption of Communication Services in the UK, 1700-2012
Telegraph
Telephone
Mobile
phone
Total
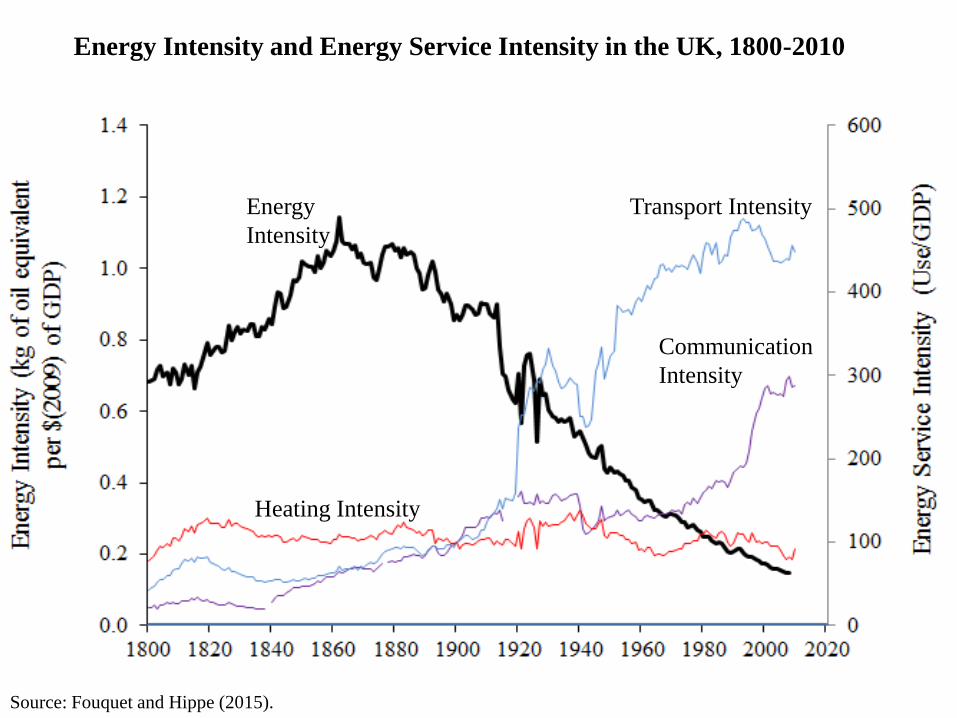
Energy Intensity and Energy Service Intensity in the UK, 1800-2010
Communication
Intensity
Energy
Intensity
Source: Fouquet and Hippe (2015).
Transport Intensity
Heating Intensity
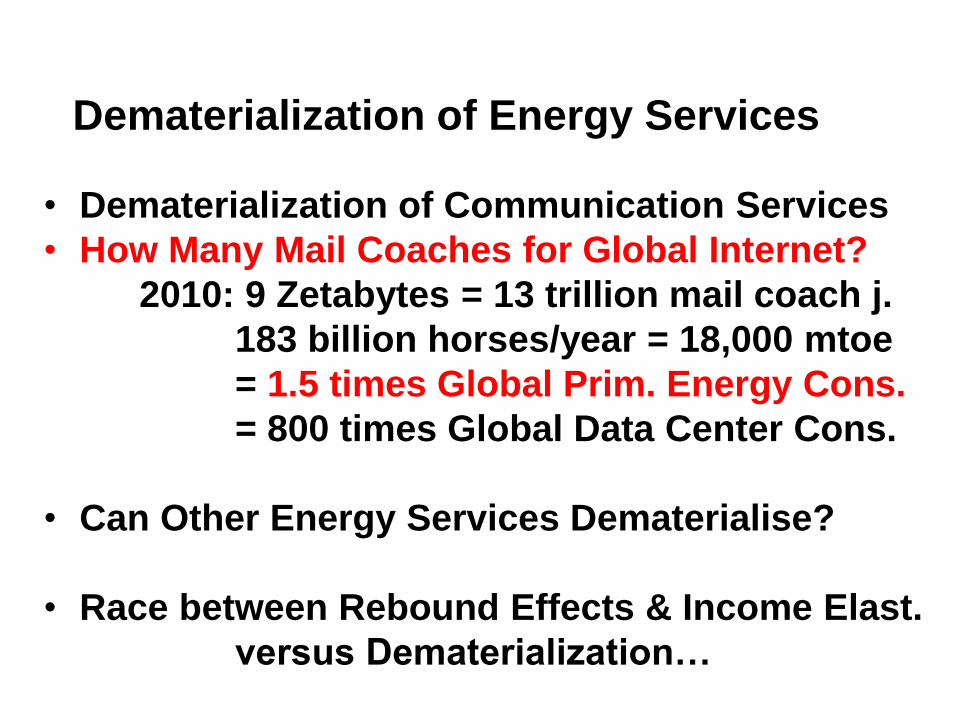
Dematerialization of Energy Services
• Dematerialization of Communication Services
• How Many Mail Coaches for Global Internet?
2010: 9 Zetabytes = 13 trillion mail coach j.
183 billion horses/year = 18,000 mtoe
= 1.5 times Global Prim. Energy Cons.
= 800 times Global Data Center Cons.
• Can Other Energy Services Dematerialise?
• Race between Rebound Effects & Income Elast.
versus Dematerialization…
Part 5
Lessons and Conclusions
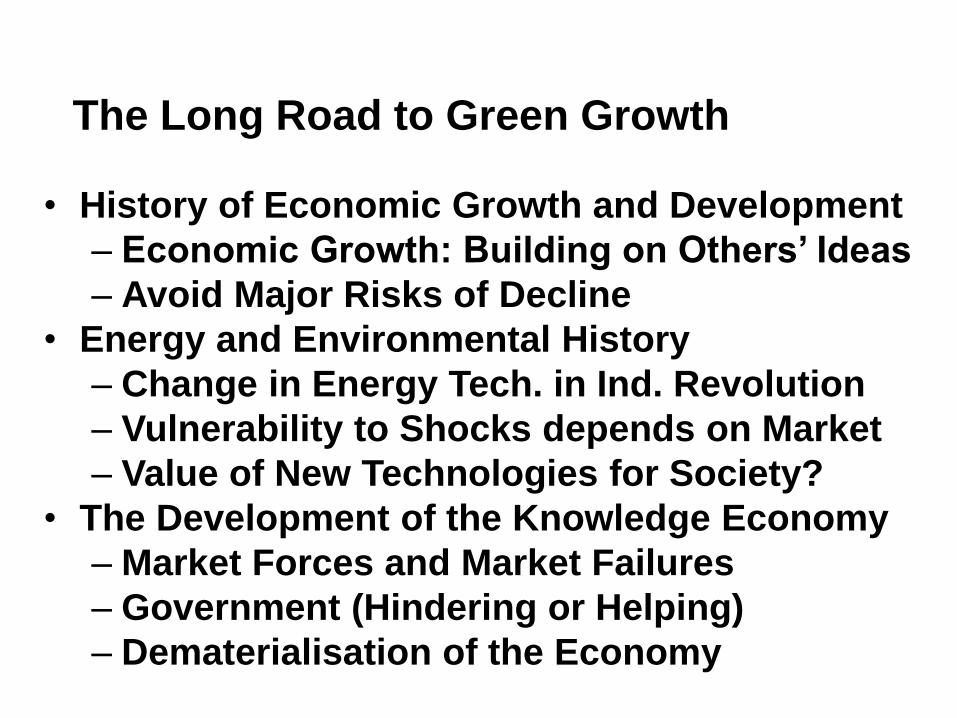
• History of Economic Growth and Development
– Economic Growth: Building on Others’ Ideas
– Avoid Major Risks of Decline
• Energy and Environmental History
– Change in Energy Tech. in Ind. Revolution
– Vulnerability to Shocks depends on Market
– Value of New Technologies for Society?
• The Development of the Knowledge Economy
– Market Forces and Market Failures
– Government (Hindering or Helping)
– Dematerialisation of the Economy
The Long Road to Green Growth
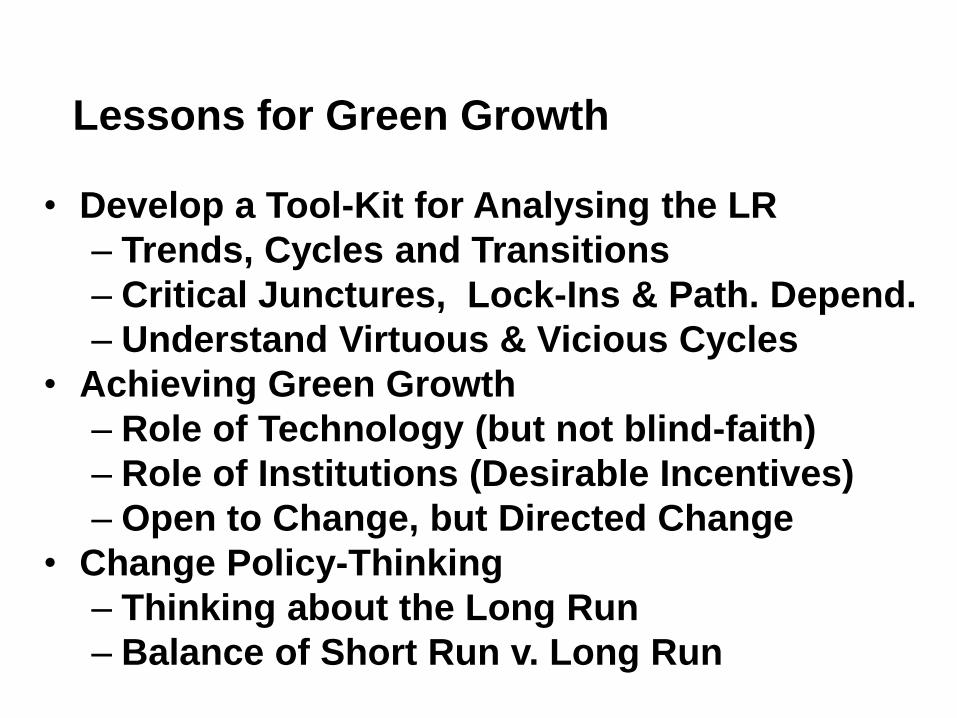
• Develop a Tool-Kit for Analysing the LR
– Trends, Cycles and Transitions
– Critical Junctures, Lock-Ins & Path. Depend.
– Understand Virtuous & Vicious Cycles
• Achieving Green Growth
– Role of Technology (but not blind-faith)
– Role of Institutions (Desirable Incentives)
– Open to Change, but Directed Change
• Change Policy-Thinking
– Thinking about the Long Run
– Balance of Short Run v. Long Run
Lessons for Green Growth

Concerns about
the Use of History (Woolcock JDS 2011):
• History Cannot provide Direct Lessons
• Each time and place is Unique
• Can the ‘Future’ be guided by human reason?
• The Use of History unleashes undesirable Consequences (Stalin, Hitler, Pol Pot)
• The Complexity of History will be Lost
• Agencies (WB, ...) tend to embrace Single Path
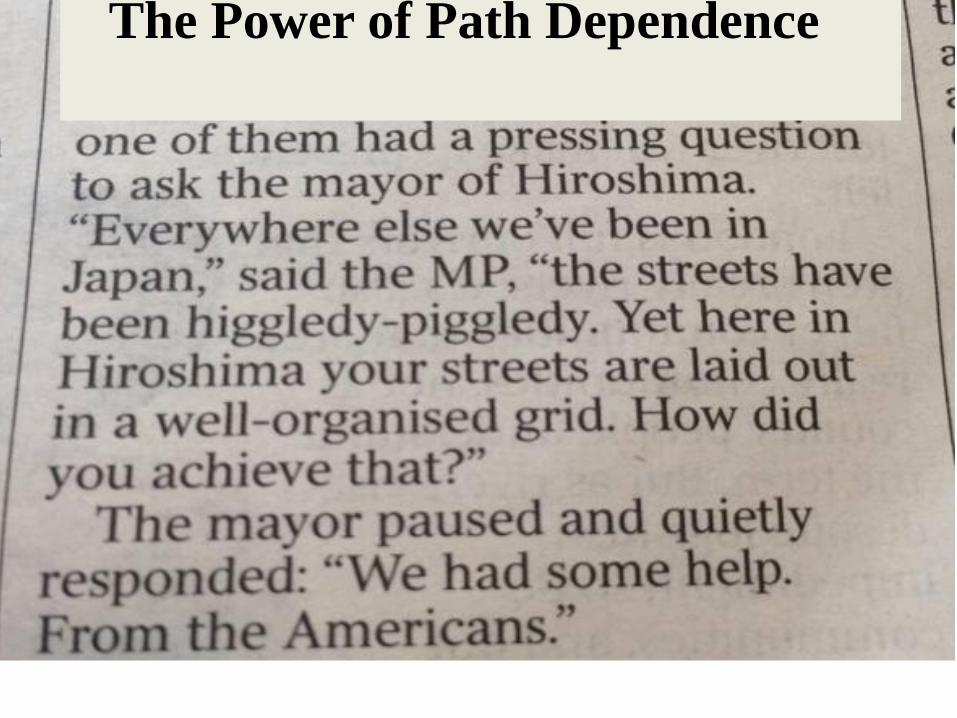
The Power of Path Dependence
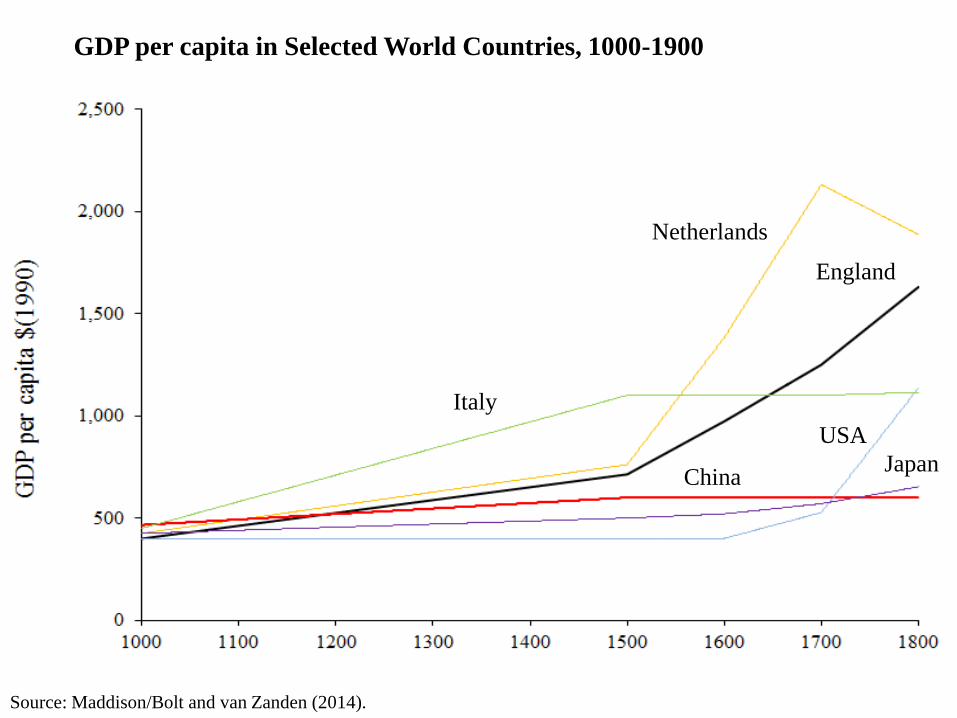
Netherlands
England
Japan China
USA
Italy
Source: Maddison/Bolt and van Zanden (2014).
GDP per capita in Selected World Countries, 1000-1900
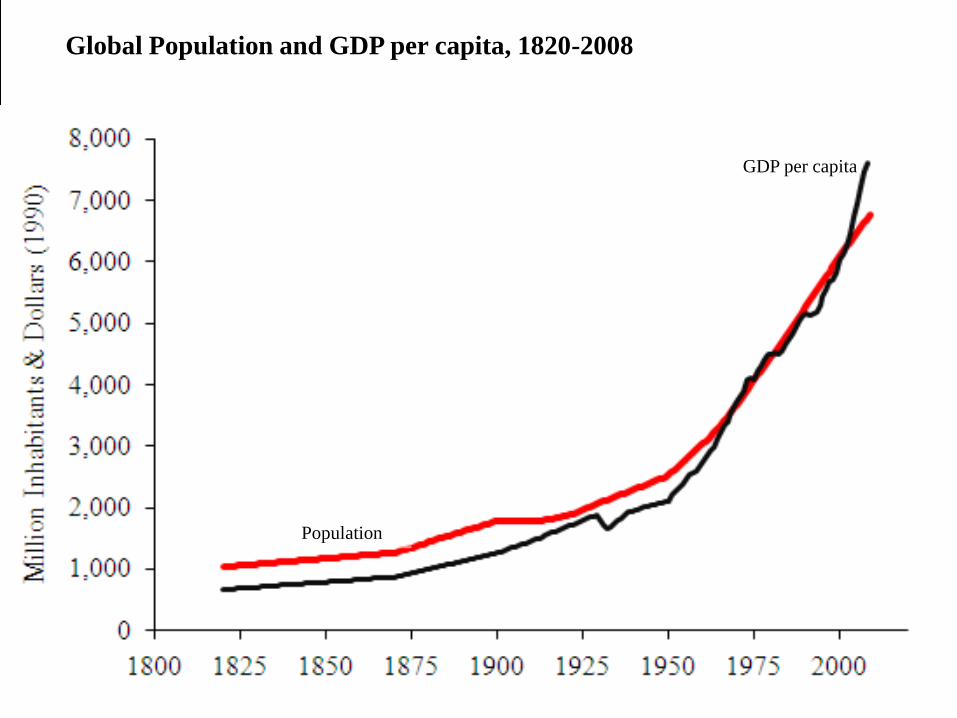
Population
Global Population and GDP per capita, 1820-2008
GDP per capita
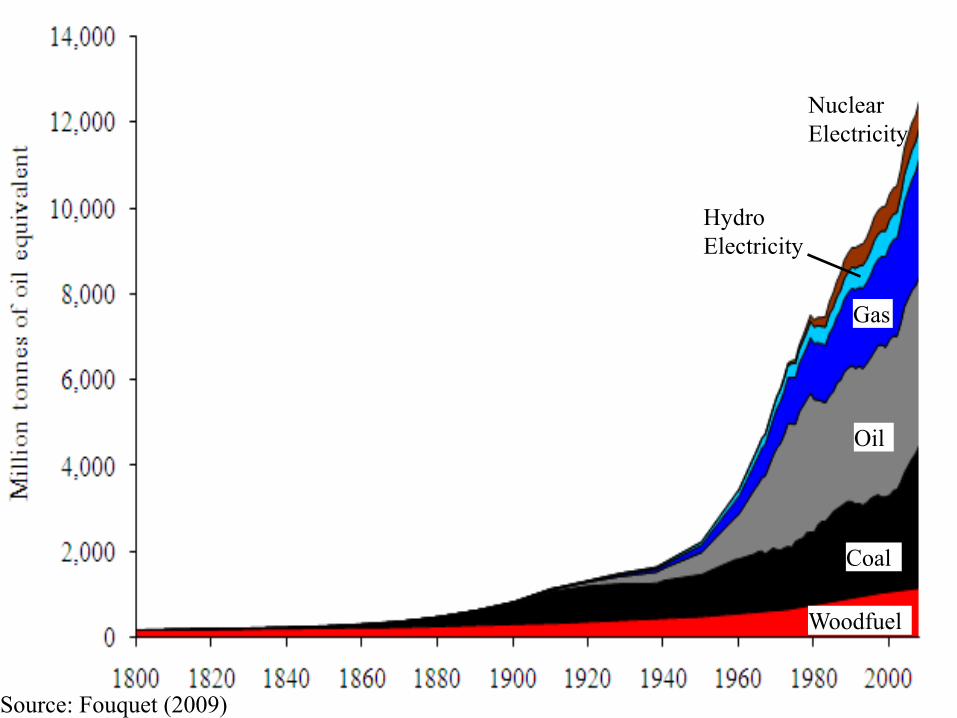
Nuclear
Electricity
Coal
Oil
Gas
Woodfuel
Hydro
Electricity
Source: Fouquet (2009)
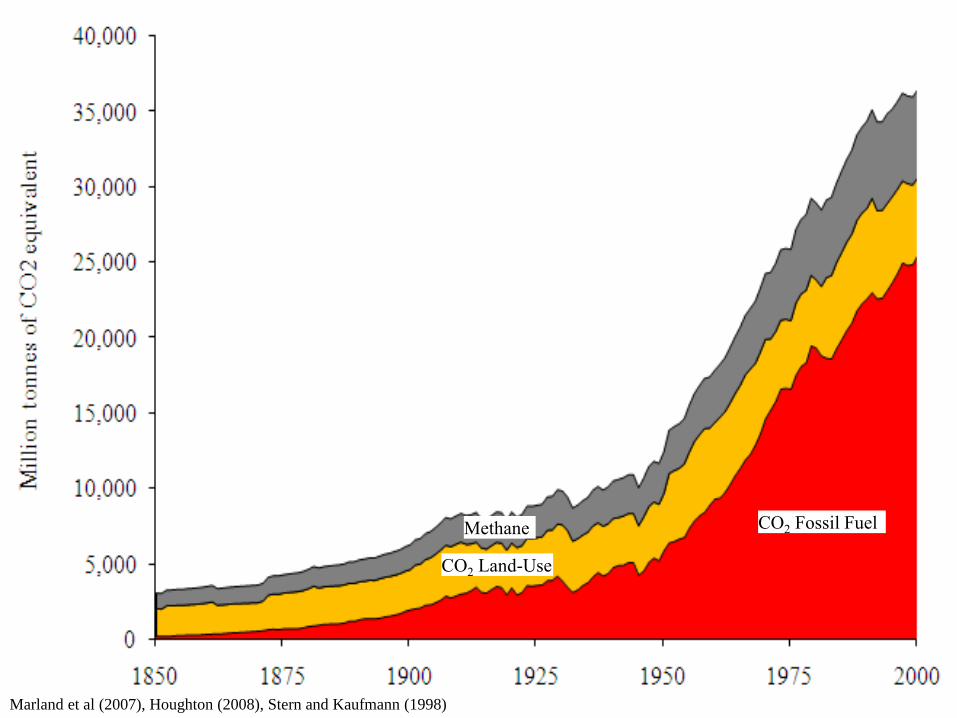
CO2 Land-Use
Methane CO2 Fossil Fuel
Marland et al (2007), Houghton (2008), Stern and Kaufmann (1998)
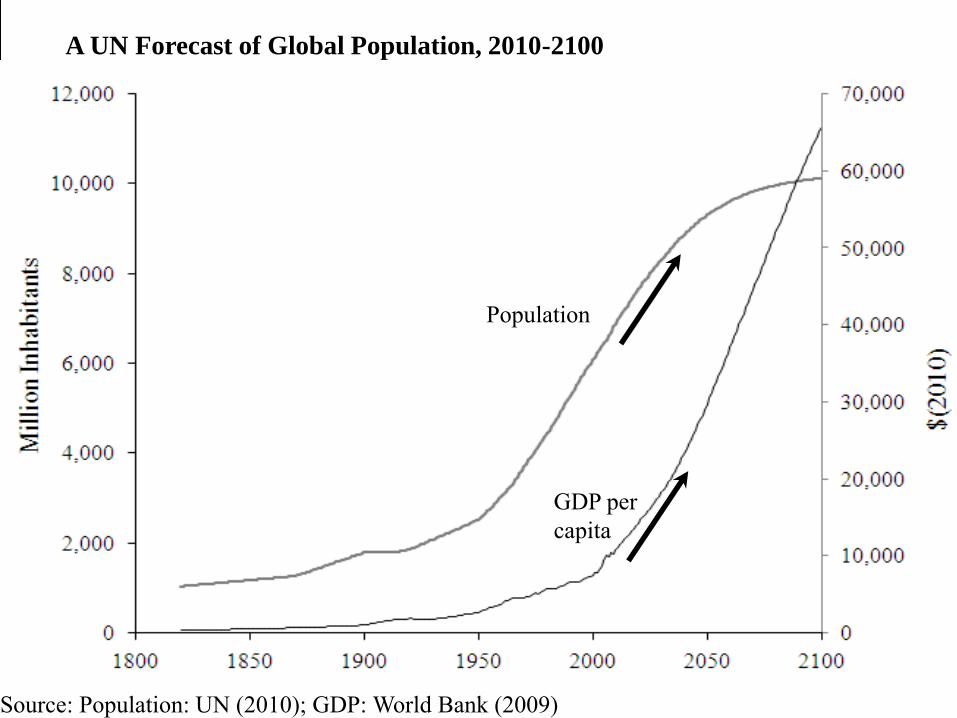
Population
GDP per
capita
Source: Population: UN (2010); GDP: World Bank (2009)
A UN Forecast of Global Population, 2010-2100
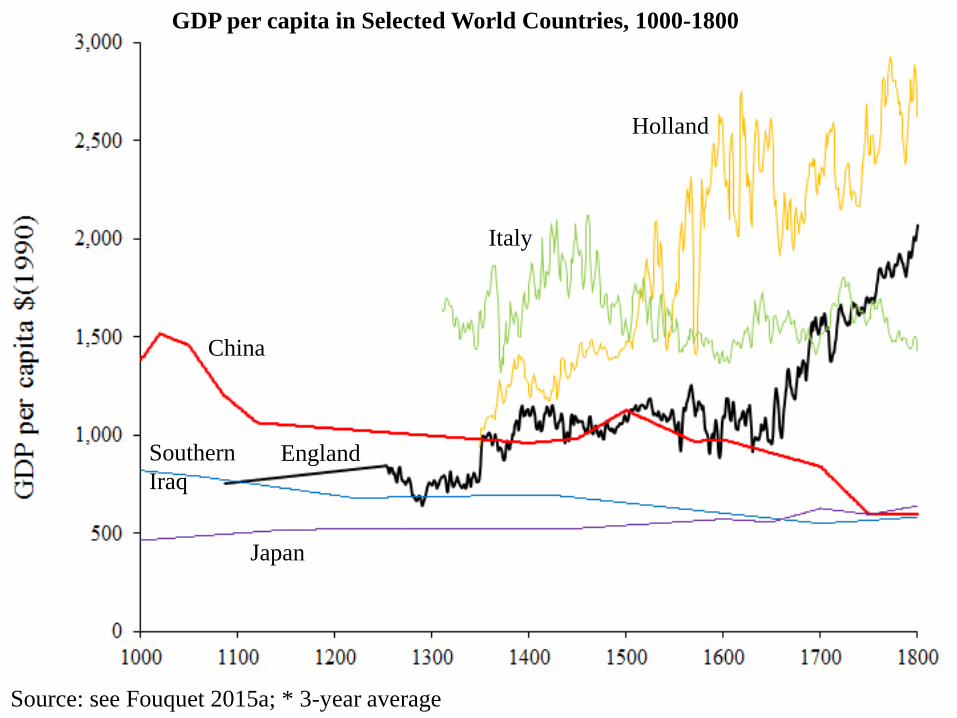
Holland
England
Source: see Fouquet 2015a; * 3-year average
Southern
Iraq
China
Italy
Japan
GDP per capita in Selected World Countries, 1000-1800
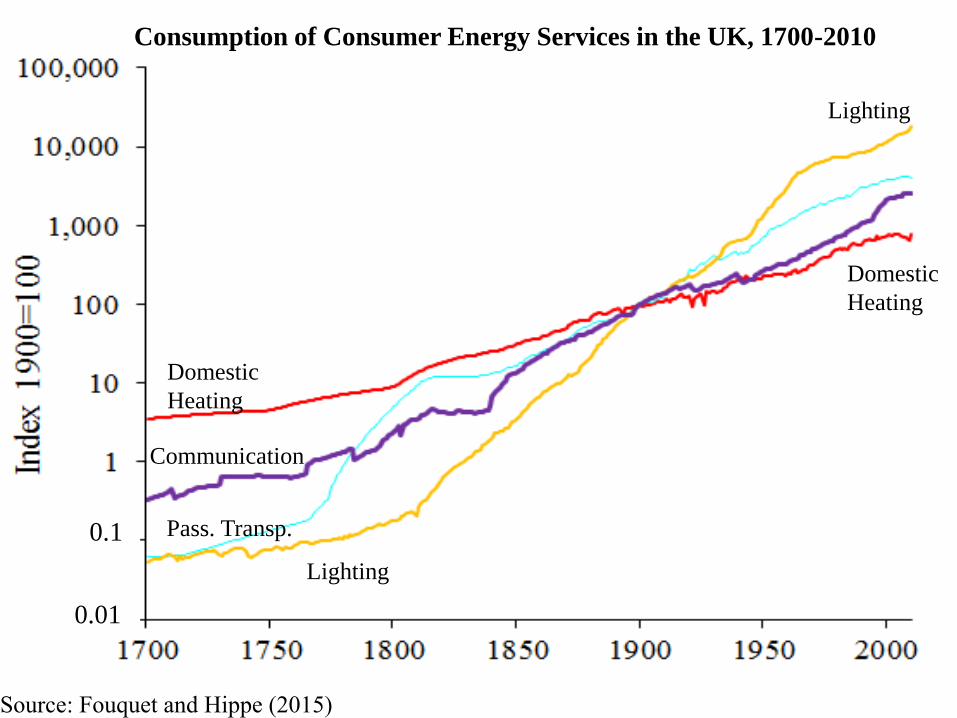
0.1
Domestic
Heating
Pass. Transp.
Communication
Lighting
Lighting
0.01
Consumption of Consumer Energy Services in the UK, 1700-2010
Domestic
Heating
Source: Fouquet and Hippe (2015)
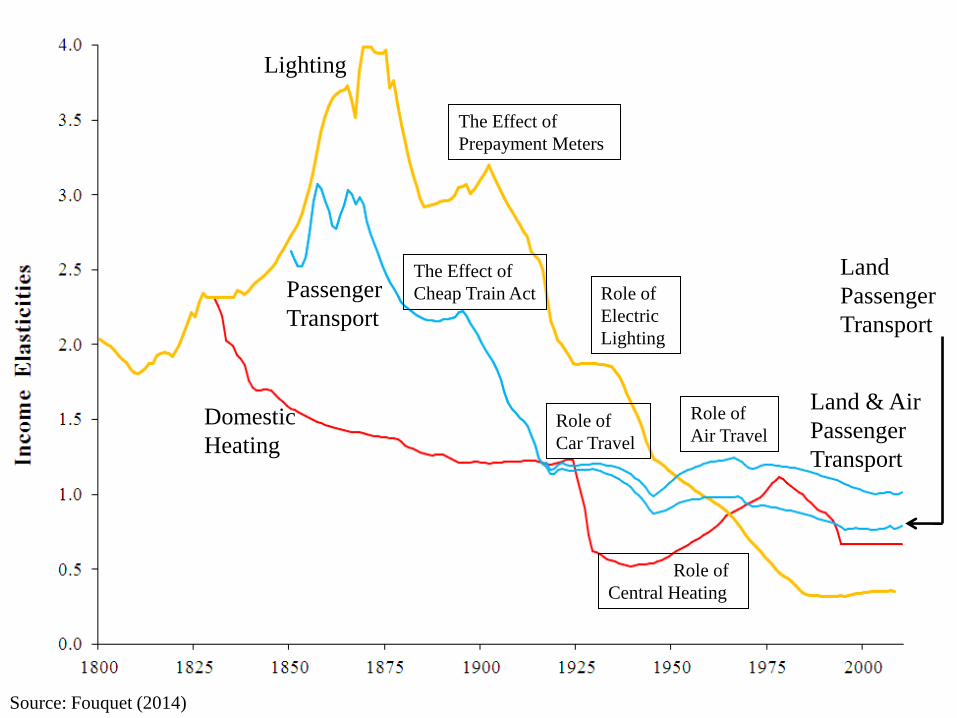
Domestic
Heating
Source: Fouquet (2014)
Passenger
Transport Role of
Electric
Lighting
Lighting
Role of
Air Travel
Role of
Central Heating
Role of
Car Travel
Land & Air
Passenger
Transport
Land
Passenger
Transport
The Effect of
Prepayment Meters
The Effect of
Cheap Train Act
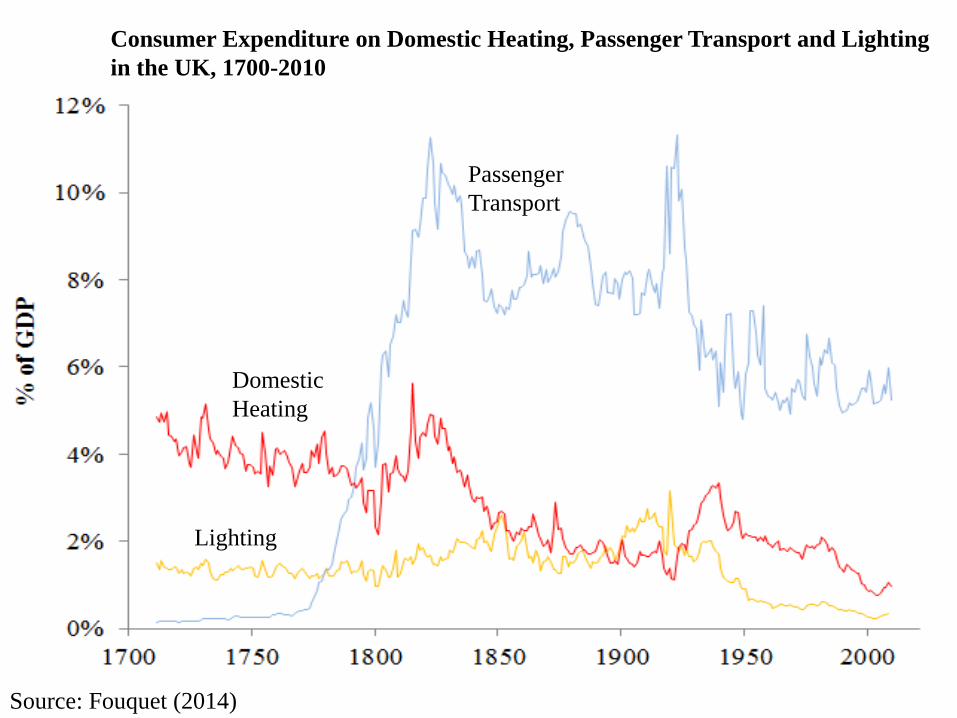
Passenger
Transport
Domestic
Heating
Source: Fouquet (2014)
Consumer Expenditure on Domestic Heating, Passenger Transport and Lighting
in the UK, 1700-2010
Lighting
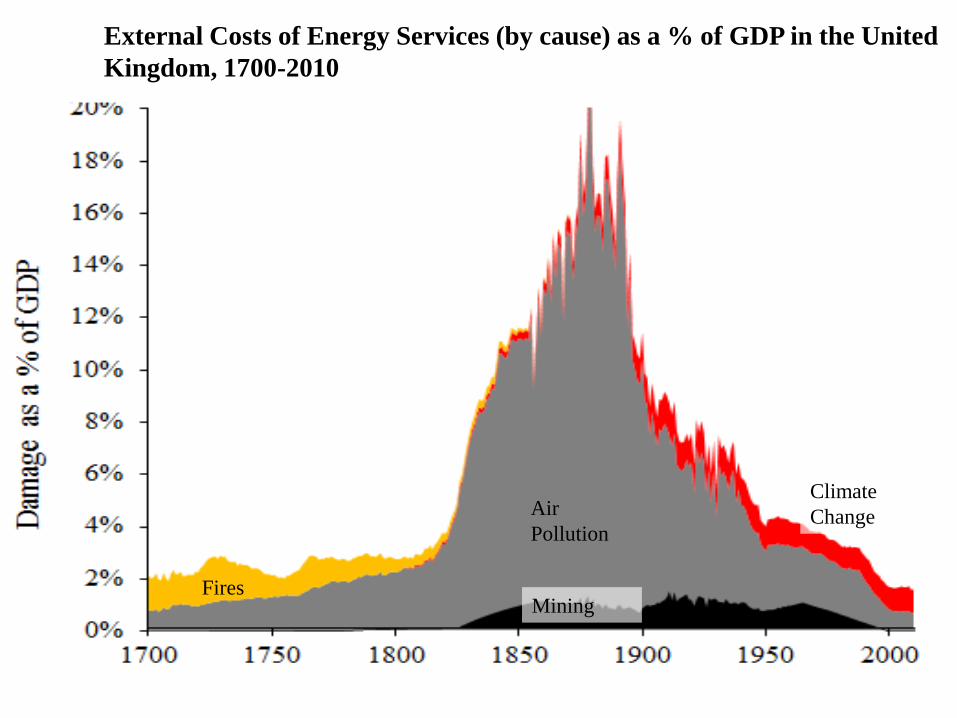
Mining
Air
Pollution
Climate
Change
Fires
External Costs of Energy Services (by cause) as a % of GDP in the United
Kingdom, 1700-2010
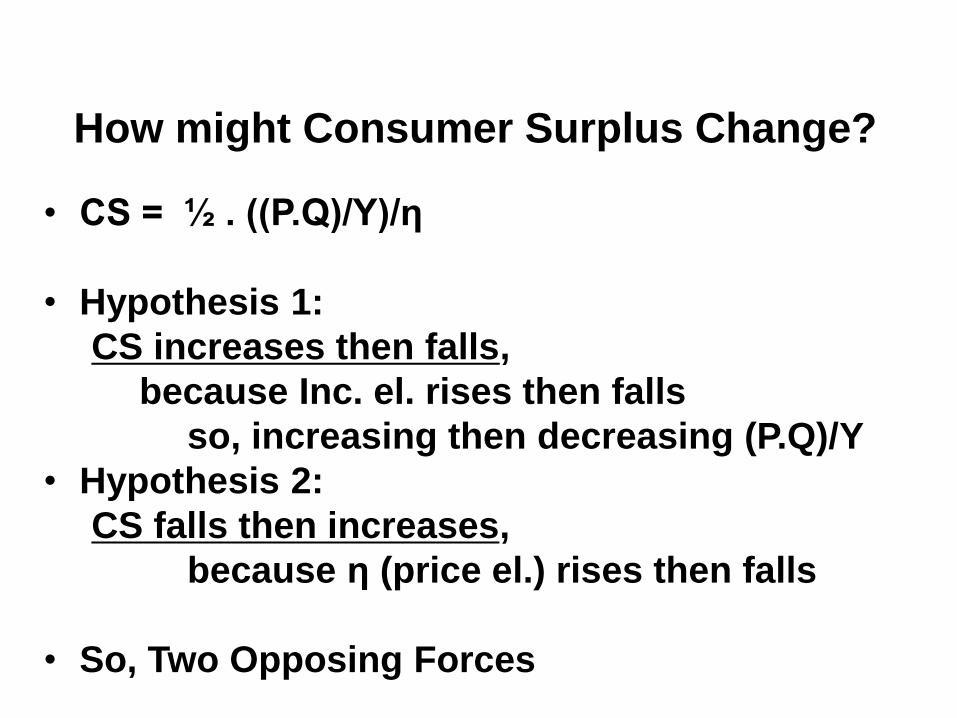
How might Consumer Surplus Change?
• CS = ½ . ((P.Q)/Y)/η
• Hypothesis 1:
CS increases then falls,
because Inc. el. rises then falls
so, increasing then decreasing (P.Q)/Y
• Hypothesis 2:
CS falls then increases,
because η (price el.) rises then falls
• So, Two Opposing Forces
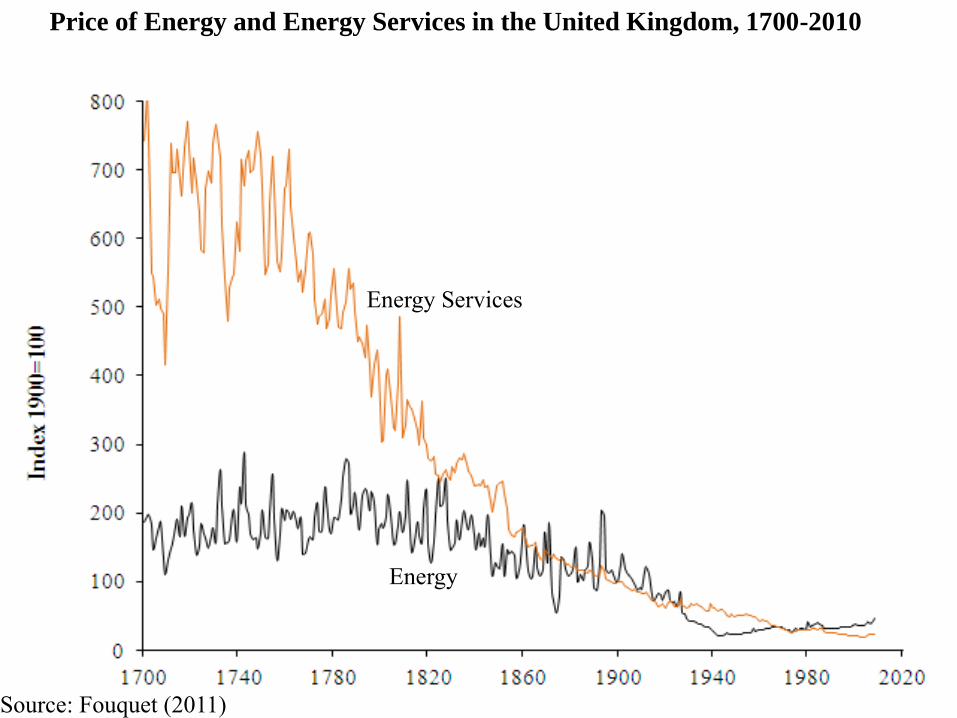
Energy
Energy Services
Source: Fouquet (2011)
Price of Energy and Energy Services in the United Kingdom, 1700-2010
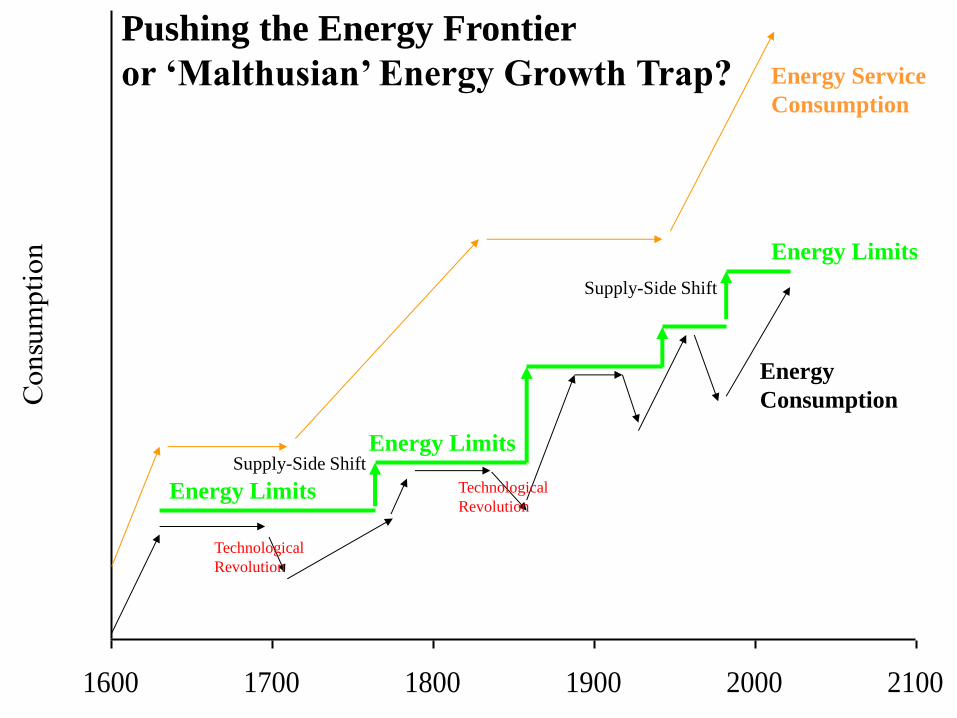
1600 1700 1800 1900 2000 2100
Consu
mpti
on
Energy Limits
Energy Limits
Energy Limits
Supply-Side Shift
Supply-Side Shift
Technological
Revolution
Energy
Consumption
Energy Service
Consumption
Pushing the Energy Frontier
or ‘Malthusian’ Energy Growth Trap?
Technological
Revolution
Global Energy and CO2 Emissions in 2050
• Need for Markets to Meet
Demand for Services of 10bn people
in a Low Carbon Economy
• New Industrial Revolution (Technologies, Energy Markets and Services, Economic
Structure, Climate, ..)
• Slow Energy Transitions: – Many Possible Solutions for Different Countries
• Rising Global CO2 Emissions
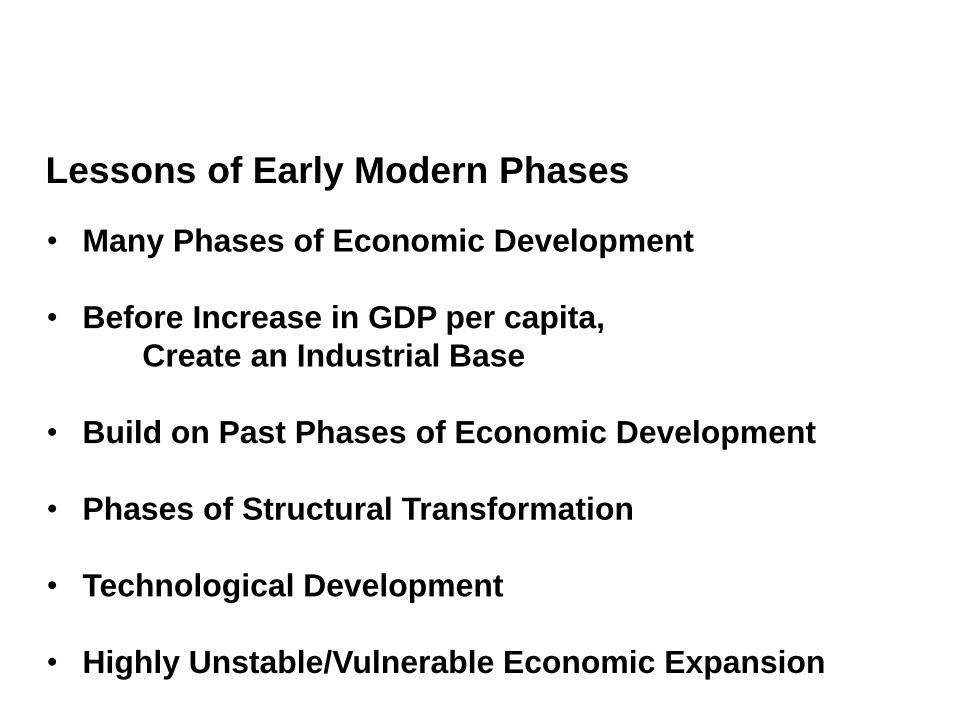
Lessons of Early Modern Phases
• Many Phases of Economic Development
• Before Increase in GDP per capita,
Create an Industrial Base
• Build on Past Phases of Economic Development
• Phases of Structural Transformation
• Technological Development
• Highly Unstable/Vulnerable Economic Expansion
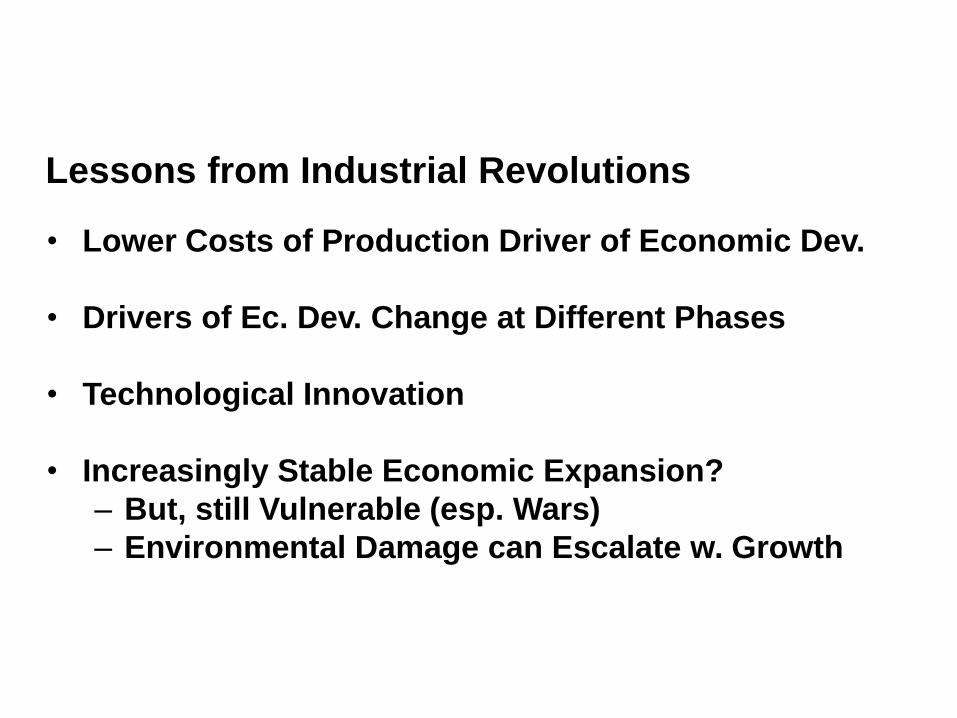
Lessons from Industrial Revolutions
• Lower Costs of Production Driver of Economic Dev.
• Drivers of Ec. Dev. Change at Different Phases
• Technological Innovation
• Increasingly Stable Economic Expansion?
– But, still Vulnerable (esp. Wars)
– Environmental Damage can Escalate w. Growth
Appendix
Energy Price Shocks on GDP
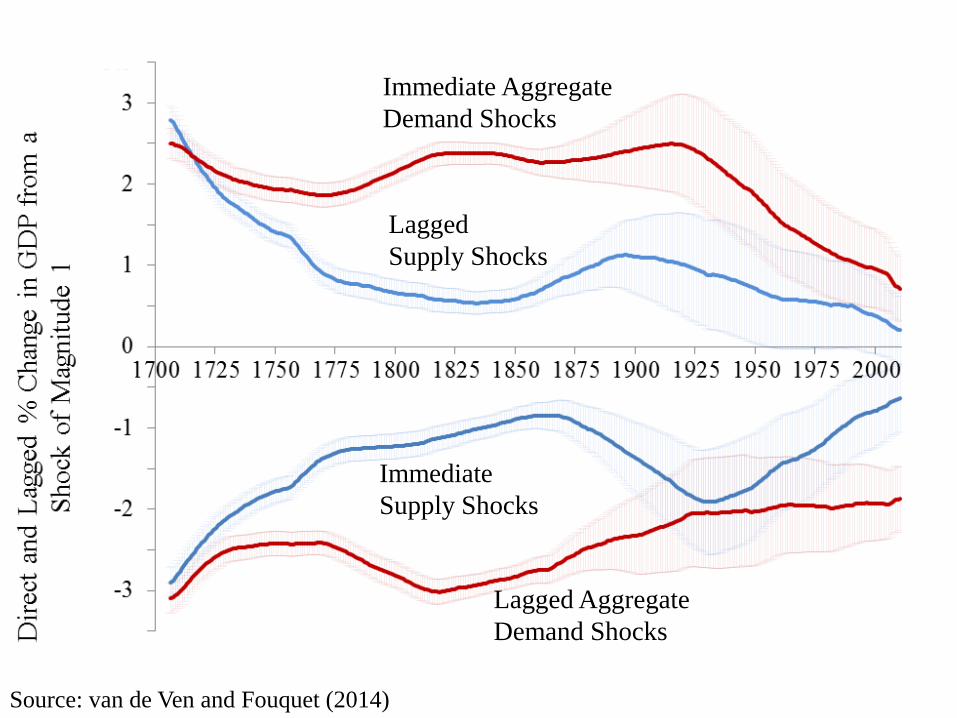
Immediate Aggregate
Demand Shocks
Lagged
Supply Shocks
Lagged Aggregate
Demand Shocks
Source: van de Ven and Fouquet (2014)
Immediate
Supply Shocks
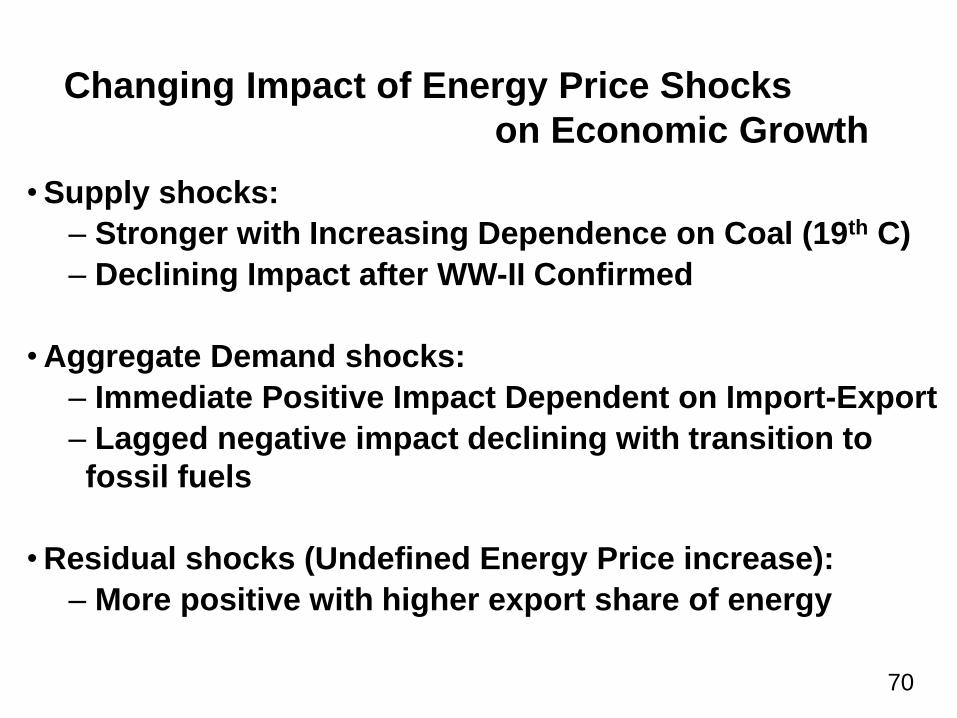
•Supply shocks:
– Stronger with Increasing Dependence on Coal (19th C)
– Declining Impact after WW-II Confirmed
•Aggregate Demand shocks:
– Immediate Positive Impact Dependent on Import-Export
– Lagged negative impact declining with transition to
fossil fuels
•Residual shocks (Undefined Energy Price increase):
– More positive with higher export share of energy
70
Changing Impact of Energy Price Shocks
on Economic Growth
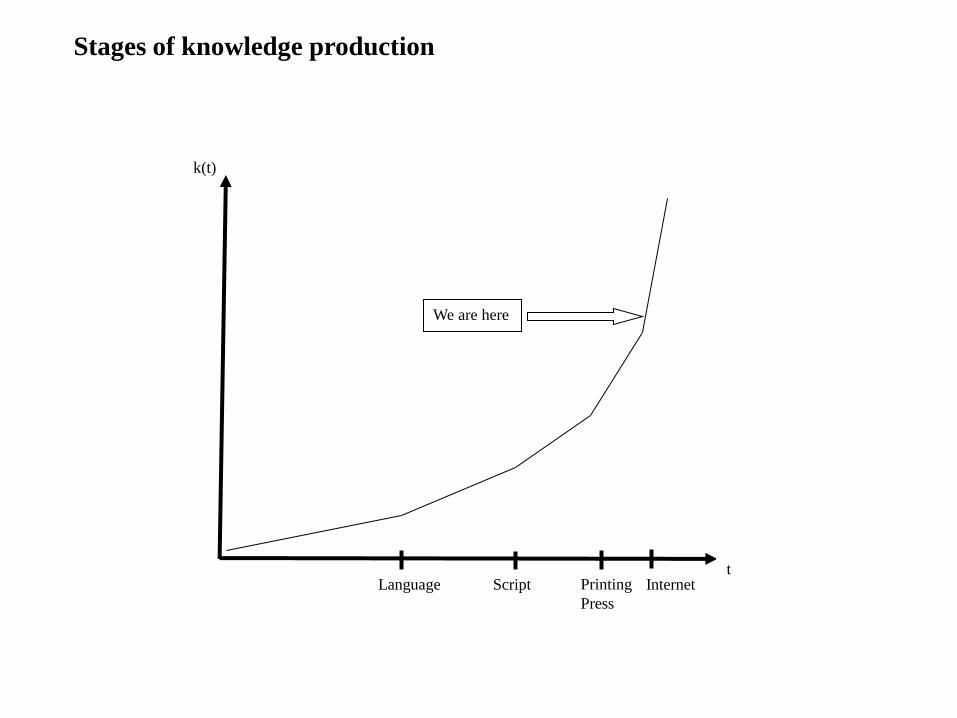
Stages of knowledge production
k(t)
Language Printing
Press
t Internet Script
We are here
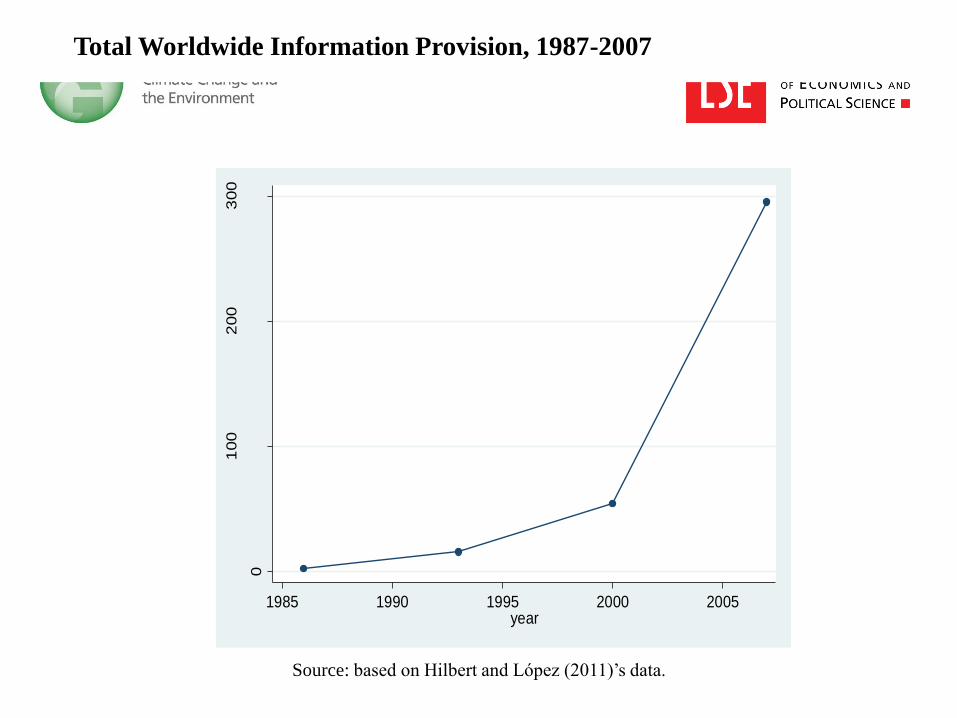
Total Worldwide Information Provision, 1987-2007
Source: based on Hilbert and López (2011)’s data.
0
100
200
300
Exa
byte
s
1985 1990 1995 2000 2005year
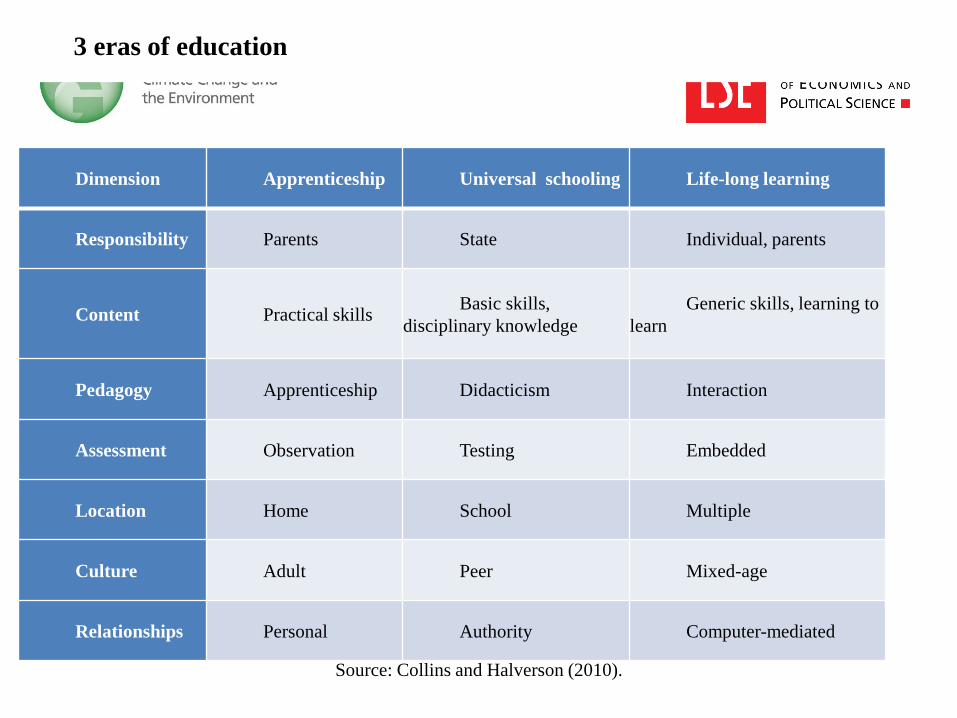
3 eras of education
Dimension Apprenticeship Universal schooling Life-long learning
Responsibility Parents State Individual, parents
Content Practical skills Basic skills,
disciplinary knowledge
Generic skills, learning to
learn
Pedagogy Apprenticeship Didacticism Interaction
Assessment Observation Testing Embedded
Location Home School Multiple
Culture Adult Peer Mixed-age
Relationships Personal Authority Computer-mediated
Source: Collins and Halverson (2010).
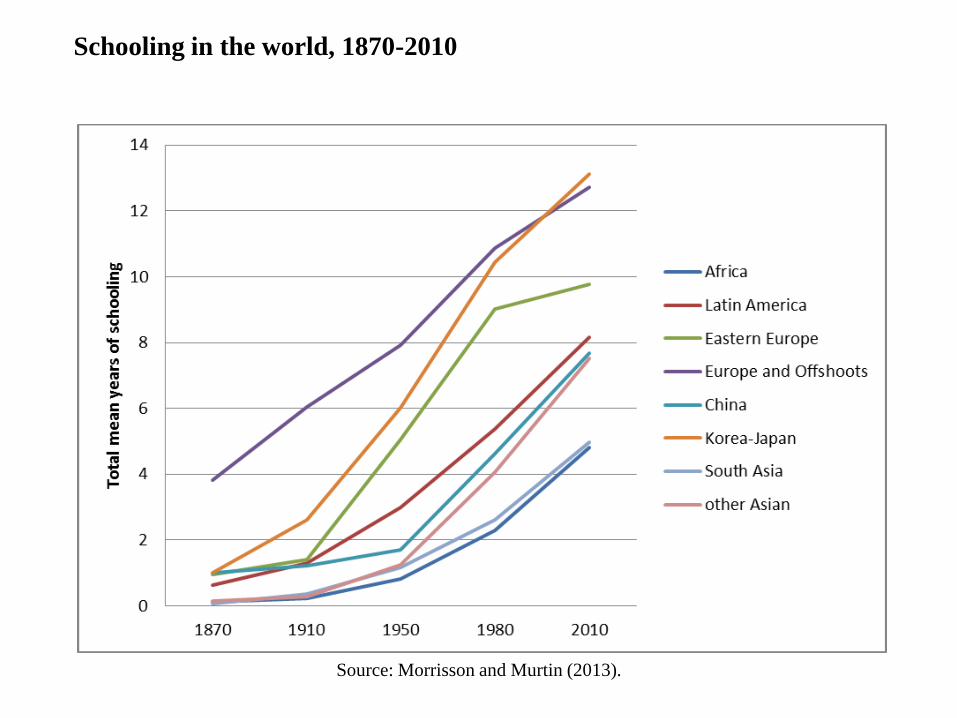
Schooling in the world, 1870-2010
Source: Morrisson and Murtin (2013).
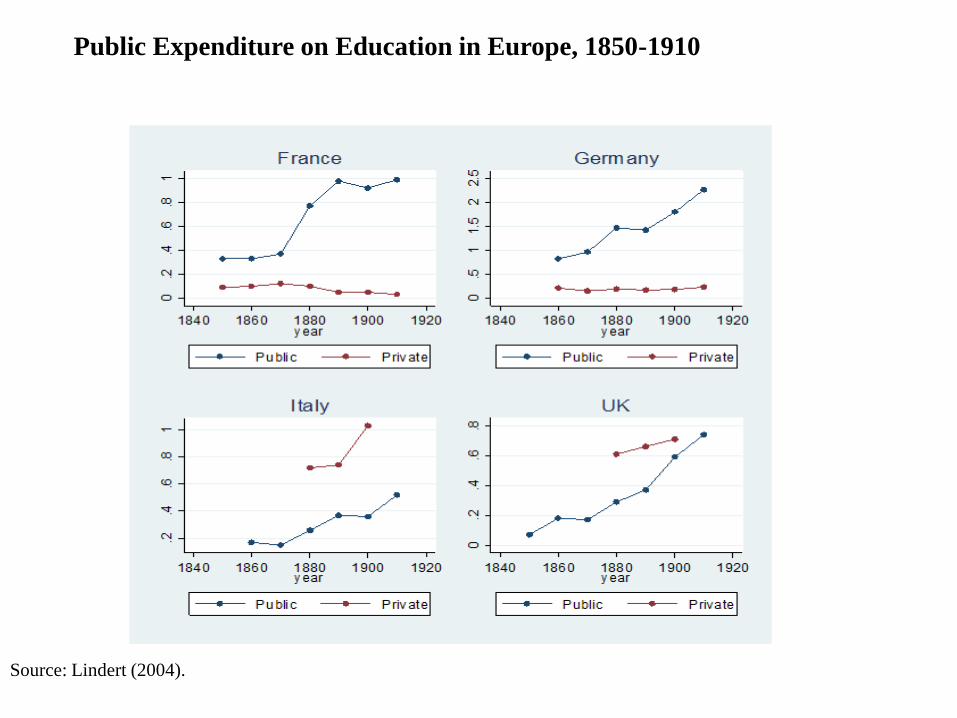
Public Expenditure on Education in Europe, 1850-1910
Source: Lindert (2004).