Embed Size (px)
Citation preview

Bringing Natural Capital into National Green Growth Policy: Lessons from Africa
13 September 2017
Need technical support? Email: [email protected] by:

The 5th Green Growth Knowledge PlatformAnnual Conference
27-28 November 2017Washington DC, USA
Sustainable Infrastructure
Leading researchers will explore key aspects ofthe infrastructure agenda, including the policyand regulatory framework, finance, climatechange adaptation, low carbon pathways, energy,transportation, nature-based solutions and more.

Moderator:
Alice Akinyi KaudiaEnvironment Secretary, Kenyan Ministry of Environment
Katia KarousakisBiodiversity Team Leader,
OECD
Bringing Natural Capital into National Green Growth Policy: Lessons from Africa
Presentations by:
Steven KingEnvironmental Economist,
UNEP-WCMC
Eoin SinnottDirector,
Valuing Nature Initiative, WWF-US

MAINSTREAMING NATURAL CAPITAL AND GREEN GROWTH
Katia KarousakisOECD Environment [email protected]
GGKP webinar, 13 September 2017
Insights from Africa and other countries

• Both the UNEP-WCMC and WWF presentations will relate to measurement issues
• How can natural capital measurement and accounting be used for policy-making?
• What types of policies can countries put in place to balance e.g., infrastructure development needs and natural capital?
Bearing in mind that you cannot manage what you cannot measure…
• The OECD’s main role is to provide evidence-based policy advice
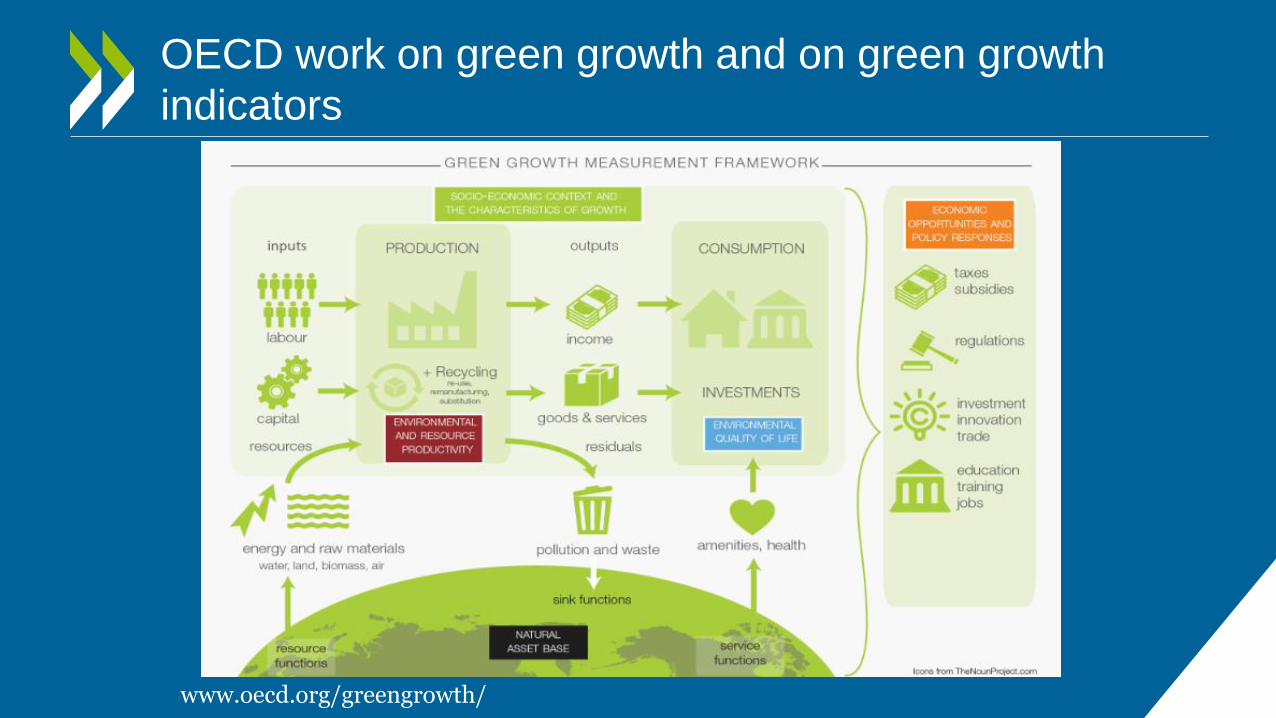
OECD work on green growth and on green growth
indicators
www.oecd.org/greengrowth/
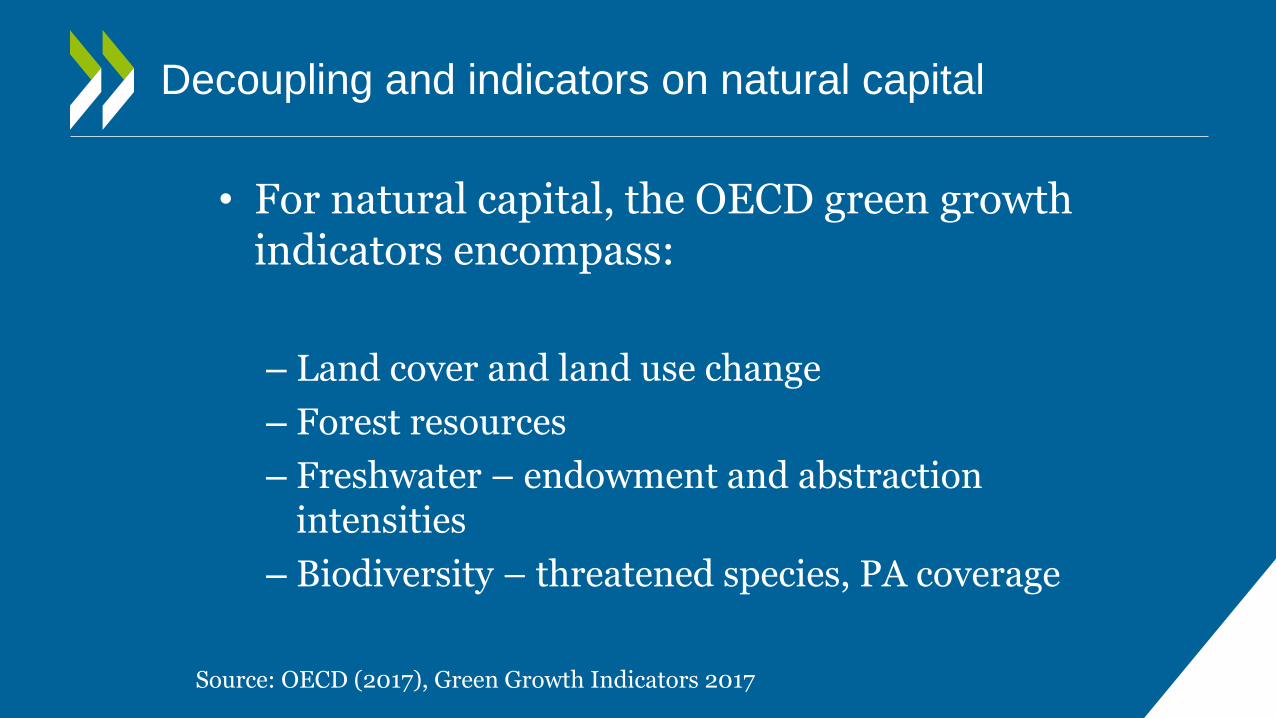
Decoupling and indicators on natural capital
• For natural capital, the OECD green growth indicators encompass:
– Land cover and land use change
– Forest resources
– Freshwater – endowment and abstraction intensities
– Biodiversity – threatened species, PA coverage
Source: OECD (2017), Green Growth Indicators 2017
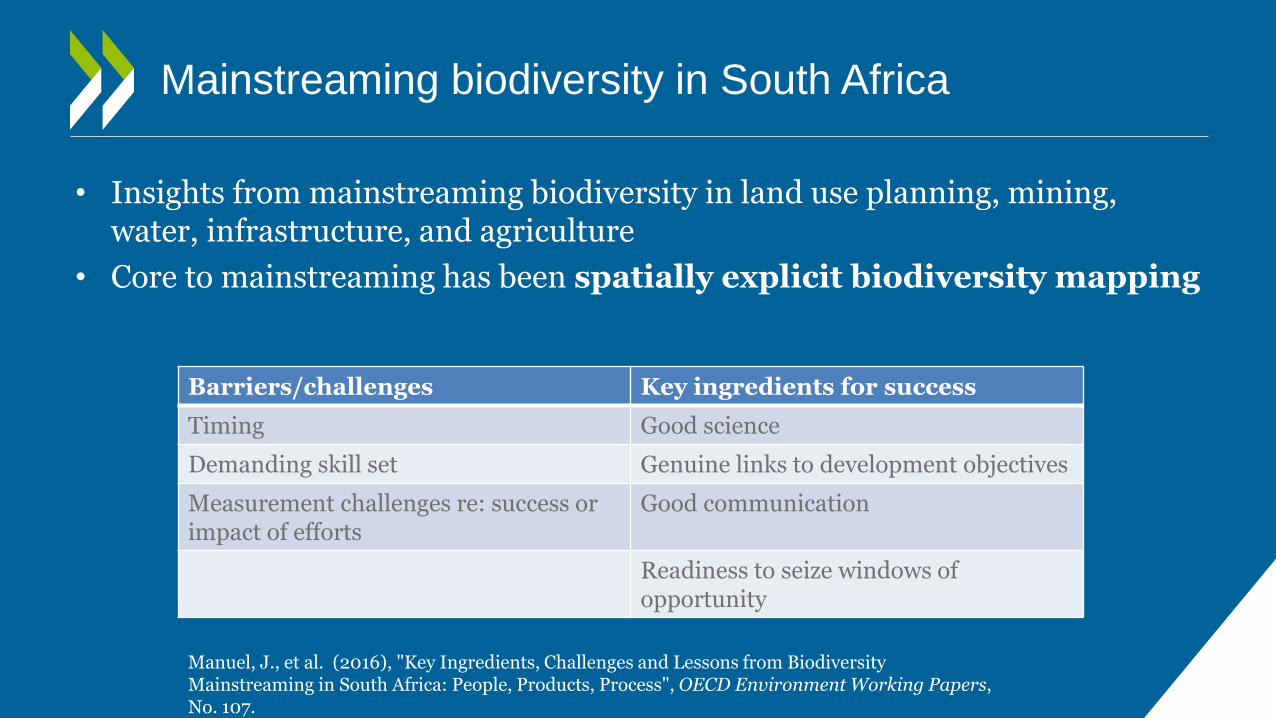
Mainstreaming biodiversity in South Africa
• Insights from mainstreaming biodiversity in land use planning, mining, water, infrastructure, and agriculture
• Core to mainstreaming has been spatially explicit biodiversity mapping
Manuel, J., et al. (2016), "Key Ingredients, Challenges and Lessons from Biodiversity Mainstreaming in South Africa: People, Products, Process", OECD Environment Working Papers, No. 107.
Barriers/challenges Key ingredients for success
Timing Good science
Demanding skill set Genuine links to development objectives
Measurement challenges re: success orimpact of efforts
Good communication
Readiness to seize windows of opportunity

Mainstreaming biodiversity and
development (on-going work)
• Examining insights from 16 predominantly megadiverse countries - including Ethiopia, Madagascar and South Africa
• Types of questions examined:
– To what extent is biodiversity mainstreamed in national development plans, green growth strategies, NSDS?
– What is the role of data and information?
– How is biodiversity mainstreamed in agriculture, forestry and fisheries sectors?
– What indicators, if any, are being used to monitor results?

Mainstreaming biodiversity in Ethiopia,
Madagascar, South Africa (preliminary insights)
• Example: mainstreaming biodiversity in national development plans
Strategic direction
Actions/ targets Indicators
Ethiopia
Madagascar
South Africa
Source: (OECD, forthcoming) Biodiversity and Development: Mainstreaming and Management for Results

• Several NBSAPs refer to indicators to monitor progress towards mainstreaming. Examples:
Number of tools developed to support mainstreaming of biodiversity assets and ecological infrastructure in production sectors and resource management (South Africa)
Rate of annual conversion of habitats into agricultural land (Ethiopia)
Percentage of important degraded ecosystems effectively recovered OR Rate of loss of natural forests and water surface area due to land-use conversion (Viet Nam)
Trends in identification, assessment, establishment and strengthening of incentives that reward positive contribution to biodiversity and ecosystems. Monitoring/Reporting frequency: every three years (India)
In other countries (e.g. Australia, France, Mexico) development of indicators is an action in the NBSAP (no indicators included yet)
Source: (OECD, forthcoming) Biodiversity and Development: Mainstreaming and Management for Results11
Examples of indicators in NBSAPs

• Madagascar: National Environmental Dashboard generates reports on the status of the environment
• Tool for decision and research and training activities at the country level
• 90% of the regions have their own dashboard updated regularly
• France: National assessment on public subsidies harmful to biodiversity (Sainteny et al. 2012)
• South Africa: National Biodiversity Assessment (NBA) includes online spatial information on biodiversity priority areas
• Brazil: Satellite-based deforestation monitoring system for the Amazon biome has enabled the enforcement and monitoring of actions against deforestation
Source: incl. OECD Environmental Performance Reviews (EPRs) for relevant countries 12
National databases and assessments relevant to
mainstreaming

Thank you!
Key areas of OECD work on Biodiversity, Land Use and Ecosystems (BLUE)
Biodiversity Indicators, Valuation and Assessment Economic Instruments, Incentives and Policies for Biodiversity Biodiversity Finance, Development and Distributional Issues
Recent and forthcoming work • Biodiversity and Development: Mainstreaming and Managing for Results (OECD,
forthcoming)• The Political Economy of Biodiversity Policy Reform (OECD, 2017)• Marine Protected Areas: Economics, Management and Effective Policy Mixes (OECD,
2017) • Biodiversity Offsets: Effective Design and Implementation (OECD, 2016)• Biodiversity Policy Response Indicators (OECD ENV Working Paper No. 90, 2015)• Biodiversity and Development Co-operation (OECD DCD Working Paper No. 27, 2015)• Scaling Up Finance Mechanisms for Biodiversity (OECD, 2013)
Visit: www.oecd.org/env/biodiversitywww.oecd.org/environment/resources/mainstreamingbiodiversity.htm
EXPERIMENTAL ECOSYSTEM ACCOUNTING IN UGANDA GGKP WEBINAR, 13TH SEPTEMBER, 2017
STEVEN KING ([email protected])14/09/2017
Institute for the Development
of Environmental-Economic
Accounting

14/09/2017
PRESENTATION OUTLINE
14/09/2017GGKP WEBINAR, SEPTEMBER, 2017
1. Policy entry points
2. The approach
3. Some results
4. Some insights & next steps
Experimental Ecosystem Accounting in Uganda
www.wcmc.io/0524

14/09/2017
POLICY ENTRY POINTS
14/09/2017
• National Development Plan (NDP) II (by 2020) - goals
• Ensuring the rational and sustainable use, development and effective management
of the environment and natural resources (ENR) in pursuit of sectoral growth and
socio-economic development
• Implementation of the SDGs (SDG1: End poverty; SDG12: Sustainable production and
consumption; and SDG15: Halt and reverse land degradation and biodiversity loss)
• Green Growth Development Strategy
• Objective: Economic growth via, inter alia, optimal use of natural capital
• Outcome: Sustainable Biodiversity and Ecosystem Management
• NBSAP II (by 2020)
• Target 1.1: Biodiversity values integrated in to national and local development
plans, budgets and policy statements
• Target 3.1: At least 17% of terrestrial ecosystems are conserved through a well-
connected systems of protected areas for socio-economic benefit of the population
GGKP WEBINAR, SEPTEMBER, 2017

THE APPROACH –A SEEA APPLICATION
GGKP WEBINAR, SEPTEMBER, 2017

14/09/2017
NATIONAL LAND COVER DATA
GGKP WEBINAR, SEPTEMBER, 2017
Digital maps of land
cover produced for
1990, 2005, 2010 and
2015
NBS Code NBS Class Derived Class
3 Tropical high forest well stocked Natural
4 Tropical high forest low stocked Natural
5 Woodland Natural
6 Bush Natural
7 Grassland Natural
8 Wetland Natural
1 Broad leaved plantations Farmland and plantations
2 Coniferous plantation Farmland and plantations
9 Small scale farm land Farmland and plantations
10 Commercial farmland Farmland and plantations
11 Built-up area Built up area
12 Open water Open water
13 Impediments No data

14/09/2017
AGGREGATED NBS CLASSES
GGKP WEBINAR, SEPTEMBER, 2017
Extent of NBS Land Cover Classes Natural Land Cover / Use in Blue
(aggregated NBS Classes)

14/09/2017
ECOSYSTEMS DATA
GGKP WEBINAR, SEPTEMBER, 2017
Original extent of ecosystems in Uganda
Based on Pomeroy et al. (2002) – http://pdf.usaid.gov/pdf_docs/pnacy477.pdf
Driver et al. (2015) - http://www.statssa.gov.za/wp-content/uploads/2016/08/Land-and-Ecosystem-Accounting-in-KZN-Discussion-Document-FINAL.pdf

14/09/2017
NTFP AND FLAGSHIP SPECIES DATA
GGKP WEBINAR, SEPTEMBER, 2017
Original extent of Shea tree suitable habitat Extent of Chimpanzee suitable habitat in IUCN Range

14/09/2017
ECOSYSTEM ACCOUNTING AREAS
GGKP WEBINAR, SEPTEMBER, 2017
Sub-Regions for policy responses Protected area estate

14/09/2017
SOME RESULTS
GGKP WEBINAR, SEPTEMBER, 2017 14/09/2017

14/09/2017
Classifications >> Dry
Sav
ann
as
Fore
st
Mo
ist
Sava
nn
a
No
n-n
atu
ral
Wet
lan
ds
TOTA
LS
Opening Stock (2010) 4,831,858 1,179,006 2,275,929 14,099,137 1,759,468 24,145,398
Additions to stock -
Total additions to stock 462,669 141,505 281,798 1,957,614 157,879 3,001,465
Reductions in stock -
Total reductions in stock (758,013) (254,815) (777,002) (1,043,851) (167,784) (3,001,465)
Net change in stock (295,344) (113,310) (495,204) 913,763 (9,905) -
Closing stock (2015) 4,536,514 1,065,696 1,780,725 15,012,900 1,749,563 24,145,398
NATIONAL ECOSYSTEM EXTENT ACCOUNT 2010-2015
GGKP WEBINAR, SEPTEMBER, 2017

14/09/2017
ACHOLI ELGON KARAMOJA LANGO TESO WEST NILE UgandaOriginal Extent 1,698,092 84,296 831,487 481,236 605,551 986,801 4,687,463
1990 1,021,071 25,823 742,697 132,093 187,845 596,956 2,706,485
% Original Extent 60% 31% 89% 27% 31% 60% 58%
% 1990 extent in Uganda 38% 1% 27% 5% 7% 22% 100%
2015 788,723 15,042 702,678 83,443 91,280 419,758 2,100,924
% Original Extent 46% 18% 85% 17% 15% 43% 45%
% 2015 extent in Uganda 38% 1% 33% 4% 4% 20% 100%
Regionally Protected 2015 72,230 50 302,280 5,689 2,410 59,807 442,466
Regional % Protected 9% 0.33% 43% 7% 3% 14% 21%
SHEA BUTTER NUT TREE ACCOUNT 1990-2015 BY SUB-REGION AND PROTECTED AREA
GGKP WEBINAR, SEPTEMBER, 2017

14/09/2017
SOUTH WESTERN WEST NILE WESTERN UGANDA
Extent IUCN Range 497,896 117,290 1,416,963 2,032,149
Opening Stock (2005)
Fully Suitable in IUCN Range 146,847 16,686 401,905 565,438
Partially Suitable in IUCN Range 104,573 50,866 375,625 531,064
Unsuitable in IUCN Range 246,476 49,738 639,433 935,647
Net Changes
Fully Suitable in IUCN Range 9,493 4,335 -86,154 -72,326
Partially Suitable in IUCN Range -18,765 -17,435 -71,016 -107,216
Unsuitable in IUCN Range 9,272 13,100 157,170 179,542
Closing Stock (2015)
Fully Suitable in IUCN Range 156,340 21,021 315,751 493,112
Partially Suitable in IUCN Range 85,808 33,431 304,609 423,848
Unsuitable in IUCN Range 255,748 62,838 796,603 1,115,189
Extent of fully suitable habitat in IUCN Range protected
(2015) 149,851 15,598 265,193 430,642
% of fully suitable habitat in IUCN Range protected (2015) 96% 74% 84% 87%
% of Uganda's total extent of fully suitable habitat in
IUCN Range protected (2015) 35% 4% 62% 100%
CHIMPANZEE ACCOUNT 2005 – 2015 BY SUB-REGION AND PROTECTED AREA
GGKP WEBINAR, SEPTEMBER, 2017
14/09/2017
SOME INSIGHTS & NEXT STEPS
GGKP WEBINAR, SEPTEMBER, 2017 14/09/2017

14/09/2017
SOME POLICY INSIGHTS
GGKP WEBINAR, SEPTEMBER, 2017
1) The NTFP account identifies large natural areas with the potential to support Shea butter production in Karamoja (if processed locally yields could equate to US$239.25 - 526.35 / ha)
2) There are significant protected areas in South Western that can support wildlife watching tourism (WTO estimates daily spend by wildlife watching tourists in Africa is US$433 per person per day, excluding flights)
3) The above insights on environmental-economic interactions are relevant to:
• NDP II goals for environmental resources and socio-economic development (including SDG1, 12 and 15)
• Green growth strategy objectives and outcomes;
• NBSAP Target 1.1.

14/09/2017
NEXT STEPS
GGKP WEBINAR, SEPTEMBER, 2017
1) The accounts should be recognised as being experimental and
subject to validation
2) The habitat based approaches imply potential presence of
species only. The accounts would be improved via the
integration of primary monitoring data.
3) The accounts should be extended managed areas, including
farmland, plantation and open water ecosystems
4) Extensions to incorporate wider ecosystem services would
provide a more coherent picture of the interactions between the
environment and the economy to decision-makers

14/09/2017
THANK YOU
GGKP WEBINAR, SEPTEMBER, 2017 14/09/2017

OPTIMIZING DYNAMIC ECOLOGICAL INFRASTRUCTURE WITH BUILT INFRASTRUCTURE, INDUSTRIES, CITIES & COMMUNITIES
GGKP Webinar, September 13th 2017
Prepared by Eoin Sinnott, WWF-US
Natural Capital ProgrammeGovernment of Mozambique
AFRICAN DEVELOPMENT BANK
COUNTRY STRATEGY PAPER 2016 - 2020
MOZAMBIQUE
Task Team Members
Core Team Mohamed Cherif Chief Country Program Officer (SARC)
Andre Almeida Santos Principal Country Economist (MZFO)
Team Members Goyal Devinder Chief Reg. Fin. Management Coordinator (ORPF)
James Opio-Omoding Chief Agriculture Economist (ANRC)
Jean-Louis Kromer Chief Natural Resources Manag. Officer (ANRC)
João Cunha Chief Climate Finance Specialist (ONEC)
Toigo Pietro Chief Macro Economist (ANRC)
Aymen A. Osman Ali Principal Transport Engineer (OITC)
Boniface Aleobua Principal Sanitation Engineer (OWAS)
César Tique Senior Agriculture & Rural Dev. Specialist (MZFO)
Elizabeth Muguti Senior Power Engineer (ONEC)
Emilio Aniceto Dava Senior Macroeconomist (ORTS)
Imen Chorfi Senior Business Data Analyst (SARC)
João Mabombo Senior Transport Engineer (MZFO)
João Tinga Senior Financial Management Specialist (ORPF)
Yolanda Arcelina Senior Social Sector Specialist (MZFO)
Lead Economist Ernest Addison Lead Economist (SARC)
Resident
Representative Joseph Ribeiro Resident Representative (MZFO)
Regional Director Kennedy Mbekeani Regional Director (OIC) (SARC)
Peer-Reviewers
SOUTHERN AFRICA REGIONAL CENTER (SARC)
August 2015
Reflections on Mozambique’s Green Economy Journey…

What do we measure & manage to deliver the SDGs? GDP?
• Eight men own as much as the poorest half of the world
(Oxfam 2017) – GDP growth will not solve inequality.
• In the anthropocene we need a social-ecological systems
mind-set to thrive within planetary limits (SRC 2015).
• Green growth, circular economy, green economy, blue
economy are narratives of inclusive prosperity, beyond GDP.
“The welfare of a nation can
scarcely be inferred from a
measurement of national
income…nor the quality of growth”
Simon Kuznets, principle architect of
the GDP concept, in 1934.
Singular focus on GDP (without valuing and managing natural capital) = Global Depletion Project?


Niassa
Cabo Delgado
TANZANIA
MALAWI
ZAMBIA
Natural Capital Programme phase 1 provinces: Cabo Delgado & Niassa
PALMA
4th largest
natural gas
reserves in the
world
Mozambique’s opportunities & challenges
• Average of 7 percent GDP growth 2005-2015.
• Tourism, agriculture, energy, fisheries – huge potential.
• Population of 27m growing at 2.5 percent/ year.
• Population is urbanising at a rate of 3 percent/ year.
• 46 percent below the poverty line in 2015 (52.8 in 2003).
• 50 percent of youths unemployed in urban areas.
• Ranked 181st on HDI in 2016.
• Ranked 153 on climate risk GAIN Index in 2015.

2001
PALMA
Deforestation
PALMA
2015
Deforestation
How do we deliver shared, lasting economic transformation?

Houston – Hurricane HarveyRobert Gauthier/Los Angeles Times via Getty Images
How can we apply lessons from other parts of the world?

How do we invest in young entrepreneurs for a resilient future society?
?Public natural gas revenues

TANZANIA
MALAWI
ZAMBIA
Niassa Game Reserve
Quirimbas National Park
Natural
Gas
FieldsLake
Niassa
Reserve
LICHINGA
Lichinga-Pemba
Corridor
PEMBA
PALMA
Natural
Gas
Fields
Infrastructure corridors: opportunity & risk
Mtwara-Palma-Pemba
Corridor
MTWARA

AFRICAN DEVELOPMENT BANK
COUNTRY STRATEGY PAPER 2016 - 2020
MOZAMBIQUE
Task Team Members
Core Team Mohamed Cherif Chief Country Program Officer (SARC)
Andre Almeida Santos Principal Country Economist (MZFO)
Team Members Goyal Devinder Chief Reg. Fin. Management Coordinator (ORPF)
James Opio-Omoding Chief Agriculture Economist (ANRC)
Jean-Louis Kromer Chief Natural Resources Manag. Officer (ANRC)
João Cunha Chief Climate Finance Specialist (ONEC)
Toigo Pietro Chief Macro Economist (ANRC)
Aymen A. Osman Ali Principal Transport Engineer (OITC)
Boniface Aleobua Principal Sanitation Engineer (OWAS)
César Tique Senior Agriculture & Rural Dev. Specialist (MZFO)
Elizabeth Muguti Senior Power Engineer (ONEC)
Emilio Aniceto Dava Senior Macroeconomist (ORTS)
Imen Chorfi Senior Business Data Analyst (SARC)
João Mabombo Senior Transport Engineer (MZFO)
João Tinga Senior Financial Management Specialist (ORPF)
Yolanda Arcelina Senior Social Sector Specialist (MZFO)
Lead Economist Ernest Addison Lead Economist (SARC)
Resident
Representative Joseph Ribeiro Resident Representative (MZFO)
Regional Director Kennedy Mbekeani Regional Director (OIC) (SARC)
Peer-Reviewers
SOUTHERN AFRICA REGIONAL CENTER (SARC)
August 2015
Vision for a Green Economy:
“inclusive middle income
country by 2030, based
on…rational use of natural
capital…to guarantee
development…within planetary
limits.”

CLIMATE
Resilience
03
ECONOMIC
Productivity
02
INCLUSIVE
Prosperity
01
Resilient
Ecological
Infrastructure
Network
3 policy impact areas
GOAL
Optimize ecological and
built infrastructure to
transform cities,
communities and
industries into inclusive,
productive and resilient
systems
NATURAL CAPITAL
PROGRAMME
Policy impact areas
01. Prosperity: Jobs, health, food, water & energy security
02. Productivity: Industry, infrastructure, cities, agriculture, fisheries, forests
03. Resilience: People, cities, industries, infrastructure, ecosystems

Natural capital selected for management under integrated spatially explicit, dynamic
Resilient Ecological Infrastructure Networks (REINs)
NB. Climate change and other drivers will constantly re-shape REINs
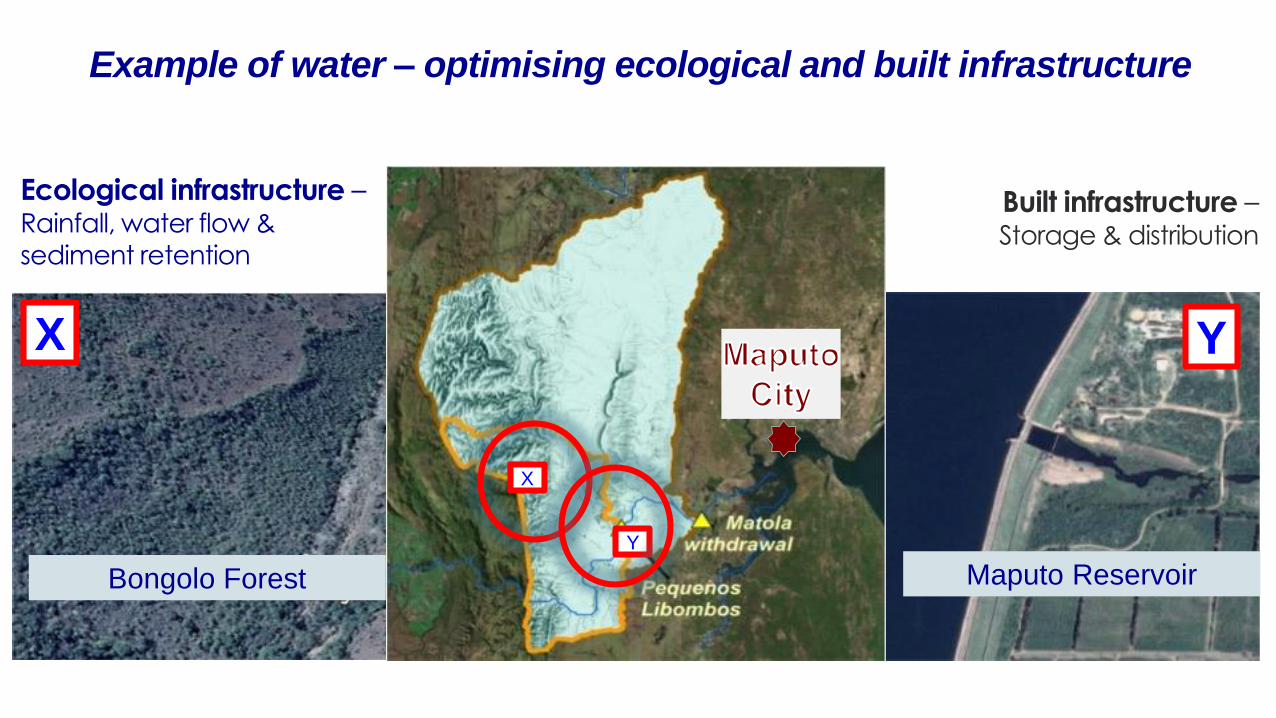
Ecological infrastructure –Rainfall, water flow &
sediment retention
X
Y
YX
Built infrastructure –Storage & distribution
Example of water – optimising ecological and built infrastructure
Bongolo Forest Maputo Reservoir


Africa industrial logo source: ISID/ UNIDO
Delivering resilient, sustainable industrialisation,
urbanisation, built infrastructure and inclusive human
prosperity requires adaptive social-ecological
management systems that harness Resilient
Ecological Infrastructure Networks.

Next steps
• Natural capital & climate assessments identifying REINs.
• Provincial action plans for REINs’ management systems.
• Performance monitoring system for REINs.
• Safeguards system plugged into REINs.
• National planning system plugged into REINs.
• Optimisation of socio-economic activities (e.g. industry,
built infrastructure, food systems) with REINs.

Guiding Questions
• Why should African countries mainstream natural capital accounting into green growth policies?
• How can African countries accelerate the integration of natural capital accounting into the green transition paradigm with a focus on enhanced human and environmental well-being?
• What are the target impacts of mainstreaming natural capital accounting into green growth policies for African governments?

Questions from the Audience
What are some successful
Payment for Ecosystem
Services (PES) schemes?
What are
methods/approaches
for integrating the
natural capital narrative
into larger growth and
development agendas?
How can/should different
levels/ministries of government work
together to facilitate on-the-ground green
growth?
What are mechanisms for finance, and how can
business sectors and other stakeholders get
involved?

Thank you for attending this webinar on Bringing Natural Capital into National Green Growth Policy: Lessons from Africa
• This webinar was recorded and will be uploaded to the GGKP website: www.ggkp.org
• If you have any further questions about the webinar please email: [email protected]
• The GGKP asks you to complete a survey which will be sent out after this webinar.