Embed Size (px)
Citation preview

© 2012 by the Board of Trustees of the Leland Stanford Junior University. All rights reserved.Stanford Prevention Research Center. Stanford Medical Youth Science Program.
Lesson Two:Food Availability, Obesity, and Diabetes
Objectives1. To discuss how upstream causes (e.g., large portion sizes served in fast food and other restaurants,
food policies) shape individual health behaviors (e.g., consuming high-sugar foods) and influence health and disease outcomes (e.g., obesity and diabetes).
2. To provide an example of how social, economic, and political factors (i.e., upstream causes) influence community health.
Outcomes1. Students will understand how resources (goods/services/people) and policies impact food choices
which can lead to poor health.
2. Students will recognize how the pathway of upstream causes relates to community health.
ActivitiesStudents will participate in the following four activities:
1. How Sweet It Is: Sugary Beverages
2. Portion Sizes on the Rise
3. Policies to Address Obesity: A Debate
4. Diabetes Detectives: A Case Study of Upstream Causes of Health


Lesson 2: Activity 1 • Page 3
Activity 1: How Sweet It Is: Sugary BeveragesPurposeThe purpose of the How Sweet It Is: Sugary Beverages activity is to visualize the amount of sugar in selected beverages.
Required MaterialsThe How Sweet It Is: Sugary Beverages activity requires the following materials:
1. 12-ounce bottles of non-diet sodas (e.g., Coca Cola, Pepsi, Sprite) and fruit drinks that are not 100% juice (e.g., Hawaiian Punch).
NOTE: 32 grams or 8 teaspoons is approximately the total recommended daily intake of sugar for young adults.1 When choosing beverages, include drinks with varying amounts of total grams of sugar.
2. One roll of wax paper.
3. Scales that measure in grams (consider borrowing from a science lab).
4. Measuring teaspoons.
5. One one-pound bag of white sugar.
6. Small bowls (to hold sugar for each group).
1 Johnson, R. K., Appel, L. J., Brands, M., Howard, B. V., Lefevre, M., Lustig, R. H., ... L. M., Wylie-Rosett, J. (2009). Dietary sugars intake and cardiovascular health: a scientific statement from the American Heart Association. [Practice Guide-line]. Circulation, 120(11), 1011-1020.

Page 4 • Lesson 2: Activity 1
InstructionsFollow the instructions below to implement the How Sweet It Is: Sugary Beverages activity.
Prior to Class1. On several tables across the classroom, arrange a scale, teaspoon, wax
paper, bowlful of sugar, and bottled beverage.
NOTE: Ideally, divide students into groups of three to five, and distribute one scale, one set of measuring spoons, and different beverages to each group, such that groups work simultaneously while measuring the sugar in different beverages. If there are limited supplies, increase group size or instruct small groups to rotate.
2. Write the following information on the board:
1 teaspoon = approximately 4 grams of sugar
8 teaspoons = approximately 32 grams of sugar = recommended daily sugar limit for a young adult 21
During Class1. Read the following statement aloud:
A bowl of cereal for breakfast, a cup of yogurt at morning break, a soda with lunch, a granola bar after school. All these snacks contain a surprising amount of sugar. The American Heart Association recommends limiting the number of calories from sugar to less than 10% of your total calories per day. While it depends on the number of calories you consume each day, for the average young adult this means eating or drinking no more than 8 teaspoons of sugar each day. The average young adult, however, consumes 20 teaspoons of sugar each day!
2. Ask students the following questions:
a. How many of you drink soda or juice (other than 100% juices)?
b. How often do you typically drink these beverages each day or week?
c. How much sugar do you estimate is in each of these beverages?
2 American Heart Association (Producer) (2010). Frequently asked questions about sugar. [webpage] Retrieved from http://heart.org/HEARTORG/GettingHealthy/NutritionCenter/HealthDietGoals/Frequently-Asked-Questions-About-Sugar_UCM_306725_Article.jsp
Q&A
Read

Lesson 2: Activity 1 • Page 5
d. Do you think these beverages fall below, meet, or exceed the recommended sugar limit for young adults (8 teaspoons or less per day)? Take a vote.
3. Depending on the availability of scales, divide students into small groups, and instruct them to:
a. Using the nutrition label, record the number of grams of sugar found in the assigned beverage.
b. Place one piece of wax paper on the scale. Zero out the scale.
c. Using the measuring teaspoon, add sugar to the scale until the amount of grams on the scale corresponds the number of grams in the beverage. Count and record the number of teaspoons scooped.
d. Compare this number to the daily recommended maximum intake of 8 teaspoons for young adults.
4. Ask each group to share the name of and number of teaspoons of sugar in their assigned beverage. Record responses on the board.
5. Discuss how quickly daily sugar consumption can accumulate.
6. Facilitate a discussion using the following questions:
a. Are you surprised by the amount of sugar found in the beverages?
b. What factors at home, school, and in the community may prevent individuals from consuming low sugar foods and beverages (or encourage individuals to consume high sugar foods and beverages)? Is the availability of high and low sugar foods and beverages similar across communities?
NOTE: A discussion about the amount of fat and calories found in common food items can be held as an additional learning opportunity. For example, the amount of fat and calories in one typical fast-food restaurant meal often exceeds daily recommendations for fat and calorie intake.
Q&A


Lesson 2: Activity 2 • Page 7
Activity 2: Portion Sizes on the RisePurposeThe purpose of the Portion Sizes on the Rise activity is to demonstrate how the size of beverage cups has increased over time, thus challenging individuals to select portion sizes appropriate for maintaining a healthy weight.
Required MaterialsThe Portion Sizes on the Rise activity requires the following materials:
1. Multiple sized beverage cups (8, 16, 24, 36, and 64 ounces) from a store or fast food restaurant (to be collected by instructor).
2. Centers for Disease Control and Prevention U.S. Obesity Trends slides available and either printed or displayed on a computer (http://www.cdc.gov/obesity/data/trends.html), in which case appropriate technology is required.

Page 8 • Lesson 2: Activity 2
InstructionsFollow the instructions below to implement the Portion Sizes on the Rise activity.
Prior to Class1. Using a marker, write the size of each cup in ounces on the outside of
each cup and display cups in order of size on a table in front of the class.
During Class1. Review total number of ounces and teaspoons of sugar in the beverages
from activity one, How Sweet It is: Sugary Beverages
2. Tell students that standard portion sizes have increased over time:
1950 1970 20006.5 ounces 12.0 ounces 20.0 ounces3
1
3. Direct students’ attention to the beverage cups at the front of the room, and state the number of ounces per cup. Based on their understanding of how much sugar was in a 12 ounce beverage in Activity One: How Sweet It Is: Sugary Beverages, ask students to estimate how much sugar would be in the cups on display. For example, if their 12 ounce beverage had 10 teaspoons of sugar, then 20 ounces of the same beverage would have almost double that amount of sugar.
a. How has the increase in portion sizes influenced the consumption of sugary beverages?
3 Division of Nutrition and Physical Activity, Centers for Disease Control and Prevention (Producer). (2006). Research to Practice Series No. 2: Do increased portion sizes affect how much we eat? [PDF] Retrieved from http://www.cdc.gov/nccdphp/dnpa/nutrition/pdf/portion_size_research.pdf

Lesson 2: Activity 2 • Page 9
b. What is the motivation of the food and beverage industry to increase cup sizes over time (e.g., policies of soda companies to increase portion sizes because of higher profit margins on sodas compared to healthy foods)?
4. Show students the Centers for Disease Control and Prevention Obesity Trend Slides to illustrate how rates of obesity have dramatically increased over time. Emphasize to students that these slides show percent obese (Body Mass Index > 30.0) and not percent overweight (Body Mass Index = 25.0-29.9). Notice how over time the key has expanded to include new categories of percent obese people in each state of the U.S. to adapt to the large increases in the percent of people who are obese. How might the increase in portion sizes and increase in rates of obesity be correlated?


Lesson 2: Activity 3 • Page 11
Activity 3: Policies to Address Obesity: A DebatePurposeThe purpose of the Polices to Address Obesity: A Debate activity is to share examples of policies that address the obesity epidemic by changing the cost of and access to high-sugar beverages.
Required MaterialsThe Polices to Address Obesity: A Debate activity does not require additional materials, though students may conduct research to support their argument in the debate.

Page 12 • Lesson 2: Activity 3
InstructionsFollow the instructions below to implement the Policies to Address Obesity: A Debate activity.
During Class1. Describe the following two policy examples to students.
Example One: Taxation on high sugar beverages and food
Description:
Some state laws tax beverages and foods with high-sugar content. This may be accomplished, for example, by charging a tax per ounce, such that a one-cent tax per ounce would yield a 12 cent tax on a 12 ounce soda and a 20 cent tax on a 20 ounce soda. Revenues from taxes may be applied to health education and disease prevention programs.
Possible arguments for taxation
Supporters of taxation on high-sugar beverages and food hope that higher costs of sugary beverages may: 1) deter individuals from purchasing high-sugar beverages, 2) increase the consumption of healthier options such as low fat milk or water, and consequently 3) decrease rates of obesity and health care costs.
Possible arguments against taxation
Opponents argue that increased taxes unfairly burden low-income consumers or those who drink high-sugar beverages or eat high-sugar foods in moderation (and are not obese or contributing to escalating health care costs).
Example Two: Restriction of high-sugar beverages and foods
Description:
Some school districts restrict high-sugar beverages and foods sold in public schools. This includes reducing the portion sizes of high-sugar beverages sold, prohibiting sales of high-sugar beverages during designated times of the day, and/or removing vending machines that sell high-sugar beverages. Restrictions may also take place at a city, county, or state level.
Possible arguments for restriction
Supporters believe that childhood obesity is fueled in part by the availability of high-fat and high-sugar meals and snacks sold at school. Given how much time students spend at school, creating a healthy environment where only healthy choices are available may exert a powerful influence over students’ eating habits.
Read

Lesson 2: Activity 3 • Page 13
Possible arguments against restriction
Opponents of legislation fear that removing high-sugar items, which are often sold for the purpose of fundraising: 1) will reduce the budget for important academic or extracurricular opportunities, and 2) may infringe on people’s personal freedom.
2. With students’ input, brainstorm policy ideas that could be implemented and enforced to help schools and communities limit the amount of high-sugar foods and beverages available to students and residents.
3. Conduct a classroom debate.
a. Ask students to vote on one policy to serve as the basis for debate (either from examples provided or from the list brainstormed by the class).
b. Divide the class into two evenly-sized groups, and assign one group to favor the policy and one group to oppose it.
c. Allow time for students to plan their argument. If the internet is available, students may search for information online, or the activity may be split over two class periods so that students can conduct research as homework.
d. Instruct students to make opening and closing statements, present reasons for favoring or opposing the proposed policy, and respond to arguments made by the other side; each group member is required to speak.


Lesson 2: Activity 4 • Page 15
Activity 4: Diabetes Detectives: A Case Study of Upstream Causes of HealthPurposeThe purpose of the Diabetes Detectives activity is to highlight: 1) the severity of diabetes, especially within certain groups in the general population; 2) the effect of resources (goods/services/people) and policies on health behaviors, health and disease outcomes; and 3) the application of an upstream causes framework to a health issue.
Required MaterialsThe Diabetes Detectives activity requires the following materials:
1. Chart paper.
2. Markers.
3. Pima and Tohono O’odham Indians Summary Story 41or Unnatural Causes documentary segment titled Bad Sugar.
4 Archibold, R. C. (2008, August 30). Indians’ Water Rights Give Hope for Better Health, The New York Times. Retrieved from http://www.nytimes.com/2008/08/31/us/31diabetes.html

Page 16 • Lesson 2: Activity 4
InstructionsFollow the directions below to implement the Diabetes Detectives activity.
Prior to Class1. Options A (print summary story) and B (documentary):
a. To review information about Type II diabetes including an updated definition, risk factors, and current statistics see: the American Diabetes Association (www.diabetes.org), National Diabetes Education Foundation (http://ndep.nih.gov/), Centers for Disease Control and Prevention (http://cdc.gov/diabetes/), or your local county health department’s websites. Record information (especially how the prevalence of diabetes varies by age, gender, ethnicity, income, etc.) to share with students during the opening discussion activity.
2. Option B (documentary):
a. Obtain a copy of the documentary film Unnatural Causes, Bad Sugar segment and arrange the necessary technology for viewing.
NOTE: This lesson only focuses on Type II diabetes, which is highly prevalent and linked to obesity and other chronic diseases such as heart disease.
During Class1. Ask the following questions:
a. Does anyone have family members, friends, or neighbors who have been diagnosed with Type II diabetes? How has diabetes affected their health?
2. Share statistics (collected by instructor during background research prior to class) about how the prevalence of Type II diabetes varies by age, gender, ethnicity, income, etc.
3. Ask the following questions:
a. What are the risk factors for Type II diabetes? (e.g., family history, poor diet, obesity, high cholesterol, high blood pressure, physical inactivity)
b. What individual behavior choices may lead someone to develop diabetes? (e.g., high fat diet, physical inactivity)
c. What community factors may influence a person’s risk of diabetes? (e.g., limited access to healthy foods due to a large number of fast food restaurants, lack of farmers’ markets and grocery stores selling healthy options, unsafe neighborhoods for physical activity)
Q&A
Q&A

Lesson 2: Activity 4 • Page 17
NOTE: Questions and examples from b and c above can also be phrased positively to highlight protective behaviors and community influences that prevent (instead of cause) diabetes, such as: what individual behavior choices may prevent someone from developing diabetes? or help maintain a low-fat diet? or encourage being physically active?
4. Read the following explanation out loud:
In the following activity, you will become diabetes detectives tasked with discovering what community factors led to a dramatic increase in diabetes rates among a community of Native Americans in Arizona. Instead of investigating why individuals were drowning in the river, like the story in Lesson One, you will investigate why a population of Native Americans developed alarmingly high rates of diabetes.
5. Distribute a blank Pima and Tohono O’odham Indians Summary Story Flow Chart to each student. Instruct students to take notes as they read the story or watch the film (Options A or B below) and to be prepared to share their answers in small groups.
6. Choose Option A (print summary story) or B (documentary) from below:
Option A – Pima and Tohono O’odham Indians Summary Story
Distribute copies of the Pima and Tohono O’odham Indians Summary Story (located at the end of Lesson Two) to all students and instruct them to read it in class.
Option B – Unnatural Causes documentary
Show the Unnatural Causes segment Bad Sugar to students.
7. Once students complete option A or B, divide the class into groups of three to four students.
a. Distribute chart paper and instruct students to select a recorder and reporter within each group. The recorder will take notes on chart paper and the reporter will share insights with the class.
b. As a group, students will combine answers from their individual story flow charts to create a new flow chart on a large piece of paper.
8. Reconvene the class and ask reporters to share the result of their group’s chart, adding new ideas to those already shared by other groups.
9. The goal is to have the class create an upstream causes chart as shown in the Pima and Tohono O’odham Indians Summary Story Flow Chart that highlights the connections among upstream causes of health, individual health behaviors, health or disease risk factors, and health or disease outcomes.
Handout1
Handout2
Read

Page 18 • Lesson 2: Activity 4
10. Once groups finish their flowcharts, ask students the following questions:
a. Some social, economic, and political factors (i.e., upstream causes) negatively affected the health of the Pima and O’odham Indians. What social, economic, and political factors exist in your community that promote or hinder health?
b. How do you suggest addressing and improving these issues in your community?
Q&A

Lesson 2: Activity 4 • Page 19
Framework Example
Pima and Tohono O’odham Indians Summary Story Flow Chart
Upstream causes(social, economic, political factors)
Building of a dam, removal of water rights, changes in farming practices, government
subsidies providing unhealthy foods
Individual health behaviors
Inability to grow healthy foods, consuming processed and high caloric foods from
government food subsidies, farming less and being less active
Health or disease risk factors Obesity, diabetes
Health or disease outcomes Heart attack, stroke, hypertension, blindness, amputation


Lesson 2 Activity 4
Handout1
Framework Example
Pima and Tohono O’odham Indians Summary Story Flow Chart
Upstream Causes(social, economic, political factors)
Individual health behaviors
Health or disease risk factors
Health or disease outcomes

Lesson 2 Activity 4
Handout2
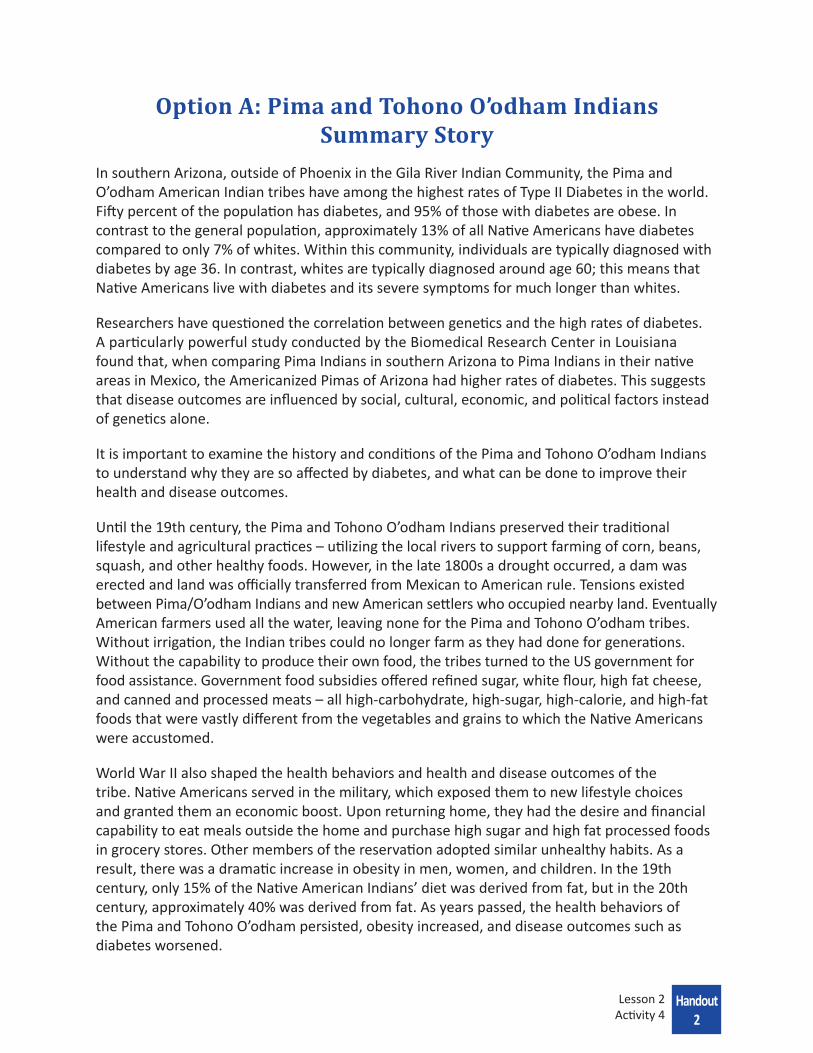
Option A: Pima and Tohono O’odham Indians Summary Story
In southern Arizona, outside of Phoenix in the Gila River Indian Community, the Pima and O’odham American Indian tribes have among the highest rates of Type II Diabetes in the world. Fifty percent of the population has diabetes, and 95% of those with diabetes are obese. In contrast to the general population, approximately 13% of all Native Americans have diabetes compared to only 7% of whites. Within this community, individuals are typically diagnosed with diabetes by age 36. In contrast, whites are typically diagnosed around age 60; this means that Native Americans live with diabetes and its severe symptoms for much longer than whites.
Researchers have questioned the correlation between genetics and the high rates of diabetes. A particularly powerful study conducted by the Biomedical Research Center in Louisiana found that, when comparing Pima Indians in southern Arizona to Pima Indians in their native areas in Mexico, the Americanized Pimas of Arizona had higher rates of diabetes. This suggests that disease outcomes are influenced by social, cultural, economic, and political factors instead of genetics alone.
It is important to examine the history and conditions of the Pima and Tohono O’odham Indians to understand why they are so affected by diabetes, and what can be done to improve their health and disease outcomes.
Until the 19th century, the Pima and Tohono O’odham Indians preserved their traditional lifestyle and agricultural practices – utilizing the local rivers to support farming of corn, beans, squash, and other healthy foods. However, in the late 1800s a drought occurred, a dam was erected and land was officially transferred from Mexican to American rule. Tensions existed between Pima/O’odham Indians and new American settlers who occupied nearby land. Eventually American farmers used all the water, leaving none for the Pima and Tohono O’odham tribes. Without irrigation, the Indian tribes could no longer farm as they had done for generations. Without the capability to produce their own food, the tribes turned to the US government for food assistance. Government food subsidies offered refined sugar, white flour, high fat cheese, and canned and processed meats – all high-carbohydrate, high-sugar, high-calorie, and high-fat foods that were vastly different from the vegetables and grains to which the Native Americans were accustomed.
World War II also shaped the health behaviors and health and disease outcomes of the tribe. Native Americans served in the military, which exposed them to new lifestyle choices and granted them an economic boost. Upon returning home, they had the desire and financial capability to eat meals outside the home and purchase high sugar and high fat processed foods in grocery stores. Other members of the reservation adopted similar unhealthy habits. As a result, there was a dramatic increase in obesity in men, women, and children. In the 19th century, only 15% of the Native American Indians’ diet was derived from fat, but in the 20th century, approximately 40% was derived from fat. As years passed, the health behaviors of the Pima and Tohono O’odham persisted, obesity increased, and disease outcomes such as diabetes worsened.

Handout2
Lesson 2 Activity 4
It was not until 2004 – after a century of court battles and suffering – that the Gila Water Settlement Act supplied water rights to this community. Resources have only recently been replaced so that farming is possible again. The problem, however, is that the new generation of Pima and Tohono O’odham youth are accustomed to unhealthy diets and sedentary lifestyles and do not have the skills to farm. A cultural shift is required in order to prioritize farming and healthier lifestyles.
The Pima and O’odham tribes are distinguished by their strikingly high rates of diabetes. Tracing the history of their community offers insight as to how community and cultural changes can impact the health of multiple generations within a population.