Embed Size (px)
Citation preview
1
Lesson 5 EACLIPSE Curriculum
© 2010 Michigan State University Board of Trustees. This activity has been funded by National Science Foundation Award No. BCS-070709671.
http://eaclipse.msu.edu Page 1
Objectives Students will be able to
analyze historical changes in land use in Southeast Michigan to make predictions.
apply what they know about changes in temperature, precipitation, and vegetation to make predictions about land use changes in East Africa.
discuss the possible effects of projected land use changes in the East African savanna.
Background Human‐environment interactions are causing climate change on a global level. Scientist measure and predict climate change by monitoring changes in temperatures, rainfall, severe weather events (e.g. droughts and floods), and changes in vegetation (including deforestation and desertification). They then predict future changes by projecting current and historical trends into the future. While the main cause of climate change is a rise in greenhouse gases, another possible contributor to climate change is land use and vegetation. Changing land use and its effect on vegetation changes local surface temperatures, the balance of oxygen and CO2 in the atmosphere, and the ability of an ecosystem to recover from stresses such as floods and droughts. Students will examine historic changes in land use in Southeast Michigan and use those data to project future land use changes. They will then apply their understandings to the EACLIPSE research project to understand how changes in land use and vegetation in the East African savanna may interact with climate change, closing the human‐land‐climate system loop.
Vocabulary Urbanization Deforestation Desertification Ground cover
Time: Two 50‐minute periods
Summary: In this lesson, students will examine changes in land use over time in Michigan, learn how scientists measure and predict changes in land use and vegetation over time in East Africa, and discuss how land use and vegetation affect climate change.
Materials: Computer with internet access Projector PowerPoint presentation: Changing Land Use Student calculators and graph paper (optional) Student handouts and answer sheets:
Changes in Land Use and Vegetation
Changes in Land Use and Vegetation with answers
Savanna Discussion Questions
Optional:
Maps of Changes in Land Use and Vegetation Data for Southeast Michigan, 1990‐2000
Maps of Land Use and Vegetation in Tanzania, current and projected
Proposed Research Questions
EACLIPSE Research Questions
Reflection Questions
Activity # 1
Lesson Plan
Changing Land Use
Author Barbara Naess Consultant Courtney Peterson
2
Lesson 5 EACLIPSE Curriculum
© 2010 Michigan State University Board of Trustees. This activity has been funded by National Science Foundation Award No. BCS-070709671.
http://eaclipse.msu.edu Page 2
Procedure 1. Begin with a brief discussion with students to activate their prior knowledge. How do scientists measure climate change? What are some of the causes of climate change? How do scientists predict future climate change? How do researchers determine the effects of
climate change? 2. Show students the PowerPoint presentation on Changing Land Use (Part 1). 3. Student Activity: Hand Student Sheet Land Use and Vegetation Data (Optional: Give students a copy of the maps comparing 1990 and 2000.) Have students complete sheet individually. While students are working project slide 16 (land cover of Tanzania in 2000). Students will:
Have them calculate the percent of land in each of the use categories on the chart and calculate the percent change in each.
Have students project future changes for the different land uses in 2010 using the rate of change they calculated for the ten‐year period 1990‐2000.
Optional Extensions: Have students graph the changes in land use over
time. Have students continue to project the change in
land use in 10‐year increments to 2050. 4. Discussion: After students have finished with the activity discuss as a class the discussion questions. 1. How has land use changed in Southeast Michigan
in the last 200 years (from map in PowerPoint presentation)?
2. How did it change in the ten years from 1990 to 2000 (map and data)?
3. How accurate do you think your predictions might be?
4. What information might be missing?
5. How do you think the changes in land use and vegetation might affect the local and regional climate?
5. Continue the PowerPoint presentation (Part 2). 6. Discussion: This discussion is meant to help students understand climate change using the human‐land‐climate system loop. Have students write down their ideas on the student handout and share their answers. Alternatively, this could be done as a small‐group activity with groups reporting back. 1. How does climate change affect vegetation? 2. How does land use affect vegetation? 3. How is land use predicted to change in the East
African savanna? 4. How do land use and vegetation affect climate
change? 5. How might people living in the savanna be
affected by these changes? 6. Can you relate this back to the human‐land‐
climate system loop? Optional Extension: After the CLIP research was finished, there were still many questions about the human‐land‐climate system in the savanna. Researchers designed the EACLIPSE Project to gather data to answer those questions. In this extension, students are given the opportunity to think like scientists and pose research questions. Pass out the blank research questions sheet and have students propose research questions that might help to understand the relationships between land‐use, vegetation, and climate change in the savanna. For each research question, have them list the data they would collect and how they would use it to understand the relationship better. Give students the final handout with the EACLIPSE research questions and reflection questions. They will compare the questions they proposed with the
Introduction to Climate Change in East Africa
3
Lesson 5 EACLIPSE Curriculum
© 2010 Michigan State University Board of Trustees. This activity has been funded by National Science Foundation Award No. BCS-070709671.
http://eaclipse.msu.edu Page 3
Web Resources Southeast Michigan Council of Governments www.semcog.org Data and maps on changing demographics and land use in Southeast Michigan Creative Change Educational Solutions www.creativechange.net Lessons from the Land: High school curriculum on land use policy in Southeast Michigan (requires subscription; tax deductible for teachers) Project Websites: EACLIPSE (East Africa Climate, People, Livestock & Savanna Ecosystems) www.eaclipse.msu.edu CLIP (Climate Land Interaction Project) www.clip.msu.edu LUCID (Land‐Use Change, Impacts, and Dynamics) www.lucideastafrica.org
Introduction to Climate Change in East Africa
EACLIPSE research questions. Reflection: This can be a class discussion or as a written assignment. Are these questions similar to the ones you
proposed? What is the same/different? What obstacles could you anticipate researchers
facing in trying to answer these questions? If we look at climate change from only a scientific
perspective, what are we missing? Which research question addresses what happens
to people as a result of climate change? 7. Conclusion: In this lesson of the science module,
you have learned about the final parts of the savanna
human‐land‐climate system loop and you have seen
how changes in land use and vegetation can in turn
affect climate change, closing the loop. The science
module focused on climate change, vegetation, and
land use. The social studies module will take a closer
look at the larger social‐cultural, political, and
economic factors that affect livelihoods and land use.
Assessment Were students able to analyze historical changes
in land use in Michigan to make predictions? Were students able to discuss the effects of
projected land use changes in the East African savanna using their understanding of the human‐land‐climate system loop?
4
Lesson 5 EACLIPSE Curriculum
© 2010 Michigan State University Board of Trustees. This activity has been funded by National Science Foundation Award No. BCS-070709671.
http://eaclipse.msu.edu Page 4
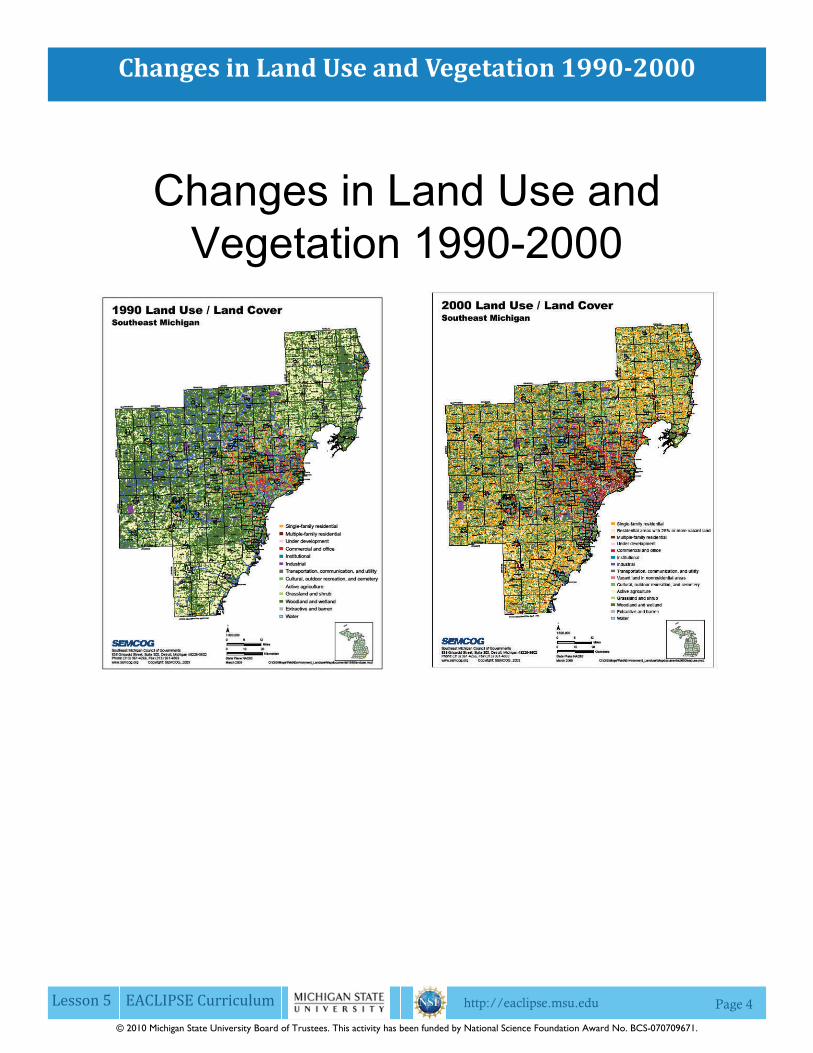
Changes in Land Use and Vegetation 19902000
Changes in Land Use and Vegetation 1990-2000
22
5
Lesson 5 EACLIPSE Curriculum
© 2010 Michigan State University Board of Trustees. This activity has been funded by National Science Foundation Award No. BCS-070709671.
http://eaclipse.msu.edu Page 5
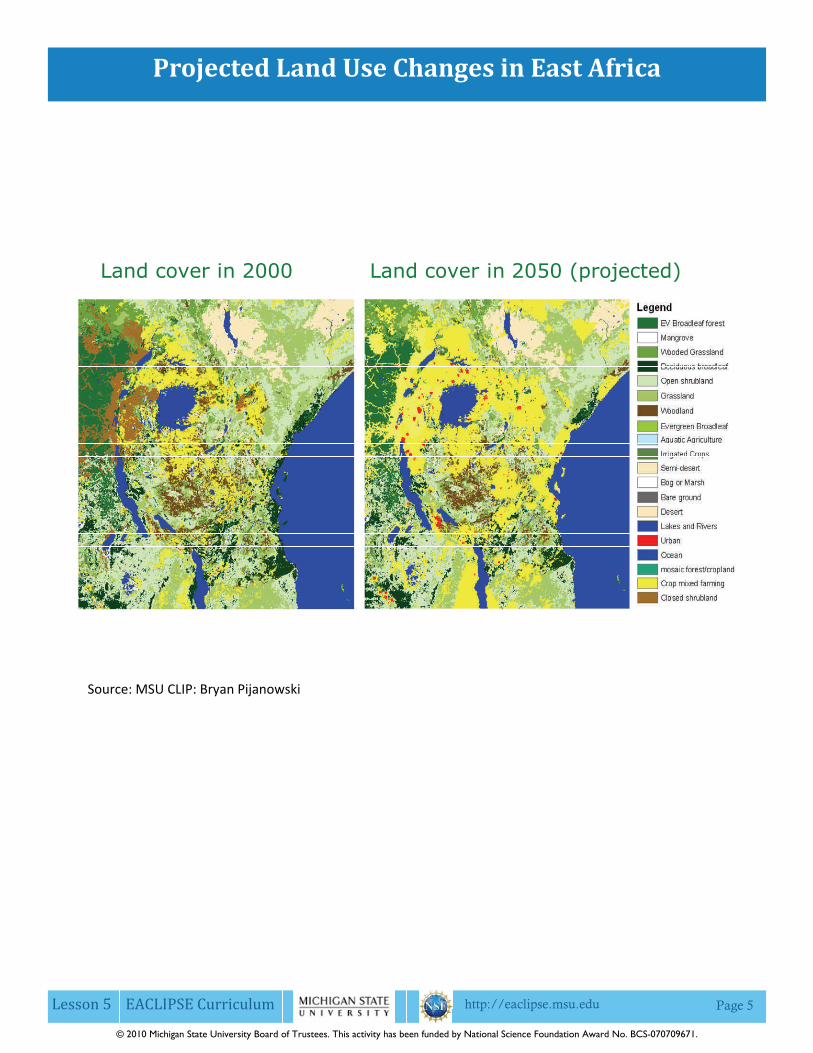
Projected Land Use Changes in East Africa
3030
Land Use Change Forcings
Land cover in 2000 Land cover in 2050 (projected)
Source: MSU CLIP: Bryan Pijanowski
6
Lesson 5 EACLIPSE Curriculum
© 2010 Michigan State University Board of Trustees. This activity has been funded by National Science Foundation Award No. BCS-070709671.
http://eaclipse.msu.edu Page 6
1. How does climate change affect vegetation?
2. How does land use affect vegetation?
3. How is land use predicted to change in the East African savanna?
4. How do land use and vegetation affect climate change?
5. Can you relate this back to the human‐land‐climate system loop?
Savanna Discussion Questions
7
Lesson 5 EACLIPSE Curriculum
© 2010 Michigan State University Board of Trustees. This activity has been funded by National Science Foundation Award No. BCS-070709671.
http://eaclipse.msu.edu Page 7
Changes in Land Use and Vegetation
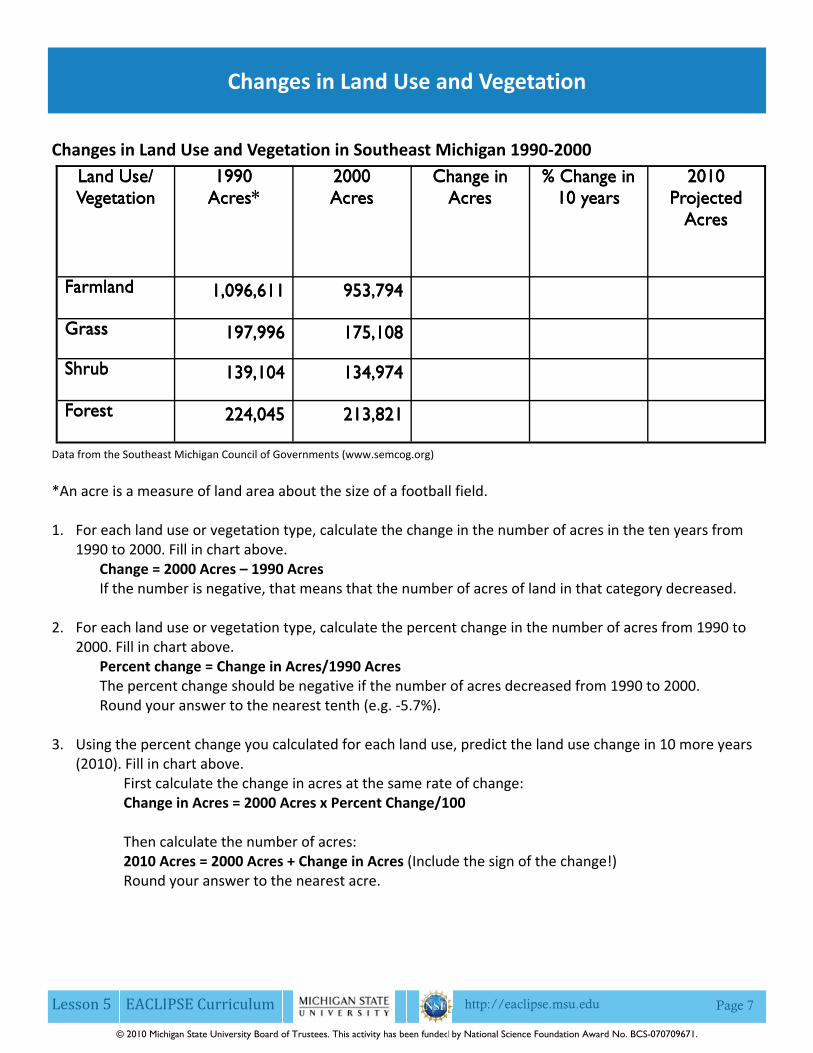
Changes in Land Use and Vegetation in Southeast Michigan 1990‐2000
Data from the Southeast Michigan Council of Governments (www.semcog.org)
*An acre is a measure of land area about the size of a football field. 1. For each land use or vegetation type, calculate the change in the number of acres in the ten years from
1990 to 2000. Fill in chart above. Change = 2000 Acres – 1990 Acres If the number is negative, that means that the number of acres of land in that category decreased.
2. For each land use or vegetation type, calculate the percent change in the number of acres from 1990 to 2000. Fill in chart above.
Percent change = Change in Acres/1990 Acres The percent change should be negative if the number of acres decreased from 1990 to 2000. Round your answer to the nearest tenth (e.g. ‐5.7%).
3. Using the percent change you calculated for each land use, predict the land use change in 10 more years (2010). Fill in chart above.
First calculate the change in acres at the same rate of change: Change in Acres = 2000 Acres x Percent Change/100 Then calculate the number of acres: 2010 Acres = 2000 Acres + Change in Acres (Include the sign of the change!) Round your answer to the nearest acre.
Land Use/ Vegetation
1990
Acres*
2000
Acres
Change in
Acres
% Change in 10 years
2010
Projected
Acres
Farmland 1,096,611 953,794
Grass 197,996 175,108
Shrub 139,104 134,974
Forest 224,045 213,821
Land Use/ Vegetation
1990
Acres*
2000
Acres
Change in
Acres
% Change in 10 years
2010
Projected
Acres
Farmland 1,096,611 953,794
Grass 197,996 175,108
Shrub 139,104 134,974
Forest 224,045 213,821
8
Lesson 5 EACLIPSE Curriculum
© 2010 Michigan State University Board of Trustees. This activity has been funded by National Science Foundation Award No. BCS-070709671.
http://eaclipse.msu.edu Page 8
Changes in Land Use and Vegetation
Discussion Questions: 1. How has land use changed in Southeast Michigan in the last 200 years (from map)? 2. How did it change in the ten years from 1990 to 2000 (map and data)? 3. How accurate do you think your predictions might be? 4. What information might be missing? 5. How do you think the changes in land use and vegetation might affect the local and regional climate?
9
Lesson 5 EACLIPSE Curriculum
© 2010 Michigan State University Board of Trustees. This activity has been funded by National Science Foundation Award No. BCS-070709671.
http://eaclipse.msu.edu Page 9
Changes in land Use and Vegetation
6. Looking at the land cover map of Tanzania in 2000 make predictions on what the land cover will be in 2050.
a. Do you think there will more or less forest? Explain your answer.
b. Do you think there will be more or less farm land? Explain your answer.
c. Do you think there will be more or less urban areas? Explain your answer. 7. How might people living in the savanna be affected by these changes? 8. Can you relate this back to the human-land-climate system loop?
10
Lesson 5 EACLIPSE Curriculum
© 2010 Michigan State University Board of Trustees. This activity has been funded by National Science Foundation Award No. BCS-070709671.
http://eaclipse.msu.edu Page 10
Changes in land Use and Vegetation Teacher Sheet
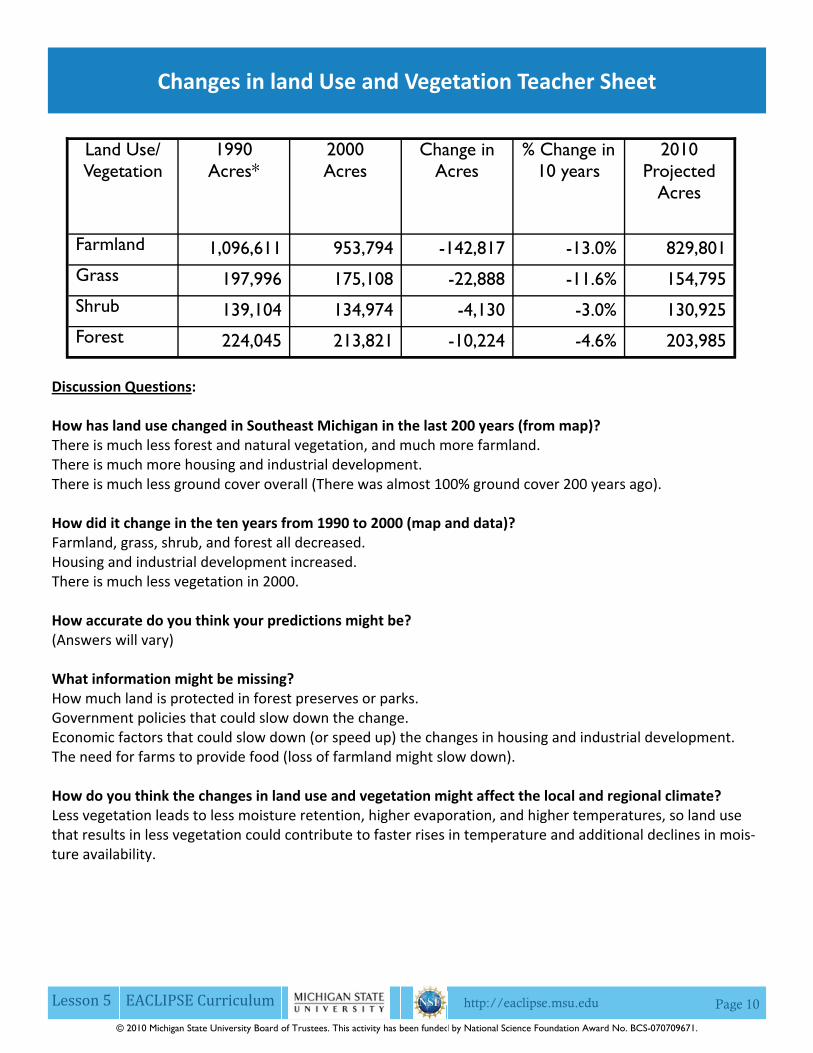
Discussion Questions: How has land use changed in Southeast Michigan in the last 200 years (from map)? There is much less forest and natural vegetation, and much more farmland. There is much more housing and industrial development. There is much less ground cover overall (There was almost 100% ground cover 200 years ago). How did it change in the ten years from 1990 to 2000 (map and data)? Farmland, grass, shrub, and forest all decreased. Housing and industrial development increased. There is much less vegetation in 2000. How accurate do you think your predictions might be? (Answers will vary) What information might be missing? How much land is protected in forest preserves or parks. Government policies that could slow down the change. Economic factors that could slow down (or speed up) the changes in housing and industrial development. The need for farms to provide food (loss of farmland might slow down). How do you think the changes in land use and vegetation might affect the local and regional climate? Less vegetation leads to less moisture retention, higher evaporation, and higher temperatures, so land use that results in less vegetation could contribute to faster rises in temperature and additional declines in mois‐ture availability.
Land Use/ Vegetation
1990
Acres*
2000
Acres
Change in
Acres
% Change in 10 years
2010
Projected
Acres
Farmland 1,096,611 953,794 -142,817 -13.0% 829,801
Grass 197,996 175,108 -22,888 -11.6% 154,795
Shrub 139,104 134,974 -4,130 -3.0% 130,925
Forest 224,045 213,821 -10,224 -4.6% 203,985

11
Lesson 5 EACLIPSE Curriculum
© 2010 Michigan State University Board of Trustees. This activity has been funded by National Science Foundation Award No. BCS-070709671.
http://eaclipse.msu.edu Page 11
Changes in land Use and Vegetation Teacher Sheet
1. How does climate change affect vegetation? In general: Vegetation is sensitive to temperature and rainfall, both the amount and timing. As these change, vegetation will change. If conditions and hotter and drier, there will be less vegetation and less ground cover, and there will be a change to smaller, more drought tolerant plants. In the East African savanna: When there are higher temperatures and lower moisture availability, savanna vegetation will change from forest to bushland to scrubland, possibly leading to eventual desertification. 2. How does land use affect vegetation? When land is cleared for farming, firewood, building homes, or commercial purposes, there is less vegetation and ground cover. Grazing animals can affect ground cover, removing vegetation and preventing regrowth if there is overgraz‐ing. 3. How is land use predicted to change in the East African savanna? More land will go into farming and urbanization, there will be less forests and wooded areas. 4. How do land use and vegetation affect climate change? As land use changes, vegetation changes. When there is less vegetation and ground cover, more heat is stored and reflected, increasing the rate of rising temperatures. Less moisture is retained in the soil and evaporation is higher, decreasing moisture availability. Decreased vegetation and ground cover speed up cli‐mate change. 5. How might people living in the savanna be affected by these changes? When vegetation changes, people might not be able to continue with their traditional livelihoods. Farmers may have to switch to drought‐resistant crops, might have to move to areas with greater moisture availability, or might have to stop farming altogether. People who raise livestock may have to move their herds to areas with better forage, switch to animals that can eat more drought‐resistant forage, reduce their herd size, or stop keeping livestock. 6. Can you relate this back to the human‐land‐climate system loop? When there is climate change, it affects the vegetation that can grow in a given place. That affects what liveli‐hoods are viable options for the people who live there. People change how they use the land according to the livelihoods they choose (farming, livestock, other uses). That land use changes the vegetation. If there is less vegetation, there will be less ground cover and that will contribute to rising temperatures and decreased moisture availability, speeding up climate change. That brings us all the way around the loop.
12
Lesson 5 EACLIPSE Curriculum
© 2010 Michigan State University Board of Trustees. This activity has been funded by National Science Foundation Award No. BCS-070709671.
http://eaclipse.msu.edu Page 12
Measuring and Predicting Changes in Climate, Land Use, and Vegetation
Measuring and Predicting Changes in Climate, Land Use, and Vegetation List research questions that might help you understand the relationships between land‐use, vegetation, and climate change in the savanna. For each research question, list what data you would collect and explain how you would analyze the data to understand the relationship better.
Research Question: Data:
Research Question: Data:
13
Lesson 5 EACLIPSE Curriculum
© 2010 Michigan State University Board of Trustees. This activity has been funded by National Science Foundation Award No. BCS-070709671.
http://eaclipse.msu.edu Page 13
Measuring and Predicting Changes in Climate, Land Use, and Vegetation
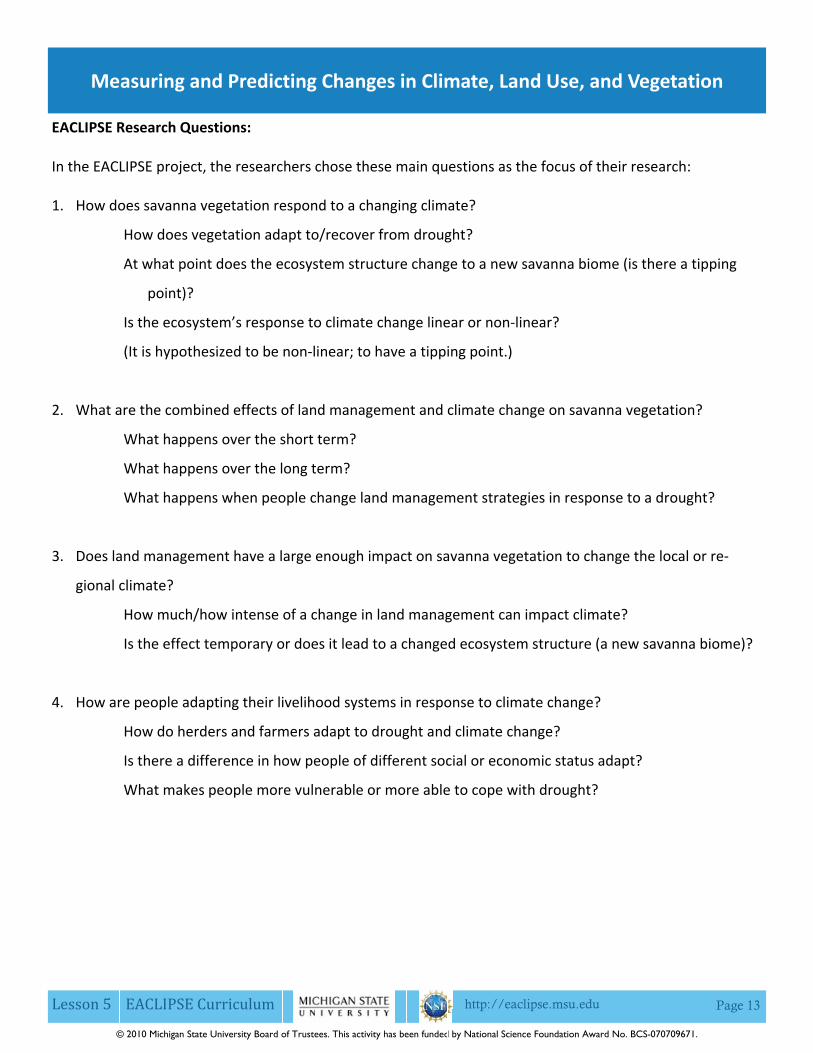
EACLIPSE Research Questions: In the EACLIPSE project, the researchers chose these main questions as the focus of their research: 1. How does savanna vegetation respond to a changing climate?
How does vegetation adapt to/recover from drought?
At what point does the ecosystem structure change to a new savanna biome (is there a tipping
point)?
Is the ecosystem’s response to climate change linear or non‐linear?
(It is hypothesized to be non‐linear; to have a tipping point.)
2. What are the combined effects of land management and climate change on savanna vegetation?
What happens over the short term?
What happens over the long term?
What happens when people change land management strategies in response to a drought?
3. Does land management have a large enough impact on savanna vegetation to change the local or re‐
gional climate?
How much/how intense of a change in land management can impact climate?
Is the effect temporary or does it lead to a changed ecosystem structure (a new savanna biome)?
4. How are people adapting their livelihood systems in response to climate change?
How do herders and farmers adapt to drought and climate change?
Is there a difference in how people of different social or economic status adapt?
What makes people more vulnerable or more able to cope with drought?
14
Lesson 5 EACLIPSE Curriculum
© 2010 Michigan State University Board of Trustees. This activity has been funded by National Science Foundation Award No. BCS-070709671.
http://eaclipse.msu.edu Page 14
Measuring and Predicting Changes in Climate, Land Use, and Vegetation
Reflection Questions: Are any of these questions similar to the ones you proposed? What is the same/different? What obstacles could you anticipate researchers facing in trying to answer these questions? If we look at climate change from only a scientific perspective, what are we missing? Which research question above addresses what happens to people as a result of climate change?
How does this lesson relate to the human‐land‐climate system loop? How does this lesson demonstrate how people can positively or negatively affect their environment?