Embed Size (px)
Citation preview
MICHIGAN STATE POLICE RETIREMENT SYSTEM • 1
Michigan State Police Retirement System a Pension and Other Employee Benefit Trust Fund of the State of Michigan
Comprehensive Annual Financial Report for the Fiscal Year Ended September 30, 2011
M S P R S
Prepared by:
Financial Services for
Office of Retirement Services P.O. Box 30171
Lansing, Michigan 48909-7671 517-322-5103
1-800-381-5111
2 • MICHIGAN STATE POLICE RETIREMENT SYSTEM
Table of Contents Introductory Section
Certificate of Achievement .......................................................................................................................................................... 4 Public Pension Standards Award ................................................................................................................................................. 5 Letter of Transmittal .................................................................................................................................................................... 6 Retirement Board Members ....................................................................................................................................................... 10 Advisors and Consultants ......................................................................................................................................................... 10 Organization Chart ................................................................................................................................................................... 11
Financial Section
Independent Auditor’s Report ................................................................................................................................................... 14 Management’s Discussion and Analysis ................................................................................................................................... 16 Basic Financial Statements Statements of Pension Plan and Other Postemployment Benefit Plan Net Assets ................................................................ 22 Statements of Changes in Pension Plan and Other Postemployment Benefit Plan Net Assets ............................................. 23 Notes to Basic Financial Statements .................................................................................................................................... 24 Required Supplementary Information Schedules of Funding Progress ............................................................................................................................................. 42 Schedules of Employer and Other Contributions.................................................................................................................. 43 Note to Required Supplementary Information ........................................................................................................................... 44 Supporting Schedules Comparative Summary Schedules of Administrative Expenses ........................................................................................... 45 Schedule of Investment Expenses ......................................................................................................................................... 46 Schedule of Payments for Professional Services .................................................................................................................. 46 Detail of Changes in Plan Net Assets (Pension and Other Postemployment Benefits) ......................................................... 48
Investment Section
Report on Investment Activity .................................................................................................................................................. 52 Asset Allocation ........................................................................................................................................................................ 61 Investment Results .................................................................................................................................................................... 62 List of Largest Stock Holdings .................................................................................................................................................. 63 List of Largest Bond Holdings ................................................................................................................................................. 63 Schedule of Investment Fees .................................................................................................................................................... 64 Schedule of Investment Commissions ....................................................................................................................................... 65 Investment Summary ................................................................................................................................................................. 66
Actuarial Section
Actuary’s Certification .............................................................................................................................................................. 70 Summary of Actuarial Assumptions and Methods .................................................................................................................... 73 Schedule of Active Member Valuation Data ............................................................................................................................. 75 Schedule of Changes in the Retirement Rolls ............................................................................................................................ 75 Prioritized Solvency Test........................................................................................................................................................... 76 Analysis of System Experience ................................................................................................................................................. 78 Summary of Plan Provisions .................................................................................................................................................... 79
Statistical Section
Schedules of Additions by Source ............................................................................................................................................. 83 Schedules of Deductions by Type ............................................................................................................................................. 84 Schedules of Changes in Net Assets .......................................................................................................................................... 85 Schedules of Benefits and Refunds by Type ............................................................................................................................. 86 Schedules of Retired Members by Type of Benefit ................................................................................................................... 87 Schedule of Other Postemployment Benefits ............................................................................................................................ 89 Schedules of Average Benefit Payments ................................................................................................................................... 90
Ten Year History of Membership .............................................................................................................................................. 94 Acknowledgements ................................................................................................................................................................... 95

MICHIGAN STATE POLICE RETIREMENT SYSTEM • 3
INTRODUCTORY SECTION
Certificate of Achievement Public Pension Standards Award
Letter of Transmittal Retirement Board Members
Advisors and Consultants Organization Chart

INTRODUCTORY SECTION
4 • MICHIGAN STATE POLICE RETIREMENT SYSTEM
Certificate of Achievement
INTRODUCTORY SECTION
MICHIGAN STATE POLICE RETIREMENT SYSTEM • 5
Public Pension Standards Award
P CP C Public Pension Coordinating Council
Public Pension Standards Award For Funding and Administration
2011
Presented to
Michigan Office of Retirement Services
In recognition of meeting professional standards for plan funding and administration as
set forth in the Public Pension Standards.
Presented by the Public Pension Coordinating Council, a confederation of
National Association of State Retirement Administrators (NASRA) National Conference on Public Employee Retirement Systems (NCPERS)
National Council on Teacher Retirement (NCTR)
Alan H. Winkle
Program Administrator
INTRODUCTORY SECTION
6 • MICHIGAN STATE POLICE RETIREMENT SYSTEM
Letter of Transmittal State Police Retirement System P.O. Box 30171 Lansing, Michigan 48909-7671 Telephone 517-322-5103 Outside Lansing 1-800-381-5111
STATE OF MICHIGAN
RICK SNYDER, Governor
DEPARTMENT OF TECHNOLOGY, MANAGEMENT & BUDGET
January 3, 2012 The Honorable Rick Snyder Governor, State of Michigan, Members of the Legislature State of Michigan, Retirement Board Members and Members, Retirees and Beneficiaries Ladies and Gentlemen: We are pleased to present the comprehensive annual financial report of the Michigan State Police Retirement System (System) for fiscal year 2011. INTRODUCTION TO REPORT The System was established by legislation under Public Act 251 of 1935. It now operates under the provisions of Public Act 182 of 1986, as amended, and is administrated by the Office of Retirement Services (ORS). The number of active and retired members and beneficiaries of the System is presented in Note 1 of the financial statements in the Financial Section of this report. The purpose of the System is to provide benefits for all State Police officers. The services performed by the staff provide benefits to members. Responsibility Responsibility for both the accuracy of the data and the completeness and fairness of the presentation, including all disclosures, rests with the leadership team of the System. To the best of our knowledge and belief, the enclosed data is accurate in all material respects and is reported in a manner designed to present fairly the financial position and results of operations of the System. Internal Control Structure The leadership team of the System is responsible for maintaining adequate internal accounting controls designed to provide reasonable assurance that transactions are executed in accordance with management’s general or specific authorization, and are recorded as necessary to maintain accountability for assets and to permit preparation of financial statements in accordance with accounting principles generally accepted in the United States of America. The internal control structure is designed to provide reasonable assurance regarding the safekeeping of assets and reliability of all financial records. The concept of reasonable assurance recognizes that the cost of a control should not exceed the benefits likely to be derived and that the valuation of costs and benefits requires estimates and judgments by management. This internal control structure includes maintaining written policies and procedures. Discussion and
INTRODUCTORY SECTION
MICHIGAN STATE POLICE RETIREMENT SYSTEM • 7
Letter of Transmittal (continued) analysis of net assets and related additions and deductions are presented in the Management Discussion and Analysis which can be found immediately following the Independent Auditor’s Report. Independent Auditors and Actuary The Office of the Auditor General (OAG), independent auditors, conducted an annual audit of the System. The independent auditor’s report on the System’s financial statements is included in the Financial Section of this report. Statute requires that an annual actuarial valuation be conducted. The purpose of the valuation is to evaluate the mortality, service, compensation and other financial experience of the System and to recommend employer-funding rates for the subsequent year. The annual actuarial valuation was completed by Gabriel Roeder Smith & Company for the fiscal year ended September 30, 2010. Actuarial certification and supporting statistics are included in the Actuarial Section of this report. Management’s Discussion and Analysis (MD&A) Generally Accepted Accounting Principles (GAAP) require that management provide a narrative introduction, overview, and analysis to accompany the Basic Financial Statements in the form of MD&A. This letter of transmittal is intended to complement MD&A and should be read in conjunction with it. The MD&A can be found immediately following the Independent Auditor’s Report. PROFILE OF THE GOVERNMENT The State Police Retirement System was created by Public Act 251 of 1935 and later superseded by Public Act 182 of 1986. A nine-member board, under the direction of a chairperson elected from the membership, administers the System to provide retirement benefits for State Police officers. Financing is provided by investment income and by an annual legislative appropriation. ECONOMIC CONDITIONS AND OUTLOOK Despite challenging economic times, the System continues to show steady performance over the long-term. Investments The State Treasurer is the investment fiduciary and custodian of all investments of the System pursuant to State law. The primary investment objective is to maximize the rate of return on the total investment portfolio, consistent with a high degree of prudence and sufficient diversity to eliminate inordinate risks and to meet the actuarial assumption for the investment return rate. The investment activity for the year produced a total rate of return on the portfolio of 6.7%. For the last five years, the System has experienced an annualized rate of return of 2.2%. A summary of asset allocation and rates of return can be found in the Investment Section of this report. Accounting System Transactions of the System are reported on the accrual basis of accounting. Additions are recorded when earned and deductions are recorded when incurred. Participants’ benefits are recorded when payable by law. We believe the accounting and administrative internal controls established by the System provide reasonable assurance the System is carrying out its responsibilities in safeguarding its assets, in maintaining the reliability of the financial records for preparing financial statements, and in maintaining accountability for its assets. Funding Funds are derived from the excess of additions to plan net assets over deductions from plan net assets. Funds are accumulated by the System to meet future benefit obligations to retirees and beneficiaries. The percentage computed by dividing the actuarial value of assets by the actuarial accrued liability is referred to as the “funded ratio.” This ratio provides an indication of the funding status of the System and generally, the greater this percentage, the stronger the System. Effective in fiscal year 2001, the System uses the actuarial valuation from the previous fiscal year for this
INTRODUCTORY SECTION
8 • MICHIGAN STATE POLICE RETIREMENT SYSTEM
Letter of Transmittal (continued) report in accordance with Governmental Accounting Standards Board (GASB) Statement No. 25. Consistent with this approach, the most recent actuarial valuation was performed as of September 30, 2010. The actuarial value of the assets and actuarial accrued liability of the System were $1.2 billion and $1.6 billion, respectively, resulting in a funded ratio of 75.4% at September 30, 2010. An historical perspective of funding levels for the System is presented on the Schedule of Funding Progress in the Required Supplementary Information in the Financial Section of this report. Postemployment Benefits An actuarial valuation is completed annually to determine the actuarial accrued liability if the postemployment benefits were to be pre-funded. If these benefits were pre-funded, the actuarial accrued liability as of September 30, 2010, would be $1.1 billion. Statement No. 43 does not require retroactive application of the reporting changes. Therefore, only three valuation years are presented and included in the required supplementary information of this report. MAJOR GOALS ACCOMPLISHED The Michigan Department of Technology, Management & Budget, Office of Retirement Services (ORS) is an innovative retirement organization driven to empower our customers for a successful today and a secure tomorrow. During fiscal year 2011, we refreshed our strategic plan, using input from staff members of the organization across multiple processes. The diverse opinions offered a unique opportunity to capture goals and successes from all aspects of the business, so we can offer our members the highest level of customer service. Below are some of the highlights from the last fiscal year. Additional accomplishments are highlighted below. Best In Class Business Practices Metrics for performance assessment: Each of the five major business processes is developing balanced scorecards that will align across the organization. Our leaders are establishing performance projections and targets to help us measure and manage process performance. The scorecards will also measure performance at different levels within each process, including team-level scorecards and individual scorecards. Retirement benchmarking survey: In September, we participated in a benchmarking survey with four other retirement systems. The survey helped us gather member satisfaction data, and allowed us to compare our results with those of our peers. We surveyed 1,415 recently retired members of all four of our retirement systems, and had a high response rate of 65.3 percent. Innovate and Improve Customer Service Improvements in call center operations: Our focus on people, processes, and technology has resulted in improved efficiency and accuracy in our call center. Improvements in the call routing system means customers can access relevant information faster, and call center representatives can spend more time answering questions. A team of part-time call center staff, coupled with a skills-based call routing system, ensures that customer calls are answered quickly by knowledgeable staff. Message Board common answers: We created a series of instant answers to common questions on the miAccount message board. Instead of asking a representative technical questions about registration, usernames, and passwords, members can find these answers all in one place, and our representatives can answer more complex, account-specific questions. Continuously Renewed Business-Driven Technology Online member statement delivery: Member Statements are now available in miAccount for active and deferred public school, state, and state police members. Members can access their statements through the Member Statement option on miAccount’s left navigation bar. Unlike paper statements printed at the end of the fiscal year, miAccount statements provide up-to-date information. In addition, they provide significant savings in both print and mailing costs
INTRODUCTORY SECTION
MICHIGAN STATE POLICE RETIREMENT SYSTEM • 9
Letter of Transmittal (continued) and in staff time previously dedicated to the process. With this tool in place, paper statements will no longer be mailed to members. HONORS ORS received the following recognitions:
• The Office of Retirement Services is one of three systems to receive a Special Award of Distinction for our achievements in Effective Communication from The National Association of Government Defined Contribution Administrators, Inc. (NAGDCA). This recognition was in response to our Personal Evaluation Campaign. Over 4,000 participants took action by getting involved in their retirement accounts and reviewing their asset allocation.
• The Public Pension Coordinating Council awarded the retirement system with the 2011 Public Pension Standards Award for Funding and Administration.
• Orion Development Group featured the Office of Retirement Services in their fall 2011 newsletter, highlighting the benefits of our process-focused management structure. In 1997, it could take up to six months for applicants to receive their first pension payments. As of June 2011, over 90 percent of initial pension payments are issued in the month of the retiree's effective date.
• The Government Finance Officers Association (GFOA) of the United Stated and Canada awarded ORS with the Certificate of Achievement for Excellence in Financial Reporting for our fiscal year 2010 Comprehensive Annual Finance Report (CAFR). This marks the 20th consecutive year ORS has received this prestigious award.
Acknowledgements The preparation of this report was accomplished with the dedication and cooperation of many people. It is intended to provide complete and reliable information as a basis for making management decisions, as a means of determining compliance with legal provisions, and as a means for determining responsible stewardship of the funds of the System. We would, therefore, like to express our appreciation for the assistance given by staff, advisors and the many people who contributed to its preparation. We believe their combined efforts have produced a report that will enable employers and plan members to better evaluate and understand the Michigan State Police Retirement System. Their cooperation contributes significantly to the success of the System.
Phillip J. Stoddard, Director Office of Retirement Services
INTRODUCTORY SECTION
10 • MICHIGAN STATE POLICE RETIREMENT SYSTEM
Administrative Organization
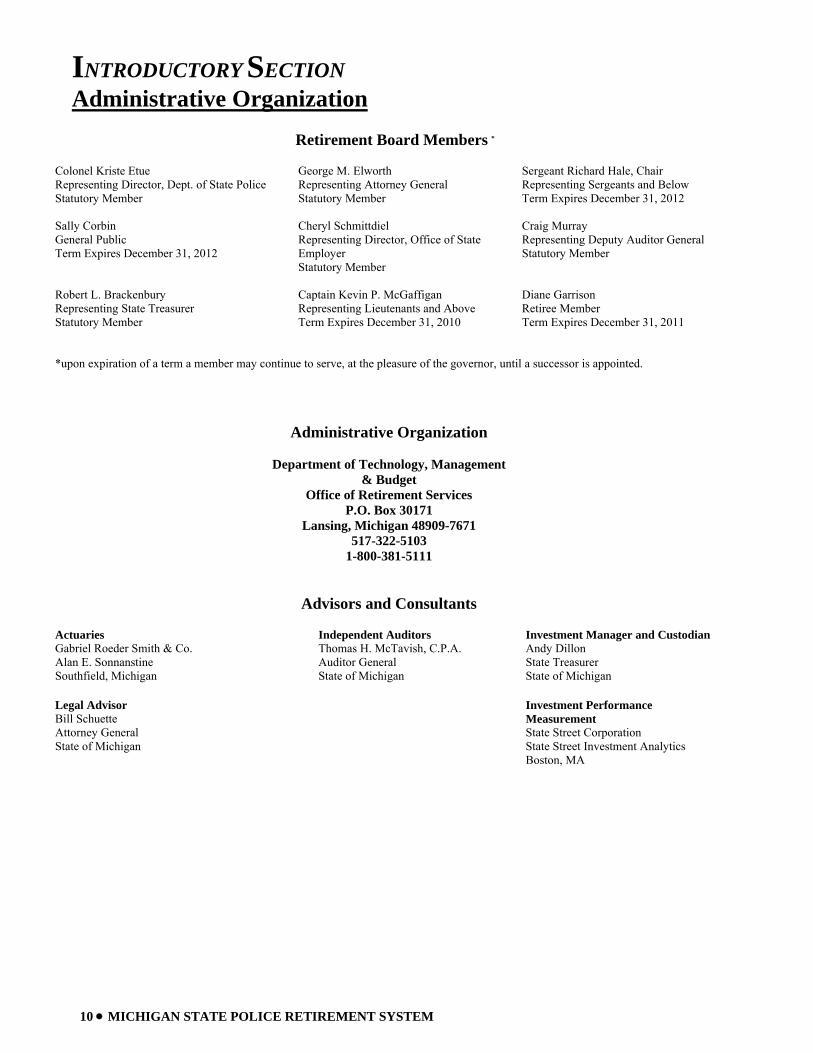
Retirement Board Members * Colonel Kriste Etue Representing Director, Dept. of State Police Statutory Member
George M. Elworth Representing Attorney General Statutory Member
Sergeant Richard Hale, Chair Representing Sergeants and Below Term Expires December 31, 2012
Sally Corbin General Public Term Expires December 31, 2012
Cheryl Schmittdiel Representing Director, Office of State Employer Statutory Member
Craig Murray Representing Deputy Auditor General Statutory Member
Robert L. Brackenbury Representing State Treasurer Statutory Member
Captain Kevin P. McGaffigan Representing Lieutenants and Above Term Expires December 31, 2010
Diane Garrison Retiree Member Term Expires December 31, 2011
*upon expiration of a term a member may continue to serve, at the pleasure of the governor, until a successor is appointed.
Administrative Organization Department of Technology, Management
& Budget Office of Retirement Services
P.O. Box 30171 Lansing, Michigan 48909-7671
517-322-5103 1-800-381-5111
Advisors and Consultants Actuaries Gabriel Roeder Smith & Co. Alan E. Sonnanstine Southfield, Michigan
Independent Auditors Thomas H. McTavish, C.P.A. Auditor General State of Michigan
Investment Manager and Custodian Andy Dillon State Treasurer State of Michigan
Legal Advisor Bill Schuette Attorney General State of Michigan
Investment Performance Measurement State Street Corporation State Street Investment Analytics Boston, MA
INTRODUCTORY SECTION
MICHIGAN STATE POLICE RETIREMENT SYSTEM • 11
Administrative Organization (continued)
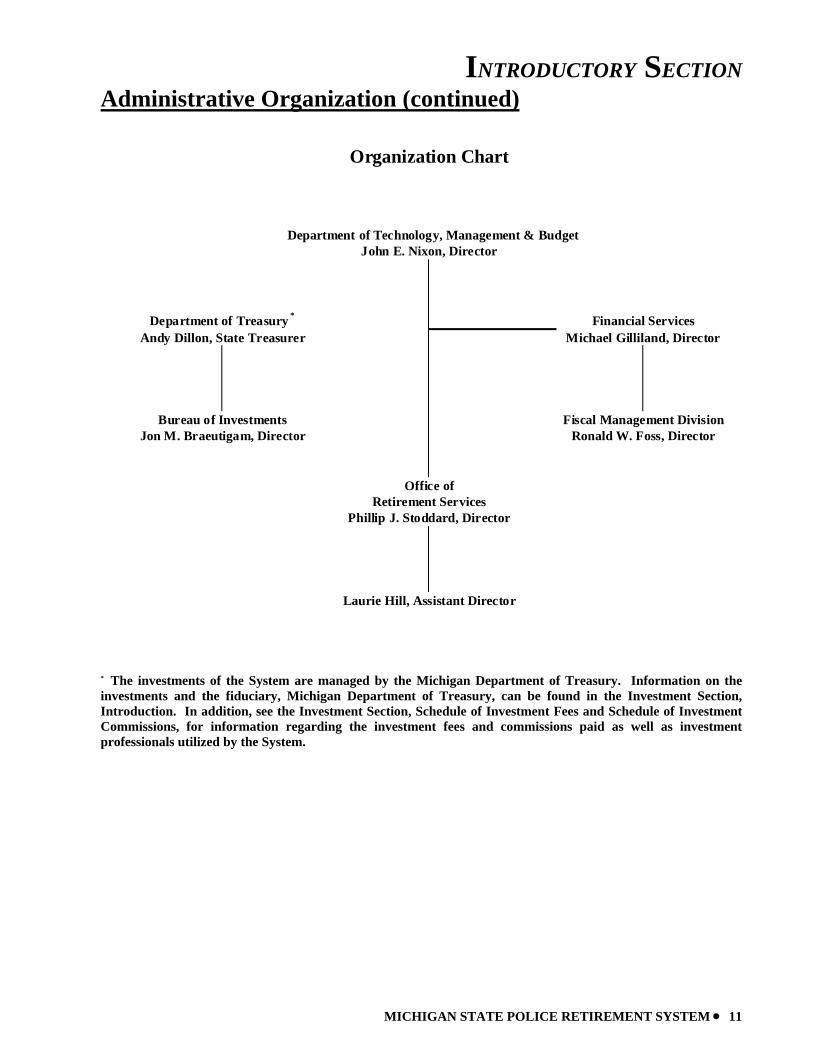
Andy Dillon, State Treasurer
Bureau of Investments Fiscal Management Division
Michael Gilliland, Director
Organization Chart
John E. Nixon, Director
Department of Treasury *
Department of Technology, Management & Budget
Financial Services
Laurie Hill, Assistant Director
Phillip J. Stoddard, Director
Jon M. Braeutigam, Director Ronald W. Foss, Director
Office ofRetirement Services
* The investments of the System are managed by the Michigan Department of Treasury. Information on the investments and the fiduciary, Michigan Department of Treasury, can be found in the Investment Section, Introduction. In addition, see the Investment Section, Schedule of Investment Fees and Schedule of Investment Commissions, for information regarding the investment fees and commissions paid as well as investment professionals utilized by the System.

12 • MICHIGAN STATE POLICE RETIREMENT SYSTEM
This page intentionally left blank.

MICHIGAN STATE POLICE RETIREMENT SYSTEM • 13
FINANCIAL SECTION
Independent Auditor’s Report Management’s Discussion and Analysis
Basic Financial Statements Notes to Basic Financial Statements
Required Supplementary Information Note to Required Supplementary Information
Supporting Schedules
FINANCIAL SECTION
14 • MICHIGAN STATE POLICE RETIREMENT SYSTEM
Independent Auditor’s Report
FINANCIAL SECTION
MICHIGAN STATE POLICE RETIREMENT SYSTEM • 15
Independent Auditor’s Report (continued)
FINANCIAL SECTION
16 • MICHIGAN STATE POLICE RETIREMENT SYSTEM
Management’s Discussion and Analysis Our discussion and analysis of the Michigan State Police Retirement System’s (System) financial performance provides an overview of the System’s financial activities for the fiscal year ended September 30, 2011. Please read it in conjunction with the transmittal letter in the Introductory Section on page 6 and the basic financial statements, which follow this discussion.
FINANCIAL HIGHLIGHTS
• System assets exceeded its liabilities at the close of fiscal year 2011 by $979.4 million (reported as net assets). Net assets are held in trust to meet future benefit payments.
• The System’s funding objective is to meet long-term benefit obligations through contributions and investment income. As of September 30, 2010 the funded ratio was approximately 75.4% for pension benefits and the funded ratio for other postemployment benefits (OPEB) was 0.0%.
• Additions for the year were $117.7 million, which are comprised primarily of contributions of $75.4 million and investment gains of $42.3 million.
• Deductions increased over the prior year from $129.8 million to $142.0 million or 9.4%. This is largely due to increased retirement benefit payments, including many Deferred Retirement Option Plan (DROP) payoffs as members reached the end date of their participation in the plan and withdrew their accumulated benefits.
THE STATEMENT OF PLAN NET ASSETS AND THE STATEMENT OF CHANGES IN PLAN NET ASSETS
This Comprehensive Annual Financial Report (CAFR) consists of two financial statements; The Statements of Pension Plan and Other Postemployment Benefit Plan Net Assets (page 22) and The Statements of Changes in Pension Plan and Other Postemployment Benefit Plan Net Assets (page 23). These financial statements report information about the System, as a whole, and about its financial condition that should help answer the question: Is the System, as a whole, better off or worse off as a result of this year’s activities? These statements include all assets and liabilities using the economic resources measurement focus and the accrual basis of accounting. Under the accrual basis of accounting, all additions and deductions are taken into account regardless of when cash is received or paid. The Statement of Pension Plan and Other Postemployment Benefit Plan Net Assets presents all of the System’s assets and liabilities, with the difference between the two reported as net assets. Over time, increases and decreases in net assets measure whether the System’s financial position is improving or deteriorating. The Statement of Changes in Pension Plan and Other Postemployment Benefit Plan Net Assets presents how the System’s net assets changed during the most recent fiscal year. These two financial statements should be reviewed along with the Schedules of Funding Progress (page 42) and Schedules of Employer and Other Contributions (page 43) to determine whether the System is becoming financially stronger or weaker and to understand changes over time in the funded status of the System.
FINANCIAL SECTION
MICHIGAN STATE POLICE RETIREMENT SYSTEM • 17
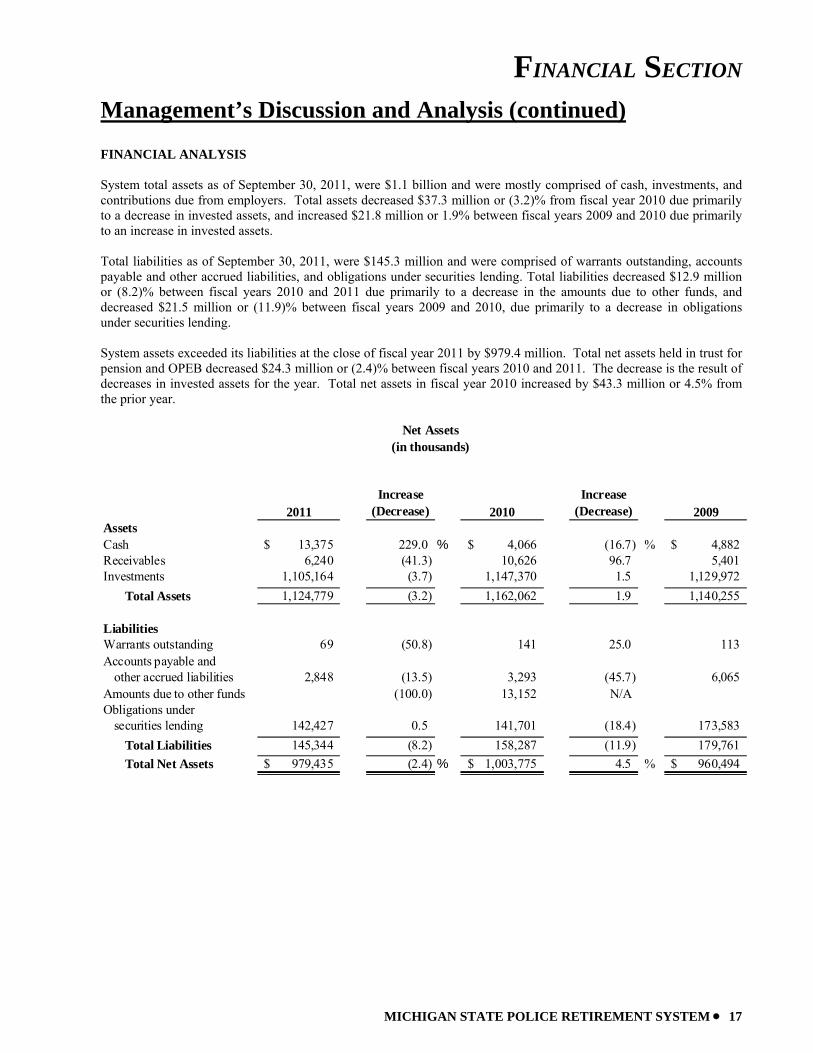
Management’s Discussion and Analysis (continued) FINANCIAL ANALYSIS System total assets as of September 30, 2011, were $1.1 billion and were mostly comprised of cash, investments, and contributions due from employers. Total assets decreased $37.3 million or (3.2)% from fiscal year 2010 due primarily to a decrease in invested assets, and increased $21.8 million or 1.9% between fiscal years 2009 and 2010 due primarily to an increase in invested assets. Total liabilities as of September 30, 2011, were $145.3 million and were comprised of warrants outstanding, accounts payable and other accrued liabilities, and obligations under securities lending. Total liabilities decreased $12.9 million or (8.2)% between fiscal years 2010 and 2011 due primarily to a decrease in the amounts due to other funds, and decreased $21.5 million or (11.9)% between fiscal years 2009 and 2010, due primarily to a decrease in obligations under securities lending. System assets exceeded its liabilities at the close of fiscal year 2011 by $979.4 million. Total net assets held in trust for pension and OPEB decreased $24.3 million or (2.4)% between fiscal years 2010 and 2011. The decrease is the result of decreases in invested assets for the year. Total net assets in fiscal year 2010 increased by $43.3 million or 4.5% from the prior year.
2011Increase
(Decrease) 2010Increase
(Decrease) 2009AssetsCash 13,375$ 229.0 % 4,066$ (16.7) % 4,882$ Receivables 6,240 (41.3) 10,626 96.7 5,401 Investments 1,105,164 (3.7) 1,147,370 1.5 1,129,972
Total Assets 1,124,779 (3.2) 1,162,062 1.9 1,140,255
LiabilitiesWarrants outstanding 69 (50.8) 141 25.0 113 Accounts payable and
other accrued liabilities 2,848 (13.5) 3,293 (45.7) 6,065 Amounts due to other funds (100.0) 13,152 N/AObligations under
securities lending 142,427 0.5 141,701 (18.4) 173,583 Total Liabilities 145,344 (8.2) 158,287 (11.9) 179,761 Total Net Assets 979,435$ (2.4) % 1,003,775$ 4.5 % 960,494$
Net Assets(in thousands)
FINANCIAL SECTION
18 • MICHIGAN STATE POLICE RETIREMENT SYSTEM
Management’s Discussion and Analysis (continued) ADDITIONS TO PLAN NET ASSETS The reserves needed to finance pension and other postemployment benefits are accumulated through the collection of employer contributions and through earnings on investments. Contributions and net investment gains for fiscal year 2011 totaled $117.6 million. Total additions decreased $55.4 million from those of fiscal year 2010, due primarily to decreased net investment gains. Total additions increased $183.7 million between fiscal years 2009 and 2010 due primarily to increased net investment gains. Total contributions increased between fiscal years 2010 and 2011 by $2.9 million or 4.1%. This increase is due primarily to activity related to the Early Retiree Reinsurance Program and Medicare Part D Retiree Drug subsidy. Total contributions increased between fiscal years 2009 and 2010 by $5.4 million or 8.1%. Net investment gains decreased from fiscal year 2010 by $58.4 million. Net investment income gains increased between fiscal years 2009 and 2010 by $178.3 million. The Investment Section of this report reviews the results of investment activity for fiscal year 2011. DEDUCTIONS FROM PLAN NET ASSETS The expenses of the System include the payment of pension benefits to members and beneficiaries, payment for health, dental and vision benefits, refund of contributions to former members, and the cost of administering the System. Total deductions for fiscal year 2011 were $142.0 million, an increase of 9.4% over fiscal year 2010 deductions. The health, dental and vision care expenses to members and beneficiaries decreased by $2.4 million or (7.7)% from $31.4 million to $29.0 million. This compares to an increase of $1.4 million or 4.6% from $30.0 million to $31.4 million between fiscal years 2009 and 2010. Pension benefit payments increased by $14.6 million or 15.0% between fiscal years 2010 and 2011, and by $8.7 million or 9.8% between fiscal years 2009 and 2010. The increase in pension benefit deductions in 2011 is due primarily to an increase in DROP distributions and an increase in retirees (95). In fiscal year 2010, the increase in pension benefit deductions was due primarily to an increase in retirees (41). Administrative expenses decreased by $13.0 thousand or (1.0)% from $1.2 million in fiscal year 2010 to $1.2 million in fiscal year 2011, due primarily to a decrease in OPEB administrative fees paid to insurance carriers. Administrative expenses decreased by $0.8 million or (37.9)% between fiscal years 2009 and 2010, due primarily to an decrease in OPEB administrative fees paid to insurance carriers.
FINANCIAL SECTION
MICHIGAN STATE POLICE RETIREMENT SYSTEM • 19
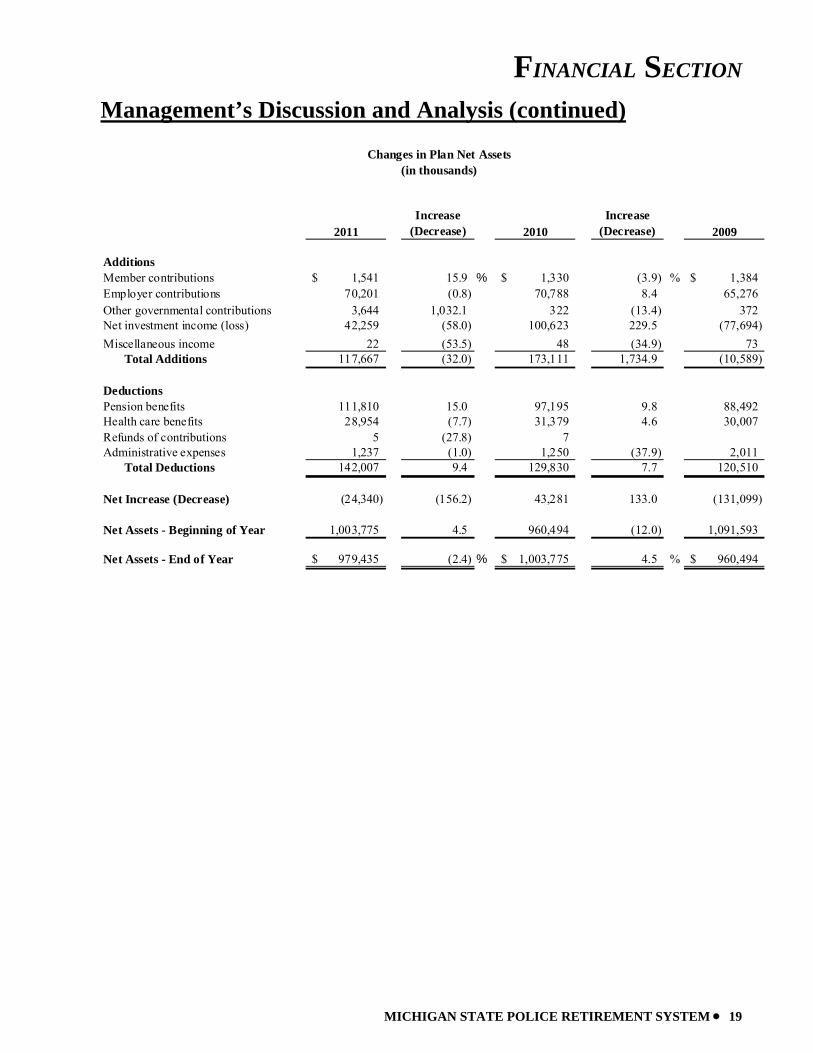
Management’s Discussion and Analysis (continued)
2011Increase
(Decrease) 2010Increase
(Decrease) 2009
AdditionsMember contributions 1,541$ 15.9 % 1,330$ (3.9) % 1,384$ Employer contributions 70,201 (0.8) 70,788 8.4 65,276 Other governmental contributions 3,644 1,032.1 322 (13.4) 372 Net investment income (loss) 42,259 (58.0) 100,623 229.5 (77,694) Miscellaneous income 22 (53.5) 48 (34.9) 73
Total Additions 117,667 (32.0) 173,111 1,734.9 (10,589)
DeductionsPension benefits 111,810 15.0 97,195 9.8 88,492 Health care benefits 28,954 (7.7) 31,379 4.6 30,007 Refunds of contributions 5 (27.8) 7 Administrative expenses 1,237 (1.0) 1,250 (37.9) 2,011
Total Deductions 142,007 9.4 129,830 7.7 120,510
Net Increase (Decrease) (24,340) (156.2) 43,281 133.0 (131,099)
Net Assets - Beginning of Year 1,003,775 4.5 960,494 (12.0) 1,091,593
Net Assets - End of Year 979,435$ (2.4) % 1,003,775$ 4.5 % 960,494$
Changes in Plan Net Assets(in thousands)
FINANCIAL SECTION
20 • MICHIGAN STATE POLICE RETIREMENT SYSTEM
Management’s Discussion and Analysis (continued) RETIREMENT SYSTEM AS A WHOLE The System's combined net assets experienced a decrease in 2011 after an increase in 2010 and a decrease in 2009. The System’s rate of return decreased an overall (1.8)% from a 8.5% return in fiscal year 2010 to a 6.7% return during fiscal year 2011. Management believes that the system remains financially sound and positioned to meet its ongoing benefit obligations due, in part, to a prudent investment program, cost controls, and strategic planning. CONTACTING SYSTEM FINANCIAL MANAGEMENT
This financial report is designed to provide the Retirement Board, our membership, taxpayers, investors, and creditors with a general overview of the System’s finances and to demonstrate the System’s accountability for the money it receives. If you have any questions about this report or need additional financial information, contact the Office of Retirement Services, P.O. Box 30171, Lansing, MI 48909-7671.

MICHIGAN STATE POLICE RETIREMENT SYSTEM • 21
This page intentionally left blank.
FINANCIAL SECTION
22 • MICHIGAN STATE POLICE RETIREMENT SYSTEM
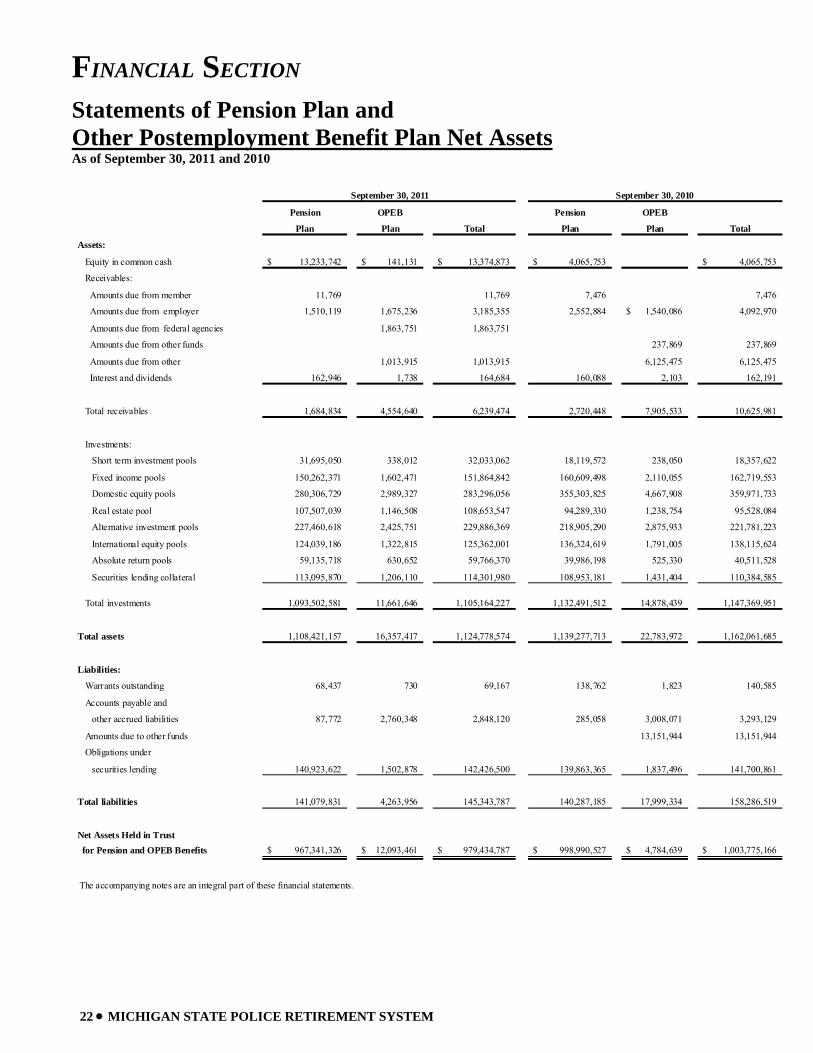
Statements of Pension Plan and Other Postemployment Benefit Plan Net Assets As of September 30, 2011 and 2010
September 30, 2011 September 30, 2010
Pension OPEB Pension OPEB
Plan Plan Total Plan Plan Total
Assets:
Equity in common cash 13,233,742$ 141,131$ 13,374,873$ 4,065,753$ 4,065,753$
Receivables:
Amounts due from member 11,769 11,769 7,476 7,476
Amounts due from employer 1,510,119 1,675,236 3,185,355 2,552,884 1,540,086$ 4,092,970
Amounts due from federal agencies 1,863,751 1,863,751
Amounts due from other funds 237,869 237,869
Amounts due from other 1,013,915 1,013,915 6,125,475 6,125,475
Interest and dividends 162,946 1,738 164,684 160,088 2,103 162,191
Total receivables 1,684,834 4,554,640 6,239,474 2,720,448 7,905,533 10,625,981
Investments:
Short term investment pools 31,695,050 338,012 32,033,062 18,119,572 238,050 18,357,622
Fixed income pools 150,262,371 1,602,471 151,864,842 160,609,498 2,110,055 162,719,553
Domestic equity pools 280,306,729 2,989,327 283,296,056 355,303,825 4,667,908 359,971,733
Real estate pool 107,507,039 1,146,508 108,653,547 94,289,330 1,238,754 95,528,084
Alternative investment pools 227,460,618 2,425,751 229,886,369 218,905,290 2,875,933 221,781,223
International equity pools 124,039,186 1,322,815 125,362,001 136,324,619 1,791,005 138,115,624
Absolute return pools 59,135,718 630,652 59,766,370 39,986,198 525,330 40,511,528
Securities lending collateral 113,095,870 1,206,110 114,301,980 108,953,181 1,431,404 110,384,585
Total investments 1,093,502,581 11,661,646 1,105,164,227 1,132,491,512 14,878,439 1,147,369,951
Total assets 1,108,421,157 16,357,417 1,124,778,574 1,139,277,713 22,783,972 1,162,061,685
Liabilities:
Warrants outstanding 68,437 730 69,167 138,762 1,823 140,585
Accounts payable and
other accrued liabilities 87,772 2,760,348 2,848,120 285,058 3,008,071 3,293,129
Amounts due to other funds 13,151,944 13,151,944
Obligations under
securities lending 140,923,622 1,502,878 142,426,500 139,863,365 1,837,496 141,700,861
Total liabilities 141,079,831 4,263,956 145,343,787 140,287,185 17,999,334 158,286,519
Net Assets Held in Trust for Pension and OPEB Benefits 967,341,326$ 12,093,461$ 979,434,787$ 998,990,527$ 4,784,639$ 1,003,775,166$
The accompanying notes are an integral part of these financial statements.
FINANCIAL SECTION
MICHIGAN STATE POLICE RETIREMENT SYSTEM • 23
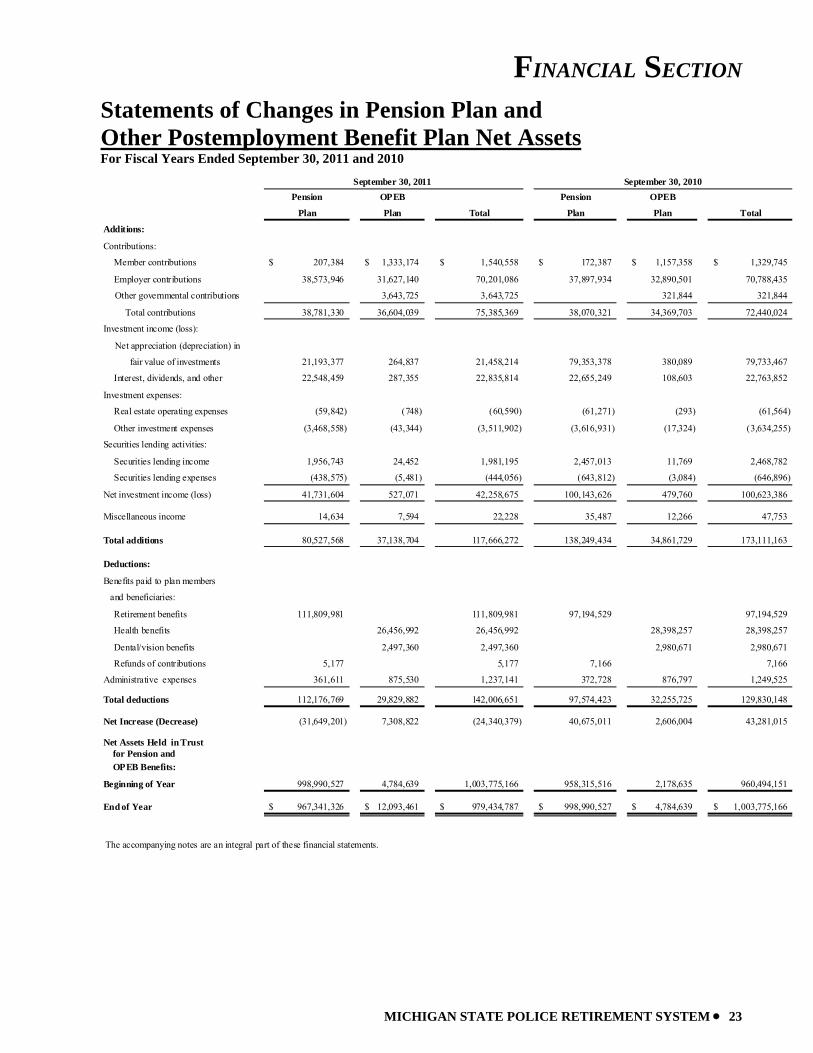
Statements of Changes in Pension Plan and Other Postemployment Benefit Plan Net Assets For Fiscal Years Ended September 30, 2011 and 2010
September 30, 2011 September 30, 2010Pension OPEB Pension OPEB
Plan Plan Total Plan Plan Total
Additions:
Contributions:
Member contributions 207,384$ 1,333,174$ 1,540,558$ 172,387$ 1,157,358$ 1,329,745$
Employer contributions 38,573,946 31,627,140 70,201,086 37,897,934 32,890,501 70,788,435
Other governmental contributions 3,643,725 3,643,725 321,844 321,844
Total contributions 38,781,330 36,604,039 75,385,369 38,070,321 34,369,703 72,440,024
Investment income (loss):
Net appreciation (depreciation) in
fair value of investments 21,193,377 264,837 21,458,214 79,353,378 380,089 79,733,467
Interest, dividends, and other 22,548,459 287,355 22,835,814 22,655,249 108,603 22,763,852
Investment expenses:
Real estate operating expenses (59,842) (748) (60,590) (61,271) (293) (61,564)
Other investment expenses (3,468,558) (43,344) (3,511,902) (3,616,931) (17,324) (3,634,255)
Securities lending activities:
Securities lending income 1,956,743 24,452 1,981,195 2,457,013 11,769 2,468,782
Securities lending expenses (438,575) (5,481) (444,056) (643,812) (3,084) (646,896)
Net investment income (loss) 41,731,604 527,071 42,258,675 100,143,626 479,760 100,623,386
Miscellaneous income 14,634 7,594 22,228 35,487 12,266 47,753
Total additions 80,527,568 37,138,704 117,666,272 138,249,434 34,861,729 173,111,163
Deductions:
Benefits paid to plan members
and beneficiaries:
Retirement benefits 111,809,981 111,809,981 97,194,529 97,194,529
Health benefits 26,456,992 26,456,992 28,398,257 28,398,257
Dental/vision benefits 2,497,360 2,497,360 2,980,671 2,980,671
Refunds of contributions 5,177 5,177 7,166 7,166
Administrative expenses 361,611 875,530 1,237,141 372,728 876,797 1,249,525
Total deductions 112,176,769 29,829,882 142,006,651 97,574,423 32,255,725 129,830,148
Net Increase (Decrease) (31,649,201) 7,308,822 (24,340,379) 40,675,011 2,606,004 43,281,015
Net Assets Held in Trust for Pension and OPEB Benefits:
Beginning of Year 998,990,527 4,784,639 1,003,775,166 958,315,516 2,178,635 960,494,151
End of Year 967,341,326$ 12,093,461$ 979,434,787$ 998,990,527$ 4,784,639$ 1,003,775,166$
The accompanying notes are an integral part of these financial statements.
FINANCIAL SECTION
24 • MICHIGAN STATE POLICE RETIREMENT SYSTEM
Notes to Basic Financial Statements September 30, 2011 and 2010
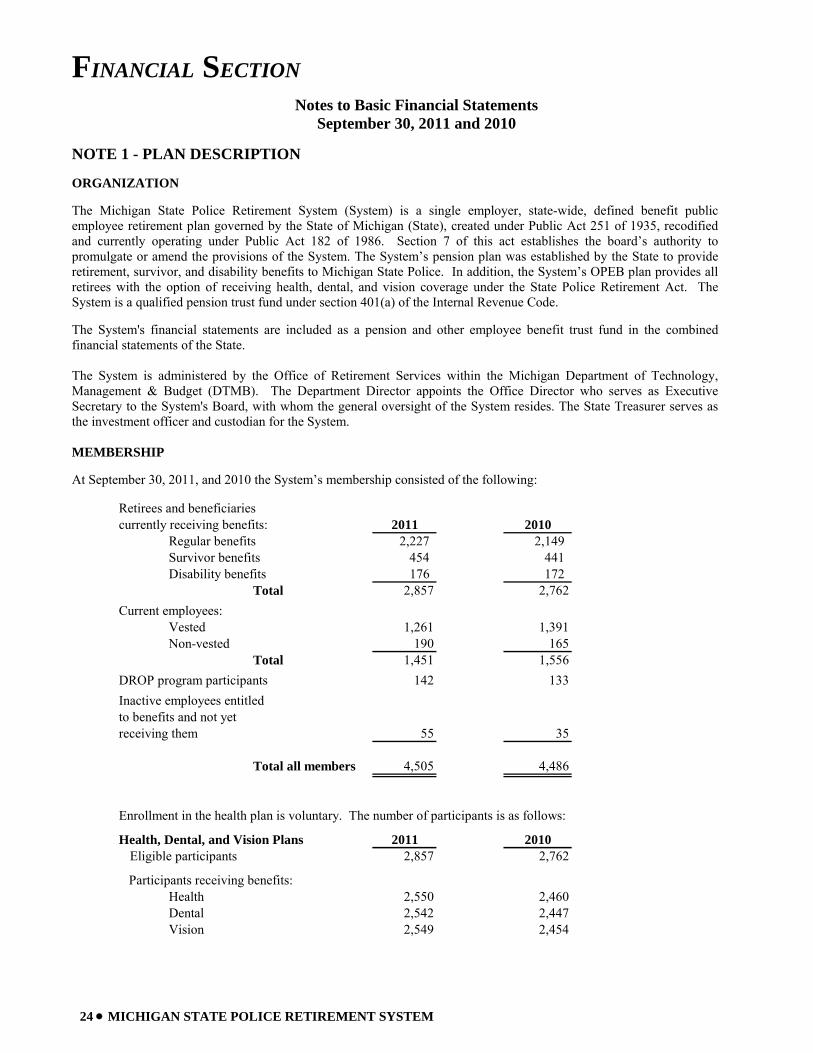
NOTE 1 - PLAN DESCRIPTION ORGANIZATION The Michigan State Police Retirement System (System) is a single employer, state-wide, defined benefit public employee retirement plan governed by the State of Michigan (State), created under Public Act 251 of 1935, recodified and currently operating under Public Act 182 of 1986. Section 7 of this act establishes the board’s authority to promulgate or amend the provisions of the System. The System’s pension plan was established by the State to provide retirement, survivor, and disability benefits to Michigan State Police. In addition, the System’s OPEB plan provides all retirees with the option of receiving health, dental, and vision coverage under the State Police Retirement Act. The System is a qualified pension trust fund under section 401(a) of the Internal Revenue Code. The System's financial statements are included as a pension and other employee benefit trust fund in the combined financial statements of the State. The System is administered by the Office of Retirement Services within the Michigan Department of Technology, Management & Budget (DTMB). The Department Director appoints the Office Director who serves as Executive Secretary to the System's Board, with whom the general oversight of the System resides. The State Treasurer serves as the investment officer and custodian for the System. MEMBERSHIP At September 30, 2011, and 2010 the System’s membership consisted of the following:
Retirees and beneficiariescurrently receiving benefits: 2011 2010
Regular benefits 2,227 2,149 Survivor benefits 454 441 Disability benefits 176 172
Total 2,857 2,762Current employees:
Vested 1,261 1,391 Non-vested 190 165
Total 1,451 1,556DROP program participants 142 133Inactive employees entitledto benefits and not yetreceiving them 55 35
Total all members 4,505 4,486
Enrollment in the health plan is voluntary. The number of participants is as follows:
Health, Dental, and Vision Plans 2011 2010Eligible participants 2,857 2,762
Participants receiving benefits: Health 2,550 2,460 Dental 2,542 2,447 Vision 2,549 2,454
FINANCIAL SECTION
MICHIGAN STATE POLICE RETIREMENT SYSTEM • 25
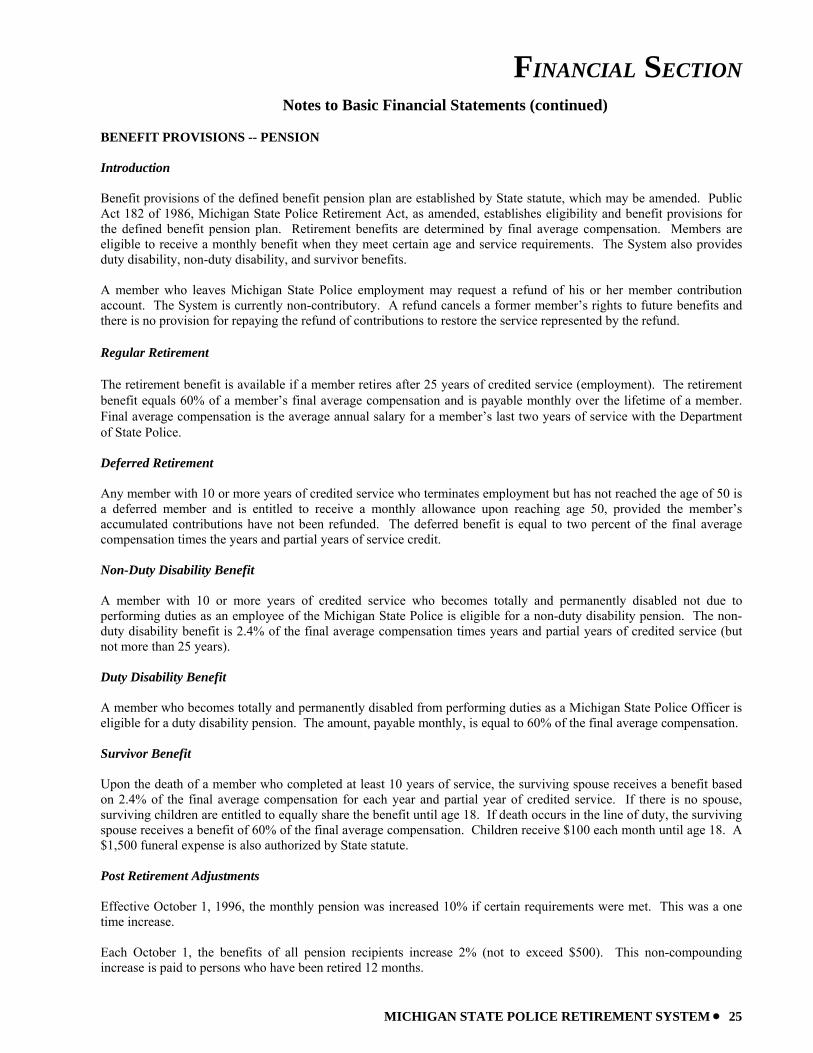
Notes to Basic Financial Statements (continued) BENEFIT PROVISIONS -- PENSION Introduction Benefit provisions of the defined benefit pension plan are established by State statute, which may be amended. Public Act 182 of 1986, Michigan State Police Retirement Act, as amended, establishes eligibility and benefit provisions for the defined benefit pension plan. Retirement benefits are determined by final average compensation. Members are eligible to receive a monthly benefit when they meet certain age and service requirements. The System also provides duty disability, non-duty disability, and survivor benefits. A member who leaves Michigan State Police employment may request a refund of his or her member contribution account. The System is currently non-contributory. A refund cancels a former member’s rights to future benefits and there is no provision for repaying the refund of contributions to restore the service represented by the refund. Regular Retirement The retirement benefit is available if a member retires after 25 years of credited service (employment). The retirement benefit equals 60% of a member’s final average compensation and is payable monthly over the lifetime of a member. Final average compensation is the average annual salary for a member’s last two years of service with the Department of State Police. Deferred Retirement Any member with 10 or more years of credited service who terminates employment but has not reached the age of 50 is a deferred member and is entitled to receive a monthly allowance upon reaching age 50, provided the member’s accumulated contributions have not been refunded. The deferred benefit is equal to two percent of the final average compensation times the years and partial years of service credit. Non-Duty Disability Benefit A member with 10 or more years of credited service who becomes totally and permanently disabled not due to performing duties as an employee of the Michigan State Police is eligible for a non-duty disability pension. The non-duty disability benefit is 2.4% of the final average compensation times years and partial years of credited service (but not more than 25 years). Duty Disability Benefit A member who becomes totally and permanently disabled from performing duties as a Michigan State Police Officer is eligible for a duty disability pension. The amount, payable monthly, is equal to 60% of the final average compensation. Survivor Benefit Upon the death of a member who completed at least 10 years of service, the surviving spouse receives a benefit based on 2.4% of the final average compensation for each year and partial year of credited service. If there is no spouse, surviving children are entitled to equally share the benefit until age 18. If death occurs in the line of duty, the surviving spouse receives a benefit of 60% of the final average compensation. Children receive $100 each month until age 18. A $1,500 funeral expense is also authorized by State statute. Post Retirement Adjustments Effective October 1, 1996, the monthly pension was increased 10% if certain requirements were met. This was a one time increase. Each October 1, the benefits of all pension recipients increase 2% (not to exceed $500). This non-compounding increase is paid to persons who have been retired 12 months.
FINANCIAL SECTION
26 • MICHIGAN STATE POLICE RETIREMENT SYSTEM
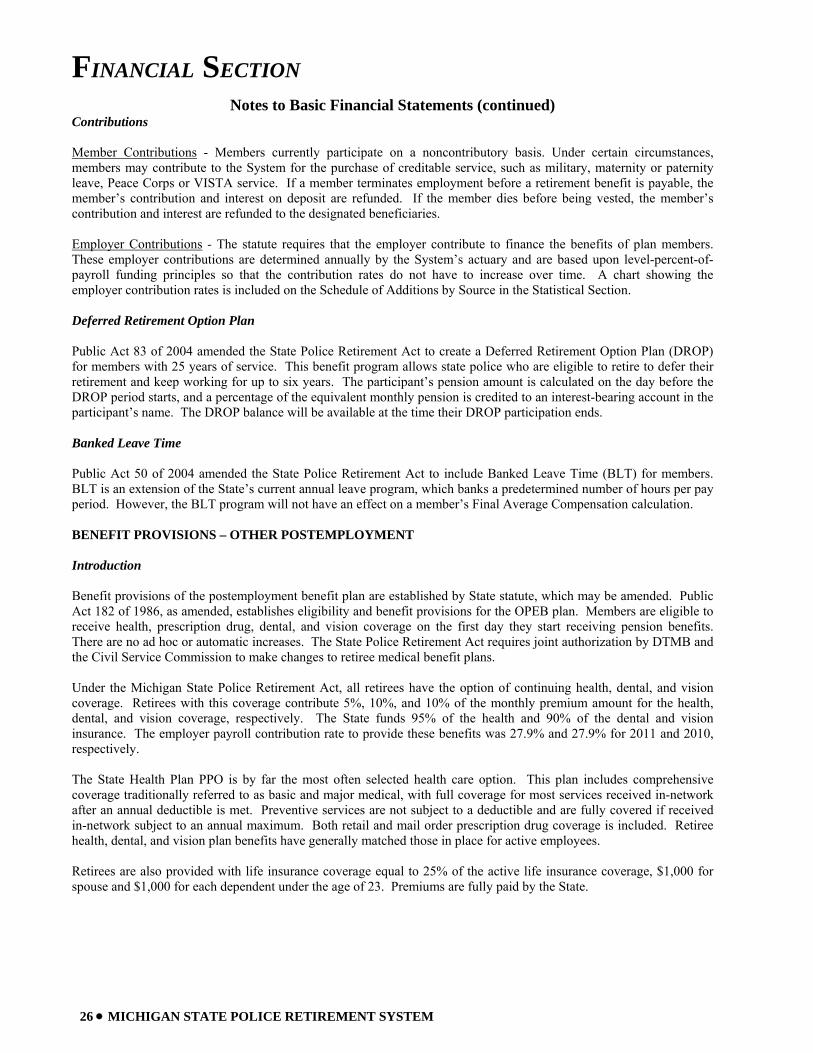
Notes to Basic Financial Statements (continued) Contributions Member Contributions - Members currently participate on a noncontributory basis. Under certain circumstances, members may contribute to the System for the purchase of creditable service, such as military, maternity or paternity leave, Peace Corps or VISTA service. If a member terminates employment before a retirement benefit is payable, the member’s contribution and interest on deposit are refunded. If the member dies before being vested, the member’s contribution and interest are refunded to the designated beneficiaries. Employer Contributions - The statute requires that the employer contribute to finance the benefits of plan members. These employer contributions are determined annually by the System’s actuary and are based upon level-percent-of-payroll funding principles so that the contribution rates do not have to increase over time. A chart showing the employer contribution rates is included on the Schedule of Additions by Source in the Statistical Section. Deferred Retirement Option Plan Public Act 83 of 2004 amended the State Police Retirement Act to create a Deferred Retirement Option Plan (DROP) for members with 25 years of service. This benefit program allows state police who are eligible to retire to defer their retirement and keep working for up to six years. The participant’s pension amount is calculated on the day before the DROP period starts, and a percentage of the equivalent monthly pension is credited to an interest-bearing account in the participant’s name. The DROP balance will be available at the time their DROP participation ends. Banked Leave Time Public Act 50 of 2004 amended the State Police Retirement Act to include Banked Leave Time (BLT) for members. BLT is an extension of the State’s current annual leave program, which banks a predetermined number of hours per pay period. However, the BLT program will not have an effect on a member’s Final Average Compensation calculation. BENEFIT PROVISIONS – OTHER POSTEMPLOYMENT Introduction Benefit provisions of the postemployment benefit plan are established by State statute, which may be amended. Public Act 182 of 1986, as amended, establishes eligibility and benefit provisions for the OPEB plan. Members are eligible to receive health, prescription drug, dental, and vision coverage on the first day they start receiving pension benefits. There are no ad hoc or automatic increases. The State Police Retirement Act requires joint authorization by DTMB and the Civil Service Commission to make changes to retiree medical benefit plans. Under the Michigan State Police Retirement Act, all retirees have the option of continuing health, dental, and vision coverage. Retirees with this coverage contribute 5%, 10%, and 10% of the monthly premium amount for the health, dental, and vision coverage, respectively. The State funds 95% of the health and 90% of the dental and vision insurance. The employer payroll contribution rate to provide these benefits was 27.9% and 27.9% for 2011 and 2010, respectively. The State Health Plan PPO is by far the most often selected health care option. This plan includes comprehensive coverage traditionally referred to as basic and major medical, with full coverage for most services received in-network after an annual deductible is met. Preventive services are not subject to a deductible and are fully covered if received in-network subject to an annual maximum. Both retail and mail order prescription drug coverage is included. Retiree health, dental, and vision plan benefits have generally matched those in place for active employees. Retirees are also provided with life insurance coverage equal to 25% of the active life insurance coverage, $1,000 for spouse and $1,000 for each dependent under the age of 23. Premiums are fully paid by the State.
FINANCIAL SECTION
MICHIGAN STATE POLICE RETIREMENT SYSTEM • 27
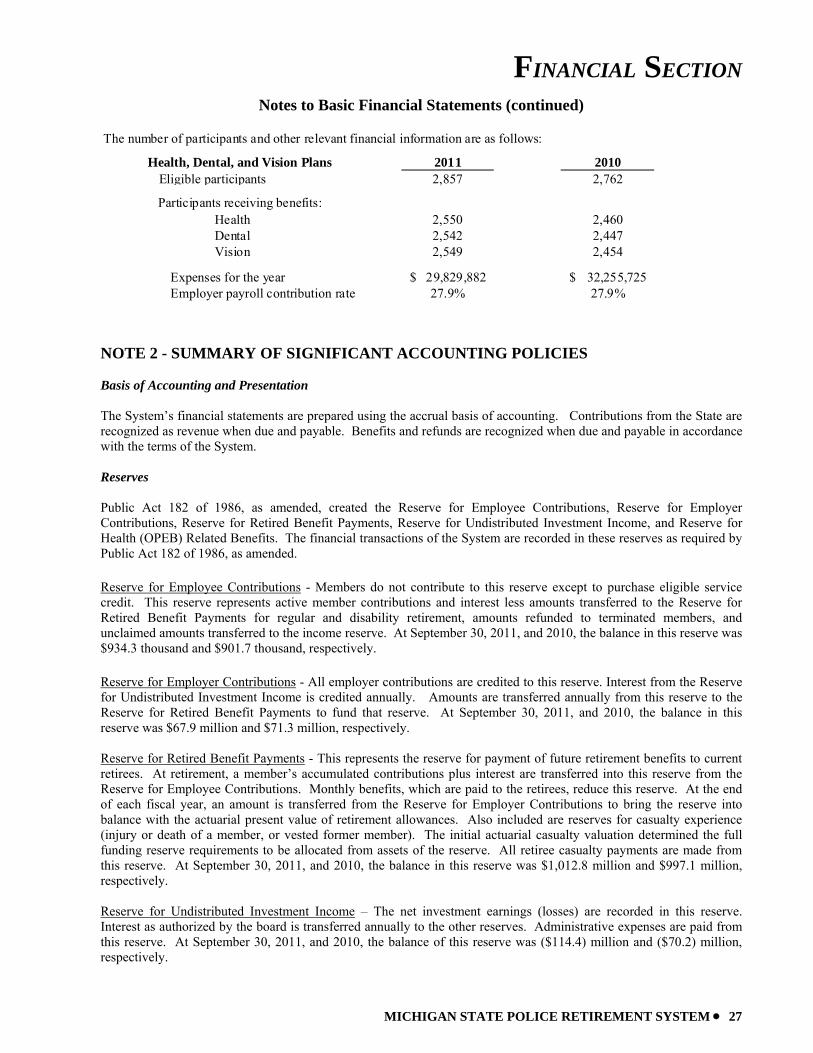
Notes to Basic Financial Statements (continued) The number of participants and other relevant financial information are as follows:
Health, Dental, and Vision Plans 2011 2010Eligible participants 2,857 2,762
Participants receiving benefits:Health 2,550 2,460Dental 2,542 2,447Vision 2,549 2,454
Expenses for the year 29,829,882$ 32,255,725$ Employer payroll contribution rate 27.9% 27.9%
NOTE 2 - SUMMARY OF SIGNIFICANT ACCOUNTING POLICIES Basis of Accounting and Presentation The System’s financial statements are prepared using the accrual basis of accounting. Contributions from the State are recognized as revenue when due and payable. Benefits and refunds are recognized when due and payable in accordance with the terms of the System. Reserves Public Act 182 of 1986, as amended, created the Reserve for Employee Contributions, Reserve for Employer Contributions, Reserve for Retired Benefit Payments, Reserve for Undistributed Investment Income, and Reserve for Health (OPEB) Related Benefits. The financial transactions of the System are recorded in these reserves as required by Public Act 182 of 1986, as amended. Reserve for Employee Contributions - Members do not contribute to this reserve except to purchase eligible service credit. This reserve represents active member contributions and interest less amounts transferred to the Reserve for Retired Benefit Payments for regular and disability retirement, amounts refunded to terminated members, and unclaimed amounts transferred to the income reserve. At September 30, 2011, and 2010, the balance in this reserve was $934.3 thousand and $901.7 thousand, respectively.
Reserve for Employer Contributions - All employer contributions are credited to this reserve. Interest from the Reserve for Undistributed Investment Income is credited annually. Amounts are transferred annually from this reserve to the Reserve for Retired Benefit Payments to fund that reserve. At September 30, 2011, and 2010, the balance in this reserve was $67.9 million and $71.3 million, respectively. Reserve for Retired Benefit Payments - This represents the reserve for payment of future retirement benefits to current retirees. At retirement, a member’s accumulated contributions plus interest are transferred into this reserve from the Reserve for Employee Contributions. Monthly benefits, which are paid to the retirees, reduce this reserve. At the end of each fiscal year, an amount is transferred from the Reserve for Employer Contributions to bring the reserve into balance with the actuarial present value of retirement allowances. Also included are reserves for casualty experience (injury or death of a member, or vested former member). The initial actuarial casualty valuation determined the full funding reserve requirements to be allocated from assets of the reserve. All retiree casualty payments are made from this reserve. At September 30, 2011, and 2010, the balance in this reserve was $1,012.8 million and $997.1 million, respectively. Reserve for Undistributed Investment Income – The net investment earnings (losses) are recorded in this reserve. Interest as authorized by the board is transferred annually to the other reserves. Administrative expenses are paid from this reserve. At September 30, 2011, and 2010, the balance of this reserve was ($114.4) million and ($70.2) million, respectively.
FINANCIAL SECTION
28 • MICHIGAN STATE POLICE RETIREMENT SYSTEM
Notes to Basic Financial Statements (continued) Reserve for Health (OPEB) Related Benefits - This reserve is credited with employer contributions for retirees’ health (including prescription coverage, dental, and vision) benefits. This reserve includes revenue from the federal government for early retiree reinsurance payment (ERRP) and retiree drug subsidy payment (RDS) pursuant to the provisions of Medicare Part D. The required contribution is based on pay-as-you-go funding and represents a level of funding that, if paid on an ongoing basis, is projected to cover normal cost each year and amortize any unfunded actuarial liability (or funding excess) over a period not to exceed thirty years. However, the actual annual contributions have been less than the annual required contribution (ARC). From this reserve, the System pays 95% of the premiums for hospitalization and medical coverage insurance and 90% of the monthly premium for dental and vision coverage insurance. At September 30, 2011, the balance in this reserve was $12.1 million. At September 30, 2010, the balance in this reserve was $4.8 million. Reporting Entity The System is a pension and other employee benefit trust fund of the State. As such, the System is considered part of the State and is included in the State’s Comprehensive Annual Financial Report as a pension and other employee benefit trust fund. The System and its Board are not financially accountable for any other entities or other organizations. Accordingly, the System is the only entity included in this financial report. Benefit Protection Public Act 100 of 2002 was passed by the Michigan Legislature to protect pension benefits of public employees from alienation (being transferred). Alienation is attachment, garnishment, levy, execution, bankruptcy or other legal process except for divorce orders or eligible domestic relation orders. The statutes governing the System contained an “anti-alienation” clause to provide for this protection; however, many smaller public pension systems did not have the benefit of this protection. Therefore, Public Act 100 of 2002 was passed to establish legal protection of pension assets that encompasses all public employees. Fair Value of Investments Plan investments are reported at fair value. Securities traded on a national or international exchange are valued at the last reported sales price at current exchange rates. Corporate bonds not traded on a national or international exchange are based on equivalent values of comparable securities with similar yield and risk. Real estate debt is valued on the basis of future principal and interest payments, and is discounted at prevailing interest rates for similar instruments. The fair value of real estate investments is based on independent appraisals. Securities purchased with cash collateral under securities lending activities are recorded at estimated fair value. Other investments not having an established market are recorded at estimated fair value. Investment Income Dividend and interest income is recognized on the accrual basis. Fair value changes are recorded as investment income or loss. Purchases and sales of investments are recorded as of the trade date (the date upon which the transaction is initiated), except for purchase and sale of mortgages, real estate, and alternative investments, which are recorded as of the settlement date (the date upon which the transaction is ultimately completed). The effect of recording such transactions as of the settlement date does not materially affect the financial statements. Costs of Administering the System Each year a restricted general fund appropriation is requested to fund the on-going business operations of the System. These administrative costs are ultimately funded by the System through the regular transfer of funds from the System to the State’s general fund based on either a direct cost or allocation basis depending on the nature of the expense. Costs of administering the System are financed by undistributed investment income of the System. Property and Equipment Office space is leased from the State on a year to year basis. Office equipment is capitalized if the value exceeds $5,000. These assets are recorded at cost and are reported net of depreciation in the Statement of Pension Plan and Other
FINANCIAL SECTION
MICHIGAN STATE POLICE RETIREMENT SYSTEM • 29
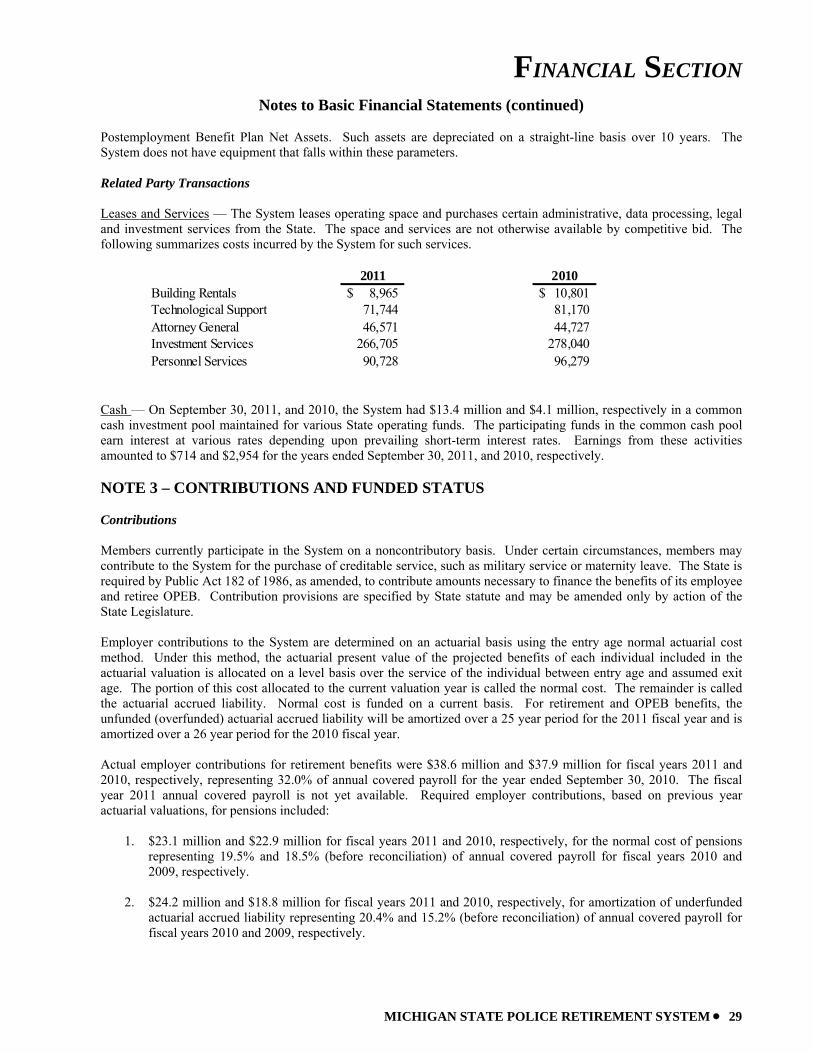
Notes to Basic Financial Statements (continued) Postemployment Benefit Plan Net Assets. Such assets are depreciated on a straight-line basis over 10 years. The System does not have equipment that falls within these parameters. Related Party Transactions Leases and Services — The System leases operating space and purchases certain administrative, data processing, legal and investment services from the State. The space and services are not otherwise available by competitive bid. The following summarizes costs incurred by the System for such services.
2011 2010Building Rentals 8,965$ 10,801$ Technological Support 71,744 81,170 Attorney General 46,571 44,727 Investment Services 266,705 278,040 Personnel Services 90,728 96,279
Cash — On September 30, 2011, and 2010, the System had $13.4 million and $4.1 million, respectively in a common cash investment pool maintained for various State operating funds. The participating funds in the common cash pool earn interest at various rates depending upon prevailing short-term interest rates. Earnings from these activities amounted to $714 and $2,954 for the years ended September 30, 2011, and 2010, respectively. NOTE 3 – CONTRIBUTIONS AND FUNDED STATUS Contributions Members currently participate in the System on a noncontributory basis. Under certain circumstances, members may contribute to the System for the purchase of creditable service, such as military service or maternity leave. The State is required by Public Act 182 of 1986, as amended, to contribute amounts necessary to finance the benefits of its employee and retiree OPEB. Contribution provisions are specified by State statute and may be amended only by action of the State Legislature. Employer contributions to the System are determined on an actuarial basis using the entry age normal actuarial cost method. Under this method, the actuarial present value of the projected benefits of each individual included in the actuarial valuation is allocated on a level basis over the service of the individual between entry age and assumed exit age. The portion of this cost allocated to the current valuation year is called the normal cost. The remainder is called the actuarial accrued liability. Normal cost is funded on a current basis. For retirement and OPEB benefits, the unfunded (overfunded) actuarial accrued liability will be amortized over a 25 year period for the 2011 fiscal year and is amortized over a 26 year period for the 2010 fiscal year. Actual employer contributions for retirement benefits were $38.6 million and $37.9 million for fiscal years 2011 and 2010, respectively, representing 32.0% of annual covered payroll for the year ended September 30, 2010. The fiscal year 2011 annual covered payroll is not yet available. Required employer contributions, based on previous year actuarial valuations, for pensions included:
1. $23.1 million and $22.9 million for fiscal years 2011 and 2010, respectively, for the normal cost of pensions representing 19.5% and 18.5% (before reconciliation) of annual covered payroll for fiscal years 2010 and 2009, respectively.
2. $24.2 million and $18.8 million for fiscal years 2011 and 2010, respectively, for amortization of underfunded
actuarial accrued liability representing 20.4% and 15.2% (before reconciliation) of annual covered payroll for fiscal years 2010 and 2009, respectively.
FINANCIAL SECTION
30 • MICHIGAN STATE POLICE RETIREMENT SYSTEM
Notes to Basic Financial Statements (continued)
Actual employer contributions for OPEB were $31.6 million and $32.9 million for fiscal years 2011 and 2010, respectively, representing 27.7% of annual covered payroll for the year ended September 30, 2010. The fiscal year 2011 annual covered payroll is not yet available. Required employer contributions, based on previous year actuarial valuations, for OPEB included:
1. $29.7 million and $24.6 million for fiscal years 2011 and 2010, respectively, for the normal cost of OPEB representing 25.1% and 19.9% (before reconciliation) of annual covered payroll for fiscal years 2010 and 2009 respectively.
2. $44.0 million and $35.5 million for fiscal years 2011 and 2010, respectively, for amortization of unfunded
actuarial accrued liability representing 37.1% and 28.8% (before reconciliation) of annual covered payroll for fiscal years 2010 and 2009, respectively.
The system is required to reconcile with actuarial requirements annually. Any funding excess or deficiency for pension benefits is smoothed over five years. One-fifth (20%) of the funding excess or deficiency is included in each of the subsequent years’ contribution, and is not recognized as a payable or receivable in the accounting records. Funded Status The employer is required to contribute at an actuarially determined rate for both pension benefits and OPEB. For fiscal year 2010, the actuarial accrued liability (AAL) for pension benefits was $1.6 billion, and the actuarial value of assets was $1.2 billion, resulting in an unfunded actuarial accrued liability (UAAL) of $392.3 million and a funded ratio of 75.4%. The covered payroll (annual payroll of active employees covered by the plan) was $118.6 million, and the ratio of the UAAL to the covered payroll was 330.9%. For fiscal year 2010, the actuarial accrued liability (AAL) for OPEB was $1.1 billion, and the actuarial value of assets was $0, resulting in an unfunded actuarial accrued liability (UAAL) of $1.1 billion and a funded ratio of 0.0%. The covered payroll (annual payroll of active employees covered by the plan) was $118.6 million, and the ratio of the UAAL to the covered payroll was 890.5%. Actuarial Valuations and Assumptions Actuarial valuations for both the pension and OPEB plans involve estimates of the value of reported amounts and assumptions about the probability of occurrence of events far into the future. Examples include assumptions about future employment, mortality, and the healthcare cost trends. Amounts determined regarding the funded status of the plan and the annual required contributions (ARC) are subject to continual revision as actual results are compared with past expectations and new estimates are made about the future. The schedules of funding progress, presented as required supplementary information following the notes to the financial statements, present multi-year trend information about whether the actuarial value of plan net assets for both pension and OPEB plans is increasing or decreasing over time relative to the actuarial accrued liabilities for benefits. The accompanying schedules of employer contributions present trend information about the amounts contributed to the plans by employers in comparison to the ARC, an amount that is actuarially determined in accordance with the parameters of GASB Statement No. 25 for pension contributions and GASB Statement No. 43 for OPEB contributions. Projections of benefits for financial reporting purposes are based on the substantive plan (the plan as understood by the employer and plan members) and include the types of benefits provided at the time of each valuation and the historical pattern of sharing of benefit costs between the employer and plan members to that point. The actuarial methods and assumptions used include techniques that are designed to reduce the effects of short-term volatility in actuarial accrued liabilities and the actuarial value of assets, consistent with the long-term perspective of the calculations.
FINANCIAL SECTION
MICHIGAN STATE POLICE RETIREMENT SYSTEM • 31
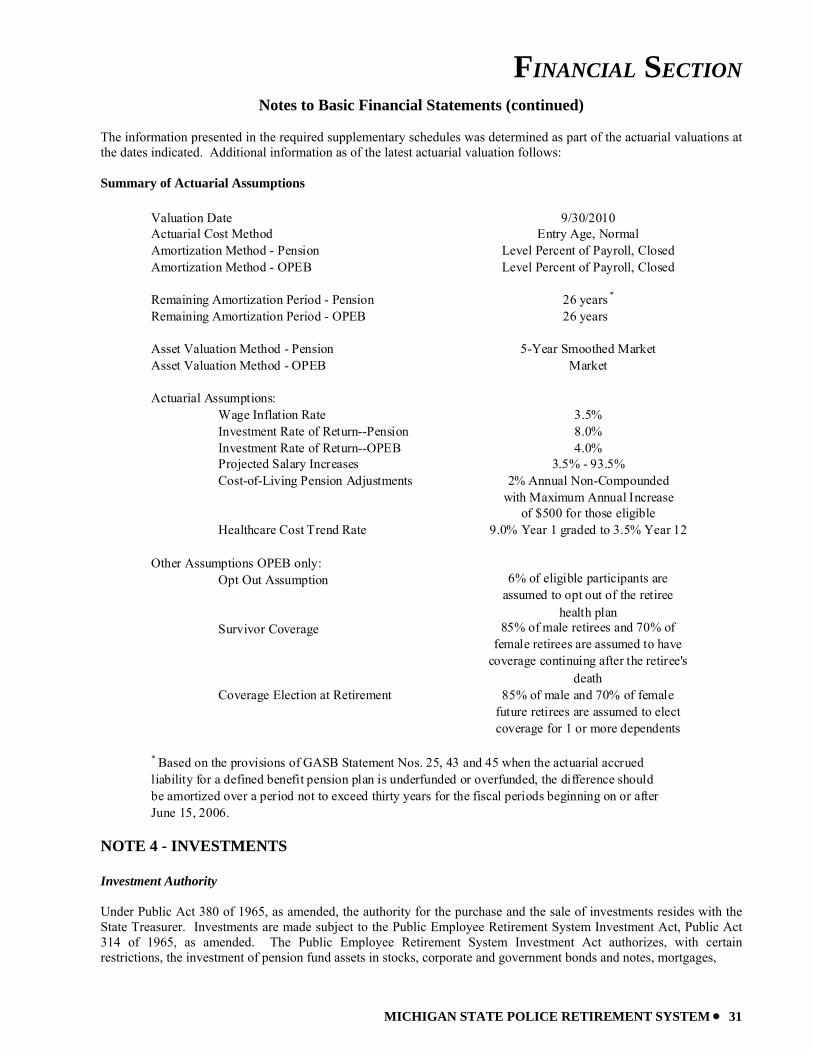
Notes to Basic Financial Statements (continued) The information presented in the required supplementary schedules was determined as part of the actuarial valuations at the dates indicated. Additional information as of the latest actuarial valuation follows: Summary of Actuarial Assumptions
Valuation Date 9/30/2010Actuarial Cost Method Entry Age, NormalAmortization Method - Pension Level Percent of Payroll, ClosedAmortization Method - OPEB Level Percent of Payroll, Closed
Remaining Amortization Period - Pension 26 years *
Remaining Amortization Period - OPEB 26 years
Asset Valuation Method - Pension 5-Year Smoothed MarketAsset Valuation Method - OPEB Market
Actuarial Assumptions:Wage Inflation Rate 3.5%Investment Rate of Return--Pension 8.0%Investment Rate of Return--OPEB 4.0%Projected Salary Increases 3.5% - 93.5%Cost-of-Living Pension Adjustments 2% Annual Non-Compounded
with Maximum Annual Increaseof $500 for those eligible
Healthcare Cost Trend Rate 9.0% Year 1 graded to 3.5% Year 12
Other Assumptions OPEB only:Opt Out Assumption 6% of eligible participants are
assumed to opt out of the retiree health plan
Survivor Coverage 85% of male retirees and 70% of female retirees are assumed to have
coverage continuing after the retiree's death
Coverage Election at Retirement 85% of male and 70% of female future retirees are assumed to elect coverage for 1 or more dependents
* Based on the provisions of GASB Statement Nos. 25, 43 and 45 when the actuarial accruedliability for a defined benefit pension plan is underfunded or overfunded, the difference should be amortized over a period not to exceed thirty years for the fiscal periods beginning on or after June 15, 2006.
NOTE 4 - INVESTMENTS Investment Authority Under Public Act 380 of 1965, as amended, the authority for the purchase and the sale of investments resides with the State Treasurer. Investments are made subject to the Public Employee Retirement System Investment Act, Public Act 314 of 1965, as amended. The Public Employee Retirement System Investment Act authorizes, with certain restrictions, the investment of pension fund assets in stocks, corporate and government bonds and notes, mortgages,
FINANCIAL SECTION
32 • MICHIGAN STATE POLICE RETIREMENT SYSTEM
Notes to Basic Financial Statements (continued) real estate, and certain short-term and alternative investments. Investments must be made for the exclusive purposes of providing benefits to active members, retired members and beneficiaries, and for defraying the expenses of investing the assets. Under Public Act 314 of 1965, as amended, the State Treasurer may invest up to 5% of the System’s assets in small businesses having more than one-half of assets or employees in Michigan as described in section 20(a) of the Act and up to 20% of the System’s assets in investments not otherwise qualified under the Act as described in section 20(d). Alternative investments include limited partnerships and distributions from these partnerships in the form of bonds, preferred stock, common stock, and direct investments. Derivatives The State Treasurer employs the use of derivatives in the investment of the pension and other employee benefit trust funds (the trust funds). Derivatives are used in managing the trust fund portfolios, but uses do not include speculation or leverage of investments. Less than 12% of the total trust funds’ portfolio has been invested from time to time in future contracts, swap agreements, structured notes, option and forward contracts. State investment statutes limit total derivative exposure to 15% of a fund’s total asset value, and restrict uses to replication of returns and hedging of assets. Swap agreements represent the largest category of derivatives used, and they represented 4.2% of market value of total pooled assets on September 30, 2011 and 6.2% of market value of total pooled assets on September 30, 2010. Structured notes represented 0.7% of market value of total pooled assets on September 30, 2011 and 0.3% of market value of total pooled assets on September 30, 2010. Future contracts represented 0.0% of market value of total pooled assets on September 30, 2011, and 2010. Option contracts represented 0.0% of market value of total pooled assets on September 30, 2011, and 2010. Forward contracts represented 0.0% of market value of total pooled assets on September 30, 2011. The derivative fair values are reported on the Statements of Pension Plan and Other Postemployment Benefit Plan Net Assets as of September 30, 2011 and 2010 statements, in their respective investment pools market value. Derivative net appreciation and depreciation are reported on the Statement of Changes in Pension Plan and Other Postemployment Benefit Plan Net Assets for fiscal years ended September 30, 2011, and 2010 statements, under “Investment income (loss)”, in “Net appreciation (depreciation) in fair value of investments”. Swap interest, payments, and dividends are reported under “Investment Income (loss)”, in “Interest, Dividends, and other” To diversify the trust funds’ portfolio, the State Treasurer has entered into international swap agreements with investment grade counterparties, which are tied to stock market indices in twenty-two foreign countries. To provide downside protection and enhance cash returns in equity investments, swap agreements tied to domestic stock indices were added. International Investments’ swap equity agreement notional amounts at September 30, 2011, and 2010, were $38.9 million and $65.3 million, respectively. Approximately one quarter of the notional amount tied to foreign stock market indices is hedged against foreign currency fluctuations. The swap agreements provide that the System will pay quarterly over the term of the swap agreements, interest indexed to the three month London Inter Bank Offer Rate (LIBOR), adjusted for an interest rate spread, on the notional amount stated in the agreements. International equity swap agreement maturity dates range from October 2011 to July 2012. The U.S. Domestic LIBOR based floating rate notes and other investments earning short-term interest are held to correspond with the notional amount of the international swap agreements. The value of the international synthetic equity structures is a combination of the value of the swap agreements and the value of the notes and short-term investments. The book value represents the cost of the notes and short-term investments. The current value represents the current value of the notes and short-term investments and the change in the value of the underlying indices from the inception of the swap agreements. The current value $42.5 million is used as a representation of the fair value based on the intention to hold all swap agreements until maturity. At the maturity of the swap agreements, the trust funds will either receive the increase in the value of the equity indices from the level at the inception of the agreements, or pay the decrease in the value of the indices. The combined swap structure generally realizes gains and losses on a rolling multi-year basis.
FINANCIAL SECTION
MICHIGAN STATE POLICE RETIREMENT SYSTEM • 33
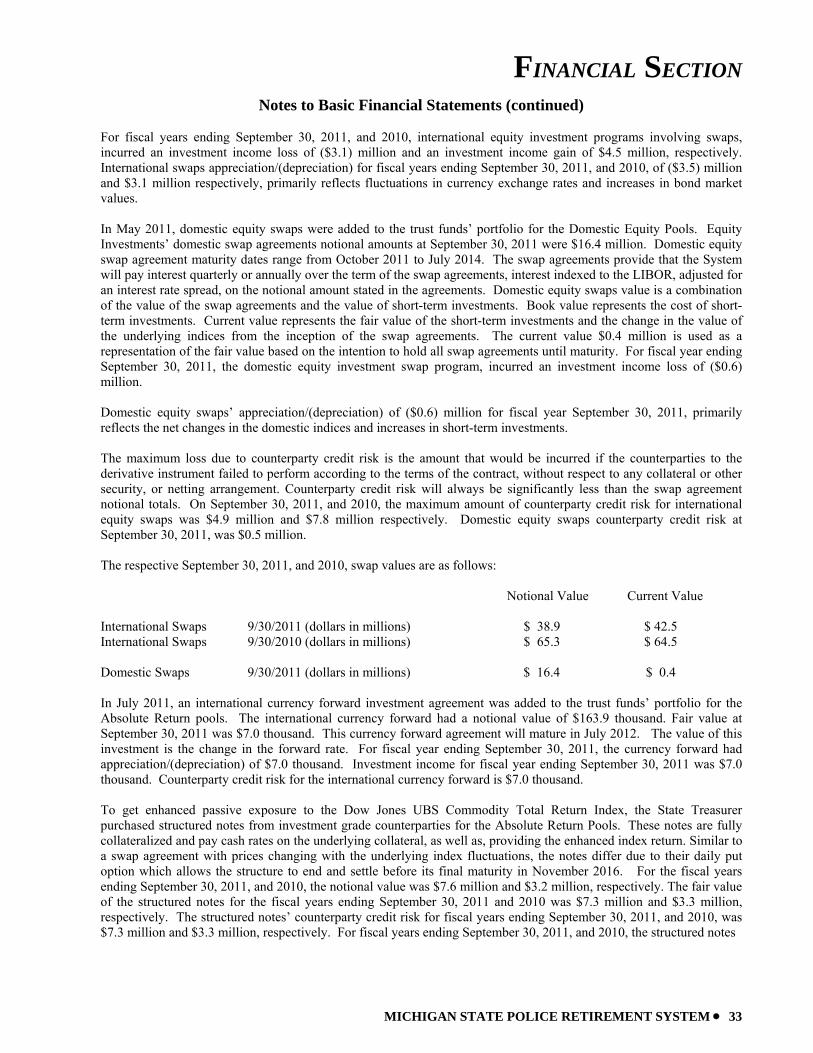
Notes to Basic Financial Statements (continued) For fiscal years ending September 30, 2011, and 2010, international equity investment programs involving swaps, incurred an investment income loss of ($3.1) million and an investment income gain of $4.5 million, respectively. International swaps appreciation/(depreciation) for fiscal years ending September 30, 2011, and 2010, of ($3.5) million and $3.1 million respectively, primarily reflects fluctuations in currency exchange rates and increases in bond market values. In May 2011, domestic equity swaps were added to the trust funds’ portfolio for the Domestic Equity Pools. Equity Investments’ domestic swap agreements notional amounts at September 30, 2011 were $16.4 million. Domestic equity swap agreement maturity dates range from October 2011 to July 2014. The swap agreements provide that the System will pay interest quarterly or annually over the term of the swap agreements, interest indexed to the LIBOR, adjusted for an interest rate spread, on the notional amount stated in the agreements. Domestic equity swaps value is a combination of the value of the swap agreements and the value of short-term investments. Book value represents the cost of short-term investments. Current value represents the fair value of the short-term investments and the change in the value of the underlying indices from the inception of the swap agreements. The current value $0.4 million is used as a representation of the fair value based on the intention to hold all swap agreements until maturity. For fiscal year ending September 30, 2011, the domestic equity investment swap program, incurred an investment income loss of ($0.6) million. Domestic equity swaps’ appreciation/(depreciation) of ($0.6) million for fiscal year September 30, 2011, primarily reflects the net changes in the domestic indices and increases in short-term investments. The maximum loss due to counterparty credit risk is the amount that would be incurred if the counterparties to the derivative instrument failed to perform according to the terms of the contract, without respect to any collateral or other security, or netting arrangement. Counterparty credit risk will always be significantly less than the swap agreement notional totals. On September 30, 2011, and 2010, the maximum amount of counterparty credit risk for international equity swaps was $4.9 million and $7.8 million respectively. Domestic equity swaps counterparty credit risk at September 30, 2011, was $0.5 million. The respective September 30, 2011, and 2010, swap values are as follows: Notional Value Current Value International Swaps 9/30/2011 (dollars in millions) $ 38.9 $ 42.5 International Swaps 9/30/2010 (dollars in millions) $ 65.3 $ 64.5 Domestic Swaps 9/30/2011 (dollars in millions) $ 16.4 $ 0.4 In July 2011, an international currency forward investment agreement was added to the trust funds’ portfolio for the Absolute Return pools. The international currency forward had a notional value of $163.9 thousand. Fair value at September 30, 2011 was $7.0 thousand. This currency forward agreement will mature in July 2012. The value of this investment is the change in the forward rate. For fiscal year ending September 30, 2011, the currency forward had appreciation/(depreciation) of $7.0 thousand. Investment income for fiscal year ending September 30, 2011 was $7.0 thousand. Counterparty credit risk for the international currency forward is $7.0 thousand. To get enhanced passive exposure to the Dow Jones UBS Commodity Total Return Index, the State Treasurer purchased structured notes from investment grade counterparties for the Absolute Return Pools. These notes are fully collateralized and pay cash rates on the underlying collateral, as well as, providing the enhanced index return. Similar to a swap agreement with prices changing with the underlying index fluctuations, the notes differ due to their daily put option which allows the structure to end and settle before its final maturity in November 2016. For the fiscal years ending September 30, 2011, and 2010, the notional value was $7.6 million and $3.2 million, respectively. The fair value of the structured notes for the fiscal years ending September 30, 2011 and 2010 was $7.3 million and $3.3 million, respectively. The structured notes’ counterparty credit risk for fiscal years ending September 30, 2011, and 2010, was $7.3 million and $3.3 million, respectively. For fiscal years ending September 30, 2011, and 2010, the structured notes
FINANCIAL SECTION
34 • MICHIGAN STATE POLICE RETIREMENT SYSTEM
Notes to Basic Financial Statements (continued) had appreciation/(depreciation) of ($0.4) million and of $0.1 million, respectively. Investment income for fiscal years ending September 30, 2011, and 2010, was ($0.4) million and $0.1 million respectively. To enhance management flexibility, the State Treasurer traded U. S. Treasury bond future contracts for the Fixed Income Pools. The U. S. Treasury bond future contracts were used to manage duration and yield curve exposure. U.S. Treasury bond future contracts’ notional values at September 30, 2011, and 2010, were $0.3 million and $0.2 million, respectively. For the fiscal years ending September 30, 2011, and 2010, the fair values were $0.7 thousand and $0.5 thousand, respectively. The investment income for fiscal years ending September 30, 2011, and 2010, was $6.0 thousand and $5.2 thousand, respectively. For fiscal years ending September 30, 2011, and 2010, appreciation/(depreciation) was $6.0 thousand and $5.2 thousand, respectively. To provide downside protection and enhance current income, the State Treasurer traded covered equity options on single securities for the Absolute Return pools. Put options are used to protect against large negative moves in single stocks, as well as to express interest in a security that is trading well below its intrinsic value. Call options have been used to achieve current income on single equity securities that are trading near their intrinsic value. Equity options’ notional values on September 30, 2011, and 2010, were $29.3 thousand and $0, respectively. For fiscal years ended September 30, 2011, and 2010, the fair values of the equity options were ($2.9) thousand and $0, respectively. The investment income on options for fiscal years ending September 30, 2011, and 2010, was $5.2 thousand and $0.1 million, respectively. Appreciation/(depreciation) for fiscal years ending September 30, 2011, and 2010 was $5.2 thousand and $0.1 million respectively. Securities Lending State statutes allow the System to participate in securities lending transactions, and the System has, by way of an Agreement, authorized Credit Suisse, the agent bank, to lend the System’s securities to broker-dealers and banks pursuant to a form of loan agreement. During the fiscal years, the agent bank lent, at the direction of the State Treasurer, the System’s securities and received cash (United States) as collateral. The types of securities lent were equity, and fixed income, which includes government and corporate bonds and notes. Borrowers were required to deliver collateral for each loan equal to (i) in case of loaned securities denominated in United States dollars or whose primary trading market was located in the United States or sovereign debt issued by foreign governments, 102% of the fair value of the loaned securities; and (ii) in the case of loaned securities not denominated in United States dollars or whose primary trading market was not located in the United States, 105% of the fair value of the loaned securities. The agent bank agreed to indemnify the System by purchasing replacement securities, or returning cash collateral in the event borrower failed to return the loaned security or pay distributions thereon, due to the borrower’s insolvency. Under Master Securities Lending Agreements between the System and each borrower, the System and the borrowers have the right to terminate all securities lending transactions on demand. The cash collateral received on each loan was invested in assets held in a collateral account dedicated to the System. As of September 30, 2011 and 2010, such assets had an average weighted maturity to next reset of 3.3 years and 3.8 years respectively and an average weighted maturity of 10.8 years and 12.6 years respectively. Because the loans are terminable at will, their duration did not generally match the duration of the investments made with cash collateral. On September 30, 2011 and 2010, the System had no credit risk exposure to borrowers. The cash received for securities on loan for the System as of September 30, 2011 and 2010, was $142,426,500 and $141,700,861 respectively. The fair market value of assets held in the dedicated collateral account at the custodian for the System as of September 30, 2011, and 2010, was $114,301,980 and $110,384,585 respectively. The carrying amount, which is the fair market value, of securities on loan for the System as of September 30, 2011, and 2010, was $139,098,340 and $138,269,636 respectively. Gross income, including capital gains and losses, from security lending for fiscal years ended September 30, 2011, and 2010 with Credit Suisse was $1,981,195 and $2,468,782 respectively. Expenses associated with this income were the borrower’s rebate of $79,953 and $221,126 and fees paid to the agent bank of $364,103 and $425,770 respectively.
FINANCIAL SECTION
MICHIGAN STATE POLICE RETIREMENT SYSTEM • 35
Notes to Basic Financial Statements (continued) Risk In accordance with GASB Statement No. 40, investments require certain disclosures regarding policies and practices, and the risks associated with them. The credit risk (including custodial credit risk and concentration of credit risk), the interest rate risk, and the foreign currency risk are discussed in the following paragraphs. Amounts represent the pro- rata share of the underlying investments as required by GASB Statement No. 40. These are held in internal investment pools and reported as such in the financial statements.
Credit Risk - Credit risk is the risk that an issuer will not fulfill its obligations.
• Short-Term Fixed Income Investments - Prime commercial paper investments must be rated A-1 or P-1 at the time of purchase as rated by the two major rating services Standard and Poor’s Corporation (S&P) and Moody’s Investor Service (Moody’s), respectively. Borrowers must have at least $400.0 million in commercial paper outstanding, and the State Treasurer may not invest in more than 10% of the borrowers’ outstanding debt. The investments are further limited to $200.0 million in any borrower, unless the borrower has an A-1+ rating in which case the investment is not to exceed $300.0 million.
• Long-Term Fixed Income Investments - These investments must be investment grade or better at the time of
purchase unless specific requirements are met as defined by Public Act 314 of 1965, as amended, and the State Treasurer’s investment policy. Law defines investment grade as investments in the top four major grades, rated by two national rating services, S&P (AAA, AA, A, BBB) and Moody’s (Aaa, Aa, A, Baa). At September 30, 2011 and 2010, the System was in compliance with the policy in all material aspects.
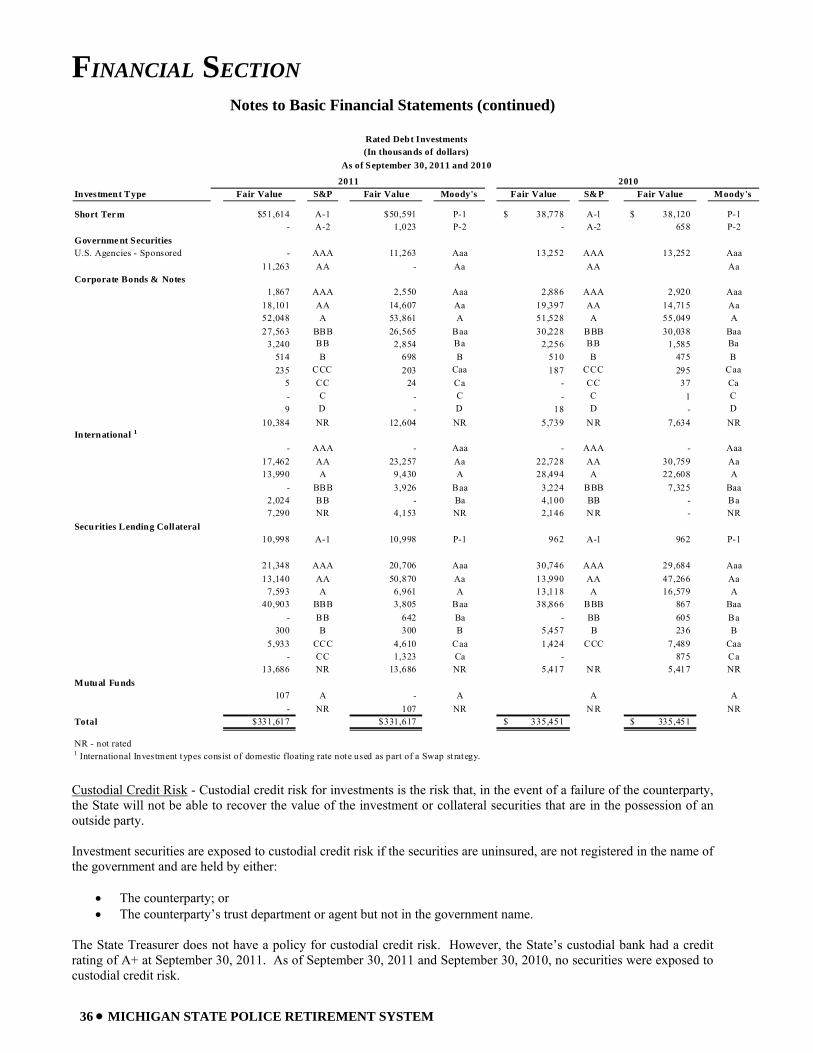
FINANCIAL SECTION
36 • MICHIGAN STATE POLICE RETIREMENT SYSTEM
Notes to Basic Financial Statements (continued)
Investment Type Fair Value S&P Fair Value Moody's Fair Value S&P Fair Value Moody's
Short Term $51,614 A-1 $50,591 P-1 38,778$ A-1 38,120$ P-1- A-2 1,023 P-2 - A-2 658 P-2
Governme nt SecuritiesU.S. Agencies - Sponsored - AAA 11,263 Aaa 13,252 AAA 13,252 Aaa
11,263 AA - Aa AA AaCorporate Bonds & Notes
1,867 AAA 2,550 Aaa 2,886 AAA 2,920 Aaa18,101 AA 14,607 Aa 19,397 AA 14,715 Aa52,048 A 53,861 A 51,528 A 55,049 A27,563 BBB 26,565 Baa 30,228 BBB 30,038 Baa
3,240 BB 2,854 Ba 2,256 BB 1,585 Ba514 B 698 B 510 B 475 B235 CCC 203 Caa 187 CCC 295 Caa
5 CC 24 Ca - CC 37 Ca- C - C - C 1 C9 D - D 18 D - D
10,384 NR 12,604 NR 5,739 N R 7,634 NRInternational 1
- AAA - Aaa - AAA - Aaa17,462 AA 23,257 Aa 22,728 AA 30,759 Aa13,990 A 9,430 A 28,494 A 22,608 A
- BBB 3,926 Baa 3,224 BBB 7,325 Baa2,024 BB - Ba 4,100 BB - Ba7,290 NR 4,153 NR 2,146 N R - NR
Securities Lending Collateral10,998 A-1 10,998 P-1 962 A-1 962 P-1
21,348 AAA 20,706 Aaa 30,746 AAA 29,684 Aaa13,140 AA 50,870 Aa 13,990 AA 47,266 Aa
7,593 A 6,961 A 13,118 A 16,579 A40,903 BBB 3,805 Baa 38,866 BBB 867 Baa
- BB 642 Ba - BB 605 Ba300 B 300 B 5,457 B 236 B
5,933 CCC 4,610 Caa 1,424 CCC 7,489 Caa- CC 1,323 Ca - 875 Ca
13,686 NR 13,686 NR 5,417 N R 5,417 NRMutual Funds
107 A - A A A- NR 107 NR N R NR
Total $331,617 $331,617 335,451$ 335,451$
NR - not rated1 International Investment types consist of domestic floating rate note used as part of a Swap st rategy.
2011 2010
Rated Debt Investments(In thousands of dollars)
As of September 30, 2011 and 2010
Custodial Credit Risk - Custodial credit risk for investments is the risk that, in the event of a failure of the counterparty, the State will not be able to recover the value of the investment or collateral securities that are in the possession of an outside party. Investment securities are exposed to custodial credit risk if the securities are uninsured, are not registered in the name of the government and are held by either:
• The counterparty; or • The counterparty’s trust department or agent but not in the government name.
The State Treasurer does not have a policy for custodial credit risk. However, the State’s custodial bank had a credit rating of A+ at September 30, 2011. As of September 30, 2011 and September 30, 2010, no securities were exposed to custodial credit risk.
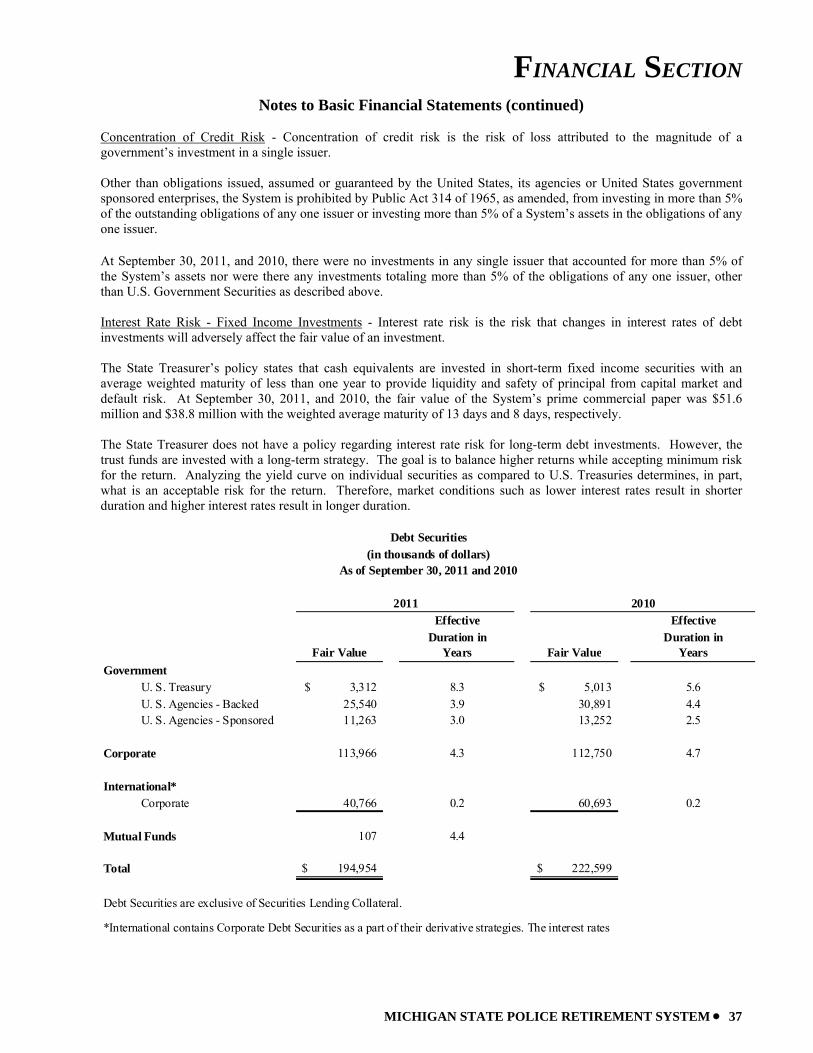
FINANCIAL SECTION
MICHIGAN STATE POLICE RETIREMENT SYSTEM • 37
Notes to Basic Financial Statements (continued) Concentration of Credit Risk - Concentration of credit risk is the risk of loss attributed to the magnitude of a government’s investment in a single issuer. Other than obligations issued, assumed or guaranteed by the United States, its agencies or United States government sponsored enterprises, the System is prohibited by Public Act 314 of 1965, as amended, from investing in more than 5% of the outstanding obligations of any one issuer or investing more than 5% of a System’s assets in the obligations of any one issuer. At September 30, 2011, and 2010, there were no investments in any single issuer that accounted for more than 5% of the System’s assets nor were there any investments totaling more than 5% of the obligations of any one issuer, other than U.S. Government Securities as described above. Interest Rate Risk - Fixed Income Investments - Interest rate risk is the risk that changes in interest rates of debt investments will adversely affect the fair value of an investment. The State Treasurer’s policy states that cash equivalents are invested in short-term fixed income securities with an average weighted maturity of less than one year to provide liquidity and safety of principal from capital market and default risk. At September 30, 2011, and 2010, the fair value of the System’s prime commercial paper was $51.6 million and $38.8 million with the weighted average maturity of 13 days and 8 days, respectively. The State Treasurer does not have a policy regarding interest rate risk for long-term debt investments. However, the trust funds are invested with a long-term strategy. The goal is to balance higher returns while accepting minimum risk for the return. Analyzing the yield curve on individual securities as compared to U.S. Treasuries determines, in part, what is an acceptable risk for the return. Therefore, market conditions such as lower interest rates result in shorter duration and higher interest rates result in longer duration.
Effective EffectiveDuration in Duration in
Fair Value Years Fair Value YearsGovernment
U. S. Treasury 3,312$ 8.3 5,013$ 5.6U. S. Agencies - Backed 25,540 3.9 30,891 4.4U. S. Agencies - Sponsored 11,263 3.0 13,252 2.5
Corporate 113,966 4.3 112,750 4.7
International*Corporate 40,766 0.2 60,693 0.2
Mutual Funds 107 4.4
Total 194,954$ 222,599$
Debt Securities are exclusive of Securities Lending Collateral.
*International contains Corporate Debt Securities as a part of their derivative strategies. The interest rates
2010
Debt Securities(in thousands of dollars)
As of September 30, 2011 and 2010
2011
FINANCIAL SECTION
38 • MICHIGAN STATE POLICE RETIREMENT SYSTEM
Notes to Basic Financial Statements (continued) Foreign Currency Risk - Foreign currency risk is the risk that changes in exchange rates will adversely affect the fair value of an investment or deposit. The System invests in various securities denominated in foreign currencies. These investments are limited to 20% of the total assets of the System with an additional limit of 5% of the outstanding foreign securities of any single issuer. No investment is allowed in a country that has been identified by the United States State Department as engaging in or sponsoring terrorism. These limits are set forth in Public Act 314 of 1965, as amended. The types of foreign investments include equities, fixed income, mutual funds, real estate, and limited partnerships. At September 30, 2011, and 2010, the total amount of foreign investment subject to foreign currency risk was $126.7 million and $112.2 million which amounted to 12.6% and 10.8% of total investments (exclusive of securities lending collateral) of the System, respectively.
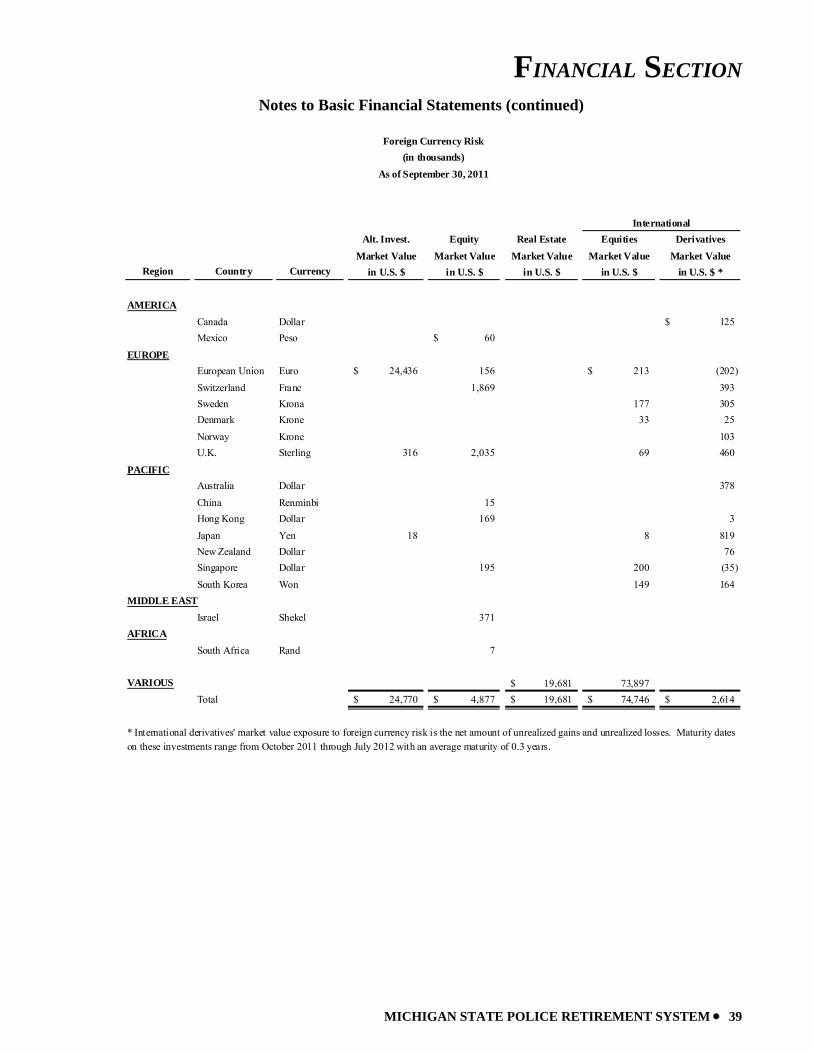
FINANCIAL SECTION
MICHIGAN STATE POLICE RETIREMENT SYSTEM • 39
Notes to Basic Financial Statements (continued)
Alt. Invest. Equity Real Estate Equities DerivativesMarket Value Market Value Market Value Market Value Market Value
Region Country Currency in U.S. $ in U.S. $ in U.S. $ in U.S. $ in U.S. $ *
AMERICACanada Dollar 125$ Mexico Peso 60$
EUROPEEuropean Union Euro 24,436$ 156 213$ (202) Switzerland Franc 1,869 393 Sweden Krona 177 305 Denmark Krone 33 25
Norway Krone 103 U.K. Sterling 316 2,035 69 460
PACIFICAustralia Dollar 378
China Renminbi 15 Hong Kong Dollar 169 3
Japan Yen 18 8 819 New Zealand Dollar 76 Singapore Dollar 195 200 (35) South Korea Won 149 164
MIDDLE EASTIsrael Shekel 371
AFRICASouth Africa Rand 7
VARIOUS 19,681$ 73,897 Total 24,770$ 4,877$ 19,681$ 74,746$ 2,614$
* International derivatives' market value exposure to foreign currency risk is the net amount of unrealized gains and unrealized losses. Maturity dates on these investments range from October 2011 through July 2012 with an average maturity of 0.3 years.
Foreign Currency Risk(in thousands)
As of September 30, 2011
International
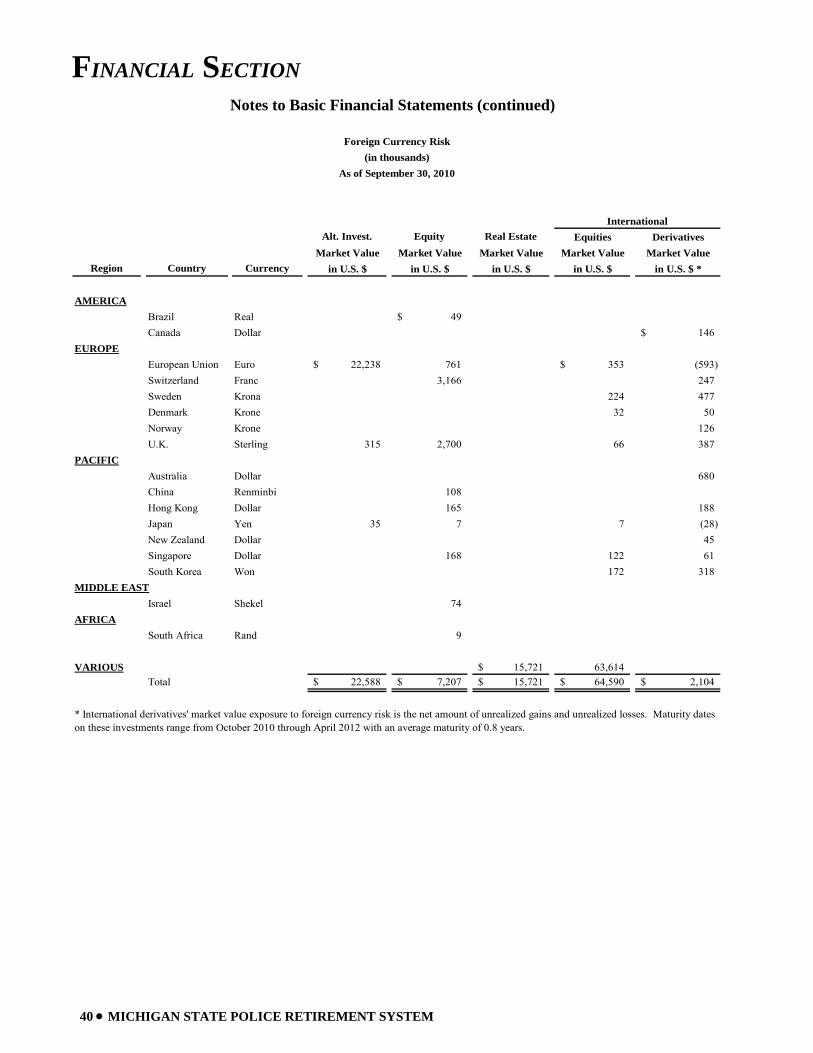
FINANCIAL SECTION
40 • MICHIGAN STATE POLICE RETIREMENT SYSTEM
Notes to Basic Financial Statements (continued)
Alt. Invest. Equity Real Estate Equities DerivativesMarket Value Market Value Market Value Market Value Market Value
Region Country Currency in U.S. $ in U.S. $ in U.S. $ in U.S. $ in U.S. $ *
AMERICABrazil Real 49$ Canada Dollar 146$
EUROPEEuropean Union Euro 22,238$ 761 353$ (593) Switzerland Franc 3,166 247 Sweden Krona 224 477 Denmark Krone 32 50 Norway Krone 126 U.K. Sterling 315 2,700 66 387
PACIFICAustralia Dollar 680 China Renminbi 108 Hong Kong Dollar 165 188 Japan Yen 35 7 7 (28) New Zealand Dollar 45 Singapore Dollar 168 122 61 South Korea Won 172 318
MIDDLE EASTIsrael Shekel 74
AFRICASouth Africa Rand 9
VARIOUS 15,721$ 63,614 Total 22,588$ 7,207$ 15,721$ 64,590$ 2,104$
International
Foreign Currency Risk(in thousands)
As of September 30, 2010
* International derivatives' market value exposure to foreign currency risk is the net amount of unrealized gains and unrealized losses. Maturity dates on these investments range from October 2010 through April 2012 with an average maturity of 0.8 years.
FINANCIAL SECTION
MICHIGAN STATE POLICE RETIREMENT SYSTEM • 41
Notes to Basic Financial Statements (continued) NOTE 5 – ACCOUNTING CHANGES During fiscal year 2010, the System implemented GASB Statement No. 53, Accounting and Financial Reporting for Derivatives Instruments. This statement addresses the recognition, measurement, and disclosure of information regarding derivative instruments. Note 4 includes disclosure regarding derivative instruments held as investments by the System; no other types of derivative instruments were used by System during the fiscal years. As a result of the implementation, the System made additional note disclosures regarding the investment derivative instrument; however, since the derivative instruments were held and accounted for as investments, there were no accounting changes or restatements required. NOTE 6 - COMMITMENTS AND CONTINGENCIES Under the Administrative Procedures Act, members may appeal a decision by the Board. Once the administrative procedure has been exhausted, the decision may be appealed in Michigan's court system. Various cases that have exhausted the administrative procedures have been appealed in the court system. These cases are in the normal course of business and the System does not anticipate any material loss as a result of the contingent liabilities.
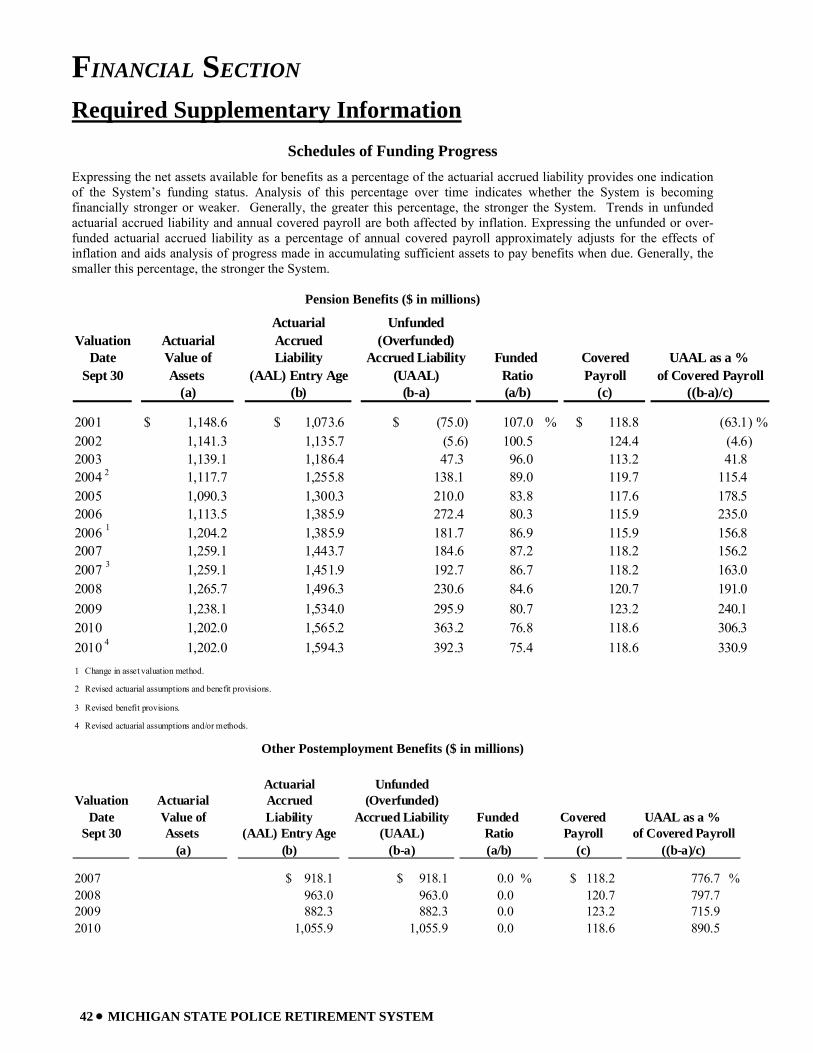
FINANCIAL SECTION
42 • MICHIGAN STATE POLICE RETIREMENT SYSTEM
Required Supplementary Information
Schedules of Funding Progress
Expressing the net assets available for benefits as a percentage of the actuarial accrued liability provides one indication of the System’s funding status. Analysis of this percentage over time indicates whether the System is becoming financially stronger or weaker. Generally, the greater this percentage, the stronger the System. Trends in unfunded actuarial accrued liability and annual covered payroll are both affected by inflation. Expressing the unfunded or over-funded actuarial accrued liability as a percentage of annual covered payroll approximately adjusts for the effects of inflation and aids analysis of progress made in accumulating sufficient assets to pay benefits when due. Generally, the smaller this percentage, the stronger the System.
Pension Benefits ($ in millions)
ValuationDate
Sept 30
2001 $ 1,148.6 $ 1,073.6 $ (75.0) 107.0 % $ 118.8 (63.1) %2002 1,141.3 1,135.7 (5.6) 100.5 124.4 (4.6)2003 1,139.1 1,186.4 47.3 96.0 113.2 41.82004 2 1,117.7 1,255.8 138.1 89.0 119.7 115.42005 1,090.3 1,300.3 210.0 83.8 117.6 178.52006 1,113.5 1,385.9 272.4 80.3 115.9 235.02006 1 1,204.2 1,385.9 181.7 86.9 115.9 156.82007 1,259.1 1,443.7 184.6 87.2 118.2 156.22007 3 1,259.1 1,451.9 192.7 86.7 118.2 163.02008 1,265.7 1,496.3 230.6 84.6 120.7 191.02009 1,238.1 1,534.0 295.9 80.7 123.2 240.12010 1,202.0 1,565.2 363.2 76.8 118.6 306.32010 4 1,202.0 1,594.3 392.3 75.4 118.6 330.91 Change in asset valuation method.
2 Revised actuarial assumptions and benefit provisions.
3 Revised benefit provisions.
4 Revised actuarial assumptions and/or methods.
(c) ((b-a)/c)(a) (b) (b-a) (a/b)Payroll of Covered Payroll
Value of Liability Accrued LiabilityAssets (AAL) Entry Age (UAAL) Ratio
Covered UAAL as a %
Actuarial UnfundedActuarial Accrued (Overfunded)
Funded
Other Postemployment Benefits ($ in millions)
ValuationDate
Sept 30
2007 918.1$ 918.1$ 0.0 % 118.2$ 776.7 %2008 963.0 963.0 0.0 120.7 797.72009 882.3 882.3 0.0 123.2 715.92010 1,055.9 1,055.9 0.0 118.6 890.5
(c) ((b-a)/c)(a) (b) (b-a) (a/b)Payroll of Covered Payroll
Value of Liability Accrued LiabilityAssets (AAL) Entry Age (UAAL) Ratio
Covered UAAL as a %
Actuarial UnfundedActuarial Accrued (Overfunded)
Funded
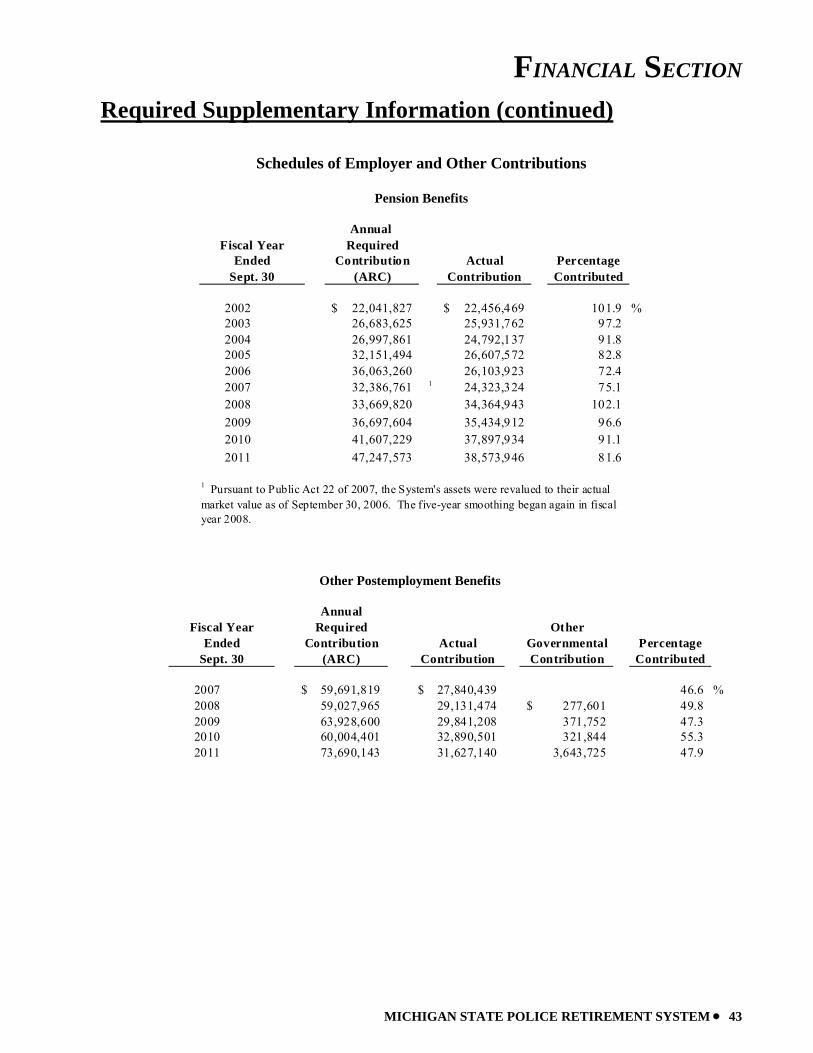
FINANCIAL SECTION
MICHIGAN STATE POLICE RETIREMENT SYSTEM • 43
Required Supplementary Information (continued)
Schedules of Employer and Other Contributions
Pension Benefits
Annual Required
Contribution Actual Percentage(ARC) Contribution Contributed
2002 22,041,827$ 22,456,469$ 101.9 %2003 26,683,625 25,931,762 97.22004 26,997,861 24,792,137 91.82005 32,151,494 26,607,572 82.82006 36,063,260 26,103,923 72.42007 32,386,761 1 24,323,324 75.12008 33,669,820 34,364,943 102.12009 36,697,604 35,434,912 96.62010 41,607,229 37,897,934 91.12011 47,247,573 38,573,946 81.6
Fiscal YearEnded
Sept. 30
1 Pursuant to Public Act 22 of 2007, the System's assets were revalued to their actual market value as of September 30, 2006. The five-year smoothing began again in fiscal year 2008.
Other Postemployment Benefits
AnnualRequired Other
Contribution Actual Governmental Percentage(ARC) Contribution Contribution Contributed
2007 59,691,819$ 27,840,439$ 46.6 %2008 59,027,965 29,131,474 277,601$ 49.82009 63,928,600 29,841,208 371,752 47.32010 60,004,401 32,890,501 321,844 55.32011 73,690,143 31,627,140 3,643,725 47.9
Fiscal YearEnded
Sept. 30
FINANCIAL SECTION
44 • MICHIGAN STATE POLICE RETIREMENT SYSTEM
Note to Required Supplementary Information
NOTE A - DESCRIPTION Ten year historical trend information designed to provide information about the System’s progress made in accumulating sufficient assets to pay benefits when due is presented in the preceding schedules. Other ten year historical trend information related to the System is presented in the Statistical and Actuarial Sections of the report. This information is presented to enable the reader to assess the progress made by the System in accumulating sufficient assets to pay pension and other postemployment benefits as they become due. Because this is the fifth year the system is reporting other postemployment benefits in accordance with GASB Statement No. 43, only five years of historical trend information is provided. The comparability of trend information is affected by changes in actuarial assumptions, benefit provisions, actuarial funding methods, accounting policies, and other changes. Those changes usually affect trends in contribution requirements and in ratios that use the pension and other postemployment benefit obligations as a factor. The Schedules of Funding Progress and Schedules of Employer Contributions are reported as historical trend information. The Schedules of Funding Progress are presented to measure the progress being made to accumulate sufficient assets to pay benefits when due. The Schedules of Employer Contributions are presented to show the responsibility of the Employer in meeting the actuarial requirements to maintain the System on a sound financial basis.
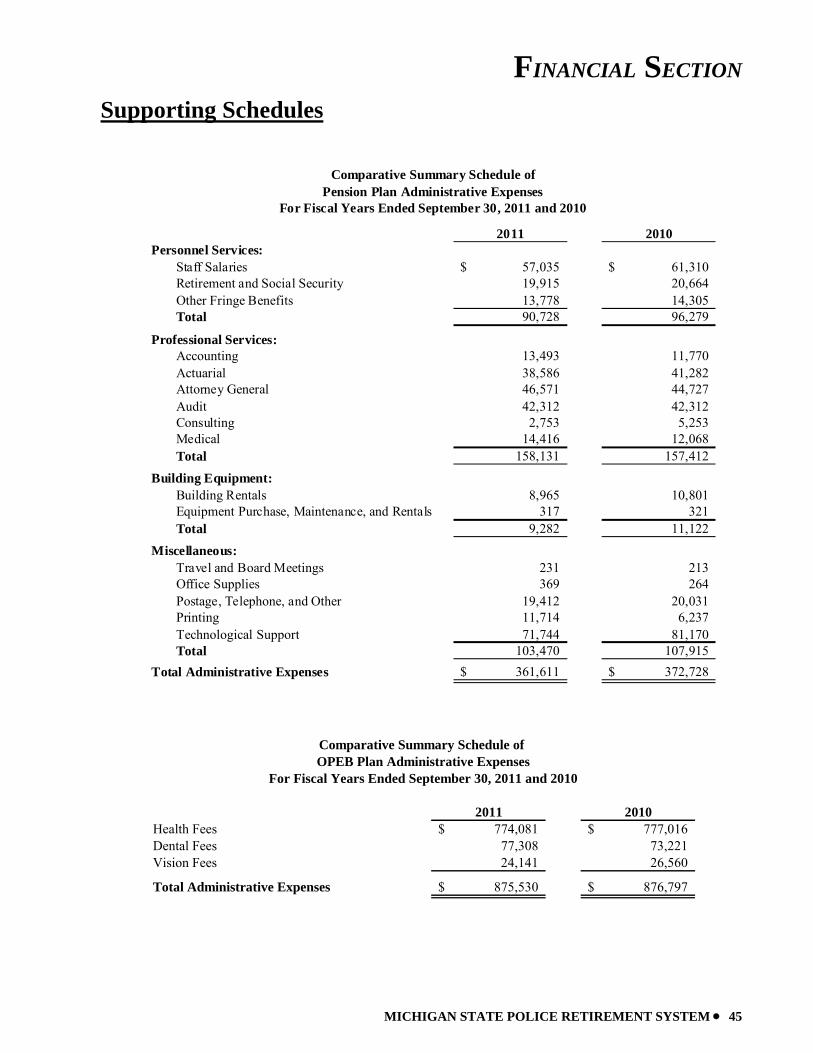
FINANCIAL SECTION
MICHIGAN STATE POLICE RETIREMENT SYSTEM • 45
Supporting Schedules
2011 2010Personnel Services:
Staff Salaries 57,035$ 61,310$ Retirement and Social Security 19,915 20,664 Other Fringe Benefits 13,778 14,305 Total 90,728 96,279
Professional Services:Accounting 13,493 11,770 Actuarial 38,586 41,282 Attorney General 46,571 44,727 Audit 42,312 42,312 Consulting 2,753 5,253 Medical 14,416 12,068 Total 158,131 157,412
Building Equipment:Building Rentals 8,965 10,801 Equipment Purchase, Maintenance, and Rentals 317 321 Total 9,282 11,122
Miscellaneous:Travel and Board Meetings 231 213 Office Supplies 369 264 Postage, Telephone, and Other 19,412 20,031 Printing 11,714 6,237 Technological Support 71,744 81,170 Total 103,470 107,915
Total Administrative Expenses 361,611$ 372,728$
Comparative Summary Schedule ofPension Plan Administrative Expenses
For Fiscal Years Ended September 30, 2011 and 2010
2011 2010Health Fees 774,081$ 777,016$ Dental Fees 77,308 73,221 Vision Fees 24,141 26,560
Total Administrative Expenses 875,530$ 876,797$
Comparative Summary Schedule of OPEB Plan Administrative Expenses
For Fiscal Years Ended September 30, 2011 and 2010
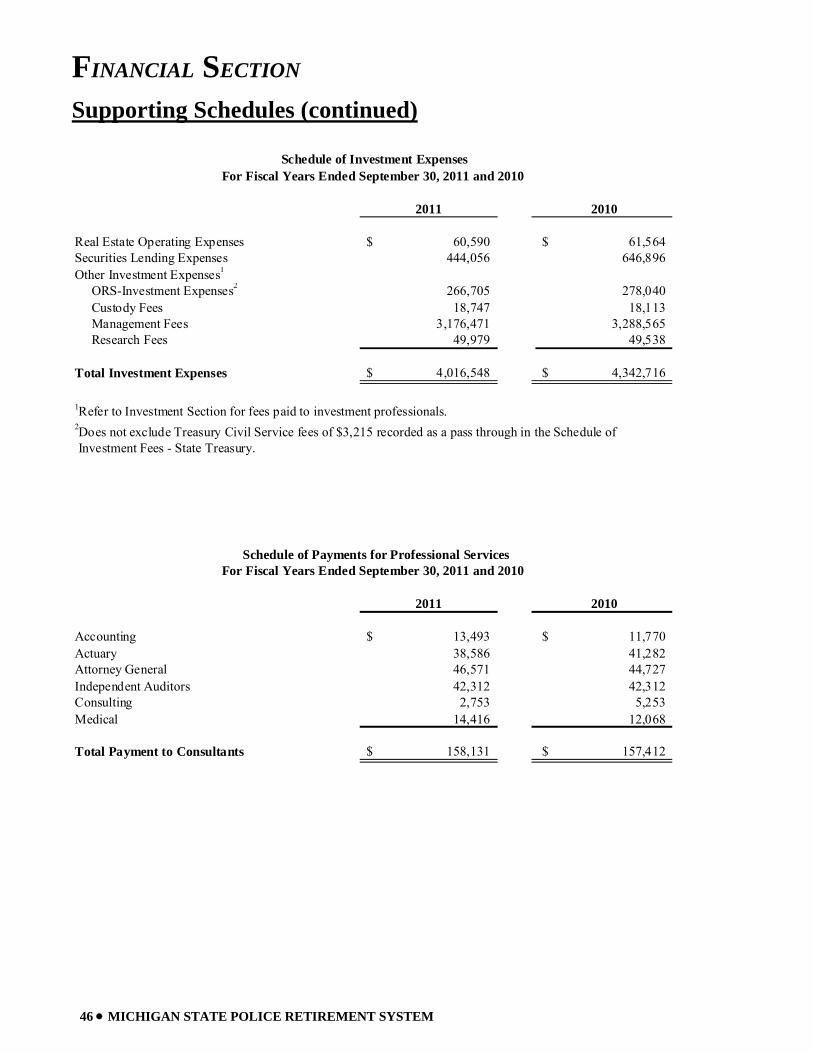
FINANCIAL SECTION
46 • MICHIGAN STATE POLICE RETIREMENT SYSTEM
Supporting Schedules (continued)
2011 2010
Real Estate Operating Expenses 60,590$ 61,564$ Securities Lending Expenses 444,056 646,896 Other Investment Expenses1
ORS-Investment Expenses2 266,705 278,040 Custody Fees 18,747 18,113 Management Fees 3,176,471 3,288,565 Research Fees 49,979 49,538
Total Investment Expenses 4,016,548$ 4,342,716$
1Refer to Investment Section for fees paid to investment professionals.2Does not exclude Treasury Civil Service fees of $3,215 recorded as a pass through in the Schedule of Investment Fees - State Treasury.
2011 2010
Accounting 13,493$ 11,770$ Actuary 38,586 41,282 Attorney General 46,571 44,727 Independent Auditors 42,312 42,312 Consulting 2,753 5,253 Medical 14,416 12,068
Total Payment to Consultants 158,131$ 157,412$ 111111
Schedule of Investment Expenses
Schedule of Payments for Professional Services
For Fiscal Years Ended September 30, 2011 and 2010
For Fiscal Years Ended September 30, 2011 and 2010

MICHIGAN STATE POLICE RETIREMENT SYSTEM • 47
This page intentionally left blank.
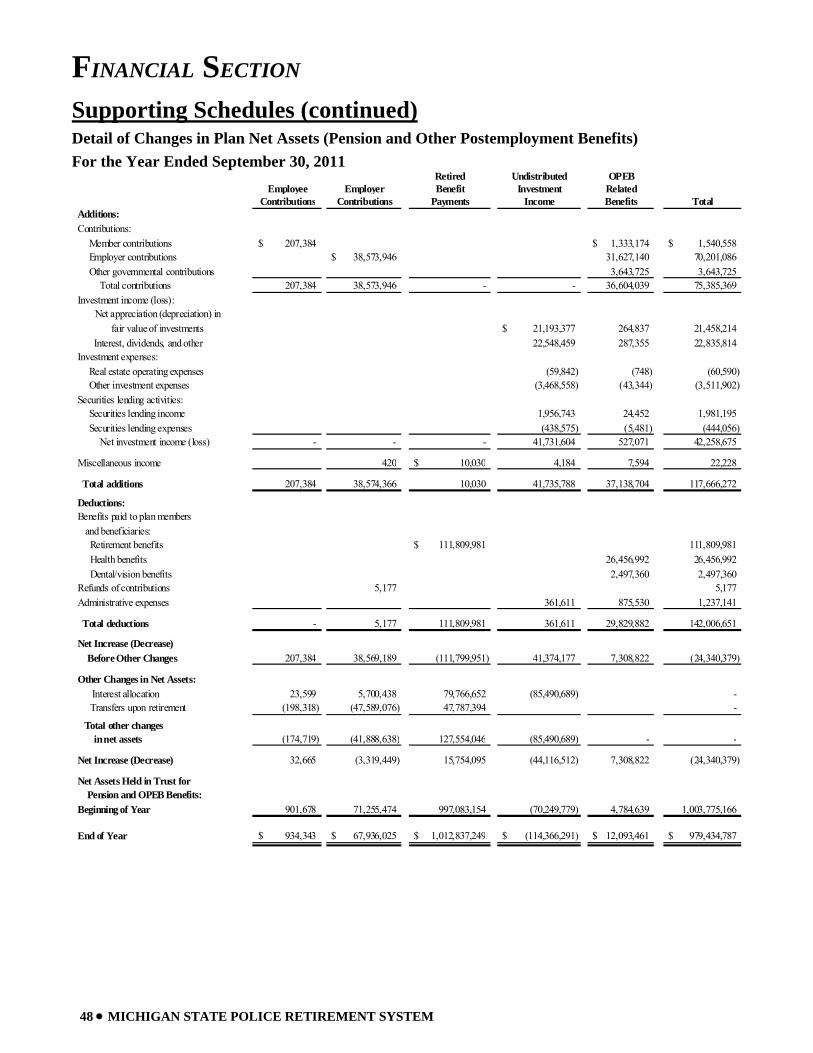
FINANCIAL SECTION
48 • MICHIGAN STATE POLICE RETIREMENT SYSTEM
Supporting Schedules (continued) Detail of Changes in Plan Net Assets (Pension and Other Postemployment Benefits) For the Year Ended September 30, 2011
Retired Undistributed OPEBEmployee Employer Benefit Investment Related
Contributions Contributions Payments Income Benefits TotalAdditions:Contributions:
Member contributions 207,384$ 1,333,174$ 1,540,558$ Employer contributions 38,573,946$ 31,627,140 70,201,086 Other governmental contributions 3,643,725 3,643,725
Total contributions 207,384 38,573,946 - - 36,604,039 75,385,369 Investment income (loss): Net appreciation (depreciation) in fair value of investments 21,193,377$ 264,837 21,458,214
Interest, dividends, and other 22,548,459 287,355 22,835,814 Investment expenses:
Real estate operating expenses (59,842) (748) (60,590) Other investment expenses (3,468,558) (43,344) (3,511,902)
Securities lending activities:Securities lending income 1,956,743 24,452 1,981,195 Securities lending expenses (438,575) (5,481) (444,056)
Net investment income (loss) - - - 41,731,604 527,071 42,258,675
Miscellaneous income 420 10,030$ 4,184 7,594 22,228
Total additions 207,384 38,574,366 10,030 41,735,788 37,138,704 117,666,272
Deductions:Benefits paid to plan members and beneficiaries: Retirement benefits 111,809,981$ 111,809,981 Health benefits 26,456,992 26,456,992 Dental/vision benefits 2,497,360 2,497,360 Refunds of contributions 5,177 5,177 Administrative expenses 361,611 875,530 1,237,141
Total deductions - 5,177 111,809,981 361,611 29,829,882 142,006,651
Net Increase (Decrease) Before Other Changes 207,384 38,569,189 (111,799,951) 41,374,177 7,308,822 (24,340,379)
Other Changes in Net Assets: Interest allocation 23,599 5,700,438 79,766,652 (85,490,689) - Transfers upon retirement (198,318) (47,589,076) 47,787,394 -
Total other changes in net assets (174,719) (41,888,638) 127,554,046 (85,490,689) - -
Net Increase (Decrease) 32,665 (3,319,449) 15,754,095 (44,116,512) 7,308,822 (24,340,379)
Net Assets Held in Trust for Pension and OPEB Benefits:Beginning of Year 901,678 71,255,474 997,083,154 (70,249,779) 4,784,639 1,003,775,166
End of Year 934,343$ 67,936,025$ 1,012,837,249$ (114,366,291)$ 12,093,461$ 979,434,787$
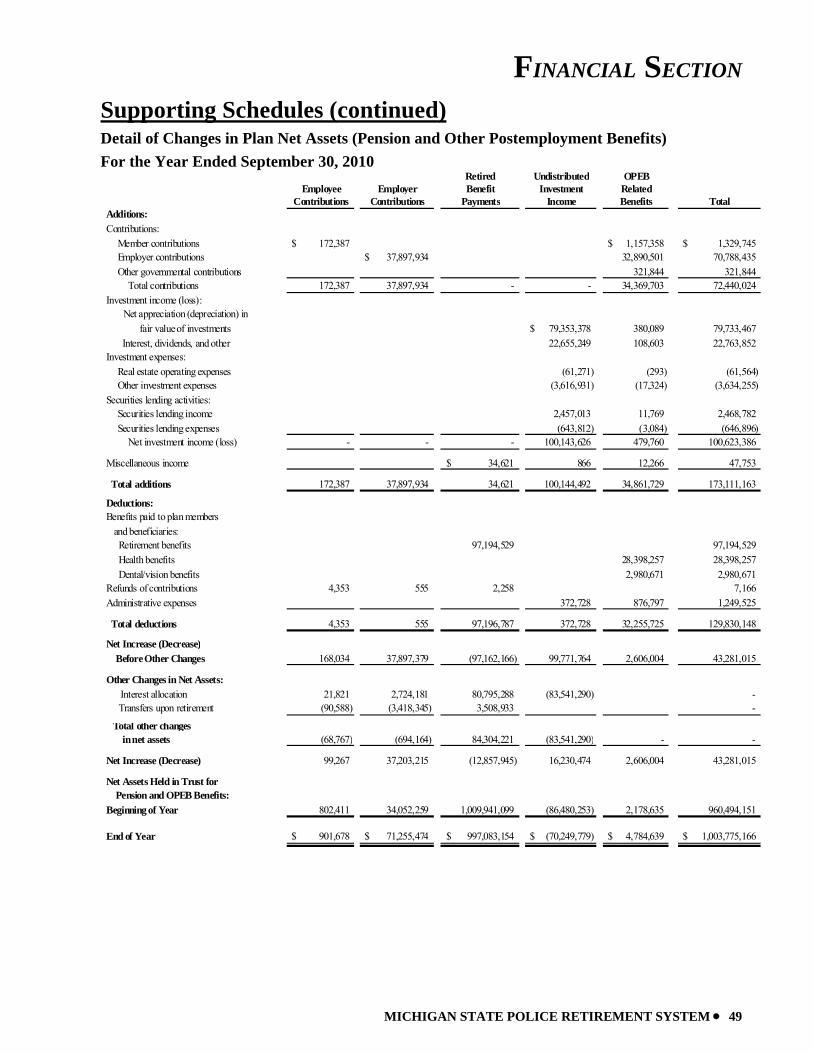
FINANCIAL SECTION
MICHIGAN STATE POLICE RETIREMENT SYSTEM • 49
Supporting Schedules (continued) Detail of Changes in Plan Net Assets (Pension and Other Postemployment Benefits) For the Year Ended September 30, 2010
Retired Undistributed OPEBEmployee Employer Benefit Investment Related
Contributions Contributions Payments Income Benefits TotalAdditions:Contributions:
Member contributions 172,387$ 1,157,358$ 1,329,745$ Employer contributions 37,897,934$ 32,890,501 70,788,435 Other governmental contributions 321,844 321,844
Total contributions 172,387 37,897,934 - - 34,369,703 72,440,024 Investment income (loss): Net appreciation (depreciation) in fair value of investments 79,353,378$ 380,089 79,733,467
Interest, dividends, and other 22,655,249 108,603 22,763,852 Investment expenses:
Real estate operating expenses (61,271) (293) (61,564) Other investment expenses (3,616,931) (17,324) (3,634,255)
Securities lending activities:Securities lending income 2,457,013 11,769 2,468,782 Securities lending expenses (643,812) (3,084) (646,896)
Net investment income (loss) - - - 100,143,626 479,760 100,623,386
Miscellaneous income 34,621$ 866 12,266 47,753
Total additions 172,387 37,897,934 34,621 100,144,492 34,861,729 173,111,163
Deductions:Benefits paid to plan members and beneficiaries: Retirement benefits 97,194,529 97,194,529 Health benefits 28,398,257 28,398,257 Dental/vision benefits 2,980,671 2,980,671 Refunds of contributions 4,353 555 2,258 7,166 Administrative expenses 372,728 876,797 1,249,525
Total deductions 4,353 555 97,196,787 372,728 32,255,725 129,830,148
Net Increase (Decrease) Before Other Changes 168,034 37,897,379 (97,162,166) 99,771,764 2,606,004 43,281,015
Other Changes in Net Assets: Interest allocation 21,821 2,724,181 80,795,288 (83,541,290) - Transfers upon retirement (90,588) (3,418,345) 3,508,933 -
Total other changes in net assets (68,767) (694,164) 84,304,221 (83,541,290) - -
Net Increase (Decrease) 99,267 37,203,215 (12,857,945) 16,230,474 2,606,004 43,281,015
Net Assets Held in Trust for Pension and OPEB Benefits:Beginning of Year 802,411 34,052,259 1,009,941,099 (86,480,253) 2,178,635 960,494,151
End of Year 901,678$ 71,255,474$ 997,083,154$ (70,249,779)$ 4,784,639$ 1,003,775,166$

50 • MICHIGAN STATE POLICE RETIREMENT SYSTEM
This page intentionally left blank.

MICHIGAN STATE POLICE RETIREMENT SYSTEM • 51
INVESTMENT SECTION
Prepared by Michigan Department of Treasury, Bureau of Investments
Jon M. Braeutigam, Director
Report on Investment Activity Asset Allocation
Investment Results List of Largest Stock Holdings List of Largest Bond Holdings
Schedule of Investment Fees Schedule of Investment Commissions
Investment Summary
INVESTMENT SECTION
52 • MICHIGAN STATE POLICE RETIREMENT SYSTEM
Report on Investment Activity INTRODUCTION The State Treasurer reports investment activity quarterly to the Investment Advisory Committee (Committee), which reviews the investments, goals, and objectives of the retirement funds and may submit recommendations regarding them to the State Treasurer. The Investment Advisory Committee may also, by a majority vote, direct the State Treasurer to dispose of any holdings that, in the Committee’s judgment, are not suitable for the funds involved, and may, by unanimous vote, direct the State Treasurer to make specific investments. The Investment Advisory Committee was created by Act 380 of the Public Acts of 1965. The three public members of the five-member committee are appointed by the Governor with the advice and consent of the Senate for three-year terms. The Director of the Department of Licensing and Regulatory Affairs and the Director of the Office of Retirement Services, Department of Technology, Management & Budget are ex-officio members. As of September 30, 2011, members of the Committee were as follows: David G. Sowerby, CFA (public member), James B. Nicholson (public member), Roger D. Robinson (public member), Steven H. Hilfinger (ex-officio member), and Phillip J. Stoddard (ex-officio member). The public members serve without pay, but may be paid actual and necessary travel and other expenses. INVESTMENT POLICY & GOALS Investment policy states that the fiduciary will operate within standard investment practices of the prudent person and in accordance with Public Employee Retirement System Investment Act 314 of 1965. The fiduciary is authorized to invest in government obligations, corporate obligations, various short-term obligations, corporate (domestic and international) stocks, private equity interests, mutual funds, real estate interests, and other investments subject to specific parameters. Above all, trust fund assets are to be invested for the exclusive benefit of the members of the System, in a fiduciary capacity. The System’s Proxy Voting Policy sets forth directives on the following issues: Boards of Directors, corporate governance, social issues, corporate restructurings and defenses. All proxies are reviewed and voted in accordance with the System’s policy. The primary function of the System is to provide retirement, survivor and disability benefits along with health and other postemployment benefits to its members. The State Treasurer is the sole investment fiduciary and custodian of the System’s investments pursuant to State law. The goals of the System are: 1. Achieve the optimal rate of return possible within prudent levels of risk.
2. Maintain sufficient liquidity to pay benefits. 3. Diversify assets to preserve capital and avoid large losses.
4. Meet or exceed the actuarial assumption over the long term. 5. Perform in the top half of the public plan universe over the long term. 6. Exceed individual asset class benchmarks over the long term. 7. Operate in a cost-effective manner. The strategy for achieving these goals is carried out by investing the assets of the System according to a two-year asset allocation model. The System currently invests in seven different asset classes, which provides for a well-diversified portfolio.
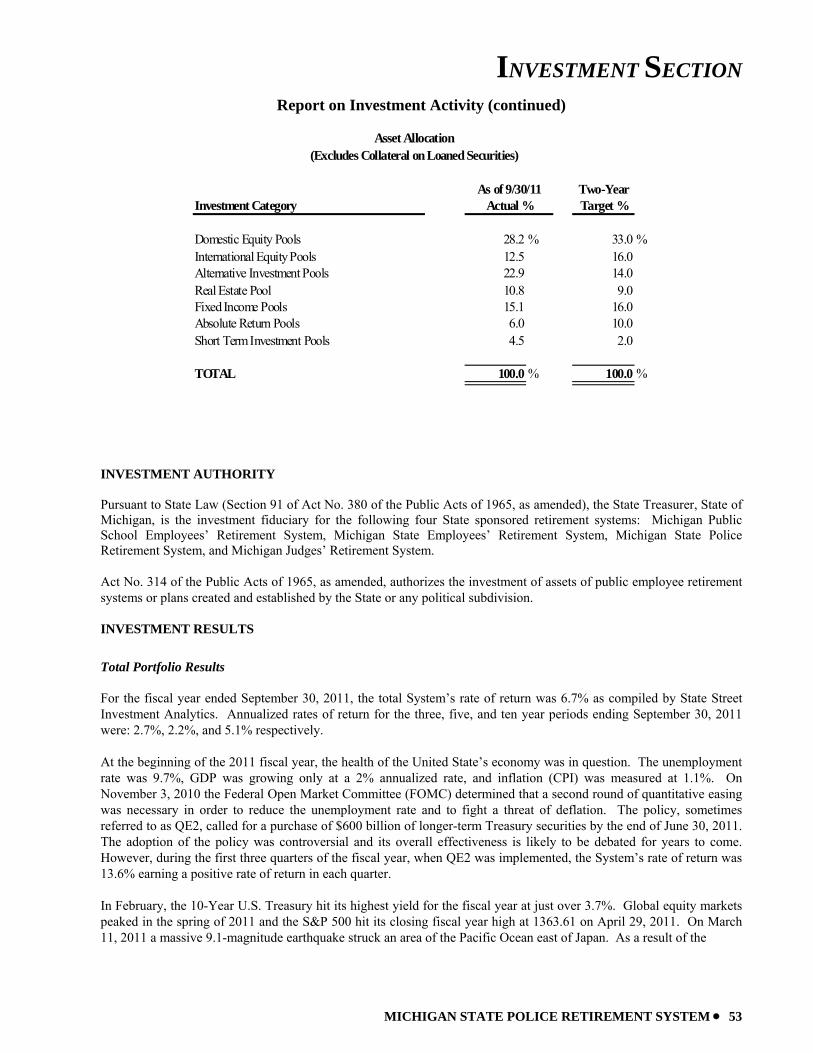
INVESTMENT SECTION
MICHIGAN STATE POLICE RETIREMENT SYSTEM • 53
Report on Investment Activity (continued)
Two-YearInvestment Category Target %
Domestic Equity Pools 28.2 % 33.0 %International Equity Pools 12.5 16.0Alternative Investment Pools 22.9 14.0Real Estate Pool 10.8 9.0Fixed Income Pools 15.1 16.0Absolute Return Pools 6.0 10.0Short Term Investment Pools 4.5 2.0
TOTAL 100.0 % 100.0 %xxx xxx
Asset Allocation(Excludes Collateral on Loaned Securities)
As of 9/30/11Actual %
INVESTMENT AUTHORITY Pursuant to State Law (Section 91 of Act No. 380 of the Public Acts of 1965, as amended), the State Treasurer, State of Michigan, is the investment fiduciary for the following four State sponsored retirement systems: Michigan Public School Employees’ Retirement System, Michigan State Employees’ Retirement System, Michigan State Police Retirement System, and Michigan Judges’ Retirement System. Act No. 314 of the Public Acts of 1965, as amended, authorizes the investment of assets of public employee retirement systems or plans created and established by the State or any political subdivision. INVESTMENT RESULTS
Total Portfolio Results For the fiscal year ended September 30, 2011, the total System’s rate of return was 6.7% as compiled by State Street Investment Analytics. Annualized rates of return for the three, five, and ten year periods ending September 30, 2011 were: 2.7%, 2.2%, and 5.1% respectively. At the beginning of the 2011 fiscal year, the health of the United State’s economy was in question. The unemployment rate was 9.7%, GDP was growing only at a 2% annualized rate, and inflation (CPI) was measured at 1.1%. On November 3, 2010 the Federal Open Market Committee (FOMC) determined that a second round of quantitative easing was necessary in order to reduce the unemployment rate and to fight a threat of deflation. The policy, sometimes referred to as QE2, called for a purchase of $600 billion of longer-term Treasury securities by the end of June 30, 2011. The adoption of the policy was controversial and its overall effectiveness is likely to be debated for years to come. However, during the first three quarters of the fiscal year, when QE2 was implemented, the System’s rate of return was 13.6% earning a positive rate of return in each quarter. In February, the 10-Year U.S. Treasury hit its highest yield for the fiscal year at just over 3.7%. Global equity markets peaked in the spring of 2011 and the S&P 500 hit its closing fiscal year high at 1363.61 on April 29, 2011. On March 11, 2011 a massive 9.1-magnitude earthquake struck an area of the Pacific Ocean east of Japan. As a result of the
INVESTMENT SECTION
54 • MICHIGAN STATE POLICE RETIREMENT SYSTEM
Report on Investment Activity (continued) earthquake, a giant tsunami devastated parts of the country. Hit especially hard was the Fukushima Daiichi nuclear power plant, the largest nuclear accident since the 1986 Chernobyl disaster. As a result, many Japanese companies were unable to operate. Since Japan is a major supplier to the global economy, manufacturers reported shortages for key components, crimping global output. The price paid for a barrel of crude oil was especially volatile in the winter months due to a loosely-linked series of demonstrations, government protests, and revolutions known as “Arab Spring”. These events occurred across a number of Middle East and North African countries, many of which are oil producing exporters. In one instance, oil prices jumped by over 8.5% as unrest in Libya intensified. By early summer, many economists came to believe that the Arab Spring and the Japanese tsunami caused a temporary weakness in the global economy that would resolve itself in the second half of the year. About the same time, however, European sovereign debt concerns began to re-emerge. Soaring interest rates in some highly indebted countries were forcing politicians to adopt various austerity measures. Adding complexity to the situation, many large European banks are holding sovereign debt as low-risk capital, placing an enormous strain on the health of the European banking industry. At home, U.S. politicians were debating the wisdom for raising the federal debt ceiling as the legal limit would be reached by July 31. After tense negotiations, a last hour compromise was reached, but not without consequence. Five days later Standard & Poor’s, a major debt rating agency, down-graded the credit rating of U.S. debt from AAA to AA. The prospects of slower global growth, austerity measures, sovereign credit risks, and the end of QE2 apparently were too much for the capital markets to bear. In the final two months of the fiscal year, the S&P 500 lost over 12% of its value while foreign markets lost over 18% in value. Despite the downgrade by Standard & Poor’s, the 10-year U.S. Treasury hit an all time low of 1.72% on September 22, as it remained a global safe-haven. The System ended the fiscal 2011 year with a positive 6.7% return. At the end of Fiscal 2011, the health of the U.S. economy remained a top concern. The unemployment rate is still over 9% and GDP is barely growing at a rate of 1.3%. The inflation rate has increased to 3.8%, though many economists believe the elevated inflation rate to be transitory given the employment situation and the sluggish economy. In response to the weak economic backdrop, the FOMC is again attempting to stimulate growth. On September 21, 2011 a plan to purchase $400 billion of bonds with maturities of 6 to 30 years by selling bonds with maturities of less than 3 years was announced. Like QE2, the plan known as “Operation Twist” is an attempt to lower longer-term borrowing rates. However, unlike QE2 this plan is not an expansion for the Federal Reserve’s balance sheet or seen as printing money. While it is still too early to determine the effects of Operation Twist; it will be important to closely monitor its success, the 2012 presidential election, the European debt situation, the Arab Spring, and the slowing global growth well into the 2012 fiscal year.
Domestic Equity Pools The objective for investments made in domestic equities is to meet or exceed the total return of the S&P 1500 Super Composite for one, three, and five-year periods and a market cycle. For active management strategies, the objective is to earn returns that exceed the most relevant S&P Index (or the most relevant Russell Index), adjusting for market capitalization and style, for one, three, and five-year periods and a market cycle. Rank above median in a universe of managers possessing a similar market cap and style characteristics.
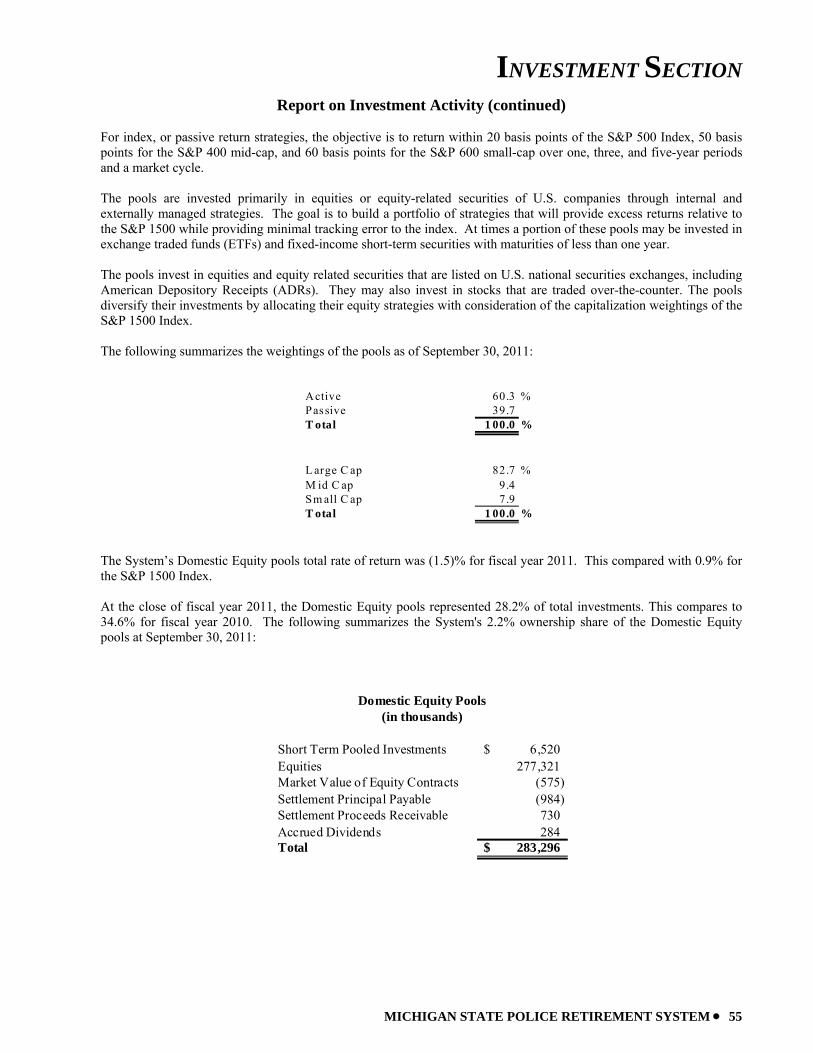
INVESTMENT SECTION
MICHIGAN STATE POLICE RETIREMENT SYSTEM • 55
Report on Investment Activity (continued) For index, or passive return strategies, the objective is to return within 20 basis points of the S&P 500 Index, 50 basis points for the S&P 400 mid-cap, and 60 basis points for the S&P 600 small-cap over one, three, and five-year periods and a market cycle. The pools are invested primarily in equities or equity-related securities of U.S. companies through internal and externally managed strategies. The goal is to build a portfolio of strategies that will provide excess returns relative to the S&P 1500 while providing minimal tracking error to the index. At times a portion of these pools may be invested in exchange traded funds (ETFs) and fixed-income short-term securities with maturities of less than one year. The pools invest in equities and equity related securities that are listed on U.S. national securities exchanges, including American Depository Receipts (ADRs). They may also invest in stocks that are traded over-the-counter. The pools diversify their investments by allocating their equity strategies with consideration of the capitalization weightings of the S&P 1500 Index.
The following summarizes the weightings of the pools as of September 30, 2011:
Active 60.3 %Passive 39.7T otal 1 00.0 %
L arge C ap 82.7 %M id C ap 9.4Sm all C ap 7.9T otal 1 00.0 %
The System’s Domestic Equity pools total rate of return was (1.5)% for fiscal year 2011. This compared with 0.9% for the S&P 1500 Index. At the close of fiscal year 2011, the Domestic Equity pools represented 28.2% of total investments. This compares to 34.6% for fiscal year 2010. The following summarizes the System's 2.2% ownership share of the Domestic Equity pools at September 30, 2011:
Short Term Pooled Investments 6,520$ Equities 277,321 Market Value of Equity Contracts (575) Settlement Principal Payable (984) Settlement Proceeds Receivable 730 Accrued Dividends 284 Total 283,296$
Domestic Equity Pools(in thousands)
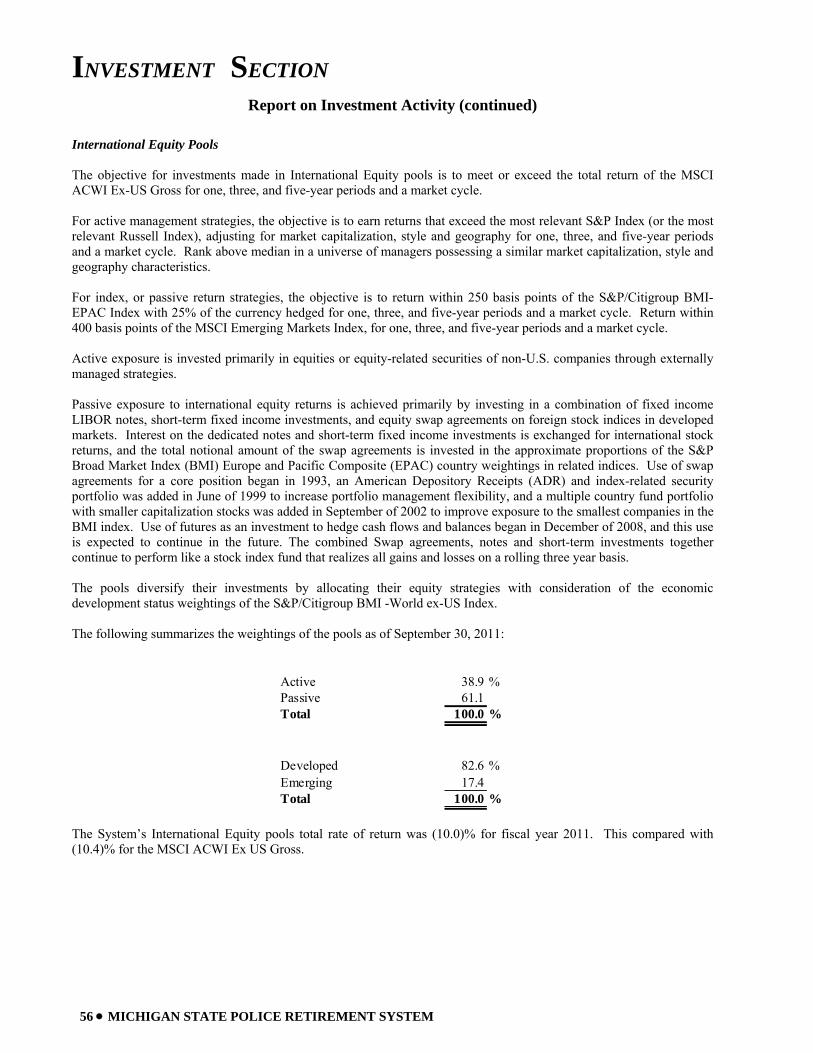
INVESTMENT SECTION
56 • MICHIGAN STATE POLICE RETIREMENT SYSTEM
Report on Investment Activity (continued)
International Equity Pools The objective for investments made in International Equity pools is to meet or exceed the total return of the MSCI ACWI Ex-US Gross for one, three, and five-year periods and a market cycle. For active management strategies, the objective is to earn returns that exceed the most relevant S&P Index (or the most relevant Russell Index), adjusting for market capitalization, style and geography for one, three, and five-year periods and a market cycle. Rank above median in a universe of managers possessing a similar market capitalization, style and geography characteristics. For index, or passive return strategies, the objective is to return within 250 basis points of the S&P/Citigroup BMI-EPAC Index with 25% of the currency hedged for one, three, and five-year periods and a market cycle. Return within 400 basis points of the MSCI Emerging Markets Index, for one, three, and five-year periods and a market cycle. Active exposure is invested primarily in equities or equity-related securities of non-U.S. companies through externally managed strategies. Passive exposure to international equity returns is achieved primarily by investing in a combination of fixed income LIBOR notes, short-term fixed income investments, and equity swap agreements on foreign stock indices in developed markets. Interest on the dedicated notes and short-term fixed income investments is exchanged for international stock returns, and the total notional amount of the swap agreements is invested in the approximate proportions of the S&P Broad Market Index (BMI) Europe and Pacific Composite (EPAC) country weightings in related indices. Use of swap agreements for a core position began in 1993, an American Depository Receipts (ADR) and index-related security portfolio was added in June of 1999 to increase portfolio management flexibility, and a multiple country fund portfolio with smaller capitalization stocks was added in September of 2002 to improve exposure to the smallest companies in the BMI index. Use of futures as an investment to hedge cash flows and balances began in December of 2008, and this use is expected to continue in the future. The combined Swap agreements, notes and short-term investments together continue to perform like a stock index fund that realizes all gains and losses on a rolling three year basis. The pools diversify their investments by allocating their equity strategies with consideration of the economic development status weightings of the S&P/Citigroup BMI -World ex-US Index.
The following summarizes the weightings of the pools as of September 30, 2011:
Active 38.9 %Passive 61.1Total 100.0 %
Developed 82.6 %Emerging 17.4Total 100.0 %
The System’s International Equity pools total rate of return was (10.0)% for fiscal year 2011. This compared with (10.4)% for the MSCI ACWI Ex US Gross.
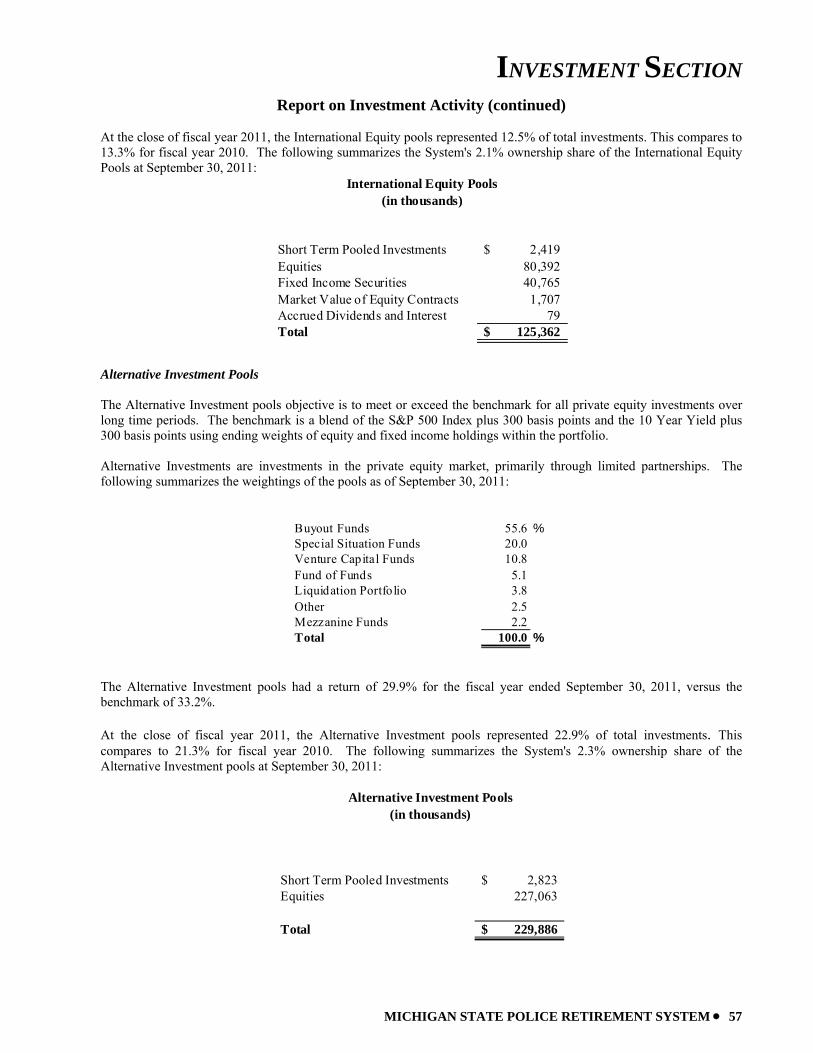
INVESTMENT SECTION
MICHIGAN STATE POLICE RETIREMENT SYSTEM • 57
Report on Investment Activity (continued) At the close of fiscal year 2011, the International Equity pools represented 12.5% of total investments. This compares to 13.3% for fiscal year 2010. The following summarizes the System's 2.1% ownership share of the International Equity Pools at September 30, 2011:
Short Term Pooled Investments 2,419$ Equities 80,392 Fixed Income Securities 40,765 Market Value of Equity Contracts 1,707 Accrued Dividends and Interest 79 Total 125,362$
International Equity Pools(in thousands)
Alternative Investment Pools The Alternative Investment pools objective is to meet or exceed the benchmark for all private equity investments over long time periods. The benchmark is a blend of the S&P 500 Index plus 300 basis points and the 10 Year Yield plus 300 basis points using ending weights of equity and fixed income holdings within the portfolio. Alternative Investments are investments in the private equity market, primarily through limited partnerships. The following summarizes the weightings of the pools as of September 30, 2011:
Buyout Funds 55.6 %Special Situation Funds 20.0Venture Capital Funds 10.8Fund of Funds 5.1Liquidation Portfolio 3.8Other 2.5Mezzanine Funds 2.2Total 100.0 %
The Alternative Investment pools had a return of 29.9% for the fiscal year ended September 30, 2011, versus the benchmark of 33.2%. At the close of fiscal year 2011, the Alternative Investment pools represented 22.9% of total investments. This compares to 21.3% for fiscal year 2010. The following summarizes the System's 2.3% ownership share of the Alternative Investment pools at September 30, 2011:
Short Term Pooled Investments 2,823$ Equities 227,063
Total 229,886$
Alternative Investment Pools(in thousands)
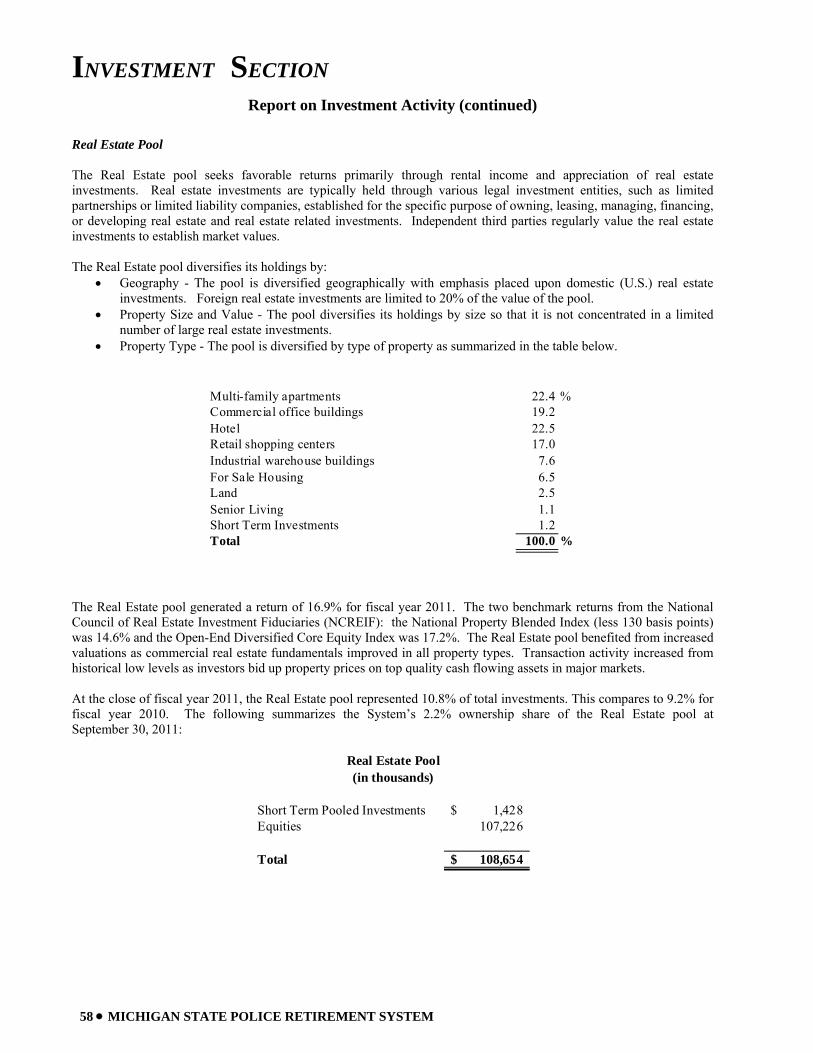
INVESTMENT SECTION
58 • MICHIGAN STATE POLICE RETIREMENT SYSTEM
Report on Investment Activity (continued)
Real Estate Pool The Real Estate pool seeks favorable returns primarily through rental income and appreciation of real estate investments. Real estate investments are typically held through various legal investment entities, such as limited partnerships or limited liability companies, established for the specific purpose of owning, leasing, managing, financing, or developing real estate and real estate related investments. Independent third parties regularly value the real estate investments to establish market values. The Real Estate pool diversifies its holdings by:
• Geography - The pool is diversified geographically with emphasis placed upon domestic (U.S.) real estate investments. Foreign real estate investments are limited to 20% of the value of the pool.
• Property Size and Value - The pool diversifies its holdings by size so that it is not concentrated in a limited number of large real estate investments.
• Property Type - The pool is diversified by type of property as summarized in the table below.
Multi-family apartments 22.4 %Commercial office buildings 19.2Hotel 22.5Retail shopping centers 17.0Industrial warehouse buildings 7.6For Sale Housing 6.5Land 2.5Senior Living 1.1Short Term Investments 1.2Total 100.0 %
The Real Estate pool generated a return of 16.9% for fiscal year 2011. The two benchmark returns from the National Council of Real Estate Investment Fiduciaries (NCREIF): the National Property Blended Index (less 130 basis points) was 14.6% and the Open-End Diversified Core Equity Index was 17.2%. The Real Estate pool benefited from increased valuations as commercial real estate fundamentals improved in all property types. Transaction activity increased from historical low levels as investors bid up property prices on top quality cash flowing assets in major markets. At the close of fiscal year 2011, the Real Estate pool represented 10.8% of total investments. This compares to 9.2% for fiscal year 2010. The following summarizes the System’s 2.2% ownership share of the Real Estate pool at September 30, 2011:
Short Term Pooled Investments 1,428$ Equities 107,226
Total 108,654$
Real Estate Pool(in thousands)
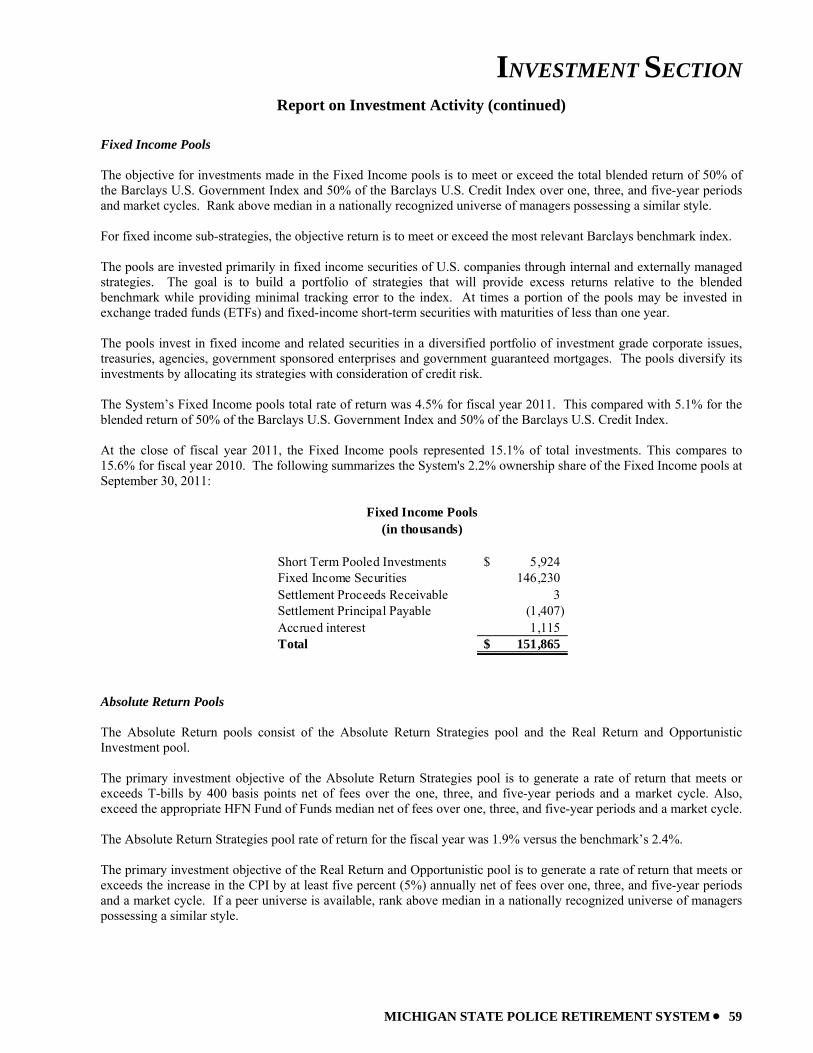
INVESTMENT SECTION
MICHIGAN STATE POLICE RETIREMENT SYSTEM • 59
Report on Investment Activity (continued)
Fixed Income Pools The objective for investments made in the Fixed Income pools is to meet or exceed the total blended return of 50% of the Barclays U.S. Government Index and 50% of the Barclays U.S. Credit Index over one, three, and five-year periods and market cycles. Rank above median in a nationally recognized universe of managers possessing a similar style. For fixed income sub-strategies, the objective return is to meet or exceed the most relevant Barclays benchmark index. The pools are invested primarily in fixed income securities of U.S. companies through internal and externally managed strategies. The goal is to build a portfolio of strategies that will provide excess returns relative to the blended benchmark while providing minimal tracking error to the index. At times a portion of the pools may be invested in exchange traded funds (ETFs) and fixed-income short-term securities with maturities of less than one year. The pools invest in fixed income and related securities in a diversified portfolio of investment grade corporate issues, treasuries, agencies, government sponsored enterprises and government guaranteed mortgages. The pools diversify its investments by allocating its strategies with consideration of credit risk. The System’s Fixed Income pools total rate of return was 4.5% for fiscal year 2011. This compared with 5.1% for the blended return of 50% of the Barclays U.S. Government Index and 50% of the Barclays U.S. Credit Index. At the close of fiscal year 2011, the Fixed Income pools represented 15.1% of total investments. This compares to 15.6% for fiscal year 2010. The following summarizes the System's 2.2% ownership share of the Fixed Income pools at September 30, 2011:
Short Term Pooled Investments 5,924$ Fixed Income Securities 146,230 Settlement Proceeds Receivable 3 Settlement Principal Payable (1,407) Accrued interest 1,115 Total 151,865$
Fixed Income Pools(in thousands)
Absolute Return Pools The Absolute Return pools consist of the Absolute Return Strategies pool and the Real Return and Opportunistic Investment pool. The primary investment objective of the Absolute Return Strategies pool is to generate a rate of return that meets or exceeds T-bills by 400 basis points net of fees over the one, three, and five-year periods and a market cycle. Also, exceed the appropriate HFN Fund of Funds median net of fees over one, three, and five-year periods and a market cycle. The Absolute Return Strategies pool rate of return for the fiscal year was 1.9% versus the benchmark’s 2.4%. The primary investment objective of the Real Return and Opportunistic pool is to generate a rate of return that meets or exceeds the increase in the CPI by at least five percent (5%) annually net of fees over one, three, and five-year periods and a market cycle. If a peer universe is available, rank above median in a nationally recognized universe of managers possessing a similar style.
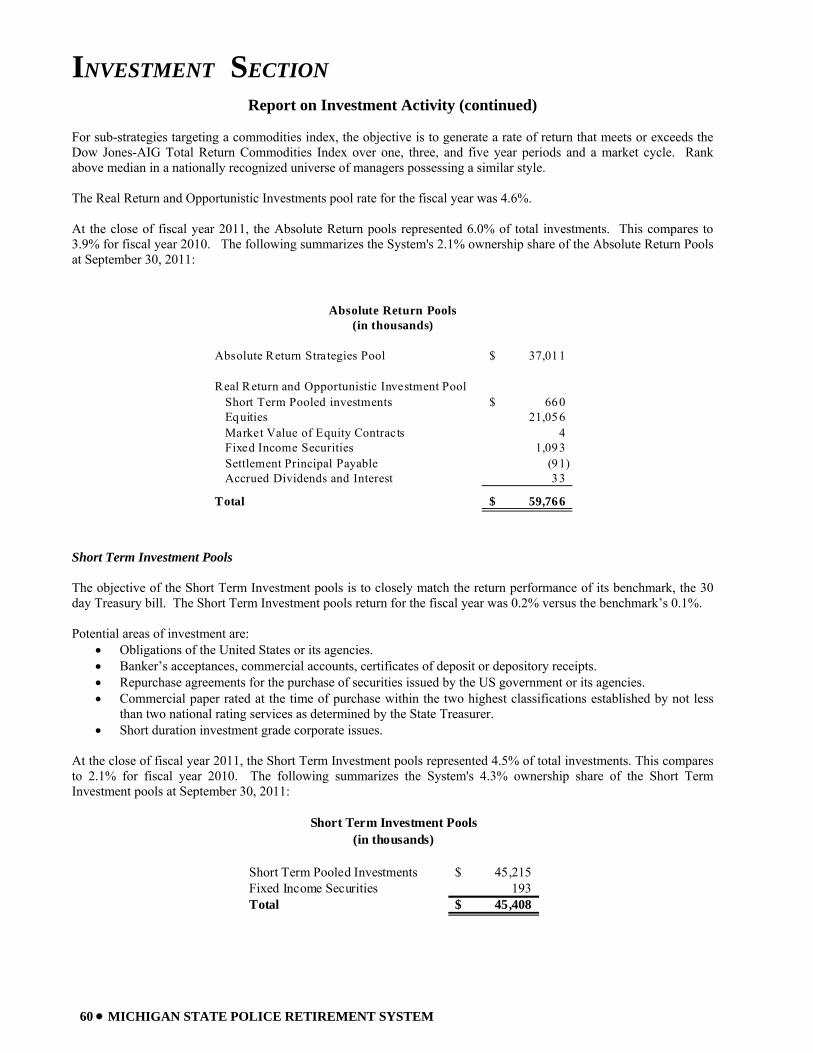
INVESTMENT SECTION
60 • MICHIGAN STATE POLICE RETIREMENT SYSTEM
Report on Investment Activity (continued) For sub-strategies targeting a commodities index, the objective is to generate a rate of return that meets or exceeds the Dow Jones-AIG Total Return Commodities Index over one, three, and five year periods and a market cycle. Rank above median in a nationally recognized universe of managers possessing a similar style. The Real Return and Opportunistic Investments pool rate for the fiscal year was 4.6%. At the close of fiscal year 2011, the Absolute Return pools represented 6.0% of total investments. This compares to 3.9% for fiscal year 2010. The following summarizes the System's 2.1% ownership share of the Absolute Return Pools at September 30, 2011:
Absolute Return Strategies Pool 37,011$
Real Return and Opportunistic Investment Pool Short Term Pooled investments 660$ Equities 21,056 Market Value of Equity Contracts 4 Fixed Income Securities 1,093 Settlement Principal Payable (91) Accrued Dividends and Interest 33
Total 59,766$
Absolute Return Pools(in thousands)
Short Term Investment Pools The objective of the Short Term Investment pools is to closely match the return performance of its benchmark, the 30 day Treasury bill. The Short Term Investment pools return for the fiscal year was 0.2% versus the benchmark’s 0.1%. Potential areas of investment are:
• Obligations of the United States or its agencies. • Banker’s acceptances, commercial accounts, certificates of deposit or depository receipts. • Repurchase agreements for the purchase of securities issued by the US government or its agencies. • Commercial paper rated at the time of purchase within the two highest classifications established by not less
than two national rating services as determined by the State Treasurer. • Short duration investment grade corporate issues.
At the close of fiscal year 2011, the Short Term Investment pools represented 4.5% of total investments. This compares to 2.1% for fiscal year 2010. The following summarizes the System's 4.3% ownership share of the Short Term Investment pools at September 30, 2011:
Short Term Pooled Investments 45,215$ Fixed Income Securities 193 Total 45,408$
Short Term Investment Pools(in thousands)
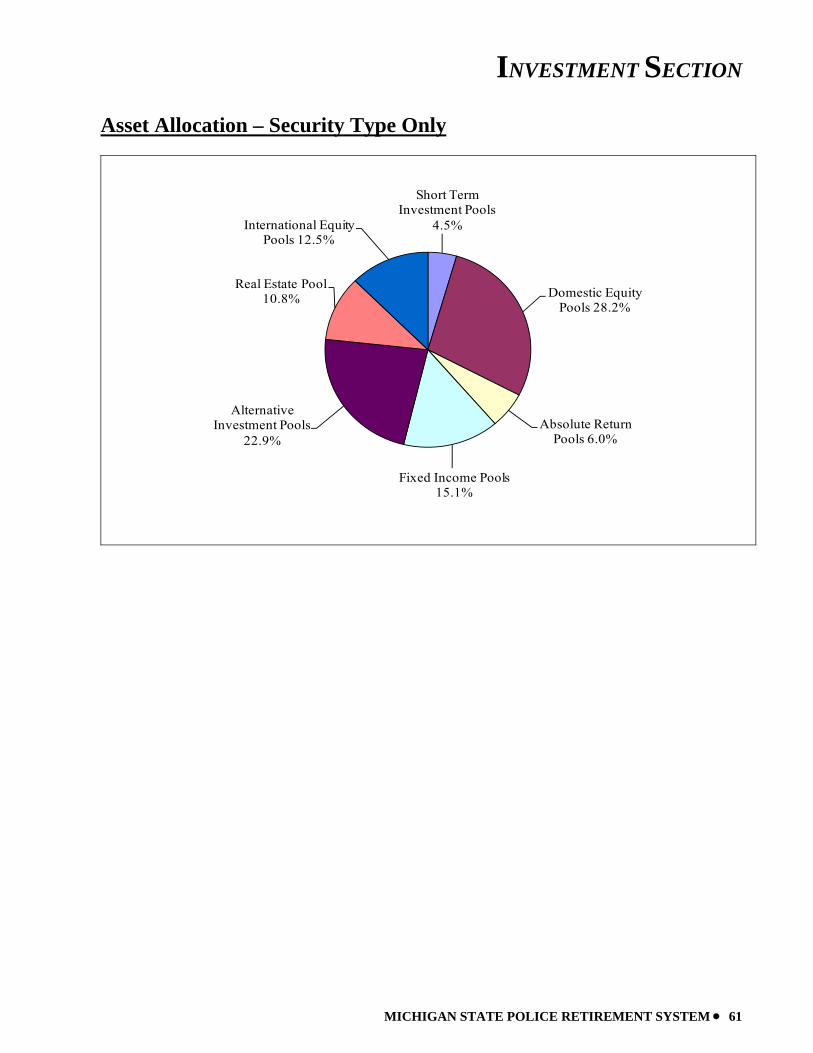
INVESTMENT SECTION
MICHIGAN STATE POLICE RETIREMENT SYSTEM • 61
Asset Allocation – Security Type Only
Short Term Investment Pools
4.5%
Domestic Equity Pools 28.2%
Absolute Return Pools 6.0%
Fixed Income Pools 15.1%
Alternative Investment Pools
22.9%
Real Estate Pool 10.8%
International Equity Pools 12.5%
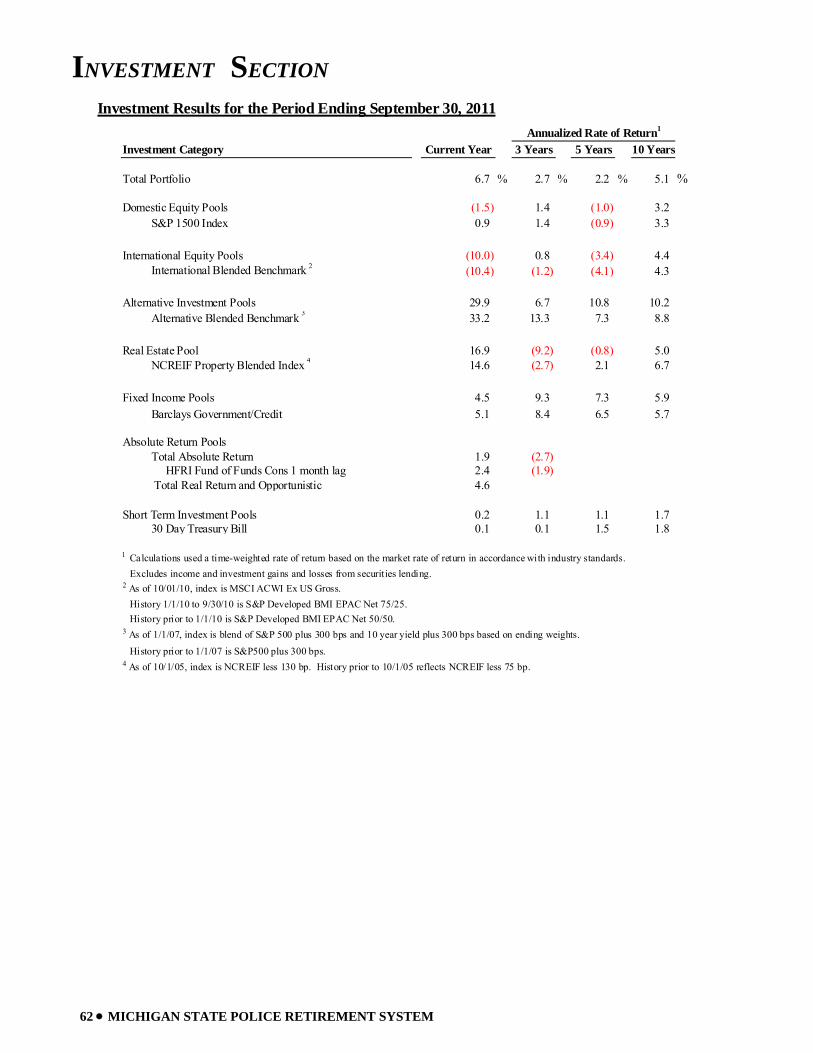
INVESTMENT SECTION
62 • MICHIGAN STATE POLICE RETIREMENT SYSTEM
Investment Results for the Period Ending September 30, 2011Annualized Rate of Return1
Investment Category Current Year 3 Years 5 Years 10 Years
Total Portfolio 6.7 % 2.7 % 2.2 % 5.1 %
Domestic Equity Pools (1.5) 1.4 (1.0) 3.2 S&P 1500 Index 0.9 1.4 (0.9) 3.3
International Equity Pools (10.0) 0.8 (3.4) 4.4 International Blended Benchmark 2 (10.4) (1.2) (4.1) 4.3
Alternative Investment Pools 29.9 6.7 10.8 10.2 Alternative Blended Benchmark 3 33.2 13.3 7.3 8.8
Real Estate Pool 16.9 (9.2) (0.8) 5.0 NCREIF Property Blended Index 4 14.6 (2.7) 2.1 6.7
Fixed Income Pools 4.5 9.3 7.3 5.9 Barclays Government/Credit 5.1 8.4 6.5 5.7
Absolute Return Pools Total Absolute Return 1.9 (2.7) HFRI Fund of Funds Cons 1 month lag 2.4 (1.9) Total Real Return and Opportunistic 4.6
Short Term Investment Pools 0.2 1.1 1.1 1.7 30 Day Treasury Bill 0.1 0.1 1.5 1.8
1 Calculations used a time-weighted rate of return based on the market rate of return in accordance with industry standards. Excludes income and investment gains and losses from securities lending.2 As of 10/01/10, index is MSCI ACWI Ex US Gross. History 1/1/10 to 9/30/10 is S&P Developed BMI EPAC Net 75/25. History prior to 1/1/10 is S&P Developed BMI EPAC Net 50/50.
3 As of 1/1/07, index is blend of S&P 500 plus 300 bps and 10 year yield plus 300 bps based on ending weights.
History prior to 1/1/07 is S&P500 plus 300 bps.4 As of 10/1/05, index is NCREIF less 130 bp. History prior to 10/1/05 reflects NCREIF less 75 bp.
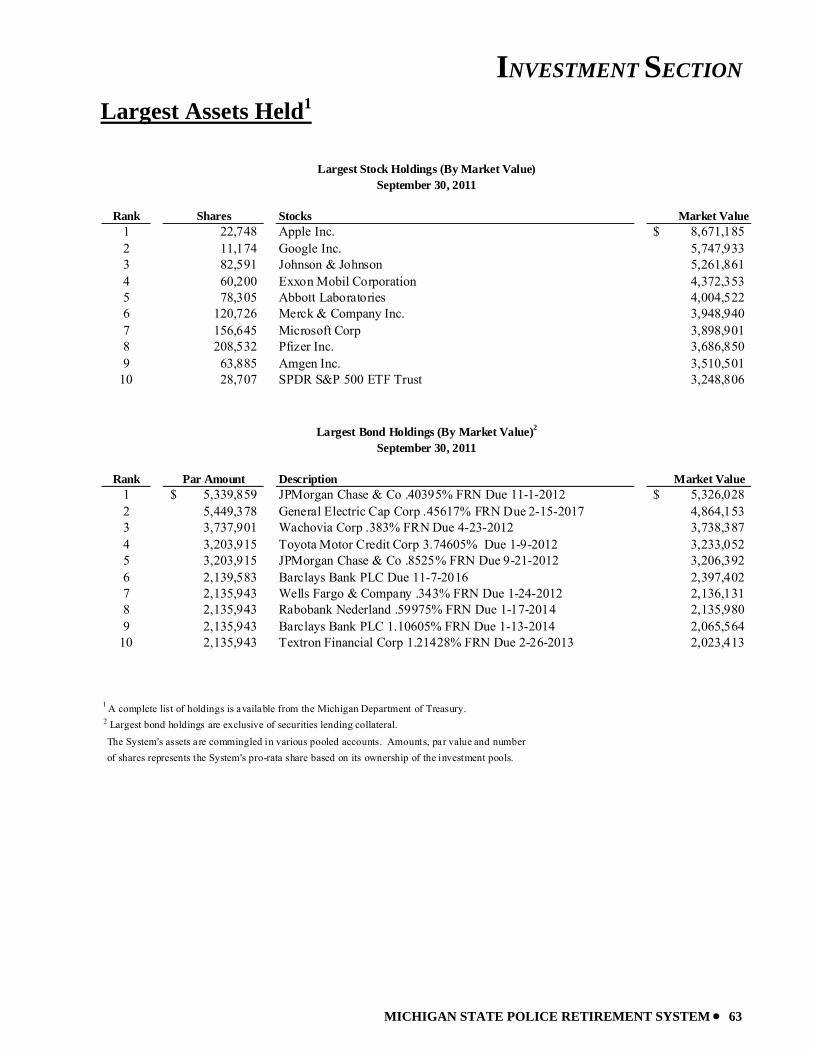
INVESTMENT SECTION
MICHIGAN STATE POLICE RETIREMENT SYSTEM • 63
Largest Assets Held1
Rank Shares Stocks Market Value1 22,748 Apple Inc. 8,671,185$ 2 11,174 Google Inc. 5,747,933 3 82,591 Johnson & Johnson 5,261,861 4 60,200 Exxon Mobil Corporation 4,372,353 5 78,305 Abbott Laboratories 4,004,522 6 120,726 Merck & Company Inc. 3,948,940 7 156,645 Microsoft Corp 3,898,901 8 208,532 Pfizer Inc. 3,686,850 9 63,885 Amgen Inc. 3,510,501
10 28,707 SPDR S&P 500 ETF Trust 3,248,806
Rank Par Amount Description Market Value1 5,339,859$ JPMorgan Chase & Co .40395% FRN Due 11-1-2012 5,326,028$ 2 5,449,378 General Electric Cap Corp .45617% FRN Due 2-15-2017 4,864,153 3 3,737,901 Wachovia Corp .383% FRN Due 4-23-2012 3,738,387 4 3,203,915 Toyota Motor Credit Corp 3.74605% Due 1-9-2012 3,233,052 5 3,203,915 JPMorgan Chase & Co .8525% FRN Due 9-21-2012 3,206,392 6 2,139,583 Barclays Bank PLC Due 11-7-2016 2,397,402 7 2,135,943 Wells Fargo & Company .343% FRN Due 1-24-2012 2,136,131 8 2,135,943 Rabobank Nederland .59975% FRN Due 1-17-2014 2,135,980 9 2,135,943 Barclays Bank PLC 1.10605% FRN Due 1-13-2014 2,065,564
10 2,135,943 Textron Financial Corp 1.21428% FRN Due 2-26-2013 2,023,413
1 A complete list of holdings is available from the Michigan Department of Treasury.2 Largest bond holdings are exclusive of securities lending collateral.The System's assets are commingled in various pooled accounts. Amounts, par value and numberof shares represents the System's pro-rata share based on its ownership of the investment pools.
Largest Bond Holdings (By Market Value)2
September 30, 2011
Largest Stock Holdings (By Market Value)September 30, 2011
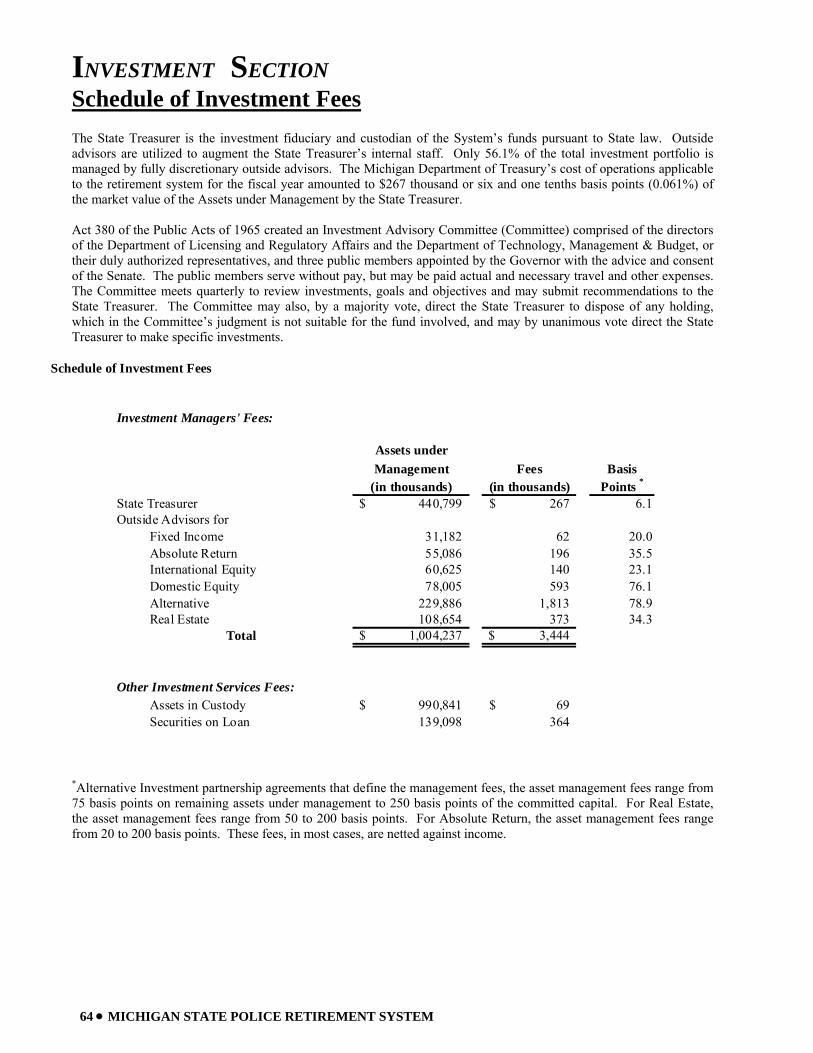
INVESTMENT SECTION
64 • MICHIGAN STATE POLICE RETIREMENT SYSTEM
Schedule of Investment Fees The State Treasurer is the investment fiduciary and custodian of the System’s funds pursuant to State law. Outside advisors are utilized to augment the State Treasurer’s internal staff. Only 56.1% of the total investment portfolio is managed by fully discretionary outside advisors. The Michigan Department of Treasury’s cost of operations applicable to the retirement system for the fiscal year amounted to $267 thousand or six and one tenths basis points (0.061%) of the market value of the Assets under Management by the State Treasurer. Act 380 of the Public Acts of 1965 created an Investment Advisory Committee (Committee) comprised of the directors of the Department of Licensing and Regulatory Affairs and the Department of Technology, Management & Budget, or their duly authorized representatives, and three public members appointed by the Governor with the advice and consent of the Senate. The public members serve without pay, but may be paid actual and necessary travel and other expenses. The Committee meets quarterly to review investments, goals and objectives and may submit recommendations to the State Treasurer. The Committee may also, by a majority vote, direct the State Treasurer to dispose of any holding, which in the Committee’s judgment is not suitable for the fund involved, and may by unanimous vote direct the State Treasurer to make specific investments.
*Alternative Investment partnership agreements that define the management fees, the asset management fees range from 75 basis points on remaining assets under management to 250 basis points of the committed capital. For Real Estate, the asset management fees range from 50 to 200 basis points. For Absolute Return, the asset management fees range from 20 to 200 basis points. These fees, in most cases, are netted against income.
Schedule of Investment Fees
Investment Managers' Fees:
Assets underManagement Fees Basis
(in thousands) (in thousands) Points *
State Treasurer 440,799$ 267$ 6.1Outside Advisors for
Fixed Income 31,182 62 20.0Absolute Return 55,086 196 35.5International Equity 60,625 140 23.1Domestic Equity 78,005 593 76.1Alternative 229,886 1,813 78.9Real Estate 108,654 373 34.3
Total 1,004,237$ 3,444$
Other Investment Services Fees:Assets in Custody 990,841$ 69$ Securities on Loan 139,098 364
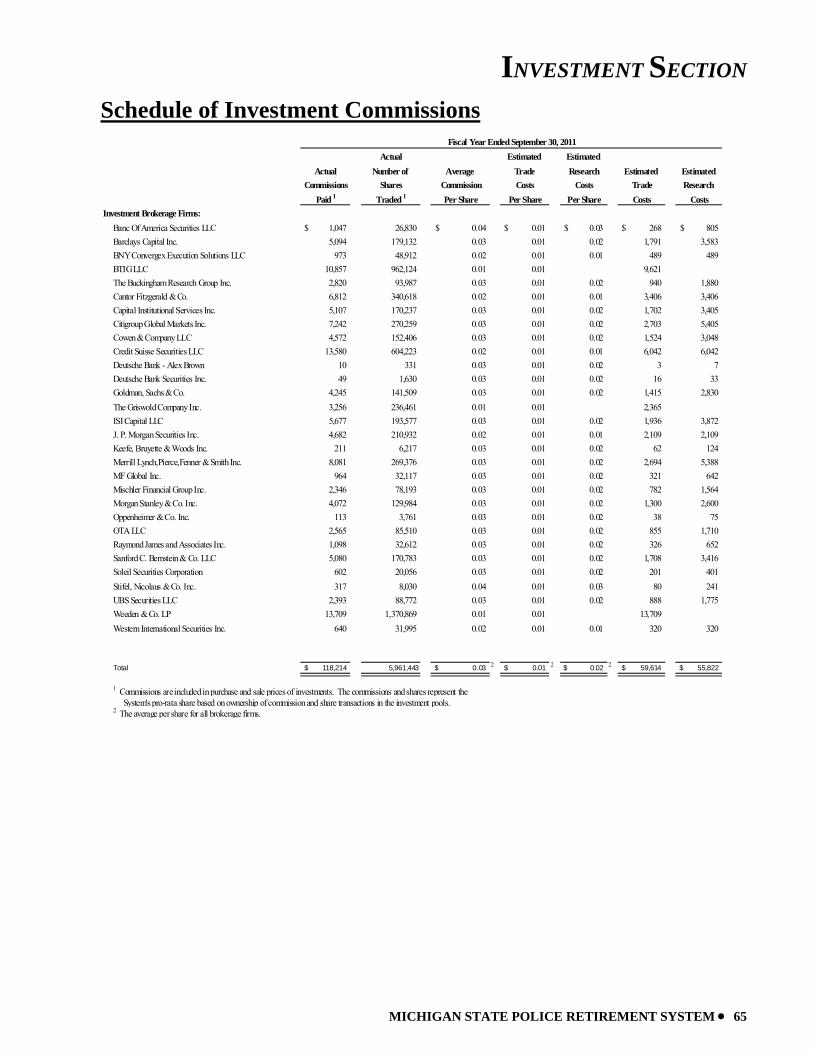
INVESTMENT SECTION
MICHIGAN STATE POLICE RETIREMENT SYSTEM • 65
Schedule of Investment Commissions
Actual Estimated Estimated Actual Number of Average Trade Research Estimated Estimated
Commissions Shares Commission Costs Costs Trade Research Paid 1 Traded 1 Per Share Per Share Per Share Costs Costs
Investment Brokerage Firms:Banc Of America Securities LLC 1,047$ 26,830 0.04$ 0.01$ 0.03$ 268$ 805$ Barclays Capital Inc. 5,094 179,132 0.03 0.01 0.02 1,791 3,583 BNY Convergex Execution Solutions LLC 973 48,912 0.02 0.01 0.01 489 489 BTIG LLC 10,857 962,124 0.01 0.01 9,621 The Buckingham Research Group Inc. 2,820 93,987 0.03 0.01 0.02 940 1,880 Cantor Fitzgerald & Co. 6,812 340,618 0.02 0.01 0.01 3,406 3,406 Capital Institutional Services Inc. 5,107 170,237 0.03 0.01 0.02 1,702 3,405 Citigroup Global Markets Inc. 7,242 270,259 0.03 0.01 0.02 2,703 5,405 Cowen & Company LLC 4,572 152,406 0.03 0.01 0.02 1,524 3,048 Credit Suisse Securities LLC 13,580 604,223 0.02 0.01 0.01 6,042 6,042 Deutsche Bank - Alex Brown 10 331 0.03 0.01 0.02 3 7 Deutsche Bank Securities Inc. 49 1,630 0.03 0.01 0.02 16 33 Goldman, Sachs & Co. 4,245 141,509 0.03 0.01 0.02 1,415 2,830 The Griswold Company Inc. 3,256 236,461 0.01 0.01 2,365 ISI Capital LLC 5,677 193,577 0.03 0.01 0.02 1,936 3,872 J. P. Morgan Securities Inc. 4,682 210,932 0.02 0.01 0.01 2,109 2,109 Keefe, Bruyette & Woods Inc. 211 6,217 0.03 0.01 0.02 62 124 Merrill Lynch,Pierce,Fenner & Smith Inc. 8,081 269,376 0.03 0.01 0.02 2,694 5,388 MF Global Inc. 964 32,117 0.03 0.01 0.02 321 642 Mischler Financial Group Inc. 2,346 78,193 0.03 0.01 0.02 782 1,564 Morgan Stanley & Co. Inc. 4,072 129,984 0.03 0.01 0.02 1,300 2,600 Oppenheimer & Co. Inc. 113 3,761 0.03 0.01 0.02 38 75 OTA LLC 2,565 85,510 0.03 0.01 0.02 855 1,710 Raymond James and Associates Inc. 1,098 32,612 0.03 0.01 0.02 326 652 Sanford C. Bernstein & Co. LLC 5,080 170,783 0.03 0.01 0.02 1,708 3,416 Soleil Securities Corporation 602 20,056 0.03 0.01 0.02 201 401 Stifel, Nicolaus & Co. Inc. 317 8,030 0.04 0.01 0.03 80 241 UBS Securities LLC 2,393 88,772 0.03 0.01 0.02 888 1,775 Weeden & Co. LP 13,709 1,370,869 0.01 0.01 13,709 Western International Securities Inc. 640 31,995 0.02 0.01 0.01 320 320
Total 118,214$ 5,961,443 0.03$ 2 0.01$ 2 0.02$ 2 59,614$ 55,822$
1 Commissions are included in purchase and sale prices of investments. The commissions and shares represent the System's pro-rata share based on ownership of commission and share transactions in the investment pools.2 The average per share for all brokerage firms.
Fiscal Year Ended September 30, 2011
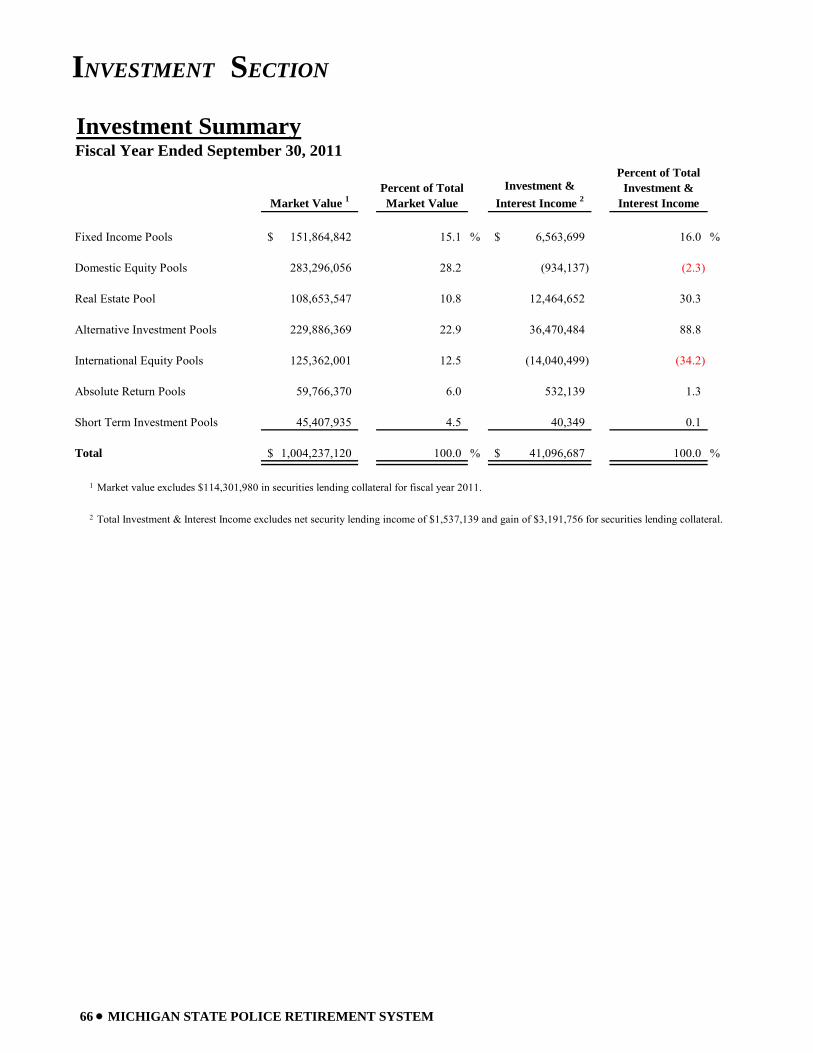
INVESTMENT SECTION
66 • MICHIGAN STATE POLICE RETIREMENT SYSTEM
Investment SummaryFiscal Year Ended September 30, 2011
Market Value 1Percent of Total Market Value
Investment & Interest Income 2
Percent of Total Investment &
Interest Income
Fixed Income Pools 151,864,842$ 15.1 % 6,563,699$ 16.0 %
Domestic Equity Pools 283,296,056 28.2 (934,137) (2.3)
Real Estate Pool 108,653,547 10.8 12,464,652 30.3
Alternative Investment Pools 229,886,369 22.9 36,470,484 88.8
International Equity Pools 125,362,001 12.5 (14,040,499) (34.2)
Absolute Return Pools 59,766,370 6.0 532,139 1.3
Short Term Investment Pools 45,407,935 4.5 40,349 0.1
Total 1,004,237,120$ 100.0 % 41,096,687$ 100.0 %
1
2
Market value excludes $114,301,980 in securities lending collateral for fiscal year 2011.
Total Investment & Interest Income excludes net security lending income of $1,537,139 and gain of $3,191,756 for securities lending collateral.
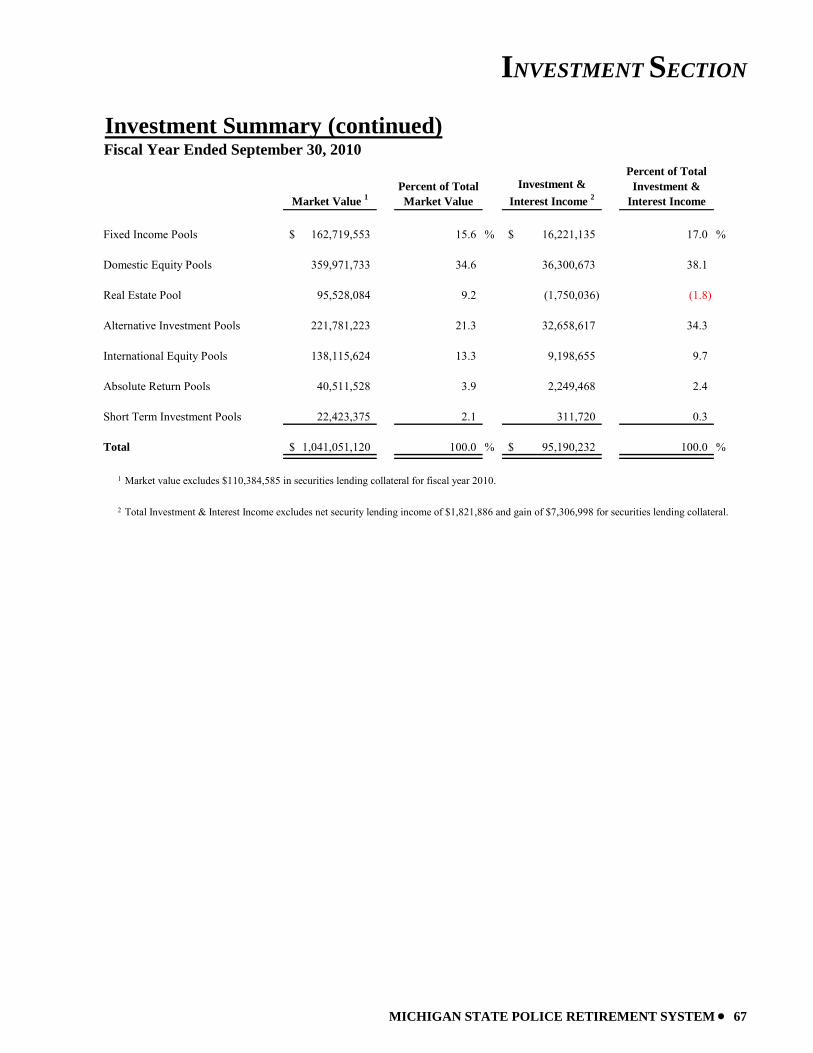
INVESTMENT SECTION
MICHIGAN STATE POLICE RETIREMENT SYSTEM • 67
Investment Summary (continued)Fiscal Year Ended September 30, 2010
Market Value 1Percent of Total Market Value
Investment & Interest Income 2
Percent of Total Investment &
Interest Income
Fixed Income Pools 162,719,553$ 15.6 % 16,221,135$ 17.0 %
Domestic Equity Pools 359,971,733 34.6 36,300,673 38.1
Real Estate Pool 95,528,084 9.2 (1,750,036) (1.8)
Alternative Investment Pools 221,781,223 21.3 32,658,617 34.3
International Equity Pools 138,115,624 13.3 9,198,655 9.7
Absolute Return Pools 40,511,528 3.9 2,249,468 2.4
Short Term Investment Pools 22,423,375 2.1 311,720 0.3
Total 1,041,051,120$ 100.0 % 95,190,232$ 100.0 %
1
2
Market value excludes $110,384,585 in securities lending collateral for fiscal year 2010.
Total Investment & Interest Income excludes net security lending income of $1,821,886 and gain of $7,306,998 for securities lending collateral.

68 • MICHIGAN STATE POLICE RETIREMENT SYSTEM
This page intentionally left blank.
MICHIGAN STATE POLICE RETIREMENT SYSTEM • 69
ACTUARIAL SECTION
Actuary’s Certification Summary of Actuarial Assumptions and Methods
Schedule of Active Member Valuation Data Schedule of Changes in the Retirement Rolls
Prioritized Solvency Test Analysis of System Experience
Summary of Plan Provisions
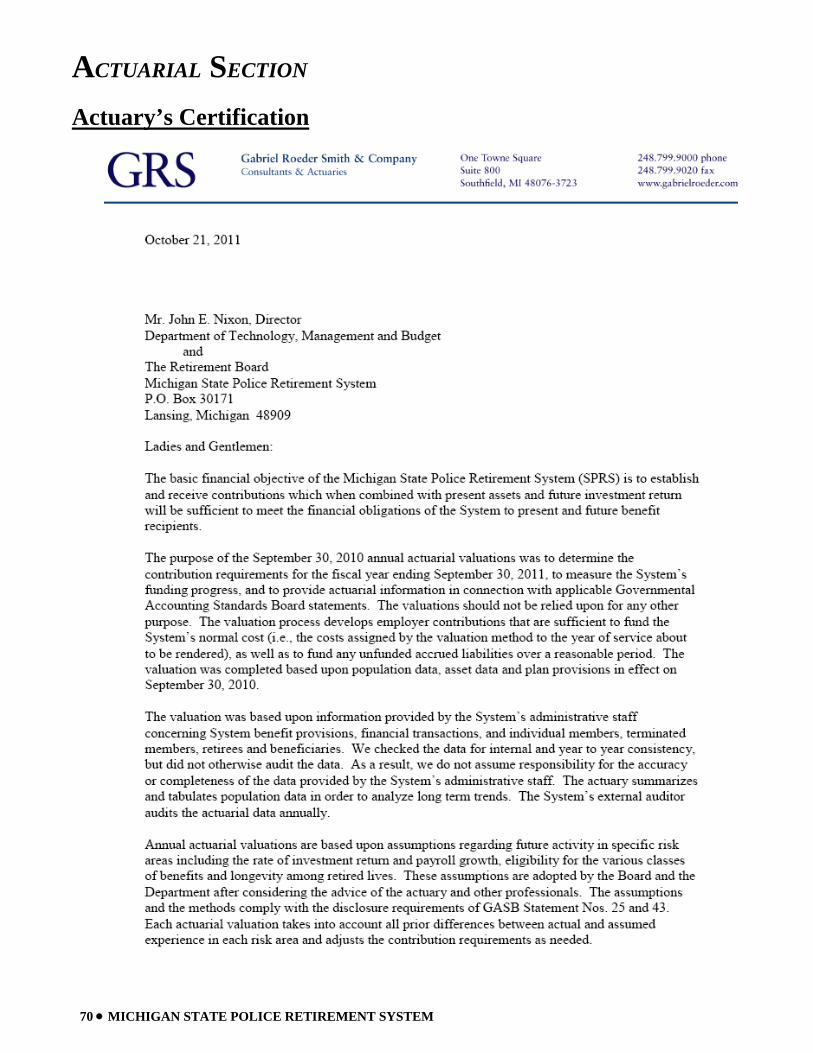
ACTUARIAL SECTION
70 • MICHIGAN STATE POLICE RETIREMENT SYSTEM
Actuary’s Certification
ACTUARIAL SECTION
MICHIGAN STATE POLICE RETIREMENT SYSTEM • 71
Actuary’s Certification (continued)
ACTUARIAL SECTION
72 • MICHIGAN STATE POLICE RETIREMENT SYSTEM
Actuary’s Certification (continued)
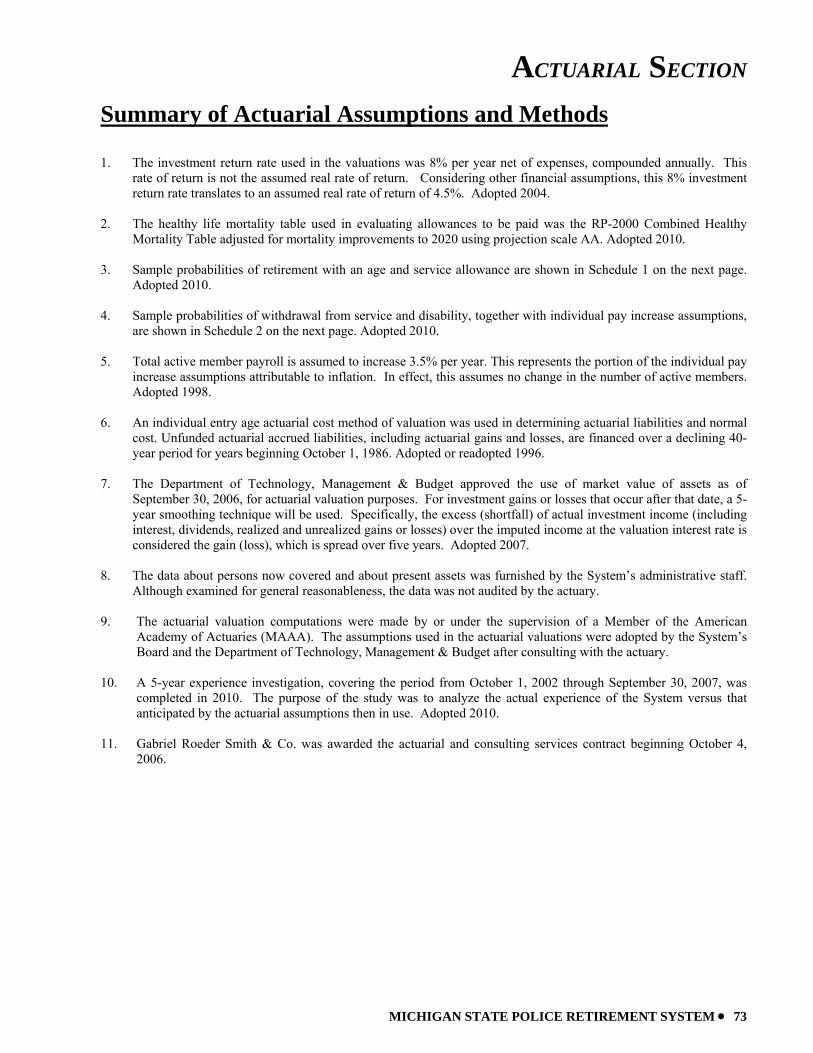
ACTUARIAL SECTION
MICHIGAN STATE POLICE RETIREMENT SYSTEM • 73
Summary of Actuarial Assumptions and Methods 1. The investment return rate used in the valuations was 8% per year net of expenses, compounded annually. This
rate of return is not the assumed real rate of return. Considering other financial assumptions, this 8% investment return rate translates to an assumed real rate of return of 4.5%. Adopted 2004.
2. The healthy life mortality table used in evaluating allowances to be paid was the RP-2000 Combined Healthy
Mortality Table adjusted for mortality improvements to 2020 using projection scale AA. Adopted 2010. 3. Sample probabilities of retirement with an age and service allowance are shown in Schedule 1 on the next page.
Adopted 2010. 4. Sample probabilities of withdrawal from service and disability, together with individual pay increase assumptions,
are shown in Schedule 2 on the next page. Adopted 2010. 5. Total active member payroll is assumed to increase 3.5% per year. This represents the portion of the individual pay
increase assumptions attributable to inflation. In effect, this assumes no change in the number of active members. Adopted 1998.
6. An individual entry age actuarial cost method of valuation was used in determining actuarial liabilities and normal
cost. Unfunded actuarial accrued liabilities, including actuarial gains and losses, are financed over a declining 40-year period for years beginning October 1, 1986. Adopted or readopted 1996.
7. The Department of Technology, Management & Budget approved the use of market value of assets as of
September 30, 2006, for actuarial valuation purposes. For investment gains or losses that occur after that date, a 5-year smoothing technique will be used. Specifically, the excess (shortfall) of actual investment income (including interest, dividends, realized and unrealized gains or losses) over the imputed income at the valuation interest rate is considered the gain (loss), which is spread over five years. Adopted 2007.
8. The data about persons now covered and about present assets was furnished by the System’s administrative staff.
Although examined for general reasonableness, the data was not audited by the actuary. 9. The actuarial valuation computations were made by or under the supervision of a Member of the American
Academy of Actuaries (MAAA). The assumptions used in the actuarial valuations were adopted by the System’s Board and the Department of Technology, Management & Budget after consulting with the actuary.
10. A 5-year experience investigation, covering the period from October 1, 2002 through September 30, 2007, was
completed in 2010. The purpose of the study was to analyze the actual experience of the System versus that anticipated by the actuarial assumptions then in use. Adopted 2010.
11. Gabriel Roeder Smith & Co. was awarded the actuarial and consulting services contract beginning October 4,
2006.
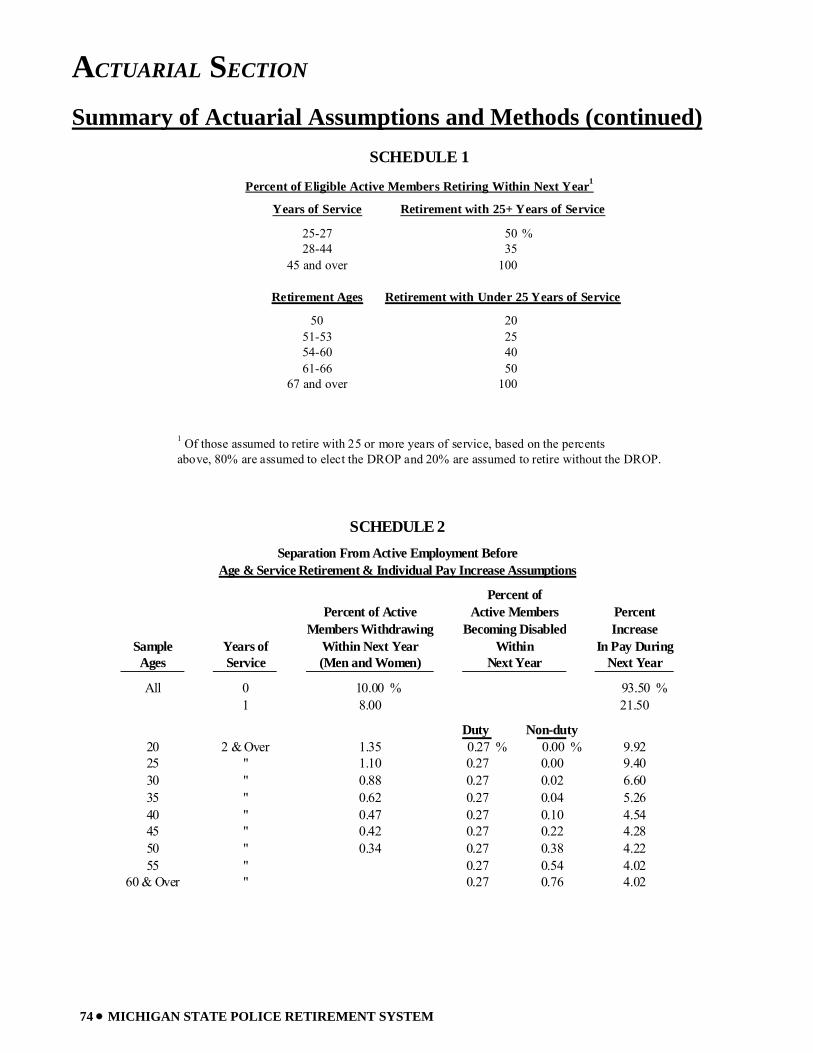
ACTUARIAL SECTION
74 • MICHIGAN STATE POLICE RETIREMENT SYSTEM
Summary of Actuarial Assumptions and Methods (continued)
Years of Service Retirement with 25+ Years of Service
25-27 50 %28-44 35
45 and over 100
Retirement Ages Retirement with Under 25 Years of Service
50 2051-53 2554-60 4061-66 50
67 and over 100
1 Of those assumed to retire with 25 or more years of service, based on the percentsabove, 80% are assumed to elect the DROP and 20% are assumed to retire without the DROP.
Percent of Eligible Active Members Retiring Within Next Year1
SCHEDULE 1
Percent of Active PercentMembers Withdrawing Increase
Sample Years of Within Next Year In Pay DuringAges Service (Men and Women) Next Year
All 0 10.00 % 93.50 %1 8.00 21.50
Duty Non-duty20 2 & Over 1.35 0.27 % 0.00 % 9.9225 " 1.10 0.27 0.00 9.4030 " 0.88 0.27 0.02 6.6035 " 0.62 0.27 0.04 5.2640 " 0.47 0.27 0.10 4.5445 " 0.42 0.27 0.22 4.2850 " 0.34 0.27 0.38 4.2255 " 0.27 0.54 4.02
60 & Over " 0.27 0.76 4.02
Active MembersBecoming Disabled
WithinNext Year
SCHEDULE 2Separation From Active Employment Before
Age & Service Retirement & Individual Pay Increase Assumptions
Percent of
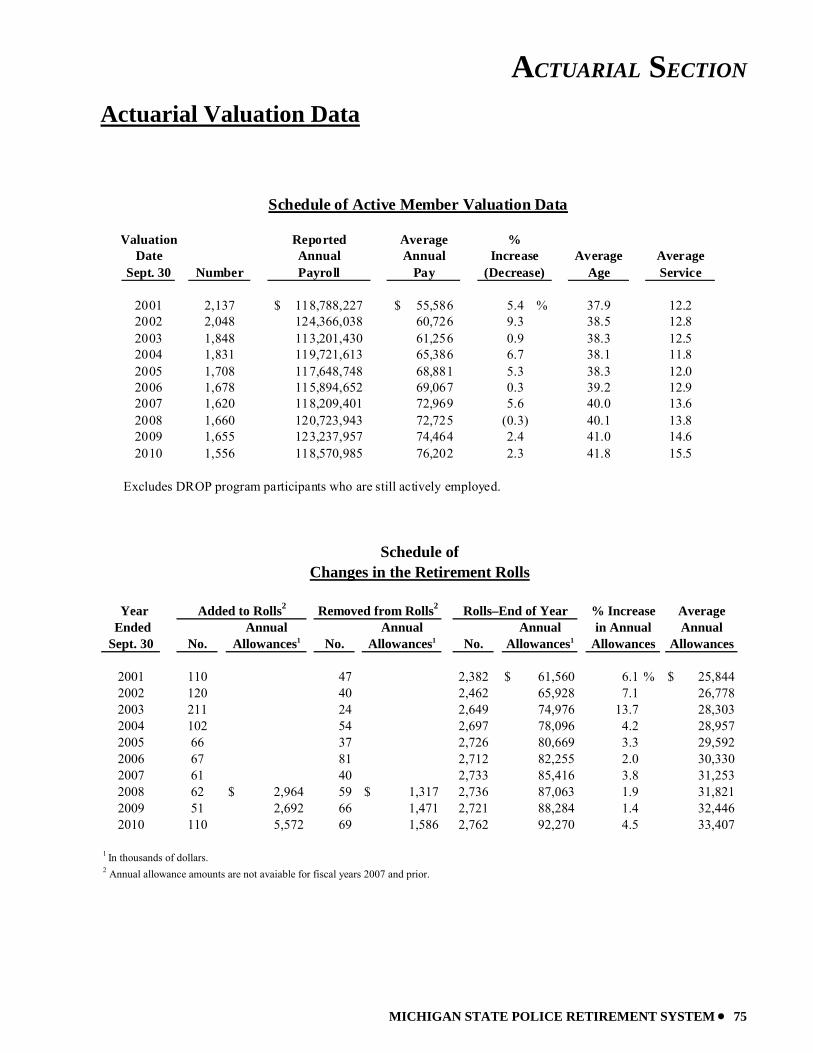
ACTUARIAL SECTION
MICHIGAN STATE POLICE RETIREMENT SYSTEM • 75
Actuarial Valuation Data
Year EndedSept. 30 No. No. No.
2001 110 47 2,382 $ 61,560 6.1 % $ 25,8442002 120 40 2,462 65,928 7.1 26,7782003 211 24 2,649 74,976 13.7 28,3032004 102 54 2,697 78,096 4.2 28,9572005 66 37 2,726 80,669 3.3 29,5922006 67 81 2,712 82,255 2.0 30,3302007 61 40 2,733 85,416 3.8 31,2532008 62 $ 2,964 59 $ 1,317 2,736 87,063 1.9 31,8212009 51 2,692 66 1,471 2,721 88,284 1.4 32,4462010 110 5,572 69 1,586 2,762 92,270 4.5 33,407
1 In thousands of dollars. 2 Annual allowance amounts are not avaiable for fiscal years 2007 and prior.
AllowancesAnnual
Allowances1
Added to Rolls2
AnnualRemoved from Rolls2
Allowances1
AverageAnnual
Allowances
Schedule ofChanges in the Retirement Rolls
Rolls–End of YearAnnual
Allowances1
% Increasein Annual
Valuation Reported AverageDate Annual Annual Average Average
Sept. 30 Number Payroll Pay Age Service
2001 2,137 118,788,227$ 55,586$ 5.4 % 37.9 12.22002 2,048 124,366,038 60,726 9.3 38.5 12.82003 1,848 113,201,430 61,256 0.9 38.3 12.52004 1,831 119,721,613 65,386 6.7 38.1 11.82005 1,708 117,648,748 68,881 5.3 38.3 12.02006 1,678 115,894,652 69,067 0.3 39.2 12.92007 1,620 118,209,401 72,969 5.6 40.0 13.62008 1,660 120,723,943 72,725 (0.3) 40.1 13.82009 1,655 123,237,957 74,464 2.4 41.0 14.62010 1,556 118,570,985 76,202 2.3 41.8 15.5
Excludes DROP program participants who are still actively employed.
Schedule of Active Member Valuation Data
%
(Decrease)Increase
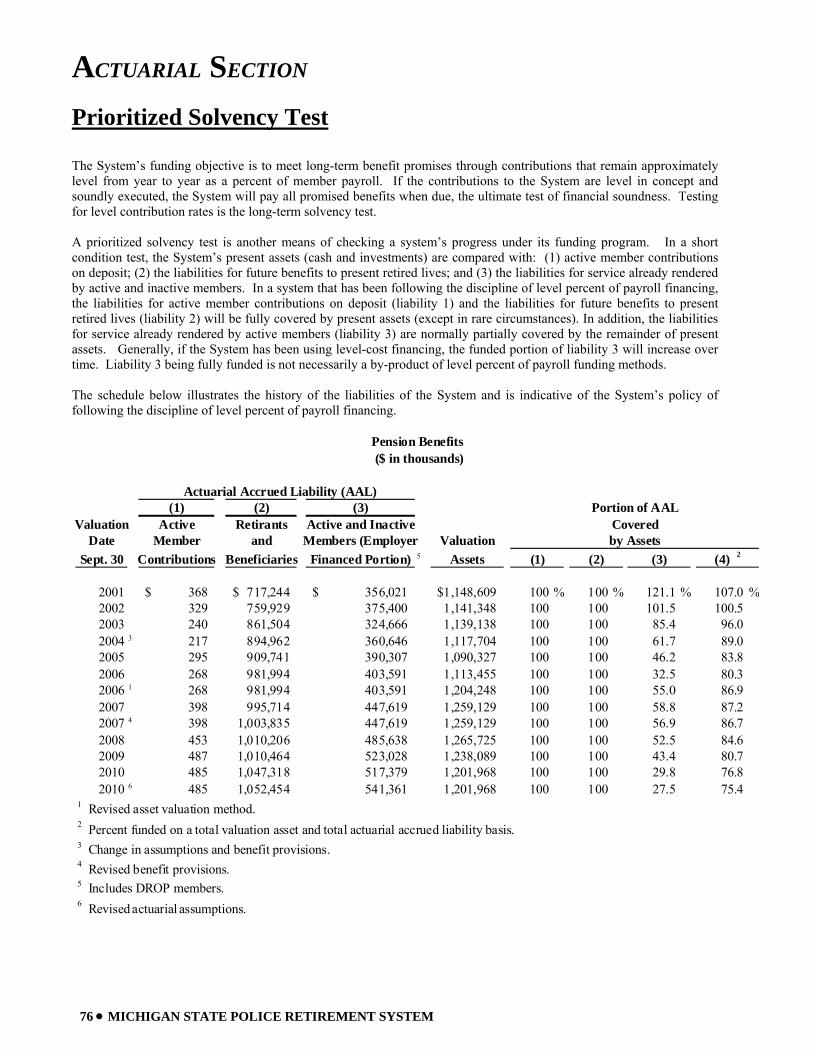
ACTUARIAL SECTION
76 • MICHIGAN STATE POLICE RETIREMENT SYSTEM
Prioritized Solvency Test The System’s funding objective is to meet long-term benefit promises through contributions that remain approximately level from year to year as a percent of member payroll. If the contributions to the System are level in concept and soundly executed, the System will pay all promised benefits when due, the ultimate test of financial soundness. Testing for level contribution rates is the long-term solvency test. A prioritized solvency test is another means of checking a system’s progress under its funding program. In a short condition test, the System’s present assets (cash and investments) are compared with: (1) active member contributions on deposit; (2) the liabilities for future benefits to present retired lives; and (3) the liabilities for service already rendered by active and inactive members. In a system that has been following the discipline of level percent of payroll financing, the liabilities for active member contributions on deposit (liability 1) and the liabilities for future benefits to present retired lives (liability 2) will be fully covered by present assets (except in rare circumstances). In addition, the liabilities for service already rendered by active members (liability 3) are normally partially covered by the remainder of present assets. Generally, if the System has been using level-cost financing, the funded portion of liability 3 will increase over time. Liability 3 being fully funded is not necessarily a by-product of level percent of payroll funding methods. The schedule below illustrates the history of the liabilities of the System and is indicative of the System’s policy of following the discipline of level percent of payroll financing.
(1) (2) (3)Valuation Active Retirants Active and Inactive
Date Member and Members (Employer ValuationSept. 30 Contributions Beneficiaries Financed Portion) 5 Assets
2001 368$ 717,244$ 356,021$ 1,148,609$ 100 % 100 % 121.1 % 107.0 %2002 329 759,929 375,400 1,141,348 100 100 101.5 100.52003 240 861,504 324,666 1,139,138 100 100 85.4 96.02004 3 217 894,962 360,646 1,117,704 100 100 61.7 89.02005 295 909,741 390,307 1,090,327 100 100 46.2 83.82006 268 981,994 403,591 1,113,455 100 100 32.5 80.32006 1 268 981,994 403,591 1,204,248 100 100 55.0 86.92007 398 995,714 447,619 1,259,129 100 100 58.8 87.22007 4 398 1,003,835 447,619 1,259,129 100 100 56.9 86.72008 453 1,010,206 485,638 1,265,725 100 100 52.5 84.62009 487 1,010,464 523,028 1,238,089 100 100 43.4 80.72010 485 1,047,318 517,379 1,201,968 100 100 29.8 76.82010 6 485 1,052,454 541,361 1,201,968 100 100 27.5 75.4
1 Revised asset valuation method.2 Percent funded on a total valuation asset and total actuarial accrued liability basis.3 Change in assumptions and benefit provisions.4 Revised benefit provisions.5 Includes DROP members.6 Revised actuarial assumptions.
Portion of AAL
(1) (2) (3) (4) 2
Pension Benefits ($ in thousands)
Actuarial Accrued Liability (AAL)
by AssetsCovered
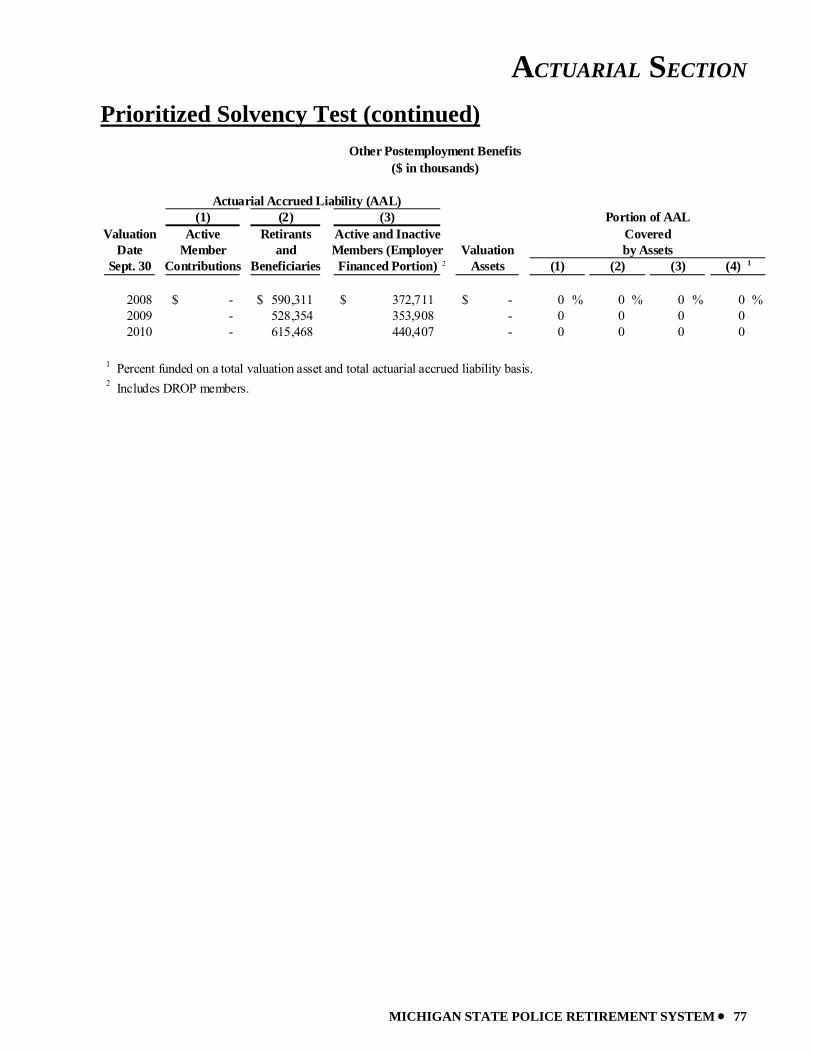
ACTUARIAL SECTION
MICHIGAN STATE POLICE RETIREMENT SYSTEM • 77
Prioritized Solvency Test (continued)
(1) (2) (3)Valuation Active Retirants Active and Inactive
Date Member and Members (Employer ValuationSept. 30 Contributions Beneficiaries Financed Portion) 2 Assets
2008 -$ 590,311$ 372,711$ -$ 0 % 0 % 0 % 0 %2009 - 528,354 353,908 - 0 0 0 02010 - 615,468 440,407 - 0 0 0 0
1 Percent funded on a total valuation asset and total actuarial accrued liability basis.2 Includes DROP members.
(1) (2) (3) (4) 1
Other Postemployment Benefits($ in thousands)
Actuarial Accrued Liability (AAL)
by AssetsCovered
Portion of AAL
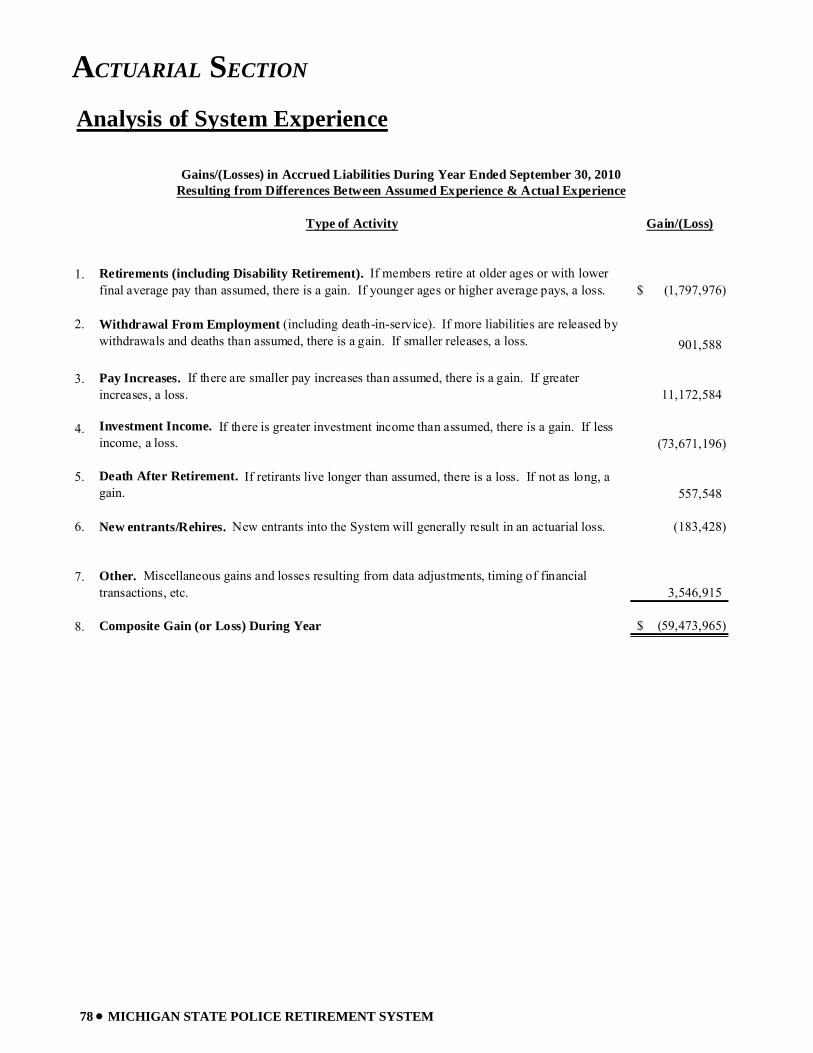
ACTUARIAL SECTION
78 • MICHIGAN STATE POLICE RETIREMENT SYSTEM
Gain/(Loss)
1. Retirements (including Disability Retirement). If members retire at older ages or with lower final average pay than assumed, there is a gain. If younger ages or higher average pays, a loss. (1,797,976)$
2. Withdrawal From Employment (including death-in-service). If more liabilities are released by withdrawals and deaths than assumed, there is a gain. If smaller releases, a loss. 901,588
3. Pay Increases. If there are smaller pay increases than assumed, there is a gain. If greater increases, a loss. 11,172,584
4. Investment Income. If there is greater investment income than assumed, there is a gain. If less income, a loss. (73,671,196)
5. Death After Retirement. If retirants live longer than assumed, there is a loss. If not as long, a gain. 557,548
6. New entrants/Rehires. New entrants into the System will generally result in an actuarial loss. (183,428)
7. Other. Miscellaneous gains and losses resulting from data adjustments, timing of financial transactions, etc. 3,546,915
8. Composite Gain (or Loss) During Year (59,473,965)$
Analysis of System Experience
Gains/(Losses) in Accrued Liabilities During Year Ended September 30, 2010Resulting from Differences Between Assumed Experience & Actual Experience
Type of Activity
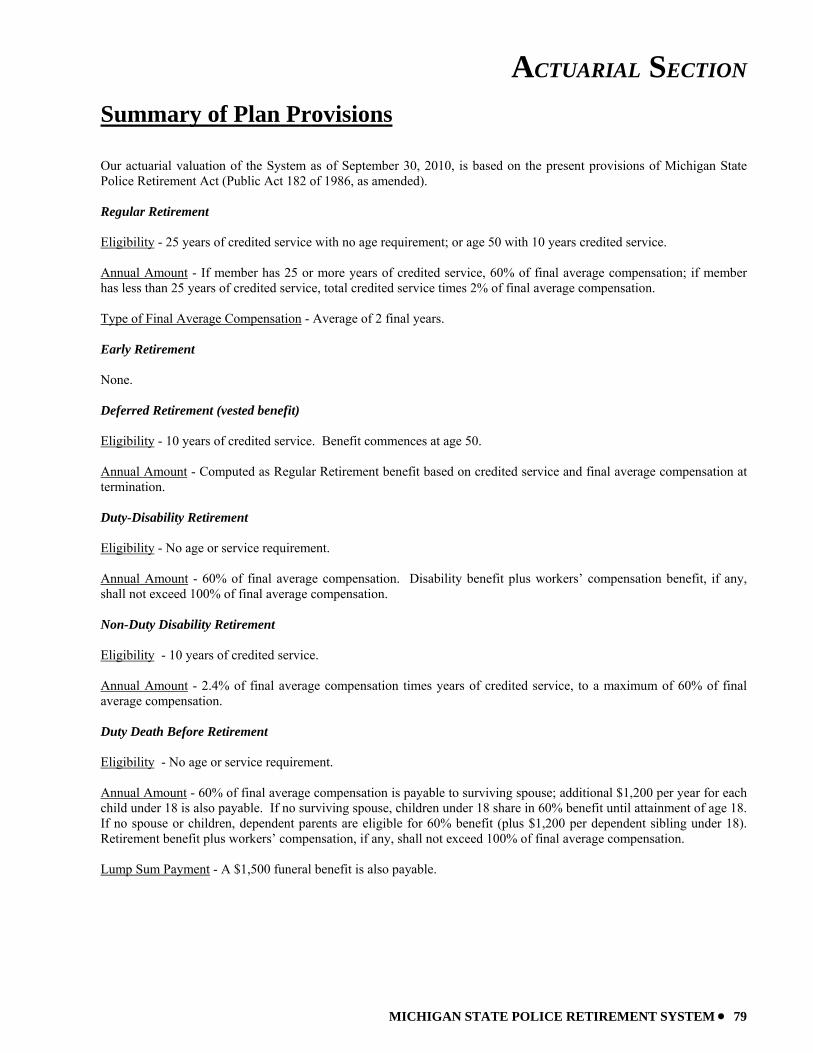
ACTUARIAL SECTION
MICHIGAN STATE POLICE RETIREMENT SYSTEM • 79
Summary of Plan Provisions Our actuarial valuation of the System as of September 30, 2010, is based on the present provisions of Michigan State Police Retirement Act (Public Act 182 of 1986, as amended). Regular Retirement Eligibility - 25 years of credited service with no age requirement; or age 50 with 10 years credited service. Annual Amount - If member has 25 or more years of credited service, 60% of final average compensation; if member has less than 25 years of credited service, total credited service times 2% of final average compensation. Type of Final Average Compensation - Average of 2 final years. Early Retirement None. Deferred Retirement (vested benefit) Eligibility - 10 years of credited service. Benefit commences at age 50. Annual Amount - Computed as Regular Retirement benefit based on credited service and final average compensation at termination. Duty-Disability Retirement Eligibility - No age or service requirement. Annual Amount - 60% of final average compensation. Disability benefit plus workers’ compensation benefit, if any, shall not exceed 100% of final average compensation. Non-Duty Disability Retirement Eligibility - 10 years of credited service. Annual Amount - 2.4% of final average compensation times years of credited service, to a maximum of 60% of final average compensation. Duty Death Before Retirement Eligibility - No age or service requirement. Annual Amount - 60% of final average compensation is payable to surviving spouse; additional $1,200 per year for each child under 18 is also payable. If no surviving spouse, children under 18 share in 60% benefit until attainment of age 18. If no spouse or children, dependent parents are eligible for 60% benefit (plus $1,200 per dependent sibling under 18). Retirement benefit plus workers’ compensation, if any, shall not exceed 100% of final average compensation. Lump Sum Payment - A $1,500 funeral benefit is also payable.
ACTUARIAL SECTION
80 • MICHIGAN STATE POLICE RETIREMENT SYSTEM
Summary of Plan Provisions (continued) Non-Duty Death Before Retirement Eligibility - 10 years of credited service. Annual Amount - 2.4% of final average compensation times years of credited service, to a maximum of 60% of final average compensation, payable to surviving spouse. If no surviving spouse, children under 18 share in benefit until attainment of age 18. Death After Retirement The retired member’s benefit continues to the surviving spouse. If no surviving spouse, children under 18 share in the continued benefit until attainment of age 18. DROP Program Provisions DROP Eligibility - Any age with 25 years of service. Maximum Years of DROP - 6 years. Retirement Benefit - Monthly benefit frozen at date of DROP election. DROP Account - Amount credited - 100% of the participant’s Retirement Benefit if stay full six years (for all 6 years); 90% if stay 5 years; 80% if stay 4 years; 70% if stay 3 years; 60% if stay 2 years; 50% if stay 1 year; 30% if stay less than 1 year. Interest Credit Rate - 3% COLA - No COLA adjustment on Retirement Benefit until the end of the DROP period. Benefit Options - At termination of DROP participation and commencement of retirement, options are lump sum of DROP account, partial lump sum, or maintain funds in account. Post-Retirement Cost-of-Living Adjustments All members retiring (or leaving employment with vested benefits), and their survivors, are eligible for automatic 2% annual (non-compounded) benefit increases, with a maximum annual increase of $500. Post-Retirement Health Insurance Coverage Persons in receipt of retirement allowances (including members who did not retire directly from the System, but come from a vested deferred status), and their dependents, are eligible for 95% State-paid health insurance coverage and 90% State-paid dental and vision insurance. Member Contributions None.
MICHIGAN STATE POLICE RETIREMENT SYSTEM ● 81
STATISTICAL SECTION
Schedules of Additions by Source Schedules of Deductions by Type
Schedules of Changes in Net Assets Schedules of Benefits and Refunds by Type
Schedules of Retired Members by Type of Benefit Schedule of Other Postemployment Benefits
Schedules of Average Benefit Payments Ten Year History of Membership
STATISTICAL SECTION
82 • MICHIGAN STATE POLICE RETIREMENT SYSTEM
This part of the System’s comprehensive annual financial report presents detailed information as a context for understanding what the information in the financial statements, note disclosures, and required supplementary information says about the System’s overall financial health.
Contents
Financial Trends These schedules contain trend information to help the reader understand how the System’s financial performance and fiscal health has changed over time. The schedules are presented for the last ten fiscal years. Schedules included are:
• Schedule of Pension Plan Additions by Source • Schedule of OPEB Plan Additions by Source • Schedule of Pension Plan Deductions by Type • Schedule of OPEB Plan Deductions by Type • Schedule of Changes in Net Assets - Pension Plan • Schedule of Changes in Net Assets - OPEB Plan • Schedule of Pension Benefits and Refunds by Type • Schedule of OPEB Benefits and Refunds by Type
Operating Information These schedules contain contextual information to assist the reader’s understanding of how the System’s financial information relates to the combination of participating members and the benefits it provides. Schedules are presented for the last ten fiscal years, except where noted. Schedules included are:
• Schedule of Retired Members by Type of Pension Benefit • Schedule of Retired Members by Type of Other Postemployment Benefits • Schedule of Other Postemployment Benefits • Schedule of Average Benefit Payments - Pension • Schedule of Average Benefit Payments - Health • Schedule of Average Benefit Payments - Dental • Schedule of Average Benefit Payments - Vision • Ten Year History of Membership
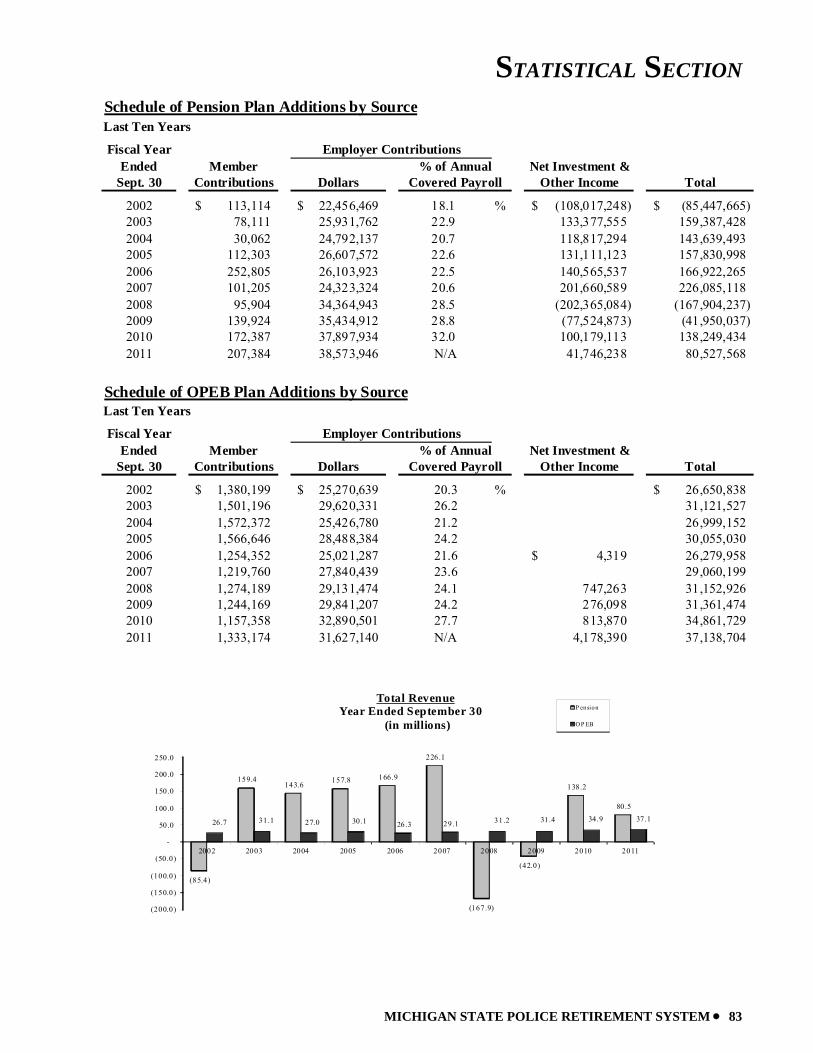
STATISTICAL SECTION
MICHIGAN STATE POLICE RETIREMENT SYSTEM • 83
Last Ten Years
Fiscal YearEnded Member Net Investment &
Sept. 30 Contributions Dollars Other Income Total
2002 113,114$ 22,456,469$ 18.1 % (108,017,248)$ (85,447,665)$ 2003 78,111 25,931,762 22.9 133,377,555 159,387,428 2004 30,062 24,792,137 20.7 118,817,294 143,639,493 2005 112,303 26,607,572 22.6 131,111,123 157,830,998 2006 252,805 26,103,923 22.5 140,565,537 166,922,265 2007 101,205 24,323,324 20.6 201,660,589 226,085,118 2008 95,904 34,364,943 28.5 (202,365,084) (167,904,237) 2009 139,924 35,434,912 28.8 (77,524,873) (41,950,037) 2010 172,387 37,897,934 32.0 100,179,113 138,249,434 2011 207,384 38,573,946 N/A 41,746,238 80,527,568
Schedule of Pension Plan Additions by Source
Employer Contributions% of Annual
Covered Payroll
Last Ten Years
Fiscal YearEnded Member Net Investment &
Sept. 30 Contributions Dollars Other Income Total
2002 1,380,199$ 25,270,639$ 20.3 % 26,650,838$ 2003 1,501,196 29,620,331 26.2 31,121,527 2004 1,572,372 25,426,780 21.2 26,999,152 2005 1,566,646 28,488,384 24.2 30,055,030 2006 1,254,352 25,021,287 21.6 4,319$ 26,279,958 2007 1,219,760 27,840,439 23.6 29,060,199 2008 1,274,189 29,131,474 24.1 747,263 31,152,926 2009 1,244,169 29,841,207 24.2 276,098 31,361,474 2010 1,157,358 32,890,501 27.7 813,870 34,861,729 2011 1,333,174 31,627,140 N/A 4,178,390 37,138,704
Schedule of OPEB Plan Additions by Source
Employer Contributions% of Annual
Covered Payroll
(85.4)
159.4 143.6 157.8 166.9
226.1
(167.9)
(42.0)
138.2
80.5
26.7 31.1 27.0 30.1 26.3 29.1 31.2 31.4 34.9 37.1
(200.0)
(150.0)
(100.0)
(50.0)
-
50.0
100.0
150.0
200.0
250.0
2002 2003 2004 2005 2006 2007 2008 2009 2010 2011
Total RevenueYear Ended September 30
(in millions)
P ension
O P EB
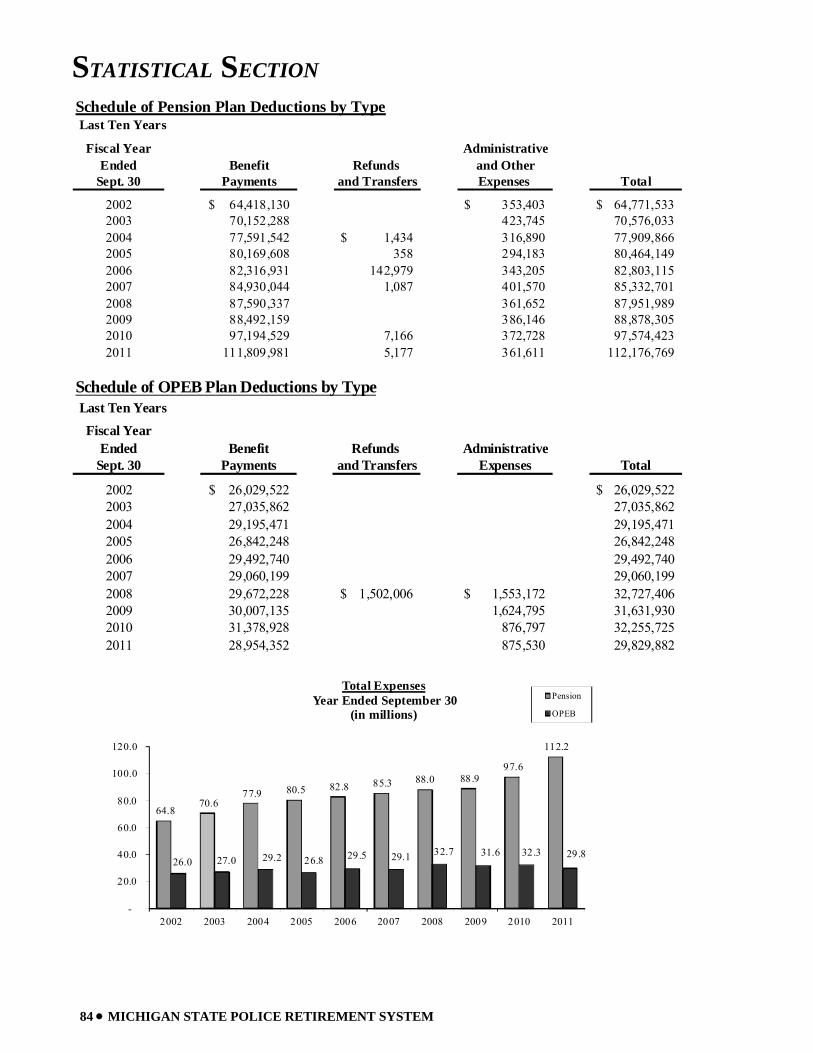
STATISTICAL SECTION
84 • MICHIGAN STATE POLICE RETIREMENT SYSTEM
Schedule of OPEB Plan Deductions by TypeLast Ten Years
Fiscal YearEnded Benefit Refunds Administrative
Sept. 30 Payments and Transfers Expenses Total
2002 26,029,522$ 26,029,522$ 2003 27,035,862 27,035,862 2004 29,195,471 29,195,471 2005 26,842,248 26,842,248 2006 29,492,740 29,492,740 2007 29,060,199 29,060,199 2008 29,672,228 1,502,006$ 1,553,172$ 32,727,406 2009 30,007,135 1,624,795 31,631,930 2010 31,378,928 876,797 32,255,725 2011 28,954,352 875,530 29,829,882
64.8 70.6
77.9 80.5 82.8 85.3 88.0 88.9 97.6
112.2
26.0 27.0 29.2 26.8 29.5 29.1 32.7 31.6 32.3 29.8
-
20.0
40.0
60.0
80.0
100.0
120.0
2002 2003 2004 2005 2006 2007 2008 2009 2010 2011
Total ExpensesYear Ended September 30
(in millions)Pension
OPEB
Schedule of Pension Plan Deductions by TypeLast Ten Years
Fiscal Year AdministrativeEnded Benefit Refunds and Other
Sept. 30 Payments and Transfers Expenses Total
2002 64,418,130$ 353,403$ 64,771,533$ 2003 70,152,288 423,745 70,576,033 2004 77,591,542 1,434$ 316,890 77,909,866 2005 80,169,608 358 294,183 80,464,149 2006 82,316,931 142,979 343,205 82,803,115 2007 84,930,044 1,087 401,570 85,332,701 2008 87,590,337 361,652 87,951,989 2009 88,492,159 386,146 88,878,305 2010 97,194,529 7,166 372,728 97,574,423 2011 111,809,981 5,177 361,611 112,176,769
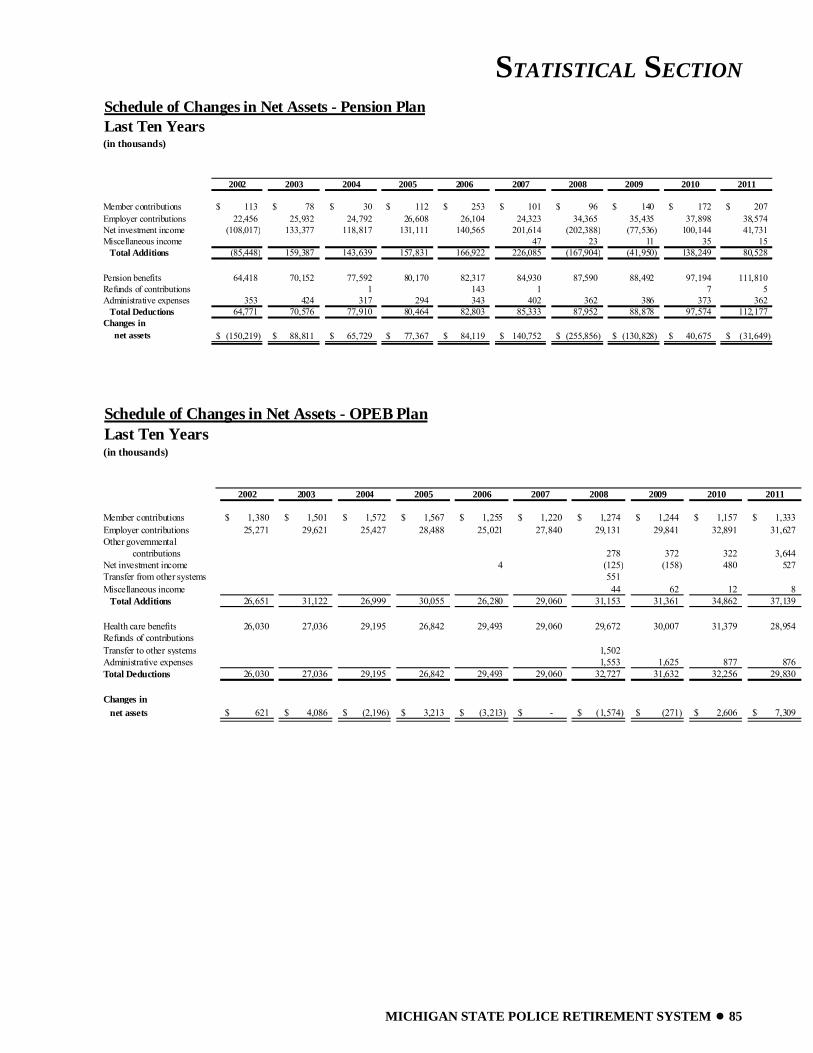
STATISTICAL SECTION
MICHIGAN STATE POLICE RETIREMENT SYSTEM ● 85
Schedule of Changes in Net Assets - Pension PlanLast Ten Years(in thousands)
2002 2003 2004 2005 2006 2007 2008 2009 2010 2011
Member contributions 113$ 78$ 30$ 112$ 253$ 101$ 96$ 140$ 172$ 207$ Employer contributions 22,456 25,932 24,792 26,608 26,104 24,323 34,365 35,435 37,898 38,574 Net investment income (108,017) 133,377 118,817 131,111 140,565 201,614 (202,388) (77,536) 100,144 41,731 Miscellaneous income 47 23 11 35 15 Total Additions (85,448) 159,387 143,639 157,831 166,922 226,085 (167,904) (41,950) 138,249 80,528
Pension benefits 64,418 70,152 77,592 80,170 82,317 84,930 87,590 88,492 97,194 111,810 1 143 1 7 5
Administrative expenses 353 424 317 294 343 402 362 386 373 362 Total Deductions 64,771 70,576 77,910 80,464 82,803 85,333 87,952 88,878 97,574 112,177
(150,219)$ 88,811$ 65,729$ 77,367$ 84,119$ 140,752$ (255,856)$ (130,828)$ 40,675$ (31,649)$
Refunds of contributions
Changes in net assets
Schedule of Changes in Net Assets - OPEB PlanLast Ten Years(in thousands)
2002 2003 2004 2005 2006 2007 2008 2009 2010 2011
Member contributions 1,380$ 1,501$ 1,572$ 1,567$ 1,255$ 1,220$ 1,274$ 1,244$ 1,157$ 1,333$ Employer contributions 25,271 29,621 25,427 28,488 25,021 27,840 29,131 29,841 32,891 31,627 Other governmental
contributions 278 372 322 3,644 Net investment income 4 (125) (158) 480 527 Transfer from other systems 551 Miscellaneous income 44 62 12 8 Total Additions 26,651 31,122 26,999 30,055 26,280 29,060 31,153 31,361 34,862 37,139
Health care benefits 26,030 27,036 29,195 26,842 29,493 29,060 29,672 30,007 31,379 28,954
Transfer to other systems 1,502 Administrative expenses 1,553 1,625 877 876 Total Deductions 26,030 27,036 29,195 26,842 29,493 29,060 32,727 31,632 32,256 29,830
621$ 4,086$ (2,196)$ 3,213$ (3,213)$ -$ (1,574)$ (271)$ 2,606$ 7,309$
Refunds of contributions
Changes in net assets
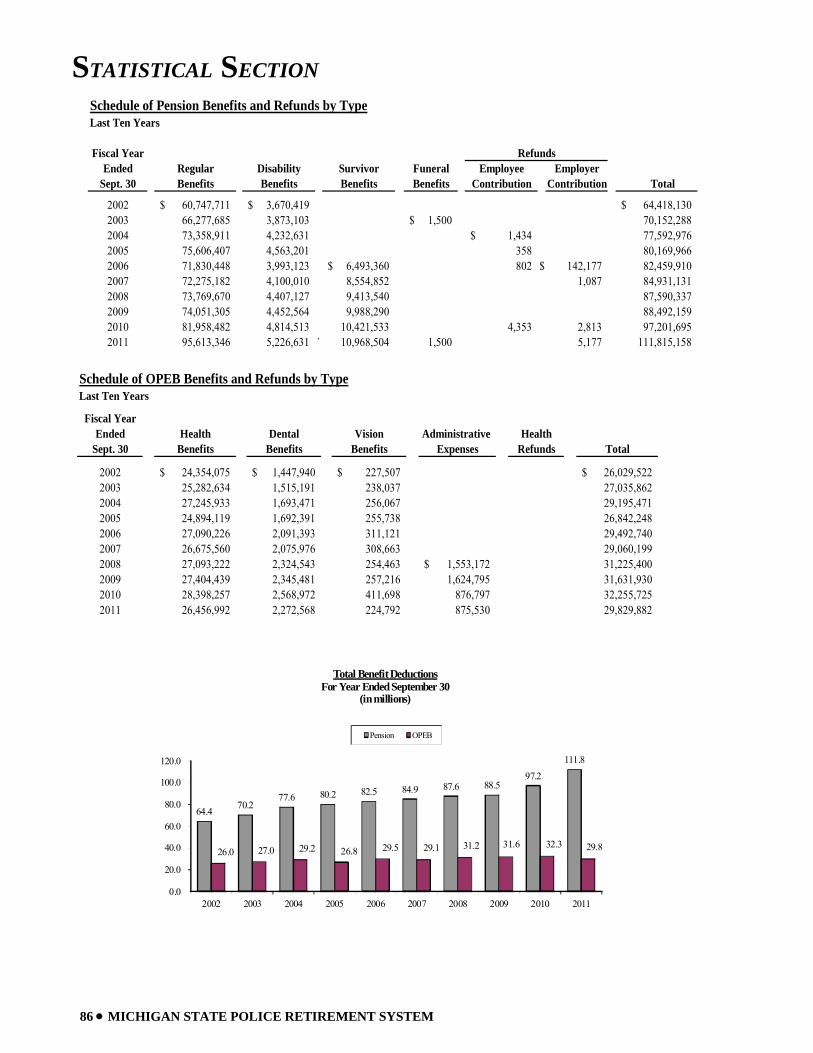
STATISTICAL SECTION
86 • MICHIGAN STATE POLICE RETIREMENT SYSTEM
Last Ten Years
Fiscal YearEnded Regular Disability Survivor Funeral Employee Employer
Sept. 30 Benefits Benefits Benefits Benefits Contribution Contribution Total
2002 60,747,711$ 3,670,419$ 64,418,130$ 2003 66,277,685 3,873,103 1,500$ 70,152,288 2004 73,358,911 4,232,631 1,434$ 77,592,976 2005 75,606,407 4,563,201 358 80,169,966 2006 71,830,448 3,993,123 6,493,360$ 802 $ 142,177 82,459,910 2007 72,275,182 4,100,010 8,554,852 1,087 84,931,131 2008 73,769,670 4,407,127 9,413,540 87,590,337 2009 74,051,305 4,452,564 9,988,290 88,492,159 2010 81,958,482 4,814,513 10,421,533 4,353 2,813 97,201,695 2011 95,613,346 5,226,631 ` 10,968,504 1,500 5,177 111,815,158
Schedule of Pension Benefits and Refunds by Type
Refunds
Schedule of OPEB Benefits and Refunds by TypeLast Ten Years
Fiscal YearEnded Health Dental Vision Administrative Health
Sept. 30 Benefits Benefits Benefits Expenses Refunds Total
2002 24,354,075$ 1,447,940$ 227,507$ 26,029,522$ 2003 25,282,634 1,515,191 238,037 27,035,862 2004 27,245,933 1,693,471 256,067 29,195,471 2005 24,894,119 1,692,391 255,738 26,842,248 2006 27,090,226 2,091,393 311,121 29,492,740 2007 26,675,560 2,075,976 308,663 29,060,199 2008 27,093,222 2,324,543 254,463 1,553,172$ 31,225,400 2009 27,404,439 2,345,481 257,216 1,624,795 31,631,930 2010 28,398,257 2,568,972 411,698 876,797 32,255,725 2011 26,456,992 2,272,568 224,792 875,530 29,829,882
64.4 70.2 77.6 80.2 82.5 84.9 87.6 88.5
97.2
111.8
26.0 27.0 29.2 26.8 29.5 29.1 31.2 31.6 32.3 29.8
0.0
20.0
40.0
60.0
80.0
100.0
120.0
2002 2003 2004 2005 2006 2007 2008 2009 2010 2011
Total Benefit DeductionsFor Year Ended September 30
(in millions)
Pension OPEB
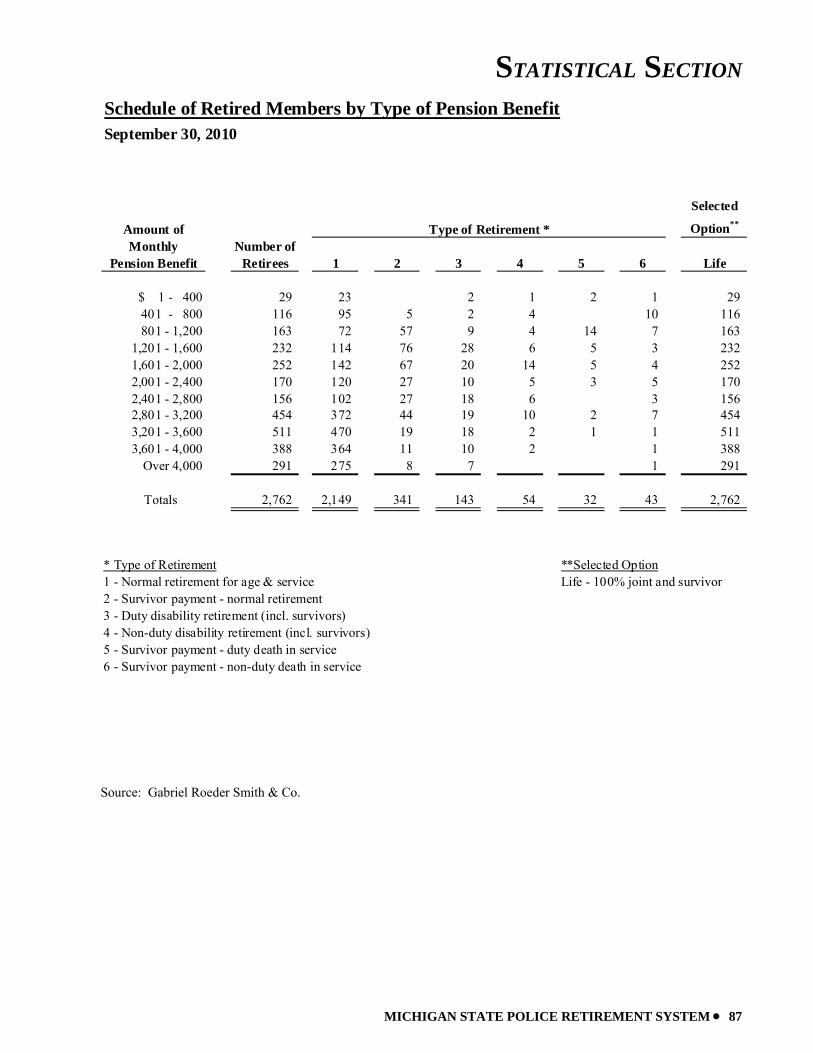
STATISTICAL SECTION
MICHIGAN STATE POLICE RETIREMENT SYSTEM • 87
Selected
Amount of Option**
Monthly Number ofPension Benefit Retirees 1 2 3 4 5 6 Life
$ 1 - 400 29 23 2 1 2 1 29 401 - 800 116 95 5 2 4 10 116
801 - 1,200 163 72 57 9 4 14 7 163 1,201 - 1,600 232 114 76 28 6 5 3 232 1,601 - 2,000 252 142 67 20 14 5 4 252 2,001 - 2,400 170 120 27 10 5 3 5 170 2,401 - 2,800 156 102 27 18 6 3 156 2,801 - 3,200 454 372 44 19 10 2 7 454 3,201 - 3,600 511 470 19 18 2 1 1 511 3,601 - 4,000 388 364 11 10 2 1 388
Over 4,000 291 275 8 7 1 291
Totals 2,762 2,149 341 143 54 32 43 2,762
* Type of Retirement **Selected Option1 - Normal retirement for age & service Life - 100% joint and survivor2 - Survivor payment - normal retirement3 - Duty disability retirement (incl. survivors)4 - Non-duty disability retirement (incl. survivors)5 - Survivor payment - duty death in service6 - Survivor payment - non-duty death in service
Type of Retirement *
September 30, 2010Schedule of Retired Members by Type of Pension Benefit
Source: Gabriel Roeder Smith & Co.
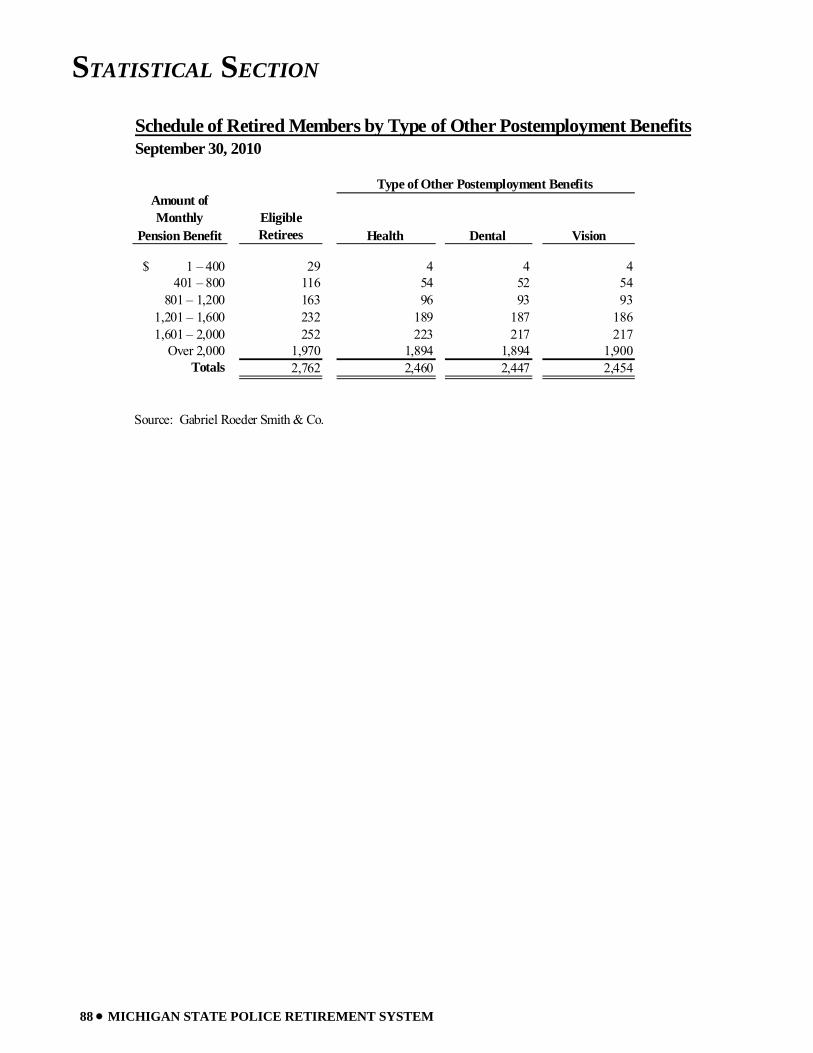
STATISTICAL SECTION
88 • MICHIGAN STATE POLICE RETIREMENT SYSTEM
Schedule of Retired Members by Type of Other Postemployment Benefits
Eligible Retirees Health Dental Vision
$ 1 – 400 29 4 4 4401 – 800 116 54 52 54
801 – 1,200 163 96 93 931,201 – 1,600 232 189 187 1861,601 – 2,000 252 223 217 217
Over 2,000 1,970 1,894 1,894 1,900Totals 2,762 2,460 2,447 2,454
Source: Gabriel Roeder Smith & Co.
Type of Other Postemployment Benefits
September 30, 2010
Amount of Monthly
Pension Benefit
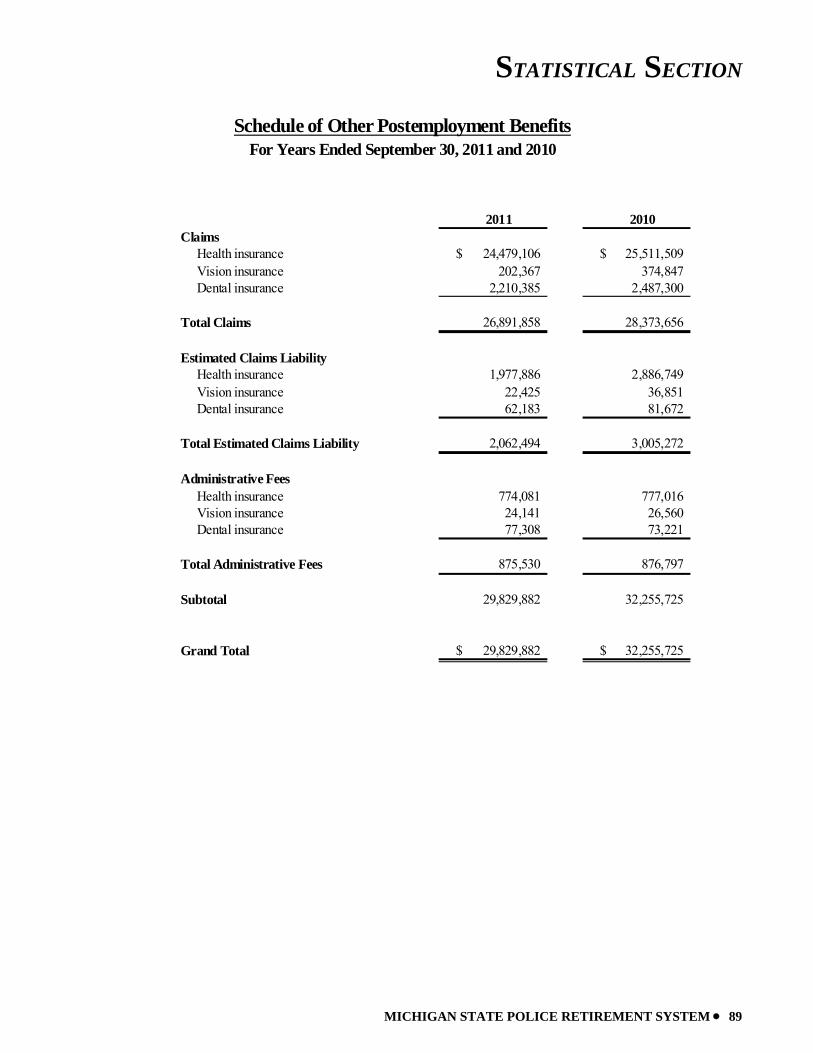
STATISTICAL SECTION
MICHIGAN STATE POLICE RETIREMENT SYSTEM • 89
2011 2010Claims Health insurance 24,479,106$ 25,511,509$ Vision insurance 202,367 374,847 Dental insurance 2,210,385 2,487,300
Total Claims 26,891,858 28,373,656
Estimated Claims Liability Health insurance 1,977,886 2,886,749 Vision insurance 22,425 36,851 Dental insurance 62,183 81,672
Total Estimated Claims Liability 2,062,494 3,005,272
Administrative Fees Health insurance 774,081 777,016 Vision insurance 24,141 26,560 Dental insurance 77,308 73,221
Total Administrative Fees 875,530 876,797
Subtotal 29,829,882 32,255,725
Grand Total 29,829,882$ 32,255,725$
Schedule of Other Postemployment BenefitsFor Years Ended September 30, 2011 and 2010
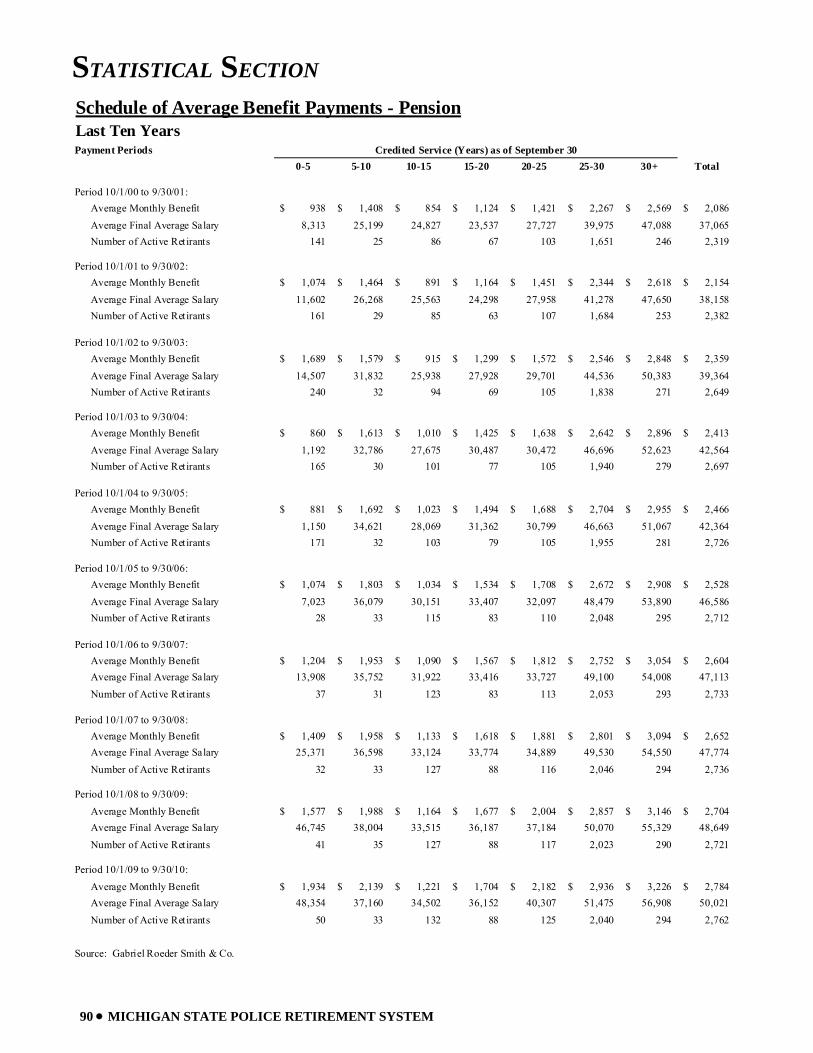
STATISTICAL SECTION
90 • MICHIGAN STATE POLICE RETIREMENT SYSTEM
Schedule of Average Benefit Payments - PensionLast Ten YearsPayment Periods
0-5 5-10 10-15 15-20 20-25 25-30 30+ Total
Period 10/1/00 to 9/30/01: Average Monthly Benefit 938$ 1,408$ 854$ 1,124$ 1,421$ 2,267$ 2,569$ 2,086$ Average Final Average Salary 8,313 25,199 24,827 23,537 27,727 39,975 47,088 37,065 Number of Active Retirants 141 25 86 67 103 1,651 246 2,319
Period 10/1/01 to 9/30/02: Average Monthly Benefit 1,074$ 1,464$ 891$ 1,164$ 1,451$ 2,344$ 2,618$ 2,154$ Average Final Average Salary 11,602 26,268 25,563 24,298 27,958 41,278 47,650 38,158 Number of Active Retirants 161 29 85 63 107 1,684 253 2,382
Period 10/1/02 to 9/30/03: Average Monthly Benefit 1,689$ 1,579$ 915$ 1,299$ 1,572$ 2,546$ 2,848$ 2,359$ Average Final Average Salary 14,507 31,832 25,938 27,928 29,701 44,536 50,383 39,364 Number of Active Retirants 240 32 94 69 105 1,838 271 2,649
Period 10/1/03 to 9/30/04: Average Monthly Benefit 860$ 1,613$ 1,010$ 1,425$ 1,638$ 2,642$ 2,896$ 2,413$ Average Final Average Salary 1,192 32,786 27,675 30,487 30,472 46,696 52,623 42,564 Number of Active Retirants 165 30 101 77 105 1,940 279 2,697
Period 10/1/04 to 9/30/05: Average Monthly Benefit 881$ 1,692$ 1,023$ 1,494$ 1,688$ 2,704$ 2,955$ 2,466$ Average Final Average Salary 1,150 34,621 28,069 31,362 30,799 46,663 51,067 42,364 Number of Active Retirants 171 32 103 79 105 1,955 281 2,726
Period 10/1/05 to 9/30/06: Average Monthly Benefit 1,074$ 1,803$ 1,034$ 1,534$ 1,708$ 2,672$ 2,908$ 2,528$ Average Final Average Salary 7,023 36,079 30,151 33,407 32,097 48,479 53,890 46,586 Number of Active Retirants 28 33 115 83 110 2,048 295 2,712
Period 10/1/06 to 9/30/07: Average Monthly Benefit 1,204$ 1,953$ 1,090$ 1,567$ 1,812$ 2,752$ 3,054$ 2,604$ Average Final Average Salary 13,908 35,752 31,922 33,416 33,727 49,100 54,008 47,113 Number of Active Retirants 37 31 123 83 113 2,053 293 2,733
Period 10/1/07 to 9/30/08: Average Monthly Benefit 1,409$ 1,958$ 1,133$ 1,618$ 1,881$ 2,801$ 3,094$ 2,652$ Average Final Average Salary 25,371 36,598 33,124 33,774 34,889 49,530 54,550 47,774 Number of Active Retirants 32 33 127 88 116 2,046 294 2,736
Period 10/1/08 to 9/30/09: Average Monthly Benefit 1,577$ 1,988$ 1,164$ 1,677$ 2,004$ 2,857$ 3,146$ 2,704$ Average Final Average Salary 46,745 38,004 33,515 36,187 37,184 50,070 55,329 48,649 Number of Active Retirants 41 35 127 88 117 2,023 290 2,721
Period 10/1/09 to 9/30/10: Average Monthly Benefit 1,934$ 2,139$ 1,221$ 1,704$ 2,182$ 2,936$ 3,226$ 2,784$ Average Final Average Salary 48,354 37,160 34,502 36,152 40,307 51,475 56,908 50,021 Number of Active Retirants 50 33 132 88 125 2,040 294 2,762
Source: Gabriel Roeder Smith & Co.
Credited Service (Years) as of September 30
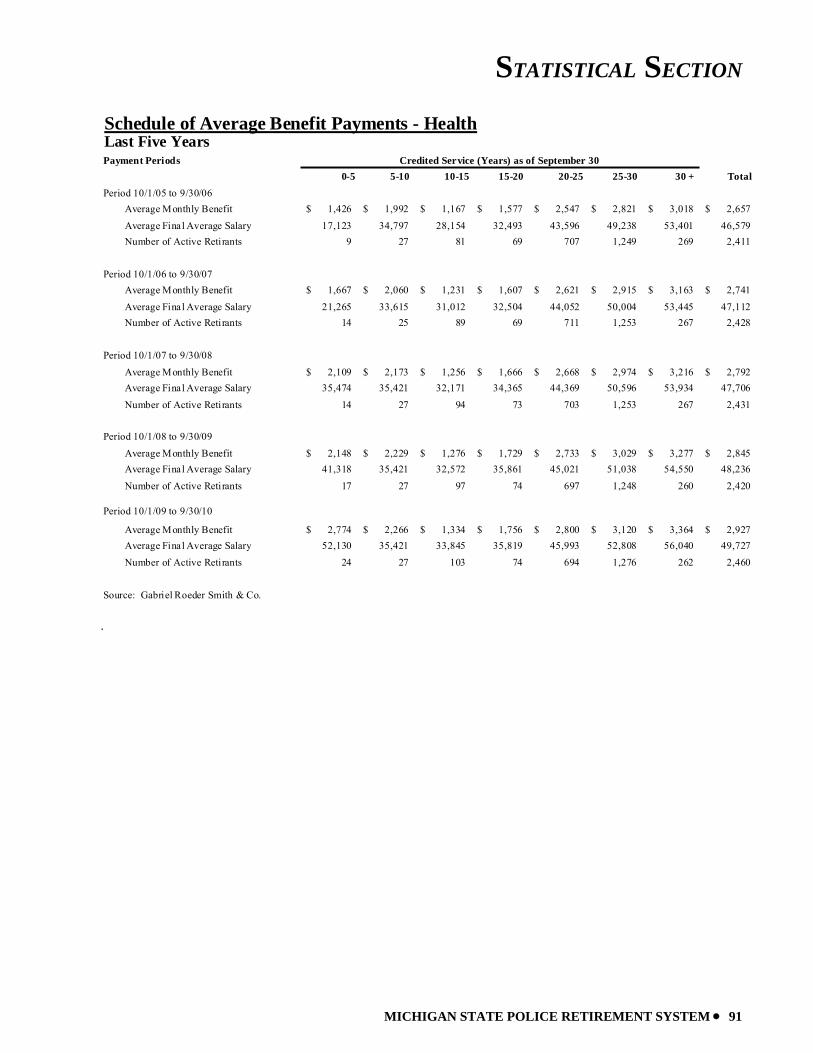
STATISTICAL SECTION
MICHIGAN STATE POLICE RETIREMENT SYSTEM • 91
Schedule of Average Benefit Payments - HealthLast Five Years
0-5 5-10 10-15 15-20 20-25 25-30 30 + Total Period 10/1/05 to 9/30/06 Average Monthly Benefit 1,426$ 1,992$ 1,167$ 1,577$ 2,547$ 2,821$ 3,018$ 2,657$
Average Final Average Salary 17,123 34,797 28,154 32,493 43,596 49,238 53,401 46,579 Number of Active Retirants 9 27 81 69 707 1,249 269 2,411
Period 10/1/06 to 9/30/07 Average Monthly Benefit 1,667$ 2,060$ 1,231$ 1,607$ 2,621$ 2,915$ 3,163$ 2,741$
Average Final Average Salary 21,265 33,615 31,012 32,504 44,052 50,004 53,445 47,112 Number of Active Retirants 14 25 89 69 711 1,253 267 2,428
2,109$ 2,173$ 1,256$ 1,666$ 2,668$ 2,974$ 3,216$ 2,792$ 35,474 35,421 32,171 34,365 44,369 50,596 53,934 47,706
14 27 94 73 703 1,253 267 2,431
2,148$ 2,229$ 1,276$ 1,729$ 2,733$ 3,029$ 3,277$ 2,845$ 41,318 35,421 32,572 35,861 45,021 51,038 54,550 48,236
17 27 97 74 697 1,248 260 2,420
Period 10/1/09 to 9/30/10
Average Monthly Benefit 2,774$ 2,266$ 1,334$ 1,756$ 2,800$ 3,120$ 3,364$ 2,927$ Average Final Average Salary 52,130 35,421 33,845 35,819 45,993 52,808 56,040 49,727 Number of Active Retirants 24 27 103 74 694 1,276 262 2,460
Number of Active Retirants
Source: Gabriel Roeder Smith & Co.
Payment Periods Credited Service (Years) as of September 30
Period 10/1/08 to 9/30/09
Average Monthly Benefit Average Final Average Salary
Number of Active Retirants
Period 10/1/07 to 9/30/08
Average Monthly Benefit Average Final Average Salary
.
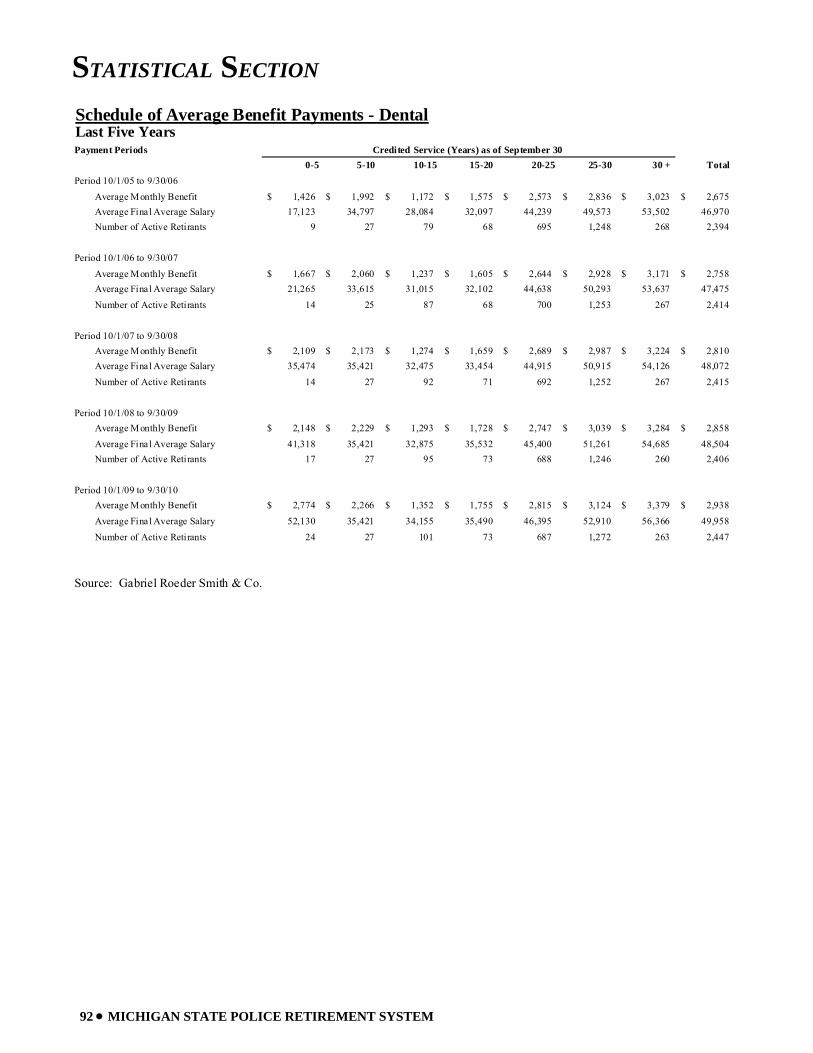
STATISTICAL SECTION
92 • MICHIGAN STATE POLICE RETIREMENT SYSTEM
Schedule of Average Benefit Payments - DentalLast Five Years
0-5 5-10 10-15 15-20 20-25 25-30 30 + Total Period 10/1/05 to 9/30/06 Average Monthly Benefit 1,426$ 1,992$ 1,172$ 1,575$ 2,573$ 2,836$ 3,023$ 2,675$ Average Final Average Salary 17,123 34,797 28,084 32,097 44,239 49,573 53,502 46,970 Number of Active Retirants 9 27 79 68 695 1,248 268 2,394
Period 10/1/06 to 9/30/07 Average Monthly Benefit 1,667$ 2,060$ 1,237$ 1,605$ 2,644$ 2,928$ 3,171$ 2,758$ Average Final Average Salary 21,265 33,615 31,015 32,102 44,638 50,293 53,637 47,475 Number of Active Retirants 14 25 87 68 700 1,253 267 2,414
2,109$ 2,173$ 1,274$ 1,659$ 2,689$ 2,987$ 3,224$ 2,810$ 35,474 35,421 32,475 33,454 44,915 50,915 54,126 48,072
14 27 92 71 692 1,252 267 2,415
2,148$ 2,229$ 1,293$ 1,728$ 2,747$ 3,039$ 3,284$ 2,858$ 41,318 35,421 32,875 35,532 45,400 51,261 54,685 48,504
17 27 95 73 688 1,246 260 2,406
Period 10/1/09 to 9/30/10 Average Monthly Benefit 2,774$ 2,266$ 1,352$ 1,755$ 2,815$ 3,124$ 3,379$ 2,938$ Average Final Average Salary 52,130 35,421 34,155 35,490 46,395 52,910 56,366 49,958 Number of Active Retirants 24 27 101 73 687 1,272 263 2,447
Source: Gabriel Roeder Smith & Co.
Average Final Average Salary Number of Active Retirants
Credited Service (Years) as of September 30
Period 10/1/08 to 9/30/09 Average Monthly Benefit Average Final Average Salary
Payment Periods
Number of Active Retirants
Period 10/1/07 to 9/30/08 Average Monthly Benefit
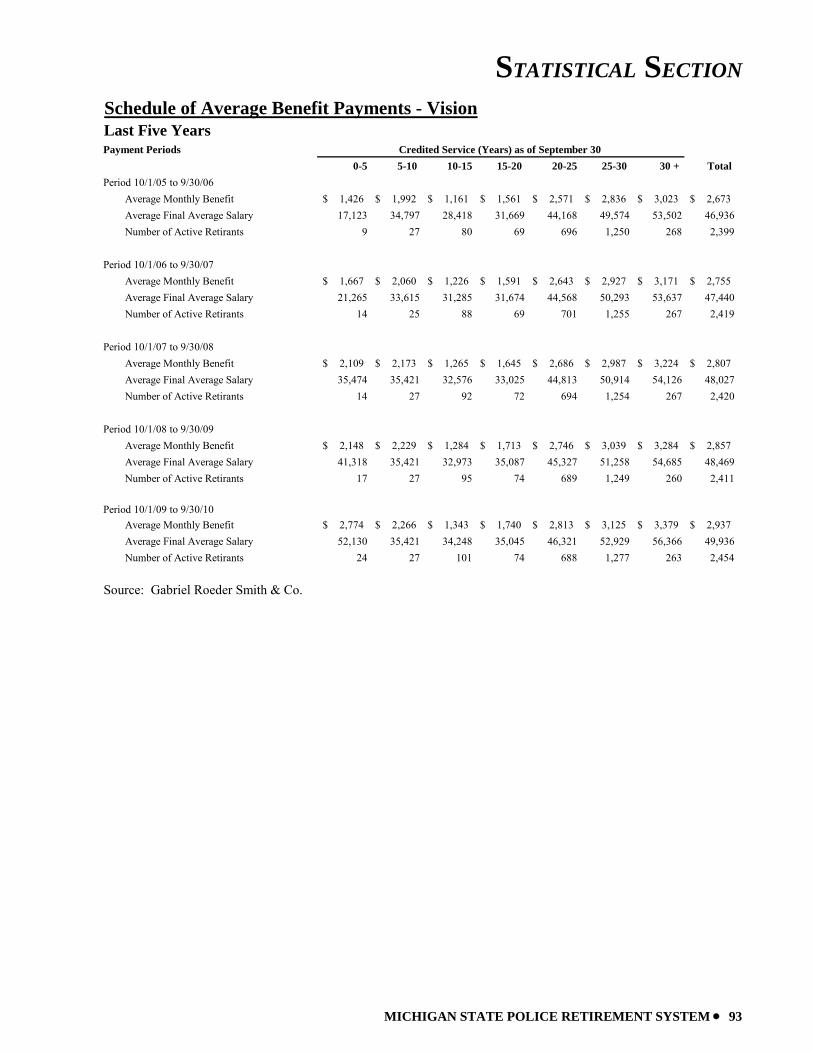
STATISTICAL SECTION
MICHIGAN STATE POLICE RETIREMENT SYSTEM • 93
Schedule of Average Benefit Payments - VisionLast Five Years
0-5 5-10 10-15 15-20 20-25 25-30 30 + Total Period 10/1/05 to 9/30/06 Average Monthly Benefit 1,426$ 1,992$ 1,161$ 1,561$ 2,571$ 2,836$ 3,023$ 2,673$ Average Final Average Salary 17,123 34,797 28,418 31,669 44,168 49,574 53,502 46,936 Number of Active Retirants 9 27 80 69 696 1,250 268 2,399
Period 10/1/06 to 9/30/07 Average Monthly Benefit 1,667$ 2,060$ 1,226$ 1,591$ 2,643$ 2,927$ 3,171$ 2,755$ Average Final Average Salary 21,265 33,615 31,285 31,674 44,568 50,293 53,637 47,440 Number of Active Retirants 14 25 88 69 701 1,255 267 2,419
2,109$ 2,173$ 1,265$ 1,645$ 2,686$ 2,987$ 3,224$ 2,807$ 35,474 35,421 32,576 33,025 44,813 50,914 54,126 48,027
14 27 92 72 694 1,254 267 2,420
2,148$ 2,229$ 1,284$ 1,713$ 2,746$ 3,039$ 3,284$ 2,857$ 41,318 35,421 32,973 35,087 45,327 51,258 54,685 48,469
17 27 95 74 689 1,249 260 2,411
Period 10/1/09 to 9/30/10 Average Monthly Benefit 2,774$ 2,266$ 1,343$ 1,740$ 2,813$ 3,125$ 3,379$ 2,937$ Average Final Average Salary 52,130 35,421 34,248 35,045 46,321 52,929 56,366 49,936 Number of Active Retirants 24 27 101 74 688 1,277 263 2,454
Source: Gabriel Roeder Smith & Co.
Payment Periods Credited Service (Years) as of September 30
Period 10/1/08 to 9/30/09 Average Monthly Benefit Average Final Average Salary Number of Active Retirants
Period 10/1/07 to 9/30/08 Average Monthly Benefit Average Final Average Salary Number of Active Retirants
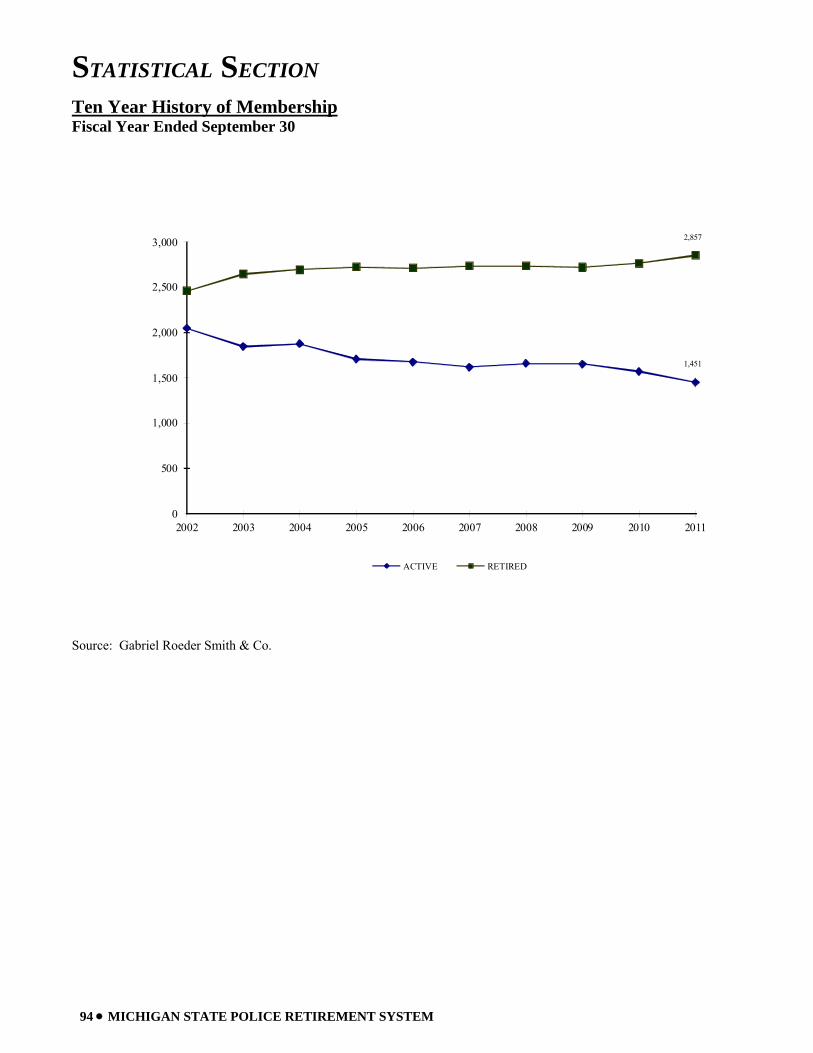
STATISTICAL SECTION
94 • MICHIGAN STATE POLICE RETIREMENT SYSTEM
Ten Year History of Membership Fiscal Year Ended September 30
0
500
1,000
1,500
2,000
2,500
3,000
2002 2003 2004 2005 2006 2007 2008 2009 2010 2011
ACTIVE RETIRED
1,451
2,857
Source: Gabriel Roeder Smith & Co.
STATISTICAL SECTION
MICHIGAN STATE POLICE RETIREMENT SYSTEM • 95
ACKNOWLEDGMENTS The Michigan State Police Retirement System Comprehensive Annual Financial Report is prepared by Financial Services, Fiscal Management Division. Staff of the division for the fiscal year 2010 - 2011 report included: Management: Ronald W. Foss, Director Cindy Peters, Accountant Manager Paula Webb, Accounting Manager Accountants: Dan Harry Erik Simmer Carol Wheaton Technical and Support Staff: Jamin Schroeder Becky Cain Special thanks are also extended to the Office of Retirement Services personnel, accounting and support personnel throughout Financial Services, Investments Division of Treasury, Department of Community Health cashiering personnel, Office of the Auditor General, Gabriel Roeder Smith & Company and the staff at the Office of Financial Management. Preparation of this report would not have been possible without the efforts of these individuals. The report may be viewed on-line at: www.michigan.gov/ors