Embed Size (px)
Citation preview

© C
arne
gie
Lear
ning
Chapter 7 Skills Practice 495
7
Lesson 7.1 Skills Practice
Name Date
Unequal EqualsSolving Polynomial Inequalities
Problem Set
Analyze the graph. Identity the set of x-values to represent when p(x) , 0 and when p(x) . 0.
1.
x
y
21 10 2 3 4
p(x)
222324
1
2
21
22
23
24
3
4
The function p(x) , 0 when {22 , x , 2}.
The function p(x) . 0 when x , 22 x . 2
.
2.
x
y
22 20 4 6 8242628
4
8
24
28
212
216
12
16 p(x)
451453_IM3_Skills_CH07_495-528.indd 495 03/12/13 2:45 PM
© C
arne
gie
Lear
ning
496 Chapter 7 Skills Practice
7
Lesson 7.1 Skills Practice page 2
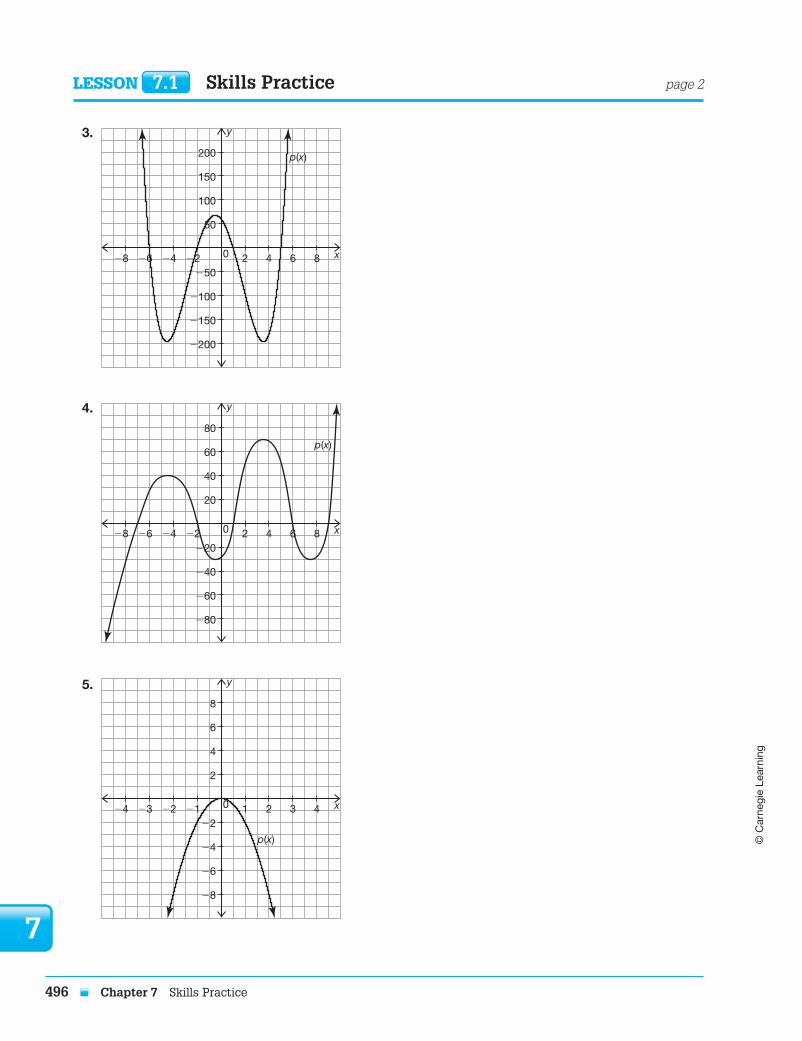
3.
x
y
22 20 4 6 8242628
50
100
250
2100
2150
2200
150
200 p(x)
4.
x
y
22 20 4 6 8242628
20
40
220
240
260
280
60
80
p(x)
5.
x
y
21 10 2 3 4222324
2
4
22
24
26
28
6
8
p(x)
451453_IM3_Skills_CH07_495-528.indd 496 03/12/13 2:45 PM

© C
arne
gie
Lear
ning
Chapter 7 Skills Practice 497
7
6.
x
y
21 10 2 3 4222324
2
4
22
24
26
28
6
8p(x)
Use a graphing calculator to solve each inequality. Round decimals to the nearest hundredths.
7. 21 , 3x2 1 1
I graphed y1 5 3 x 2 1 1 and y2 5 21.
Using the intersection function of the calculator, I determined that 21 , 3 x 2 1 1 when
x , 22.58 or x . 2.58.
8. 4x2 2 5 # 9
9. 23 # x3 1 2x 1 6
Lesson 7.1 Skills Practice page 3
Name Date
451453_IM3_Skills_CH07_495-528.indd 497 03/12/13 2:45 PM
© C
arne
gie
Lear
ning
498 Chapter 7 Skills Practice
7
Lesson 7.1 Skills Practice page 4
10. 210.5 . 21.5x2 2 15.5x
11. 21.2x3 2 4x2 1 15x # 1
12. 26.6 , 212.4x2 1 2.2x3 1 0.8x4
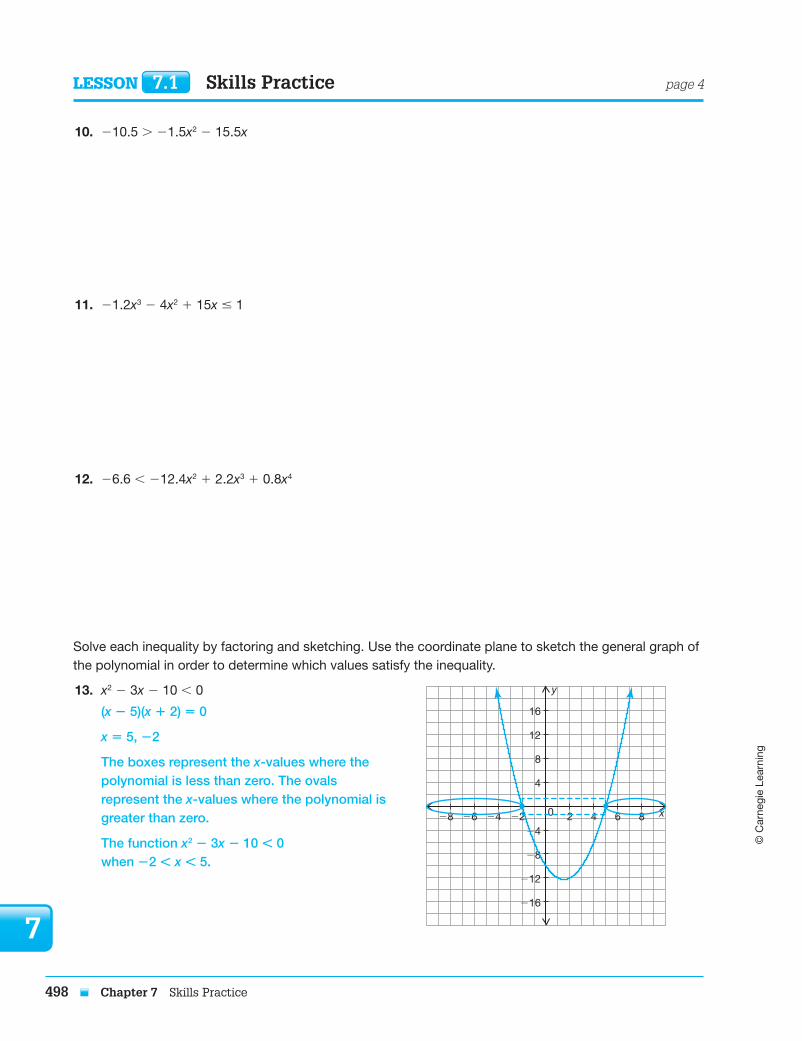
Solve each inequality by factoring and sketching. Use the coordinate plane to sketch the general graph of the polynomial in order to determine which values satisfy the inequality.
13. x2 2 3x 2 10 , 0
(x 2 5)(x 1 2) 5 0
x 5 5, 22
The boxes represent the x-values where the polynomial is less than zero. The ovals represent the x-values where the polynomial is greater than zero.
The function x2 2 3x 2 10 , 0 when 22 , x , 5.
x
y
22 20 4 6 8242628
4
8
24
28
212
216
12
16
451453_IM3_Skills_CH07_495-528.indd 498 03/12/13 2:45 PM
© C
arne
gie
Lear
ning
Chapter 7 Skills Practice 499
7
Lesson 7.1 Skills Practice page 5
Name Date
14. x3 1 3x2 1 x 1 3 $ 0
x
y
21 10 2 3 4222324
2
4
22
24
26
28
6
8
15. 2x3 1 6x2 2 20x # 0
x
y
22 20 4 6 8242628
20
40
220
240
260
280
60
80
16. x3 1 4x2 1 x 2 6 . 0
x
y
21 10 2 3 4222324
2
4
22
24
26
28
6
8
451453_IM3_Skills_CH07_495-528.indd 499 03/12/13 2:45 PM

© C
arne
gie
Lear
ning
500 Chapter 7 Skills Practice
7
17. x4 2 25x2 1 144 $ 0
x
y
21 10 2 3 4222324
40
80
240
280
2120
2160
120
160
18. x4 2 8x3 1 2x2 1 80x 2 75 # 0
x
y
22 20 4 6 8242628
40
80
240
280
2120
2160
120
160
Lesson 7.1 Skills Practice page 6
451453_IM3_Skills_CH07_495-528.indd 500 03/12/13 2:45 PM

© C
arne
gie
Lear
ning
Chapter 7 Skills Practice 501
7
Lesson 7.2 Skills Practice
Name Date
America’s Next Top Polynomial Model Modeling with Polynomials
Vocabulary
Explain each key term in your own words.
1. regression equation
2. coefficient of determination
Problem Set
Create a scatter plot of the data. Predict the type of polynomial that best fits the data. Explain your reasoning.
1. The table of values represents the temperature of 2 liters of water in a teakettle over time as it is set to boil and then cools down.
The data increases, then decreases. So, the data could be represented by a quadratic equation.
Time (minutes) Temperature (°C)
0 15
10 40
15 90
20 100
30 80
45 50
60 25
x
y
100 20 30 40
10
20
30
40
50
Time (minutes)
60 70 80 90
50
Tem
per
atur
e (°
C)
60
70
80
90
451453_IM3_Skills_CH07_495-528.indd 501 03/12/13 2:45 PM

© C
arne
gie
Lear
ning
502 Chapter 7 Skills Practice
7
Lesson 7.2 Skills Practice page 2
2. The table of values represents the number of work hours for which Jay was hired throughout the year.
Time Since December (months)
Work Time (hours)
1 40
3 100
5 160
7 140
9 160
11 60
3. The table of values represents the download speed in kilobytes per second (kBps) of Sue’s Internet connection throughout the day.
Time Since 7:00 am (hours)
Download Speed (kBps)
1 5775
3 7000
5 4505
7 6855
9 6540
11 5020
13 3780
15 4250
451453_IM3_Skills_CH07_495-528.indd 502 03/12/13 2:45 PM
© C
arne
gie
Lear
ning
Chapter 7 Skills Practice 503
7
Lesson 7.2 Skills Practice page 3
Name Date
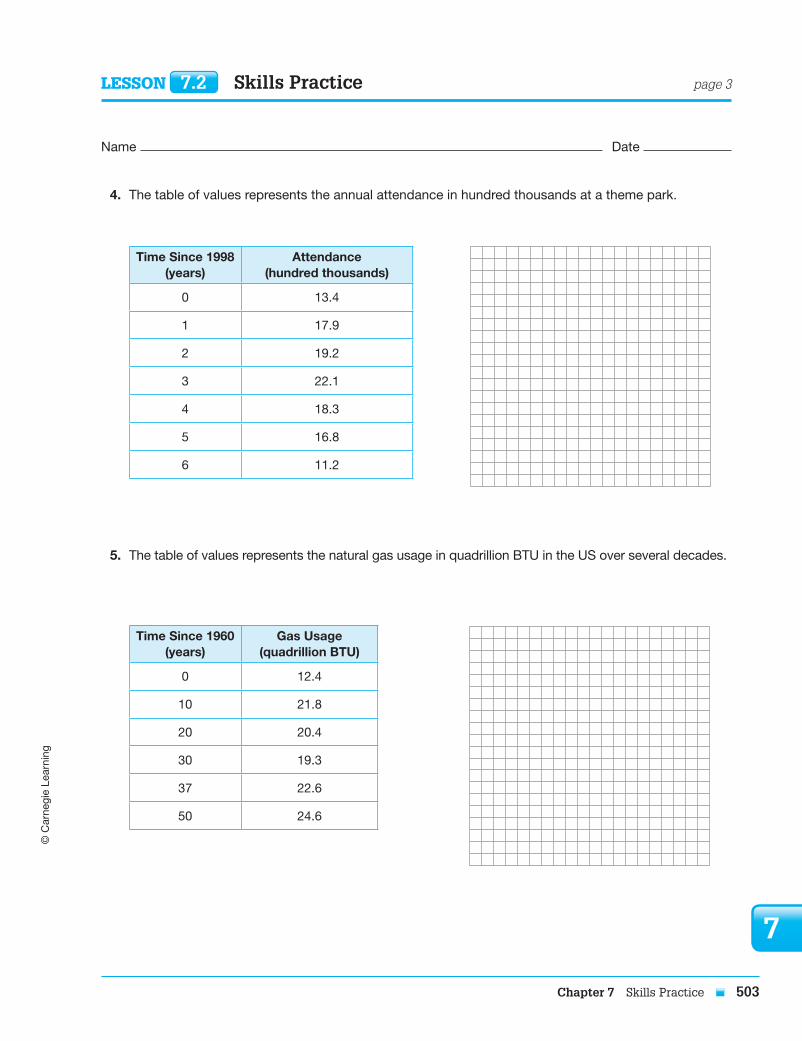
4. The table of values represents the annual attendance in hundred thousands at a theme park.
Time Since 1998 (years)
Attendance (hundred thousands)
0 13.4
1 17.9
2 19.2
3 22.1
4 18.3
5 16.8
6 11.2
5. The table of values represents the natural gas usage in quadrillion BTU in the US over several decades.
Time Since 1960 (years)
Gas Usage(quadrillion BTU)
0 12.4
10 21.8
20 20.4
30 19.3
37 22.6
50 24.6
451453_IM3_Skills_CH07_495-528.indd 503 03/12/13 2:45 PM
© C
arne
gie
Lear
ning
504 Chapter 7 Skills Practice
7
Lesson 7.2 Skills Practice page 4
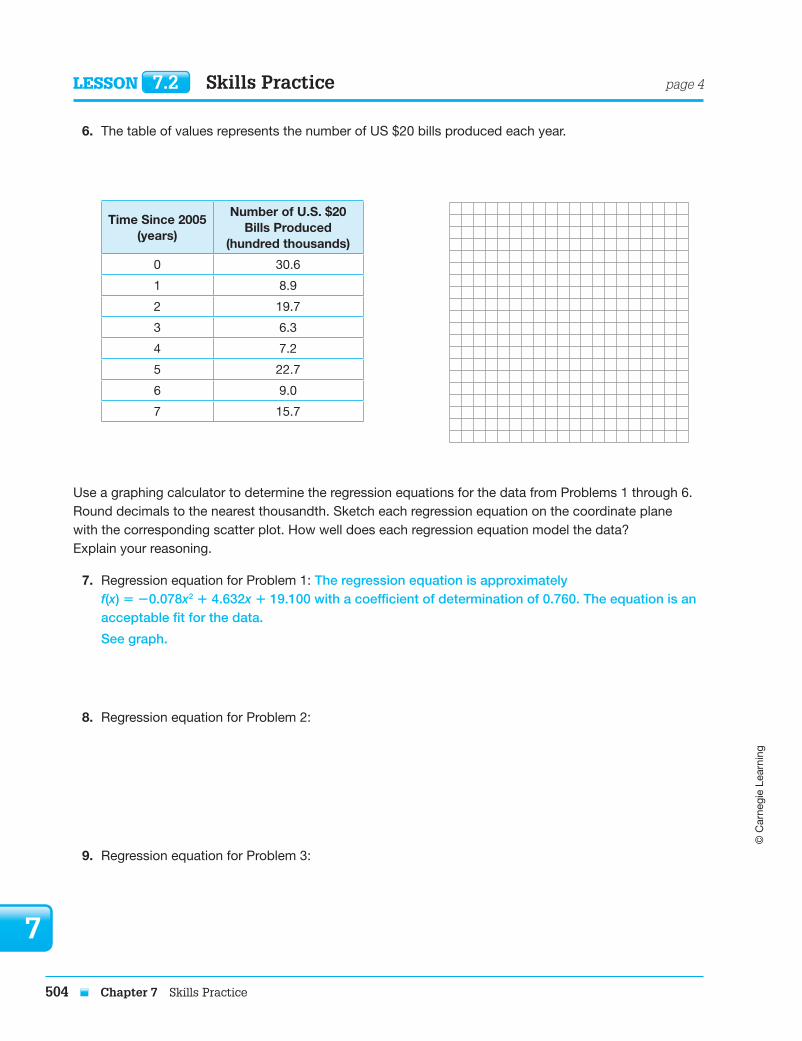
6. The table of values represents the number of US $20 bills produced each year.
Time Since 2005 (years)
Number of U.S. $20 Bills Produced
(hundred thousands)
0 30.6
1 8.9
2 19.7
3 6.3
4 7.2
5 22.7
6 9.0
7 15.7
Use a graphing calculator to determine the regression equations for the data from Problems 1 through 6. Round decimals to the nearest thousandth. Sketch each regression equation on the coordinate plane with the corresponding scatter plot. How well does each regression equation model the data? Explain your reasoning.
7. Regression equation for Problem 1: The regression equation is approximately f(x) 5 20.078x2 1 4.632x 1 19.100 with a coefficient of determination of 0.760. The equation is an acceptable fit for the data.
See graph.
8. Regression equation for Problem 2:
9. Regression equation for Problem 3:
451453_IM3_Skills_CH07_495-528.indd 504 03/12/13 2:45 PM

© C
arne
gie
Lear
ning
Chapter 7 Skills Practice 505
7
Lesson 7.2 Skills Practice page 5
Name Date
10. Regression equation for Problem 4:
11. Regression equation for Problem 5:
12. Regression equation for Problem 6:
Use the data and regression equations from Problems 1 through 12 to make predictions for each problem situation. Explain your reasoning.
13. Charlotte wants to make sure the hot chocolate is not too hot for her daughter. She wants to pour the water at about 60°C. Use the regression equation for Problem 1 to predict after how many minutes she should pour the water from the kettle.
Using the regression equation, I solved f(x) 5 60 to predict when the water is about 608C.
Charlotte should pour the water after approximately 11 minutes or 48 minutes.
14. Use the regression equation for Problem 2 to predict how many hours of work Jay will be hired for in October.
451453_IM3_Skills_CH07_495-528.indd 505 03/12/13 2:45 PM
© C
arne
gie
Lear
ning
506 Chapter 7 Skills Practice
7
15. Sue gets off work at 7:00 pm and wants to download some music. Use the graph from Problem 3 to predict the download speed she should expect at that time.
16. If the theme park in Problem 4 opened in 1995, explain why the regression equation would not give an accurate prediction of attendance that year.
17. Use the graph from Problem 1 to predict the temperature of the water be after 64 minutes. Is this likely? Explain your reasoning.
18. Use the regression equation from Problem 5 to predict the amount of natural gas the US used in 2000.
19. Use the regression equation from Problem 5 to predict the amount of natural gas the US will use in 2020.
20. Use the regression equation from Problem 6 to predict the number of $20 bills made in 2004. Is this likely? Do you think the regression equation is a good match for the data? Explain your reasoning.
Lesson 7.2 Skills Practice page 6
451453_IM3_Skills_CH07_495-528.indd 506 03/12/13 2:45 PM

© C
arne
gie
Lear
ning
Chapter 7 Skills Practice 507
7
Connecting PiecesPiecewise Functions
Vocabulary
Write a definition for the term in your own words.
1. piecewise function
Problem Set
Sketch each piecewise function on the coordinate plane.
1. p(x) 5 (x 1 3)2, x , 0
(x 2 3)2, x $ 0
x
y
p(x)
22 20 4 6 8242628
2
4
22
24
26
28
6
8
2. b(x) 5 1 __ 4
x2, x # 2
2 1 __ 2 (x 2 2)2, x . 2
x
y
21 10 2 3 4222324
1
2
21
22
23
24
3
4
Lesson 7.3 Skills Practice
Name Date
451453_IM3_Skills_CH07_495-528.indd 507 03/12/13 2:45 PM

© C
arne
gie
Lear
ning
508 Chapter 7 Skills Practice
7
Lesson 7.3 Skills Practice page 2
3. f(x) 5
2x 1 1, x , 0
(x 2 2)2 2 3, 0 # x # 2
23, x . 2
x
y
21 10 2 3 4222324
1
2
21
22
23
24
3
4
4. g(x) 5 2x 1 12, x , 23
2x4 1 9x2, 23 # x # 3
7x 2 42, x . 3
x
y
22 20 4 6 8242628
6
12
26
212
218
224
18
24
5. t(x) 5 2 1 __ 4 (x 2 2)2 1 3, x # 2
22x 1 4, x . 2
x
y
21 10 2 3 4222324
1
2
21
22
23
24
3
4
451453_IM3_Skills_CH07_495-528.indd 508 03/12/13 2:45 PM

© C
arne
gie
Lear
ning
Chapter 7 Skills Practice 509
7
Lesson 7.3 Skills Practice page 3
Name Date
6. m(x) 5 x2, x # 21
2x3 1 3, 21 , x # 1
2x2 1 4, x . 1
x
y
21 10 2 3 4222324
1
2
21
22
23
24
3
4
Write the equation of each piecewise function given its graph.
7.
x
y
22 20 4 6 8242628
2
4
22
24
26
28
6
8 b(x)
b(x) 5 9, x , 23
x2, 23 # x # 3
9, x . 3
451453_IM3_Skills_CH07_495-528.indd 509 03/12/13 2:45 PM

© C
arne
gie
Lear
ning
510 Chapter 7 Skills Practice
7
Lesson 7.3 Skills Practice page 4
8.
x
y
21 10 2 3 4222324
1
2
21
22
23
24
3
4
c(x)
c(x) 5
9.
x
y
21 10 2 3 4222324
1
2
21
22
23
24
3
4
d(x)
d(x) 5
10.
x
y
22 20 4 6 8242628
2
4
22
24
26
28
6
8
f(x)
f(x) 5
451453_IM3_Skills_CH07_495-528.indd 510 03/12/13 2:45 PM
© C
arne
gie
Lear
ning
Chapter 7 Skills Practice 511
7
Lesson 7.3 Skills Practice page 5
Name Date
11.
x
y
21 10 2 3 4222324
2
4
22
24
26
28
6
8
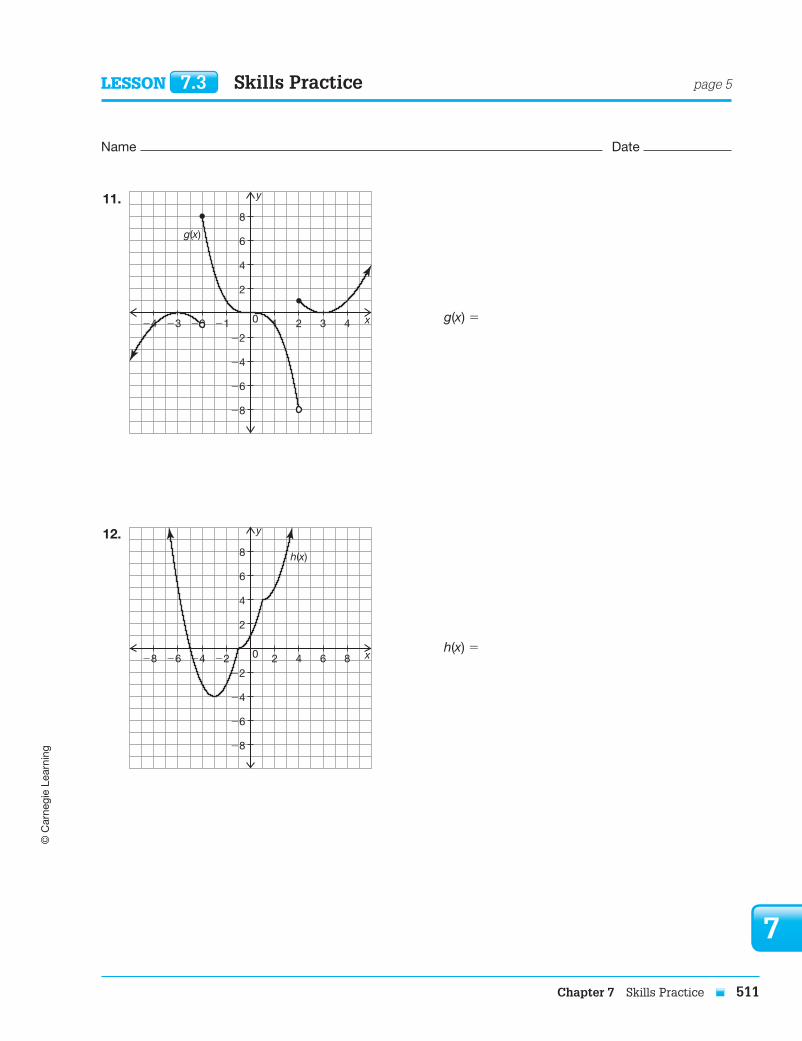
g(x)
g(x) 5
12.
x
y
22 20 4 6 8242628
2
4
22
24
26
28
6
8 h(x)
h(x) 5
451453_IM3_Skills_CH07_495-528.indd 511 03/12/13 2:45 PM

© C
arne
gie
Lear
ning
512 Chapter 7 Skills Practice
7
Lesson 7.3 Skills Practice page 6
Analyze the scatter plot. Determine a regression equation over each interval to write a piecewise function that models the data. Round decimals to the nearest thousandth. Then, graph the piecewise function on the scatter plot.
13.
x
y
1
3
0 2 3 4
4
5
6
7
5 6 7 8 9 10 11
8
9
10
11
12
Answers will vary.
f(x) 5
20.286x2 2 1.4x 1 9.7 , 0.5 # x , 3.5
0.438x 1 1.574 , 3.5 # x , 9
0.826x2 2 15.245x 1 77.265 , 9 # x # 12
14.
x
y
20 4 6 8
5
10
15
20
10 12 14 16 18
25
30
35
40
45
f(x) 5
, 0 # x # 3
, 3 , x # 8
, 8 , x # 20
451453_IM3_Skills_CH07_495-528.indd 512 03/12/13 2:45 PM

© C
arne
gie
Lear
ning
Chapter 7 Skills Practice 513
7
Lesson 7.3 Skills Practice page 7
Name Date
15.
x
y
0.10 0.2 0.3 0.4
2
4
6
8
0.5 0.6 0.7 0.8 0.9
10
12
14
16
18
f(x) 5
, 0 , x # 0.5
, 0.5 , x # 0.8
, 0.8 , x # 1.0
16.
x
y
20
8
0 30 40 50
12
16
20
24
10 60 70 80 90 100
28
32
36
40
44
f(x) 5
, 10 # x # 35
, 35 , x # 75
, 75 , x # 110
451453_IM3_Skills_CH07_495-528.indd 513 03/12/13 2:45 PM

© C
arne
gie
Lear
ning
514 Chapter 7 Skills Practice
7
Lesson 7.3 Skills Practice page 8
17.
x
y
20 4 6 8
2
4
6
8
10 12 14 16 18
10
12
14
16
18
f(x) 5
, 0 # x # 5
, 5 , x # 9
, 9 , x # 14
, 14 , x # 18
18.
x
y
840
12 16 20
1
2
3
4
24 28 32 36 40
5
6
7
8
9
f(x) 5
, 4 # x , 8
, 8 # x , 20
, 20 # x , 32
, 32 # x # 44
451453_IM3_Skills_CH07_495-528.indd 514 03/12/13 2:45 PM

© C
arne
gie
Lear
ning
Chapter 7 Skills Practice 515
7
Lesson 7.4 Skills Practice
Name Date
Modeling GigModeling Polynomial Data
Problem Set
Use Data Sets A through F to solve the following problems.
A: The table shows the average share price of WXY company stock since 1994.
Time Since 1994 (years)
WXY Share Price (dollars)
1 5
3 10
5 25
7 15
9 15
11 40
13 100
15 150
17 300
19 500
B: The table shows the number of less than 100- mile trips in the US over the Thanksgiving holiday.
Time Since Monday before Thanksgiving
(days)
Number of Less Than 100-Mile Trips
(millions)
1 12
2 19
3 27
4 23
5 24
6 18
C: The table shows the relationship between J. Company’s advertising spending and their profit.
Advertising Spending (hundred dollars)
Profit (ten thousand dollars)
0 2
2 6
6 14
10 18
12 20
14 16
16 12
18 8
20 4
D: The table shows the number of tons of apples harvested per acre since 1990.
Time Since 1990 (years)
Tons of Apples (thousands)
1 4.9
3 5.4
5 5.2
7 5.4
9 5.9
11 6.3
13 7.1
15 9.7
451453_IM3_Skills_CH07_495-528.indd 515 03/12/13 2:45 PM

© C
arne
gie
Lear
ning
516 Chapter 7 Skills Practice
7
Lesson 7.4 Skills Practice page 2
E: The table shows the average home mortgage interest rate since 1999.
Time Since 1999 (years)
Interest Rate (%)
0 6.5
1 8.5
2 7.0
3 6.5
4 6.0
5 5.5
6 6.0
7 7.0
8 5.0
9 4.5
F: The table shows the relationship between shell length of a turtle and number of eggs laid per clutch.
Shell Length (millimeters)
Number of Eggs Laid per Clutch
285 3
290 7
300 9
305 10
310 10
315 9
320 7
330 5
335 2
Create a scatter plot for the data.
1. Data Set A
x
y
310
5 7 9
50
100
150
200
11 13 15 17 19
250
300
350
400
450
Time Since 1994 (Years)
WX
Y S
hare
Pri
ce (d
olla
rs)
451453_IM3_Skills_CH07_495-528.indd 516 03/12/13 2:45 PM
© C
arne
gie
Lear
ning
Chapter 7 Skills Practice 517
7
Lesson 7.4 Skills Practice page 3
Name Date
2. Data Set B
3. Data Set C
451453_IM3_Skills_CH07_495-528.indd 517 03/12/13 2:45 PM
© C
arne
gie
Lear
ning
518 Chapter 7 Skills Practice
7
Lesson 7.4 Skills Practice page 4
4. Data Set D
5. Data Set E
451453_IM3_Skills_CH07_495-528.indd 518 03/12/13 2:45 PM

© C
arne
gie
Lear
ning
Chapter 7 Skills Practice 519
7
Lesson 7.4 Skills Practice page 5
Name Date
6. Data Set F
Analyze each data set and its scatter plot and describe the polynomial function that best models the data. Explain your reasoning.
7. Data Set A: The data increases, decreases, then increases again. A cubic function models the data.
8. Data Set B:
451453_IM3_Skills_CH07_495-528.indd 519 03/12/13 2:45 PM
© C
arne
gie
Lear
ning
520 Chapter 7 Skills Practice
7
Lesson 7.4 Skills Practice page 6
9. Data Set C:
10. Data Set D:
11. Data Set E:
12. Data Set F:
Use a graphing calculator to determine the regression equation that best models the data. Round decimals to the nearest thousandth.
13. Data Set A: The function y 5 0.229x3 2 4.106x2 1 22.496x 2 18.003 models the data.
14. Data Set B:
451453_IM3_Skills_CH07_495-528.indd 520 03/12/13 2:45 PM
© C
arne
gie
Lear
ning
Chapter 7 Skills Practice 521
7
Lesson 7.4 Skills Practice page 7
Name Date
15. Data Set C:
16. Data Set D:
17. Data Set E:
18. Data Set F:
Use the regression equations from Problems 13 through 18 to answer each question.
19. Susan bought 25 shares of WXY stock in 2006. How much money did she pay for her shares?
In the year 2006, 25 shares cost $56.40. I used the regression equation to determine the output value for the input x 5 12.
20. Approximately how many people travel less than 100 miles on the Monday after Thanksgiving?
451453_IM3_Skills_CH07_495-528.indd 521 03/12/13 2:45 PM
© C
arne
gie
Lear
ning
522 Chapter 7 Skills Practice
7
Lesson 7.4 Skills Practice page 8
21. What is the optimal amount of money the J. Company should spend on advertising to maximize profit?
22. How many tons of apples were harvested in 2007?
23. Predict the home mortgage interest rate in 2015. Is this likely? Explain your reasoning.
24. What shell size is best for laying the largest clutch of eggs? Why might larger size shells be associated with smaller clutches of eggs?
451453_IM3_Skills_CH07_495-528.indd 522 03/12/13 2:45 PM

© C
arne
gie
Lear
ning
Chapter 7 Skills Practice 523
7
Lesson 7.5 Skills Practice
Name Date
The Choice Is Yours Comparing Polynomials in Different Representations
Problem Set
Analyze each pair of representations. Then, answer each question and justify your reasoning.
1. Which polynomial function has a greater degree?
A polynomial function b(x) with 2 absolute minimums and 1 relative maximum.
c(x) 5 22(3 2 x2)(x 2 4) 1 9
The function b(x) has a greater degree.
A function with 2 absolute minimums and 1 relative maximum must have a degree greater than 3. The first function is at least a quartic function. The second function is a cubic function.
2. Which polynomial function has a greater number of real zeros?
d(x) 5 x2 2 x – 6 x f(x)
25 28
24 21
23 0
22 1
21 8
0 27
1 64
451453_IM3_Skills_CH07_495-528.indd 523 03/12/13 2:45 PM
© C
arne
gie
Lear
ning
524 Chapter 7 Skills Practice
7
Lesson 7.5 Skills Practice page 2
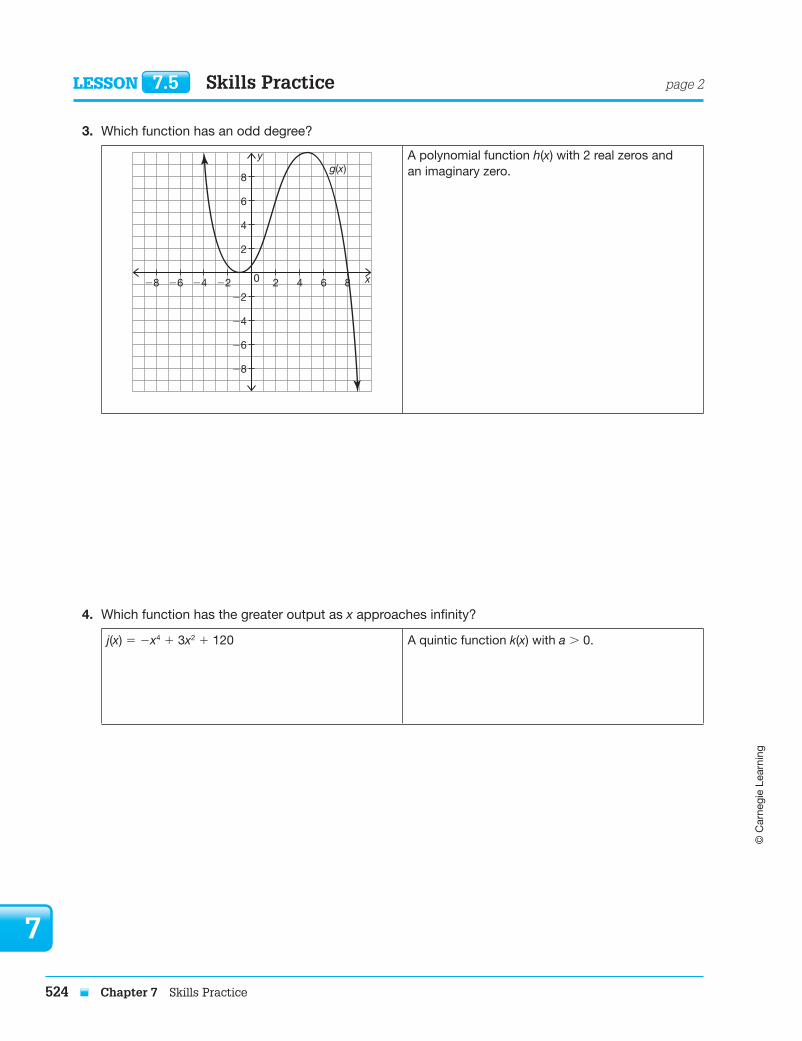
3. Which function has an odd degree?
x
y
22 20 4 6 8242628
2
4
22
24
26
28
6
8g(x)
A polynomial function h(x) with 2 real zeros and an imaginary zero.
4. Which function has the greater output as x approaches infinity?
j(x) 5 2x4 1 3x2 1 120 A quintic function k(x) with a . 0.
451453_IM3_Skills_CH07_495-528.indd 524 03/12/13 2:45 PM

© C
arne
gie
Lear
ning
Chapter 7 Skills Practice 525
7
Lesson 7.5 Skills Practice page 3
Name Date
5. Which function has the smaller output as x approaches negative infinity?
A quadratic equation m(x) with y-intercept of (0, 212) and imaginary roots.
n(x) 5 22(x 1 3)5 2 25
6. Which function has a greater y-intercept?
x p(x)
26 16
24 0
22 28
0 28
2 0
4 16
q(x) 5 (x 1 2)3 2 9
451453_IM3_Skills_CH07_495-528.indd 525 03/12/13 2:45 PM
© C
arne
gie
Lear
ning
526 Chapter 7 Skills Practice
7
Lesson 7.5 Skills Practice page 4
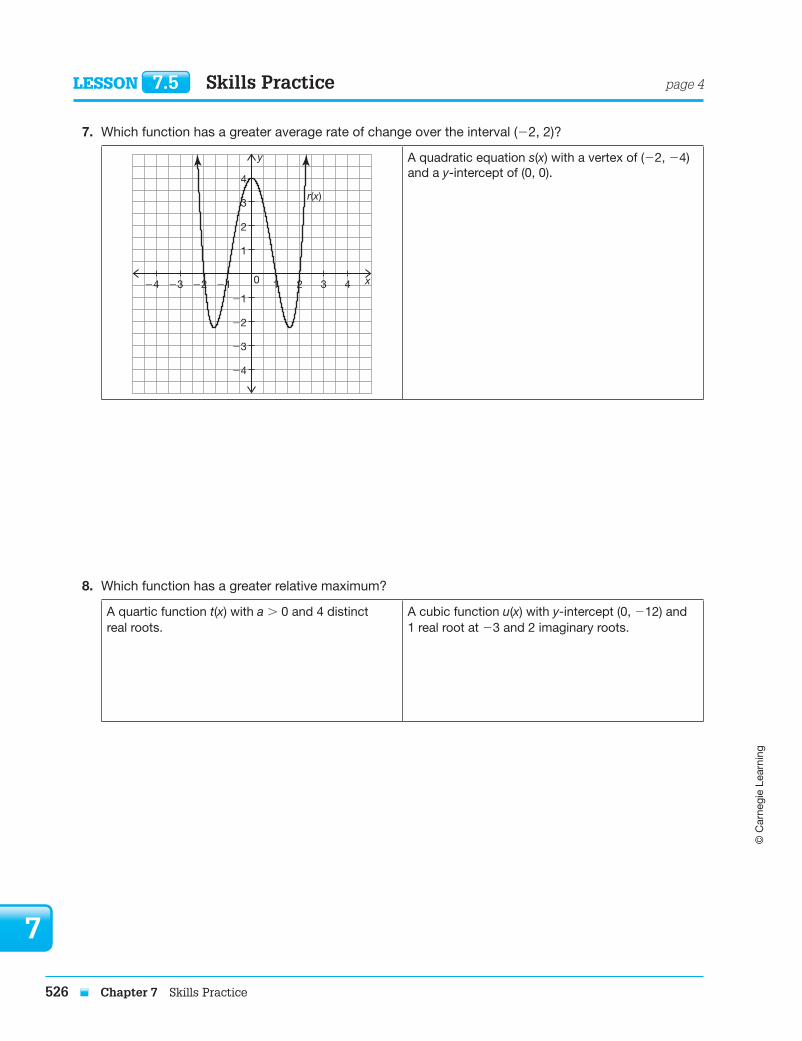
7. Which function has a greater average rate of change over the interval (22, 2)?
x
y
21 10 2 3 4222324
1
2
21
22
23
24
3
4
r(x)
A quadratic equation s(x) with a vertex of (22, 24) and a y-intercept of (0, 0).
8. Which function has a greater relative maximum?
A quartic function t(x) with a . 0 and 4 distinct real roots.
A cubic function u(x) with y-intercept (0, 212) and 1 real root at 23 and 2 imaginary roots.
451453_IM3_Skills_CH07_495-528.indd 526 03/12/13 2:45 PM

© C
arne
gie
Lear
ning
Chapter 7 Skills Practice 527
7
Lesson 7.5 Skills Practice page 5
Name Date
9. Which function’s axis of symmetry has a greater x-value?
A quadratic function z(x) with zeros at 24 and 4.
x
y
22 20 4 6 8242628
2
4
22
24
26
28
6
8a(x)
10. Which function has a greater output for a given input?
The basic cubic function f(x) 5 x3. d(x) 5 f(x 2 1) 2 5
451453_IM3_Skills_CH07_495-528.indd 527 03/12/13 2:46 PM

© C
arne
gie
Lear
ning
528 Chapter 7 Skills Practice
7
Lesson 7.5 Skills Practice page 6
11. Which function has a lower minimum?
x g(x)
22 4
21 1
0 0
1 1
2 4
h(x) 5 4g(x 2 3) 2 8
12. Which function has a greater input for a given output?
x
y
22 20 4 6 8242628
2
4
22
24
26
28
6
8 m(x)
n(x) 5 m(x 1 4) 1 1
451453_IM3_Skills_CH07_495-528.indd 528 03/12/13 2:46 PM