Embed Size (px)
Citation preview
Lesson 3Lesson 3
Scientific ToolsScientific Tools
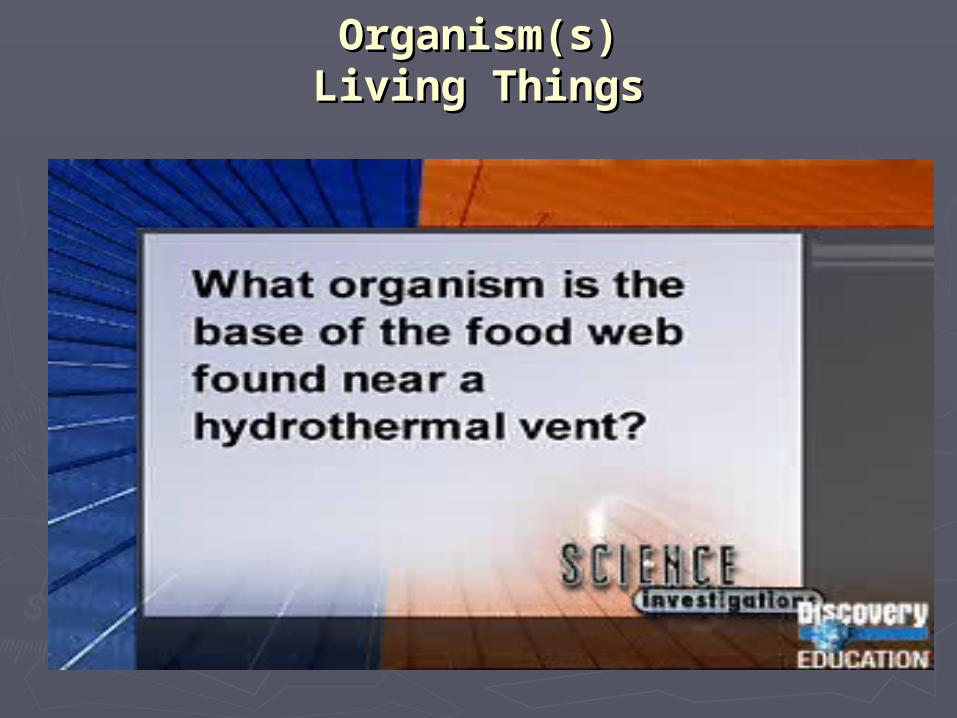
Organism(s)Organism(s)Living ThingsLiving Things
Microorganism(s)Microorganism(s)Living thing too small to see with the unaided Living thing too small to see with the unaided
eye.eye.
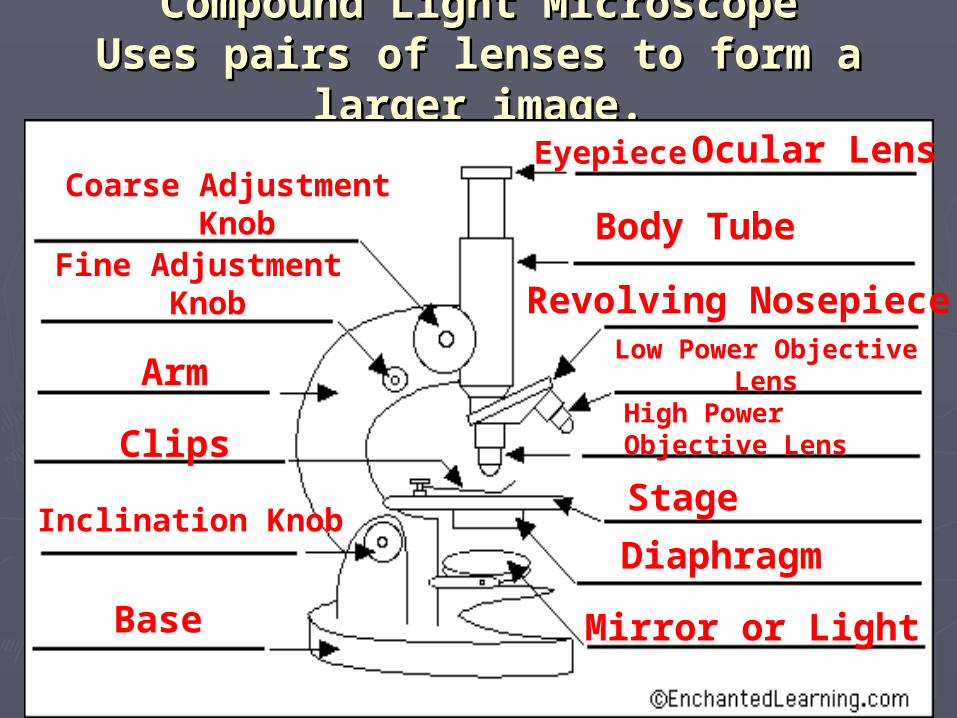
Compound Light MicroscopeCompound Light MicroscopeUses pairs of lenses to form a larger Uses pairs of lenses to form a larger
image.image.Ocular Lens
Body Tube
Revolving NosepieceLow Power Objective
LensHigh Power Objective Lens
Stage
Diaphragm
Mirror or Light
Coarse Adjustment Knob
Fine Adjustment Knob
Arm
Clips
Inclination Knob
Base
Eyepiece
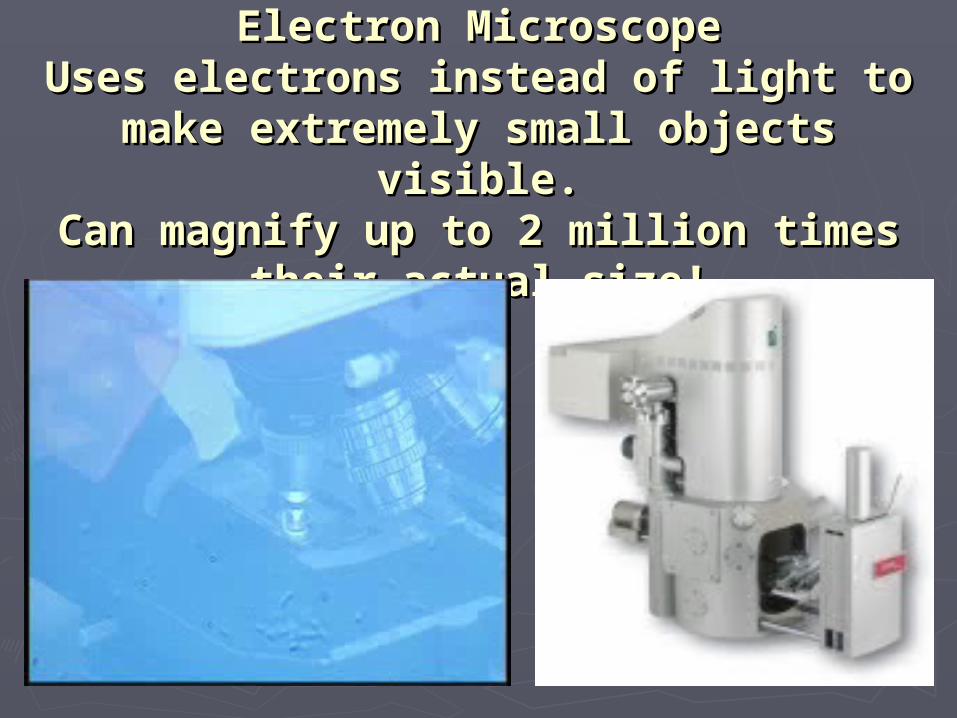
Electron MicroscopeElectron MicroscopeUses electrons instead of light to Uses electrons instead of light to
make extremely small objects visible.make extremely small objects visible.Can magnify up to 2 million times Can magnify up to 2 million times
their actual size!their actual size!
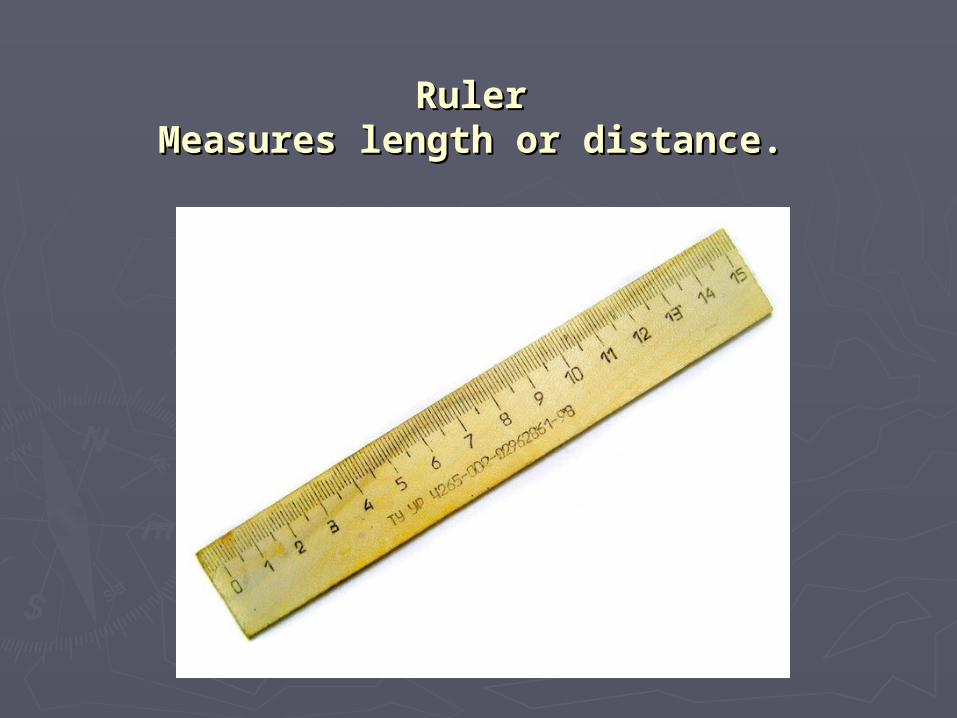
RulerRulerMeasures length or distance.Measures length or distance.
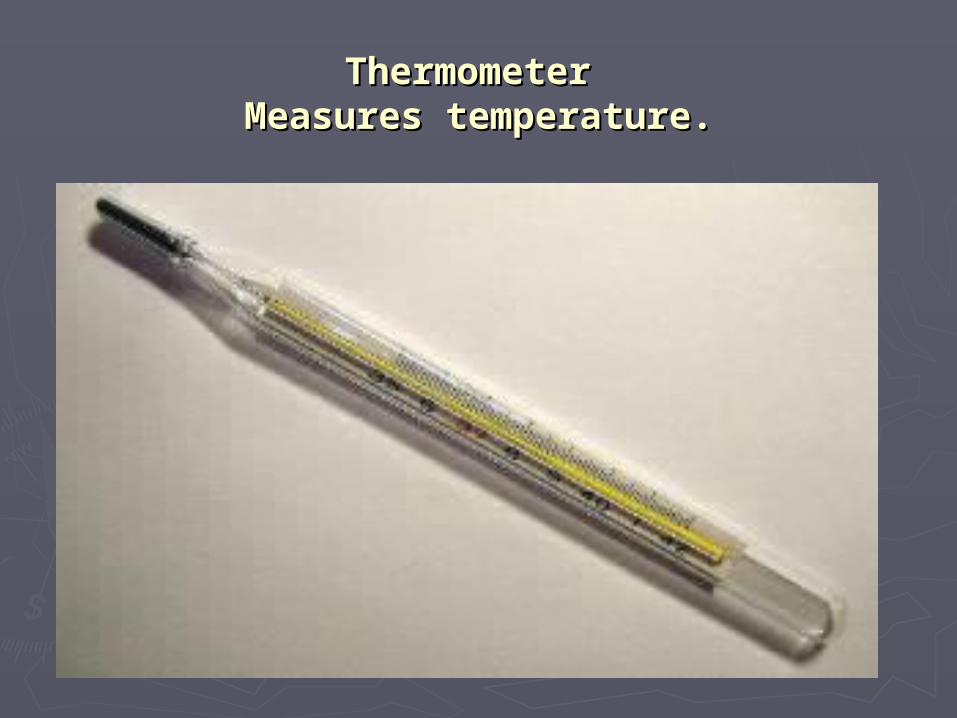
Thermometer Thermometer Measures temperature.Measures temperature.
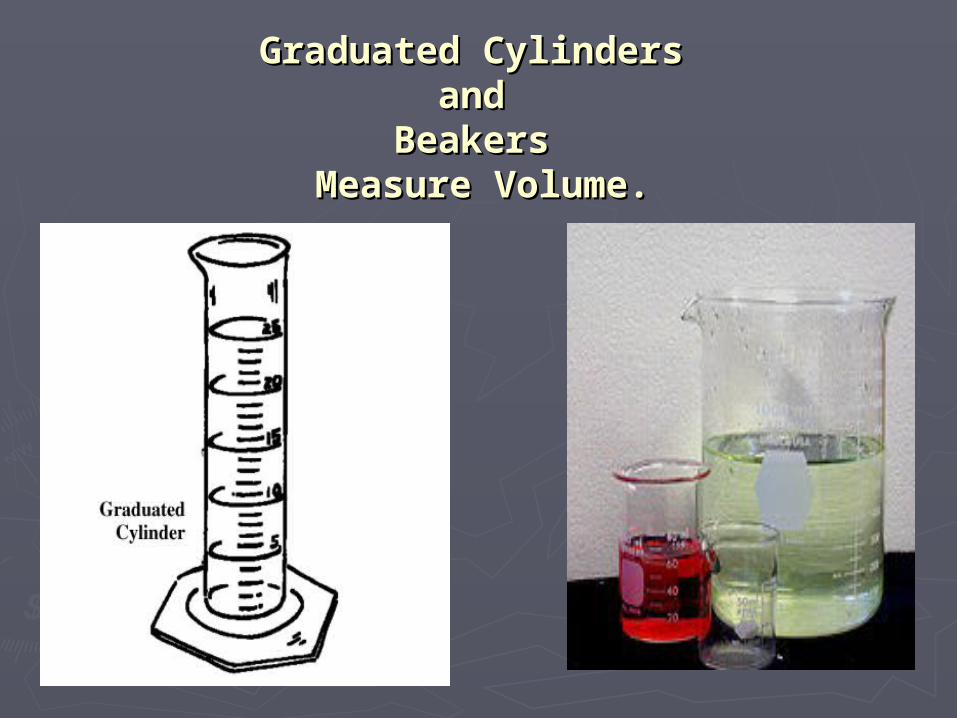
Graduated Cylinders Graduated Cylinders and and
Beakers Beakers Measure Volume.Measure Volume.
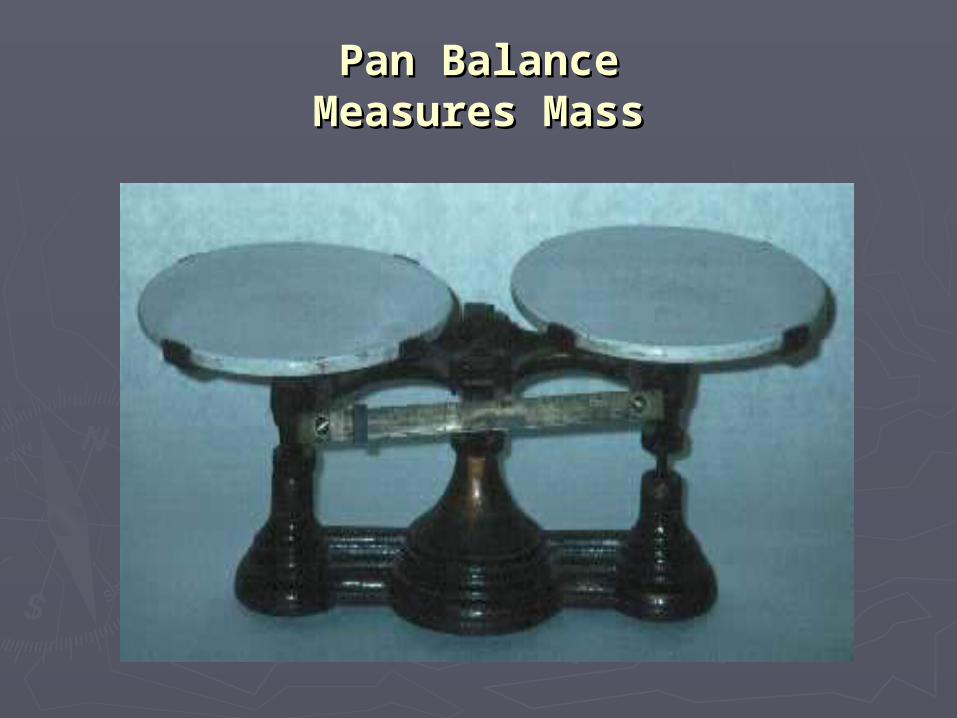
Pan BalancePan BalanceMeasures MassMeasures Mass
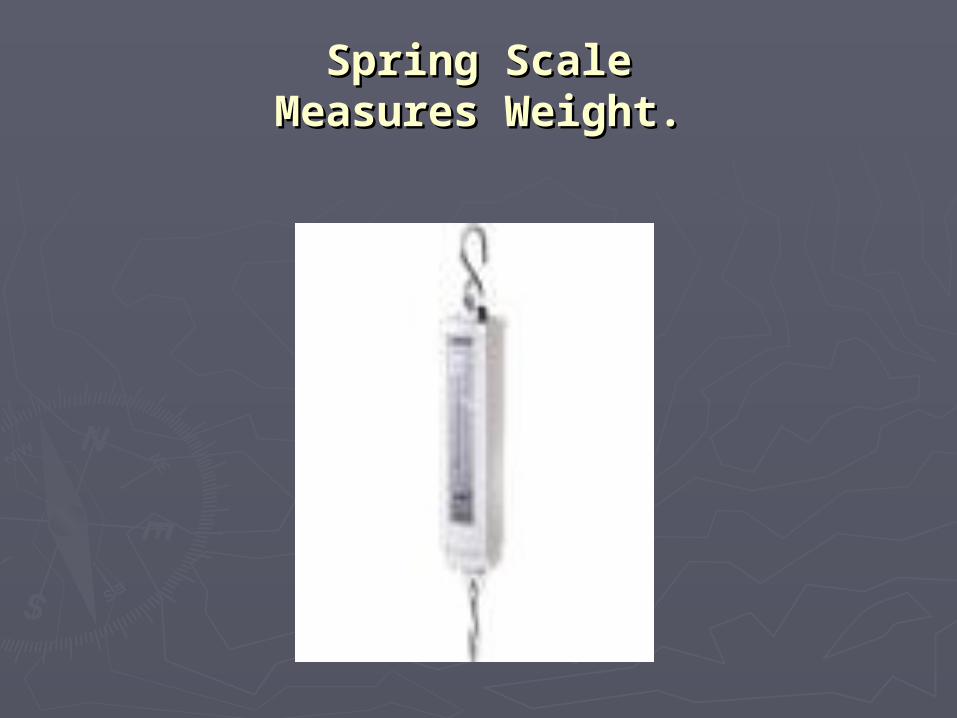
Spring ScaleSpring ScaleMeasures Weight.Measures Weight.
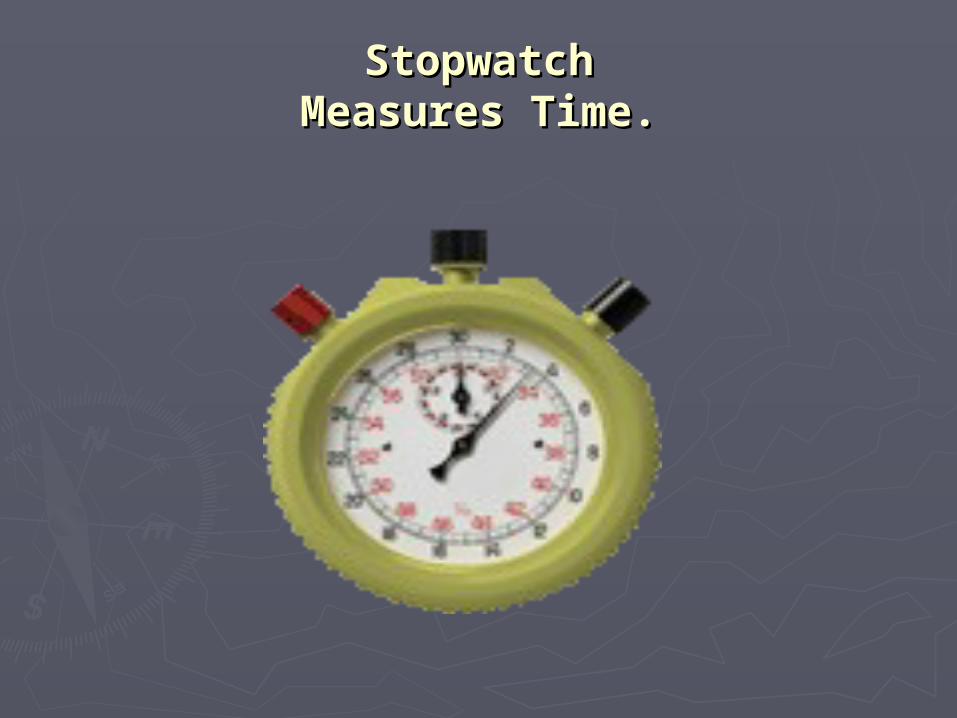
StopwatchStopwatchMeasures Time.Measures Time.
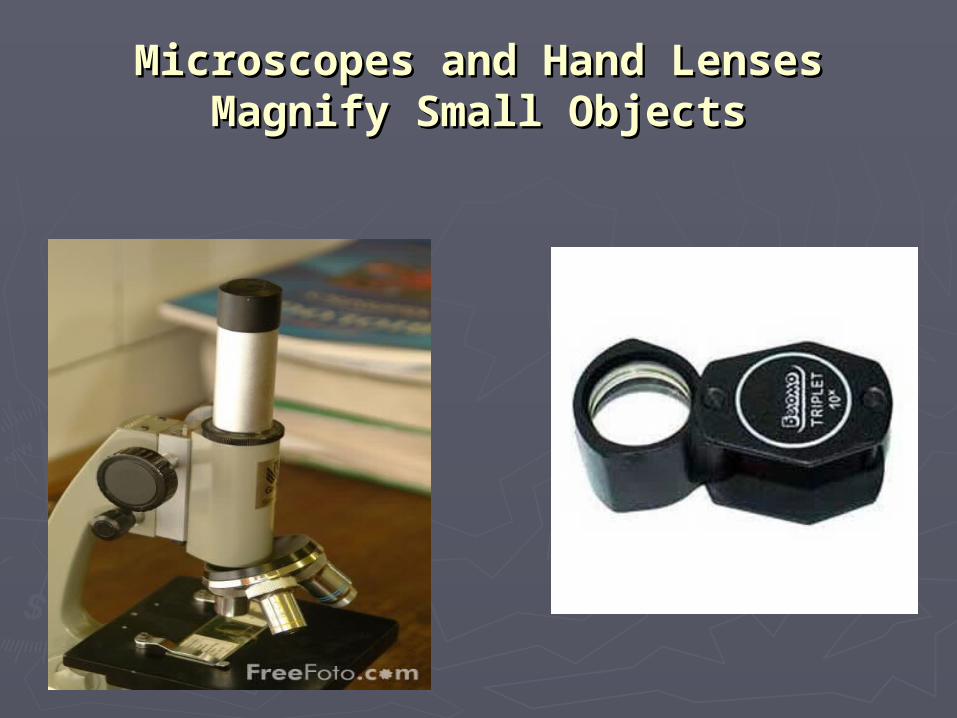
Microscopes and Hand LensesMicroscopes and Hand LensesMagnify Small ObjectsMagnify Small Objects
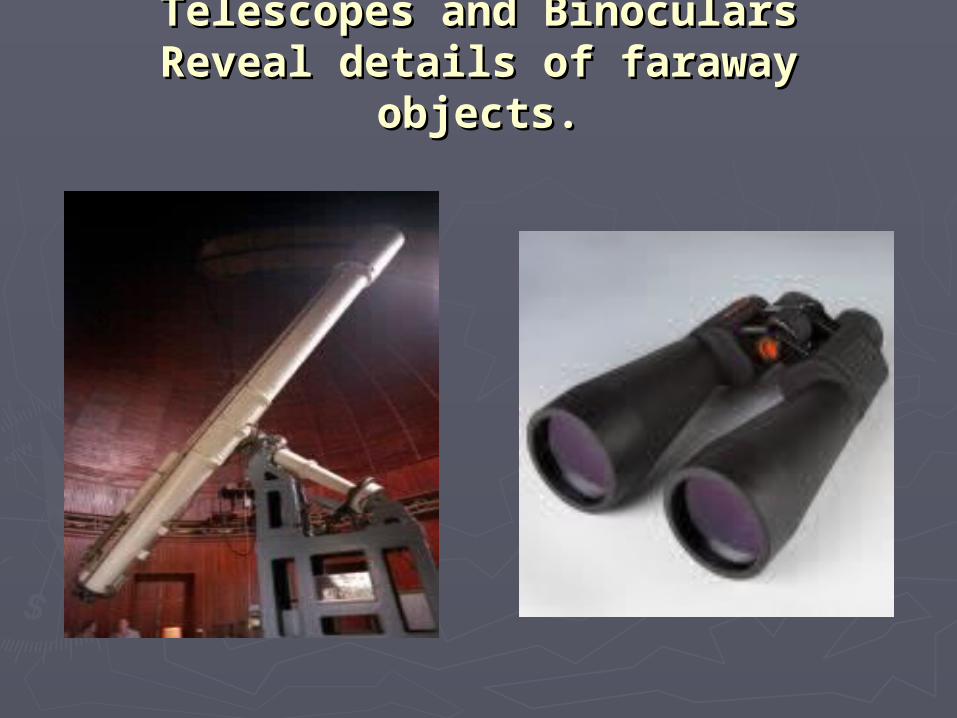
Telescopes and BinocularsTelescopes and BinocularsReveal details of faraway objects.Reveal details of faraway objects.
Calculators and ComputersCalculators and ComputersOrganize Data and Make Graphs.Organize Data and Make Graphs.
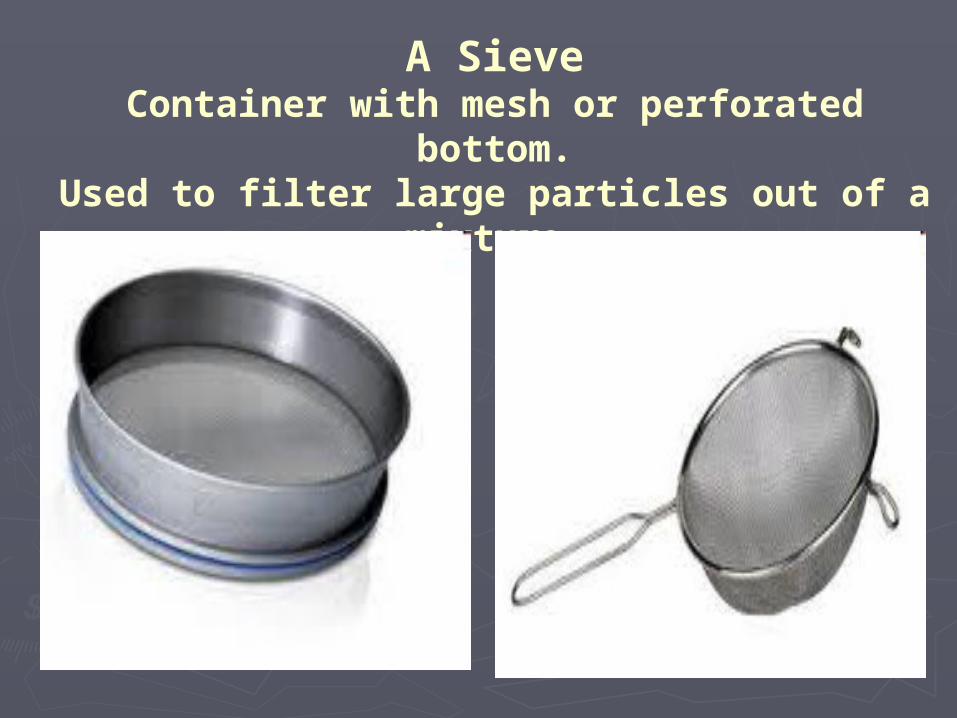
A SieveContainer with mesh or perforated
bottom.Used to filter large particles out of a
mixture.
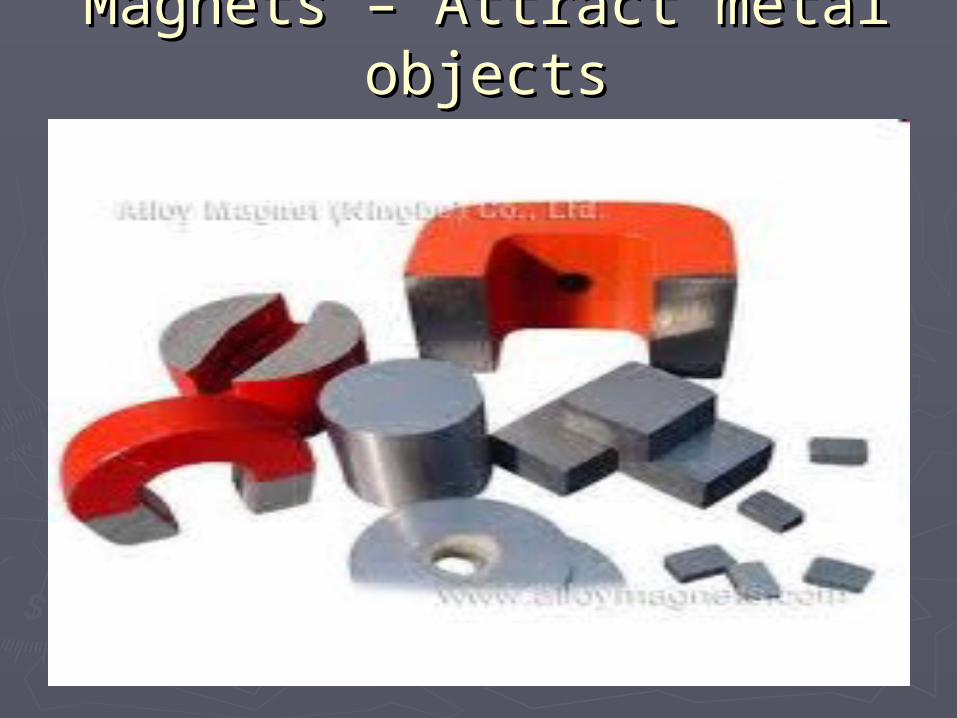
Magnets – Attract metal Magnets – Attract metal objectsobjects
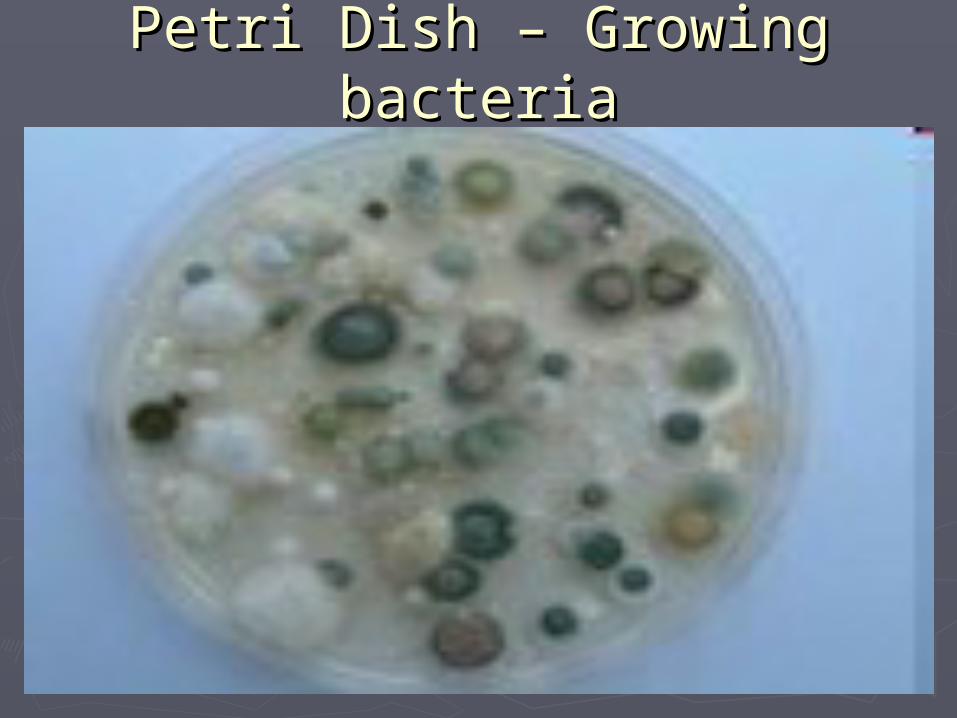
Petri Dish – Growing Petri Dish – Growing bacteriabacteria
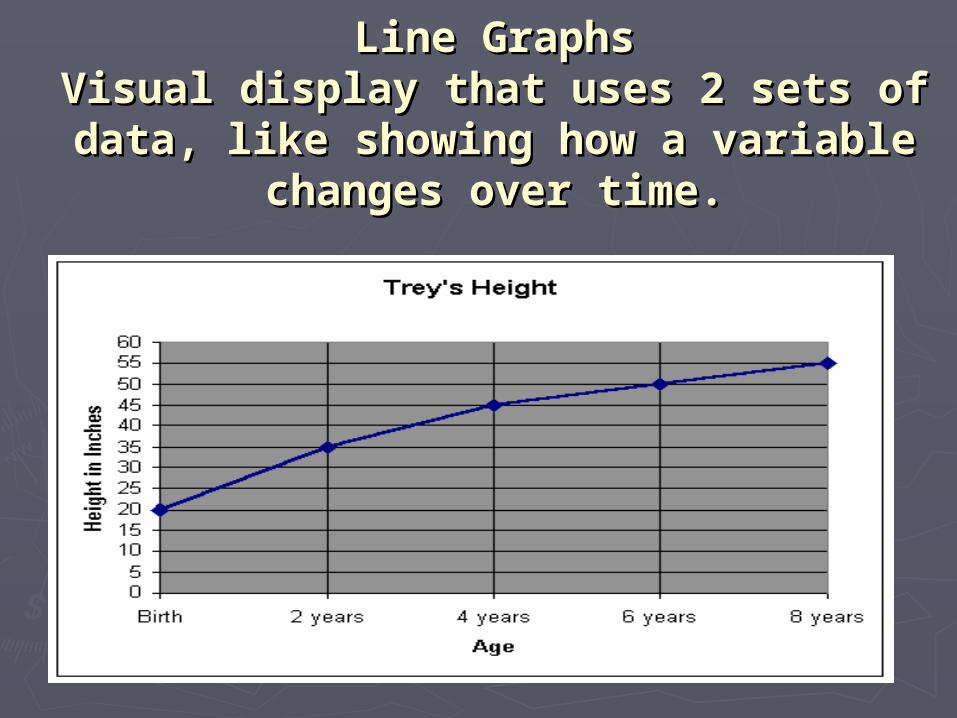
Line GraphsLine GraphsVisual display that uses 2 sets of Visual display that uses 2 sets of data, like showing how a variable data, like showing how a variable
changes over time.changes over time.
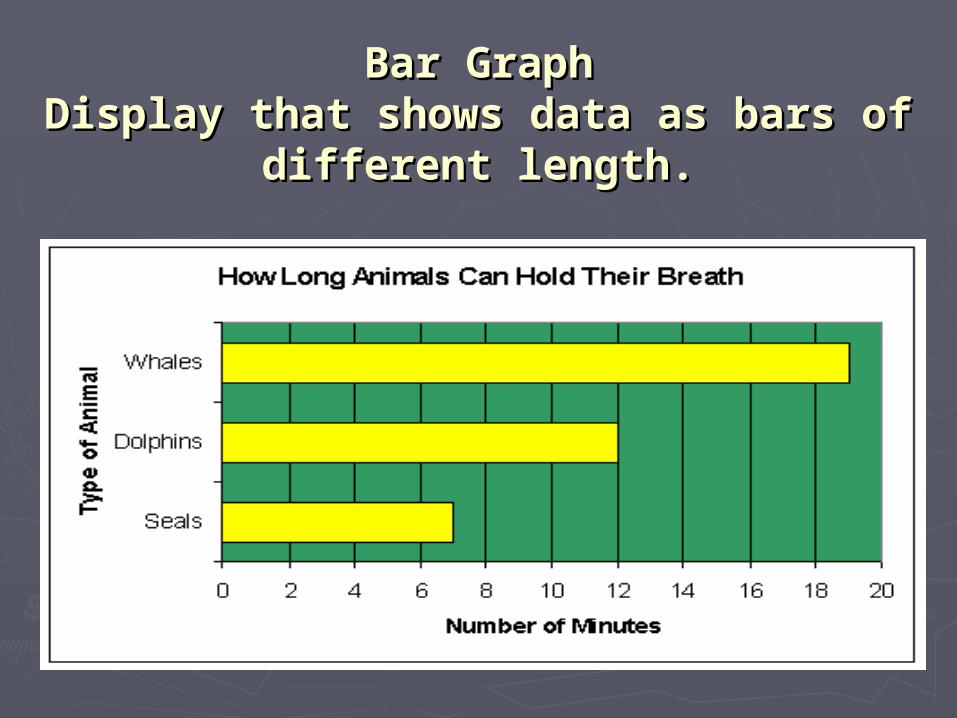
Bar GraphBar GraphDisplay that shows data as bars of Display that shows data as bars of
different length.different length.
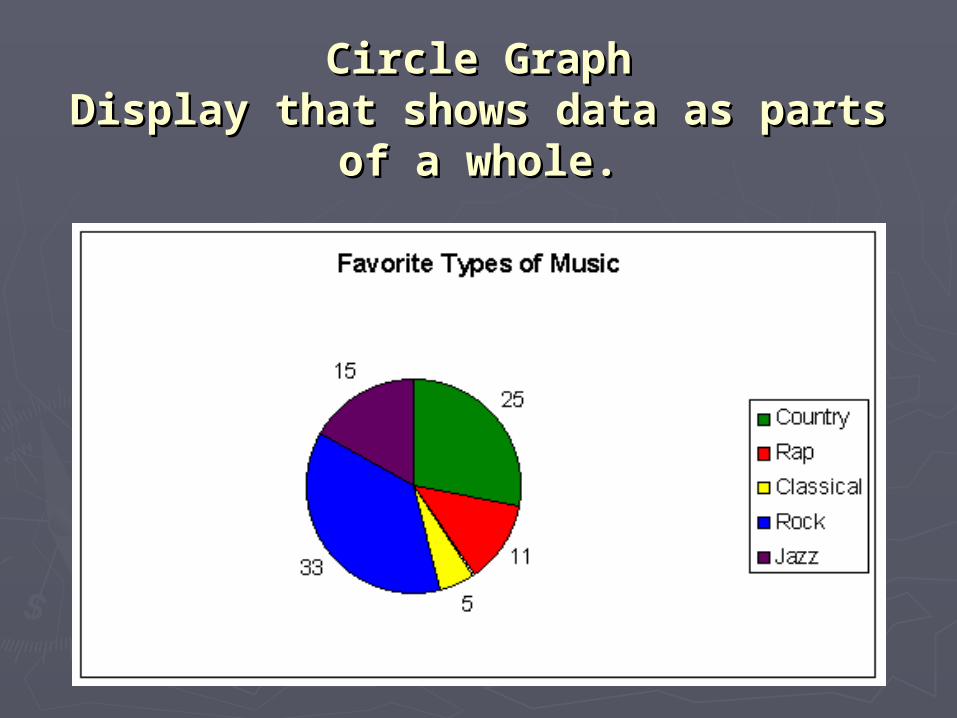
Circle GraphCircle GraphDisplay that shows data as parts of Display that shows data as parts of
a whole.a whole.
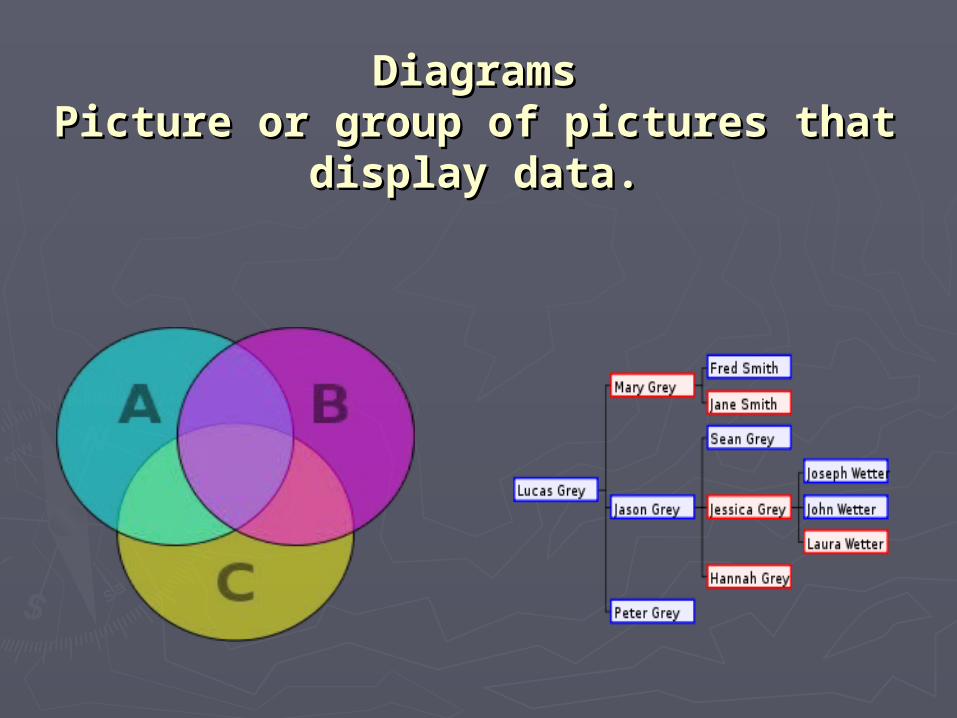
DiagramsDiagramsPicture or group of pictures that Picture or group of pictures that
display data.display data.
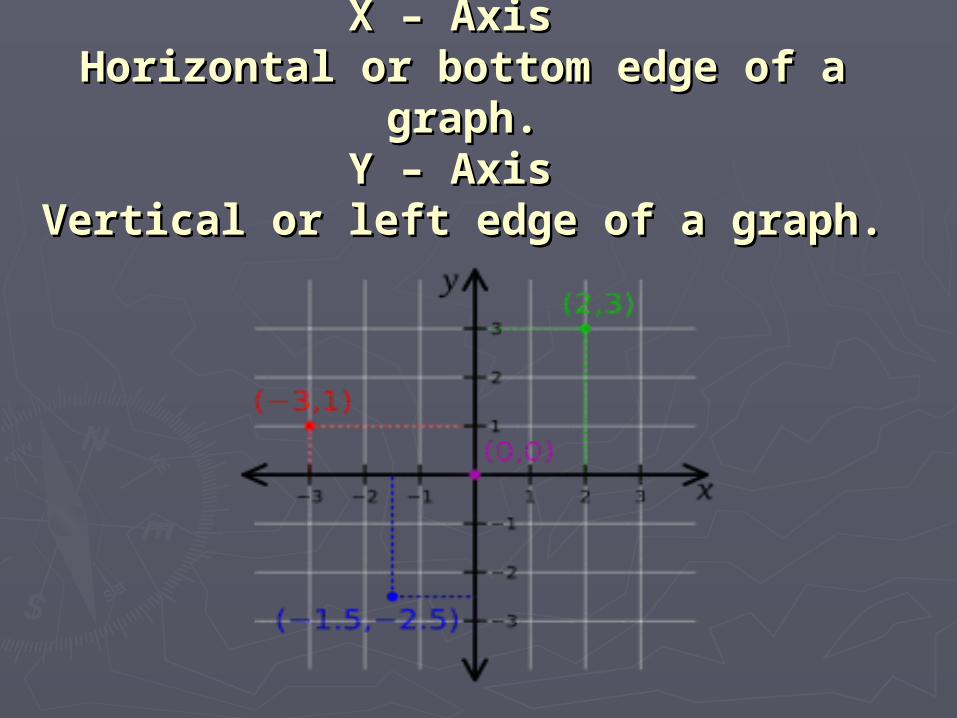
X – Axis X – Axis Horizontal or bottom edge of a Horizontal or bottom edge of a
graph.graph.Y – Axis Y – Axis
Vertical or left edge of a graph.Vertical or left edge of a graph.
PredictionPredictionA guess about what is likely to A guess about what is likely to
happen.happen.
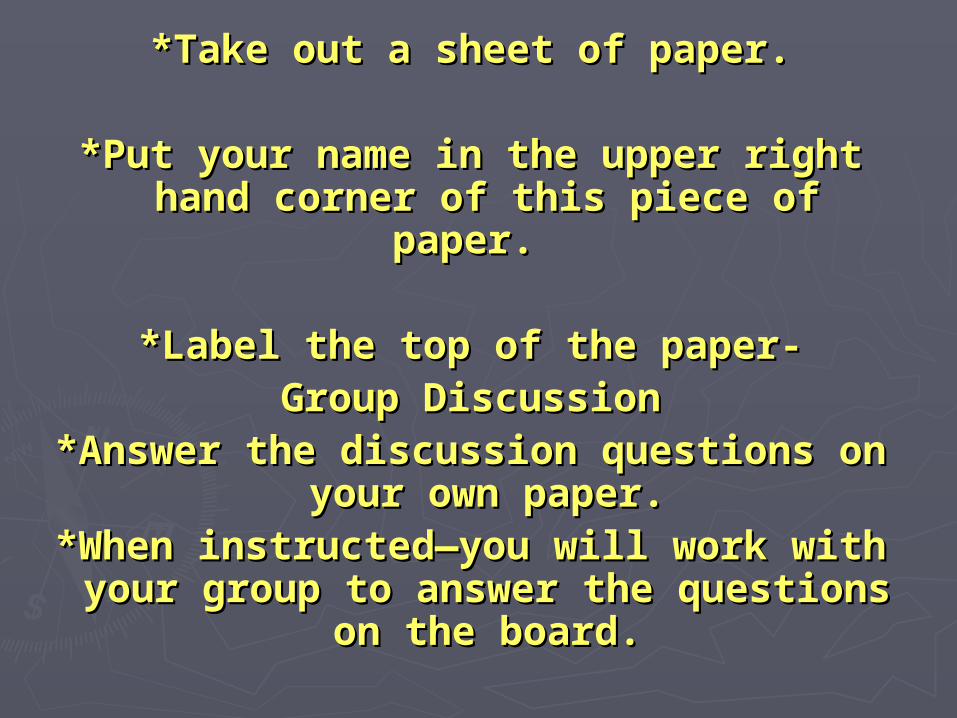
*Take out a sheet of paper.*Take out a sheet of paper.
*Put your name in the upper right *Put your name in the upper right hand corner of this piece of paper. hand corner of this piece of paper.
*Label the top of the paper-*Label the top of the paper-Group DiscussionGroup Discussion
*Answer the discussion questions on *Answer the discussion questions on your own paper.your own paper.
*When instructed—you will work *When instructed—you will work with your group to answer the with your group to answer the
questions on the board.questions on the board.
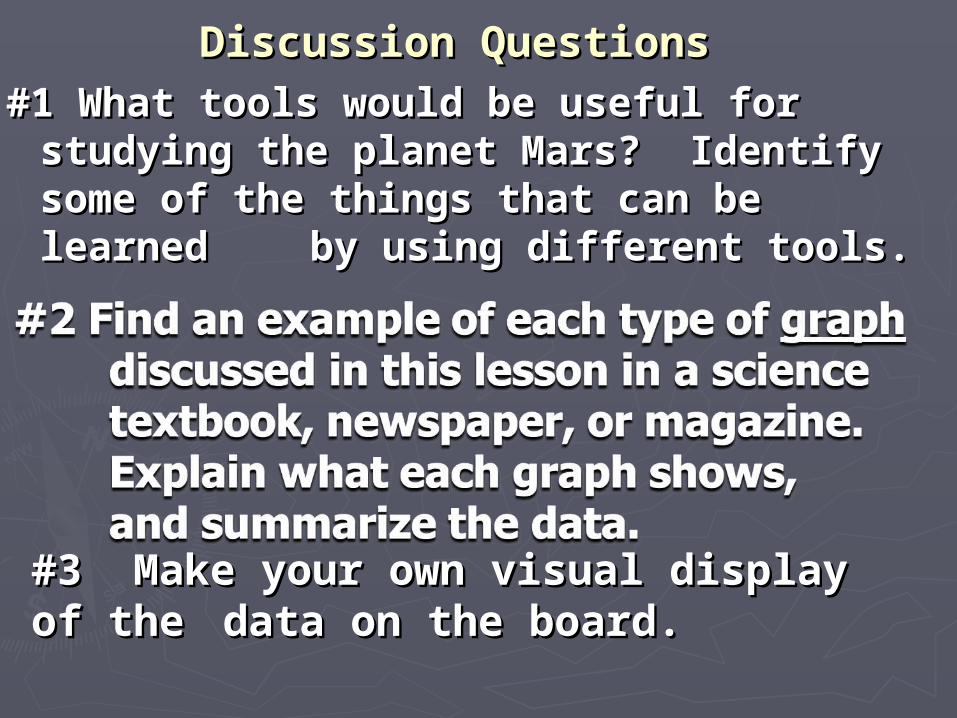
Discussion QuestionsDiscussion Questions
#1 What tools would be useful for #1 What tools would be useful for studying the planet Mars? Identify studying the planet Mars? Identify some of the things that can be some of the things that can be learned learned by using different tools.by using different tools.
#3 Make your own visual display of #3 Make your own visual display of the the data on the board.data on the board.
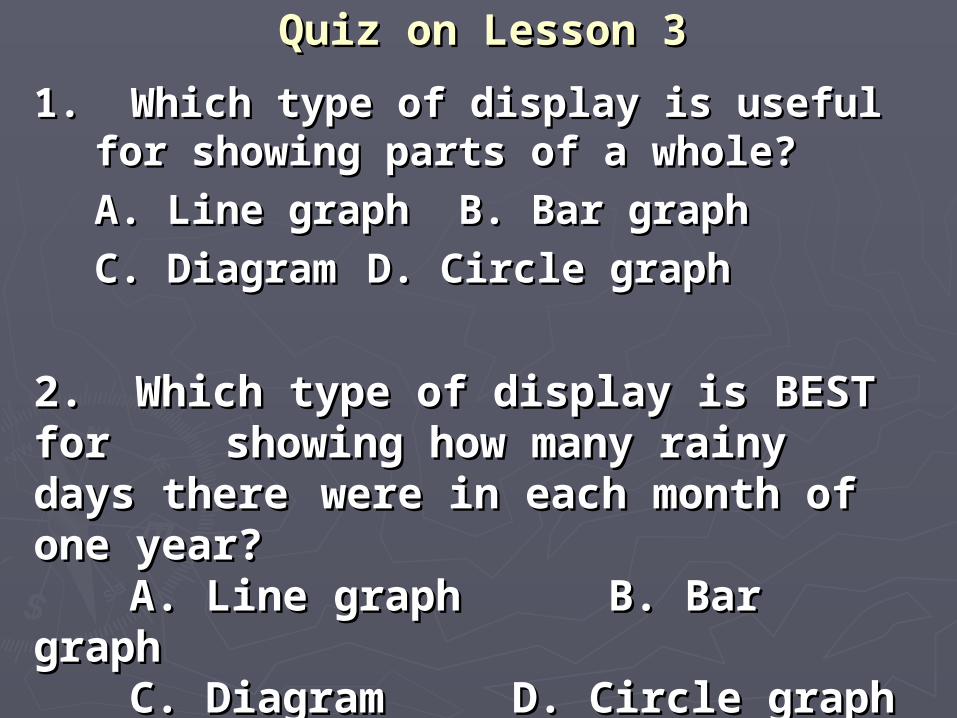
Quiz on Lesson 3Quiz on Lesson 3
1. Which type of display is useful 1. Which type of display is useful for showing parts of a whole?for showing parts of a whole?
A. Line graphA. Line graph B. Bar graphB. Bar graph
C. DiagramC. Diagram D. Circle graphD. Circle graph
2. Which type of display is BEST for 2. Which type of display is BEST for showing how many rainy days showing how many rainy days
there there were in each month of one were in each month of one year?year?
A. Line graphA. Line graph B. Bar B. Bar graphgraph
C. DiagramC. Diagram D. Circle graphD. Circle graph
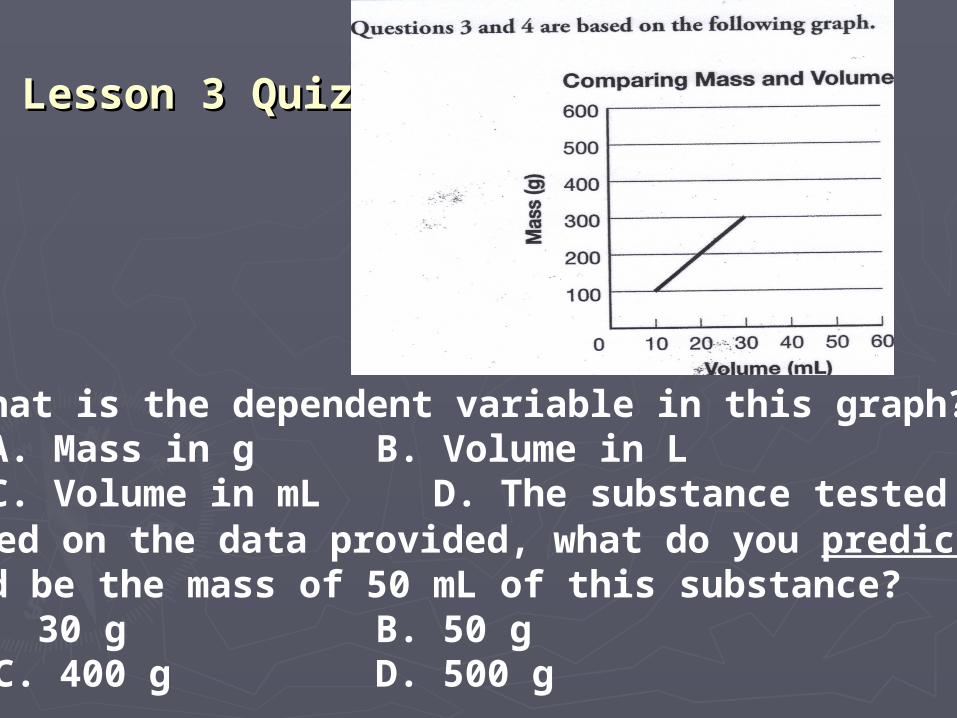
Lesson 3 QuizLesson 3 Quiz
3. What is the dependent variable in this graph? A. Mass in g B. Volume in L C. Volume in mL D. The substance tested
4. Based on the data provided, what do you predict would be the mass of 50 mL of this substance?
A. 30 g B. 50 gC. 400 g D. 500 g
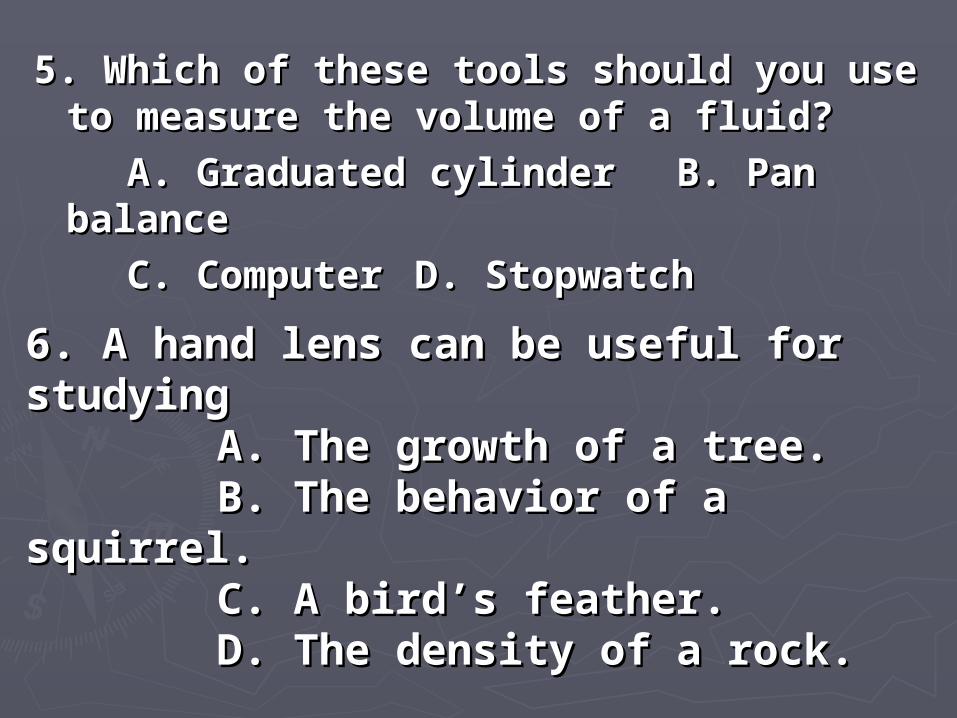
5. Which of these tools should you use to 5. Which of these tools should you use to measure the volume of a fluid?measure the volume of a fluid?
A. Graduated cylinderA. Graduated cylinder B. Pan balanceB. Pan balance
C. ComputerC. Computer D. StopwatchD. Stopwatch
6. A hand lens can be useful for 6. A hand lens can be useful for studying studying A. The growth of a tree.A. The growth of a tree. B. The behavior of a squirrel.B. The behavior of a squirrel. C. A bird’s feather.C. A bird’s feather. D. The density of a rock.D. The density of a rock.
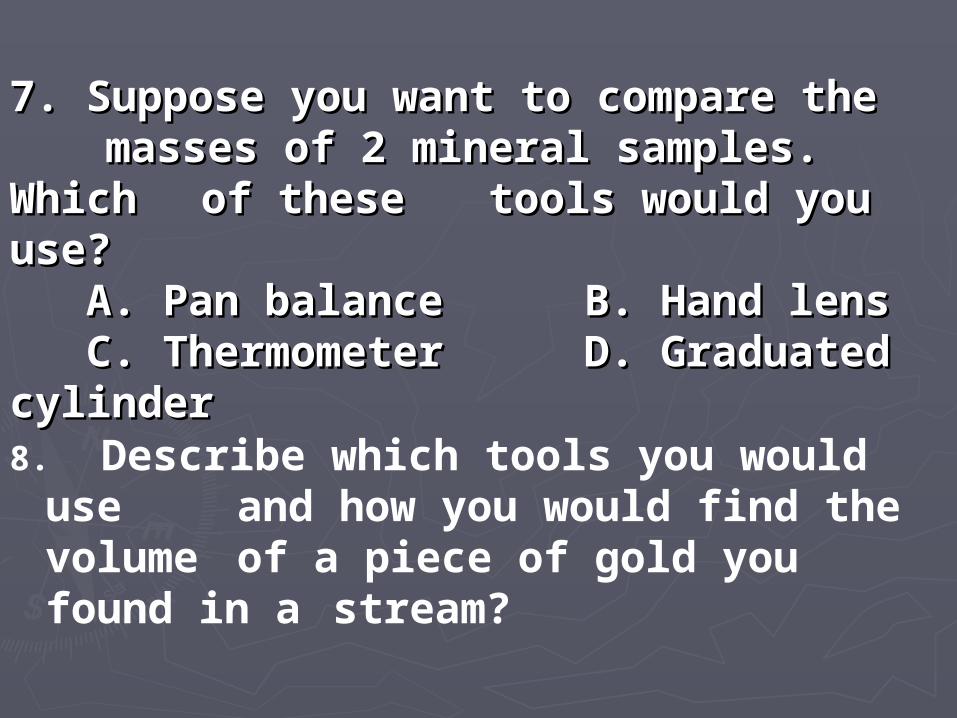
7. Suppose you want to compare the 7. Suppose you want to compare the masses of 2 mineral samples. masses of 2 mineral samples.
Which Which of these of these tools would you tools would you use?use? A. Pan balanceA. Pan balance B. Hand lensB. Hand lens C. ThermometerC. Thermometer D. Graduated D. Graduated cylindercylinder8. Describe which tools you would
use and how you would find the volume of a piece of gold you found in a stream?
9. The ________ is the horizontal 9. The ________ is the horizontal or bottom edge of the or bottom edge of the
graph.graph.10. Charts and graphs allow 10. Charts and graphs allow
scientists to visualize data. Using scientists to visualize data. Using these tools they can make these tools they can make ________________ about what will ________________ about what will happen in the future.happen in the future.
**Listen carefully to the extra credit—your mouth should not open and your eyes should be on your
own paper!!