Embed Size (px)
Citation preview

Course 1 • Chapter 11 Statistical Measures 137
NAME ________________________________________________ DATE ____________________ PERIOD ___________
Cop
yrig
ht ©
McG
raw
-Hill
Edu
catio
n. P
erm
issi
on is
gra
nted
to re
prod
uce
for c
lass
room
use
.Lesson 1 Multi-Step Problem Solving
Cha
pter
11
Multi-Step ExampleEdward’s family owns a tree farm, which is open every day of the week except Monday. Edward kept track of how many trees were sold each day for two weeks. How much greater was the mean number of trees for Week 2 than for Week 1? 6.SP.3, MP 1
Use a problem-solving model to solve this problem.
Analyze Read the problem. Circle the information you know.
Underline what the problem is asking you to find.
Plan What will you need to do to solve the problem? Write your plan in steps.
Step 1Step 1 Determine the mean for each week.
Step 2Step 2 Subtract to find how much greater the mean for Week 2 is than Week 1.
Solve Use your plan to solve the problem. Show your steps.
Week 1: 7 + 12 + 6 + 14 + 22 + 17 __ 6 �=
Week 2: 10 + 8 + 12 + 17 + 31 + 18 __ 6 �=
So, Week 2’s mean is 16 - 13 or trees greater.
Justify and Evaluate How do you know your solution is reasonable?
Week 1
Day Trees
Tuesday 7
Wednesday 12
Thursday 6
Friday 14
Saturday 22
Sunday 17
Week 2
Day Trees
Tuesday 10
Wednesday 8
Thursday 12
Friday 17
Saturday 31
Sunday 18
137-138_GM15_AFB1_C11L01_678290.indd 137 3/14/14 11:44 AM

Course 1 • Chapter 11 Statistical Measures138
NAME ________________________________________________ DATE ____________________ PERIOD ___________
Copyright ©
McG
raw-H
ill Education. Permission is granted to reproduce for classroom
use.Lesson 1 (continued)
Use a problem-solving model to solve each problem.
1 The dot plot shows how many minutes Mr. Elliot’s piano students said they practiced on the day before their lessons. Imala practiced 31 minutes but forgot to tell Mr. Elliot. If Imala’s time were included, by how much time (in minutes) would the mean increase? 6.SP.3, MP 1
1211 2117 18 19 2016151413
Minutes of Practice
2 The graph shows how many rides a group of friends went on at the fair. Each ride costs $2.75. What was the mean amount of money, in dollars, spent per person to go on the rides? 6.SP.3, MP 2
Rides Taken
Ride
sMa
ria Emir
Haley
Chey
enne
Dexte
r
Yoko
876543210
6
4
6
43
7
3 For Quon’s first six quizzes, he had a mean score of 33 points. After the seventh quiz, his mean score was 32 points. After the eighth quiz, the mean was 34. What was the difference in scores between his seventh and eighth quizzes? 6.SP.3, MP 8
4 H.O.T. Problem Create a list of 8 values with a mean of 26. Justify your response. 6.SP.3, MP 3
137-138_GM15_AFB1_C11L01_678290.indd 138 3/14/14 11:44 AM

Course 1 • Chapter 11 Statistical Measures 139
NAME ________________________________________________ DATE ____________________ PERIOD ___________
Cop
yrig
ht ©
McG
raw
-Hill
Edu
catio
n. P
erm
issi
on is
gra
nted
to re
prod
uce
for c
lass
room
use
.Lesson 2 Multi-Step Problem Solving
Cha
pter
11
Multi-Step ExampleFour students kept track of how long they did homework for five nights. For which student do the mean, median, and mode all have the same value? 6.SP.3, MP 1
A Emma C Peter
B Rosario D Susana
Use a problem-solving model to solve this problem.
Analyze Read the problem. Circle the information you know.
Underline what the problem is asking you to find.
Plan What will you need to do to solve the problem? Write your plan in steps.
Step 1Step 1 Determine the mean, median, and mode for each student.
Step 2Step 2 Compare the measures.
Solve Use your plan to solve the problem. Show your steps.
Mean Median Mode
Emma
Rosario
Peter
Susana
Since has all three measures the same, choice is correct. Fill in that answer choice.
Justify and Evaluate How do you know your solution is accurate?
Day Emma Rosario Peter Susana
1 1.25 1.25 1 0.75
2 0.75 2.25 1.75 2.5
3 1 1.5 1 1.5
4 1.25 2 0.5 0.75
5 2 0.75 1.5 2
139-140_GM15_AFB1_C11L02_678290.indd 139 3/14/14 11:44 AM

Course 1 • Chapter 11 Statistical Measures140
NAME ________________________________________________ DATE ____________________ PERIOD ___________
Copyright ©
McG
raw-H
ill Education. Permission is granted to reproduce for classroom
use.Lesson 2 (continued)
Use a problem-solving model to solve each problem.
1 Four drivers recorded the distance they drove each day for a week. Which driver’s data set has a mode that is greater than the mean or median AND a median with the lowest value of the three measures? 6.SP.3, MP 1
A Kadisha: 8, 17, 23, 16, 17, 18, 125
B Cole: 14, 26, 34, 22, 47, 22, 45
C Fabian: 7, 12, 11, 23, 13, 23, 30
D Lina: 52, 36, 41, 31, 31, 37, 59
2 The graph shows the number of cell phones per 100 people in certain countries. How much would the difference between the median and the mode change if Finland were not included in the data? 6.SP.5, MP 7
Cell Phones per 100 People
Num
ber o
f Pho
nes
Brazil
Denmark
Canada
Finland
Germany
France
United
States
Greece
Iceland
Ukraine
United
Kingdom
200
140160180
120100806040200
Countries
123
75
126
166
105132
106
106123
131
106
3 What is the difference between the medians of Kendra’s sprint times and Hakim’s sprint times? 6.SP.5, MP 2
Kendra’s Sprint Times (seconds)
12 14 11 13
15 13 15 14
11 14 17 12
Hakim’s Sprint Times (seconds)
11 11 15 13
14 16 15 14
13 15 12 16
4 H.O.T. Problem For which data set is the median a better predictor of the rest of the data than the mode? Explain your answer. 6.SP.5b, MP 3
2524 3630 31 32 33 34 3529282726
Miles per Gallon
Game Scores
Gam
e
8
50 1510 20 25
7654321
139-140_GM15_AFB1_C11L02_678290.indd 140 3/14/14 11:44 AM

Course 1 • Chapter 11 Statistical Measures 141
NAME ________________________________________________ DATE ____________________ PERIOD ___________
Cop
yrig
ht ©
McG
raw
-Hill
Edu
catio
n. P
erm
issi
on is
gra
nted
to re
prod
uce
for c
lass
room
use
.Lesson 3 Multi-Step Problem Solving
Cha
pter
11
Multi-Step ExampleCarmen and Noah are running for president of the middle school student government. Votes are counted by classroom. What is the difference between the interquartile ranges for the two candidates? 6.SP.3, MP 1
Use a problem-solving model to solve this problem.
Analyze Read the problem. Circle the information you know.
Underline what the problem is asking you to find.
Plan What will you need to do to solve the problem? Write your
plan in steps.Step 1Step 1 Order the values for each person from least to greatest.
Step 2Step 2 Determine the IQR for each data set.
Step 3Step 3 Subtract to find the difference.
Solve Use your plan to solve the problem. Show your steps.
Carmen: 2, 6, 8, 12, 12, 14, 18, 20 IQR:
Noah: 6, 7, 8, 9, 12, 13, 17, 18 IQR:
The difference between the interquartile ranges is .
Justify and Evaluate How do you know your solution is reasonable?
Voting Results
Room Number
Number of Votes Room Number
Number of Votes
Carmen Noah Carmen Noah
1 12 9 5 8 17
2 6 18 6 2 13
3 14 8 7 18 7
4 20 6 8 12 12
141-142_GM15_AFB1_C11L03_678290.indd 141 3/14/14 11:44 AM

Course 1 • Chapter 11 Statistical Measures142
NAME ________________________________________________ DATE ____________________ PERIOD ___________
Copyright ©
McG
raw-H
ill Education. Permission is granted to reproduce for classroom
use.Lesson 3 (continued)
Use a problem-solving model to solve each problem.
1 Melissa is keeping track of the temperature in her town at noon each day. She has recorded the temperature for six days so far. How much greater will the interquartile range be if Saturday’s temperature is 70°F than if it is 58°F? 6.SP.3, MP 1
Temperature at Noon
Day Temperature (°F)
Sunday 64
Monday 72
Tuesday 58
Wednesday 54
Thursday 60
Friday 62
Saturday ?
2 Jamal cut out these shapes from construction paper. What is the interquartile range for the areas of the shapes? 6.SP.3, MP 7
5 cm
1 cm
6 cm
2 cm
3 cm
3 cm4 cm
2 cm
3 Tamiko is training for a bicycle race. She made a graph of the number of miles she rode each week for 6 weeks. If the median at Week 7 increases by 1.5, how many miles did she ride in Week 7? 6.SP.5, MP 7
Bicycle Riding
Mile
s
Wee
k 1W
eek 2
Wee
k 3
Wee
k 5
Wee
k 4
Wee
k 6
50
354045
302520151050
Weeks
3540
27
3831
43
4 H.O.T. Problem Describe the measures of spread for the data set. Change the data set by adding an outlier. Describe the new measures of spread. 6.SP.5c, MP 3
1,124 465
650 976
840 711
712 925
141-142_GM15_AFB1_C11L03_678290.indd 142 3/14/14 11:44 AM
Course 1 • Chapter 11 Statistical Measures 143
NAME ________________________________________________ DATE ____________________ PERIOD ___________
Cop
yrig
ht ©
McG
raw
-Hill
Edu
catio
n. P
erm
issi
on is
gra
nted
to re
prod
uce
for c
lass
room
use
.Lesson 4 Multi-Step Problem Solving
Cha
pter
11
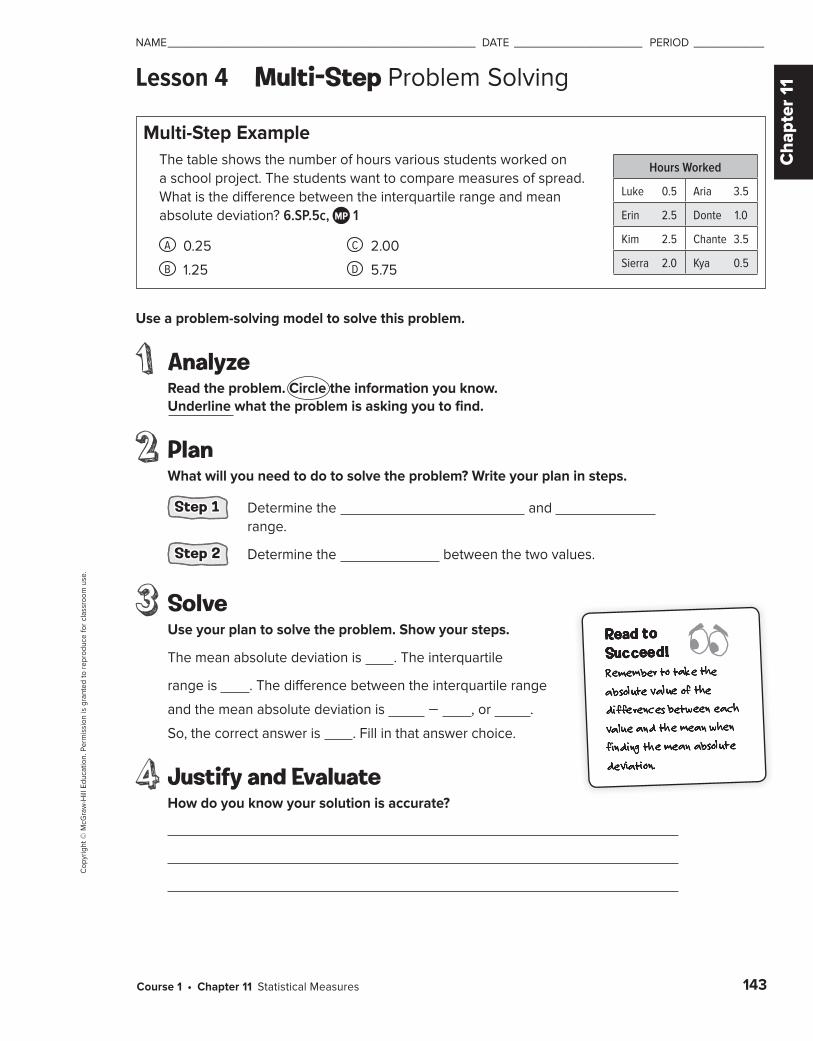
Multi-Step ExampleThe table shows the number of hours various students worked on a school project. The students want to compare measures of spread. What is the difference between the interquartile range and mean absolute deviation? 6.SP.5c, MP 1
A 0.25 C 2.00
B 1.25 D 5.75
Use a problem-solving model to solve this problem.
Analyze Read the problem. Circle the information you know.
Underline what the problem is asking you to find.
Plan What will you need to do to solve the problem? Write your plan in steps.
Step 1Step 1 Determine the and range.
Step 2Step 2 Determine the between the two values.
Solve Use your plan to solve the problem. Show your steps.
The mean absolute deviation is . The interquartile
range is . The difference between the interquartile range
and the mean absolute deviation is - , or .
So, the correct answer is . Fill in that answer choice.
Justify and Evaluate How do you know your solution is accurate?
Hours Worked
Luke 0.5 Aria 3.5
Erin 2.5 Donte 1.0
Kim 2.5 Chante 3.5
Sierra 2.0 Kya 0.5
143-144_GM15_AFB1_C11L04_678290.indd 143 3/14/14 11:45 AM

Course 1 • Chapter 11 Statistical Measures144
NAME ________________________________________________ DATE ____________________ PERIOD ___________
Copyright ©
McG
raw-H
ill Education. Permission is granted to reproduce for classroom
use.Lesson 4 (continued)
Use a problem-solving model to solve each problem.
1 The table shows the quiz scores of various students. The students want to compare the measures of spread. What is the difference between the interquartile range and mean absolute deviation? 6.SP.5c, MP 1
Quiz Scores
95 100 50 75 60
100 100 60 100 60
A 20
B 21
C 31
D 40
2 Eight students were asked how many persons live in their home. The results of the survey are shown in the line plot. What is the mean absolute deviation of the data? 6.SP.5c, MP 2
0 2 4 6 8
×
×
×
×
×
×
× ×
3 Some students were asked how much they spent on their last trip to the mall. The results of the survey are shown in the stem-and-leaf plot. What is the mean absolute deviation of the data? 6.SP.5c, MP 7
Money Spent at Mall
Stem Leaf
0 6
1 5 9
2 0 5 5
3 0 5 5
4 0
1 5 = $15
4 H.O.T. Problem The mean number of points scored by eight players in a basketball game is 6. Use the table to determine mean absolute deviation of the data. Justify your answer. 6.SP.5b, MP 3
Points Scored
Abdi 4 Benito 4
Noah 0 Wen 10
Felix 0 Delon ��8
Tyler 2 Sean ?
143-144_GM15_AFB1_C11L04_678290.indd 144 3/14/14 11:45 AM
Course 1 • Chapter 11 Statistical Measures 145
NAME ________________________________________________ DATE ____________________ PERIOD ___________
Cop
yrig
ht ©
McG
raw
-Hill
Edu
catio
n. P
erm
issi
on is
gra
nted
to re
prod
uce
for c
lass
room
use
.Lesson 5 Multi-Step Problem Solving
Cha
pter
11
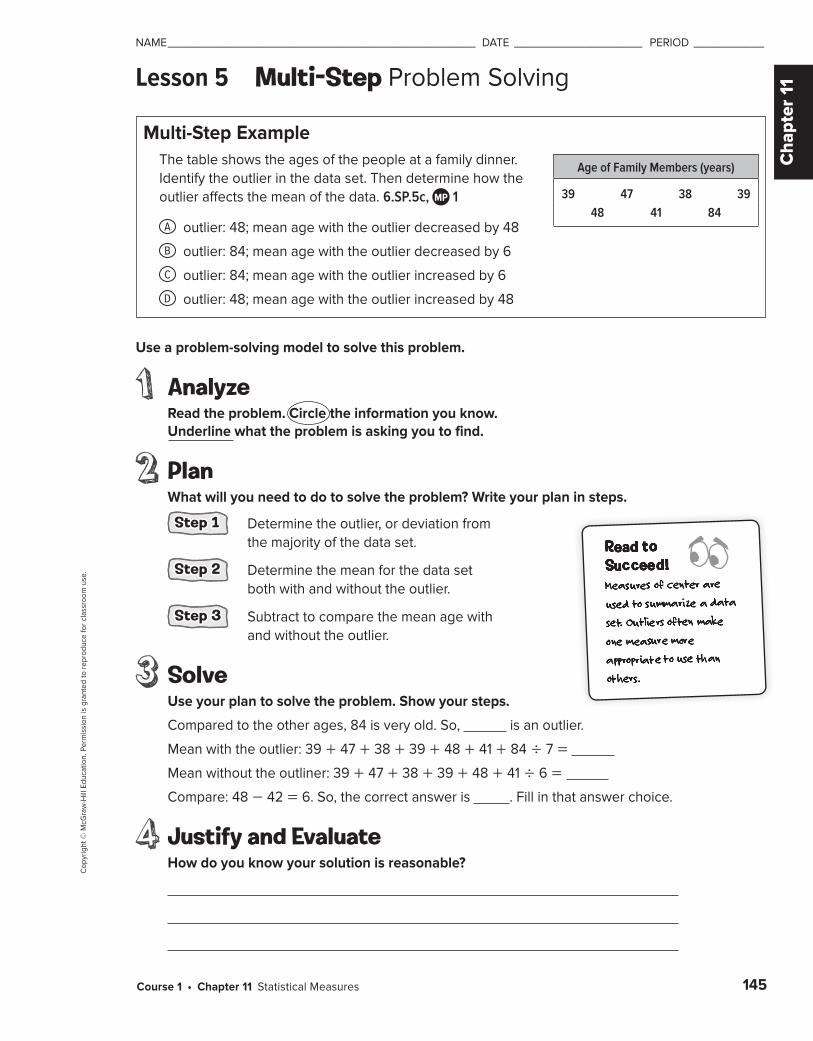
Multi-Step ExampleThe table shows the ages of the people at a family dinner. Identify the outlier in the data set. Then determine how the outlier affects the mean of the data. 6.SP.5c, MP 1
A outlier: 48; mean age with the outlier decreased by 48
B outlier: 84; mean age with the outlier decreased by 6
C outlier: 84; mean age with the outlier increased by 6
D outlier: 48; mean age with the outlier increased by 48
Use a problem-solving model to solve this problem.
Analyze Read the problem. Circle the information you know.
Underline what the problem is asking you to find.
Plan What will you need to do to solve the problem? Write your plan in steps.
Step 1Step 1 Determine the outlier, or deviation from the majority of the data set.
Step 2Step 2 Determine the mean for the data set both with and without the outlier.
Step 3Step 3 Subtract to compare the mean age with and without the outlier.
Solve Use your plan to solve the problem. Show your steps.
Compared to the other ages, 84 is very old. So, is an outlier.
Mean with the outlier: 39 + 47 + 38 + 39 + 48 + 41 + 84 ÷ 7 =
Mean without the outliner: 39 + 47 + 38 + 39 + 48 + 41 ÷ 6 =
Compare: 48 - 42 = 6. So, the correct answer is . Fill in that answer choice.
Justify and Evaluate How do you know your solution is reasonable?
Age of Family Members (years)
39 47 38 3948 41 84
145-146_GM15_AFB1_C11L05_678290.indd 145 3/14/14 11:45 AM

Course 1 • Chapter 11 Statistical Measures146
NAME ________________________________________________ DATE ____________________ PERIOD ___________
Copyright ©
McG
raw-H
ill Education. Permission is granted to reproduce for classroom
use.Lesson 5 (continued)
Use a problem-solving model to solve each problem.
1 The table shows the weekly deposits Malcolm made in his savings account. Identify the outlier in the data set. Then determine how the outlier affects the mean of the data. 6.SP.5c, MP 1
Deposits in Savings Account ($)
41 28 26 11 3241 38 26 36
A outlier: 41; mean with the outlier increased by 2.5
B outlier: 11; mean with the outlier increased by 2.5
C outlier: 41; mean with the outlier decreased by 2.5
D outlier: 11; mean with the outlier decreased by 2.5
2 The scores Miriam received on the science tests are 95, 80, 95, 85, 45, 95, 75, 85, and 90. Identify the outlier in the data set. Determine the mean, median, and mode without the outlier. Then tell which measure of center best describes the data without the outlier. 6.SP.5d, MP 7
3 List eight data values for which the median is the best measure of center for the data set. Explain. 6.SP.5d, MP 3
4 H.O.T. Problem The table shows the lengths of some rivers in the United States. Identify the outlier. Find the measures of center with and without the outlier. Tell which measure of center best describes the data with and without the outlier. 6.SP.5c, MP 3
River Length (mi)
Columbia 1,243
Mississippi 2,340
Ohio-Allegheny 1,310
Peace 1,210
Red 1,290
145-146_GM15_AFB1_C11L05_678290.indd 146 3/14/14 11:45 AM