Embed Size (px)
Citation preview

Lesson #1: Introducing Earthquakes
Introduction-
Did you know that during recorded history, more than 13 million people have died
as a result of earthquakes and that about 1 million of those deaths occurred in the
20th century? In one earthquake alone in Turkey in 1999, more than 17,000 people
were killed. And, when an earthquake generates a tsunami, the death toll can be
even more disastrous. On December 26, 2004, nearly 300,000 people tragically lost
their lives in the tsunami that was generated by the Great Sumatra-Andaman
earthquake.
In this lesson, you will begin a series of inquiries on earthquakes. You will
examine where earthquakes occur most often, and you will use this information to
learn more about the earth and why earthquakes happen. What are the greatest
risks that individuals face from earthquakes? How might scientists better predict
earthquakes? What can society do to reduce the loss of life and property that results
from earthquake damage. Let’s find out.
What is an Earthquake?
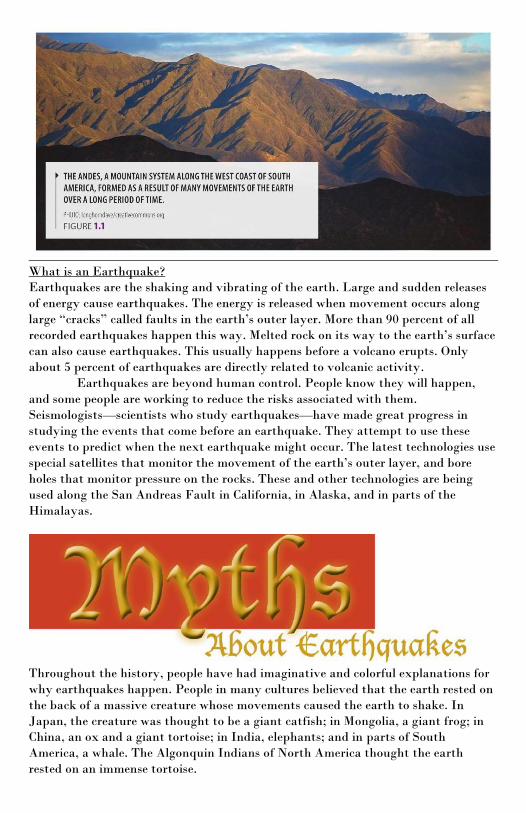
Earthquakes are the shaking and vibrating of the earth. Large and sudden releases
of energy cause earthquakes. The energy is released when movement occurs along
large “cracks” called faults in the earth’s outer layer. More than 90 percent of all
recorded earthquakes happen this way. Melted rock on its way to the earth’s surface
can also cause earthquakes. This usually happens before a volcano erupts. Only
about 5 percent of earthquakes are directly related to volcanic activity.
Earthquakes are beyond human control. People know they will happen,
and some people are working to reduce the risks associated with them.
Seismologists—scientists who study earthquakes—have made great progress in
studying the events that come before an earthquake. They attempt to use these
events to predict when the next earthquake might occur. The latest technologies use
special satellites that monitor the movement of the earth’s outer layer, and bore
holes that monitor pressure on the rocks. These and other technologies are being
used along the San Andreas Fault in California, in Alaska, and in parts of the
Himalayas.
Throughout the history, people have had imaginative and colorful explanations for
why earthquakes happen. People in many cultures believed that the earth rested on
the back of a massive creature whose movements caused the earth to shake. In
Japan, the creature was thought to be a giant catfish; in Mongolia, a giant frog; in
China, an ox and a giant tortoise; in India, elephants; and in parts of South
America, a whale. The Algonquin Indians of North America thought the earth
rested on an immense tortoise.

The people of Siberia, in northern Russia, thought a god called Tuli had a
sled so big that it held the earth. They imagined that giant dogs pulled the sled. The
dogs had fleas, and when they stopped to scratch, they shook the sled and its
cargo—the earth.
Famous writers and philosophers have sometimes tried to explain
earthquakes. For example, the English playwright Shakespeare wrote, “The earth
did shake when I was born” (Henry IV, Part I). The Greek philosopher Aristotle
gave a natural explanation for earthquakes. He thought that atmospheric winds
were drawn into the earth’s interior. These winds caused fires that swept through
underground cavities trying to escape.
In the 1700s, many people believed that earthquakes were a punishment or
a warning for those who were not sorry for wrongs they had done. This view was
strongly reinforced by the great earthquake that occurred in Lisbon, Portugal, on
November 1, 1755. It was All Saints’ Day, a holy day, when many people were
attending church services. The earthquake was so strong that buildings shook all
over Europe. Chandeliers rattled even in parts of the United States. Approximately
70,000 people were killed, mostly from aftershocks (earthquakes that happen after a
main earthquake). Buildings collapsed, and a giant sea wave destroyed waterfront
areas in Lisbon. Fires burned throughout the city.
Today, most people know that natural events within the earth cause
earthquakes. Still, people all over the world fear and wonder about these vibrations.
Folklore and legend helped explain these strange and frightful events to people of
the past. Technology provides the scientific “stories” that help us understand
earthquakes today.
Discussion Questions
1. Why should we believe that scientific “stories” hold more truth than stories about
a giant catfish shaking the earth?
2. Do you believe there will be more earthquakes in the world? Explain your
reasoning.
Lesson #2: When the Earth Shakes

Introduction-
An earthquake occurs when a piece of the earth’s crust moves suddenly. This
releases a huge amount of energy. The effect of this sudden release of energy is felt
later as an earthquake at places hundreds or even thousands of miles away. How
does the energy released by this sudden movement make the earth quake at places
far away? In this lesson, you will investigate this question. You will also investigate
how earthquakes can cause major damage to buildings and other structures, and
read about how buildings can be made to withstand the destructive forces of
earthquakes.
Earthquake Waves and The Transfer of Energy-
When a piece of the earth shifts suddenly, earthquake waves move out in all
directions, just like sound moves out in all directions when a bell is rung. In fact, a
P-wave is just like a sound wave. It pushes particles in the earth closer together and
then stretches them apart. That is why we call it a “push-and-pull” wave. Another
type of earthquake wave, an S-wave, moves particles in the earth’s crust from side
to side in a direction perpendicular to the direction of the wave energy. That is why
we call it a “side-to-side” wave. In both cases, the energy released by the sudden
movement of a piece of the earth’s crust moves through the earth’s particles,
shaking them. But when the wave has passed, the particles come to rest back in
their original positions, just as the pieces of tape returned to their original positions
in your spring model. This happens because energy simply moves through matter,
transferred by waves. We call this a transfer of energy. During an earthquake,
things on the earth’s surface, such as fence posts, trees, and buildings move up and
down or sway side to side. Once the earthquake waves have stopped, the fence posts,
trees, ad buildings all come to rest in their original positions, unless they have been
damaged by the energy in the waves.
“Earthquakes don’t kill people. Buildings do.” Have you heard that saying? It’s
true that one of the greatest risks during an earthquake is personal injury from
falling debris. What’s more, the most populated regions of the world are also places
where earthquakes occur most often.
This has happened mainly because many large cities were built long ago in
coastal regions near waterways used for shipping. Not until the 1920s did scientists
realize that some of these beautiful coastal areas are also the most prone to
earthquakes.
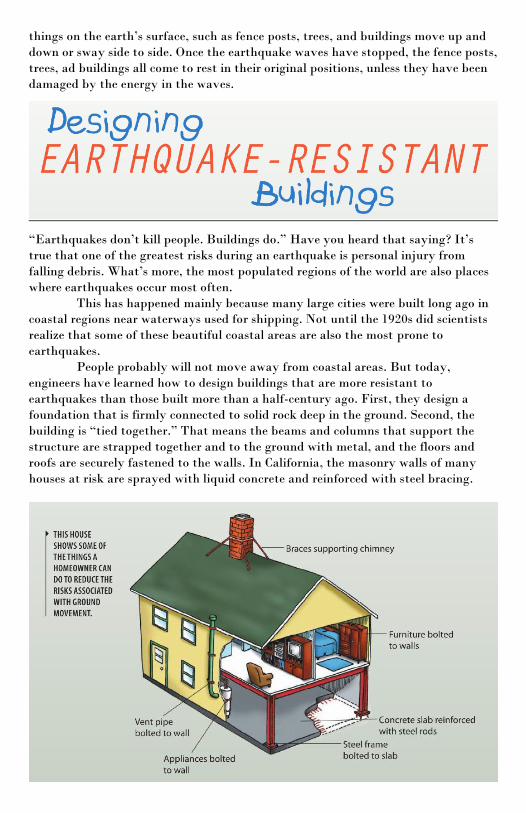
People probably will not move away from coastal areas. But today,
engineers have learned how to design buildings that are more resistant to
earthquakes than those built more than a half-century ago. First, they design a
foundation that is firmly connected to solid rock deep in the ground. Second, the
building is “tied together.” That means the beams and columns that support the
structure are strapped together and to the ground with metal, and the floors and
roofs are securely fastened to the walls. In California, the masonry walls of many
houses at risk are sprayed with liquid concrete and reinforced with steel bracing.
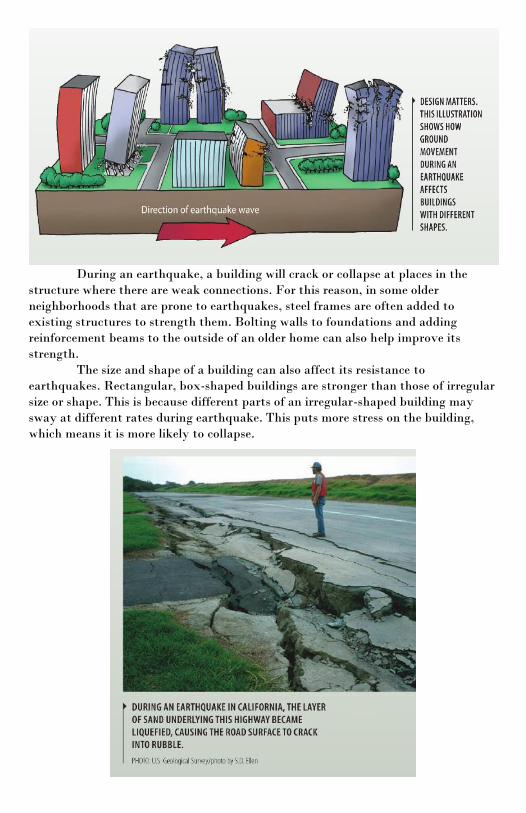
During an earthquake, a building will crack or collapse at places in the
structure where there are weak connections. For this reason, in some older
neighborhoods that are prone to earthquakes, steel frames are often added to
existing structures to strength them. Bolting walls to foundations and adding
reinforcement beams to the outside of an older home can also help improve its
strength.
The size and shape of a building can also affect its resistance to
earthquakes. Rectangular, box-shaped buildings are stronger than those of irregular
size or shape. This is because different parts of an irregular-shaped building may
sway at different rates during earthquake. This puts more stress on the building,
which means it is more likely to collapse.
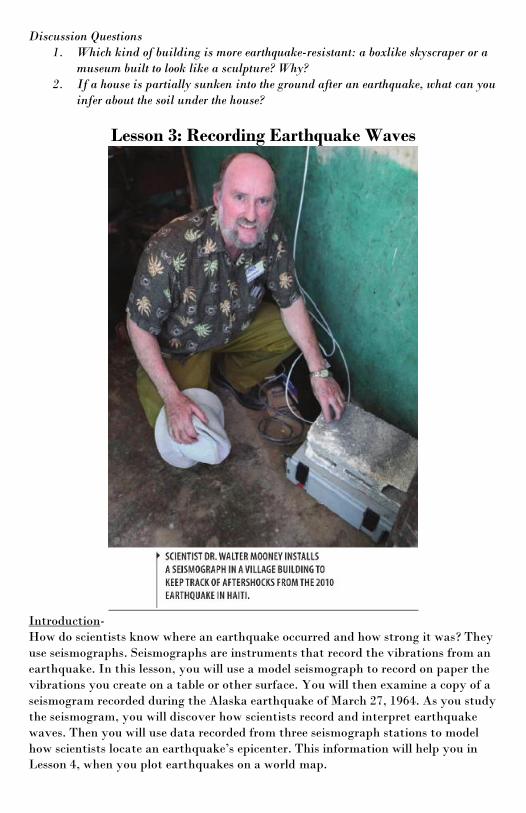
Buildings with open or unsupported first stories are most likely to be
damaged during an earthquake. Tall buildings such as skyscrapers must be designed
so that a certain amount of swaying or “flexing” can occur, but not so much that
they could touch neighboring buildings. A tall building that does not sway slightly
will crack and collapse. This is because the stress forces from the earthquakes get
stronger as they move up the building.
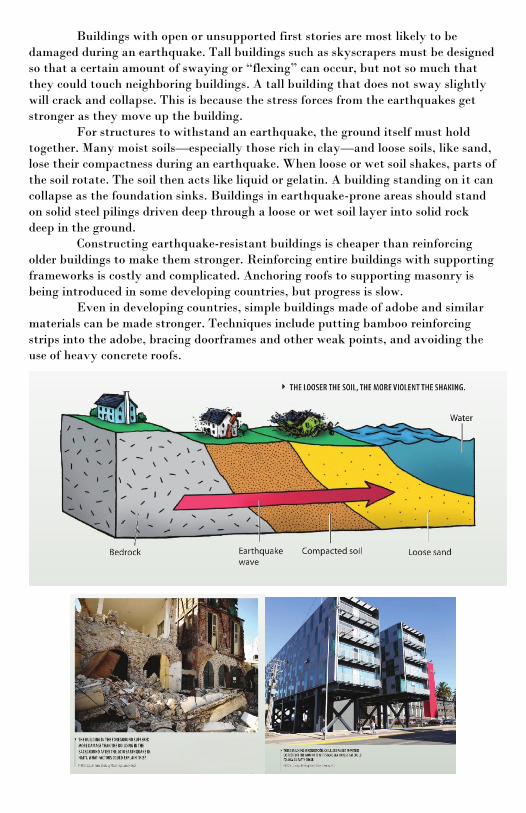
For structures to withstand an earthquake, the ground itself must hold
together. Many moist soils—especially those rich in clay—and loose soils, like sand,
lose their compactness during an earthquake. When loose or wet soil shakes, parts of
the soil rotate. The soil then acts like liquid or gelatin. A building standing on it can
collapse as the foundation sinks. Buildings in earthquake-prone areas should stand
on solid steel pilings driven deep through a loose or wet soil layer into solid rock
deep in the ground.
Constructing earthquake-resistant buildings is cheaper than reinforcing
older buildings to make them stronger. Reinforcing entire buildings with supporting
frameworks is costly and complicated. Anchoring roofs to supporting masonry is
being introduced in some developing countries, but progress is slow.
Even in developing countries, simple buildings made of adobe and similar
materials can be made stronger. Techniques include putting bamboo reinforcing
strips into the adobe, bracing doorframes and other weak points, and avoiding the
use of heavy concrete roofs.
Discussion Questions
1. Which kind of building is more earthquake-resistant: a boxlike skyscraper or a
museum built to look like a sculpture? Why?
2. If a house is partially sunken into the ground after an earthquake, what can you
infer about the soil under the house?
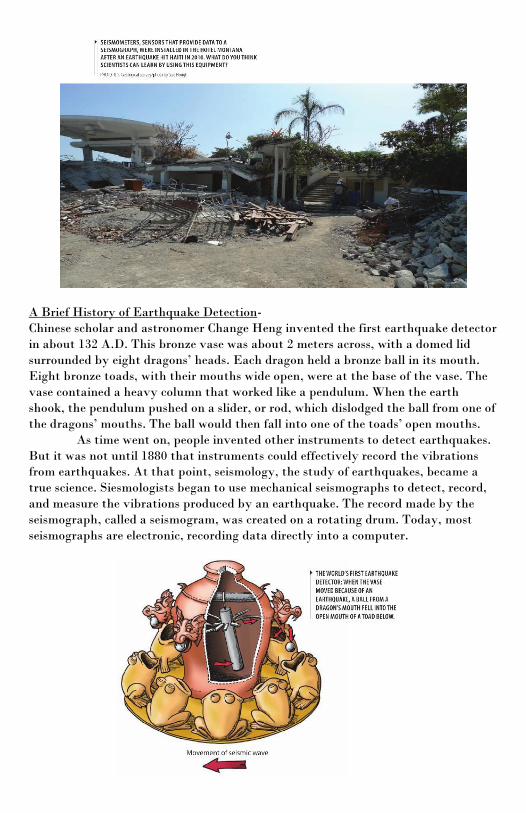
Lesson 3: Recording Earthquake Waves
Introduction-
How do scientists know where an earthquake occurred and how strong it was? They
use seismographs. Seismographs are instruments that record the vibrations from an
earthquake. In this lesson, you will use a model seismograph to record on paper the
vibrations you create on a table or other surface. You will then examine a copy of a
seismogram recorded during the Alaska earthquake of March 27, 1964. As you study
the seismogram, you will discover how scientists record and interpret earthquake
waves. Then you will use data recorded from three seismograph stations to model
how scientists locate an earthquake’s epicenter. This information will help you in
Lesson 4, when you plot earthquakes on a world map.
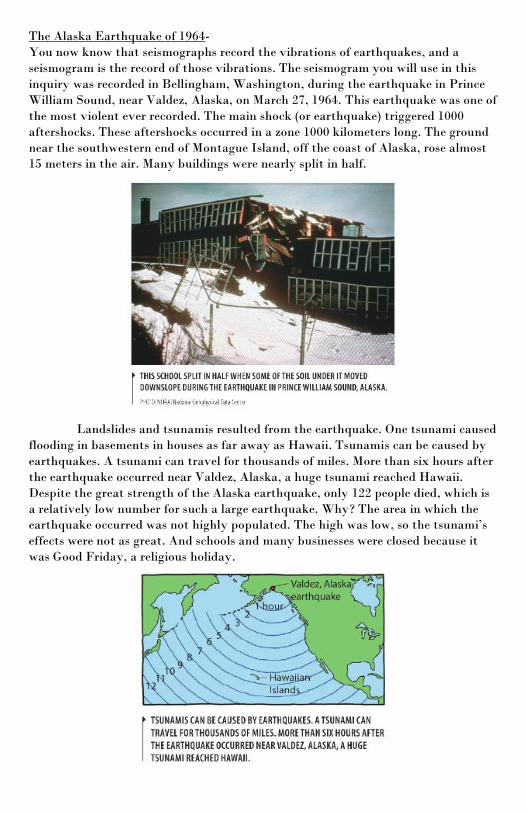
A Brief History of Earthquake Detection-
Chinese scholar and astronomer Change Heng invented the first earthquake detector
in about 132 A.D. This bronze vase was about 2 meters across, with a domed lid
surrounded by eight dragons’ heads. Each dragon held a bronze ball in its mouth.
Eight bronze toads, with their mouths wide open, were at the base of the vase. The
vase contained a heavy column that worked like a pendulum. When the earth
shook, the pendulum pushed on a slider, or rod, which dislodged the ball from one of
the dragons’ mouths. The ball would then fall into one of the toads’ open mouths.
As time went on, people invented other instruments to detect earthquakes.
But it was not until 1880 that instruments could effectively record the vibrations
from earthquakes. At that point, seismology, the study of earthquakes, became a
true science. Siesmologists began to use mechanical seismographs to detect, record,
and measure the vibrations produced by an earthquake. The record made by the
seismograph, called a seismogram, was created on a rotating drum. Today, most
seismographs are electronic, recording data directly into a computer.
The Alaska Earthquake of 1964-
You now know that seismographs record the vibrations of earthquakes, and a
seismogram is the record of those vibrations. The seismogram you will use in this
inquiry was recorded in Bellingham, Washington, during the earthquake in Prince
William Sound, near Valdez, Alaska, on March 27, 1964. This earthquake was one of
the most violent ever recorded. The main shock (or earthquake) triggered 1000
aftershocks. These aftershocks occurred in a zone 1000 kilometers long. The ground
near the southwestern end of Montague Island, off the coast of Alaska, rose almost
15 meters in the air. Many buildings were nearly split in half.
Landslides and tsunamis resulted from the earthquake. One tsunami caused
flooding in basements in houses as far away as Hawaii. Tsunamis can be caused by
earthquakes. A tsunami can travel for thousands of miles. More than six hours after
the earthquake occurred near Valdez, Alaska, a huge tsunami reached Hawaii.
Despite the great strength of the Alaska earthquake, only 122 people died, which is
a relatively low number for such a large earthquake. Why? The area in which the
earthquake occurred was not highly populated. The high was low, so the tsunami’s
effects were not as great. And schools and many businesses were closed because it
was Good Friday, a religious holiday.

Finding the Epicenter: The Tortoise and the Hare-
Seismographs are located all over the world. A seismograph station in Montana can
pick up an earthquake occurring in California. If the earthquake is really strong,
seismograph stations all over the world can also record this same earthquake. Why?
Because earthquake waves that travel through the body of the earth move outward
in all directions.
The point where the earthquake occurs is called the focus, and it can be
shallow or deep in the earth. The point on the earth’s surface directly above the
focus is called the earthquake’s epicenter. This is usually the lace that you read or
hear about in the news when there has been an earthquake.
Damage from one earthquake can occur in many different places.
Seismologists use special math calculations to pinpoint the exact location of the
earthquake’s epicenter. First, they use the arrival times of P- and S-waves, as shown
on several seismograms. Then they plot those times on a special graph called a time-
distance graph.
P-waves always travel at the same average speed. S-waves have a constant
speed, too, only slower. Scientists can graph the speeds of both waves on a special
graph. Like the tortoise in the story “The Tortoise and the Hare,” an S-wave always
travels more slowly than a P-wave. Although both animals in the story leave the
starting line at the same time, the distance between the two becomes greater and
greater the farther they are from the starting line (until the hare takes a break). By
computer how many minutes apart the two animals are from each other at any one
point in the race, you could calculate the distance they have traveled (how far they
are from the starting line) using a time-distance graph.
In much the same way, by knowing when each wave arrives at the
seismograph station and subtracting the difference, seismologists can determine how
far away the earthquake’s epicenter is from their station. The greater the difference
in time between the P- and S-waves’ arrival, the further the seismograph station is
from the epicenter.
Is that enough information to pinpoint the exact location of the
earthquake? No, because earthquake waves do not follow one path. They move
outward in all directions in a circle around the epicenter. With data from a single
station, the seismologist knows only that the earthquake could have happened
anywhere in a circle around that station. With data from two seismograph stations,
however, seismologists can narrow the epicenter location down to two places—that
is, the two points at
which the circles cross
each other. But with
data from three
stations, they determine
the exact point at which
all three circles
intersect, as shown on
the map below. This
point is the epicenter of
the earthquake.

In 1985, a violent earthquake shook Mexico City and destroyed a factory. The
people working inside were trapped under the debris. After rescuers searched for 10
days, the Mexican government was ready to give up trying to find missing workers.
As a last resort, relatives of the trapped victims asked rescue expert Carolyn Hebard
to search the factory ruins with her dogs. Hebard flew in from her home in New
Jersey with her specially trained German shepherds to help with the rescue
operation. Hebard and her dogs worked their way into the wreckage and found two
survivors.
Hebard and Her Amazing Dogs: Hebard, a member of the National
Association for Search and Rescue, is one of 1500 handlers of rescue dogs across the
United States. She is one of the nation’s respected experts on canine search and
rescue. Hebard first learned search-and-rescue techniques as a hobby, because she
loved dogs and the outdoors. She joined a search-and-rescue club. With the club
members, she trained her dogs, Pasha and Aranka, in the woods.
The Nose Knows: Dogs are good at finding people stranded under rubble
because they have an excellent sense of smell. Instead of tracking a scent by sniffing
the ground, escue dogs are trained to sniff the air. The human body sheds tiny
particles of dead skin that carry the human scent. These particles float on air
currents where dogs’ noses can easily detect them. By sniffing the air, dogs can
search a much larger area than they could by just sniffing the ground.
Between search-and-rescue jobs, Hebard trains her dogs in the woods about
once a week, just as athletes train between competitions. The dogs often practice by
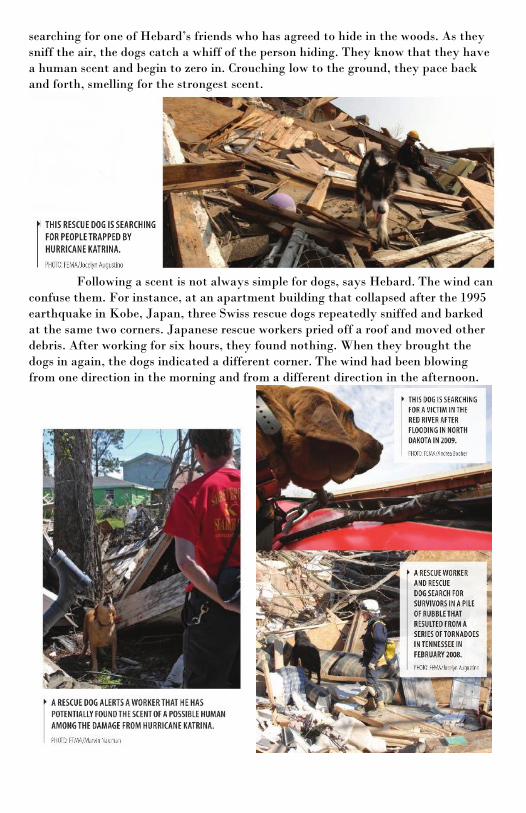
searching for one of Hebard’s friends who has agreed to hide in the woods. As they
sniff the air, the dogs catch a whiff of the person hiding. They know that they have
a human scent and begin to zero in. Crouching low to the ground, they pace back
and forth, smelling for the strongest scent.
Following a scent is not always simple for dogs, says Hebard. The wind can
confuse them. For instance, at an apartment building that collapsed after the 1995
earthquake in Kobe, Japan, three Swiss rescue dogs repeatedly sniffed and barked
at the same two corners. Japanese rescue workers pried off a roof and moved other
debris. After working for six hours, they found nothing. When they brought the
dogs in again, the dogs indicated a different corner. The wind had been blowing
from one direction in the morning and from a different direction in the afternoon.

Helping Out in Kobe: Hebard and her dogs also helped out during the
earthquake in Kobe. She and her dogs searched the ruins of the city’s train station.
“The railroad tracks actually looked like a roller coaster,” she said. “It was
incredible the way they had bent. We had to crawl inside the station.” They climbed
over piles of broken glass and crushed filing cabinets. It took four hours to crawl
through a structure that would have taken 10 minutes to walk through before the
earthquake.
When a search-and-rescue mission is over, Hebard and her dogs return to a
quiet life in New Jersey. Sometimes it takes the dogs a little time to adjust to having
other family members around.
“You do become very close to the dog, and definitely after you’ve been on
an extended search,” said Hebard. “The bond between you and that dog becomes
closer and closer.”
Discussion Questions
1. Suppose you were asked to build an automatic “sniffer” that could do the same
job as a rescue dog. How would you design it?
2. While dogs are useful in search-and-rescue efforts, the work remains costly and
dangerous. How could the need for such rescues after earthquakes and other
natural disasters be reduced?
Lesson #4: Plotting Earthquakes
Introduction-
On September 19, 1985, a strong earthquake occurred in Mexico City. The quake
killed more than 9000 people and destroyed thousands of buildings. Two months
later, a powerful volcanic eruption occurred about 3200 kilometers south of Mexico
City. Do you think there could be a relationship between where earthquakes and
volcanoes occur?
In this lesson and in Lesson 5, you will conduct inquiries that will help you
begin to answer this question. In this lesson, you will plot on a world map a set of
earthquakes that occurred in various parts of the world in the 1990s. You will then
examine the map to determine whether you can see a pattern in the locations of the
earthquake epicenters. Then, in Lesson 5, you will plot on the same map the
locations of recent volcanic eruptions. Finally, you will analyze the locations of
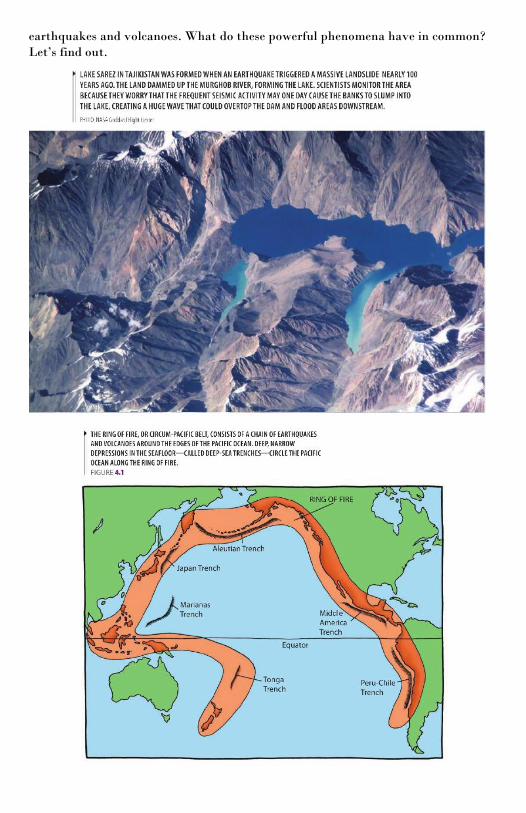
earthquakes and volcanoes. What do these powerful phenomena have in common?
Let’s find out.
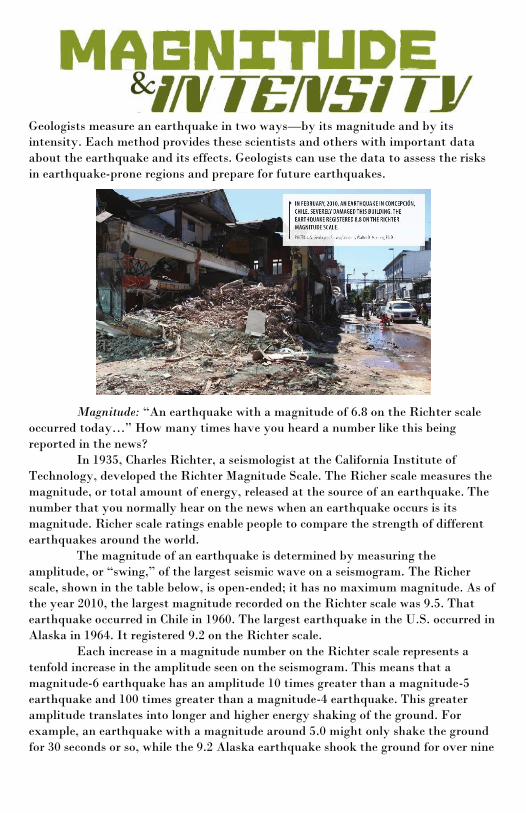
Geologists measure an earthquake in two ways—by its magnitude and by its
intensity. Each method provides these scientists and others with important data
about the earthquake and its effects. Geologists can use the data to assess the risks
in earthquake-prone regions and prepare for future earthquakes.
Magnitude: “An earthquake with a magnitude of 6.8 on the Richter scale
occurred today…” How many times have you heard a number like this being
reported in the news?
In 1935, Charles Richter, a seismologist at the California Institute of
Technology, developed the Richter Magnitude Scale. The Richer scale measures the
magnitude, or total amount of energy, released at the source of an earthquake. The
number that you normally hear on the news when an earthquake occurs is its
magnitude. Richer scale ratings enable people to compare the strength of different
earthquakes around the world.
The magnitude of an earthquake is determined by measuring the
amplitude, or “swing,” of the largest seismic wave on a seismogram. The Richer
scale, shown in the table below, is open-ended; it has no maximum magnitude. As of
the year 2010, the largest magnitude recorded on the Richter scale was 9.5. That
earthquake occurred in Chile in 1960. The largest earthquake in the U.S. occurred in
Alaska in 1964. It registered 9.2 on the Richter scale.
Each increase in a magnitude number on the Richter scale represents a
tenfold increase in the amplitude seen on the seismogram. This means that a
magnitude-6 earthquake has an amplitude 10 times greater than a magnitude-5
earthquake and 100 times greater than a magnitude-4 earthquake. This greater
amplitude translates into longer and higher energy shaking of the ground. For
example, an earthquake with a magnitude around 5.0 might only shake the ground
for 30 seconds or so, while the 9.2 Alaska earthquake shook the ground for over nine
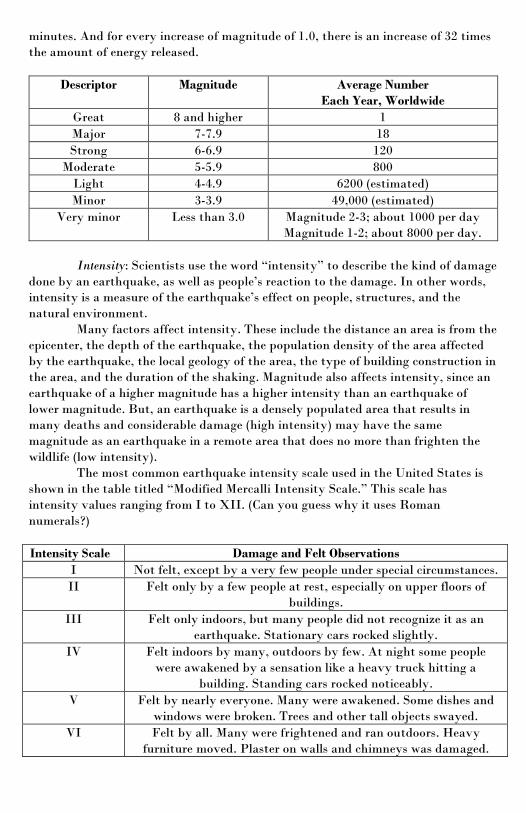
minutes. And for every increase of magnitude of 1.0, there is an increase of 32 times
the amount of energy released.
Descriptor Magnitude Average Number
Each Year, Worldwide
Great 8 and higher 1
Major 7-7.9 18
Strong 6-6.9 120
Moderate 5-5.9 800
Light 4-4.9 6200 (estimated)
Minor 3-3.9 49,000 (estimated)
Very minor Less than 3.0 Magnitude 2-3; about 1000 per day
Magnitude 1-2; about 8000 per day.
Intensity: Scientists use the word “intensity” to describe the kind of damage
done by an earthquake, as well as people’s reaction to the damage. In other words,
intensity is a measure of the earthquake’s effect on people, structures, and the
natural environment.
Many factors affect intensity. These include the distance an area is from the
epicenter, the depth of the earthquake, the population density of the area affected
by the earthquake, the local geology of the area, the type of building construction in
the area, and the duration of the shaking. Magnitude also affects intensity, since an
earthquake of a higher magnitude has a higher intensity than an earthquake of
lower magnitude. But, an earthquake is a densely populated area that results in
many deaths and considerable damage (high intensity) may have the same
magnitude as an earthquake in a remote area that does no more than frighten the
wildlife (low intensity).
The most common earthquake intensity scale used in the United States is
shown in the table titled “Modified Mercalli Intensity Scale.” This scale has
intensity values ranging from I to XII. (Can you guess why it uses Roman
numerals?)
Intensity Scale Damage and Felt Observations
I Not felt, except by a very few people under special circumstances.
II Felt only by a few people at rest, especially on upper floors of
buildings.
III Felt only indoors, but many people did not recognize it as an
earthquake. Stationary cars rocked slightly.
IV Felt indoors by many, outdoors by few. At night some people
were awakened by a sensation like a heavy truck hitting a
building. Standing cars rocked noticeably.
V Felt by nearly everyone. Many were awakened. Some dishes and
windows were broken. Trees and other tall objects swayed.
VI Felt by all. Many were frightened and ran outdoors. Heavy
furniture moved. Plaster on walls and chimneys was damaged.

VII Everyone ran outdoors. Slight to moderate damage to well-built
structures. Considerable damage to poorly built structures. Some
chimneys broken. Noticed by people driving cars.
VIII Damage slight in well-designed structures, great in poorly built
structures. Fallen chimneys, monuments, and walls. Heavy
furniture was overturned. Sand and mud were ejected from the
ground in small amounts.
IX Damage was considerable in well-designed structures. Buildings
shifted off foundations. Ground noticeably cracked. Underground
pipes broken.
X Well-built wooden structures destroyed. Ground badly cracked.
Railroad tracks bent. Landslides considerable. Water splashed
over riverbanks.
XI Few, if any, masonry structures remained standing. Bridges were
destroyed. Broad cracks formed in ground. Underground pipes
completely out of service.
XII Total damage. Waves seen on ground surfaces. Objects thrown
upward into the air.
Discussion Questions
1. Look at the photo of earthquake damage in Sichuan, China. Where would you
put this earthquake on the intensity scale?
2. On average, there are about 8000 earthquakes of magnitude 1-2 per day, and
only one earthquake of magnitude 8 or higher each year. Why are there so many
minor earthquakes and so few major ones?

Since the mid-19th century, well before the Richter Magnitude Scale was developed,
scientists have been using intensity as an approximation of the strength of an
earthquake. The U.S. Geological Survey (USGS) collects data about historical
earthquakes based on “felt observations” of citizens. People who think they have
felt the impacts of an earthquake can go to the USGS website and fill out a
questionnaire about where they were and what they experience. Compiling this data
helps the USGS determine the intensity of earthquakes.
If records existed of the “felt observations” for all the earthquakes that
have occurred on the earth, the maximum intensity of all earthquakes at a
particular site would be a good estimate of earthquake risk for that rea. But
scientists only have a small amount of data about the earthquakes that have
occurred throughout history. Therefore, they make intelligent guesses about where
and how often earthquakes occur, how large they will be, and how much shaking
will occur. This information is then plotted on a map. People moving into an
earthquake-prone city might use the map to get some idea of the risk of an
earthquake occurring in that area. Earthquake maps are also used to determine
building codes and insurance rates.

Discussion Questions
1. “Felt observations” have proven useful for understanding historical
earthquakes. If you were guiding people today to keep a record of their felt
observations, what information would you ask them to record, and in what form?
2. Besides a map showing felt observations, what other data could people use to get
an idea of earthquake risks in a particular area?
Do you use social networks through your computer, phone, or other device to keep
in touch with your friends? Maybe you share information such as photos, or news
about people you know. Scientists around the world who study earthquakes and
volcanoes also use digital networks to keep in constant contact with each other,
sharing scientific news, data, and ideas. The information they are sharing is about
one of their favorite topics, seismic activity (frequency, intensity, and magnitude of
earthquakes). Your conversations and the scientists’ communications both rely on
telecommunications networks, including satellites, sensor networks, and the
Internet.
The Global Seismographic Network is a permanent set of more than 150
sensors that are placed around the world to monitor seismic activity. They are
connected by a telecommunications network that allows data to flow from the
sensors to scientists who can monitor it. The network was conceived in 1984 by a
group of organizations, led by the U.S. Geological Survey (USGS), which were
trying to coordinate the monitoring of seismic activity. While several organizations
around the globe had been monitoring seismic activity, they had no easy way to
share their information to produce timely, global analyses of Earth’s crust in
motion. With the Global Seismographic Network, not only did they succeed in
connecting themselves in a network, they were able to get funding to set up more
seismic monitoring stations. Today, sensors are in locations as diverse as a diary
famr in Singapore, a snowy peninsula in Antarctica, and a remote island nation in
the South Pacific called Tuvalu.
You may belong to some sort of club. As a member, you probably take part
in regular club activities, like meetings or practices, and you agree to follow the
club’s rules or guidelines. Members of the Global Seismographic Network must agree
to collect regular, standardized data on seismic activity. Each of the more than 100
members—universities, government agencies, and institute representing about sixty
different countries—maintains one or more sophisticated sensors. In exchange for
keeping their sensors in good, working order, the members get access to worldwide
data on seismic activity. Just as your club president should make sure the activities
of the club are running smoothly, the USGS helps many of the member countries
maintain their sensors.
Collectively, the sensors of the Global Seismographic Network provide
nearly uniform coverage of seismic events on the earth. Each sensor measures and
records vibrations, and the sensors’’ clocks are set to be highly accurate, using global
positioning satellites (GPS). It is important that scientists know exactly when
seismic activity is taking place, so that they can see and study all the simultaneous
activity around the world. The data collected by each sensor is sent to earthquake
information and warning centers, using satellites and the Internet. Some of the
seismic data is sent in real time, which means people receive it right away, while the
events are happening. This can be extremely useful. Knowing the epicenter and
magnitude of an earthquake immediately can help warning centers mobilize a rapid
emergency response. Someday, as our technology improves, all of the monitoring
stations’ data will be available in real time.
Even data that is not sent in real time can be used by researchers to better
understand seismic events. Thanks to the Global Seismographic Network, within an
hour of an earthquake anywhere on the globe, scientists know its location, depth,
and magnitude. Using the data collected, scientists have been able to learn more
about the earth’s interior structure and what happens during an earthquake. They
are looking at things such as the dep structure of spreading ridges. The more we can
understand about the workings of the inner earth, the better chance we have of
learning how to anticipate and prepare for earthquakes.
Data from the network also helps us understand the aftermath of
earthquakes. High-frequency vibrations occur during an earthquake, but we now
know they are followed by low-frequency vibrations that shake the earth for days or
weeks. The giant Sumatra earthquake, which lasted about seven minutes, set the
entire planet to vibrating within 21 minutes.
The Global Seismographic Network is also used for the military purpose of
detecting underground nuclear explosions. In fact, the U.S. Department of Defense
was one of the founding partners of the network, and some of the money to

maintain it comes from the U.S. Air Force. AS early as the 1960s, scientists realized
that nuclear explosions generated seismic waves: waves of energy that travel
through the earth. The seismic waves produced by a nuclear explosion are large
enough to be detected around the world. This means that countries can monitor
each other to see who is testing nuclear weapons, sometimes in violation of
international treaties. The U.S. Department of Defense operates a specialized center
to scan data from the network for evidence of nuclear tests. It has documented a
number of nuclear explosions, including the series of nuclear tests conducted by
India and Pakistan in 1998.
You may wonder how scientists can tell the difference between a seismic
wave generated by an earthquake and one generated by a nuclear weapons
explosion. It turns out that while earthquakes produce strong waves along the
earth’s surface, the waves from nuclear explosions tend to be confined to deeper
layers. Determining the kinds of waves produced by a seismic event allows for
identification of its cause.
So, the Global Seismographic Network really serves three functions:
earthquake monitoring, earthquake research, and nuclear test monitoring. The
network does all three jobs best if the sensors are numerous, well-placed, reliable,
and linked through strong communication networks. Both scientists and military
strategists are working to improve the network and make it fully real-time, using
state-of-the-art equipment. If we’re lucky, the Global Seismographic Network’s
continuing work will mean that students in the future understand our shifting,
elastic planet even better than top seismologists can today.
Discussion Questions
1. Think about how your class might work on a large project: what are the
advantages and disadvantages of working independently in small groups versus
linking all groups’ efforts together in a classroom effort?
2. What does this tell you about the advantages and disadvantages of linking
individual monitoring networks into a global monitoring network?
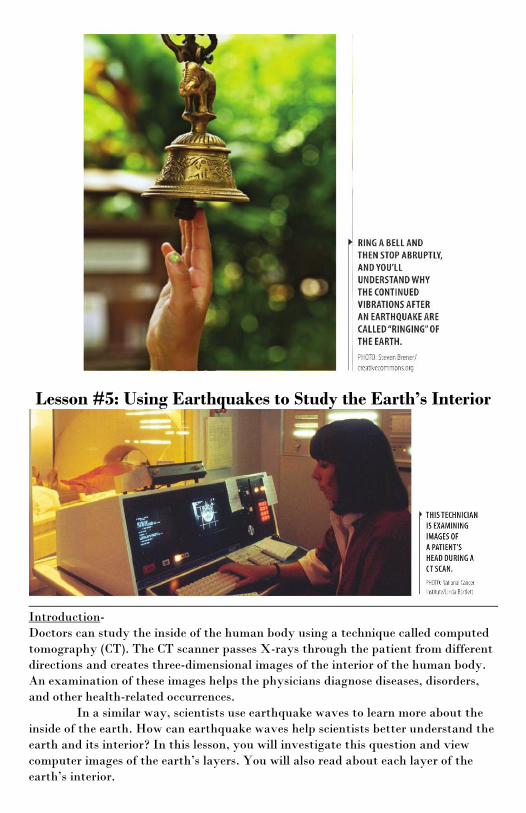
Lesson #5: Using Earthquakes to Study the Earth’s Interior
Introduction-
Doctors can study the inside of the human body using a technique called computed
tomography (CT). The CT scanner passes X-rays through the patient from different
directions and creates three-dimensional images of the interior of the human body.
An examination of these images helps the physicians diagnose diseases, disorders,
and other health-related occurrences.
In a similar way, scientists use earthquake waves to learn more about the
inside of the earth. How can earthquake waves help scientists better understand the
earth and its interior? In this lesson, you will investigate this question and view
computer images of the earth’s layers. You will also read about each layer of the
earth’s interior.
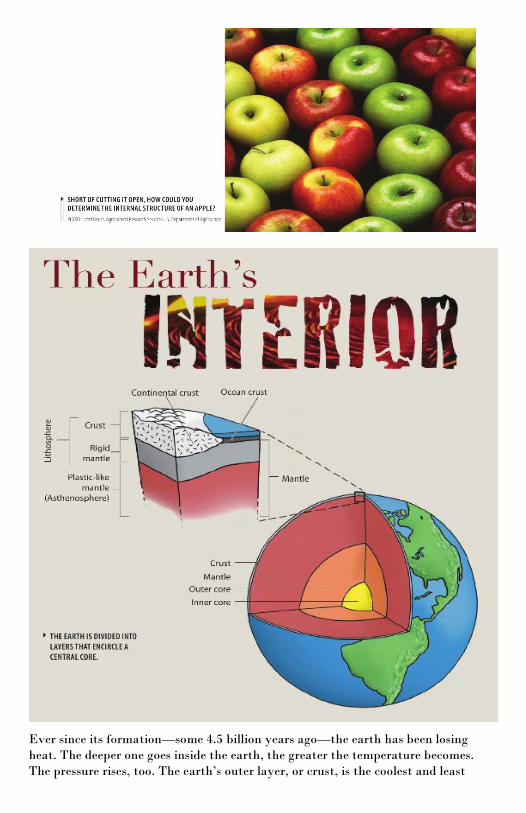
Ever since its formation—some 4.5 billion years ago—the earth has been losing
heat. The deeper one goes inside the earth, the greater the temperature becomes.
The pressure rises, too. The earth’s outer layer, or crust, is the coolest and least
dense of all the layers inside the earth. (You might compare the earth with a loaf of
bread that is cooling on a shelf. The crust cools first; the soft inner part of the loaf
remains warm much longer.)
There are two kinds of crust: oceanic and continental. The oceanic crust lies
beneath the ocean. It is approximately 5 to 10 kilometers (3 to 6 miles) thick. The
continental crust contains mostly land. It ranges from 15 to 70 kilometers (9 to 43
miles) thick and is thickest under high mountain areas. Both types of crust are made
up of rock.
Directly under the crust is the mantle. Like the crust, the mantle is
composed of rock; however, the rock in the mantle is much denser than that in the
crust. The mantle is about 2900 kilometers (1800 miles) thick, and it makes up
about 83 percent of the earth’s interior. The top layer of the mantle is rigid. It is
cooler than the lower part of the mantle. Geologists call this rigid part of the mantle,
together with the crust, the lithosphere. The lithosphere is broken into pieces called
“plates.” (To visualize these plates, think about how an egg looks when its shell is
cracked.)
The plates of the lithosphere “float” on the part of the mantle directly
below it. This part of the mantle is called the asthenosphere. The consistency of the
asthenosphere is like taffy. The asthenosphere is hot, and, like warm taffy, it can
flow. The movement of the plates of the lithosphere on top of the slowly moving
asthenosphere accounts for the formation of many mountains and volcanoes, as well
as for earthquakes.
Beneath the mantle is the earth’s innermost layer, the core. (Think of the
center of an apple, which is also called the core.) The earth’s core is divided into two
parts: a liquid outer core, made of iron, and a solid inner core, made of iron and
nickel.
Discussion Questions
1. Why is the crust the coolest layer of the earth?
2. How is rock in the earth’s mantle different form rock in the earth’s crust?
The deepest that scientists have drilled into the earth is 12 kilometers (7.5 miles).
That’s less than 0.2 percent of the distance from the surface of the earth to its
center! So how do scientists know so much about the layers of earth’s interior? How
do they know, for example, that the lithosphere is rigid? Or that the asthenosphere
is soft, like taffy? Or that the outer core is liquid?
To understand how scientists study the earth’s interior, think about how
they study the deepest parts of the ocean floor, which, like the depths of the earth,
have never been explored directly by humans. Scientists study the ocean floor and
the inner earth using waves. To study the ocean, they analyze sound waves, using a
technique called sonar. To study the inside of the earth, they analyze earthquake, or
seismic, waves.
Sonar Waves: “Sonar” stands for Sound Navigation and Ranging. A sonar
system consists of a transmitter and a receiver, just like a walkie-talkie, a phone, or
any other two-way communication device. The sonar transmitter sends waves from
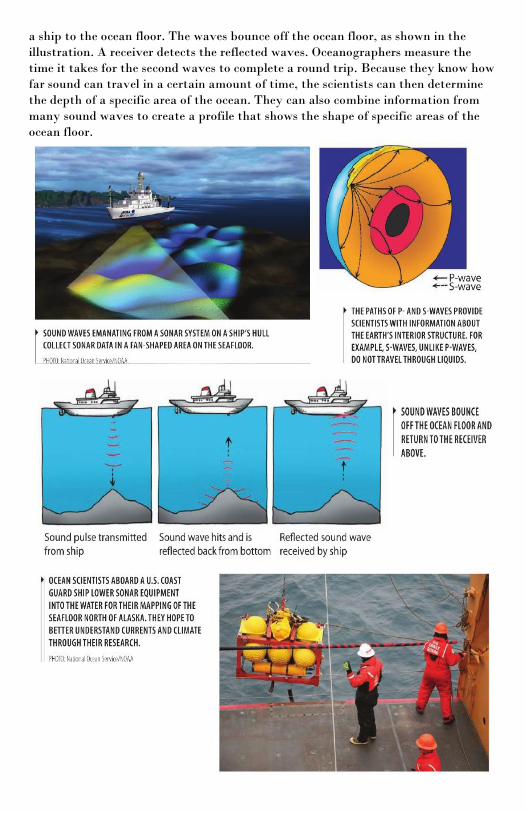
a ship to the ocean floor. The waves bounce off the ocean floor, as shown in the
illustration. A receiver detects the reflected waves. Oceanographers measure the
time it takes for the second waves to complete a round trip. Because they know how
far sound can travel in a certain amount of time, the scientists can then determine
the depth of a specific area of the ocean. They can also combine information from
many sound waves to create a profile that shows the shape of specific areas of the
ocean floor.
Earthquake Waves: Seismologists use earthquake waves to map the
structure of the interior of the earth in much the same way oceanographers use
sonar to map the ocean floor. As the earthquake waves move through the different
layers of the earth, they change speed and direction. Sometimes they even stop. In
other words, earthquake waves behave differently, depending on what substance
they are traveling through. Because scientists know the average speed of P- and S-
waves and also know how the waves travel, they can make educated guesses about
the substances that make up the earth’s interior. For example, they know that the
outer core is liquid, because S-waves, which cannot travel through liquids, do not
travel through the core. The more scientists learn about sound waves and seismic
waves, the more they may discover about the earth’s most hidden area—its interior.
Discussion Questions:
1. Why do waves move at different speeds through different layers of the earth?
2. Why might S-waves travel more slowly than P-waves? Use internet or library
resources to see if your hypothesis is correct.
Lesson #6: Investigating Plate Movements
Introduction-
What does the word “model” mean to you? A model is often a smaller version of an
object, such as a miniature airplane. In earth science, the shell of an egg can be used
as a model of the earth’s crust, which is too large and too complex to study firsthand
in the classroom. In this lesson, you will use models to study how the earth’s plates
move and how the forces created by this movement result in earthquakes.
You will use two different styles of models in this lesson. One is quite
simple, and the other is more complex. Using these models, you will investigate how
the earth’s lithospheric plates collide, separate, and slide past one another. You will
use a relief globe to look for evidence of these interactions in landforms on the earth.
The crust of the earth, along with the rigid uppermost part of the mantle, is called
the lithosphere. The lithosphere is 18 to 120 kilometers thick. It covers the earth’s
interior and is broken into pieces called plates. The rocks that make up these plates
grind, collide, move past one another, and separate as they float on a flowing, taffy-
like, solid upper mantle called the asthenosphere. The place where plates meet is
called a plate boundary. At some plate boundaries, the plates collide, and
mountains, and trenches form, as shown in the photograph below. At other plate
boundaries, the plates try to slide past one another. When this happens, energy
builds up in the rock as it compresses or twists. When the force between the plates
gets too great, the rock breaks, or ruptures, and an earthquake may occur.
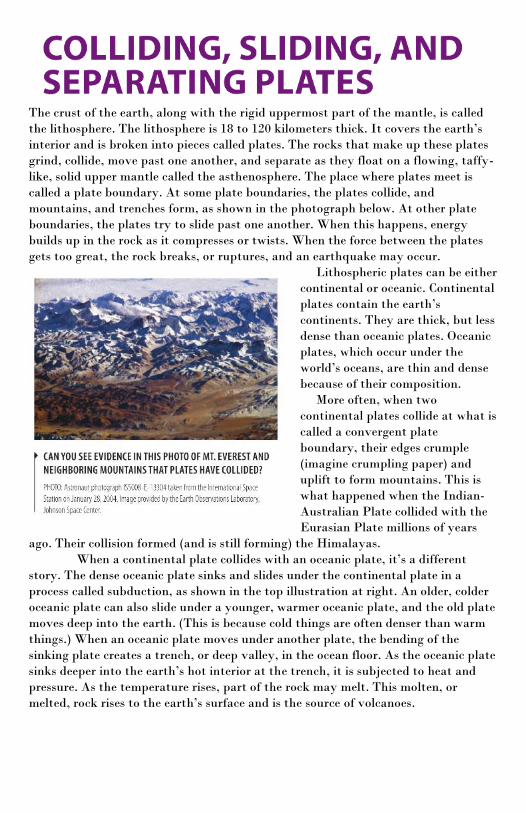
Lithospheric plates can be either
continental or oceanic. Continental
plates contain the earth’s
continents. They are thick, but less
dense than oceanic plates. Oceanic
plates, which occur under the
world’s oceans, are thin and dense
because of their composition.
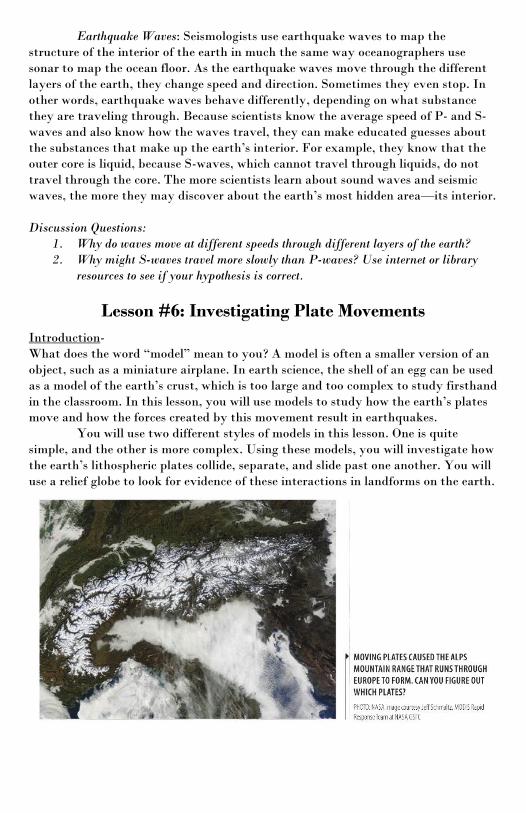
More often, when two
continental plates collide at what is
called a convergent plate
boundary, their edges crumple
(imagine crumpling paper) and
uplift to form mountains. This is
what happened when the Indian-
Australian Plate collided with the
Eurasian Plate millions of years
ago. Their collision formed (and is still forming) the Himalayas.
When a continental plate collides with an oceanic plate, it’s a different
story. The dense oceanic plate sinks and slides under the continental plate in a
process called subduction, as shown in the top illustration at right. An older, colder
oceanic plate can also slide under a younger, warmer oceanic plate, and the old plate
moves deep into the earth. (This is because cold things are often denser than warm
things.) When an oceanic plate moves under another plate, the bending of the
sinking plate creates a trench, or deep valley, in the ocean floor. As the oceanic plate
sinks deeper into the earth’s hot interior at the trench, it is subjected to heat and
pressure. As the temperature rises, part of the rock may melt. This molten, or
melted, rock rises to the earth’s surface and is the source of volcanoes.
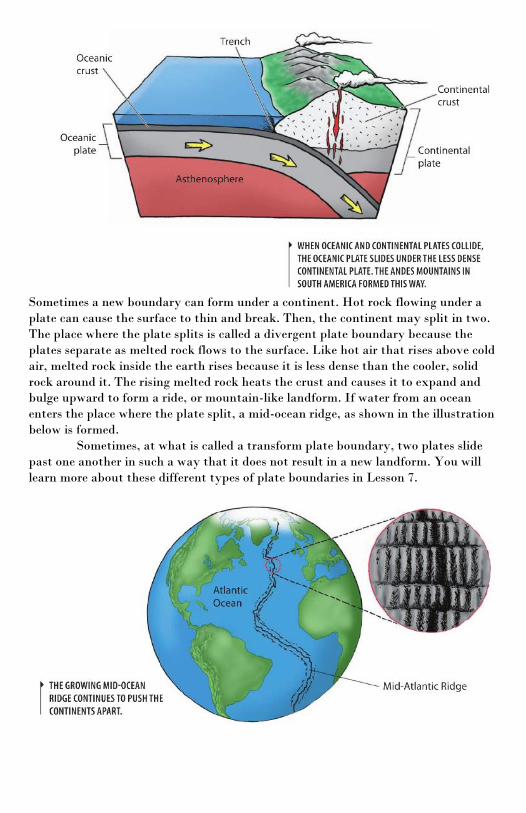
Sometimes a new boundary can form under a continent. Hot rock flowing under a
plate can cause the surface to thin and break. Then, the continent may split in two.
The place where the plate splits is called a divergent plate boundary because the
plates separate as melted rock flows to the surface. Like hot air that rises above cold
air, melted rock inside the earth rises because it is less dense than the cooler, solid
rock around it. The rising melted rock heats the crust and causes it to expand and
bulge upward to form a ride, or mountain-like landform. If water from an ocean
enters the place where the plate split, a mid-ocean ridge, as shown in the illustration
below is formed.
Sometimes, at what is called a transform plate boundary, two plates slide
past one another in such a way that it does not result in a new landform. You will
learn more about these different types of plate boundaries in Lesson 7.
You’ve observed that Africa and South America seem to fit together like pieces of a
puzzle. Scientists now believe that all the continents were once a single landmass.
Earth’s hot mantle separated those continents over time, and oceans formed
between them. How did scientists long ago explain these changes? Let’s take a look
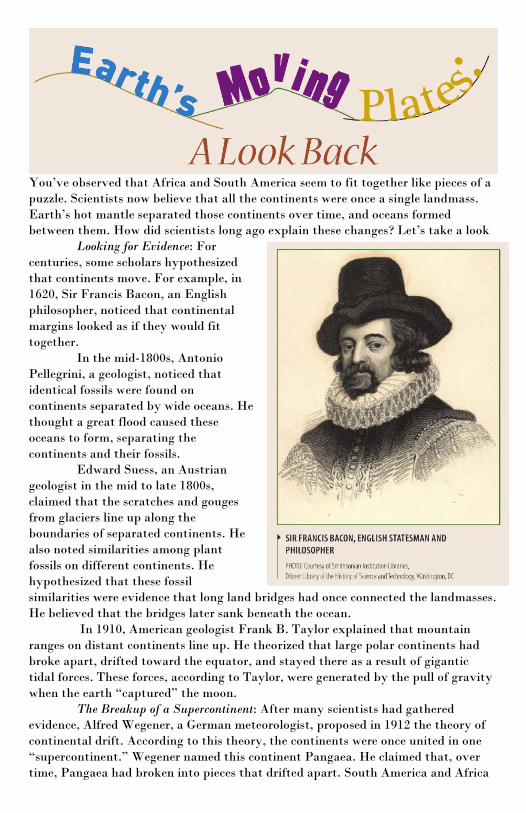
Looking for Evidence: For
centuries, some scholars hypothesized
that continents move. For example, in
1620, Sir Francis Bacon, an English
philosopher, noticed that continental
margins looked as if they would fit
together.
In the mid-1800s, Antonio
Pellegrini, a geologist, noticed that
identical fossils were found on
continents separated by wide oceans. He
thought a great flood caused these
oceans to form, separating the
continents and their fossils.
Edward Suess, an Austrian
geologist in the mid to late 1800s,
claimed that the scratches and gouges
from glaciers line up along the
boundaries of separated continents. He
also noted similarities among plant
fossils on different continents. He
hypothesized that these fossil
similarities were evidence that long land bridges had once connected the landmasses.
He believed that the bridges later sank beneath the ocean.
In 1910, American geologist Frank B. Taylor explained that mountain
ranges on distant continents line up. He theorized that large polar continents had
broke apart, drifted toward the equator, and stayed there as a result of gigantic
tidal forces. These forces, according to Taylor, were generated by the pull of gravity
when the earth “captured” the moon.
The Breakup of a Supercontinent: After many scientists had gathered
evidence, Alfred Wegener, a German meteorologist, proposed in 1912 the theory of
continental drift. According to this theory, the continents were once united in one
“supercontinent.” Wegener named this continent Pangaea. He claimed that, over
time, Pangaea had broken into pieces that drifted apart. South America and Africa

had moved away from each other. North America and Europe had separated. His
theory was supported by evidence from many different fields of science.
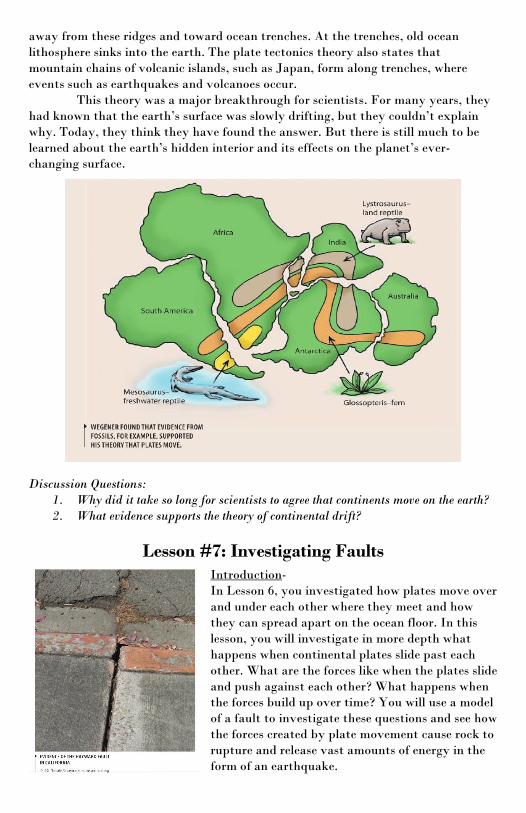
Wegener explained why the shorelines of different continents seem to
match. He noted that mountain ranges of similar age and structure were now
located on separated continents. Fossil animals, such as Mesosaurus (a freshwater
reptile about 1 meter long), were found in countries on two different continents,
Africa and South America. Because Mesosaurus lived only in fresh water, Wegener
surmised that the continents at one time were connected. Finally, Wegener found
evidence that continents currently in the Tropics were once covered with glaciers.
This means the continents must have “drifted” or moved somehow.
Wegener proved that continents appeared to move over time, but he could
not prove why these events took place. What caused the continents to drift?
Wegener thought he had answers. He argued that both gravitational tidal forces
and the earth’s rotation were responsible for continental drift. However, it was
fairly easy for scientists to prove that these forces were much too weak. His
explanations were not accepted.
Seafloor Spreading and the Drifting Continents: in the late 1950s and early
1960s, years after Wegener’s death, new data about the seafloor emerged that enable
geologists to suggest why continents appear to drift. Evidence from seafloor fossils
and magnetic data suggested that younger parts of the floor were located closer to
the mid-ocean ridge, while older parts of the seafloor were farther from the mid-
ocean ridge, near the trenches. These data prompted the theory of seafloor
spreading, which states that a force within the earth drives the ocean floor apart
and allows new oceanic crust to form.
Plate Tectonics: In the late 1960s, scientists combined information on
seafloor spreading and continental drift to propose the plate tectonics theory. This
theory states that rigid plates move away from mid-ocean ridges, where new
lithosphere is constantly being formed. It also proposed that old lithosphere moves
away from these ridges and toward ocean trenches. At the trenches, old ocean
lithosphere sinks into the earth. The plate tectonics theory also states that
mountain chains of volcanic islands, such as Japan, form along trenches, where
events such as earthquakes and volcanoes occur.
This theory was a major breakthrough for scientists. For many years, they
had known that the earth’s surface was slowly drifting, but they couldn’t explain
why. Today, they think they have found the answer. But there is still much to be
learned about the earth’s hidden interior and its effects on the planet’s ever-
changing surface.
Discussion Questions:
1. Why did it take so long for scientists to agree that continents move on the earth?
2. What evidence supports the theory of continental drift?
Lesson #7: Investigating Faults
Introduction-
In Lesson 6, you investigated how plates move over
and under each other where they meet and how
they can spread apart on the ocean floor. In this
lesson, you will investigate in more depth what
happens when continental plates slide past each
other. What are the forces like when the plates slide
and push against each other? What happens when
the forces build up over time? You will use a model
of a fault to investigate these questions and see how
the forces created by plate movement cause rock to
rupture and release vast amounts of energy in the
form of an earthquake.

Push your hands together hard. If your palms are flat against each other, not much
will happen. But if you push your hands together at an angle, they will slide past
each other. The earth’s plates work
something like this. Most
earthquakes are the result of huge
pieces of rock in the earth that rub
or press against each other as a
result of changes inside the earth.
As forces are applied to the rock,
the rock slightly deforms. Energy
builds up within and between
pieces or rock. Suddenly, they slip
past one another. Energy is
released, and the ground ruptures
and shakes. The longer the force is
applied to the rock, the greater the
amount of energy that will be
stored in the rock, and the more
severe the earthquake.
Plate boundaries occur
along fractures or breaks in the
earth’s outer layer. A fault is a
fracture along which blocks of rock
on opposite sides of the fracture
move. One type of fault is shown in
the photo at right.
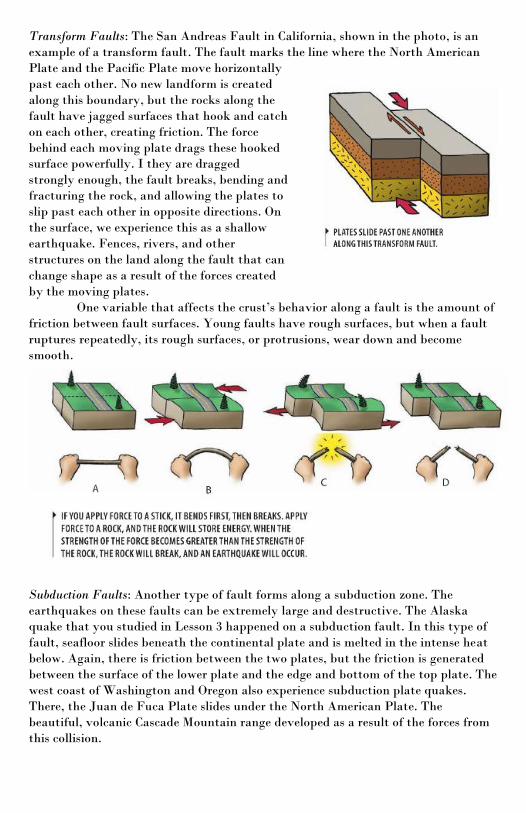
Transform Faults: The San Andreas Fault in California, shown in the photo, is an
example of a transform fault. The fault marks the line where the North American
Plate and the Pacific Plate move horizontally
past each other. No new landform is created
along this boundary, but the rocks along the
fault have jagged surfaces that hook and catch
on each other, creating friction. The force
behind each moving plate drags these hooked
surface powerfully. I they are dragged
strongly enough, the fault breaks, bending and
fracturing the rock, and allowing the plates to
slip past each other in opposite directions. On
the surface, we experience this as a shallow
earthquake. Fences, rivers, and other
structures on the land along the fault that can
change shape as a result of the forces created
by the moving plates.
One variable that affects the crust’s behavior along a fault is the amount of
friction between fault surfaces. Young faults have rough surfaces, but when a fault
ruptures repeatedly, its rough surfaces, or protrusions, wear down and become
smooth.
Subduction Faults: Another type of fault forms along a subduction zone. The
earthquakes on these faults can be extremely large and destructive. The Alaska
quake that you studied in Lesson 3 happened on a subduction fault. In this type of
fault, seafloor slides beneath the continental plate and is melted in the intense heat
below. Again, there is friction between the two plates, but the friction is generated
between the surface of the lower plate and the edge and bottom of the top plate. The
west coast of Washington and Oregon also experience subduction plate quakes.
There, the Juan de Fuca Plate slides under the North American Plate. The
beautiful, volcanic Cascade Mountain range developed as a result of the forces from
this collision.

Spreading Faults: A third major type of fault happens along ocean bottoms where
two plates pull apart and magma wells up into the chasm, causing seafloor
spreading and the formation of new ocean floor.
Lesson #8: Convection in the Mantle Introduction-
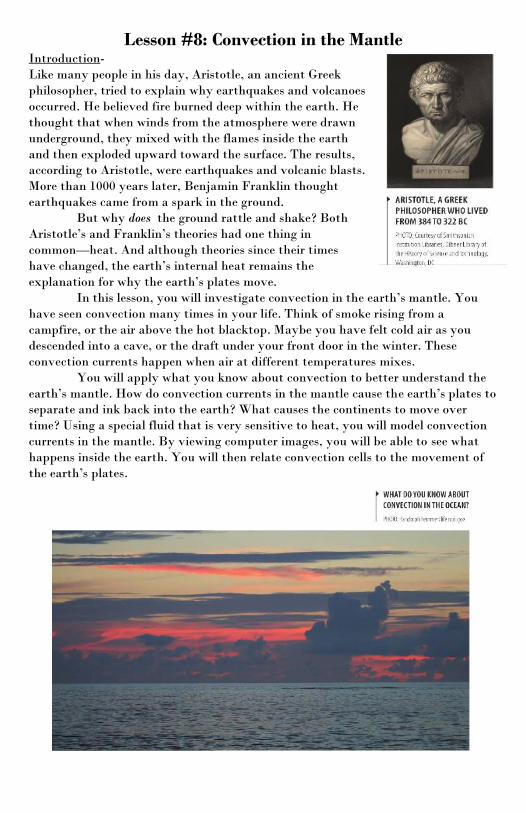
Like many people in his day, Aristotle, an ancient Greek
philosopher, tried to explain why earthquakes and volcanoes
occurred. He believed fire burned deep within the earth. He
thought that when winds from the atmosphere were drawn
underground, they mixed with the flames inside the earth
and then exploded upward toward the surface. The results,
according to Aristotle, were earthquakes and volcanic blasts.
More than 1000 years later, Benjamin Franklin thought
earthquakes came from a spark in the ground.
But why does the ground rattle and shake? Both
Aristotle’s and Franklin’s theories had one thing in
common—heat. And although theories since their times
have changed, the earth’s internal heat remains the
explanation for why the earth’s plates move.
In this lesson, you will investigate convection in the earth’s mantle. You
have seen convection many times in your life. Think of smoke rising from a
campfire, or the air above the hot blacktop. Maybe you have felt cold air as you
descended into a cave, or the draft under your front door in the winter. These
convection currents happen when air at different temperatures mixes.
You will apply what you know about convection to better understand the
earth’s mantle. How do convection currents in the mantle cause the earth’s plates to
separate and ink back into the earth? What causes the continents to move over
time? Using a special fluid that is very sensitive to heat, you will model convection
currents in the mantle. By viewing computer images, you will be able to see what
happens inside the earth. You will then relate convection cells to the movement of
the earth’s plates.
When Alfred Wegener introduced his theory of continental drift to the scientific
world in 1912, even this most sympathetic listeners had a hard time taking him
seriously. For one thing, he was telling them that the earth’s land masses were
rooted in the mantle, but drifted around the globe, gliding through the ocean floor
like icebergs through the sea. He couldn’t explain what caused the continents to
move or how they managed their trips across the ocean floor.
Geologists found his ideas completely implausible. Instead, they favored
the idea that changes in the crust, like the eruption of mountain ranges, were caused
by temperature fluctuations in the earth, which caused the earth to expand or
shrink. Mountain ranges, under that hypothesis, were a sort of bunching up of the
crust over shrinking earth. Adding to their skepticism towards Wegener and his
theory was the fact that Wegener wasn’t a geologist at all; he was a meteorologist.
However, several scientists following Wegener provided theories and evidence that,
after decades, brought the scientific community around to accepting continental
drift.
First, a British geologist named Sir Arthur Holmes proposed that the
shifting, semi-liquid mantle under the earth’s crust flowed in a regular pattern.
Heat, given off by decaying radioactive elements in the earth’s core, drove the
mantle’s flow. And, he said, the slowly flowing mantle dragged continents with it.
“Slowly” here meant quite slowly indeed; at most, a continent might move 15 cm
(about 6 inches) over an entire year.
Holmes’ theory relied on an understanding of thermal convection. As part
of a fluid heats, it grows less dense and rises. Imagine a heated portion of the mantle
moving upward, then cooling, becoming denser, and sinking downward again,
creating a circular current. Like airport carousels that move luggage, said Holmes’
theory, circulating parts of the mantle moved the continents.
Even though Holmes’ theory provided a mechanism for continental drift,
no one paid much attention, and people were still not convinced. It took the work of
five other scientists to generate a consensus in favor of the theory within the
scientific community.
Hard Data to the Rescue: Working in the 1950s and 1960s, Harry Hess and
Robert Dietz studied the ocean floor and suggested that continental land masses
weren’t plowing through the seabed; instead, the seabeds were split at thin points
along the crust, and magma came up through those splits, forcing parts of the ocean
floor away from each other and forming new crust. In other words, Hess and Dietz
figured that the continents weren’t moving on their own; as chunks of seafloor
slowly moved apart, they carried continents along with them. At the far edges of the
crustal plates, the crust sank down into other rifts and melted back into the mantle.
Hess and Dietz collected other data supporting the theory of mantle convection

driving continental drift. For example, mid-oceanic ridges with volcanoes signaled
that magma was welling up at plate boundaries.
Soon after Hess and Dietz presented their
ideas, three other geologists—Fred Vine,
Drummond Matthews, and Lawrence
Morely—suggested that new discoveries
about the magnetism of freshly formed
rocks would support their theory of seafloor spreading. Their theory turned out to
be correct, and it was crucial to the scientific community’s acceptance of continental
drift as reality.
The Work’s Not Done: Today, we continue to seek information about the
details of mantle convection and how exactly it contributes to continental drift.
Where does convection occur, and what are the forces that generate and direct its
flow? Keep in mind that the mantle’s flow can be influenced by heating from the
bottom, cooling at the top, and movement of crustal materials at plate boundaries.
Because the forces of mantle convection are operating deep with the earth’s interior,
they are difficult to study. It is tricky to determine exactly how they contribute to
the mantle’s convection.
The “plume model” of the mantle convection assumes that magma wells up
from deep in the mantle and generates the convection currents that move the
continental plates. Imagine a simmering bowl of thick soup with crackers floating
on the top. What do you think would happen to the crackers in the soup if you
heated it to boiling? As the cooler soup sinks down and the hotter soup rises,
currents are generated that move the crackers around. So, while the mantle is very
active, the continental plates in this model are passive, reacting to the activity in
the mantle. The plume model has frequently been used to diagram and explain
mantle convection.
In recent years, however, evidence has accumulated for the “plate model”
of mantle convection. This model gives the continental plates themselves an active
role in generating the motion of the mantle below. According to this model,
continental plates affect the mantle’s convective flow by absorbing and reflecting
heat, causing variations in mantle temperature. They also provide a continually
changing surface boundary between mantle and crust. Crustal events, such as plates
breaking up and slabs subducting, may change the flow of the mantle.
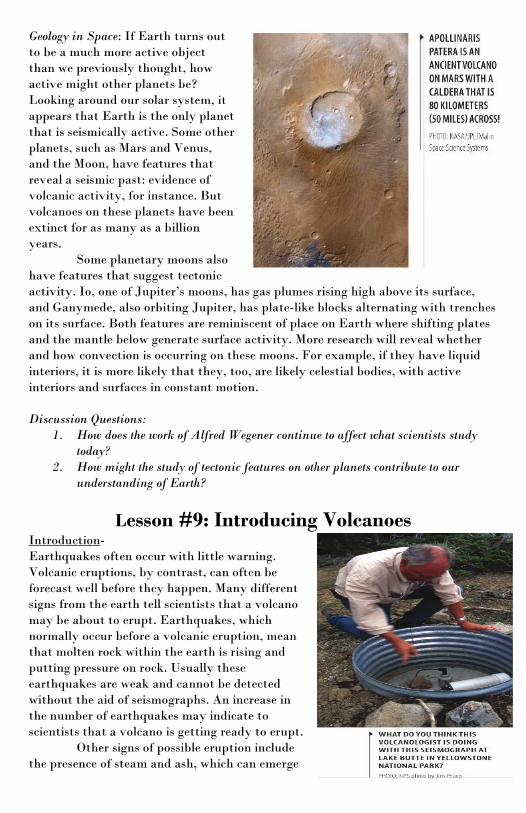
Geology in Space: If Earth turns out
to be a much more active object
than we previously thought, how
active might other planets be?
Looking around our solar system, it
appears that Earth is the only planet
that is seismically active. Some other
planets, such as Mars and Venus,
and the Moon, have features that
reveal a seismic past: evidence of
volcanic activity, for instance. But
volcanoes on these planets have been
extinct for as many as a billion
years.
Some planetary moons also
have features that suggest tectonic
activity. Io, one of Jupiter’s moons, has gas plumes rising high above its surface,
and Ganymede, also orbiting Jupiter, has plate-like blocks alternating with trenches
on its surface. Both features are reminiscent of place on Earth where shifting plates
and the mantle below generate surface activity. More research will reveal whether
and how convection is occurring on these moons. For example, if they have liquid
interiors, it is more likely that they, too, are likely celestial bodies, with active
interiors and surfaces in constant motion.
Discussion Questions:
1. How does the work of Alfred Wegener continue to affect what scientists study
today?
2. How might the study of tectonic features on other planets contribute to our
understanding of Earth?
Lesson #9: Introducing Volcanoes Introduction-
Earthquakes often occur with little warning.
Volcanic eruptions, by contrast, can often be
forecast well before they happen. Many different
signs from the earth tell scientists that a volcano
may be about to erupt. Earthquakes, which
normally occur before a volcanic eruption, mean
that molten rock within the earth is rising and
putting pressure on rock. Usually these
earthquakes are weak and cannot be detected
without the aid of seismographs. An increase in
the number of earthquakes may indicate to
scientists that a volcano is getting ready to erupt.
Other signs of possible eruption include
the presence of steam and ash, which can emerge
during small explosions from a volcanic vent. The amount of sulfur in the air over a
volcano might also increase as gas is released from the rising molten rock. The top
and sides of the volcano may begin to bulge as the molten rock approaches the
surface. Volcanologists use special tools to measure the changes that occur in a
volcano. By monitoring these changes, scientists can attempt to forecast when the
volcano might erupt. The right forecast can save lives and protect property.
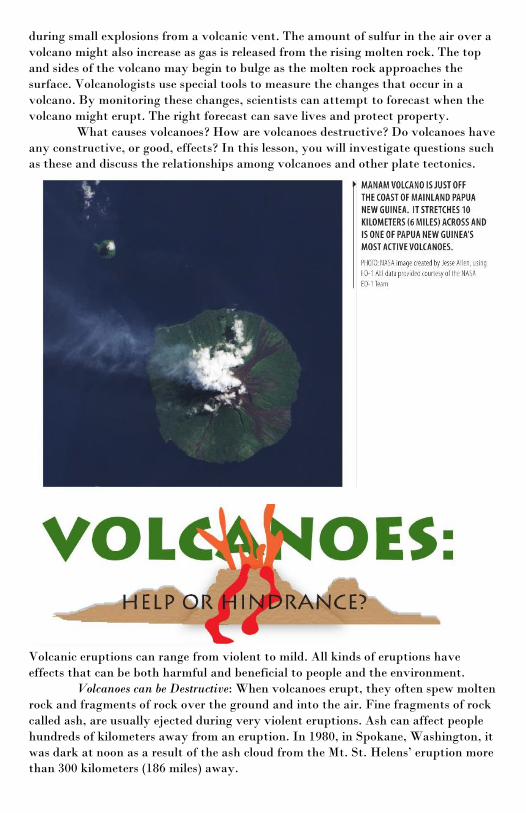
What causes volcanoes? How are volcanoes destructive? Do volcanoes have
any constructive, or good, effects? In this lesson, you will investigate questions such
as these and discuss the relationships among volcanoes and other plate tectonics.
Volcanic eruptions can range from violent to mild. All kinds of eruptions have
effects that can be both harmful and beneficial to people and the environment.
Volcanoes can be Destructive: When volcanoes erupt, they often spew molten
rock and fragments of rock over the ground and into the air. Fine fragments of rock
called ash, are usually ejected during very violent eruptions. Ash can affect people
hundreds of kilometers away from an eruption. In 1980, in Spokane, Washington, it
was dark at noon as a result of the ash cloud from the Mt. St. Helens’ eruption more
than 300 kilometers (186 miles) away.
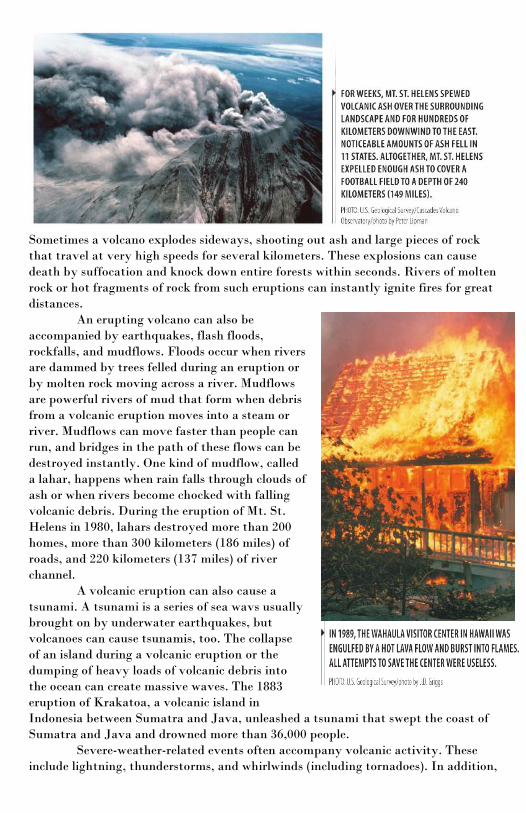
Sometimes a volcano explodes sideways, shooting out ash and large pieces of rock
that travel at very high speeds for several kilometers. These explosions can cause
death by suffocation and knock down entire forests within seconds. Rivers of molten
rock or hot fragments of rock from such eruptions can instantly ignite fires for great
distances.
An erupting volcano can also be
accompanied by earthquakes, flash floods,
rockfalls, and mudflows. Floods occur when rivers
are dammed by trees felled during an eruption or
by molten rock moving across a river. Mudflows
are powerful rivers of mud that form when debris
from a volcanic eruption moves into a steam or
river. Mudflows can move faster than people can
run, and bridges in the path of these flows can be
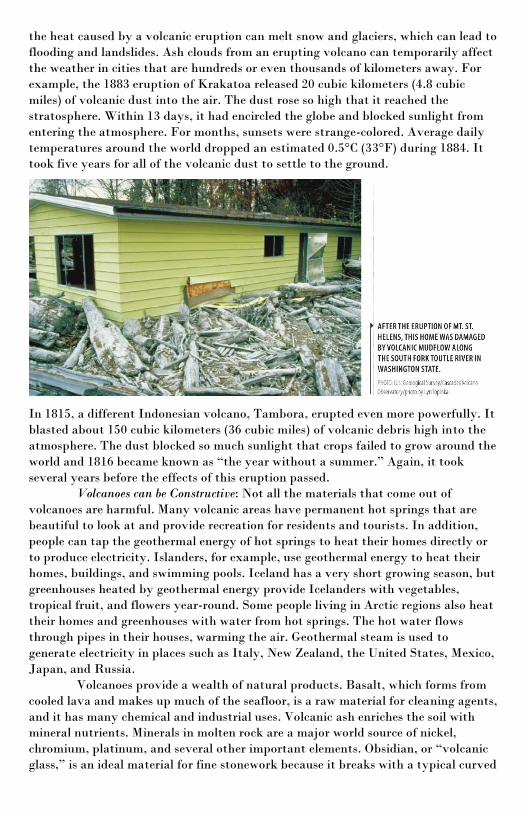
destroyed instantly. One kind of mudflow, called
a lahar, happens when rain falls through clouds of
ash or when rivers become chocked with falling
volcanic debris. During the eruption of Mt. St.
Helens in 1980, lahars destroyed more than 200
homes, more than 300 kilometers (186 miles) of
roads, and 220 kilometers (137 miles) of river
channel.
A volcanic eruption can also cause a
tsunami. A tsunami is a series of sea wavs usually
brought on by underwater earthquakes, but
volcanoes can cause tsunamis, too. The collapse
of an island during a volcanic eruption or the
dumping of heavy loads of volcanic debris into
the ocean can create massive waves. The 1883
eruption of Krakatoa, a volcanic island in
Indonesia between Sumatra and Java, unleashed a tsunami that swept the coast of
Sumatra and Java and drowned more than 36,000 people.
Severe-weather-related events often accompany volcanic activity. These
include lightning, thunderstorms, and whirlwinds (including tornadoes). In addition,
the heat caused by a volcanic eruption can melt snow and glaciers, which can lead to
flooding and landslides. Ash clouds from an erupting volcano can temporarily affect
the weather in cities that are hundreds or even thousands of kilometers away. For
example, the 1883 eruption of Krakatoa released 20 cubic kilometers (4.8 cubic
miles) of volcanic dust into the air. The dust rose so high that it reached the
stratosphere. Within 13 days, it had encircled the globe and blocked sunlight from
entering the atmosphere. For months, sunsets were strange-colored. Average daily
temperatures around the world dropped an estimated 0.5°C (33°F) during 1884. It
took five years for all of the volcanic dust to settle to the ground.
In 1815, a different Indonesian volcano, Tambora, erupted even more powerfully. It
blasted about 150 cubic kilometers (36 cubic miles) of volcanic debris high into the
atmosphere. The dust blocked so much sunlight that crops failed to grow around the
world and 1816 became known as “the year without a summer.” Again, it took
several years before the effects of this eruption passed.
Volcanoes can be Constructive: Not all the materials that come out of
volcanoes are harmful. Many volcanic areas have permanent hot springs that are
beautiful to look at and provide recreation for residents and tourists. In addition,
people can tap the geothermal energy of hot springs to heat their homes directly or
to produce electricity. Islanders, for example, use geothermal energy to heat their
homes, buildings, and swimming pools. Iceland has a very short growing season, but
greenhouses heated by geothermal energy provide Icelanders with vegetables,
tropical fruit, and flowers year-round. Some people living in Arctic regions also heat
their homes and greenhouses with water from hot springs. The hot water flows
through pipes in their houses, warming the air. Geothermal steam is used to
generate electricity in places such as Italy, New Zealand, the United States, Mexico,
Japan, and Russia.
Volcanoes provide a wealth of natural products. Basalt, which forms from
cooled lava and makes up much of the seafloor, is a raw material for cleaning agents,
and it has many chemical and industrial uses. Volcanic ash enriches the soil with
mineral nutrients. Minerals in molten rock are a major world source of nickel,
chromium, platinum, and several other important elements. Obsidian, or “volcanic
glass,” is an ideal material for fine stonework because it breaks with a typical curved
fracture when struck with a sharp blow. Beautiful arrowheads of obsidian have been
found in Ohio from the Hopewell culture, which flourished 1500 to 2300 years ago.
Volcanoes also create beautiful landscapes. Without volcanic activity, there
would be none of the spectacular fissures that dot the Hawaiian landscape or the
majestic peaks of the Cascade Range, such as Mt. Rainier.
Most people think of catastrophic events as violent natural hazards that
create human and environmental risks. But as we have just seen, there is another
side of the story. Catastrophic events can also be constructive forces on the earth.
Volcanoes affect the composition of our oceans and atmosphere. Floods create sandy
beaches along riverbanks. And earthquakes, as well as volcanoes, create and shape
the mountains and islands that people enjoy.
Discussion Questions:
1. The primary effect of a volcanic eruption is the spewing of lava, rocks, and/or
ash. What are some secondary effects of a volcanic eruption?
2. What are two ways in which volcanoes are seen as beneficial?
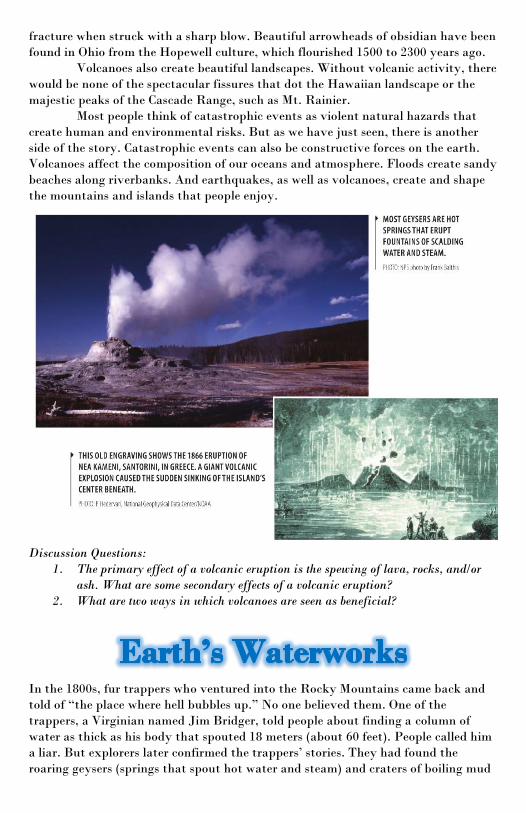
In the 1800s, fur trappers who ventured into the Rocky Mountains came back and
told of “the place where hell bubbles up.” No one believed them. One of the
trappers, a Virginian named Jim Bridger, told people about finding a column of
water as thick as his body that spouted 18 meters (about 60 feet). People called him
a liar. But explorers later confirmed the trappers’ stories. They had found the
roaring geysers (springs that spout hot water and steam) and craters of boiling mud

in the area that is now Yellowstone National
Park. Today, several million people every year
come to view these wonders at Yellowstone.
Yellowstone Park, located in Wyoming
and Montana, is the hottest, most active geyser
area in the world. It contains more than 500
geysers, or nearly three-fourths of all the
world’s geysers. In all, Yellowstone has 10,000
geothermal features (“geo” means “earth” and
“thermal” means “heat”). Besides geysers,
Yellowstone’s geothermal features include hot
springs and bubbling mud pots.
Why does Yellowstone have so many
hot springs? Most of Yellowstone sits inside an
ancient caldera. The volcano’s last major
eruption, which created the caldera, happened
600,000 years ago. Smaller lava flows from the
volcano gradually filled up most of the caldera. Rock under the earth’s surface can
stay hot for thousands of years. Heat from molten rock a few kilometers below the
surface heats the groundwater. The groundwater is held in a porous type of rock,
and the heated water travels upward until its bursts through the earth’s surface like
a fountain.
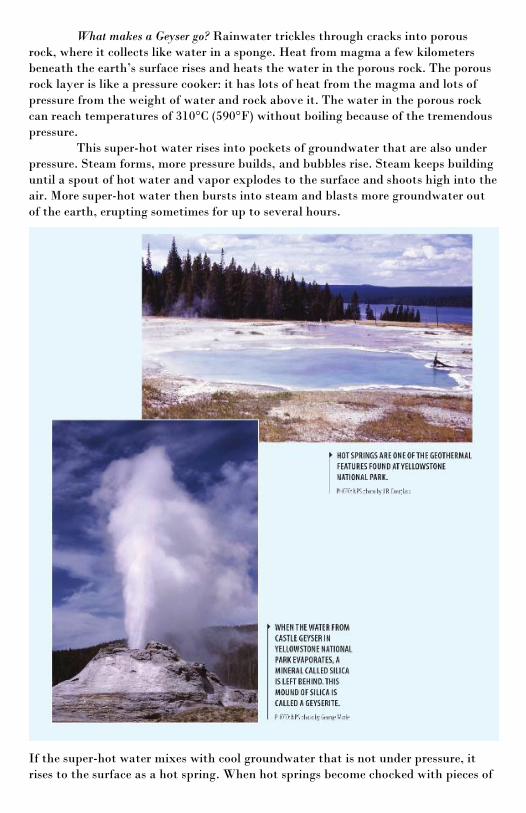
Old Faithful, Yellowstone’s most famous geyser, got its name because it
normally erupts on a regular basis—on average, every 79 minutes. The eruptions are
so regular because the water supply and the structure of the rock remain fairly
constant over time. Yet Old Faithful isn’t completely predictable. The time between
eruptions actually varies between 45 and 105 minutes, depending on the amount of
super-hot water left in the spongy rock when the geyser runs out of steam.
Recently, scientists lowered a video camera and other instruments into the
vent of Old Faithful. They found that for the first 20 or 30 seconds of each eruption
(which lasts for several minutes), steam and boiling water rocket through the
narrowest underground cracks at the speed of sound!
What makes a Geyser go? Rainwater trickles through cracks into porous
rock, where it collects like water in a sponge. Heat from magma a few kilometers
beneath the earth’s surface rises and heats the water in the porous rock. The porous
rock layer is like a pressure cooker: it has lots of heat from the magma and lots of
pressure from the weight of water and rock above it. The water in the porous rock
can reach temperatures of 310°C (590°F) without boiling because of the tremendous
pressure.
This super-hot water rises into pockets of groundwater that are also under
pressure. Steam forms, more pressure builds, and bubbles rise. Steam keeps building
until a spout of hot water and vapor explodes to the surface and shoots high into the
air. More super-hot water then bursts into steam and blasts more groundwater out
of the earth, erupting sometimes for up to several hours.
If the super-hot water mixes with cool groundwater that is not under pressure, it
rises to the surface as a hot spring. When hot springs become chocked with pieces of

weathered rock (sediment) that break off from the surrounding rock, bubbling mud
pots are the result.
If the super-hot water rises to the surface with no resistance, it begins to
boil and erupts at the surface as steam. This thermal feature, called a fumarole, is
like a geyser, except that it is mostly steam.
When Geysers lost their Steam: Some old geysers lose their steam. The super-
hot water carries minerals that, through time, accumulate on the walls of the
underground channels and cracks. Like arteries, the cracks become clogged, and
then steam and water can no longer escape.
For one Yellowstone geyser, named Porkchop, the pressure was too much.
It spouted water and steam for years. Then one day it blew rocks the size of TV sets
into the air and stopped gushing for good.
Discussion Questions:
1. Why do geysers erupt? Why don’t they remain as pools of hot underground
water?
2. Imagine you are a scientist tasked with studying how geysers might serve as
earthquake detectors. What sort of data could you gather?

Lesson #10: Exploration Activity- Exploring Mitigation of
Earthquakes and Volcanic Eruptions Introduction-
On December 26, 2004, the fourth
largest earthquake since 1900 rocked
the region around Sumatra and
triggered a tsunami that reached 14
countries. The landscape of Banda
Aceh was permanently altered. The
event killed 227,898 people, and 1.7
million people were displaced. The
earthquake registered 9.1 on the
Richter scale, and people in Banda
Aceh experienced a Mercalli rating
of IX. As tragic as this event was,
valuable lessons were learned and
headed. Was this disaster
preventable? What technologies and
designs have we developed as a
result of tragedies like this one?
In this activity, you will research an historic earthquake or volcanic
eruption. Then you will relate the event to a specific technology, building design, or
monitoring system that has been used to prevent the loss of lives in future
earthquakes or volcanic eruptions. You will work with your group to give a
historical perspective about the event, detail the event’s impact on people’s lives
and their surroundings, and describe the technology used to monitor and predict
these disasters. You will develop a detailed display summarizing your research and
present it to the class.
The next time your mind is wandering during class, consider what you may be
missing. In December of 2004, a ten-year-old British girl was able to save over a
hundred people, including her family, thanks to what she’d learned from a video
she’d seen in her geography class. The video showed a tsunami approaching shore; a
tsunami is a series of enormous, fast-moving ocean waves generated by an undersea
earthquake or volcanic eruption. They can be tremendously destructive. Although
tsunami waves may not be tall waves in the open ocean, as they knock up against
the rising seabed of the shore, they slow down, grow tens or hundreds of feet tall,
and begin to pile up behind each other. As they gather for the crash on the shore,
they may suck water back into the ocean, leaving people on the beach wondering
why the tide’s suddenly gone out so far.
Some time after Tilly Smith saw the tsunami video in class, her family took
a winter seaside vacation in Thailand, on the Indian Ocean. While playing on the
beach, Tilly noticed that the ocean was rising and becoming bubbly and frothy. The
scene that unfolded before her eyes looked alarmingly like what she had seen in the
video. In a panic, she screamed for her family to get off the beach. Luckily, her
parents took her fright seriously, warned other vacationers and guards, and ran up
the beach to their hotel. Other beachgoers followed. While they were sheltered on
the third floor of the hotel, the beach was pummeled by the tsunami. It was one of
the few beaches hit that day on which no one was killed.
The giant waves were caused by a powerful earthquake (magnitude-9) that
had occurred in Sumatra, an island in another part of the Indian Ocean, earlier that
day. Although Tilly’s ability to read the signs of a tsunami got everyone off her
hotel beach to safety, nearly 228,000 people in eleven countries were killed by the
tidal waves from the Indian Ocean during the catastrophic event.
If a ten-year-old was able to see a tsunami coming and clear a beach, why
couldn’t more people have been saved that day? The answer lies partially in how
difficult it can be to spot major catastrophes in time to warn authorities and have
them get people to safety. Tsunamis are huge volumes of water pushed into motion
by a catastrophic event undersea, but most of that rolling mass lies under the
ocean’s surface. In the open ocean, tsunami waves may look like normal waves, only
a foot or so tall. The bulk of the enormous wave lies underneath. It’s only when the
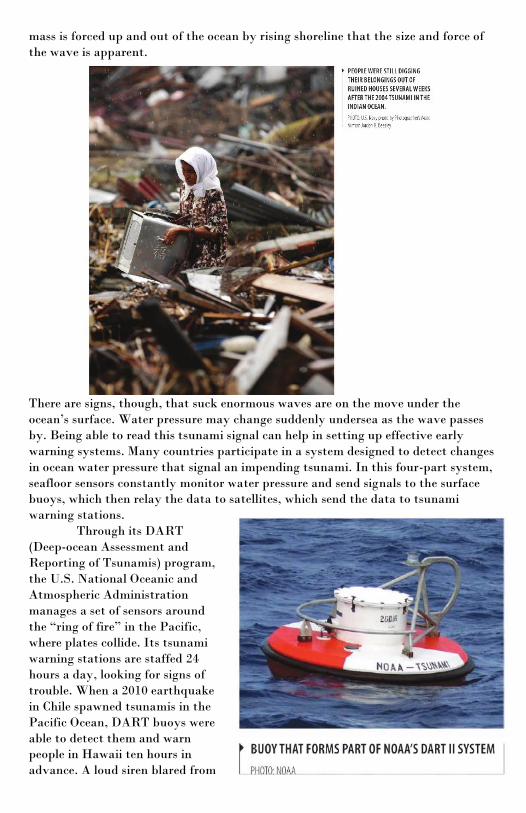
mass is forced up and out of the ocean by rising shoreline that the size and force of
the wave is apparent.
There are signs, though, that suck enormous waves are on the move under the
ocean’s surface. Water pressure may change suddenly undersea as the wave passes
by. Being able to read this tsunami signal can help in setting up effective early
warning systems. Many countries participate in a system designed to detect changes
in ocean water pressure that signal an impending tsunami. In this four-part system,
seafloor sensors constantly monitor water pressure and send signals to the surface
buoys, which then relay the data to satellites, which send the data to tsunami
warning stations.
Through its DART
(Deep-ocean Assessment and
Reporting of Tsunamis) program,
the U.S. National Oceanic and
Atmospheric Administration
manages a set of sensors around
the “ring of fire” in the Pacific,
where plates collide. Its tsunami
warning stations are staffed 24
hours a day, looking for signs of
trouble. When a 2010 earthquake
in Chile spawned tsunamis in the
Pacific Ocean, DART buoys were
able to detect them and warn
people in Hawaii ten hours in
advance. A loud siren blared from
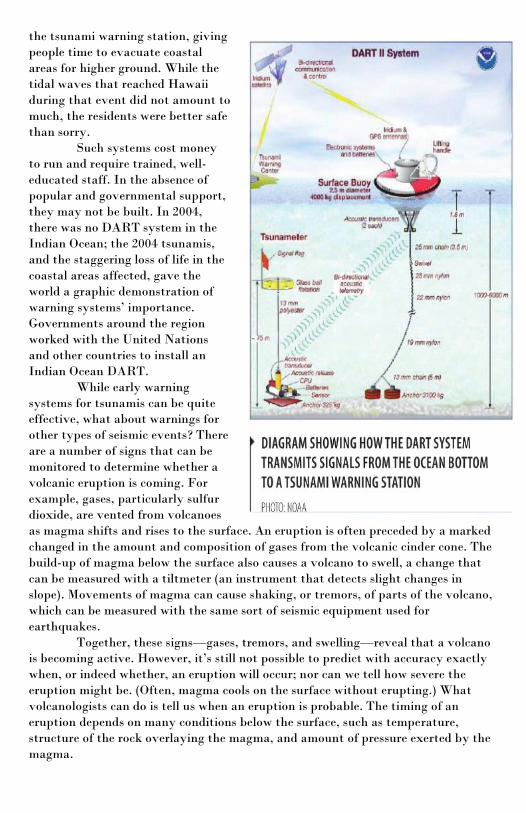
the tsunami warning station, giving
people time to evacuate coastal
areas for higher ground. While the
tidal waves that reached Hawaii
during that event did not amount to
much, the residents were better safe
than sorry.
Such systems cost money
to run and require trained, well-
educated staff. In the absence of
popular and governmental support,
they may not be built. In 2004,
there was no DART system in the
Indian Ocean; the 2004 tsunamis,
and the staggering loss of life in the
coastal areas affected, gave the
world a graphic demonstration of
warning systems’ importance.
Governments around the region
worked with the United Nations
and other countries to install an
Indian Ocean DART.
While early warning
systems for tsunamis can be quite
effective, what about warnings for
other types of seismic events? There
are a number of signs that can be
monitored to determine whether a
volcanic eruption is coming. For
example, gases, particularly sulfur
dioxide, are vented from volcanoes
as magma shifts and rises to the surface. An eruption is often preceded by a marked
changed in the amount and composition of gases from the volcanic cinder cone. The
build-up of magma below the surface also causes a volcano to swell, a change that
can be measured with a tiltmeter (an instrument that detects slight changes in
slope). Movements of magma can cause shaking, or tremors, of parts of the volcano,
which can be measured with the same sort of seismic equipment used for
earthquakes.
Together, these signs—gases, tremors, and swelling—reveal that a volcano
is becoming active. However, it’s still not possible to predict with accuracy exactly
when, or indeed whether, an eruption will occur; nor can we tell how severe the
eruption might be. (Often, magma cools on the surface without erupting.) What
volcanologists can do is tell us when an eruption is probable. The timing of an
eruption depends on many conditions below the surface, such as temperature,
structure of the rock overlaying the magma, and amount of pressure exerted by the
magma.

Consider the unfortunate events of 1993, when seven volcanologists were
studying the active Galeras Volcano in Colombia, South America. They were
collaborating to learn more about the early warning signs of eruption. Because the
recent tremors and venting of gases had abated, the scientists thought it was safe to
climb into the cone to take measurements. They were wrong. A massive explosion
killed all but one of the scientists, Stanley Williams, who had to crawl out with
broken legs and burned skin. It is thought that the Galeras Volcano had appeared to
be “asleep” because magma had sealed up all the surface cracks, temporarily
blocking the exit of gases and stilling the tremors. As magma continued to rise
inside, the extreme pressure brought on by this situation literally burst the volcano
open.
Developing early warning
systems for earthquakes has
also proven to be difficult.
For decades, scientists have
been developing technology
to monitor the seismic
changes that accompany
earthquakes. Earthquake
monitoring stations now use
specialized instruments to
detect P-waves, the fast-
moving waves that precede
the arrival of the more
damaging, slower waves.
Unfortunately, because
the more destructive waves
follow right on the heels of
the P-waves, at best we can
detect an earthquake less than a minute before its destructive impact. This falls
short of what we need for an early warning system. Would you be able to put down

what you are doing and evacuate to a safe place with less than a minute of warning?
The good news is that in recent years, scientists have found that by positioning
highly sensitive instruments as deep as a kilometer underground, they can measure
subtle changes in stresses on rocks that might signal a quake.
With continued seismological research, we should be able to develop earlier
warning systems for earthquakes as well as improve systems for volcanoes and
tsunamis. Scientists continue to work on understanding the sometimes hard-to-read
signs that a major seismic event is going to occur. As a professor at Arizona State
University, the recovered Stanley Williams still climbs into volcano cones collecting
data. The work that he and other scientists conduct may save a lot of lives by
making it possible to forecast catastrophic events in a timely, accurate way.
Discussion Questions:
1. The video Tilly watched in school helped her spot danger and warn her parents
of the tsunami. What else could have helped people get off the beach to safety?
2. Scientific research is often expensive, and we cannot fund all the research we
might like to fund. Suppose a friend said, “We’re really far from being able to
predict earthquakes. We should spend money on science that has a better chance
of success.” Do you agree or disagree? Why?
Lesson #11: Volcanoes Change the Landscape
Introduction-
The hot molten rock that
lies deep within the earth
rises through fractures in
the earth’s crust. Sometimes
it stays below the earth’s
surface, where it cools
slowly and forms new rock.
At other times, it spews out
onto the land or the ocean
floor. This is how volcanic
mountains or islands form.
If the molten rock flows
into the ocean or emerges
under the sea (such as along
mid-ocean ridges), it cools
as soon as it hits the water.
In recent years, scientists
have used remote-controlled
cameras to observe how red-
hot liquid rock emerging
from the ocean floor cools
and turns into a solid mound of lava in only a few seconds. Scientists call the
resulting underwater balloon-shaped mounds of lava “pillows.”
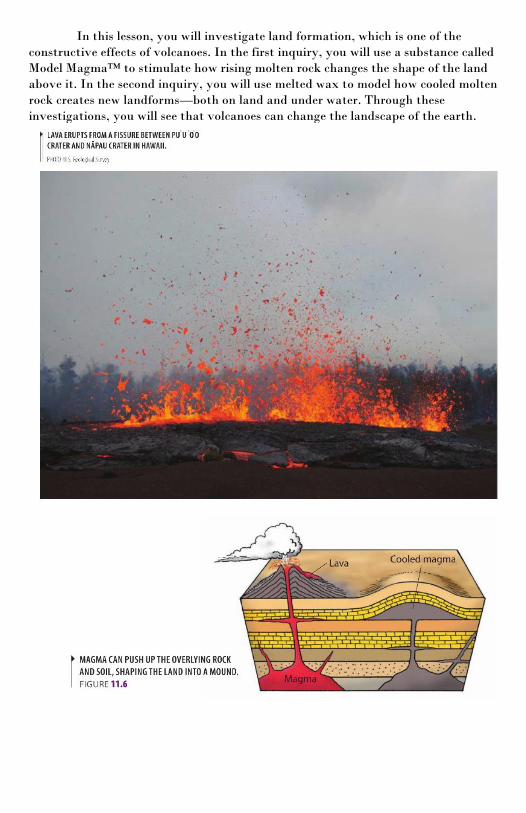
In this lesson, you will investigate land formation, which is one of the
constructive effects of volcanoes. In the first inquiry, you will use a substance called
Model Magma™ to stimulate how rising molten rock changes the shape of the land
above it. In the second inquiry, you will use melted wax to model how cooled molten
rock creates new landforms—both on land and under water. Through these
investigations, you will see that volcanoes can change the landscape of the earth.
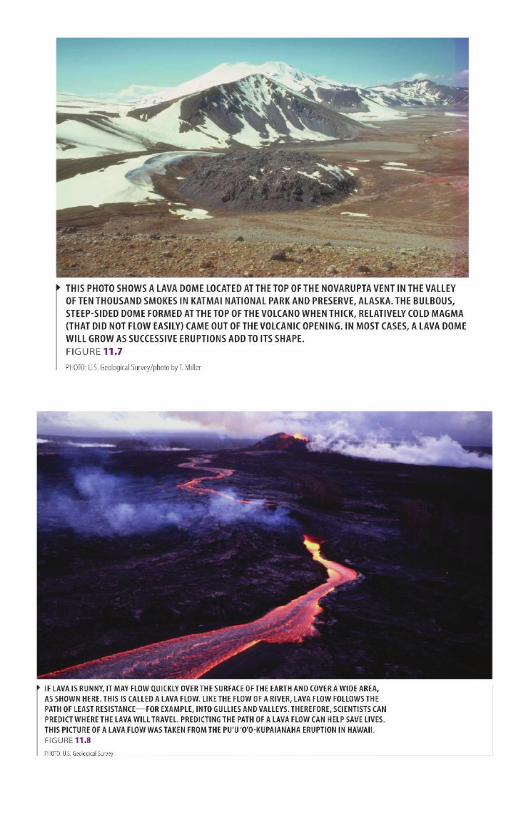
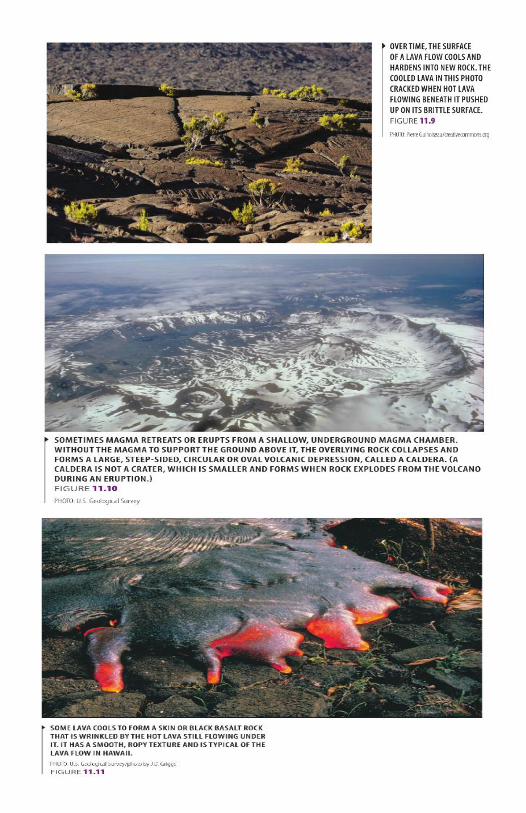
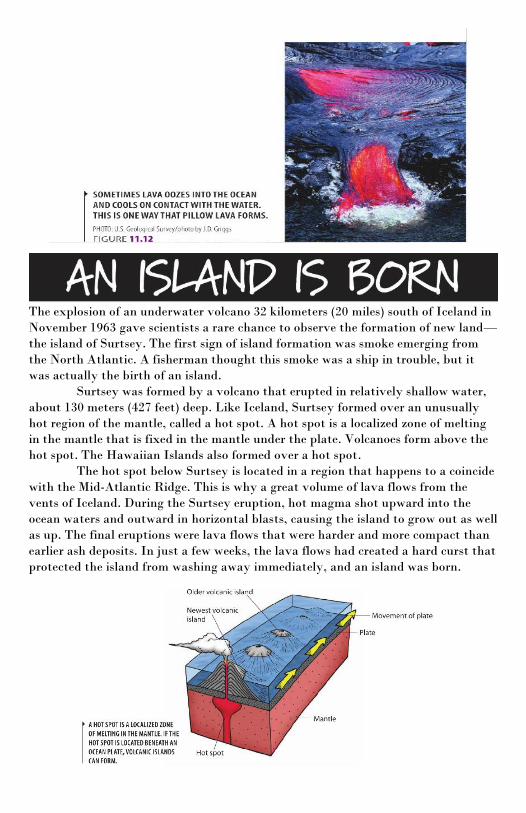
The explosion of an underwater volcano 32 kilometers (20 miles) south of Iceland in
November 1963 gave scientists a rare chance to observe the formation of new land—
the island of Surtsey. The first sign of island formation was smoke emerging from
the North Atlantic. A fisherman thought this smoke was a ship in trouble, but it
was actually the birth of an island.
Surtsey was formed by a volcano that erupted in relatively shallow water,
about 130 meters (427 feet) deep. Like Iceland, Surtsey formed over an unusually
hot region of the mantle, called a hot spot. A hot spot is a localized zone of melting
in the mantle that is fixed in the mantle under the plate. Volcanoes form above the
hot spot. The Hawaiian Islands also formed over a hot spot.
The hot spot below Surtsey is located in a region that happens to a coincide
with the Mid-Atlantic Ridge. This is why a great volume of lava flows from the
vents of Iceland. During the Surtsey eruption, hot magma shot upward into the
ocean waters and outward in horizontal blasts, causing the island to grow out as well
as up. The final eruptions were lava flows that were harder and more compact than
earlier ash deposits. In just a few weeks, the lava flows had created a hard curst that
protected the island from washing away immediately, and an island was born.
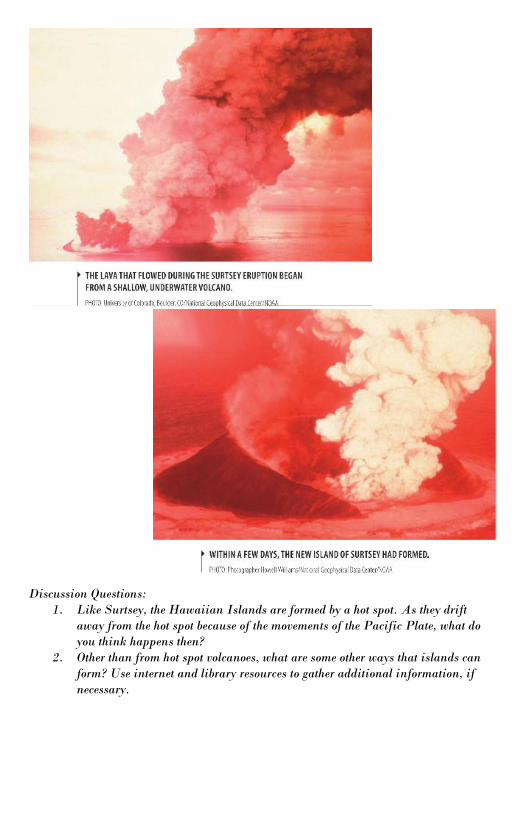
Discussion Questions:
1. Like Surtsey, the Hawaiian Islands are formed by a hot spot. As they drift
away from the hot spot because of the movements of the Pacific Plate, what do
you think happens then?
2. Other than from hot spot volcanoes, what are some other ways that islands can
form? Use internet and library resources to gather additional information, if
necessary.
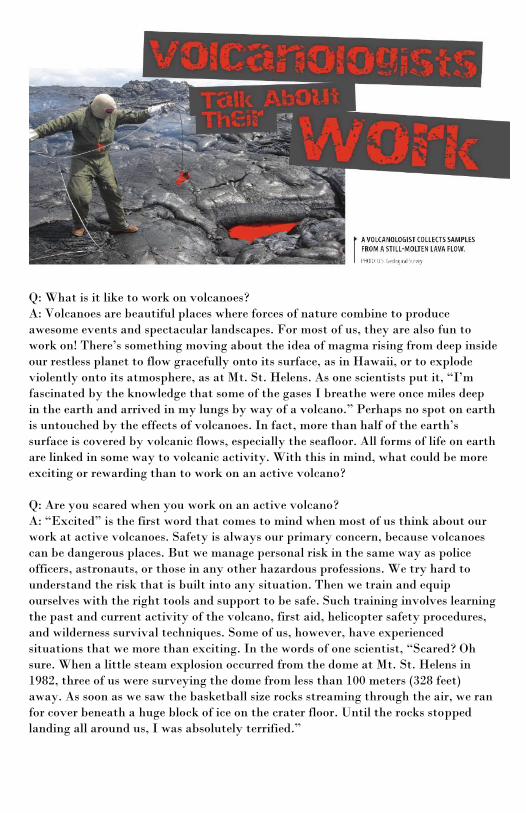
Q: What is it like to work on volcanoes?
A: Volcanoes are beautiful places where forces of nature combine to produce
awesome events and spectacular landscapes. For most of us, they are also fun to
work on! There’s something moving about the idea of magma rising from deep inside
our restless planet to flow gracefully onto its surface, as in Hawaii, or to explode
violently onto its atmosphere, as at Mt. St. Helens. As one scientists put it, “I’m
fascinated by the knowledge that some of the gases I breathe were once miles deep
in the earth and arrived in my lungs by way of a volcano.” Perhaps no spot on earth
is untouched by the effects of volcanoes. In fact, more than half of the earth’s
surface is covered by volcanic flows, especially the seafloor. All forms of life on earth
are linked in some way to volcanic activity. With this in mind, what could be more
exciting or rewarding than to work on an active volcano?
Q: Are you scared when you work on an active volcano?
A: “Excited” is the first word that comes to mind when most of us think about our
work at active volcanoes. Safety is always our primary concern, because volcanoes
can be dangerous places. But we manage personal risk in the same way as police
officers, astronauts, or those in any other hazardous professions. We try hard to
understand the risk that is built into any situation. Then we train and equip
ourselves with the right tools and support to be safe. Such training involves learning
the past and current activity of the volcano, first aid, helicopter safety procedures,
and wilderness survival techniques. Some of us, however, have experienced
situations that we more than exciting. In the words of one scientist, “Scared? Oh
sure. When a little steam explosion occurred from the dome at Mt. St. Helens in
1982, three of us were surveying the dome from less than 100 meters (328 feet)
away. As soon as we saw the basketball size rocks streaming through the air, we ran
for cover beneath a huge block of ice on the crater floor. Until the rocks stopped
landing all around us, I was absolutely terrified.”
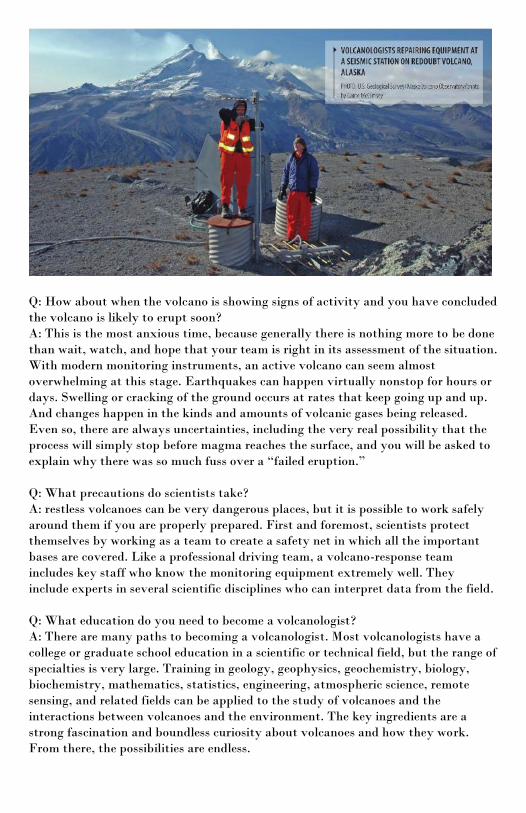
Q: How about when the volcano is showing signs of activity and you have concluded
the volcano is likely to erupt soon?
A: This is the most anxious time, because generally there is nothing more to be done
than wait, watch, and hope that your team is right in its assessment of the situation.
With modern monitoring instruments, an active volcano can seem almost
overwhelming at this stage. Earthquakes can happen virtually nonstop for hours or
days. Swelling or cracking of the ground occurs at rates that keep going up and up.
And changes happen in the kinds and amounts of volcanic gases being released.
Even so, there are always uncertainties, including the very real possibility that the
process will simply stop before magma reaches the surface, and you will be asked to
explain why there was so much fuss over a “failed eruption.”
Q: What precautions do scientists take?
A: restless volcanoes can be very dangerous places, but it is possible to work safely
around them if you are properly prepared. First and foremost, scientists protect
themselves by working as a team to create a safety net in which all the important
bases are covered. Like a professional driving team, a volcano-response team
includes key staff who know the monitoring equipment extremely well. They
include experts in several scientific disciplines who can interpret data from the field.
Q: What education do you need to become a volcanologist?
A: There are many paths to becoming a volcanologist. Most volcanologists have a
college or graduate school education in a scientific or technical field, but the range of
specialties is very large. Training in geology, geophysics, geochemistry, biology,
biochemistry, mathematics, statistics, engineering, atmospheric science, remote
sensing, and related fields can be applied to the study of volcanoes and the
interactions between volcanoes and the environment. The key ingredients are a
strong fascination and boundless curiosity about volcanoes and how they work.
From there, the possibilities are endless.
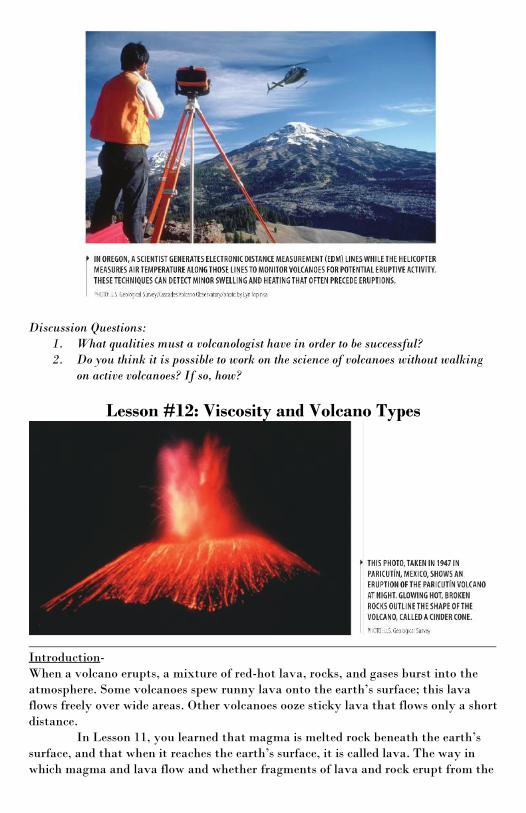
Discussion Questions:
1. What qualities must a volcanologist have in order to be successful?
2. Do you think it is possible to work on the science of volcanoes without walking
on active volcanoes? If so, how?
Lesson #12: Viscosity and Volcano Types
Introduction-
When a volcano erupts, a mixture of red-hot lava, rocks, and gases burst into the
atmosphere. Some volcanoes spew runny lava onto the earth’s surface; this lava
flows freely over wide areas. Other volcanoes ooze sticky lava that flows only a short
distance.
In Lesson 11, you learned that magma is melted rock beneath the earth’s
surface, and that when it reaches the earth’s surface, it is called lava. The way in
which magma and lava flow and whether fragments of lava and rock erupt from the
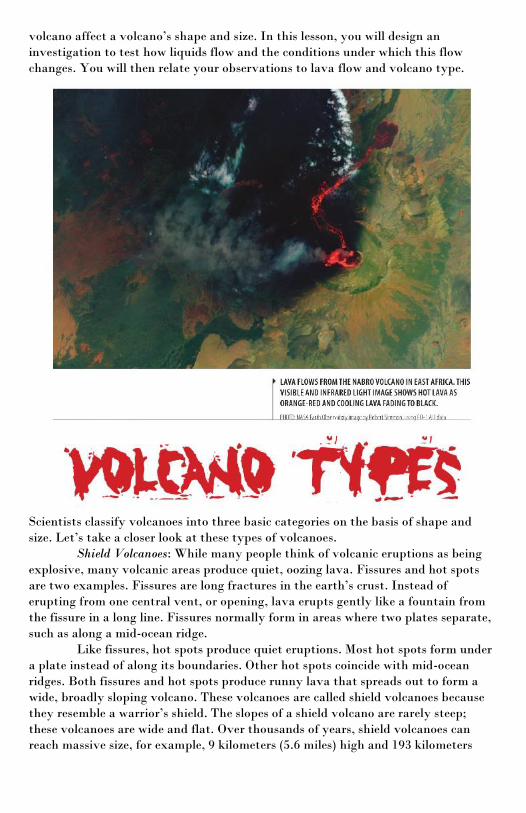
volcano affect a volcano’s shape and size. In this lesson, you will design an
investigation to test how liquids flow and the conditions under which this flow
changes. You will then relate your observations to lava flow and volcano type.
Scientists classify volcanoes into three basic categories on the basis of shape and
size. Let’s take a closer look at these types of volcanoes.
Shield Volcanoes: While many people think of volcanic eruptions as being
explosive, many volcanic areas produce quiet, oozing lava. Fissures and hot spots
are two examples. Fissures are long fractures in the earth’s crust. Instead of
erupting from one central vent, or opening, lava erupts gently like a fountain from
the fissure in a long line. Fissures normally form in areas where two plates separate,
such as along a mid-ocean ridge.
Like fissures, hot spots produce quiet eruptions. Most hot spots form under
a plate instead of along its boundaries. Other hot spots coincide with mid-ocean
ridges. Both fissures and hot spots produce runny lava that spreads out to form a
wide, broadly sloping volcano. These volcanoes are called shield volcanoes because
they resemble a warrior’s shield. The slopes of a shield volcano are rarely steep;
these volcanoes are wide and flat. Over thousands of years, shield volcanoes can
reach massive size, for example, 9 kilometers (5.6 miles) high and 193 kilometers
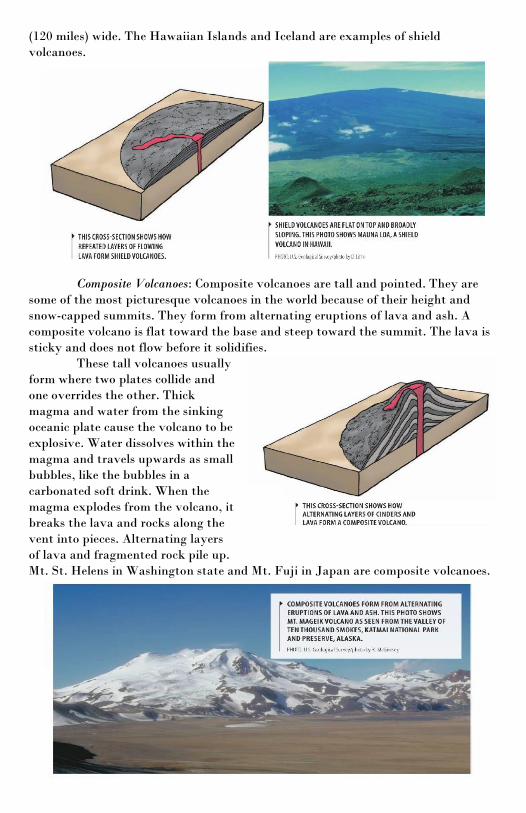
(120 miles) wide. The Hawaiian Islands and Iceland are examples of shield
volcanoes.
Composite Volcanoes: Composite volcanoes are tall and pointed. They are
some of the most picturesque volcanoes in the world because of their height and
snow-capped summits. They form from alternating eruptions of lava and ash. A
composite volcano is flat toward the base and steep toward the summit. The lava is
sticky and does not flow before it solidifies.
These tall volcanoes usually
form where two plates collide and
one overrides the other. Thick
magma and water from the sinking
oceanic plate cause the volcano to be
explosive. Water dissolves within the
magma and travels upwards as small
bubbles, like the bubbles in a
carbonated soft drink. When the
magma explodes from the volcano, it
breaks the lava and rocks along the
vent into pieces. Alternating layers
of lava and fragmented rock pile up.
Mt. St. Helens in Washington state and Mt. Fuji in Japan are composite volcanoes.
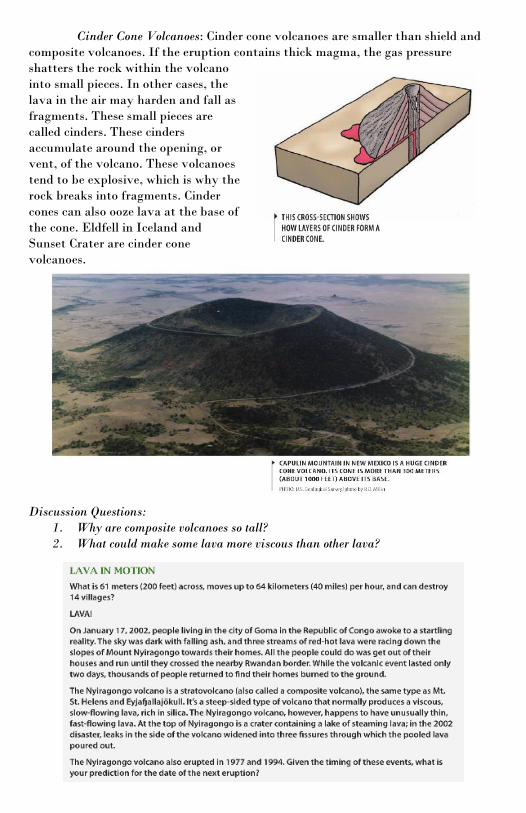
Cinder Cone Volcanoes: Cinder cone volcanoes are smaller than shield and
composite volcanoes. If the eruption contains thick magma, the gas pressure
shatters the rock within the volcano
into small pieces. In other cases, the
lava in the air may harden and fall as
fragments. These small pieces are
called cinders. These cinders
accumulate around the opening, or
vent, of the volcano. These volcanoes
tend to be explosive, which is why the
rock breaks into fragments. Cinder
cones can also ooze lava at the base of
the cone. Eldfell in Iceland and
Sunset Crater are cinder cone
volcanoes.
Discussion Questions:
1. Why are composite volcanoes so tall?
2. What could make some lava more viscous than other lava?
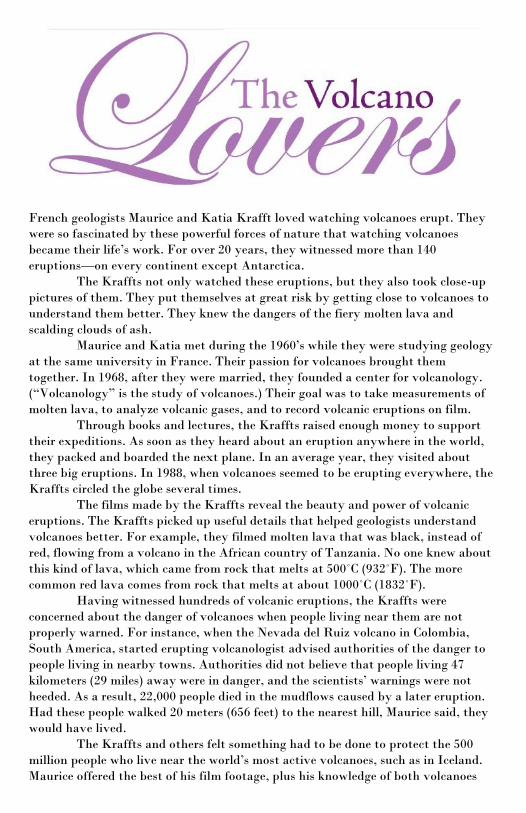
French geologists Maurice and Katia Krafft loved watching volcanoes erupt. They
were so fascinated by these powerful forces of nature that watching volcanoes
became their life’s work. For over 20 years, they witnessed more than 140
eruptions—on every continent except Antarctica.
The Kraffts not only watched these eruptions, but they also took close-up
pictures of them. They put themselves at great risk by getting close to volcanoes to
understand them better. They knew the dangers of the fiery molten lava and
scalding clouds of ash.
Maurice and Katia met during the 1960’s while they were studying geology
at the same university in France. Their passion for volcanoes brought them
together. In 1968, after they were married, they founded a center for volcanology.
(“Volcanology” is the study of volcanoes.) Their goal was to take measurements of
molten lava, to analyze volcanic gases, and to record volcanic eruptions on film.
Through books and lectures, the Kraffts raised enough money to support
their expeditions. As soon as they heard about an eruption anywhere in the world,
they packed and boarded the next plane. In an average year, they visited about
three big eruptions. In 1988, when volcanoes seemed to be erupting everywhere, the
Kraffts circled the globe several times.
The films made by the Kraffts reveal the beauty and power of volcanic
eruptions. The Kraffts picked up useful details that helped geologists understand
volcanoes better. For example, they filmed molten lava that was black, instead of
red, flowing from a volcano in the African country of Tanzania. No one knew about
this kind of lava, which came from rock that melts at 500˚C (932˚F). The more
common red lava comes from rock that melts at about 1000˚C (1832˚F).
Having witnessed hundreds of volcanic eruptions, the Kraffts were
concerned about the danger of volcanoes when people living near them are not
properly warned. For instance, when the Nevada del Ruiz volcano in Colombia,
South America, started erupting volcanologist advised authorities of the danger to
people living in nearby towns. Authorities did not believe that people living 47
kilometers (29 miles) away were in danger, and the scientists’ warnings were not
heeded. As a result, 22,000 people died in the mudflows caused by a later eruption.
Had these people walked 20 meters (656 feet) to the nearest hill, Maurice said, they
would have lived.
The Kraffts and others felt something had to be done to protect the 500
million people who live near the world’s most active volcanoes, such as in Iceland.
Maurice offered the best of his film footage, plus his knowledge of both volcanoes
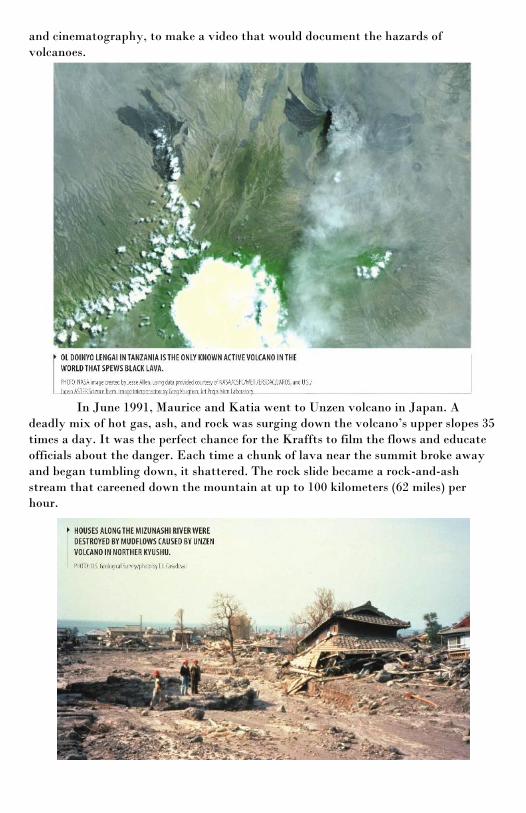
and cinematography, to make a video that would document the hazards of
volcanoes.
In June 1991, Maurice and Katia went to Unzen volcano in Japan. A
deadly mix of hot gas, ash, and rock was surging down the volcano’s upper slopes 35
times a day. It was the perfect chance for the Kraffts to film the flows and educate
officials about the danger. Each time a chunk of lava near the summit broke away
and began tumbling down, it shattered. The rock slide became a rock-and-ash
stream that careened down the mountain at up to 100 kilometers (62 miles) per
hour.
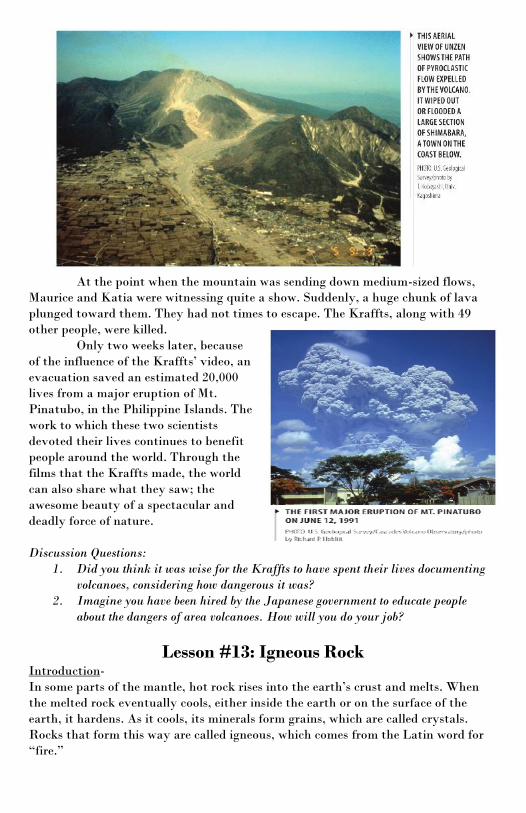
At the point when the mountain was sending down medium-sized flows,
Maurice and Katia were witnessing quite a show. Suddenly, a huge chunk of lava
plunged toward them. They had not times to escape. The Kraffts, along with 49
other people, were killed.
Only two weeks later, because
of the influence of the Kraffts’ video, an
evacuation saved an estimated 20,000
lives from a major eruption of Mt.
Pinatubo, in the Philippine Islands. The
work to which these two scientists
devoted their lives continues to benefit
people around the world. Through the
films that the Kraffts made, the world
can also share what they saw; the
awesome beauty of a spectacular and
deadly force of nature.
Discussion Questions:
1. Did you think it was wise for the Kraffts to have spent their lives documenting
volcanoes, considering how dangerous it was?
2. Imagine you have been hired by the Japanese government to educate people
about the dangers of area volcanoes. How will you do your job?
Lesson #13: Igneous Rock Introduction-
In some parts of the mantle, hot rock rises into the earth’s crust and melts. When
the melted rock eventually cools, either inside the earth or on the surface of the
earth, it hardens. As it cools, its minerals form grains, which are called crystals.
Rocks that form this way are called igneous, which comes from the Latin word for
“fire.”
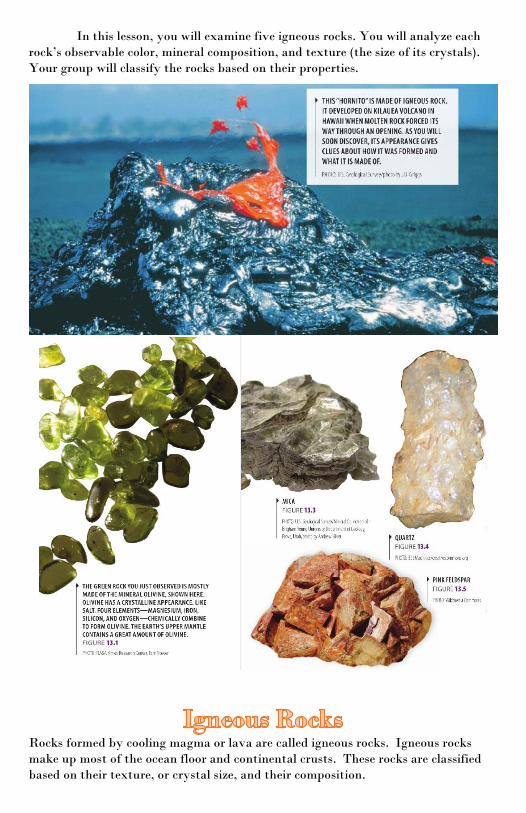
In this lesson, you will examine five igneous rocks. You will analyze each
rock’s observable color, mineral composition, and texture (the size of its crystals).
Your group will classify the rocks based on their properties.
Rocks formed by cooling magma or lava are called igneous rocks. Igneous rocks
make up most of the ocean floor and continental crusts. These rocks are classified
based on their texture, or crystal size, and their composition.
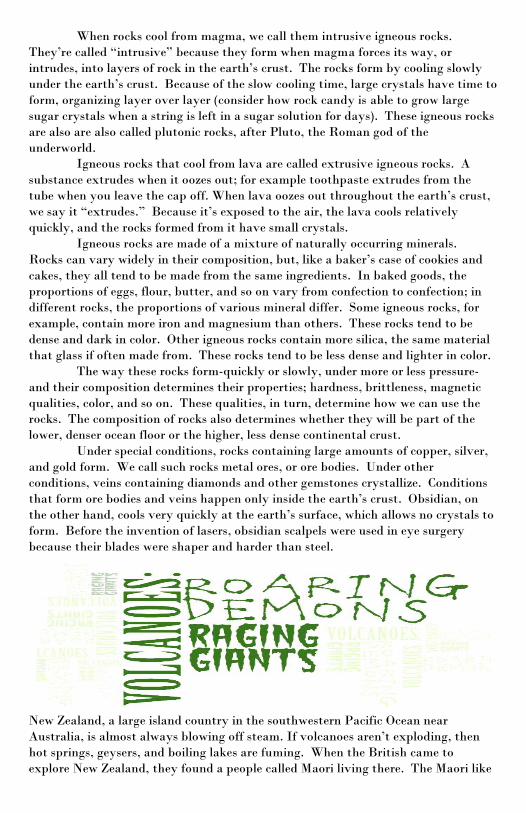
When rocks cool from magma, we call them intrusive igneous rocks.
They’re called “intrusive” because they form when magma forces its way, or
intrudes, into layers of rock in the earth’s crust. The rocks form by cooling slowly
under the earth’s crust. Because of the slow cooling time, large crystals have time to
form, organizing layer over layer (consider how rock candy is able to grow large
sugar crystals when a string is left in a sugar solution for days). These igneous rocks
are also are also called plutonic rocks, after Pluto, the Roman god of the
underworld.
Igneous rocks that cool from lava are called extrusive igneous rocks. A
substance extrudes when it oozes out; for example toothpaste extrudes from the
tube when you leave the cap off. When lava oozes out throughout the earth’s crust,
we say it “extrudes.” Because it’s exposed to the air, the lava cools relatively
quickly, and the rocks formed from it have small crystals.
Igneous rocks are made of a mixture of naturally occurring minerals.
Rocks can vary widely in their composition, but, like a baker’s case of cookies and
cakes, they all tend to be made from the same ingredients. In baked goods, the
proportions of eggs, flour, butter, and so on vary from confection to confection; in
different rocks, the proportions of various mineral differ. Some igneous rocks, for
example, contain more iron and magnesium than others. These rocks tend to be
dense and dark in color. Other igneous rocks contain more silica, the same material
that glass if often made from. These rocks tend to be less dense and lighter in color.
The way these rocks form-quickly or slowly, under more or less pressure-
and their composition determines their properties; hardness, brittleness, magnetic
qualities, color, and so on. These qualities, in turn, determine how we can use the
rocks. The composition of rocks also determines whether they will be part of the
lower, denser ocean floor or the higher, less dense continental crust.
Under special conditions, rocks containing large amounts of copper, silver,
and gold form. We call such rocks metal ores, or ore bodies. Under other
conditions, veins containing diamonds and other gemstones crystallize. Conditions
that form ore bodies and veins happen only inside the earth’s crust. Obsidian, on
the other hand, cools very quickly at the earth’s surface, which allows no crystals to
form. Before the invention of lasers, obsidian scalpels were used in eye surgery
because their blades were shaper and harder than steel.
New Zealand, a large island country in the southwestern Pacific Ocean near
Australia, is almost always blowing off steam. If volcanoes aren’t exploding, then
hot springs, geysers, and boiling lakes are fuming. When the British came to
explore New Zealand, they found a people called Maori living there. The Maori like
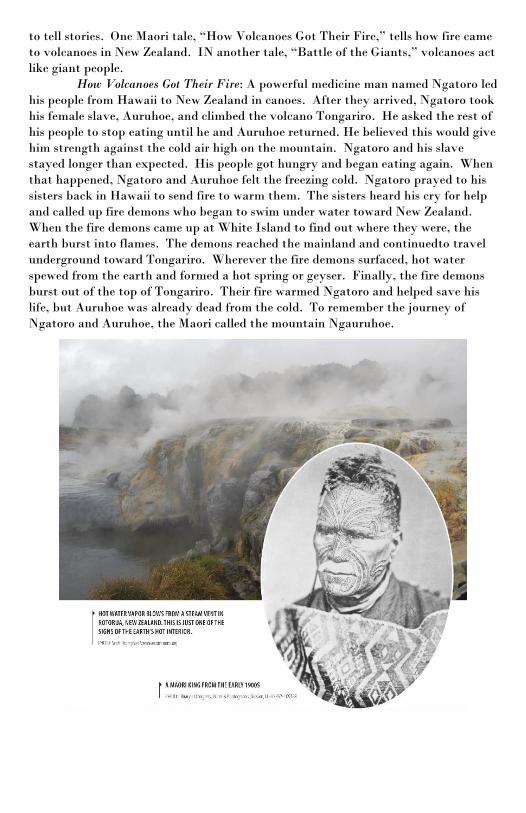
to tell stories. One Maori tale, “How Volcanoes Got Their Fire,” tells how fire came
to volcanoes in New Zealand. IN another tale, “Battle of the Giants,” volcanoes act
like giant people.
How Volcanoes Got Their Fire: A powerful medicine man named Ngatoro led
his people from Hawaii to New Zealand in canoes. After they arrived, Ngatoro took
his female slave, Auruhoe, and climbed the volcano Tongariro. He asked the rest of
his people to stop eating until he and Auruhoe returned. He believed this would give
him strength against the cold air high on the mountain. Ngatoro and his slave
stayed longer than expected. His people got hungry and began eating again. When
that happened, Ngatoro and Auruhoe felt the freezing cold. Ngatoro prayed to his
sisters back in Hawaii to send fire to warm them. The sisters heard his cry for help
and called up fire demons who began to swim under water toward New Zealand.
When the fire demons came up at White Island to find out where they were, the
earth burst into flames. The demons reached the mainland and continuedto travel
underground toward Tongariro. Wherever the fire demons surfaced, hot water
spewed from the earth and formed a hot spring or geyser. Finally, the fire demons
burst out of the top of Tongariro. Their fire warmed Ngatoro and helped save his
life, but Auruhoe was already dead from the cold. To remember the journey of
Ngatoro and Auruhoe, the Maori called the mountain Ngauruhoe.

Battle of the Giants: Three volcanoes-Taranaki, Ruapehu, and Tongariro-lived near
each other. Taranaki and Ruapehu both fell in love with Tongariro, but she could
not decide which one she preferred. Finally, they decided to fight for her. Tearing
himself loose from the earth, Taranaki thrust himself at Ruapehu and tried to crush
him. “I’ll get you,” fumed Ruapehu. He heated the waters in his crater lake until
they were boiling. Then he sprayed scalding water over Taranaki and on the
countryside around him. The scalding bath hurt Taranaki badly. Furious, he
hurled a shower of stones at Ruapehu. He swallowed his broken cone, melted it, and
spat it at Taranaki. The molten cone burned Taranaki badly, and he ran to the sea
to cool his burns.
For a long time, when Tongariro erupted, the warlike tribes of the area saw
it as a sign that they should act like the quarreling giants in the myth, and they
made war with each other. Today, the Maori are still afraid that Taranaki will
awaken and begin fighting again. They refuse to live or be buried anywhere on a
line between Taranaki and the other two peaks. They may be right, Taranaki, 2400
meters (7874 feet) high and snow capped, last erupted only 300 years ago. In their
stories, the Maori were probably describing events that they had seen. When a
volcano erupts, the top of the mountain sometimes blows off or collapses into the
crater. Such an event was probably the basis of the story about Ruapehu’s broken
cone. Scientists have also shown that the path of lava that flowed from Taranaki to
the sea formed New Zealand’s Wanganui River Valley.
Discussion Questions:
1. Why do people tell stories “How Volcanoes Got Their Fire?” Are non-scientific
stories that explain catastrophic events useful?
2. What sorts of volcanic events might people have been describing in the telling of
“Battle of the Giants”?
Lesson #14: Volcanic Ash Introduction-
When magma forcefully erupts from a volcano, it can shatter into billions of
fragments. These pieces can be as small as dust particles of as large as trucks. The
fragmented materials include rocks, minerals, and broken pieces of volcanic glass.
When the broken pieces are fine grained, the material is called volcanic ash.
Most people think of a volcanic eruption as fiery streams of red lava and
glowing rock. Lava flows can pose great danger to people. They may cover the land
and can even set buildings or trees on fire. Lava flows, however, are actually the
least dangerous part of a volcanic eruption. Most lava flows do not move
particularly fast. And because they are fluid, they tend to flow along low-lying
areas. This means that predicting the path of the lava is fairly easy. Although
property will be destroyed, areas likely to be affected by the lava can be evacuated.
Ash from violent eruption, in contrast, often poses great environmental and
personal dangers. During an ash fall, the ash that has been ejected into the
atmosphere settles back to the earth over a wide area. The ash may cover
everything it falls on, smothering crops and coating people’s lungs. Or it can erupt
into the atmosphere, blocking sunlight, and making daylights turn to darkness. Ash
can also move over the ground or close to it in clouds of ash and gas. These clouds,
which move like raging rivers, sometimes move at more than 400 kilometers (249
miles) per hour. Melted glaciers, snow, and rain-soaked soils mix with the ash.
These mudflows of ash flow down the mountainside, hugging the ground.
In this lesson, you will examine rock fragments that make up volcanic ash
and model an ash fall. You will investigate how different-sized volcanic materials
erupt into and settle out of the air. You will then discuss how an ash fall can affect
the atmosphere, weather, the land, and people and animals.
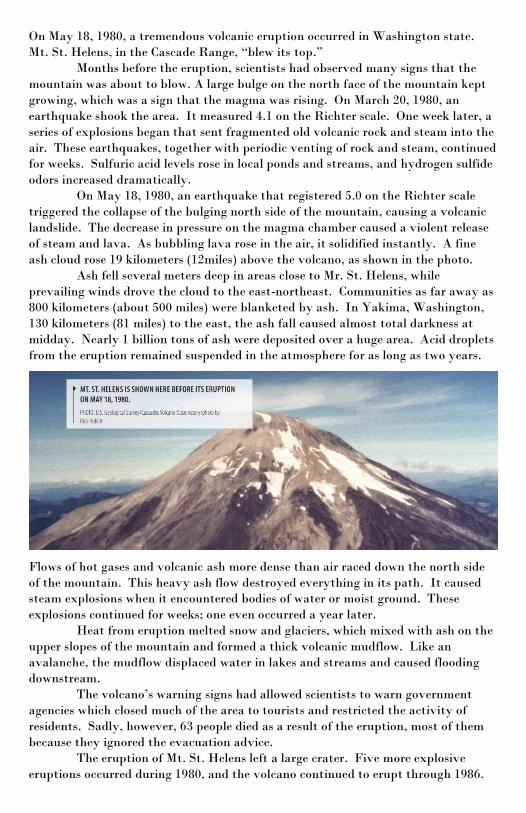
On May 18, 1980, a tremendous volcanic eruption occurred in Washington state.
Mt. St. Helens, in the Cascade Range, “blew its top.”
Months before the eruption, scientists had observed many signs that the
mountain was about to blow. A large bulge on the north face of the mountain kept
growing, which was a sign that the magma was rising. On March 20, 1980, an
earthquake shook the area. It measured 4.1 on the Richter scale. One week later, a
series of explosions began that sent fragmented old volcanic rock and steam into the
air. These earthquakes, together with periodic venting of rock and steam, continued
for weeks. Sulfuric acid levels rose in local ponds and streams, and hydrogen sulfide
odors increased dramatically.
On May 18, 1980, an earthquake that registered 5.0 on the Richter scale
triggered the collapse of the bulging north side of the mountain, causing a volcanic
landslide. The decrease in pressure on the magma chamber caused a violent release
of steam and lava. As bubbling lava rose in the air, it solidified instantly. A fine
ash cloud rose 19 kilometers (12miles) above the volcano, as shown in the photo.
Ash fell several meters deep in areas close to Mr. St. Helens, while
prevailing winds drove the cloud to the east-northeast. Communities as far away as
800 kilometers (about 500 miles) were blanketed by ash. In Yakima, Washington,
130 kilometers (81 miles) to the east, the ash fall caused almost total darkness at
midday. Nearly 1 billion tons of ash were deposited over a huge area. Acid droplets
from the eruption remained suspended in the atmosphere for as long as two years.
Flows of hot gases and volcanic ash more dense than air raced down the north side
of the mountain. This heavy ash flow destroyed everything in its path. It caused
steam explosions when it encountered bodies of water or moist ground. These
explosions continued for weeks; one even occurred a year later.
Heat from eruption melted snow and glaciers, which mixed with ash on the
upper slopes of the mountain and formed a thick volcanic mudflow. Like an
avalanche, the mudflow displaced water in lakes and streams and caused flooding
downstream.
The volcano’s warning signs had allowed scientists to warn government
agencies which closed much of the area to tourists and restricted the activity of
residents. Sadly, however, 63 people died as a result of the eruption, most of them
because they ignored the evacuation advice.
The eruption of Mt. St. Helens left a large crater. Five more explosive
eruptions occurred during 1980, and the volcano continued to erupt through 1986.

These successive eruptions created a lava dome on the floor of the crater. Today,
eruptions appear to be over. But Mt. St. Helens is the most frequently active
volcano in the Cascade Range, and scientists anticipate the volcano will erupt
violently again.
Monitoring the Volcano’s Warning
Signs: Scientists at the U. S.
Geological Survey monitor Mt. St.
Helens in order to predict future
eruptions. In the photo on page 198,
geologists use a steel tape to measure
the distance across a crack in the
volcano’s crater floor. Widening
cracks indicate that magma is rising,
deforming the area, and leading to an
eruption. These cracks usually extend
outward from the lava dome, like the
spokes of a wheel.
Geologists use a tiltmeter to
electronically measure changes in the
slope of the crater floor, which are
caused by moving magma. Tiltmeters
allow 24-hour monitoring. The
information collected from these
instruments is relayed to the volcano observatory.
Scientists also place seismographs at stations near the lava dome to monitor
earthquake activity. And increase in the number of earthquake vibrations is often
the first sign that a major eruption is approaching. Scientists also collect gas sample
from the volcano. They place gas sensors around vents and near the lava dome and
crater floor. Specially equipped airplanes measure sulfur dioxide gas, which usually
increases 5- to 10-fold during an eruption.

Signs of Renewal: Plant and animal life returned to
Mt. St. Helens. As early as the summer of 1980,
new vegetation began to appear. Many small trees
and plants, which had been protected during the
eruption by packed snow, re-emerged after
snowmelt. Seeds carried by the wind or by animals
landed in the area and sprouted on the lava–
covered ground. By 1985, new growth covered all
the ridges surrounding the volcano. During the
May 1980 eruption, many small animals-such as
gophers, mice, frogs, fish, and insects-were
protected from the blast because they were below
ground or underwater. Many large animals, such as
bear, elk, deer, and coyotes, were killed in the
eruption, but with the return of a food supply, they
have repopulated the region.
Future Eruptions? Several
other mountains in the
Cascade Range (see map)
pose a threat to populated
area. Eruptions of Mr. Shasta in northern
California would cause damage and perhaps
fatalities to several nearby communities.
Mt. Hood, in Oregon, lies less than 65
kilometers (40 miles away from the densely
populated city of Portland. Probably the
most dangerous eruption would be from Mt.
Rainier, one of which completely covered an
area that is now populated by 120,000
people. No one can predict when another
mudflow from M. Rainier might take place
or when any of these Cascade mountain
volcanoes might “wake up.” With
continued monitoring and emergency
evacuation plans in place, scientists and
public officials hope everyone will be ready
when the next volcano blows its top.

Discussion Questions:
1. What characteristics made the 1980 eruption of Mt.St. Helens particularly
dangerous to people and wildlife?
2. What allowed most people to escape its destructive effects?
In the mid-1900s, a farmer named Dionisio Pulido lived with his family in the small
town of Paricutin, Mexico. Pulido’s farm was a few miles outside the town. He had
owned it for 31 years. There was nothing unusually about this farm, except for a
small depression in the cornfield. Pulido and his wife had tried to fill the depression
several times, but it always came back. In fact, one local resident recalled that, 50
years earlier as a small child, he had played near
the “small hole.” He remembered hearing
underground noises like falling rocks near the
hole and felt a pleasant warmth” coming from it.
The year 1943 started off as usual in
Paricutin. There were reports of small
earthquakes in the area, but no one was too
concerned. Earthquakes were common in these
parts. So, on February 20, Pulido mounted his
horse and set off as usual to prepare his fields for
spring planting. Then something very unusual
happened.
“I heard a noise like thunders during a
rainstorm, but I could not explain it, for the sky
above was clear and the day was so peaceful,” he
recalled.

Pulido soon noticed something else in his field: along with the depression, a
crevice had opened up on the side of a hill. “Here is something new and strange,” he
remembered thinking.
A few minutes later, he heard thunder again, and he saw the trees tremble.
“It was then I saw how, in the hole, the ground swelled and raised itself up 2 or 2.5
meters (6.6 or 8.2 feet) high, and a kind of fine dust-gray, like ashes-began to rise up
in a portion of the crack. Immediately, more clouds of dust began to rise, with a hiss
or whistle, loud and continuous. A
smell of sulfur filled the air. I
became greatly frightened.”
When sparks ignited pine
trees 23 meters (75 feet) from the
jagged rip in the ground, Pulido
raced back to his home.
Throughout the night, the
volcano continued to grow. By
midnight, hug incandescent bombs
were hurling into the air with a roar.
Lightning flashes appeared in the
heavy columns of ash. In the
morning when Pulido returned to his
cornfield, he saw an amazing sight.
A cinder cone-almost 2 meters (6.6
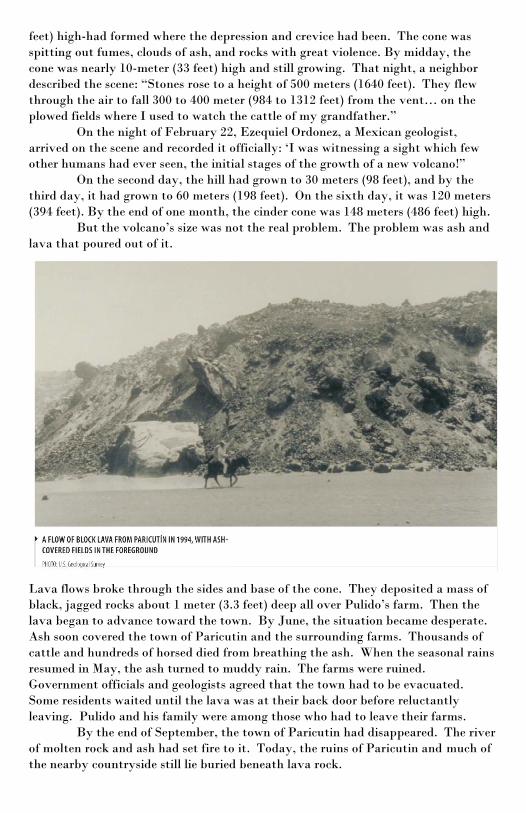
feet) high-had formed where the depression and crevice had been. The cone was
spitting out fumes, clouds of ash, and rocks with great violence. By midday, the
cone was nearly 10-meter (33 feet) high and still growing. That night, a neighbor
described the scene: “Stones rose to a height of 500 meters (1640 feet). They flew
through the air to fall 300 to 400 meter (984 to 1312 feet) from the vent… on the
plowed fields where I used to watch the cattle of my grandfather.”
On the night of February 22, Ezequiel Ordonez, a Mexican geologist,
arrived on the scene and recorded it officially: ‘I was witnessing a sight which few
other humans had ever seen, the initial stages of the growth of a new volcano!”
On the second day, the hill had grown to 30 meters (98 feet), and by the
third day, it had grown to 60 meters (198 feet). On the sixth day, it was 120 meters
(394 feet). By the end of one month, the cinder cone was 148 meters (486 feet) high.
But the volcano’s size was not the real problem. The problem was ash and
lava that poured out of it.
Lava flows broke through the sides and base of the cone. They deposited a mass of
black, jagged rocks about 1 meter (3.3 feet) deep all over Pulido’s farm. Then the
lava began to advance toward the town. By June, the situation became desperate.
Ash soon covered the town of Paricutin and the surrounding farms. Thousands of
cattle and hundreds of horsed died from breathing the ash. When the seasonal rains
resumed in May, the ash turned to muddy rain. The farms were ruined.
Government officials and geologists agreed that the town had to be evacuated.
Some residents waited until the lava was at their back door before reluctantly
leaving. Pulido and his family were among those who had to leave their farms.
By the end of September, the town of Paricutin had disappeared. The river
of molten rock and ash had set fire to it. Today, the ruins of Paricutin and much of
the nearby countryside still lie buried beneath lava rock.
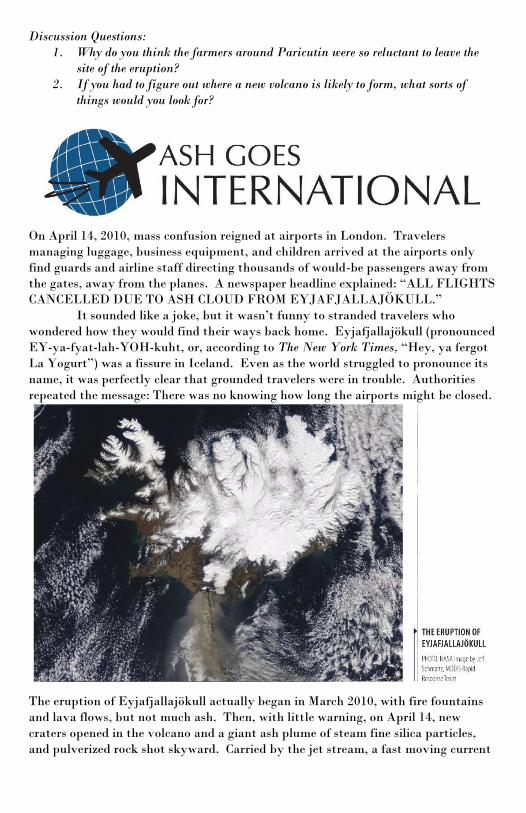
Discussion Questions:
1. Why do you think the farmers around Paricutin were so reluctant to leave the
site of the eruption?
2. If you had to figure out where a new volcano is likely to form, what sorts of
things would you look for?
On April 14, 2010, mass confusion reigned at airports in London. Travelers
managing luggage, business equipment, and children arrived at the airports only
find guards and airline staff directing thousands of would-be passengers away from
the gates, away from the planes. A newspaper headline explained: “ALL FLIGHTS
CANCELLED DUE TO ASH CLOUD FROM EYJAFJALLAJÖKULL.”
It sounded like a joke, but it wasn’t funny to stranded travelers who
wondered how they would find their ways back home. Eyjafjallajökull (pronounced
EY-ya-fyat-lah-YOH-kuht, or, according to The New York Times, “Hey, ya fergot
La Yogurt”) was a fissure in Iceland. Even as the world struggled to pronounce its
name, it was perfectly clear that grounded travelers were in trouble. Authorities
repeated the message: There was no knowing how long the airports might be closed.
The eruption of Eyjafjallajökull actually began in March 2010, with fire fountains
and lava flows, but not much ash. Then, with little warning, on April 14, new
craters opened in the volcano and a giant ash plume of steam fine silica particles,
and pulverized rock shot skyward. Carried by the jet stream, a fast moving current
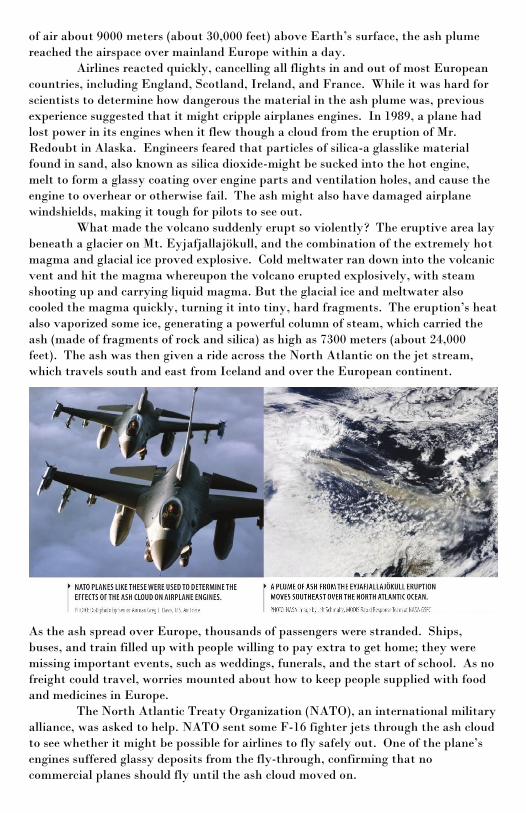
of air about 9000 meters (about 30,000 feet) above Earth’s surface, the ash plume
reached the airspace over mainland Europe within a day.
Airlines reacted quickly, cancelling all flights in and out of most European
countries, including England, Scotland, Ireland, and France. While it was hard for
scientists to determine how dangerous the material in the ash plume was, previous
experience suggested that it might cripple airplanes engines. In 1989, a plane had
lost power in its engines when it flew though a cloud from the eruption of Mr.
Redoubt in Alaska. Engineers feared that particles of silica-a glasslike material
found in sand, also known as silica dioxide-might be sucked into the hot engine,
melt to form a glassy coating over engine parts and ventilation holes, and cause the
engine to overhear or otherwise fail. The ash might also have damaged airplane
windshields, making it tough for pilots to see out.
What made the volcano suddenly erupt so violently? The eruptive area lay
beneath a glacier on Mt. Eyjafjallajökull, and the combination of the extremely hot
magma and glacial ice proved explosive. Cold meltwater ran down into the volcanic
vent and hit the magma whereupon the volcano erupted explosively, with steam
shooting up and carrying liquid magma. But the glacial ice and meltwater also
cooled the magma quickly, turning it into tiny, hard fragments. The eruption’s heat
also vaporized some ice, generating a powerful column of steam, which carried the
ash (made of fragments of rock and silica) as high as 7300 meters (about 24,000
feet). The ash was then given a ride across the North Atlantic on the jet stream,
which travels south and east from Iceland and over the European continent.
As the ash spread over Europe, thousands of passengers were stranded. Ships,
buses, and train filled up with people willing to pay extra to get home; they were
missing important events, such as weddings, funerals, and the start of school. As no
freight could travel, worries mounted about how to keep people supplied with food
and medicines in Europe.
The North Atlantic Treaty Organization (NATO), an international military
alliance, was asked to help. NATO sent some F-16 fighter jets through the ash cloud
to see whether it might be possible for airlines to fly safely out. One of the plane’s
engines suffered glassy deposits from the fly-through, confirming that no
commercial planes should fly until the ash cloud moved on.

But Europeans ad travelers were not the only victims of Eyjafjallajökull.
Consider the Icelanders themselves. Many lived on farms near Eyjafjallajökull,
which were suddenly flooded as meltwater poured off the volcano. Thanks to
evacuations, no Icelanders were known to have died in the flooding, byt people
returned to find their farms waterlogged and covered in ash.
Despite its powerful effects, the 2010 eruption of Eyjafjallajökull was mild
compared to an eruption that occurred in Iceland a few centuries ago. On June 8,
1783, the crater of a fissure volcano called Laki burst open, freeing lakes of boiling
lava. For nearly eight months lava spilled out, covering about 600 square kilometers
(232 square miles) of countryside and killing about 10,000 people. A cloud of gases
containing hydrofluoric acid and sulfur dioxide spewed out of the volcano and was
carried over Iceland and to Europe on the winds. Unfortunately, sulfur dioxide
reacts with water-even the water in human lung tissue-to form poisonous sulfuric
acid. Tens of thousands of Europeans choked to death from inhaling the gases. A
terrible winter followed, as Icelanders and their livestock died of sulfur and fluorine
poisoning and famine. About a quarter of the population died. The winter was
unusually hot; a lingering haze of ash and sulfur dioxide hung over Iceland and
western Europe. Chroniclers of the time wrote that fresh-slaughtered meat had to
be eaten immediately, because it would go bad by the next day.
Indeed, Iceland, sometimes called the land of fire and ice, is a highly
volcanic place. It is part of the Mid-Atlantic Ridge (which you read about in Lesson
6), an area where magma is rising and plates are spreading. What is unusual about
Iceland is that the ridge is above sea level, which means that violent eruptions are
not buffered by the ocean.
There is concern that the 2010 eruption of Eyjafjalljökull forecasts a worse
eruption of the nearby Katla volcano. Every time in history that Eyjafjallajökull
has erupted, Katla has followed. Katla is larger, with a magma chamber ten times
the size of Eyjafjallajökull’s. And because Katla is beneath a huge glacier, an
eruption could produce heaving flooding and an avalanche of giant chunks of ice.
Scientists have been keeping a close eye on Katla for signs that it may erupt.
Monitioring the effects of the Eyjafjallajökull eruption has allowed scientists to
learn more about glaciovolcanoes (ice-covered volcanoes). While the volcanoes
themselves are similar to other volcanoes, their interactions with the ice when they
erupt make them unique.
Discussion Questions:
1. Why did a volcanic
eruption in Iceland
close airports in
Europe but not in
North America?
2. Explain the statement
“Every volcano is
unique” and how this
impacts our ability to
predict and respond to
volcanic eruptions.

Lesson #15: Exploring the Plate Tectonics Assessment
Introduction-
You have now finished your investigations of plate tectonics. During the next four
periods, you will complete a two-part assessment. On the first day, you will review
what you have learned in this unit. On the second day, you will complete Part A of
the assessment. Your will design and carry out an investigation to test the effects of
soils on building stability during an earthquake. Working individually, you will
plan an investigation, record a plan, state the hypothesis, conduct the investigation,
and record observations as they relate to the concepts and skills addressed in
Exploring Plate Tectonics. On the third day, you will complete Part B, which is a set
of multiple-choice and short-answer questions. On the fourth day, you will review
the assessment and personally assess how well you have learned the concepts and
skills in this unit.


![Papua New Guinea Earthquake-Related Media Monitoring Log ......04/04/18 Earthquake’s K200 million bill in Hela is only ‘half the cost’ [Refer to article 4] The National Newspaper](https://img.pdfslide.us/doc/110x75/5faa3ecc6936442a2014609d/papua-new-guinea-earthquake-related-media-monitoring-log-040418-earthquakeas.jpg)