Embed Size (px)
Citation preview
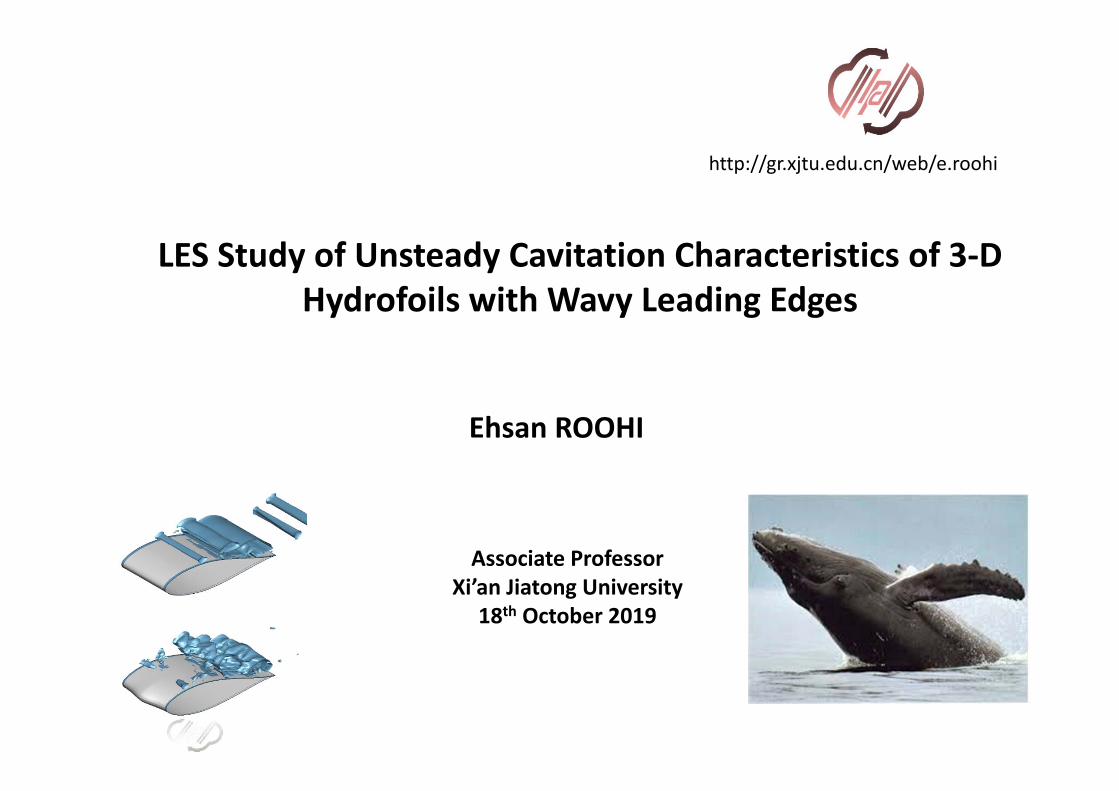
Ehsan ROOHI
LES Study of Unsteady Cavitation Characteristics of 3‐D Hydrofoils with Wavy Leading Edges
http://gr.xjtu.edu.cn/web/e.roohi
Associate ProfessorXi’an Jiatong University
18th October 2019
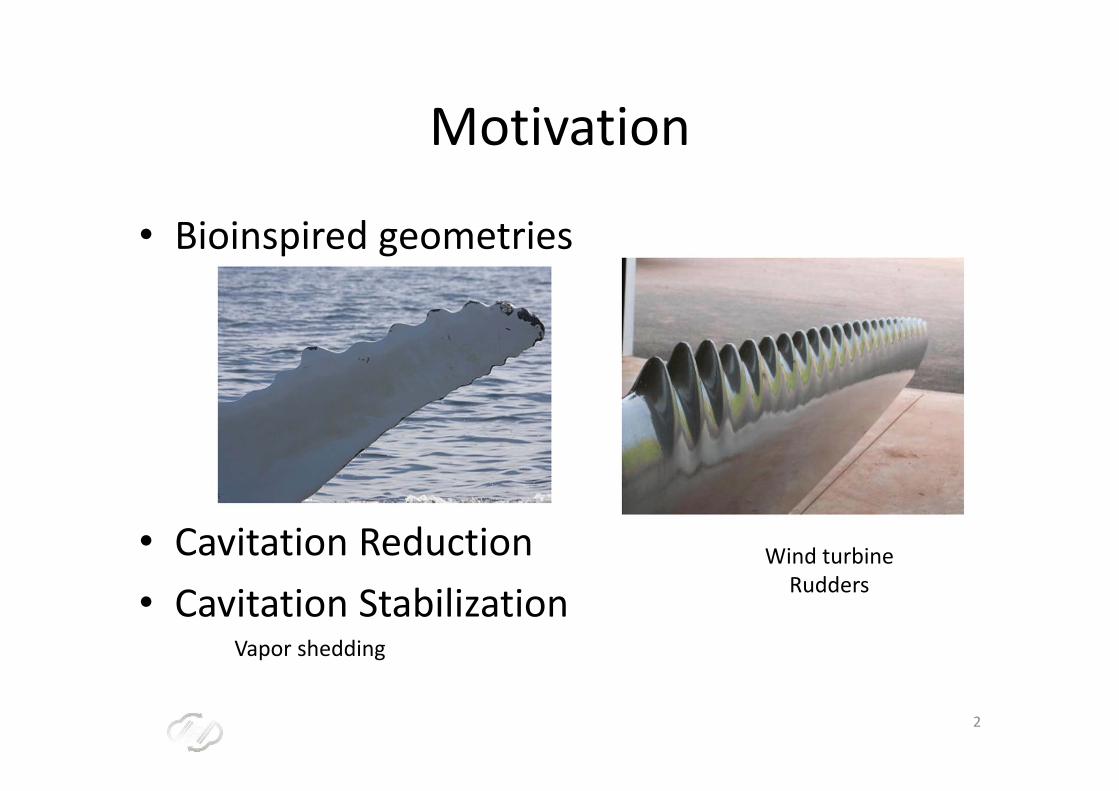
Motivation
• Bioinspired geometries
• Cavitation Reduction • Cavitation Stabilization
Vapor shedding
Wind turbineRudders
2
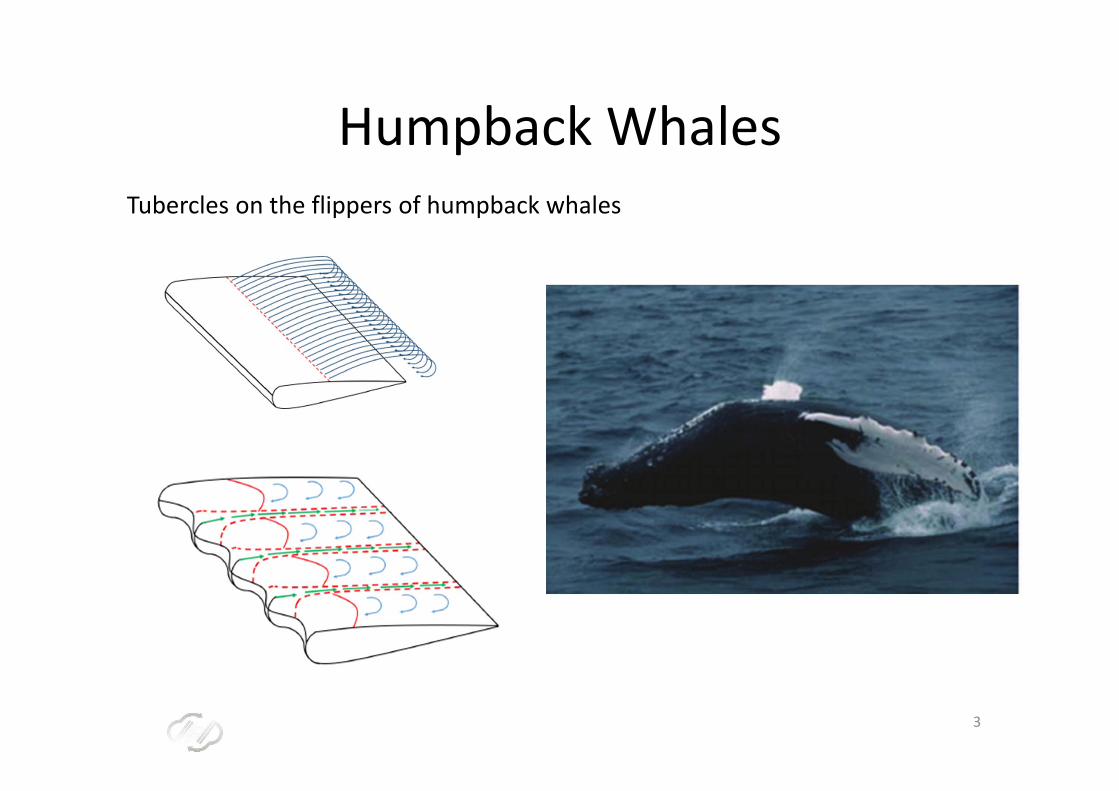
Humpback WhalesTubercles on the flippers of humpback whales
3
http:// hpclab.um.ac.ir http://e.roohi.profcms.um.ac.ir
http://hpclab.um.ac.ir
• Cavitation seriously influences the hydrodynamicperformance due to its complex unsteady nature;it may cause
Lift reduction/oscillation Erosion Vibration Noise
• Considering the performance and reliability of modifying hydrofoilsWavy Leading Edge (WLE) vs. straight leading edge (SLE)
Cavitation
http:// hpclab.um.ac.ir http://e.roohi.profcms.um.ac.ir
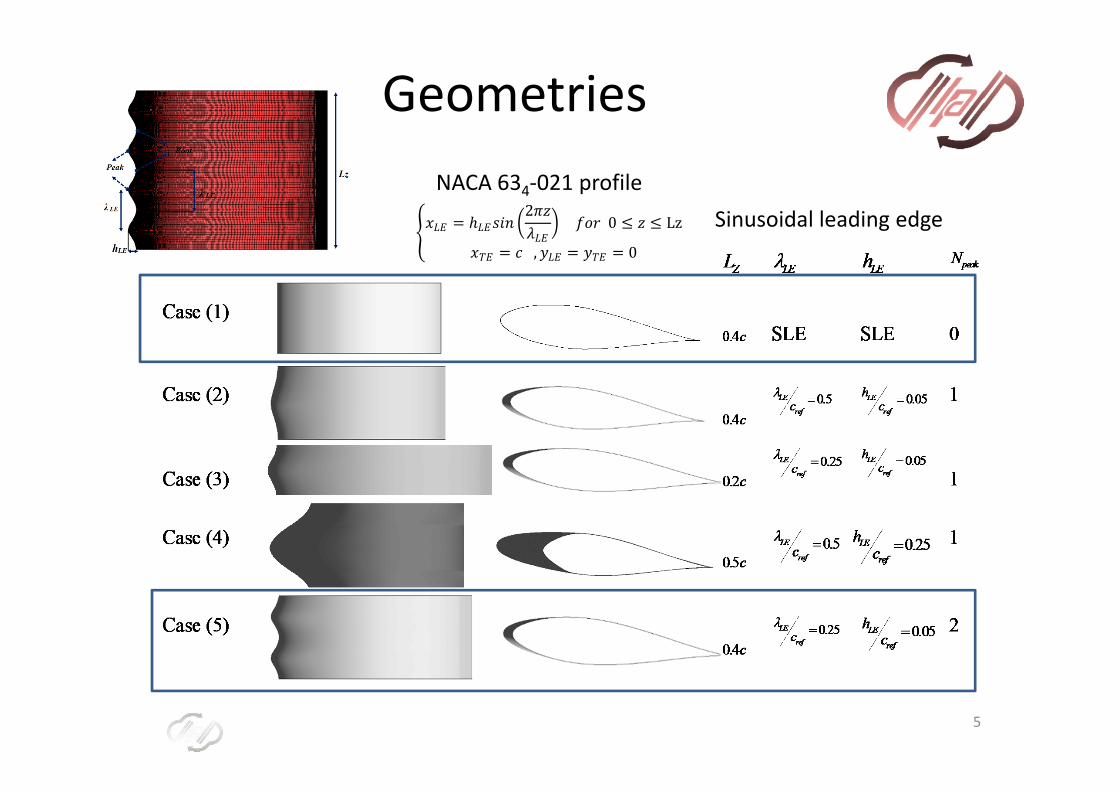
GeometriesNACA 634‐021 profile
𝑥𝐿𝐸 ℎ𝐿𝐸 𝑠𝑖𝑛2𝜋𝑧𝜆𝐿𝐸
𝑓𝑜𝑟 0 𝑧 Lz
𝑥𝑇𝐸 𝑐 , 𝑦𝐿𝐸 𝑦𝑇𝐸 0
Sinusoidal leading edge
5
http:// hpclab.um.ac.ir http://e.roohi.profcms.um.ac.ir
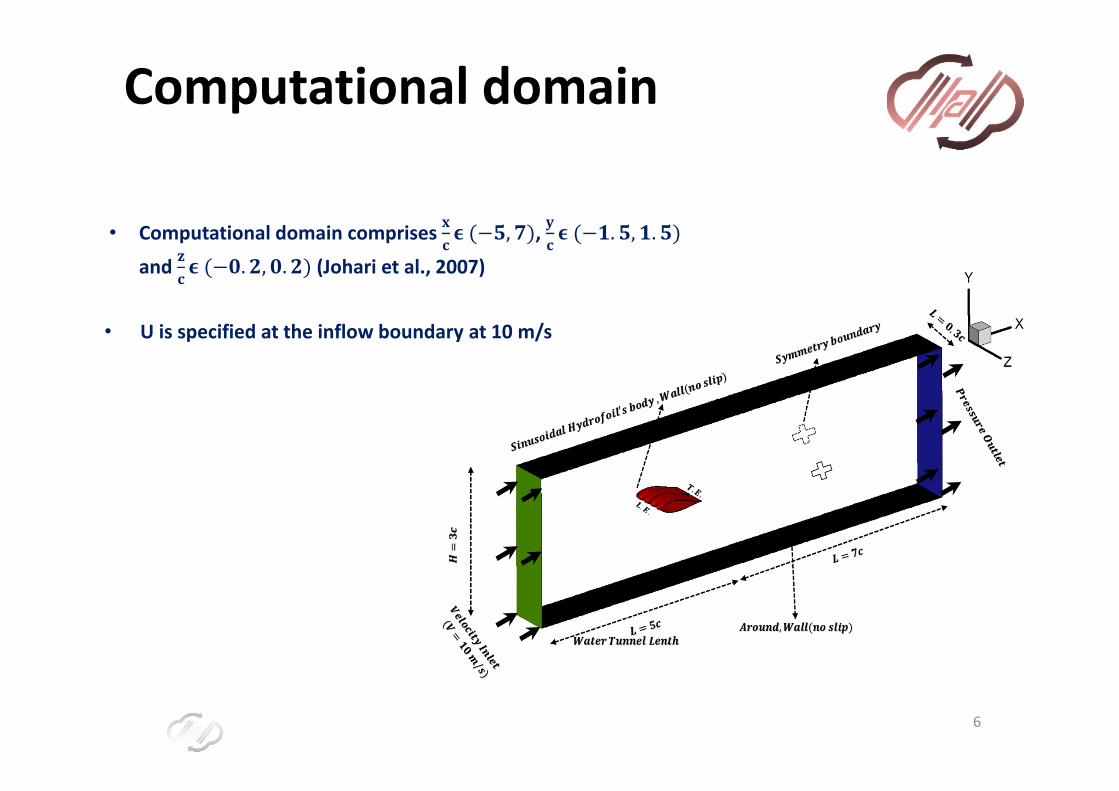
Computational domain
• Computational domain comprises 𝐱𝐜
𝛜 𝟓, 𝟕 , 𝐲𝐜
𝛜 𝟏. 𝟓, 𝟏. 𝟓and 𝐳
𝐜𝛜 𝟎. 𝟐, 𝟎. 𝟐 (Johari et al., 2007)
• U is specified at the inflow boundary at 10 m/s
6
http:// hpclab.um.ac.ir http://e.roohi.profcms.um.ac.ir
Large eddy simulation (LES) and Kunz mass transfer model were used tosimulate the dynamic cavitation
SGS: OEEVM
Volume of fluid (VOF)
IntephaseChangeFoam solver
The velocity‐pressure coupling is performed using the PIMPLE
Numerical Setup
7
http:// hpclab.um.ac.ir http://e.roohi.profcms.um.ac.ir
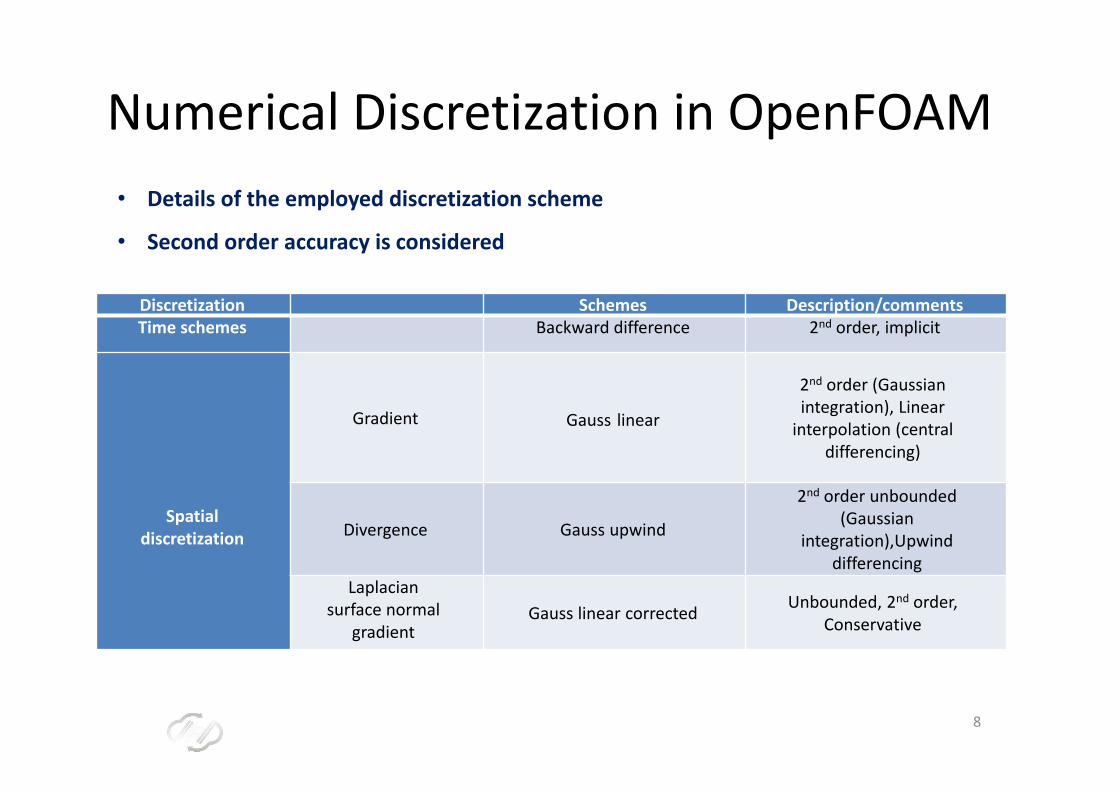
Discretization Schemes Description/commentsTime schemes Backward difference 2nd order, implicit
Spatial
discretization
Gradient Gauss linear
2nd order (Gaussian integration), Linear interpolation (central
differencing)
Divergence Gauss upwind
2nd order unbounded (Gaussian
integration),Upwind differencing
Laplaciansurface normal
gradientGauss linear corrected Unbounded, 2nd order,
Conservative
• Details of the employed discretization scheme
• Second order accuracy is considered
Numerical Discretization in OpenFOAM
8
http:// hpclab.um.ac.ir http://e.roohi.profcms.um.ac.ir
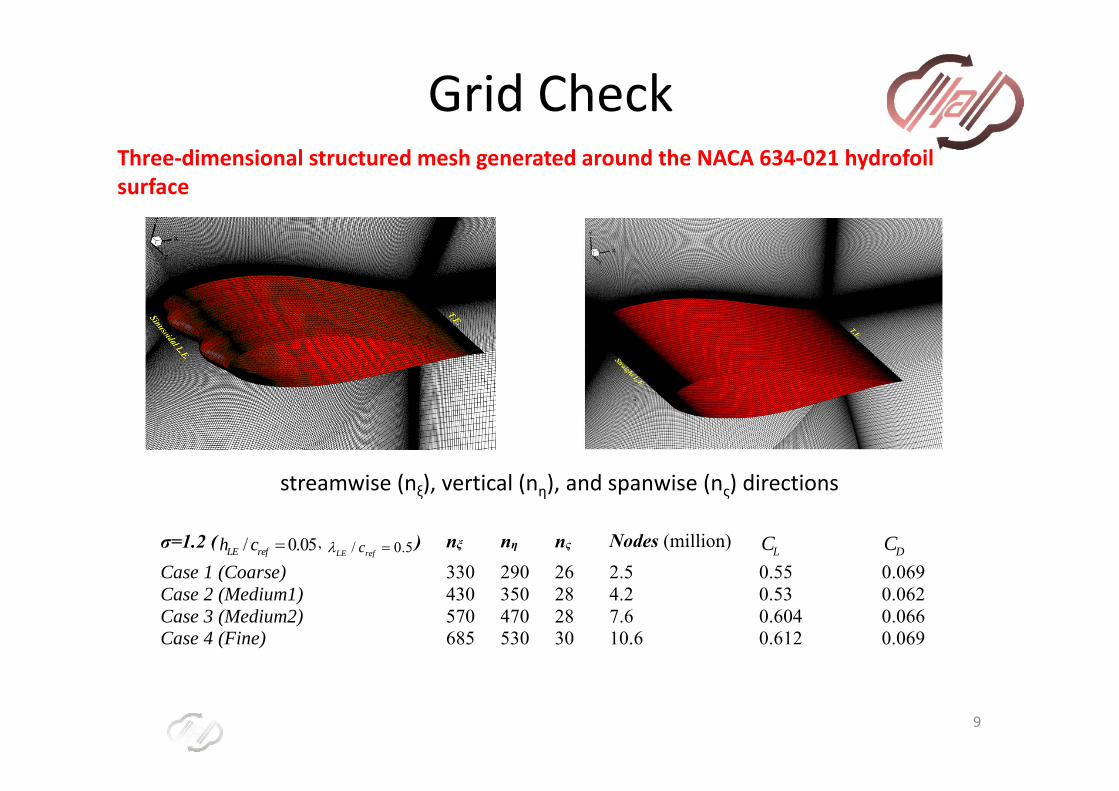
Three‐dimensional structured mesh generated around the NACA 634‐021 hydrofoil surface
σ=1.2 ( / 0.05LE refh c , / 0.5LE refc ) nξ nη nς Nodes (million) LC DC
Case 1 (Coarse) 330 290 26 2.5 0.55 0.069 Case 2 (Medium1) 430 350 28 4.2 0.53 0.062 Case 3 (Medium2) 570 470 28 7.6 0.604 0.066 Case 4 (Fine) 685 530 30 10.6 0.612 0.069
Grid Check
streamwise (nξ), vertical (nη), and spanwise (nς) directions
9
http:// hpclab.um.ac.ir http://e.roohi.profcms.um.ac.ir
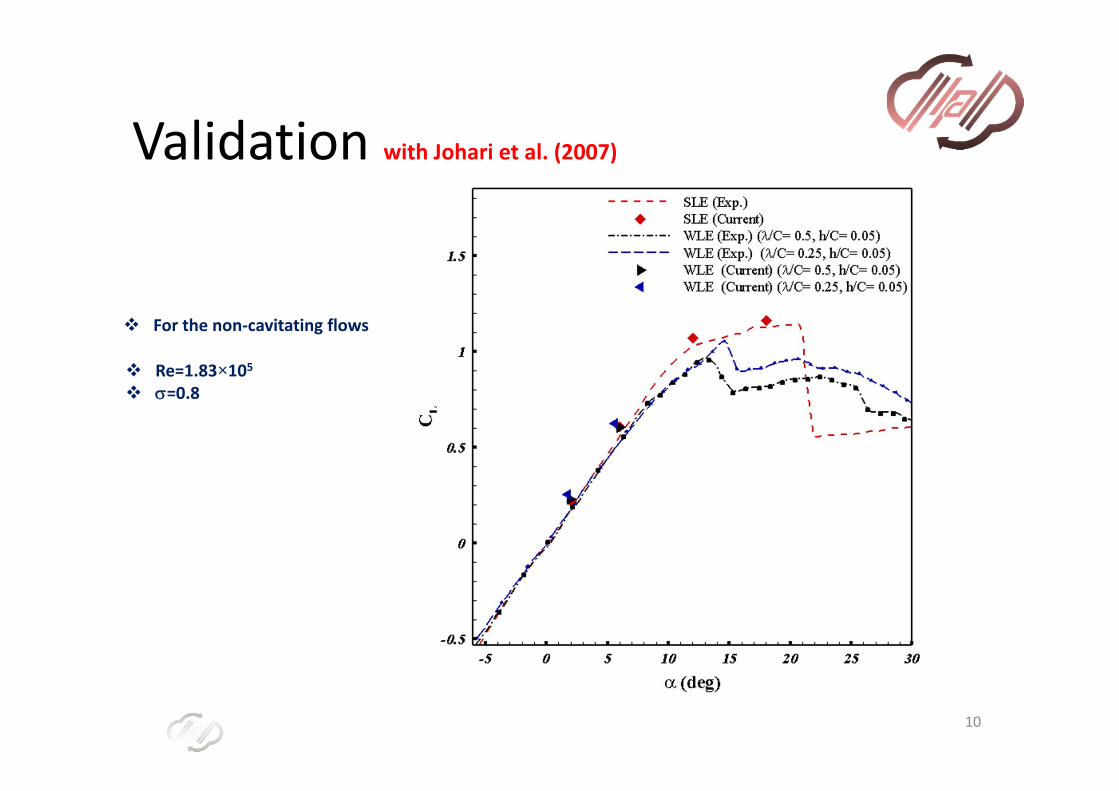
Validation with Johari et al. (2007)
For the non‐cavitating flows
Re=1.83×105 =0.8
10
http:// hpclab.um.ac.ir http://e.roohi.profcms.um.ac.ir
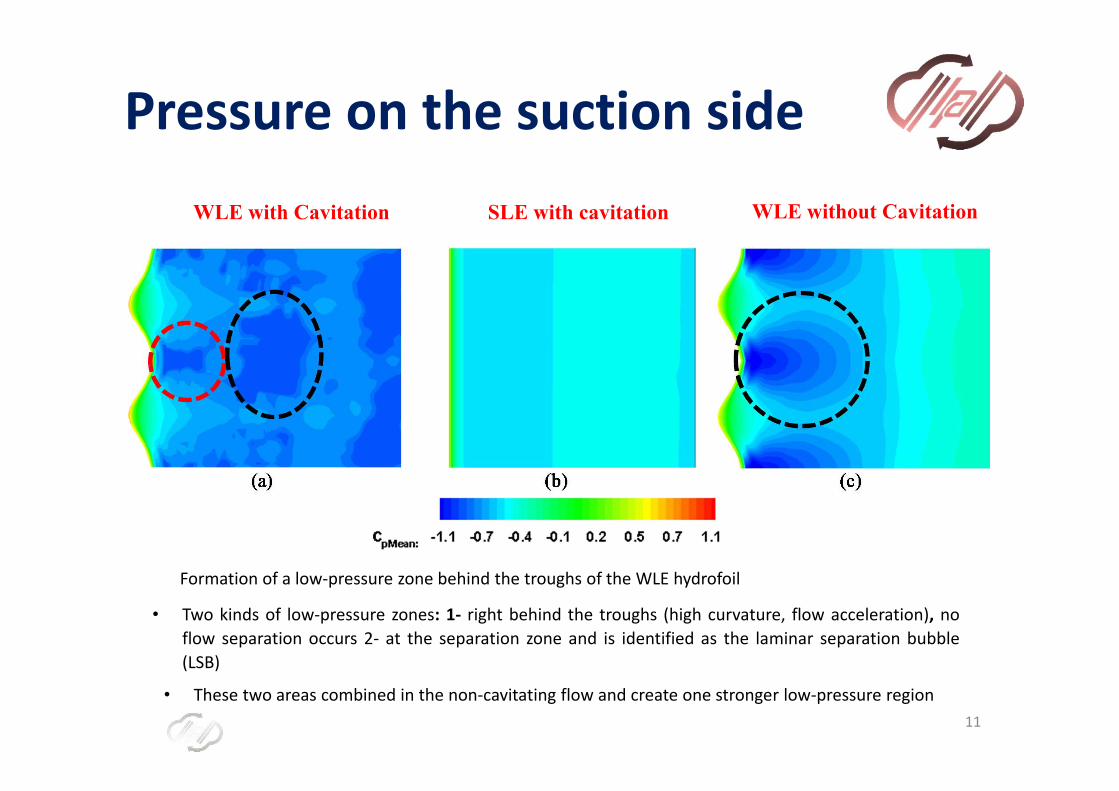
Pressure on the suction side WLE with Cavitation SLE with cavitation WLE without Cavitation
Formation of a low‐pressure zone behind the troughs of the WLE hydrofoil
• Two kinds of low‐pressure zones: 1‐ right behind the troughs (high curvature, flow acceleration), noflow separation occurs 2‐ at the separation zone and is identified as the laminar separation bubble(LSB)
• These two areas combined in the non‐cavitating flow and create one stronger low‐pressure region11
http:// hpclab.um.ac.ir http://e.roohi.profcms.um.ac.ir
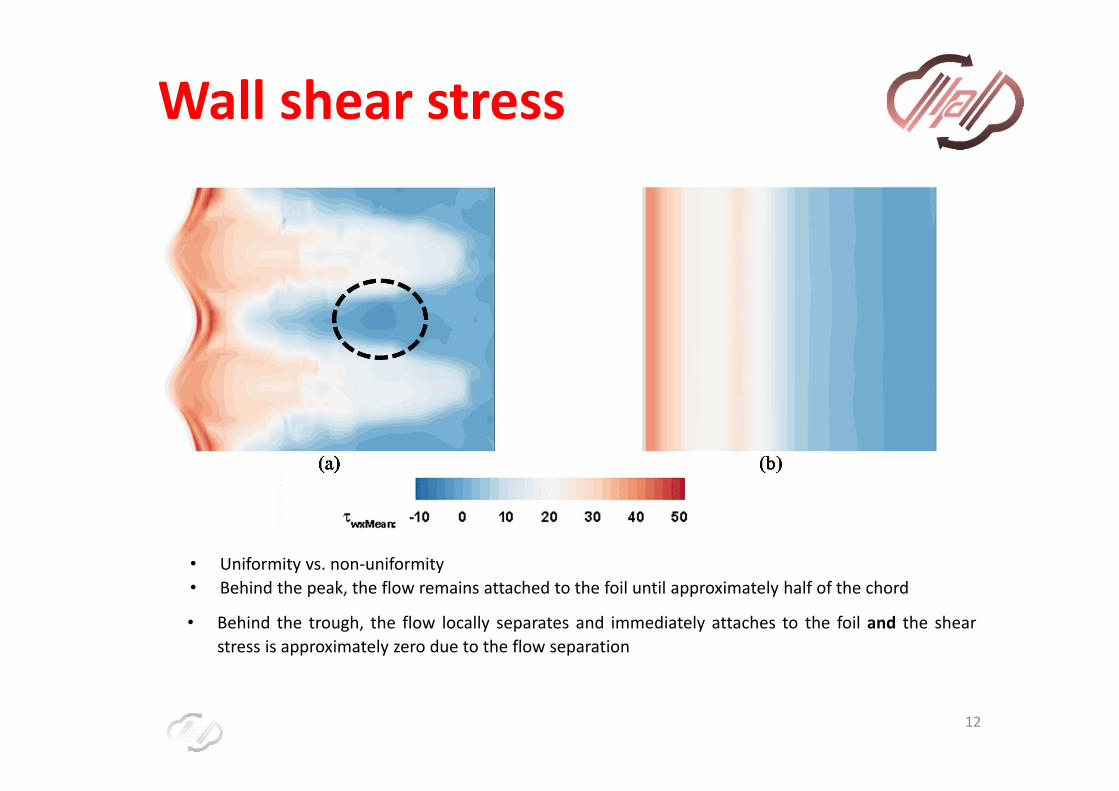
Wall shear stress
• Uniformity vs. non‐uniformity• Behind the peak, the flow remains attached to the foil until approximately half of the chord
• Behind the trough, the flow locally separates and immediately attaches to the foil and the shearstress is approximately zero due to the flow separation
12

http:// hpclab.um.ac.ir http://e.roohi.profcms.um.ac.ir
Zero streamwise velocity
• Separated flow region in the SLE case is larger than in the WLE case
• The early development of LSBs near the leading edge of the WLE hydrofoil prevents large flowseparation
• In the SLE case, however, the flow is completely separated without reattachment
Laminar Separation Bubble (LSBs)
13
http:// hpclab.um.ac.ir http://e.roohi.profcms.um.ac.ir
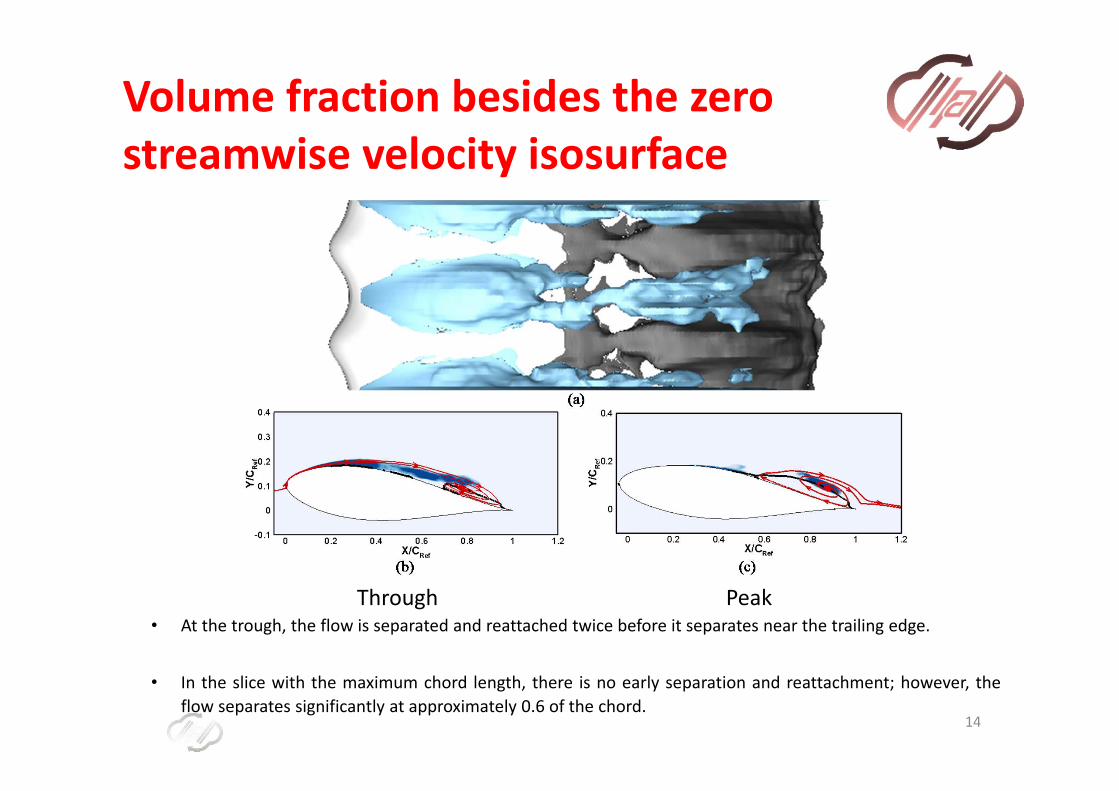
Volume fraction besides the zero streamwise velocity isosurface
• At the trough, the flow is separated and reattached twice before it separates near the trailing edge.
• In the slice with the maximum chord length, there is no early separation and reattachment; however, theflow separates significantly at approximately 0.6 of the chord.
PeakThrough
14
http:// hpclab.um.ac.ir http://e.roohi.profcms.um.ac.ir
Time (ms)
CL
5 10 15 20 25 30 35 40 45 500
0.2
0.4
0.6
0.8
1
1.2
Cycle 1Cycle 2
Cycle 3
A AA
B
B B
CC
C
D
DD
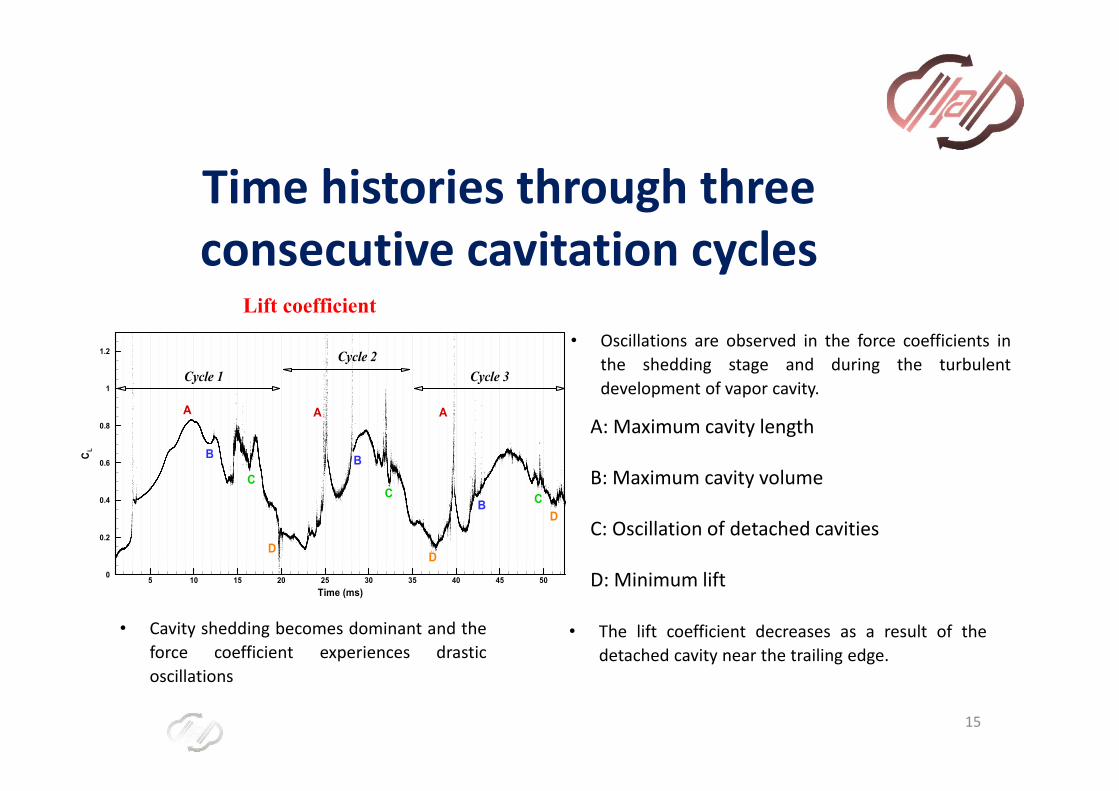
Time histories through three consecutive cavitation cycles
Lift coefficient
• The lift coefficient decreases as a result of thedetached cavity near the trailing edge.
• Oscillations are observed in the force coefficients inthe shedding stage and during the turbulentdevelopment of vapor cavity.
A: Maximum cavity length
B: Maximum cavity volume
C: Oscillation of detached cavities
D: Minimum lift
• Cavity shedding becomes dominant and theforce coefficient experiences drasticoscillations
15
http:// hpclab.um.ac.ir http://e.roohi.profcms.um.ac.ir
http://hpclab.um.ac.ir
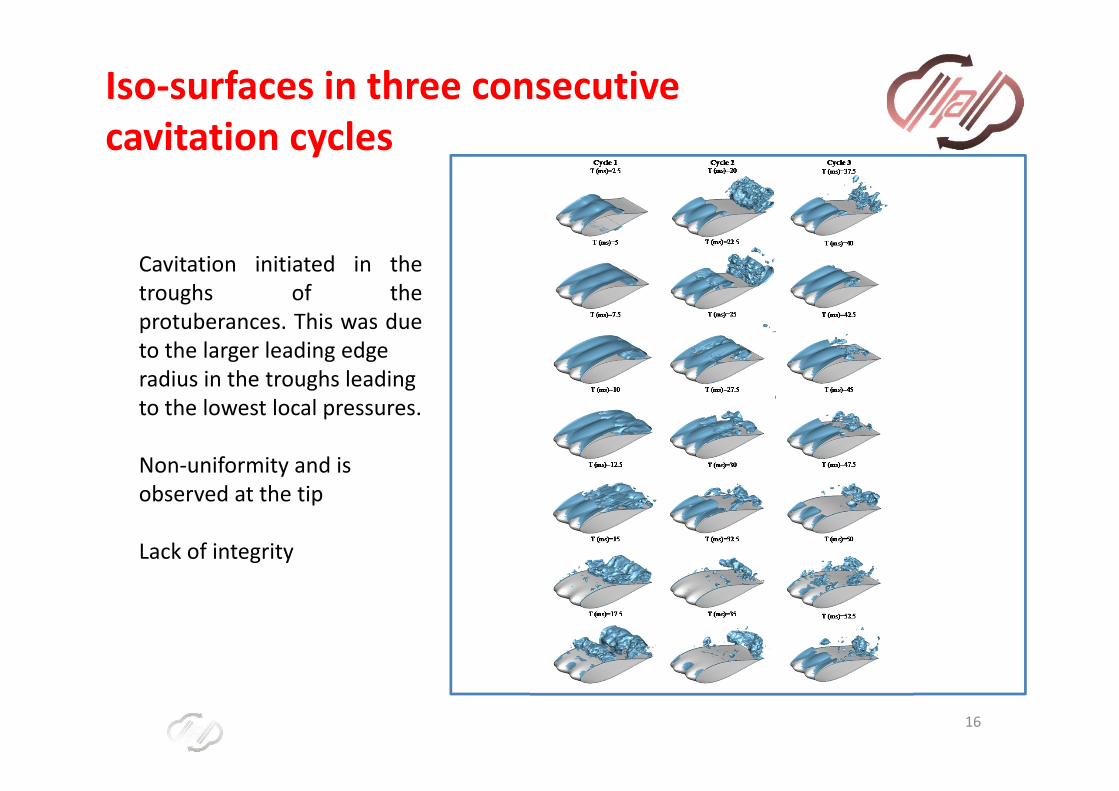
Iso‐surfaces in three consecutive cavitation cycles
Cavitation initiated in thetroughs of theprotuberances. This was dueto the larger leading edgeradius in the troughs leading to the lowest local pressures.
Non‐uniformity and is observed at the tip
Lack of integrity
16
http:// hpclab.um.ac.ir http://e.roohi.profcms.um.ac.ir
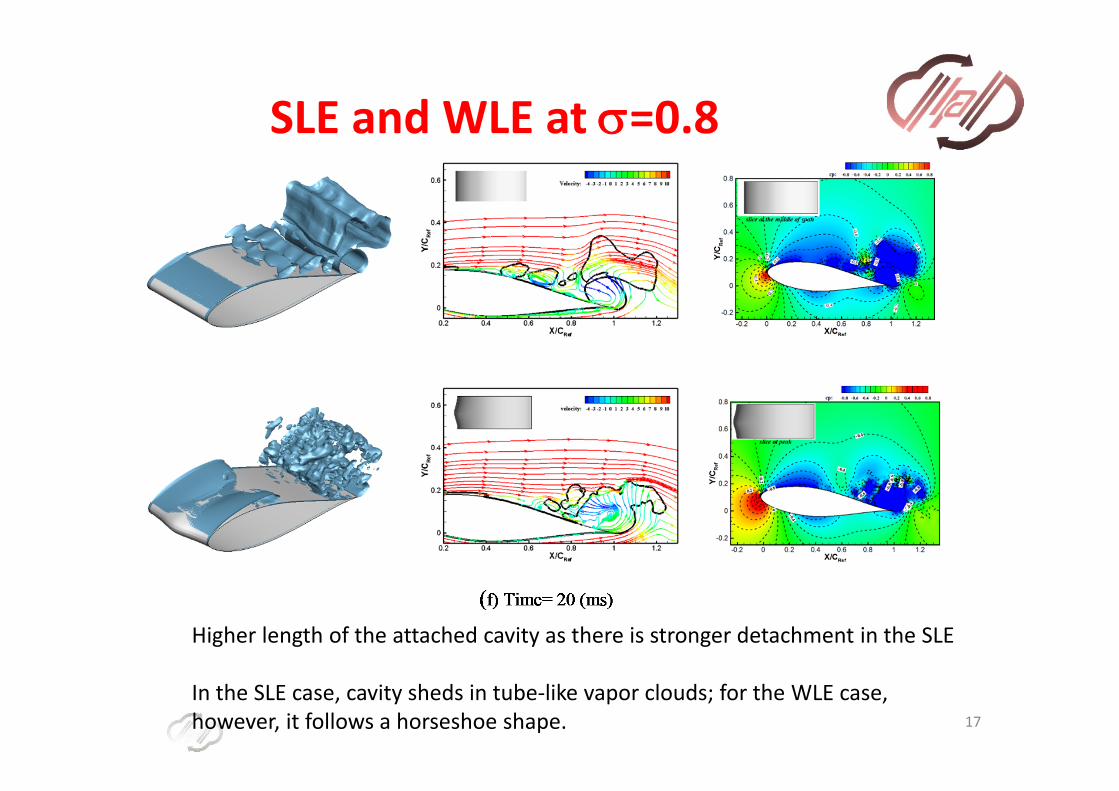
SLE and WLE at =0.8
17
Higher length of the attached cavity as there is stronger detachment in the SLE
In the SLE case, cavity sheds in tube‐like vapor clouds; for the WLE case, however, it follows a horseshoe shape.
http:// hpclab.um.ac.ir http://e.roohi.profcms.um.ac.ir
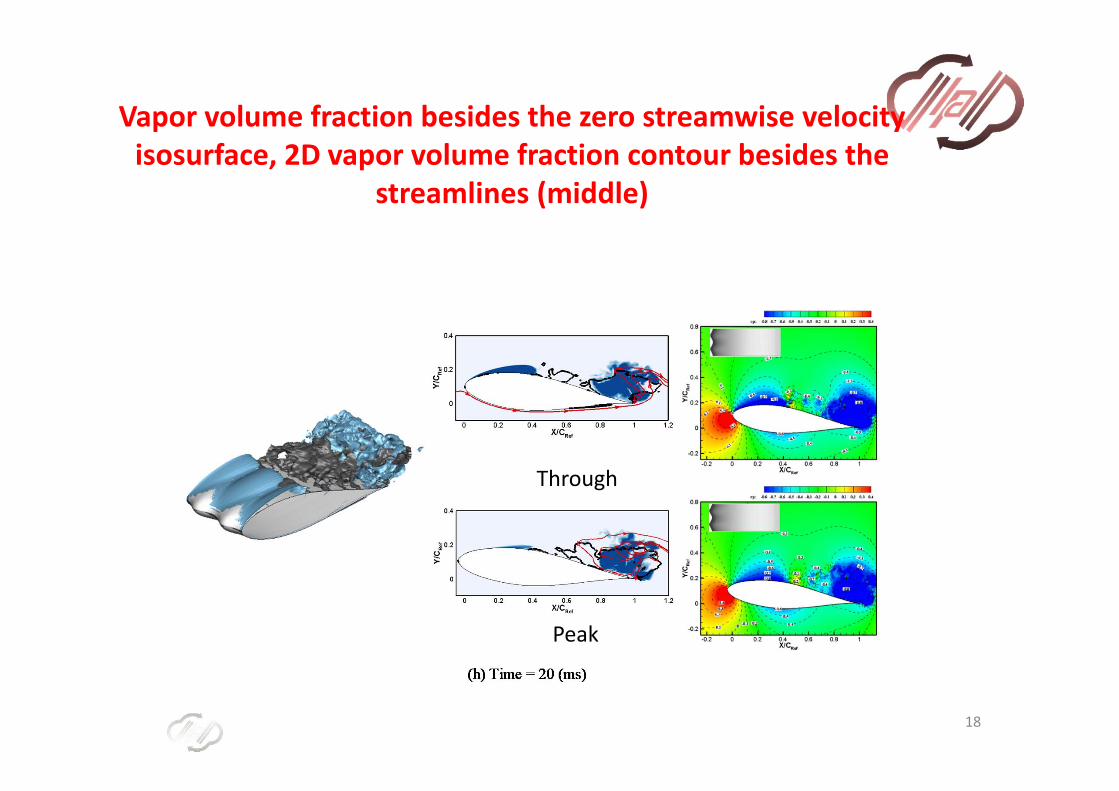
Vapor volume fraction besides the zero streamwise velocity isosurface, 2D vapor volume fraction contour besides the
streamlines (middle)
18
Through
Peak
http:// hpclab.um.ac.ir http://e.roohi.profcms.um.ac.ir
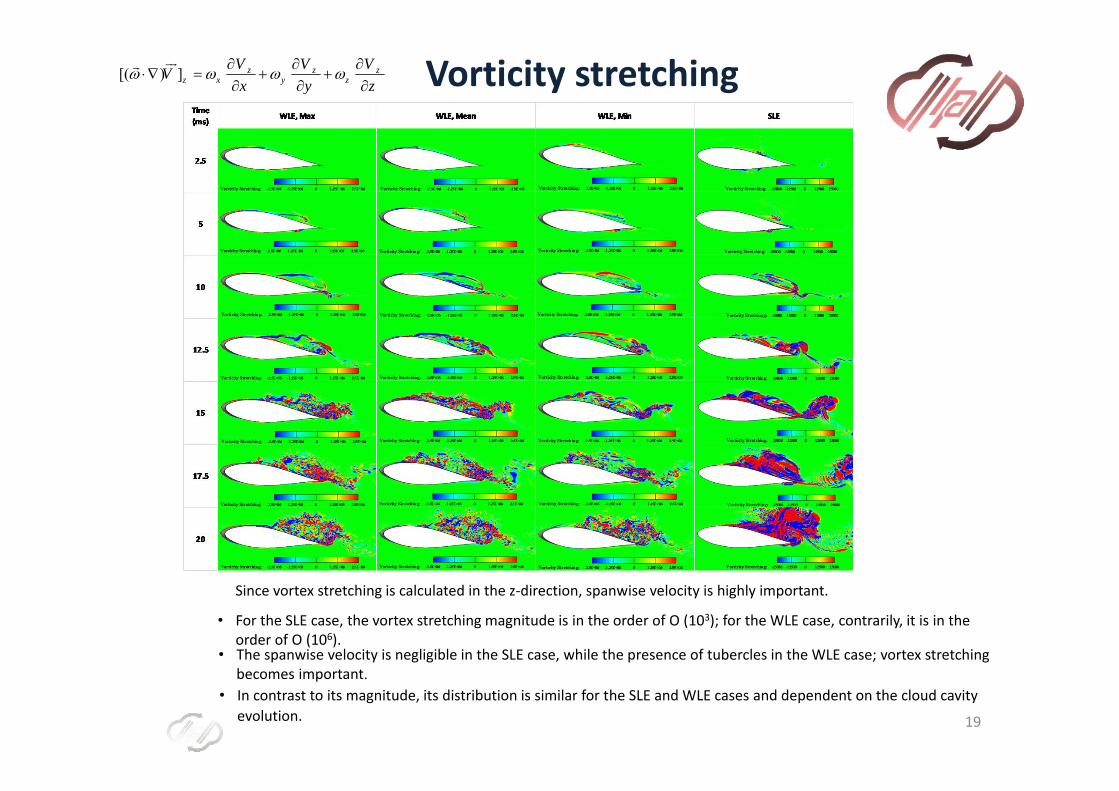
Vorticity stretching
• For the SLE case, the vortex stretching magnitude is in the order of O (103); for the WLE case, contrarily, it is in the order of O (106).
• The spanwise velocity is negligible in the SLE case, while the presence of tubercles in the WLE case; vortex stretching becomes important.
• In contrast to its magnitude, its distribution is similar for the SLE and WLE cases and dependent on the cloud cavity evolution. 19
Since vortex stretching is calculated in the z‐direction, spanwise velocity is highly important.
[( ) ] zz y z
zx
zV V VVx y z

http:// hpclab.um.ac.ir http://e.roohi.profcms.um.ac.ir
Vorticity dilatation
• Vorticity dilatation is dominant inside the cavity, while the vorticity stretching is stronger outside the cloud cavity
• Vorticity dilatation is in the same order for both cases, SLE and WLE
• This term is important during the entire process20
[( )]( yxz
zz
VV VVx y z
http:// hpclab.um.ac.ir http://e.roohi.profcms.um.ac.ir
Conclusions
• NACA 634‐021 hydrofoil with WLE and SLE was considered.
• When the flow passes over the tubercles, it is deflected toward the troughs and a low‐pressure
zone forms behind the trough.
• Presence of tubercles on the LE results in a spanwise flow on the suction side of WLE hydrofoil.
• Flow separation in SLE case is greater than WLE case, because the early development of LSBs
near the leading edge of WLE hydrofoil prevents large flow separation. While in the SLE case,
no early separation happens and flow is completely separated without reattachment.
21
http:// hpclab.um.ac.ir http://e.roohi.profcms.um.ac.ir
http://hpclab.um.ac.ir
• Results show that there is a contrast between vorticity stretching and vorticity dilatation.
• The latter is dominant inside the cavity, while the former is stronger outside the cloud cavity and particularly in the
wake, where cavity shedding is dominant.
• Vortex stretching is almost negligible for SLE case in comparison to the WLE case.
• Vortex stretching is calculated in z‐direction which causes that the spanwise velocity becomes very important. In
the SLE case, the spanwise velocity is negligible.
• The vorticity dilatation is important during the whole process of cavitation cycle, because it is proportional to the
velocity divergence.
• Its value is negative inside the cavity, while it is positive at the closure point of cavity.
Conclusions
22
http://hpclab.um.ac.ir
Further Reading
Movahedian, A., Passandideh‐Fard, M., Roohi, E., LES Study of Sheet‐Cloud Cavitation around the 3‐DTwisted wing with NACA16012 hydrofoil, Accepted at Ocean Engineering.Zahiri, A.P., Roohi, E., Anisotropic Minimum‐Dissipation (AMD) Subgrid‐Scale Model Implemented inOpenFOAM: Verification and Assessment in Single‐phase and Multi‐phase Flows, Computers & Fluids, Vol.180, pp. 190‐205, 2019.Kolahan, A., Roohi, E., Pendar, M.R., Wavelet Analysis and Frequency Spectrum of Cloud Cavitation arounda Sphere, Ocean Engineering, Vol. 182, 235‐247, 2019.Pendar , M., Roohi, E.,Cavitation Characteristics around a Sphere: An LES Investigation, InternationalJournal of Multiphase Flow, Vol. 98, 1‐23, 2018.Pendar, M., Roohi, E., Investigation of cavitation around 3D hemispherical head‐form body and conicalcavitator using different turbulence and cavitation models, Ocean Engineering, Vol. 112, pp. 287‐306,DOI:10.1016/j.oceaneng.2015.12.010, 2016.Roohi, E., Pendar, M., Rahimi, A., Simulation of Three Dimensional Cavitation behind a Disk using VariousTurbulence/Mass Transfer Models, Applied Mathematical Modelling, Vol. 40(1), pp. 542‐564, 2016.Roohi, E., Zahiri, A. P., Passandideh‐Fard, M., Numerical Simulation of Cavitation around a Two‐Dimensional Hydrofoil Using VOF Method and LES Turbulence Model, Applied Mathematical Modeling,Vol. 37, 6469‐6488, 2013.Passandideh Fard, M., Roohi, E., Transient simulations of cavitating flows using a modified volume‐of‐fluid(VOF) technique, International Journal of Computational Fluid Dynamics, Volume 22, 2008, Pages 97‐114
23
Thank youQuestions?
24
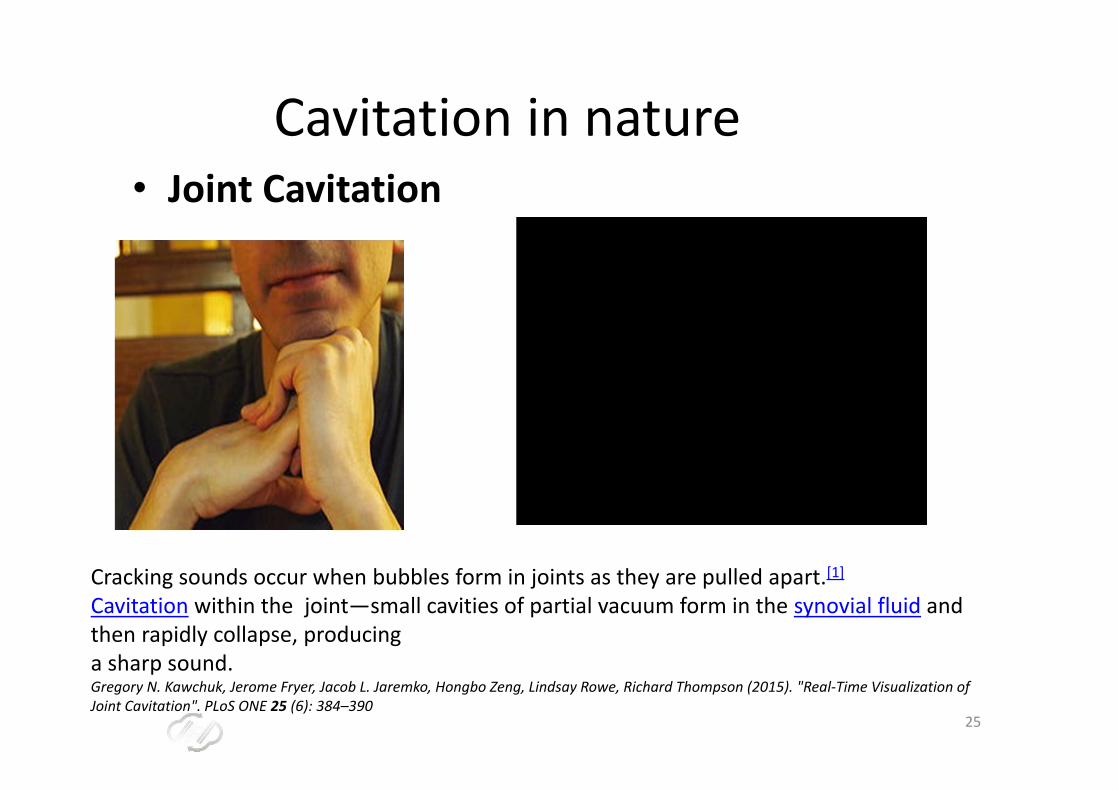
Cavitation in nature• Joint Cavitation
Cracking sounds occur when bubbles form in joints as they are pulled apart.[1]Cavitation within the joint—small cavities of partial vacuum form in the synovial fluid and then rapidly collapse, producing a sharp sound.Gregory N. Kawchuk, Jerome Fryer, Jacob L. Jaremko, Hongbo Zeng, Lindsay Rowe, Richard Thompson (2015). "Real‐Time Visualization of Joint Cavitation". PLoS ONE 25 (6): 384–390
25
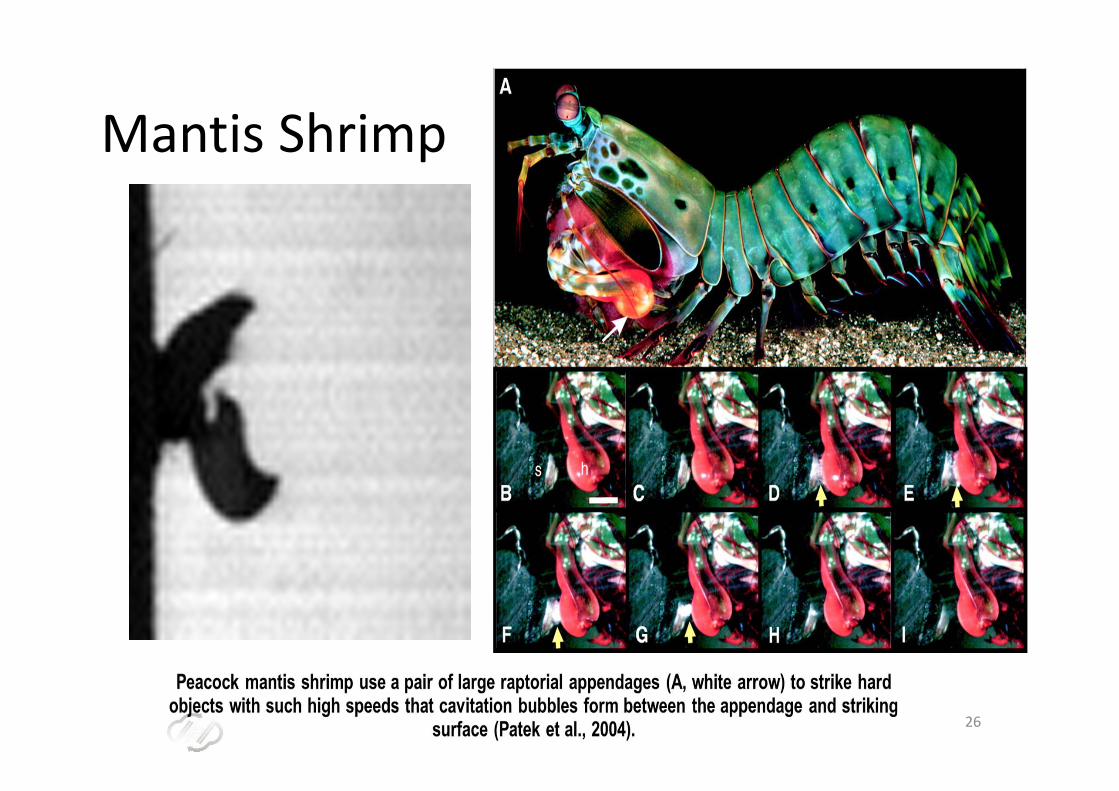
Mantis Shrimp
26
Mantis Shrimp
27