Embed Size (px)
Citation preview
LEPF 04-18
DETERMINING STREAM ORIGIN OF FOUR PURPORTED WALLEYE STOCKS IN LAKE ERIE USING OTOLITH ELEMENTAL ANALYSIS
FINAL REPORT
By
Investigator: Jennell Lynn Bigrigg, B.S.,
*****
The Ohio State University
ABSTRACT
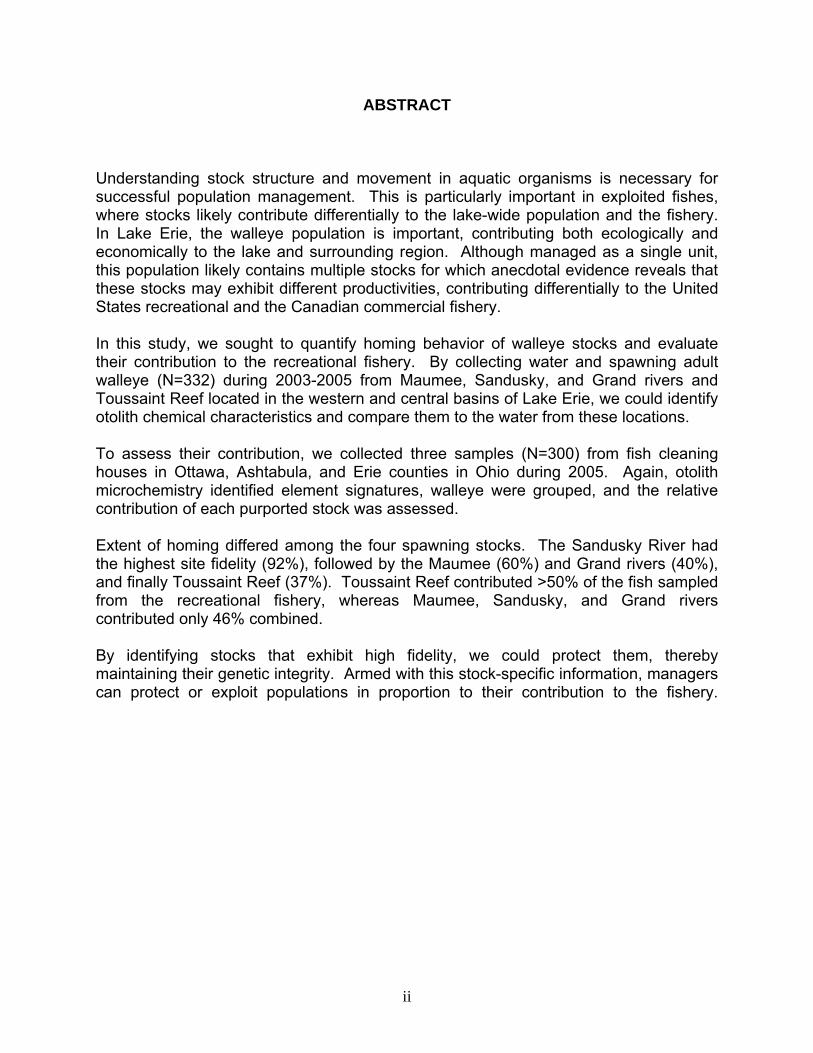
Understanding stock structure and movement in aquatic organisms is necessary for successful population management. This is particularly important in exploited fishes, where stocks likely contribute differentially to the lake-wide population and the fishery. In Lake Erie, the walleye population is important, contributing both ecologically and economically to the lake and surrounding region. Although managed as a single unit, this population likely contains multiple stocks for which anecdotal evidence reveals that these stocks may exhibit different productivities, contributing differentially to the United States recreational and the Canadian commercial fishery. In this study, we sought to quantify homing behavior of walleye stocks and evaluate their contribution to the recreational fishery. By collecting water and spawning adult walleye (N=332) during 2003-2005 from Maumee, Sandusky, and Grand rivers and Toussaint Reef located in the western and central basins of Lake Erie, we could identify otolith chemical characteristics and compare them to the water from these locations. To assess their contribution, we collected three samples (N=300) from fish cleaning houses in Ottawa, Ashtabula, and Erie counties in Ohio during 2005. Again, otolith microchemistry identified element signatures, walleye were grouped, and the relative contribution of each purported stock was assessed. Extent of homing differed among the four spawning stocks. The Sandusky River had the highest site fidelity (92%), followed by the Maumee (60%) and Grand rivers (40%), and finally Toussaint Reef (37%). Toussaint Reef contributed >50% of the fish sampled from the recreational fishery, whereas Maumee, Sandusky, and Grand rivers contributed only 46% combined.
By identifying stocks that exhibit high fidelity, we could protect them, thereby maintaining their genetic integrity. Armed with this stock-specific information, managers can protect or exploit populations in proportion to their contribution to the fishery.
ii

ACKNOWLEDGMENTS
First and foremost I would like to thank my advisors, Drs. Roy Stein and Derek Aday, for their continual knowledge, guidance, and encouragement throughout this journey. These two have been a pleasure to work with, and I appreciate them both providing me with the opportunity to pursue this degree. In addition, I would also like to thank my committee members who always went above and beyond the call of duty. Dr. Elizabeth Marschall was always available for direction and support, specifically with revisions and her statistical expertise. Dr. Stuart Ludsin, the otolith microchemistry man, taught me a great deal about the finer details of work of this type, particularly important given it had not been done previously at the AEL. I also would like to thank the numerous people at the Aquatic Ecology Lab for their technical help, advice, and support. I cannot express what a dynamic group of students, faculty, and staff are associated with this lab, making it a stimulating and entertaining place to work. Specifically, I would like to thank Jason Van Tassell (aka, my third advisor), Paris Collingsworth, Samantha Fedor, Ben Sylak, Jessica Best, Jamie Fagman, Mike Zimmerman, Ben Carr, and many others. I am also grateful to our administrative staff, Melissa Marburger and Barbara Fate, who guided me through the administrative details and formalities associated with the project. In addition to intellectual support, I would like to thank my funding agencies who have made this project possible. I am grateful to the Division of Wildlife for not only the funds to complete this project, but for the countless hours they put into scoping meetings, field sampling, and preparation to make this project successful. Specifically, I would like to thank Roger Knight, Jeff Tyson, Chris Vandergoot, Tim Bader, Ann Marie Gorman, Larry Goedde, Carey Knight, and Travis Hartman. The Lake Erie Protection Fund (LEPF) provided additional funds that have contributed to project completion. Finally, I am grateful to Dr. John Olesik at the MARC facility on Ohio State University’s campus for the amount of expertise and technical work he has put into this project, all the while ensuring samples were done in a timely manner. Last, but certainly not least, I would like to thank my family and friends for their continual support. Specifically, I would like acknowledge my parents who have been there since day one and instilled in me to always strive for my goals. I would also like to thank Ryan Romero for his words of encouragement and understanding, and his continual support through all my endeavors.
iii
VITA
August 21, 1981 ………………………....Born - Lorain, Ohio
2003 ……………………………...……...B.S. Biology, Bowling Green State University
2003-2006 ……………………………....Graduate Research Associate, Department of Evolution, Ecology and Organismal Biology, The Ohio State University
FIELDS OF STUDY Major Field: ……………………………..Evolution, Ecology, and Organismal Biology Specialization: …………………………...Aquatic Ecology
iv
TABLE OF CONTENTS Page Abstract .............................................................................................................................. ii Acknowledgements ………………………………………................................... ………iii Vita …………………………………………………………………………........ …........iv List of Tables ……………………………………………………………….. ... …….......vi List of Figures …………………………………………………………...... ……………vii Introduction ……………………………………………………………………........…….1 Methods ……….……………………………..……………………………………....……3 Sample Collection ……………………………...…………............................…....3 Sample Preparation..................................................................................................3 Sample Processing ………………………………………………… ..………....…3 Data Analysis …………………………………………………………………..…4 Mixed Stock Analysis.................................................................................. ............5 Results ………………………………………………………………………….………....6 Water Samples...................................................................................................... ...6 Adult Walleye: Homing........................................................................................ ...6 Mixed Stock Analysis.......................................................................................... ....7 Discussion ………………………………………………………………………...............8 Literature Cited ......................................................................................................... ........12 Appendix A.................................................................................................................. ......26 Appendix B................................................................................................................... .....28 Appendix C........................................................................................................ ................30
v
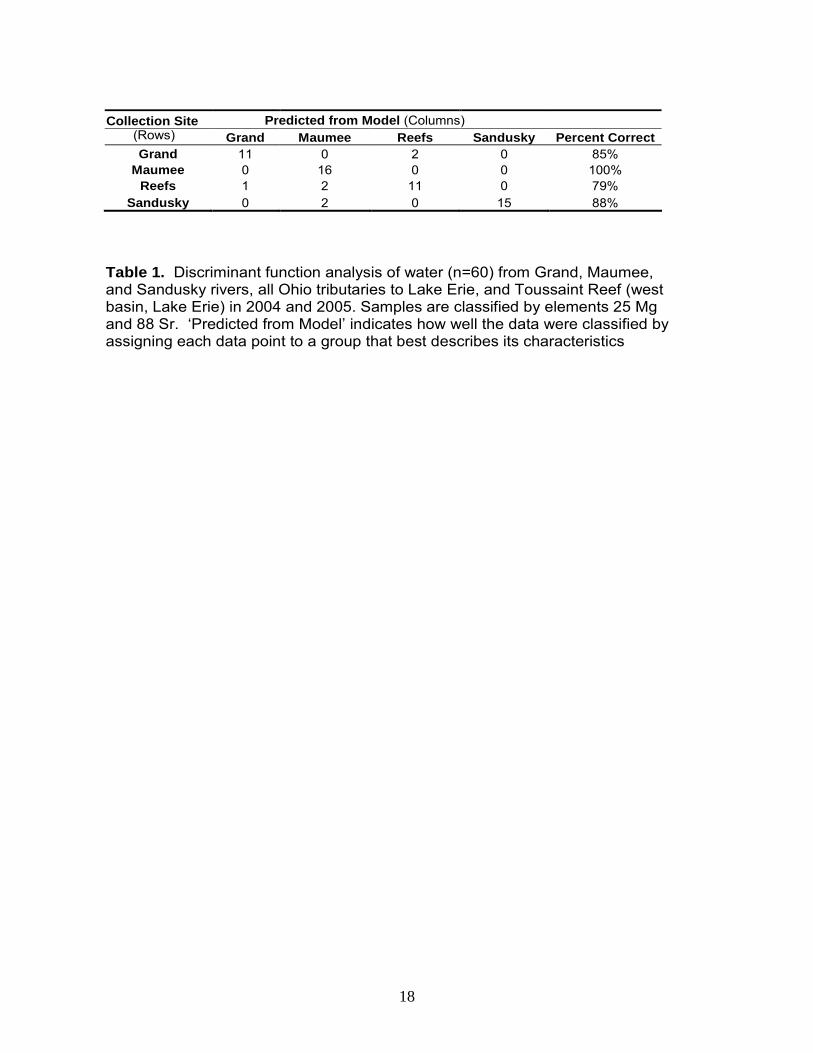
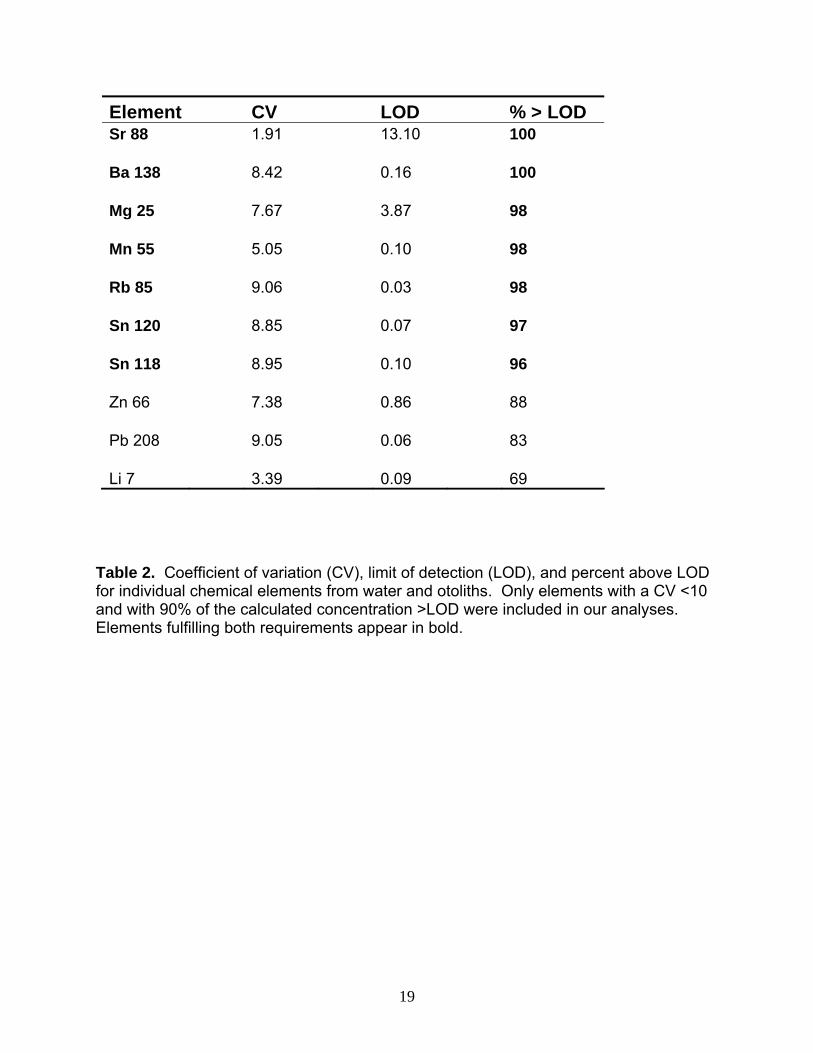
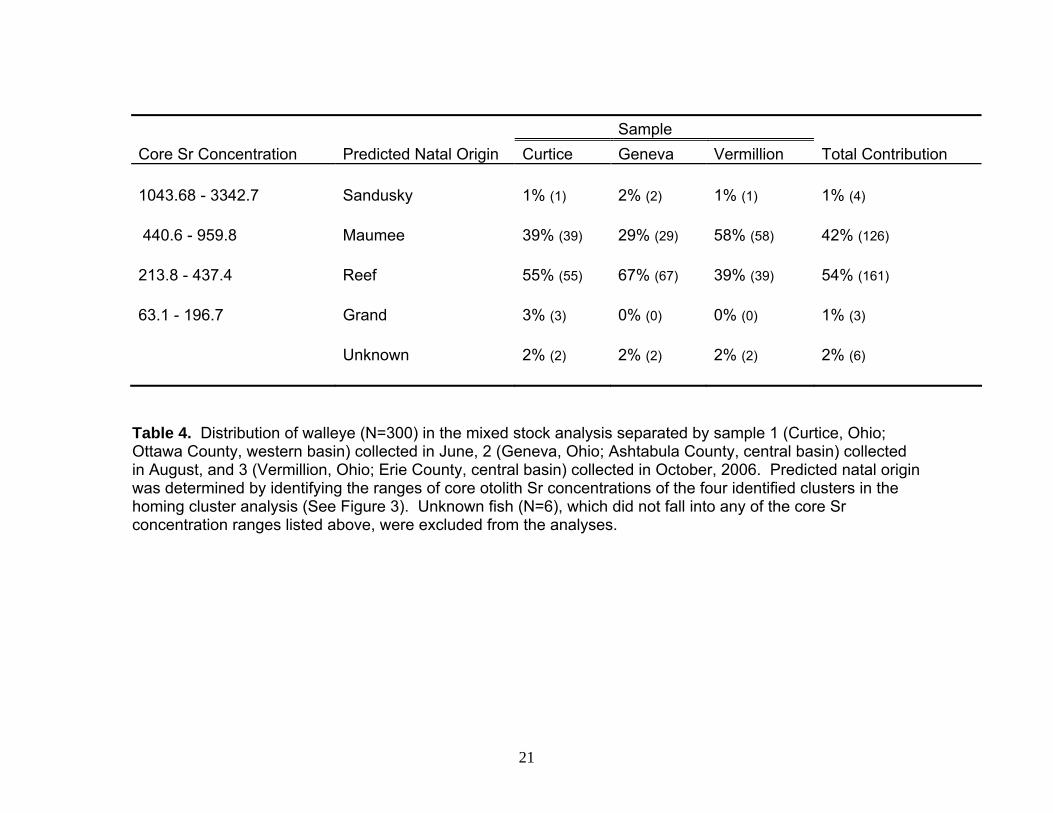
LIST OF TABLES Table Page 1. Discriminant function analysis of water (n=60) from Grand, Maumee, and Sandusky rivers, all Ohio tributaries to Lake Erie, and Toussaint Reef (west basin, Lake Erie) in 2004 and 2005. Samples are classified by elements 25 Mg and 88 Sr. ‘Predicted from Model’ indicates how well the data were classified by assigning each data point to a group that best described its characteristics.................................................................................................................................28 2. Coefficient of variation (CV), limit of detection (LOD), and percent above LOD for individual chemical elements from water and otoliths. Only elements with a CV <10 and with 90% of the calculated concentration >LOD were included in our analyses. Elements fulfilling both requirements appear in bold ..................................................................................................29 3. Results of the cluster analysis from the homing study using the element Sr 88 quantified in otoliths as the only discriminator. Predicted natal origin was determined by examining box plots of the four clusters in Figure 3. To interpret the table, read across the columns. For example, “Cluster 1 was identified as fish of Sandusky River natal origin. Of those fish, 47 spawned in the Sandusky River, 1 spawned in the Maumee River, 3 in Toussaint Reef, and 0 spawned in the Grand River, illustrating a homing rate of 92%”..................................................30 4. Distribution of walleye (N=300) in the mixed stock analysis separated by sample 1 (Curtice, Ohio; Ottawa County, western basin) collected in June, 2 (Geneva, Ohio; Ashtabula County, central basin) collected in August, and 3 (Vermillion, Ohio; Erie County, central basin) collected in October, 2006. Predicted natal origin was determined by identifying the ranges of core otolith Sr concentrations of the four identified clusters in the homing cluster analysis (See Figure 3). Unknown fish (N=6), which did not fall into any of the core Sr concentration ranges listed above, were excluded from the analyses..............................................................................31
vi
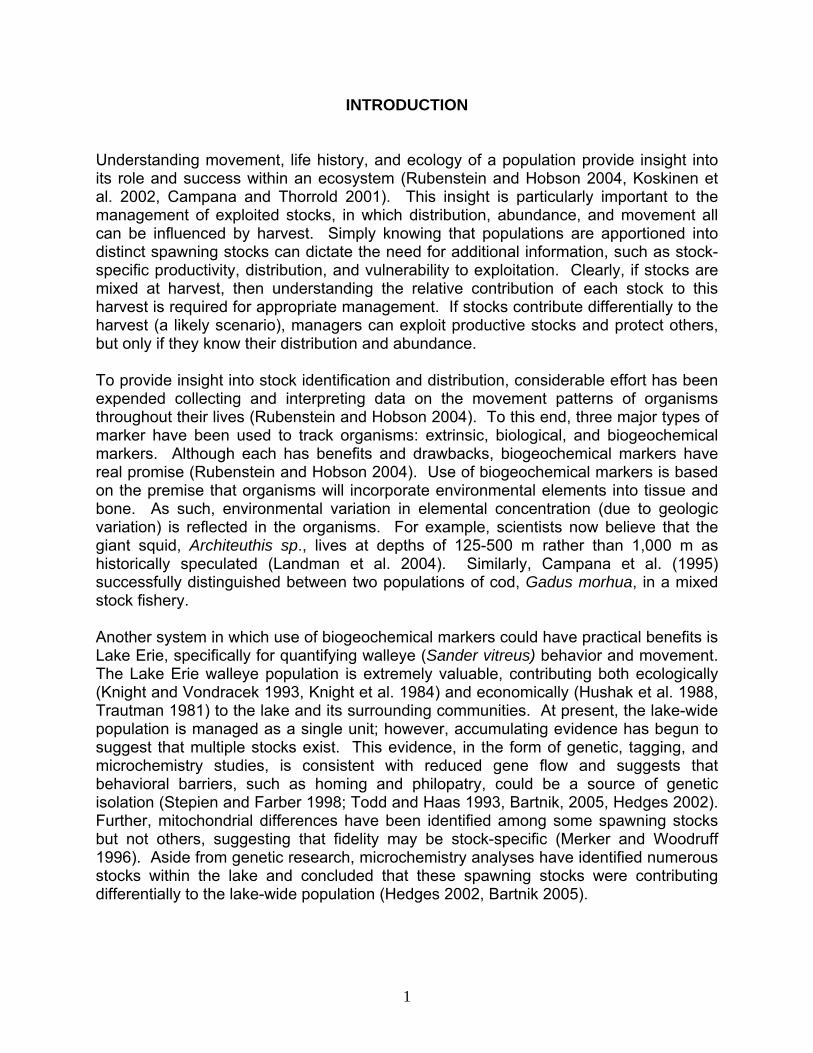
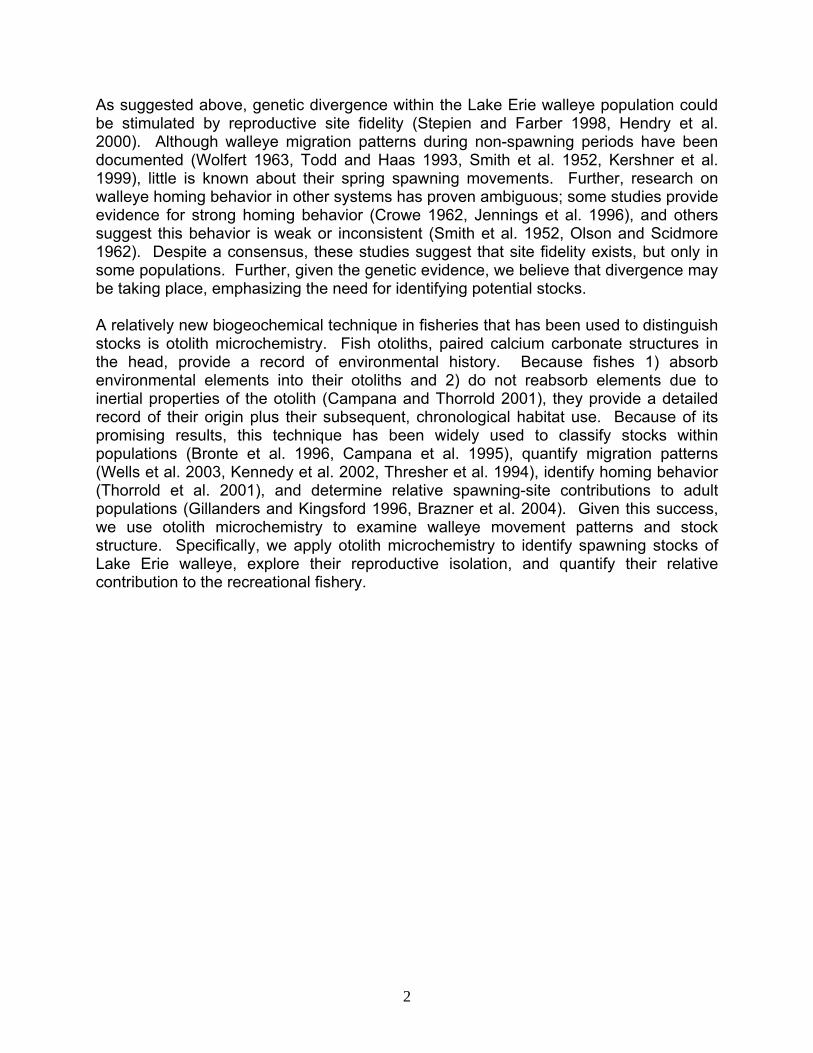
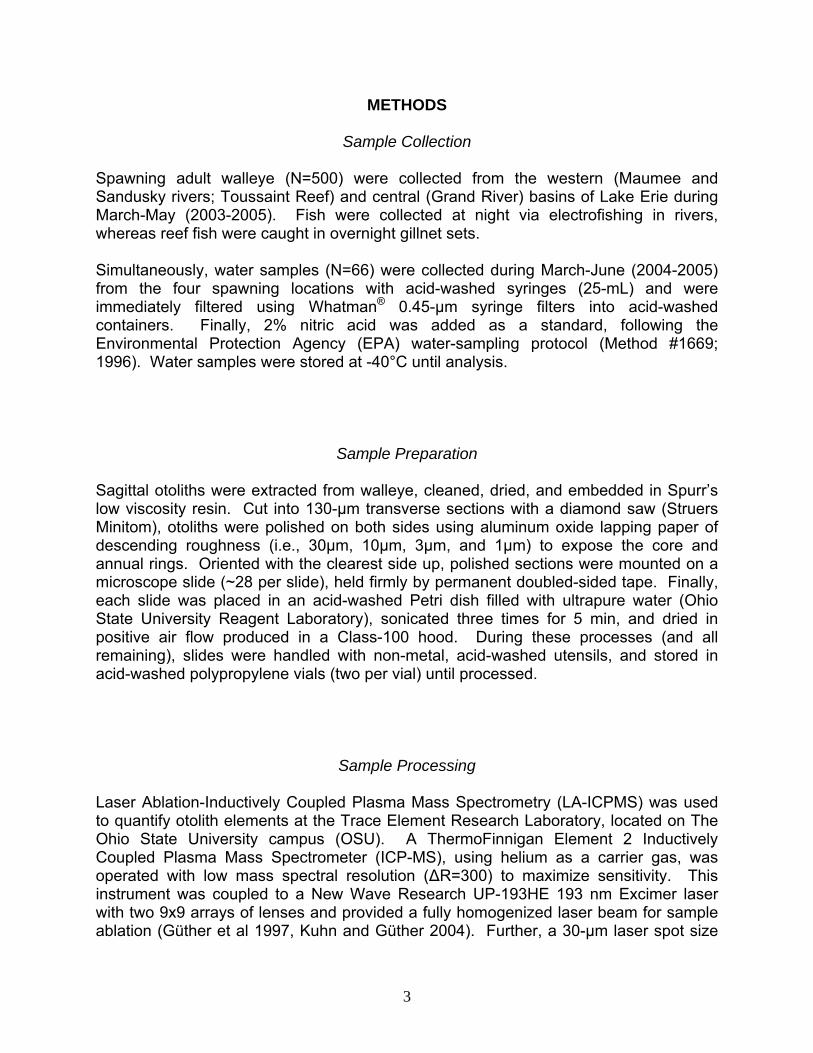
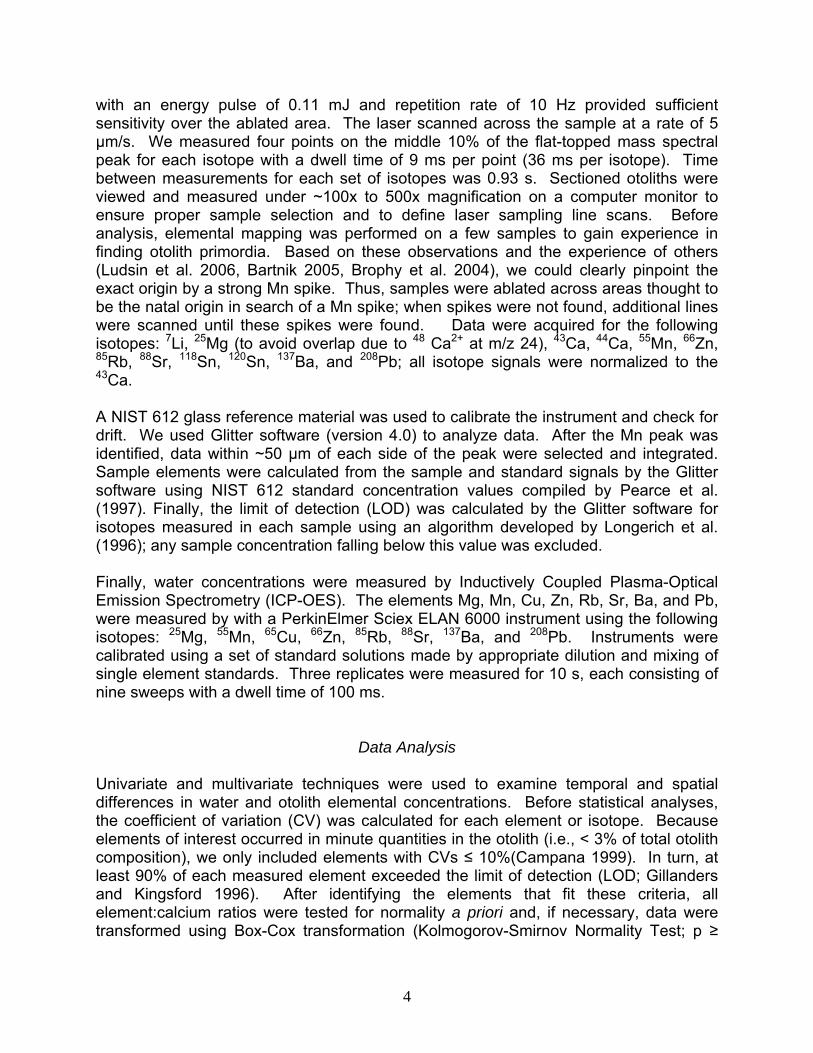
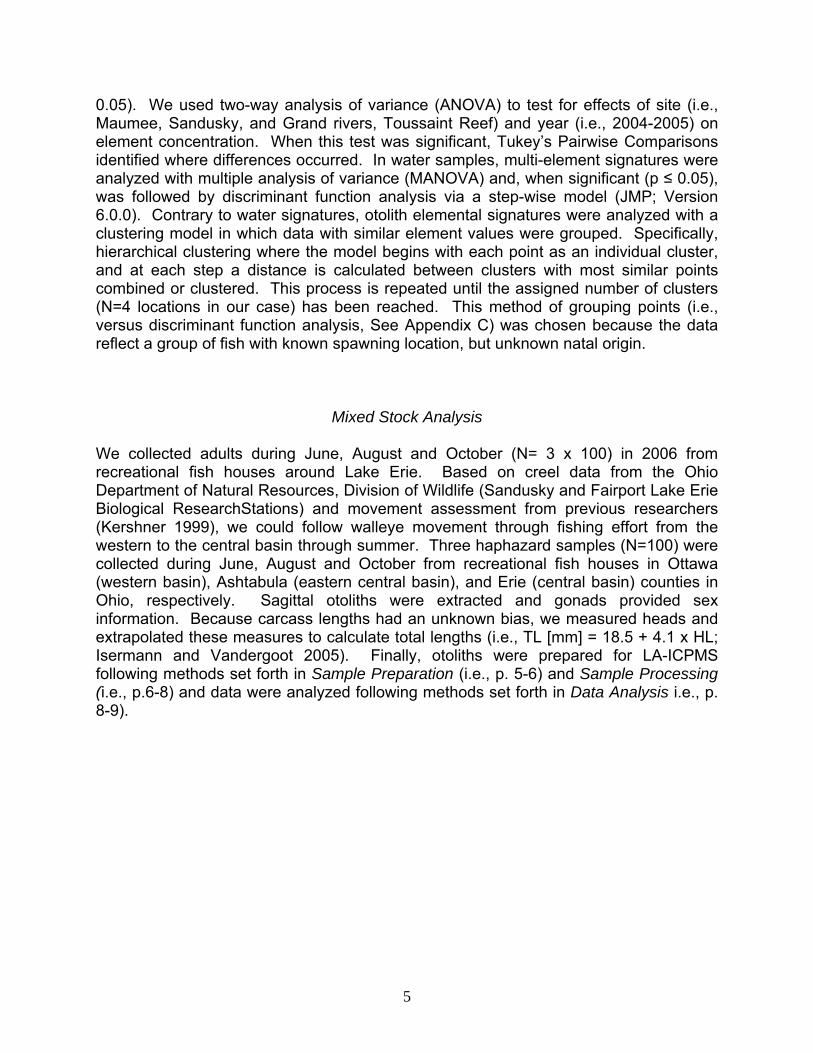
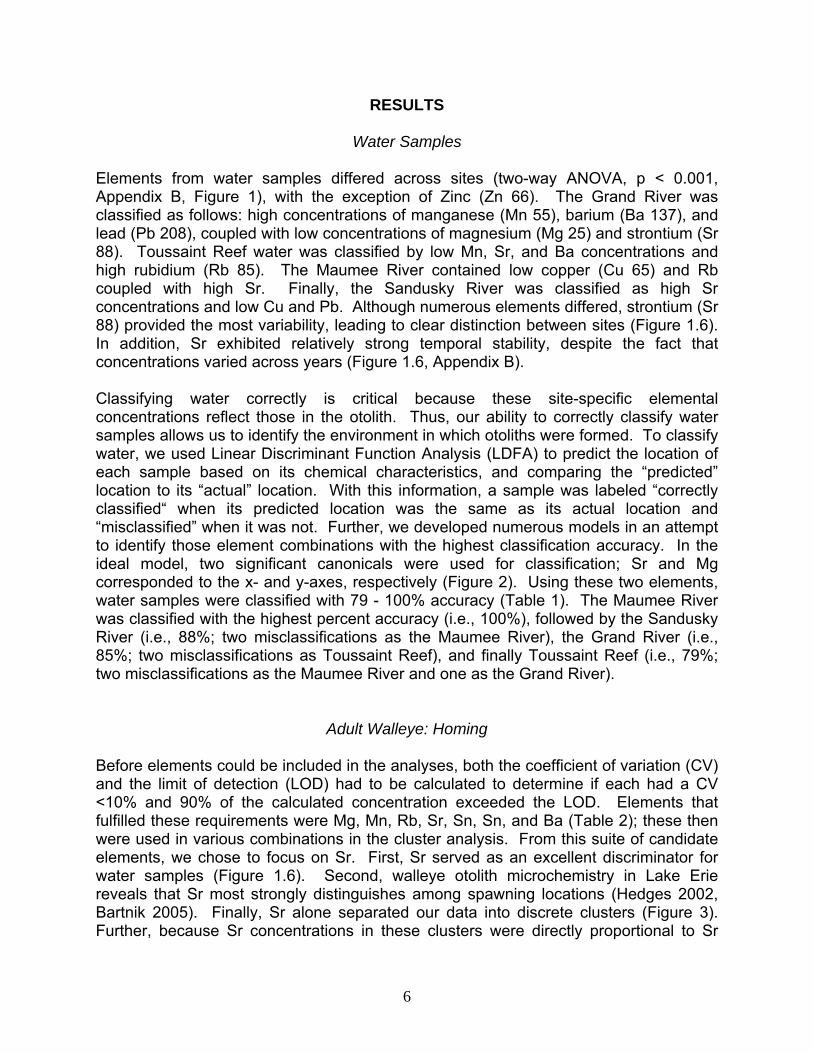
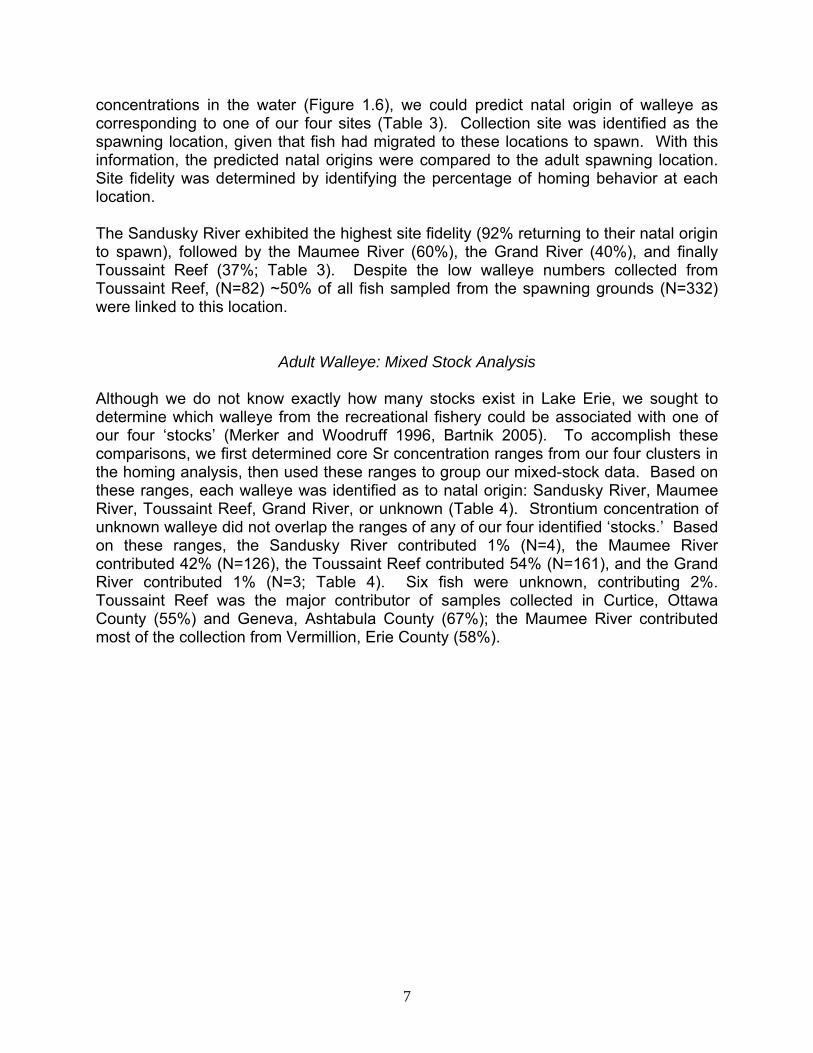
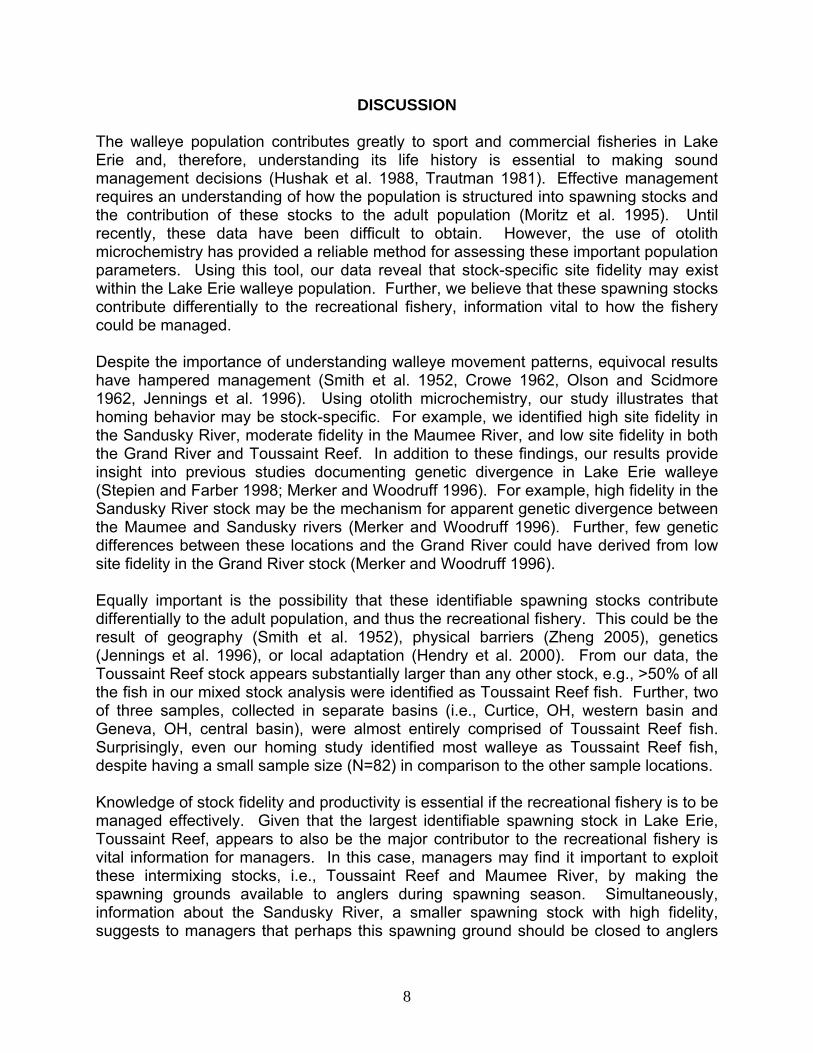
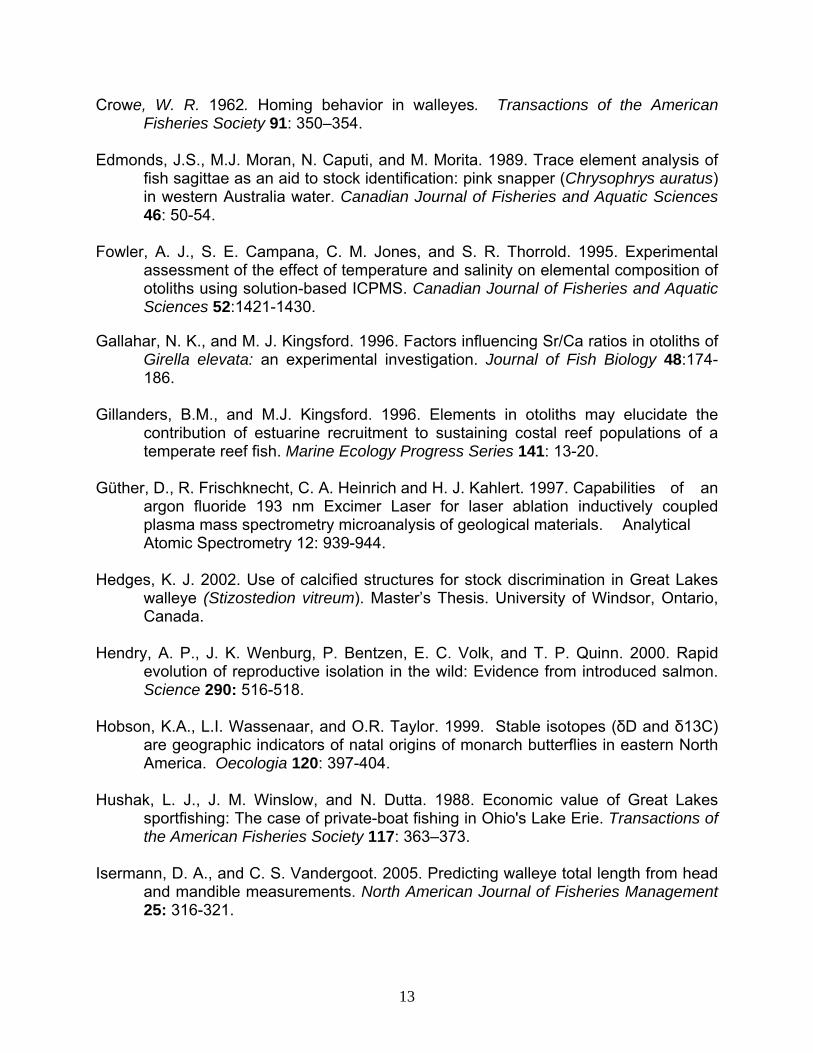
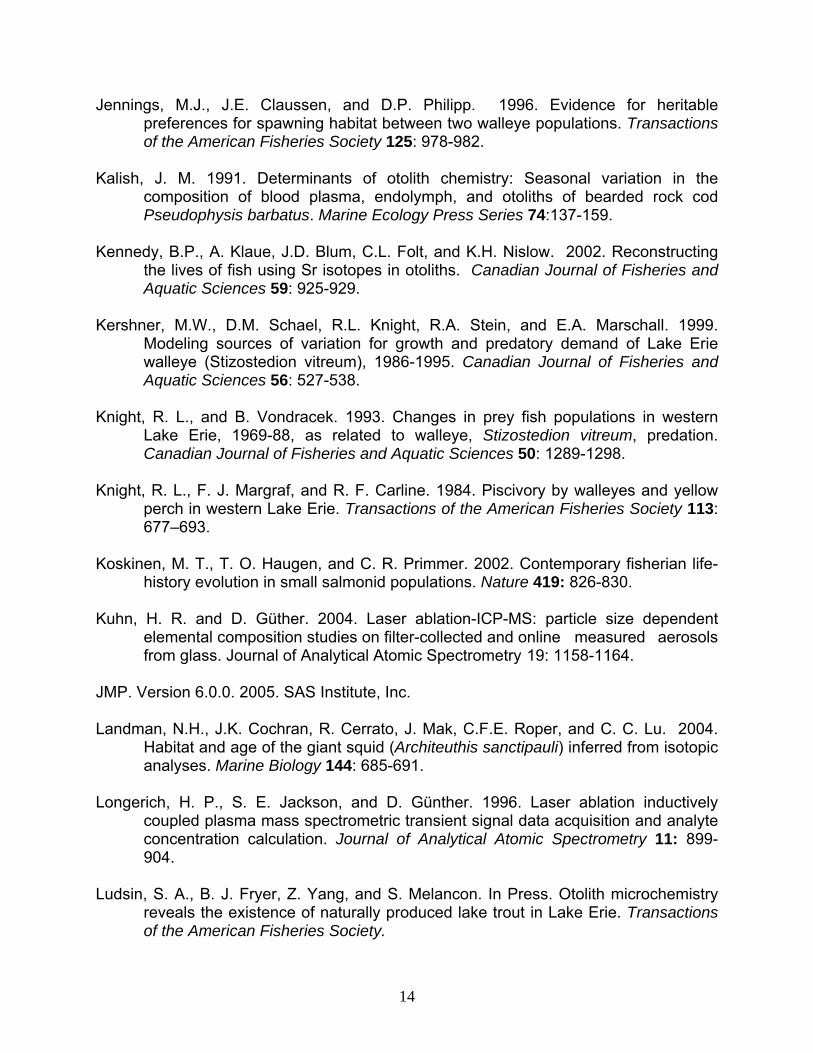
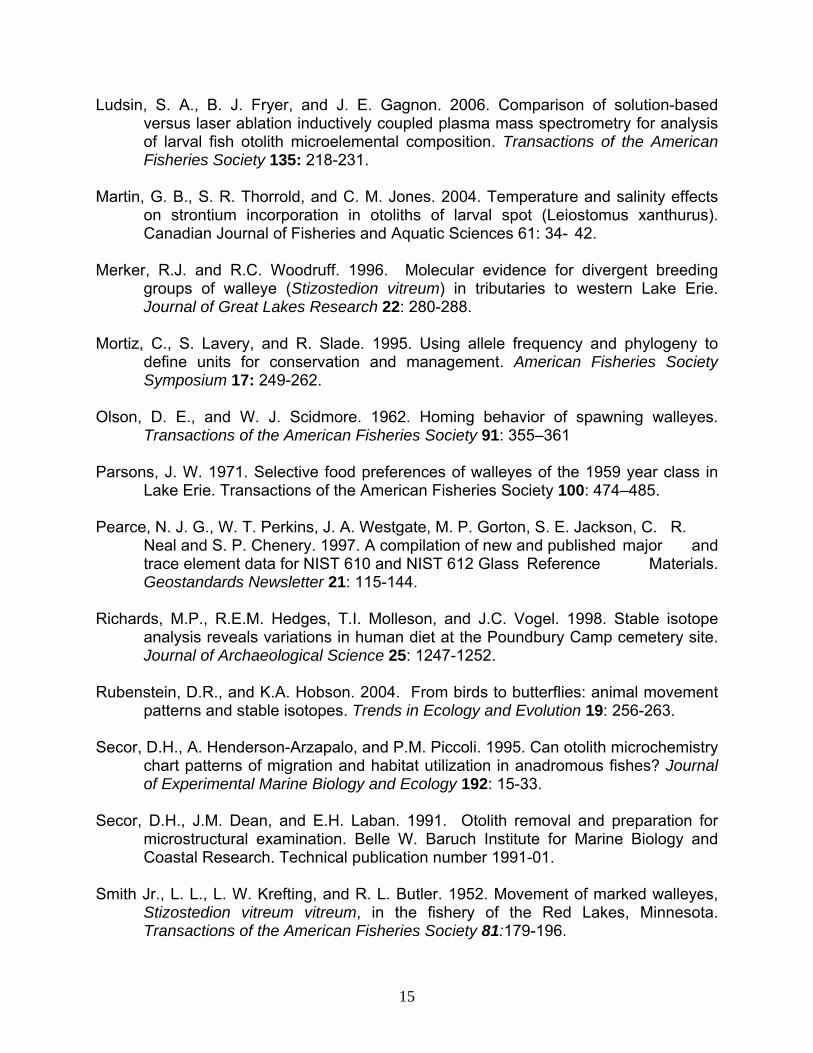
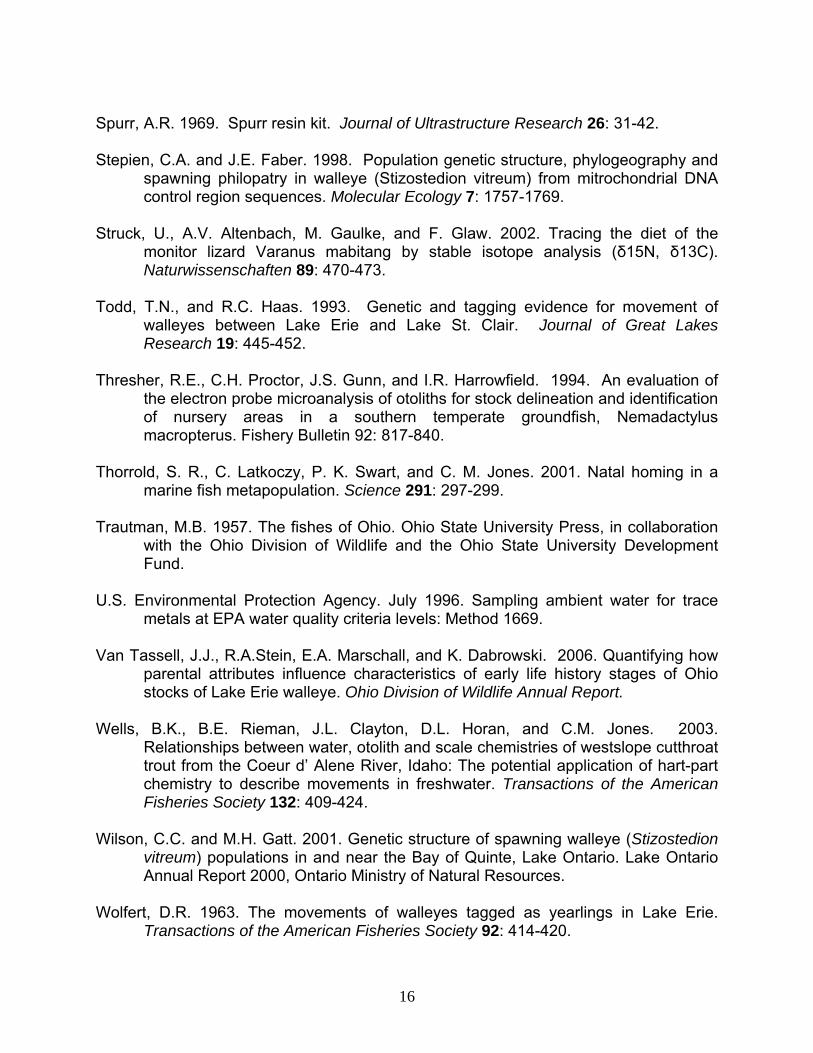
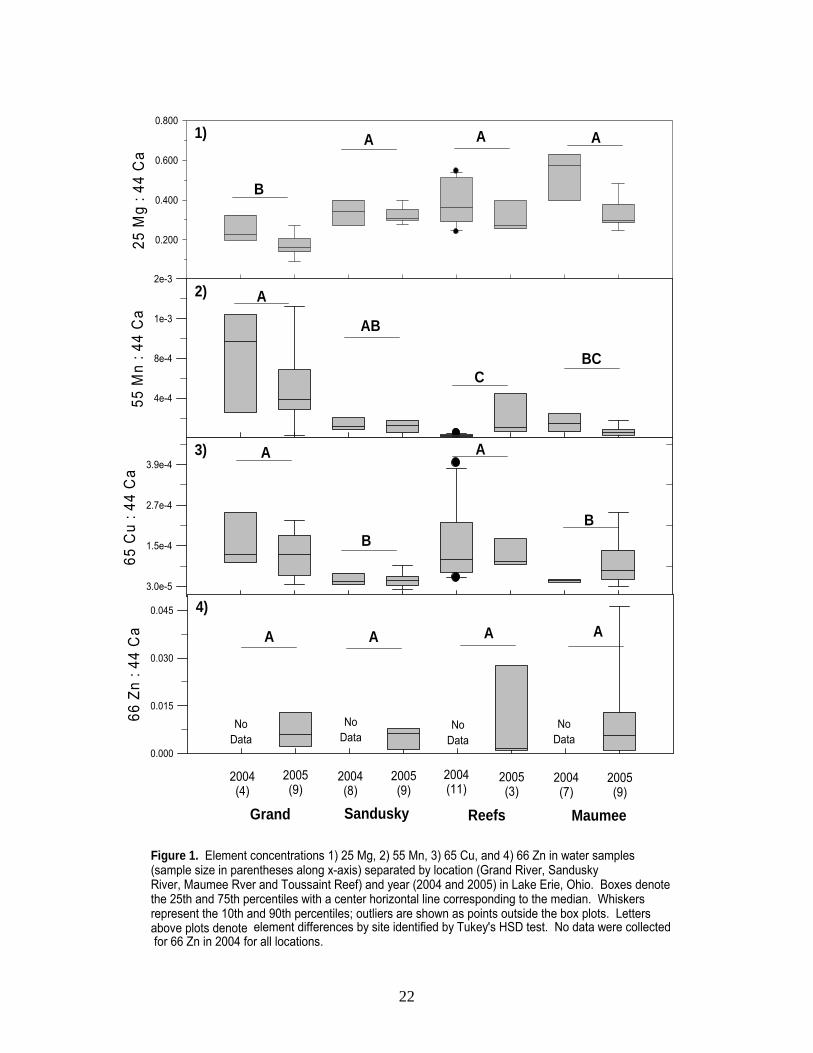
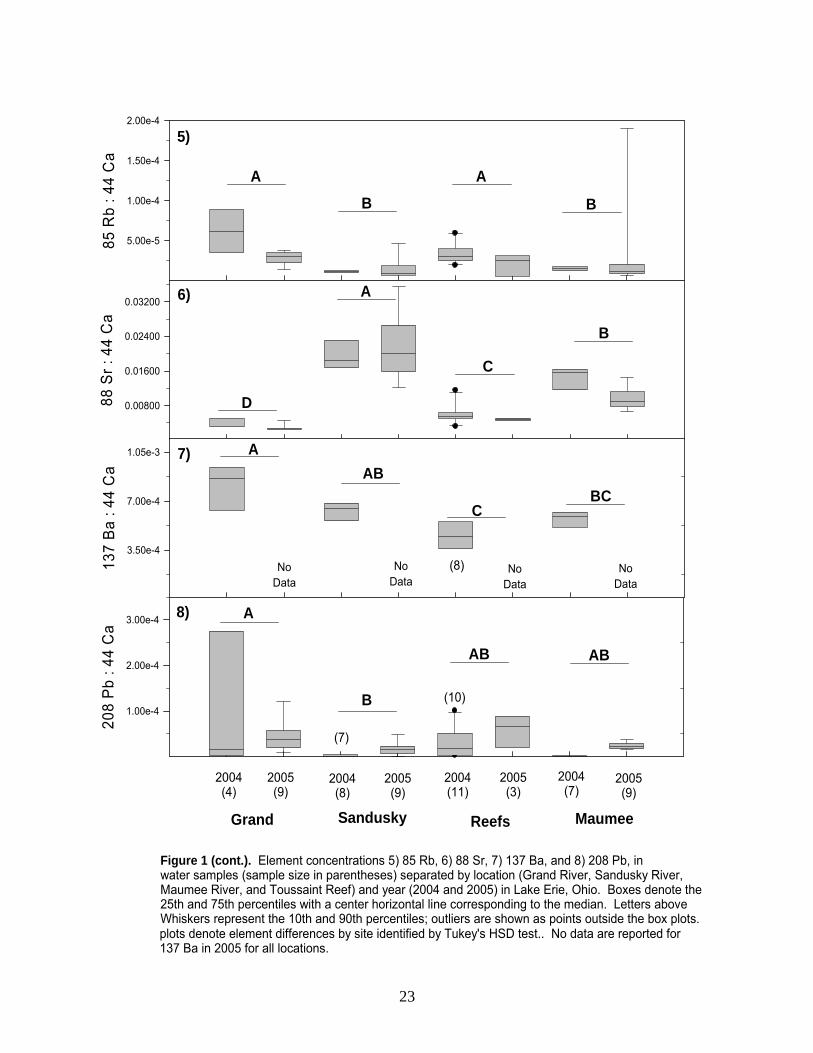
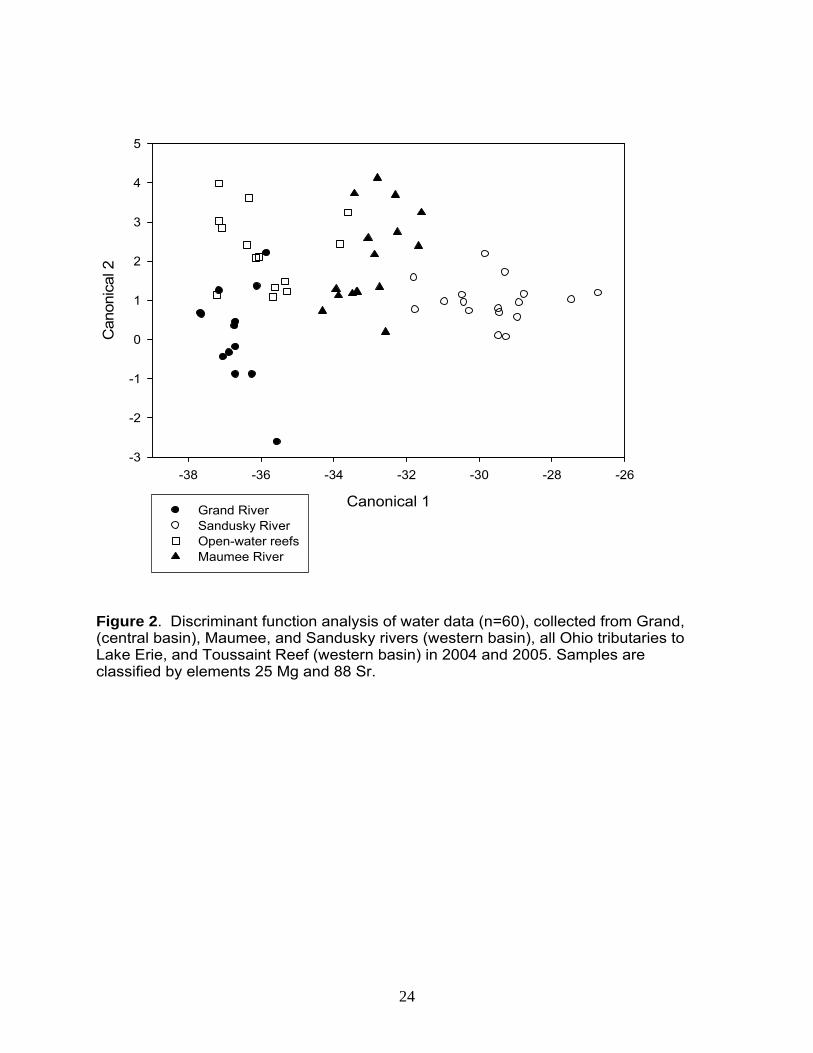
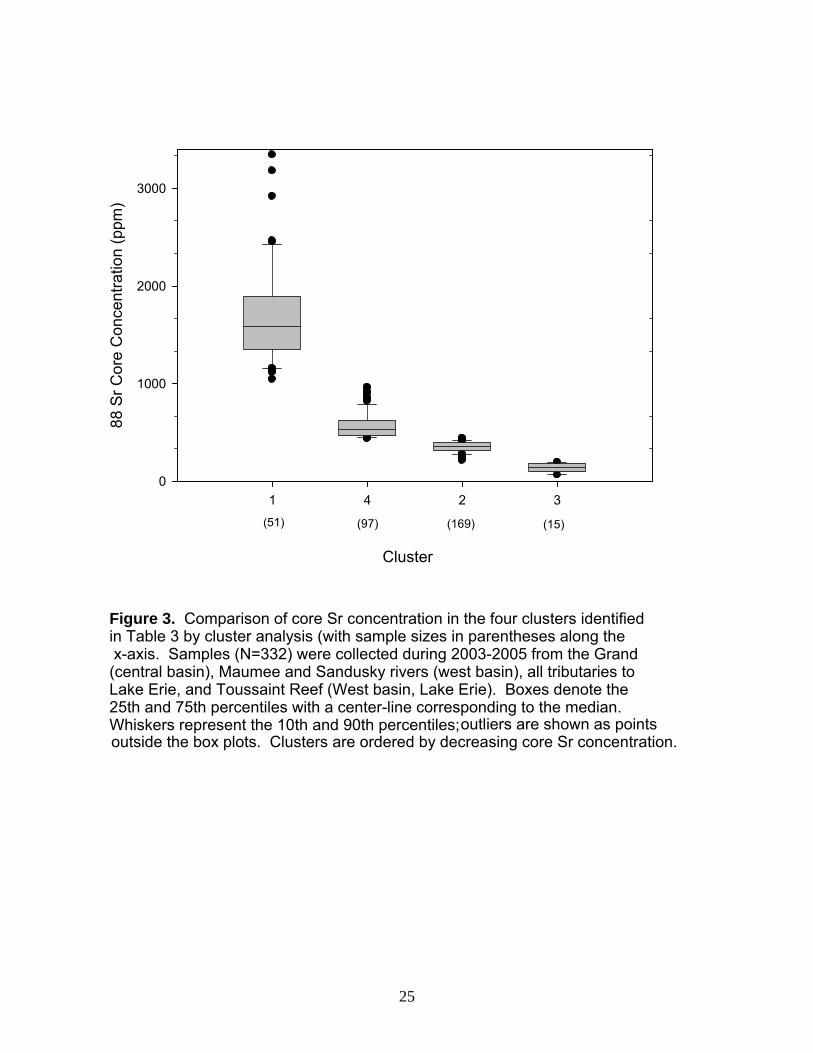
LIST OF FIGURES Figure Page 1. Element concentrations 1) 25 Mg, 2) 55 Mn, 3) 65 Cu, 4) 66 Zn, 5) 85 Rb, 6) 88 Sr, 7) 137 Ba, and 8) 208 Pb in water samples (sample size in parentheses along the x-axis) separated by location (Grand River, Sandusky River, Toussaint Reef in the western basin, and Maumee River) and year (2004 and 2005) in Lake Erie, Ohio. Boxes denote the 25th and 75th percentiles with a center horizontal line corresponding to the median. Whiskers represent the 10th and 90th percentiles; outliers were points outside the box plots. Letters above plots denote element differences by site identified by Tukey’s HSD test. No data were collected for 66 Zn in 2004 and 137 Ba in 2005 for all locations..............................................................................................32 2. Discriminant function analysis of water data (n=60), collected from Grand (central basin), Maumee, and Sandusky rivers (western basin), all Ohio tributaries to Lake Erie, and Toussaint Reef (western basin) in 2004 and 2005. Samples are classified by elements 25 Mg and 88 Sr …....................................................................................................................................................34 3. Comparison of core Sr concentration in the four clusters identified in Table 3 by cluster analysis (with sample sizes in parentheses along the x-axis). Samples (N=332) were collected during 2003-2005 from the Grand (central basin), Maumee, and Sandusky rivers (west basin), all tributaries to Lake Erie, and Toussaint Reef (western basin, Lake Erie). Boxes denote the 25th and 75th percentiles with a center-line corresponding to the median. Whiskers represent the 10th and 90th percentiles; outliers were points outside the box plots. Clusters were ordered by decreasing core Sr concentration...................................................................................................35
vii
INTRODUCTION
Understanding movement, life history, and ecology of a population provide insight into its role and success within an ecosystem (Rubenstein and Hobson 2004, Koskinen et al. 2002, Campana and Thorrold 2001). This insight is particularly important to the management of exploited stocks, in which distribution, abundance, and movement all can be influenced by harvest. Simply knowing that populations are apportioned into distinct spawning stocks can dictate the need for additional information, such as stock-specific productivity, distribution, and vulnerability to exploitation. Clearly, if stocks are mixed at harvest, then understanding the relative contribution of each stock to this harvest is required for appropriate management. If stocks contribute differentially to the harvest (a likely scenario), managers can exploit productive stocks and protect others, but only if they know their distribution and abundance. To provide insight into stock identification and distribution, considerable effort has been expended collecting and interpreting data on the movement patterns of organisms throughout their lives (Rubenstein and Hobson 2004). To this end, three major types of marker have been used to track organisms: extrinsic, biological, and biogeochemical markers. Although each has benefits and drawbacks, biogeochemical markers have real promise (Rubenstein and Hobson 2004). Use of biogeochemical markers is based on the premise that organisms will incorporate environmental elements into tissue and bone. As such, environmental variation in elemental concentration (due to geologic variation) is reflected in the organisms. For example, scientists now believe that the giant squid, Architeuthis sp., lives at depths of 125-500 m rather than 1,000 m as historically speculated (Landman et al. 2004). Similarly, Campana et al. (1995) successfully distinguished between two populations of cod, Gadus morhua, in a mixed stock fishery. Another system in which use of biogeochemical markers could have practical benefits is Lake Erie, specifically for quantifying walleye (Sander vitreus) behavior and movement. The Lake Erie walleye population is extremely valuable, contributing both ecologically (Knight and Vondracek 1993, Knight et al. 1984) and economically (Hushak et al. 1988, Trautman 1981) to the lake and its surrounding communities. At present, the lake-wide population is managed as a single unit; however, accumulating evidence has begun to suggest that multiple stocks exist. This evidence, in the form of genetic, tagging, and microchemistry studies, is consistent with reduced gene flow and suggests that behavioral barriers, such as homing and philopatry, could be a source of genetic isolation (Stepien and Farber 1998; Todd and Haas 1993, Bartnik, 2005, Hedges 2002). Further, mitochondrial differences have been identified among some spawning stocks but not others, suggesting that fidelity may be stock-specific (Merker and Woodruff 1996). Aside from genetic research, microchemistry analyses have identified numerous stocks within the lake and concluded that these spawning stocks were contributing differentially to the lake-wide population (Hedges 2002, Bartnik 2005).
1
As suggested above, genetic divergence within the Lake Erie walleye population could be stimulated by reproductive site fidelity (Stepien and Farber 1998, Hendry et al. 2000). Although walleye migration patterns during non-spawning periods have been documented (Wolfert 1963, Todd and Haas 1993, Smith et al. 1952, Kershner et al. 1999), little is known about their spring spawning movements. Further, research on walleye homing behavior in other systems has proven ambiguous; some studies provide evidence for strong homing behavior (Crowe 1962, Jennings et al. 1996), and others suggest this behavior is weak or inconsistent (Smith et al. 1952, Olson and Scidmore 1962). Despite a consensus, these studies suggest that site fidelity exists, but only in some populations. Further, given the genetic evidence, we believe that divergence may be taking place, emphasizing the need for identifying potential stocks. A relatively new biogeochemical technique in fisheries that has been used to distinguish stocks is otolith microchemistry. Fish otoliths, paired calcium carbonate structures in the head, provide a record of environmental history. Because fishes 1) absorb environmental elements into their otoliths and 2) do not reabsorb elements due to inertial properties of the otolith (Campana and Thorrold 2001), they provide a detailed record of their origin plus their subsequent, chronological habitat use. Because of its promising results, this technique has been widely used to classify stocks within populations (Bronte et al. 1996, Campana et al. 1995), quantify migration patterns (Wells et al. 2003, Kennedy et al. 2002, Thresher et al. 1994), identify homing behavior (Thorrold et al. 2001), and determine relative spawning-site contributions to adult populations (Gillanders and Kingsford 1996, Brazner et al. 2004). Given this success, we use otolith microchemistry to examine walleye movement patterns and stock structure. Specifically, we apply otolith microchemistry to identify spawning stocks of Lake Erie walleye, explore their reproductive isolation, and quantify their relative contribution to the recreational fishery.
2
METHODS
Sample Collection
Spawning adult walleye (N=500) were collected from the western (Maumee and Sandusky rivers; Toussaint Reef) and central (Grand River) basins of Lake Erie during March-May (2003-2005). Fish were collected at night via electrofishing in rivers, whereas reef fish were caught in overnight gillnet sets. Simultaneously, water samples (N=66) were collected during March-June (2004-2005) from the four spawning locations with acid-washed syringes (25-mL) and were immediately filtered using Whatman® 0.45-µm syringe filters into acid-washed containers. Finally, 2% nitric acid was added as a standard, following the Environmental Protection Agency (EPA) water-sampling protocol (Method #1669; 1996). Water samples were stored at -40°C until analysis.
Sample Preparation
Sagittal otoliths were extracted from walleye, cleaned, dried, and embedded in Spurr’s low viscosity resin. Cut into 130-µm transverse sections with a diamond saw (Struers Minitom), otoliths were polished on both sides using aluminum oxide lapping paper of descending roughness (i.e., 30µm, 10µm, 3µm, and 1µm) to expose the core and annual rings. Oriented with the clearest side up, polished sections were mounted on a microscope slide (~28 per slide), held firmly by permanent doubled-sided tape. Finally, each slide was placed in an acid-washed Petri dish filled with ultrapure water (Ohio State University Reagent Laboratory), sonicated three times for 5 min, and dried in positive air flow produced in a Class-100 hood. During these processes (and all remaining), slides were handled with non-metal, acid-washed utensils, and stored in acid-washed polypropylene vials (two per vial) until processed.
Sample Processing
Laser Ablation-Inductively Coupled Plasma Mass Spectrometry (LA-ICPMS) was used to quantify otolith elements at the Trace Element Research Laboratory, located on The Ohio State University campus (OSU). A ThermoFinnigan Element 2 Inductively Coupled Plasma Mass Spectrometer (ICP-MS), using helium as a carrier gas, was operated with low mass spectral resolution (∆R=300) to maximize sensitivity. This instrument was coupled to a New Wave Research UP-193HE 193 nm Excimer laser with two 9x9 arrays of lenses and provided a fully homogenized laser beam for sample ablation (Güther et al 1997, Kuhn and Güther 2004). Further, a 30-µm laser spot size
3
with an energy pulse of 0.11 mJ and repetition rate of 10 Hz provided sufficient sensitivity over the ablated area. The laser scanned across the sample at a rate of 5 µm/s. We measured four points on the middle 10% of the flat-topped mass spectral peak for each isotope with a dwell time of 9 ms per point (36 ms per isotope). Time between measurements for each set of isotopes was 0.93 s. Sectioned otoliths were viewed and measured under ~100x to 500x magnification on a computer monitor to ensure proper sample selection and to define laser sampling line scans. Before analysis, elemental mapping was performed on a few samples to gain experience in finding otolith primordia. Based on these observations and the experience of others (Ludsin et al. 2006, Bartnik 2005, Brophy et al. 2004), we could clearly pinpoint the exact origin by a strong Mn spike. Thus, samples were ablated across areas thought to be the natal origin in search of a Mn spike; when spikes were not found, additional lines were scanned until these spikes were found. Data were acquired for the following isotopes: 7Li, 25Mg (to avoid overlap due to 48 Ca2+ at m/z 24), 43Ca, 44Ca, 55Mn, 66Zn, 85Rb, 88Sr, 118Sn, 120Sn, 137Ba, and 208Pb; all isotope signals were normalized to the 43Ca. A NIST 612 glass reference material was used to calibrate the instrument and check for drift. We used Glitter software (version 4.0) to analyze data. After the Mn peak was identified, data within ~50 µm of each side of the peak were selected and integrated. Sample elements were calculated from the sample and standard signals by the Glitter software using NIST 612 standard concentration values compiled by Pearce et al. (1997). Finally, the limit of detection (LOD) was calculated by the Glitter software for isotopes measured in each sample using an algorithm developed by Longerich et al. (1996); any sample concentration falling below this value was excluded. Finally, water concentrations were measured by Inductively Coupled Plasma-Optical Emission Spectrometry (ICP-OES). The elements Mg, Mn, Cu, Zn, Rb, Sr, Ba, and Pb, were measured by with a PerkinElmer Sciex ELAN 6000 instrument using the following isotopes: 25Mg, 55Mn, 65Cu, 66Zn, 85Rb, 88Sr, 137Ba, and 208Pb. Instruments were calibrated using a set of standard solutions made by appropriate dilution and mixing of single element standards. Three replicates were measured for 10 s, each consisting of nine sweeps with a dwell time of 100 ms.
Data Analysis
Univariate and multivariate techniques were used to examine temporal and spatial differences in water and otolith elemental concentrations. Before statistical analyses, the coefficient of variation (CV) was calculated for each element or isotope. Because elements of interest occurred in minute quantities in the otolith (i.e., < 3% of total otolith composition), we only included elements with CVs ≤ 10%(Campana 1999). In turn, at least 90% of each measured element exceeded the limit of detection (LOD; Gillanders and Kingsford 1996). After identifying the elements that fit these criteria, all element:calcium ratios were tested for normality a priori and, if necessary, data were transformed using Box-Cox transformation (Kolmogorov-Smirnov Normality Test; p ≥
4
0.05). We used two-way analysis of variance (ANOVA) to test for effects of site (i.e., Maumee, Sandusky, and Grand rivers, Toussaint Reef) and year (i.e., 2004-2005) on element concentration. When this test was significant, Tukey’s Pairwise Comparisons identified where differences occurred. In water samples, multi-element signatures were analyzed with multiple analysis of variance (MANOVA) and, when significant (p ≤ 0.05), was followed by discriminant function analysis via a step-wise model (JMP; Version 6.0.0). Contrary to water signatures, otolith elemental signatures were analyzed with a clustering model in which data with similar element values were grouped. Specifically, hierarchical clustering where the model begins with each point as an individual cluster, and at each step a distance is calculated between clusters with most similar points combined or clustered. This process is repeated until the assigned number of clusters (N=4 locations in our case) has been reached. This method of grouping points (i.e., versus discriminant function analysis, See Appendix C) was chosen because the data reflect a group of fish with known spawning location, but unknown natal origin.
Mixed Stock Analysis We collected adults during June, August and October (N= 3 x 100) in 2006 from recreational fish houses around Lake Erie. Based on creel data from the Ohio Department of Natural Resources, Division of Wildlife (Sandusky and Fairport Lake Erie Biological ResearchStations) and movement assessment from previous researchers (Kershner 1999), we could follow walleye movement through fishing effort from the western to the central basin through summer. Three haphazard samples (N=100) were collected during June, August and October from recreational fish houses in Ottawa (western basin), Ashtabula (eastern central basin), and Erie (central basin) counties in Ohio, respectively. Sagittal otoliths were extracted and gonads provided sex information. Because carcass lengths had an unknown bias, we measured heads and extrapolated these measures to calculate total lengths (i.e., TL [mm] = 18.5 + 4.1 x HL; Isermann and Vandergoot 2005). Finally, otoliths were prepared for LA-ICPMS following methods set forth in Sample Preparation (i.e., p. 5-6) and Sample Processing (i.e., p.6-8) and data were analyzed following methods set forth in Data Analysis i.e., p. 8-9).
5
RESULTS
Water Samples
Elements from water samples differed across sites (two-way ANOVA, p < 0.001, Appendix B, Figure 1), with the exception of Zinc (Zn 66). The Grand River was classified as follows: high concentrations of manganese (Mn 55), barium (Ba 137), and lead (Pb 208), coupled with low concentrations of magnesium (Mg 25) and strontium (Sr 88). Toussaint Reef water was classified by low Mn, Sr, and Ba concentrations and high rubidium (Rb 85). The Maumee River contained low copper (Cu 65) and Rb coupled with high Sr. Finally, the Sandusky River was classified as high Sr concentrations and low Cu and Pb. Although numerous elements differed, strontium (Sr 88) provided the most variability, leading to clear distinction between sites (Figure 1.6). In addition, Sr exhibited relatively strong temporal stability, despite the fact that concentrations varied across years (Figure 1.6, Appendix B). Classifying water correctly is critical because these site-specific elemental concentrations reflect those in the otolith. Thus, our ability to correctly classify water samples allows us to identify the environment in which otoliths were formed. To classify water, we used Linear Discriminant Function Analysis (LDFA) to predict the location of each sample based on its chemical characteristics, and comparing the “predicted” location to its “actual” location. With this information, a sample was labeled “correctly classified“ when its predicted location was the same as its actual location and “misclassified” when it was not. Further, we developed numerous models in an attempt to identify those element combinations with the highest classification accuracy. In the ideal model, two significant canonicals were used for classification; Sr and Mg corresponded to the x- and y-axes, respectively (Figure 2). Using these two elements, water samples were classified with 79 - 100% accuracy (Table 1). The Maumee River was classified with the highest percent accuracy (i.e., 100%), followed by the Sandusky River (i.e., 88%; two misclassifications as the Maumee River), the Grand River (i.e., 85%; two misclassifications as Toussaint Reef), and finally Toussaint Reef (i.e., 79%; two misclassifications as the Maumee River and one as the Grand River).
Adult Walleye: Homing Before elements could be included in the analyses, both the coefficient of variation (CV) and the limit of detection (LOD) had to be calculated to determine if each had a CV <10% and 90% of the calculated concentration exceeded the LOD. Elements that fulfilled these requirements were Mg, Mn, Rb, Sr, Sn, Sn, and Ba (Table 2); these then were used in various combinations in the cluster analysis. From this suite of candidate elements, we chose to focus on Sr. First, Sr served as an excellent discriminator for water samples (Figure 1.6). Second, walleye otolith microchemistry in Lake Erie reveals that Sr most strongly distinguishes among spawning locations (Hedges 2002, Bartnik 2005). Finally, Sr alone separated our data into discrete clusters (Figure 3). Further, because Sr concentrations in these clusters were directly proportional to Sr
6
concentrations in the water (Figure 1.6), we could predict natal origin of walleye as corresponding to one of our four sites (Table 3). Collection site was identified as the spawning location, given that fish had migrated to these locations to spawn. With this information, the predicted natal origins were compared to the adult spawning location. Site fidelity was determined by identifying the percentage of homing behavior at each location. The Sandusky River exhibited the highest site fidelity (92% returning to their natal origin to spawn), followed by the Maumee River (60%), the Grand River (40%), and finally Toussaint Reef (37%; Table 3). Despite the low walleye numbers collected from Toussaint Reef, (N=82) ~50% of all fish sampled from the spawning grounds (N=332) were linked to this location.
Adult Walleye: Mixed Stock Analysis Although we do not know exactly how many stocks exist in Lake Erie, we sought to determine which walleye from the recreational fishery could be associated with one of our four ‘stocks’ (Merker and Woodruff 1996, Bartnik 2005). To accomplish these comparisons, we first determined core Sr concentration ranges from our four clusters in the homing analysis, then used these ranges to group our mixed-stock data. Based on these ranges, each walleye was identified as to natal origin: Sandusky River, Maumee River, Toussaint Reef, Grand River, or unknown (Table 4). Strontium concentration of unknown walleye did not overlap the ranges of any of our four identified ‘stocks.’ Based on these ranges, the Sandusky River contributed 1% (N=4), the Maumee River contributed 42% (N=126), the Toussaint Reef contributed 54% (N=161), and the Grand River contributed 1% (N=3; Table 4). Six fish were unknown, contributing 2%. Toussaint Reef was the major contributor of samples collected in Curtice, Ottawa County (55%) and Geneva, Ashtabula County (67%); the Maumee River contributed most of the collection from Vermillion, Erie County (58%).
7
DISCUSSION The walleye population contributes greatly to sport and commercial fisheries in Lake Erie and, therefore, understanding its life history is essential to making sound management decisions (Hushak et al. 1988, Trautman 1981). Effective management requires an understanding of how the population is structured into spawning stocks and the contribution of these stocks to the adult population (Moritz et al. 1995). Until recently, these data have been difficult to obtain. However, the use of otolith microchemistry has provided a reliable method for assessing these important population parameters. Using this tool, our data reveal that stock-specific site fidelity may exist within the Lake Erie walleye population. Further, we believe that these spawning stocks contribute differentially to the recreational fishery, information vital to how the fishery could be managed. Despite the importance of understanding walleye movement patterns, equivocal results have hampered management (Smith et al. 1952, Crowe 1962, Olson and Scidmore 1962, Jennings et al. 1996). Using otolith microchemistry, our study illustrates that homing behavior may be stock-specific. For example, we identified high site fidelity in the Sandusky River, moderate fidelity in the Maumee River, and low site fidelity in both the Grand River and Toussaint Reef. In addition to these findings, our results provide insight into previous studies documenting genetic divergence in Lake Erie walleye (Stepien and Farber 1998; Merker and Woodruff 1996). For example, high fidelity in the Sandusky River stock may be the mechanism for apparent genetic divergence between the Maumee and Sandusky rivers (Merker and Woodruff 1996). Further, few genetic differences between these locations and the Grand River could have derived from low site fidelity in the Grand River stock (Merker and Woodruff 1996). Equally important is the possibility that these identifiable spawning stocks contribute differentially to the adult population, and thus the recreational fishery. This could be the result of geography (Smith et al. 1952), physical barriers (Zheng 2005), genetics (Jennings et al. 1996), or local adaptation (Hendry et al. 2000). From our data, the Toussaint Reef stock appears substantially larger than any other stock, e.g., >50% of all the fish in our mixed stock analysis were identified as Toussaint Reef fish. Further, two of three samples, collected in separate basins (i.e., Curtice, OH, western basin and Geneva, OH, central basin), were almost entirely comprised of Toussaint Reef fish. Surprisingly, even our homing study identified most walleye as Toussaint Reef fish, despite having a small sample size (N=82) in comparison to the other sample locations. Knowledge of stock fidelity and productivity is essential if the recreational fishery is to be managed effectively. Given that the largest identifiable spawning stock in Lake Erie, Toussaint Reef, appears to also be the major contributor to the recreational fishery is vital information for managers. In this case, managers may find it important to exploit these intermixing stocks, i.e., Toussaint Reef and Maumee River, by making the spawning grounds available to anglers during spawning season. Simultaneously, information about the Sandusky River, a smaller spawning stock with high fidelity, suggests to managers that perhaps this spawning ground should be closed to anglers
8
during spawning season so that these walleye can reproduce, thus protecting the genetic integrity of the Sandusky stock. In addition to otoliths, we used water to quantify chemical signatures among our sample sites, setting the foundation for our otolith analyses. Although we identified numerous appropriate elements that allowed for characterization, we ultimately chose Sr as the only discriminator, given that it clearly distinguished water collected from our sample sites. Likewise, other researchers have indicated that Sr is the most powerful discriminator in walleye residing in these locations. For example, one microchemistry study identified Sr as the only significant discriminator among larval walleye from the Maumee and Sandusky rivers and the Toussaint Reef (Hedges 2002). Further, another microchemistry study in Lake Erie chose to use this element in a mixed stock analysis (Bartnik 2005). As a result of our water analyses and previous microchemistry findings, we chose to only use this element in both the homing study and mixed stock analysis. Despite the advantages of using Sr as our only classification variable, we had to make some assumptions about this element, as well as the technique in general. For example, we assumed Sr was temporally stable, in spite of the variation in our two years of water samples. In addition, fish and water were concurrently collected during only a few years. To justify these assumptions, we examined our data and water quality data from United States Geological Survey (USGS). Data were available from the Maumee, Sandusky and Grand rivers during 1962-1999. In both data sets variation was present; however, concentrations in our sample sites remained relatively proportional to one another over time (i.e., Sandusky River always exhibited highest Sr concentration, followed by Maumee River, Toussaint Reef, and Grand River, respectively). Despite the temporal stability described, we recommend implementing a long-term water sampling program that would evaluate chemical stability as well as allow for collection of concurrent water and otolith data. Collecting water samples from more locations around the entire lake will help us identify all site-specific signatures and associated overlap. In addition, we made a specific assumption about the number of spawning stocks. Despite research (Hedges 2003, Bartnik 2005, Merker and Woodruff 1996, Stepien and Farber 1998), the exact number that exists lake-wide is unknown. For example, Bartnik (2005) suggests that four stocks contribute to the western basin. Others believe that the Ontario reefs, in Canada, are major spawning sites, contributing substantially to the adult population (Bartnik 2005, Hedges 2003). Despite this ambiguity, we chose to assume four stocks exist based on our water samples. Because we clearly distinguished four sites from our water samples, we assumed walleye collected from these sites could be distinguished. In addition, genetic evidence (Todd and Haas 1993), site-specific parental attributes (Van Tassell 2006), and microchemistry research indicates that at least these four spawning stocks do, in fact, exist. Long-term annual water sampling, as suggested above, will contribute to this issue.
Finally, as is always the case in otolith microchemistry, assumptions concerning the general technique are necessary. The main assumption is that chemical concentrations
9
are deposited in the otolith in proportion to those exhibited in the environment, thus reflecting the fish’s residency (Campana 1999). In the past, scientists have discovered factors that may affect the rate at which these elements are substituted for calcium into the otolith. The list includes exogenous factors such as temperature, salinity and diet; and endogenous factors including growth rate, gonadal development, and stress. Although the exact influence of these factors on otolith absorption is unknown, they appear to have some effect on elemental uptake and are discussed in the subsequent paragraphs.
Numerous papers have examined the effects of exogenous factors, particularly temperature regime. Some experiments have illustrated a positive correlation between temperature and otolith absorption (Bath et al. 2000, Fowler et al. 1995), whereas others have found no relationship (Sadovy and Severin 1994). Further, researchers have found inconclusive results when examining the interactions of multiple exogenous factors (Gallaher and Kingsford 1996, Martin et al. 2004, Secor et al. 1995). Certain endogenous factors may also play a role in otolith uptake of elements. For example, some researchers have found that gonadal development is important (Gallahar and Kingsford 1996, Kalish 1991). On the contrary, Sadovy and Stevenson (1994) concluded that gonadal development and reproductive activity was not a source of differentiating Sr uptake in otoliths. Physiological factors such as stress also have been examined. Gallahar and Kingsford (1996) concluded that although they found a positive relationship with diet and no relationship with temperature in their experiment, stress could have had a major impact on their results. In addition, they explained the difficulty in conducting experiments to control environmental factors and, inadvertently inducing stress on organisms. It is obvious that more research is critical to clearly understand the influence of these factors on otolith composition. In the meantime, we do know that some factors (e.g., salinity and diet) do not appear to be as influential in freshwater systems. For example, most freshwater species are not passing through different salinity gradients (i.e., ocean to tributaries to spawn) and so salinity does not appear to be a problem. Further, unlike marine species, freshwater fish receive trace elements through their gills, and so diet is less likely to be important as well (Campana 1999). Endogenous factors (e.g., growth rate, gonadal development, and stress) appear to have some effect on otolith elemental composition in freshwater systems, however, their impact is so minor that, given geological differences among systems are high, physiological effects do not appear to confound the data (Kalish 1991, Sadovy and Stevenson 1994). Currently, temperature appears to be the most important factor in freshwater systems and may have an effect on how elements are absorbed and incorporated into the otolith. However, more research is necessary to quantify its impact so that these data may be interpreted more effectively. In the meantime, we may not be able to quantify the impact of these factors on our otolith samples; however, we do know that researchers have been able to actually distinguish larval walleye from our sample sites, suggesting that element differences among sites are larger than the influence of the described variables (Hedges 2002, Bartnik 2005).
10
In this study, we compared spawning stocks by quantifying site fidelity and measuring the contribution of each to the mixed stock fishery. By quantifying elements in both water and otoliths, we used water to characterize site elemental signatures which, in turn, set the foundation for our otolith analyses. Thus, using Sr as our only discriminator, we identified four spawning stocks in the homing study and determined their stock-specific fidelity. In addition, our homing study allowed us to quantify the range of Sr concentration in identified fish and apply these ranges to our mixed stock analysis. Rather than use water or larvae as priors, we used adult walleyes and applied their Sr differences to the mixed stock analysis. These data will give rise to new research opportunities in Lake Erie, such as comparing the contribution of these spawning stocks to the commercial fishery in Canada. Equally important, managers will be able to make well-informed decisions on how to manage this fishery effectively so that it will continue to thrive.
11
LITERATURE CITED Bartnik, S. E. 2005. Population dynamics of age-0 walleye in western Lake Erie.
Master’s Thesis. University of Windsor, Ontario, Canada.
Bath, G. E., S. R. Thorrold, C. M. Jones, S. E. Campana, J. W. McLaren, and J. W. H. Lam. 2000. Strontium and barium uptake in aragonitic otoliths of marine fish. Geochimica et Cosmochimica Acta 64: 1705-1714.
Brazner, J. C., S. E. Campana, and D. K. Tanner. 2004. 2004. Habitat fingerprints for
Lake Superior coastal wetlands derived from elemental analysis of yellow perch otoliths. Transactions of the American Fisheries Society 133: 692-704.
Bronte, C. R., R. J. Hesselberg, J. A. Shoesmith, and M. H. Hoff. 1996. Discrimination
among spawning concentrations of Lake Superior lake herring based on trace element profiles in sagittae. Transactions of the American Fisheries Society 125: 852-859.
Brothers, E., and R. Thresher. 2004. Statolith chemical analysis as a means of
identifying stream origins of lampreys in Lake Huron. Transactions of the American Fisheries Society 133: 1107-1116.
Campana, S.E. 1999. Chemistry and composition of fish otoliths: pathways,
mechanisms and applications. Marine Ecology Progress Series 188: 263-297. Campana, S.E., J.A. Gagne, and J.W. McLaren. 1995. Elemental fingerprinting of fish
otoliths using ID-ICPMS. Marine Ecology Progress Series 122: 115-120. Campana, S.E., and J.D. Neilson. 1985. Microstructure of fish otoliths. Canadian
Journal of Fisheries and Aquatic Sciences 42: 1014-1032. Campana, S.E., and S.R. Thorrold. 2001. Otoliths, increments, and elements: keys to a
comprehensive understanding of fish populations? Canadian Journal of Fisheries and Aquatic Sciences 58: 30-38.
Cherel, Y., K.A. Hobson, and H. Weimerskirch. 2000. Using stable-isotope analysis of
feathers to distinguish moulting and breeding origins of seabirds. Oecologia 122: 155-162.
Corkum, L. D., J. J. H. Ciborowski, and R. G. Poulin. 1997. Effects of emergence date
and maternal size on egg development and sizes of eggs and first-instar nymphs of a semelparous aquatic insect. Oecologia 111: 69–75.
12
Crowe, W. R. 1962. Homing behavior in walleyes. Transactions of the American Fisheries Society 91: 350–354.
Edmonds, J.S., M.J. Moran, N. Caputi, and M. Morita. 1989. Trace element analysis of
fish sagittae as an aid to stock identification: pink snapper (Chrysophrys auratus) in western Australia water. Canadian Journal of Fisheries and Aquatic Sciences 46: 50-54.
Fowler, A. J., S. E. Campana, C. M. Jones, and S. R. Thorrold. 1995. Experimental
assessment of the effect of temperature and salinity on elemental composition of otoliths using solution-based ICPMS. Canadian Journal of Fisheries and Aquatic Sciences 52:1421-1430.
Gallahar, N. K., and M. J. Kingsford. 1996. Factors influencing Sr/Ca ratios in otoliths of Girella elevata: an experimental investigation. Journal of Fish Biology 48:174-186.
Gillanders, B.M., and M.J. Kingsford. 1996. Elements in otoliths may elucidate the
contribution of estuarine recruitment to sustaining costal reef populations of a temperate reef fish. Marine Ecology Progress Series 141: 13-20.
Güther, D., R. Frischknecht, C. A. Heinrich and H. J. Kahlert. 1997. Capabilities of an
argon fluoride 193 nm Excimer Laser for laser ablation inductively coupled plasma mass spectrometry microanalysis of geological materials. Analytical Atomic Spectrometry 12: 939-944.
Hedges, K. J. 2002. Use of calcified structures for stock discrimination in Great Lakes
walleye (Stizostedion vitreum). Master’s Thesis. University of Windsor, Ontario, Canada.
Hendry, A. P., J. K. Wenburg, P. Bentzen, E. C. Volk, and T. P. Quinn. 2000. Rapid
evolution of reproductive isolation in the wild: Evidence from introduced salmon. Science 290: 516-518.
Hobson, K.A., L.I. Wassenaar, and O.R. Taylor. 1999. Stable isotopes (δD and δ13C)
are geographic indicators of natal origins of monarch butterflies in eastern North America. Oecologia 120: 397-404.
Hushak, L. J., J. M. Winslow, and N. Dutta. 1988. Economic value of Great Lakes
sportfishing: The case of private-boat fishing in Ohio's Lake Erie. Transactions of the American Fisheries Society 117: 363–373.
Isermann, D. A., and C. S. Vandergoot. 2005. Predicting walleye total length from head
and mandible measurements. North American Journal of Fisheries Management 25: 316-321.
13
Jennings, M.J., J.E. Claussen, and D.P. Philipp. 1996. Evidence for heritable preferences for spawning habitat between two walleye populations. Transactions of the American Fisheries Society 125: 978-982.
Kalish, J. M. 1991. Determinants of otolith chemistry: Seasonal variation in the
composition of blood plasma, endolymph, and otoliths of bearded rock cod Pseudophysis barbatus. Marine Ecology Press Series 74:137-159.
Kennedy, B.P., A. Klaue, J.D. Blum, C.L. Folt, and K.H. Nislow. 2002. Reconstructing
the lives of fish using Sr isotopes in otoliths. Canadian Journal of Fisheries and Aquatic Sciences 59: 925-929.
Kershner, M.W., D.M. Schael, R.L. Knight, R.A. Stein, and E.A. Marschall. 1999.
Modeling sources of variation for growth and predatory demand of Lake Erie walleye (Stizostedion vitreum), 1986-1995. Canadian Journal of Fisheries and Aquatic Sciences 56: 527-538.
Knight, R. L., and B. Vondracek. 1993. Changes in prey fish populations in western
Lake Erie, 1969-88, as related to walleye, Stizostedion vitreum, predation. Canadian Journal of Fisheries and Aquatic Sciences 50: 1289-1298.
Knight, R. L., F. J. Margraf, and R. F. Carline. 1984. Piscivory by walleyes and yellow
perch in western Lake Erie. Transactions of the American Fisheries Society 113: 677–693.
Koskinen, M. T., T. O. Haugen, and C. R. Primmer. 2002. Contemporary fisherian life-
history evolution in small salmonid populations. Nature 419: 826-830. Kuhn, H. R. and D. Güther. 2004. Laser ablation-ICP-MS: particle size dependent
elemental composition studies on filter-collected and online measured aerosols from glass. Journal of Analytical Atomic Spectrometry 19: 1158-1164.
JMP. Version 6.0.0. 2005. SAS Institute, Inc. Landman, N.H., J.K. Cochran, R. Cerrato, J. Mak, C.F.E. Roper, and C. C. Lu. 2004.
Habitat and age of the giant squid (Architeuthis sanctipauli) inferred from isotopic analyses. Marine Biology 144: 685-691.
Longerich, H. P., S. E. Jackson, and D. Günther. 1996. Laser ablation inductively
coupled plasma mass spectrometric transient signal data acquisition and analyte concentration calculation. Journal of Analytical Atomic Spectrometry 11: 899-904.
Ludsin, S. A., B. J. Fryer, Z. Yang, and S. Melancon. In Press. Otolith microchemistry
reveals the existence of naturally produced lake trout in Lake Erie. Transactions of the American Fisheries Society.
14
Ludsin, S. A., B. J. Fryer, and J. E. Gagnon. 2006. Comparison of solution-based versus laser ablation inductively coupled plasma mass spectrometry for analysis of larval fish otolith microelemental composition. Transactions of the American Fisheries Society 135: 218-231.
Martin, G. B., S. R. Thorrold, and C. M. Jones. 2004. Temperature and salinity effects
on strontium incorporation in otoliths of larval spot (Leiostomus xanthurus). Canadian Journal of Fisheries and Aquatic Sciences 61: 34- 42.
Merker, R.J. and R.C. Woodruff. 1996. Molecular evidence for divergent breeding
groups of walleye (Stizostedion vitreum) in tributaries to western Lake Erie. Journal of Great Lakes Research 22: 280-288.
Mortiz, C., S. Lavery, and R. Slade. 1995. Using allele frequency and phylogeny to
define units for conservation and management. American Fisheries Society Symposium 17: 249-262.
Olson, D. E., and W. J. Scidmore. 1962. Homing behavior of spawning walleyes.
Transactions of the American Fisheries Society 91: 355–361 Parsons, J. W. 1971. Selective food preferences of walleyes of the 1959 year class in
Lake Erie. Transactions of the American Fisheries Society 100: 474–485. Pearce, N. J. G., W. T. Perkins, J. A. Westgate, M. P. Gorton, S. E. Jackson, C. R.
Neal and S. P. Chenery. 1997. A compilation of new and published major and trace element data for NIST 610 and NIST 612 Glass Reference Materials. Geostandards Newsletter 21: 115-144.
Richards, M.P., R.E.M. Hedges, T.I. Molleson, and J.C. Vogel. 1998. Stable isotope
analysis reveals variations in human diet at the Poundbury Camp cemetery site. Journal of Archaeological Science 25: 1247-1252.
Rubenstein, D.R., and K.A. Hobson. 2004. From birds to butterflies: animal movement
patterns and stable isotopes. Trends in Ecology and Evolution 19: 256-263. Secor, D.H., A. Henderson-Arzapalo, and P.M. Piccoli. 1995. Can otolith microchemistry
chart patterns of migration and habitat utilization in anadromous fishes? Journal of Experimental Marine Biology and Ecology 192: 15-33.
Secor, D.H., J.M. Dean, and E.H. Laban. 1991. Otolith removal and preparation for
microstructural examination. Belle W. Baruch Institute for Marine Biology and Coastal Research. Technical publication number 1991-01.
Smith Jr., L. L., L. W. Krefting, and R. L. Butler. 1952. Movement of marked walleyes,
Stizostedion vitreum vitreum, in the fishery of the Red Lakes, Minnesota. Transactions of the American Fisheries Society 81:179-196.
15
Spurr, A.R. 1969. Spurr resin kit. Journal of Ultrastructure Research 26: 31-42. Stepien, C.A. and J.E. Faber. 1998. Population genetic structure, phylogeography and
spawning philopatry in walleye (Stizostedion vitreum) from mitrochondrial DNA control region sequences. Molecular Ecology 7: 1757-1769.
Struck, U., A.V. Altenbach, M. Gaulke, and F. Glaw. 2002. Tracing the diet of the
monitor lizard Varanus mabitang by stable isotope analysis (δ15N, δ13C). Naturwissenschaften 89: 470-473.
Todd, T.N., and R.C. Haas. 1993. Genetic and tagging evidence for movement of
walleyes between Lake Erie and Lake St. Clair. Journal of Great Lakes Research 19: 445-452.
Thresher, R.E., C.H. Proctor, J.S. Gunn, and I.R. Harrowfield. 1994. An evaluation of
the electron probe microanalysis of otoliths for stock delineation and identification of nursery areas in a southern temperate groundfish, Nemadactylus macropterus. Fishery Bulletin 92: 817-840.
Thorrold, S. R., C. Latkoczy, P. K. Swart, and C. M. Jones. 2001. Natal homing in a
marine fish metapopulation. Science 291: 297-299. Trautman, M.B. 1957. The fishes of Ohio. Ohio State University Press, in collaboration
with the Ohio Division of Wildlife and the Ohio State University Development Fund.
U.S. Environmental Protection Agency. July 1996. Sampling ambient water for trace
metals at EPA water quality criteria levels: Method 1669. Van Tassell, J.J., R.A.Stein, E.A. Marschall, and K. Dabrowski. 2006. Quantifying how
parental attributes influence characteristics of early life history stages of Ohio stocks of Lake Erie walleye. Ohio Division of Wildlife Annual Report.
Wells, B.K., B.E. Rieman, J.L. Clayton, D.L. Horan, and C.M. Jones. 2003.
Relationships between water, otolith and scale chemistries of westslope cutthroat trout from the Coeur d’ Alene River, Idaho: The potential application of hart-part chemistry to describe movements in freshwater. Transactions of the American Fisheries Society 132: 409-424.
Wilson, C.C. and M.H. Gatt. 2001. Genetic structure of spawning walleye (Stizostedion
vitreum) populations in and near the Bay of Quinte, Lake Ontario. Lake Ontario Annual Report 2000, Ontario Ministry of Natural Resources.
Wolfert, D.R. 1963. The movements of walleyes tagged as yearlings in Lake Erie.
Transactions of the American Fisheries Society 92: 414-420.
16

Zheng, P. Q., and J. F. Koonce. 2005. A decision analysis of the proposed Ballville Dam removal considering habitat-fish population linkages. International Association for Great Lakes Resarch Conference 48: 206- 207.
17
Grand Maumee Reefs Sandusky Percent Correct
Grand 11 0 2 0 85% Maumee 0 16 0 0 100%
Reefs 1 2 11 0 79% Sandusky 0 2 0 15 88%
Table 1. Discriminant function analysis of water (n=60) from Grand, Maumee, and Sandusky rivers, all Ohio tributaries to Lake Erie, and Toussaint Reef (west basin, Lake Erie) in 2004 and 2005. Samples are classified by elements 25 Mg and 88 Sr. ‘Predicted from Model’ indicates how well the data were classified by assigning each data point to a group that best describes its characteristics
Predicted from Model (Columns)Collection Site (Rows)
18
19
Element CV LOD % > LOD Sr 88 1.91 13.10 100 Ba 138 8.42 0.16 100 Mg 25 7.67 3.87 98 Mn 55 5.05 0.10 98 Rb 85 9.06 0.03 98 Sn 120 8.85 0.07 97 Sn 118 8.95 0.10 96 Zn 66 7.38 0.86 88 Pb 208 9.05 0.06 83 Li 7 3.39 0.09 69
Table 2. Coefficient of variation (CV), limit of detection (LOD), and percent above LOD for individual chemical elements from water and otoliths. Only elements with a CV <10 and with 90% of the calculated concentration >LOD were included in our analyses. Elements fulfilling both requirements appear in bold.
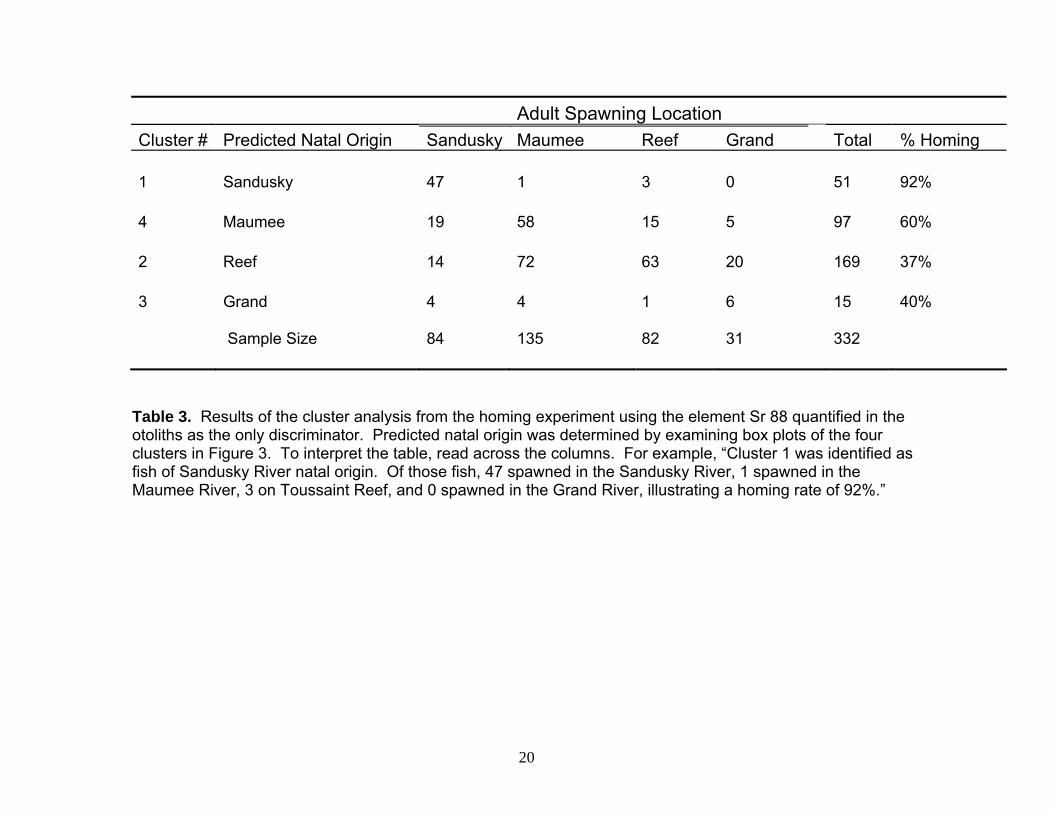
Adult Spawning Location Cluster # Predicted Natal Origin Sandusky Maumee Reef Grand Total % Homing 1 Sandusky 47 1 3 0 51 92% 4 Maumee 19 58 15 5 97 60% 2 Reef 14 72 63 20 169 37% 3 Grand 4 4 1 6 15 40% Sample Size 84 135 82 31 332
Table 3. Results of the cluster analysis from the homing experiment using the element Sr 88 quantified in the otoliths as the only discriminator. Predicted natal origin was determined by examining box plots of the four clusters in Figure 3. To interpret the table, read across the columns. For example, “Cluster 1 was identified as fish of Sandusky River natal origin. Of those fish, 47 spawned in the Sandusky River, 1 spawned in the Maumee River, 3 on Toussaint Reef, and 0 spawned in the Grand River, illustrating a homing rate of 92%.”
20
21
Sample
Core Sr Concentration Predicted Natal Origin Curtice Geneva Vermillion Total Contribution 1043.68 - 3342.7 Sandusky 1% (1) 2% (2) 1% (1) 1% (4) 440.6 - 959.8 Maumee 39% (39) 29% (29) 58% (58) 42% (126) 213.8 - 437.4 Reef 55% (55) 67% (67) 39% (39) 54% (161) 63.1 - 196.7 Grand 3% (3) 0% (0) 0% (0) 1% (3) Unknown 2% (2) 2% (2) 2% (2) 2% (6)
Table 4. Distribution of walleye (N=300) in the mixed stock analysis separated by sample 1 (Curtice, Ohio; Ottawa County, western basin) collected in June, 2 (Geneva, Ohio; Ashtabula County, central basin) collected in August, and 3 (Vermillion, Ohio; Erie County, central basin) collected in October, 2006. Predicted natal origin was determined by identifying the ranges of core otolith Sr concentrations of the four identified clusters in the homing cluster analysis (See Figure 3). Unknown fish (N=6), which did not fall into any of the core Sr concentration ranges listed above, were excluded from the analyses.
1)25
Mg
: 44
Ca
0.200
0.400
0.600
0.800
2)
55 M
n : 4
4 C
a
4e-4
8e-4
1e-3
2e-3
3)
65 C
u : 4
4 C
a
3.0e-5
1.5e-4
2.7e-4
3.9e-4
4)
66 Z
n : 4
4 C
a
0.000
0.015
0.030
0.045
2004(4)
2004(11)
2004(7)
2004(8)
2005(9)
2005(9)
2005(3)
2005(9)
Grand Sandusky Maumee
A A A A
A A
BB
Reefs
A
CBC
B
A A A
NoData
AB
Figure 1. Element concentrations 1) 25 Mg, 2) 55 Mn, 3) 65 Cu, and 4) 66 Zn in water samples (sample size in parentheses along x-axis) separated by location (Grand River, Sandusky River, Maumee Rver and Toussaint Reef) and year (2004 and 2005) in Lake Erie, Ohio. Boxes denote the 25th and 75th percentiles with a center horizontal line corresponding to the median. Whiskers represent the 10th and 90th percentiles; outliers are shown as points outside the box plots. Letters above plots denote
NoData
NoData
NoData
element differences by site identified by Tukey's HSD test. No data were collected for 66 Zn in 2004 for all locations.
22
5)
85 R
b : 4
4 C
a
5.00e-5
1.00e-4
1.50e-4
2.00e-488
Sr :
44
Ca
0.00800
0.01600
0.02400
0.03200
137
Ba
: 44
Ca
3.50e-4
7.00e-4
1.05e-3
8)
208
Pb
: 44
Ca
1.00e-4
2.00e-4
3.00e-4
6)
7)
2004(4)
2005(9)
2004(8)
2005(9)
2004(11)
2005(3)
2004(7)
2005(9)
Grand Sandusky Reefs Maumee
(8)
A AB B
A
B
C
D
AAB
BCC
A
B
AB AB
Figure 1 (cont.). Element concentrations 5) 85 Rb, 6) 88 Sr, 7) 137 Ba, and 8) 208 Pb, in water samples (sample size in parentheses) separated by location (Grand River, Sandusky River, Maumee River, and Toussaint Reef) and year (2004 and 2005) in Lake Erie, Ohio. Boxes denote the 25th and 75th percentiles with a center horizontal line corresponding to the median. Letters above Whiskers represent the 10th and 90th percentiles; outliers are shown as points outside the box plots.plots denote element differences by site identified by Tukey's HSD test.. No data are reported for 137 Ba in 2005 for all locations.
(7)
(10)
NoData
NoData
NoData
NoData
23
Canonical 1
-38 -36 -34 -32 -30 -28 -26
Can
onic
al 2
-3
-2
-1
0
1
2
3
4
5
Grand RiverSandusky RiverOpen-water reefsMaumee River
Figure 2. Discriminant function analysis of water data (n=60), collected from Grand,(central basin), Maumee, and Sandusky rivers (western basin), all Ohio tributaries to Lake Erie, and Toussaint Reef (western basin) in 2004 and 2005. Samples are classified by elements 25 Mg and 88 Sr.
24
25
Cluster
1 4 2 3
88 S
r Cor
e C
once
ntra
tion
(ppm
)
0
1000
2000
3000
Figure 3. Comparison of core Sr concentration in the four clusters identified in Table 3 by cluster analysis (with sample sizes in parentheses along the x-axis. Samples (N=332) were collected during 2003-2005 from the Grand (central basin), Maumee and Sandusky rivers (west basin), all tributaries to Lake Erie, and Toussaint Reef (West basin, Lake Erie). Boxes denote the 25th and 75th percentiles with a center-line corresponding to the median. Whiskers represent the 10th and 90th percentiles;
(51) (15)(97) (169)
outliers are shown as points outside the box plots. Clusters are ordered by decreasing core Sr concentration.

APPENDIX A
Advances in Otolith Microchemistry
26
Advances in Otolith Microchemistry
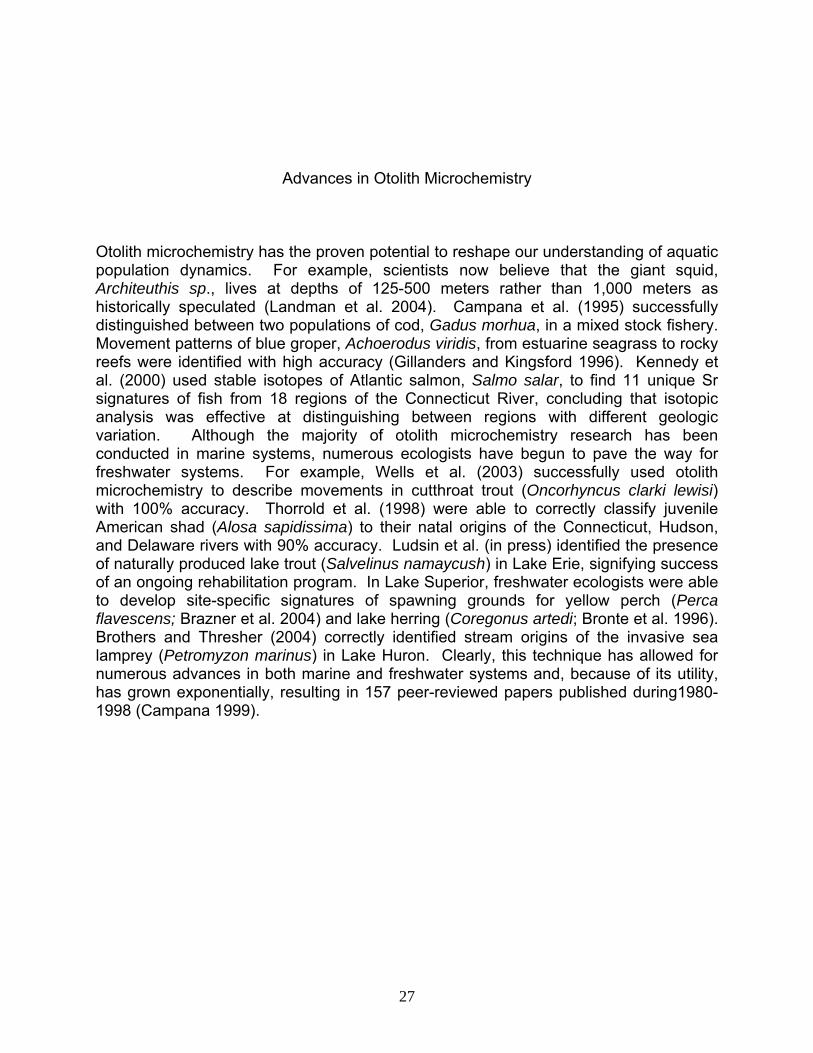
Otolith microchemistry has the proven potential to reshape our understanding of aquatic population dynamics. For example, scientists now believe that the giant squid, Architeuthis sp., lives at depths of 125-500 meters rather than 1,000 meters as historically speculated (Landman et al. 2004). Campana et al. (1995) successfully distinguished between two populations of cod, Gadus morhua, in a mixed stock fishery. Movement patterns of blue groper, Achoerodus viridis, from estuarine seagrass to rocky reefs were identified with high accuracy (Gillanders and Kingsford 1996). Kennedy et al. (2000) used stable isotopes of Atlantic salmon, Salmo salar, to find 11 unique Sr signatures of fish from 18 regions of the Connecticut River, concluding that isotopic analysis was effective at distinguishing between regions with different geologic variation. Although the majority of otolith microchemistry research has been conducted in marine systems, numerous ecologists have begun to pave the way for freshwater systems. For example, Wells et al. (2003) successfully used otolith microchemistry to describe movements in cutthroat trout (Oncorhyncus clarki lewisi) with 100% accuracy. Thorrold et al. (1998) were able to correctly classify juvenile American shad (Alosa sapidissima) to their natal origins of the Connecticut, Hudson, and Delaware rivers with 90% accuracy. Ludsin et al. (in press) identified the presence of naturally produced lake trout (Salvelinus namaycush) in Lake Erie, signifying success of an ongoing rehabilitation program. In Lake Superior, freshwater ecologists were able to develop site-specific signatures of spawning grounds for yellow perch (Perca flavescens; Brazner et al. 2004) and lake herring (Coregonus artedi; Bronte et al. 1996). Brothers and Thresher (2004) correctly identified stream origins of the invasive sea lamprey (Petromyzon marinus) in Lake Huron. Clearly, this technique has allowed for numerous advances in both marine and freshwater systems and, because of its utility, has grown exponentially, resulting in 157 peer-reviewed papers published during1980-1998 (Campana 1999).
27

APPENDIX B
Additional Tables
28
1) 25 Mg : Ca df SS F value Prob > F Figure Site 3 0.596 15.507 < 0.0001 Figure 1.1 Year 1 0.167 13.062 0.001 Site*Year 3 0.065 1.694 0.180 Error 52 0.666 2) 55 Mn : Ca Site 3 5.243 7.380 0.0003 Figure 1.2 Year 1 0.349 1.472 0.231 Site*Year 3 2.026 2.852 0.046 Error 52 12.314 3) 65 Cu : Ca Site 3 1.740 10.623 < 0.0001 Figure 1.3 Year 1 3.7E-04 0.007 0.935 Site*Year 3 0.301 1.837 0.152 Error 52 2.840 4) 66 Zn : Ca Site 3 9.8E-05 0.228 0.876 Figure 1.4 Year - - - - Site*Year - - - - Error 26 0.00373 5) 85 Rb : Ca Site 3 2.062 11.419 < 0.0001 Figure 1.5 Year 1 0.262 4.347 0.042 Site*Year 3 0.342 1.892 0.142 Error 52 3.130 6) 88 Sr : Ca Site 3 1.9E-03 110.412 < 0.0001 Figure 1.6 Year 1 3.2E-05 5.642 0.021 Site*Year 3 4.4E-05 2.546 0.066 Error 52 3.0E-04 7) 137 Ba : Ca Site 3 3.6E-07 10.427 0.0002 Figure 1.7 Year - - - - Site*Year - - - - Error 26 2.6E-07 8) 208 Pb : Ca Site 3 5.471 7.561 0.0003 Figure 1.8 Year 1 5.595 23.198 < 0.0001 Site*Year 3 1.328 1.836 0.153 Error 49 11.818
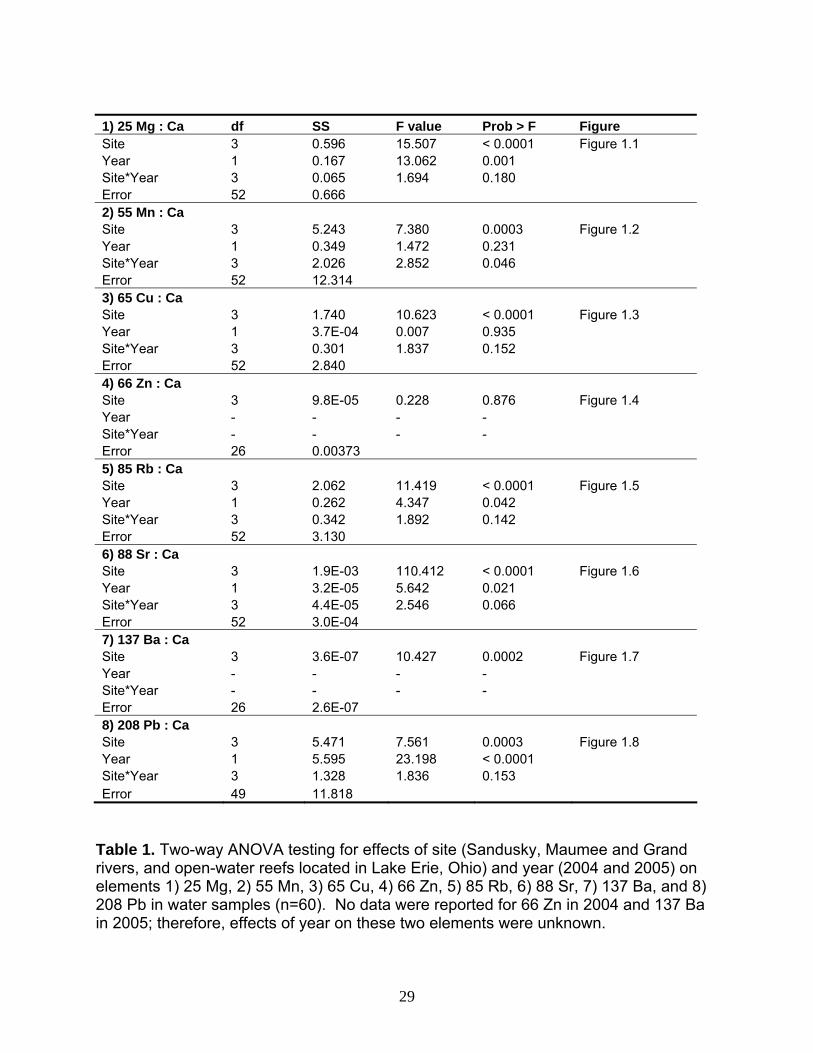
Table 1. Two-way ANOVA testing for effects of site (Sandusky, Maumee and Grand rivers, and open-water reefs located in Lake Erie, Ohio) and year (2004 and 2005) on elements 1) 25 Mg, 2) 55 Mn, 3) 65 Cu, 4) 66 Zn, 5) 85 Rb, 6) 88 Sr, 7) 137 Ba, and 8) 208 Pb in water samples (n=60). No data were reported for 66 Zn in 2004 and 137 Ba in 2005; therefore, effects of year on these two elements were unknown.
29

30
APPENDIX C
Discriminant Function Analysis
Adult Spawning Location
Most Comparable Group Grand Maumee Reef Sandusky Total % Homing Grand 17 17 17 6 57 30% Maumee 8 71 28 12 119 59% Reef 5 35 29 3 72 40% Sandusky 1 12 4 63 80 78% Sample Size 31 135 78 84 328
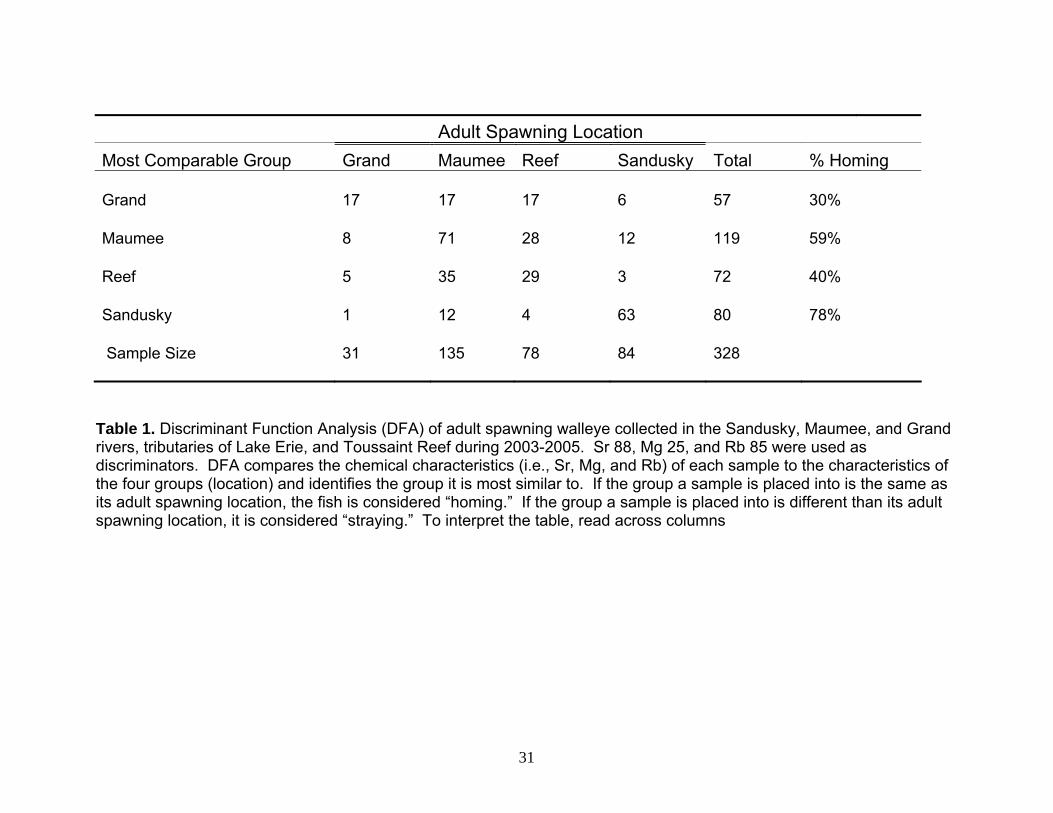
Table 1. Discriminant Function Analysis (DFA) of adult spawning walleye collected in the Sandusky, Maumee, and Grand rivers, tributaries of Lake Erie, and Toussaint Reef during 2003-2005. Sr 88, Mg 25, and Rb 85 were used as discriminators. DFA compares the chemical characteristics (i.e., Sr, Mg, and Rb) of each sample to the characteristics of the four groups (location) and identifies the group it is most similar to. If the group a sample is placed into is the same as its adult spawning location, the fish is considered “homing.” If the group a sample is placed into is different than its adult spawning location, it is considered “straying.” To interpret the table, read across columns
31