Embed Size (px)
Citation preview
LEGENDplex™ Data Analysis Software-Help
LEGENDplex™ Data Analysis Software
Version 7.1
For Mac Computers
Copyright © 2015 VigeneTech. All rights reserved.
LEGENDplex™ Data Analysis Software-Help
Contents
Getting Started ...................................................................................................... 3 Overview ............................................................................................................ 3
System Requirements & Recommendations ............................................................ 3 Installation .......................................................................................................... 4
Start LEGENDplex™ ........................................................................................... 8
Toolbar ............................................................................................................... 9 Files ................................................................................................................. 11
Status File ..................................................................................................... 11
FCS-VG File ................................................................................................. 12
Data Analysis ...................................................................................................... 13 Quantitative Analysis ......................................................................................... 13
Quantitative Analysis Wizard .......................................................................... 13 Quantitative Settings ................................................................................... 13
Wizard Step 1 ............................................................................................. 16
Wizard Step 2 ............................................................................................. 21
Wizard Step 3 ............................................................................................. 23 Quantitative Operation Items ........................................................................... 24
Quantitative FCS Files List .......................................................................... 24
Standard Curve Files ................................................................................... 25 Sample Files .............................................................................................. 26
Modify Standard Concentration Dialog box ................................................... 26
Add FCS Files ............................................................................................ 27
Remove Files ............................................................................................. 28 Define Names............................................................................................. 29
Define Dilution Factor................................................................................. 31
Flag Data ................................................................................................... 31 Data Sorting ............................................................................................... 32
Set Standard Curve ..................................................................................... 32
Set Standard Curve Manually ....................................................................... 33
Remove Standard Curve .............................................................................. 34 Edit Standard Curve .................................................................................... 34
Convert To Sample ..................................................................................... 37
Convert To Standard Curve ......................................................................... 37 Replicates .................................................................................................. 38
Standard Curve-Set Standard Well Dilution Order.......................................... 38
Parameters-Set for the Highest Standard Concentration .................................. 40
Analyte List-Apply Settings To Analytes ...................................................... 41 Gating ....................................................................................................... 41
Quantitative Result ......................................................................................... 46
Concentration ............................................................................................. 47 Median ...................................................................................................... 48
Median CV ................................................................................................ 49
Count ........................................................................................................ 50
Bar Chart ................................................................................................... 51
LEGENDplex™ Data Analysis Software-Help
Standard Curve ........................................................................................... 53
Clustering .................................................................................................. 54
Output ....................................................................................................... 58 Qualitative Analysis ........................................................................................... 59
Qualitative Analysis Wizard ............................................................................ 59
Qualitative Settings ..................................................................................... 59
Wizard Step 1 ............................................................................................. 61 Wizard Step 2 ............................................................................................. 63
Wizard Step 3 ............................................................................................. 64
Qualitative Operation Items ............................................................................. 65 Qualitative FCS Files List ............................................................................ 65
Files .......................................................................................................... 66
Qualitative Gating....................................................................................... 68
Qualitative Result ........................................................................................... 68 Output ....................................................................................................... 69
Options ............................................................................................................... 71 Curve Option ..................................................................................................... 72 Data Analysis Option ......................................................................................... 75
View Option ...................................................................................................... 76
Standard Curve Fitting Model ............................................................................. 76
Index ................................................................................................................... 79
LEGENDplex™ Data Analysis Software-Installation Guide
1
Welcome
Welcome to LEGENDplex™, the superior software solution for the analysis of bead-
based assay data from flow cytometers with full automation, great accuracy, high
throughput, and simple user interface.
LEGENDplex™ Data Analysis Software has the following main features:
Easy-to-use user interface
Simple wizard for repetitive tasks required for FCS data analysis generated from
flow cytometers
Automated curve-fitting and sample concentration calculations
Robust curve-fitting algorithm
Detection limit determination
Integrated data visualization within original data, calculated data and curve
mapping
Standardized data reports
Support both quantitative and qualitative analysis
Normalization options for control analytes or control samples
Related topics:
System Requirement
Start LEGENDplex™
Toolbar
Installation
Wizard Step 1

LEGENDplex™ Data Analysis Software-Installation Guide
3
Getting Started
Overview
LEGENDplex™ data analysis software is designed for analysis of data of FCS file types
generated from flow cytometers. Compatible FCS files that are in FCS 2.0, FCS 3.0, FCS
3.1 standard formats and some list mode files (.lmd).
System Requirements & Recommendations
Software:
Mac OS X version 10.7 (Lion) and later.
Mono 4.0 or higher
Related topics:
Welcome
Installation
Start LEGENDplex™
Toolbar
Wizard Step 1
LEGENDplex™ Data Analysis Software-Installation Guide
4
Installation
Download the software package from VigeneTech web site
(http://www.vigenetech.com/LEP7register.asp) and save it to your computer.
Check your computer for appropriate environment. Installation of Mono 4.0 or a higher
is required prior to installation of LEGENDplex™ data analysis software.
To install,
1. Double click the installation package in the folder where the software package is
saved to unzip the software package, the icon of LEGENDplex™ will appear.
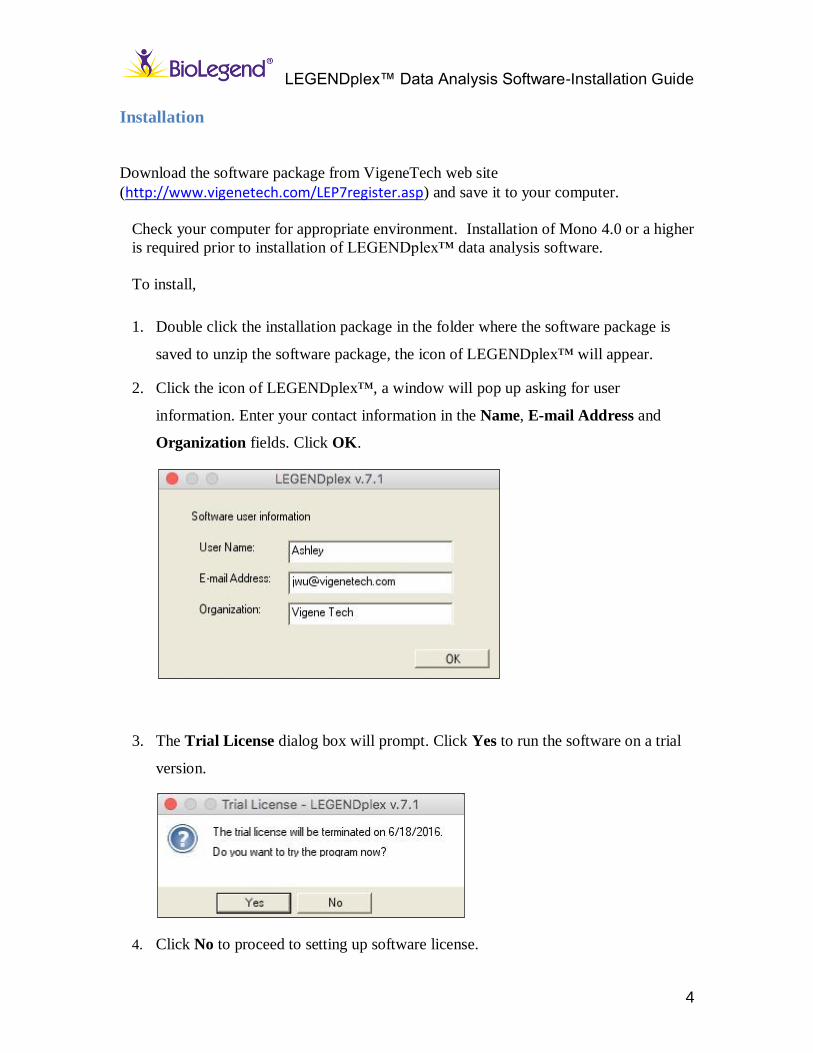
2. Click the icon of LEGENDplex™, a window will pop up asking for user
information. Enter your contact information in the Name, E-mail Address and
Organization fields. Click OK.
3. The Trial License dialog box will prompt. Click Yes to run the software on a trial
version.
4. Click No to proceed to setting up software license.
LEGENDplex™ Data Analysis Software-Help
5
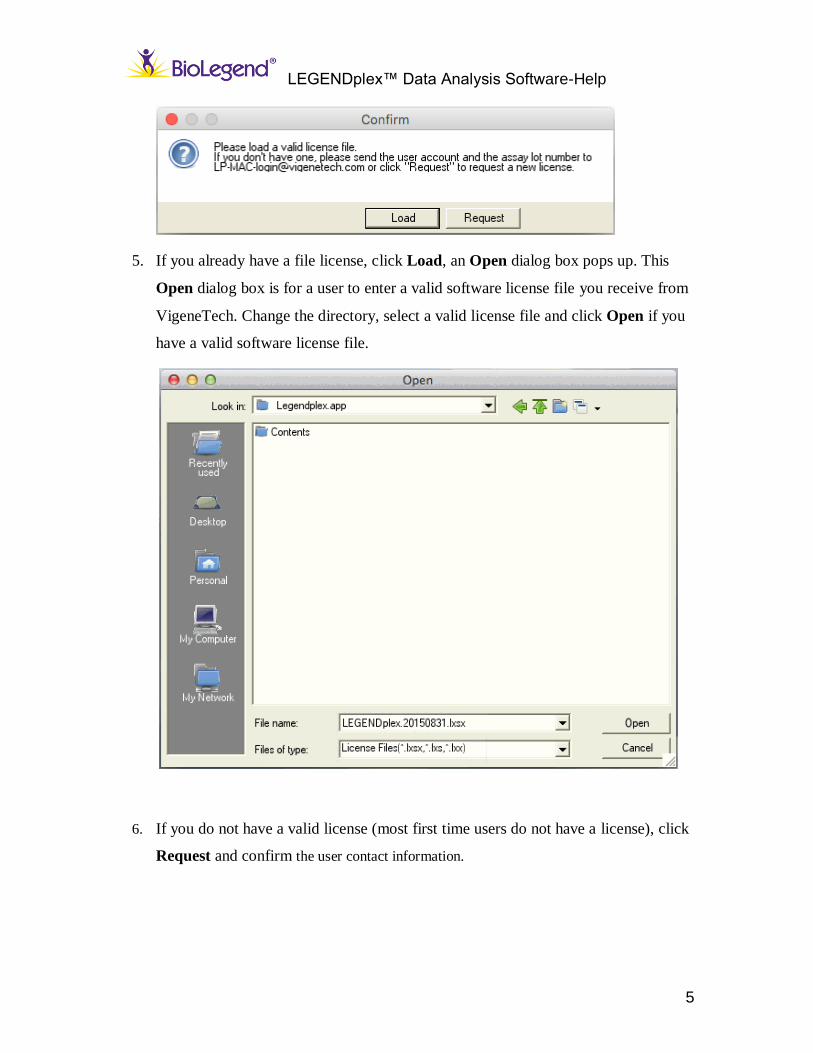
5. If you already have a file license, click Load, an Open dialog box pops up. This
Open dialog box is for a user to enter a valid software license file you receive from
VigeneTech. Change the directory, select a valid license file and click Open if you
have a valid software license file.
6. If you do not have a valid license (most first time users do not have a license), click
Request and confirm the user contact information.
LEGENDplex™ Data Analysis Software-Help
6
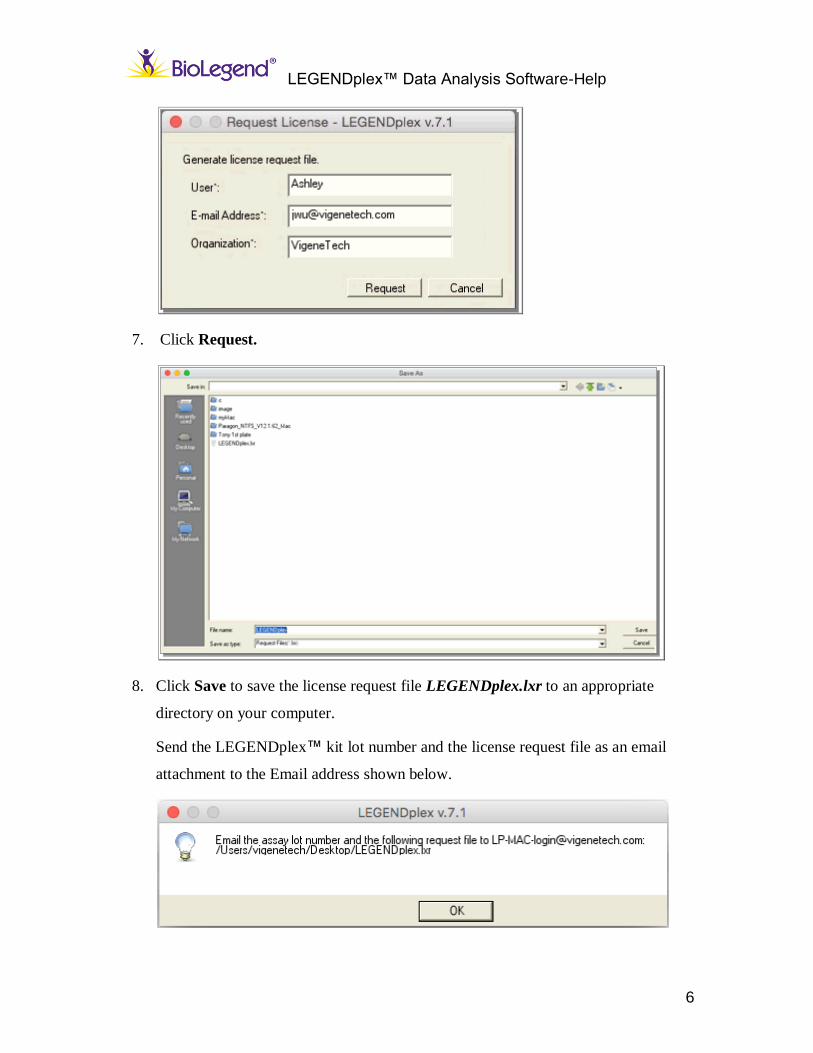
7. Click Request.
8. Click Save to save the license request file LEGENDplex.lxr to an appropriate
directory on your computer.
Send the LEGENDplex™ kit lot number and the license request file as an email
attachment to the Email address shown below.
LEGENDplex™ Data Analysis Software-Help
7
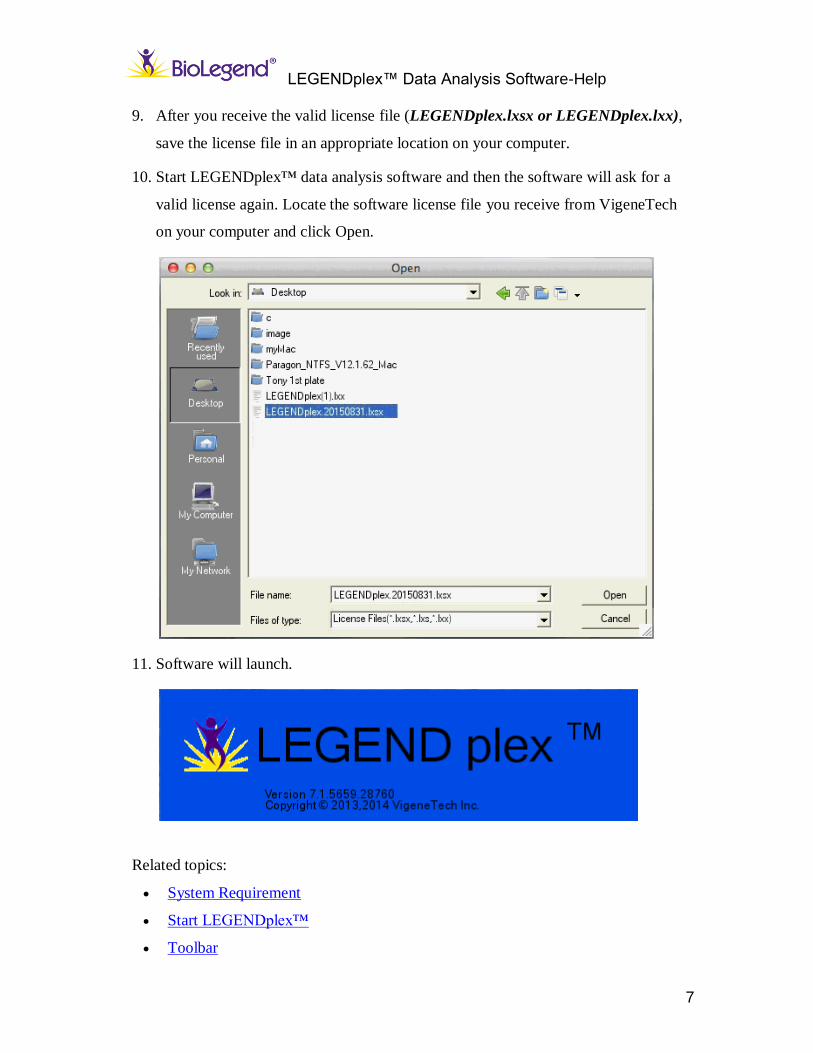
9. After you receive the valid license file (LEGENDplex.lxsx or LEGENDplex.lxx),
save the license file in an appropriate location on your computer.
10. Start LEGENDplex™ data analysis software and then the software will ask for a
valid license again. Locate the software license file you receive from VigeneTech
on your computer and click Open.
11. Software will launch.
Related topics:
System Requirement
Start LEGENDplex™
Toolbar
LEGENDplex™ Data Analysis Software-Help
8
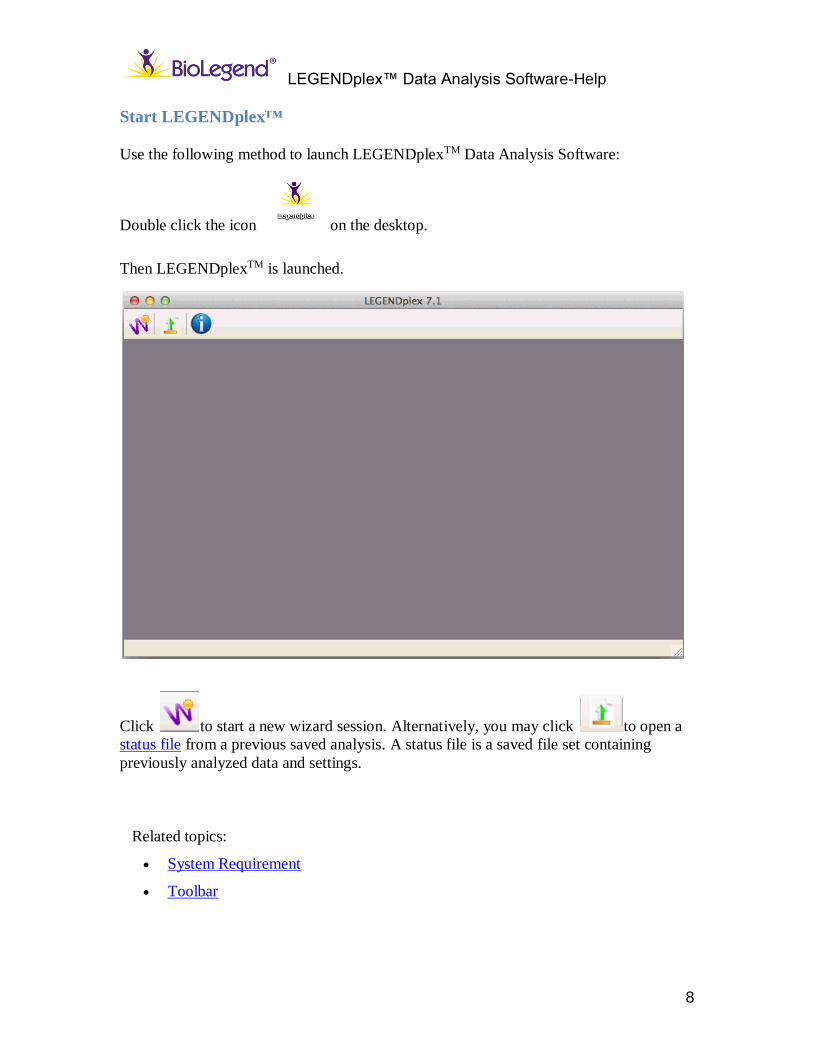
Start LEGENDplex™
Use the following method to launch LEGENDplexTM Data Analysis Software:
Double click the icon on the desktop.
Then LEGENDplexTM is launched.
Click to start a new wizard session. Alternatively, you may click to open a
status file from a previous saved analysis. A status file is a saved file set containing
previously analyzed data and settings.
Related topics:
System Requirement
Toolbar
LEGENDplex™ Data Analysis Software-Help
9
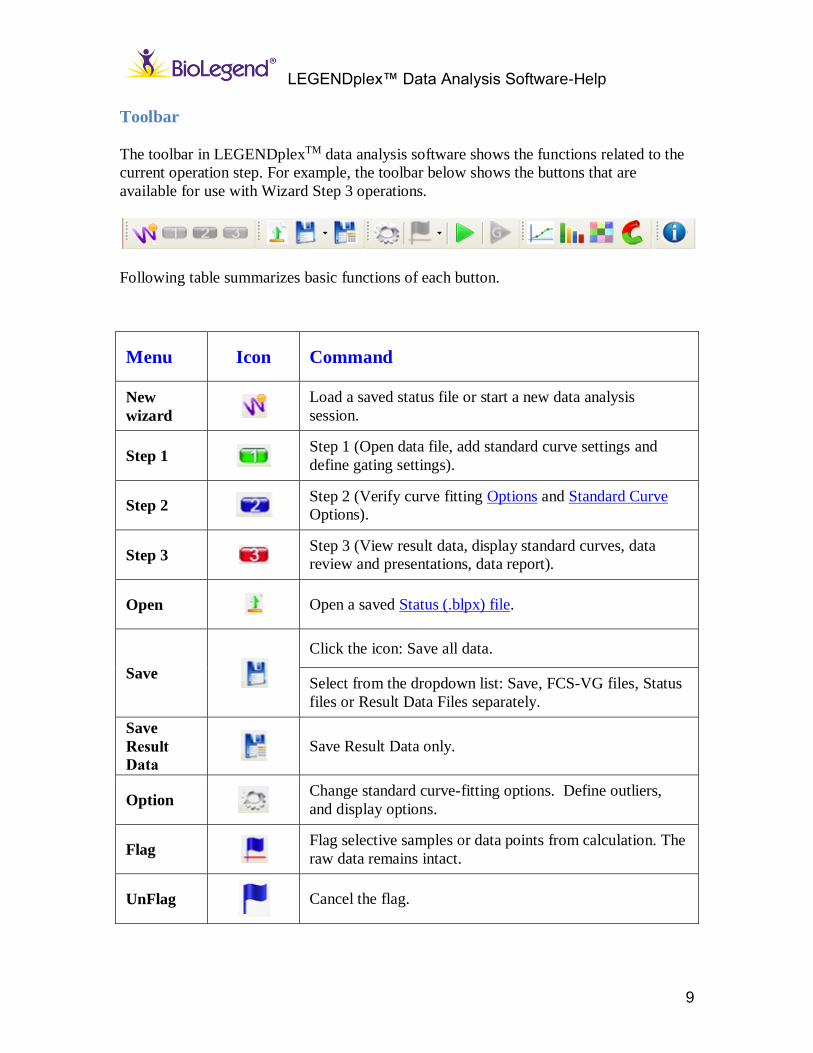
Toolbar
The toolbar in LEGENDplexTM data analysis software shows the functions related to the
current operation step. For example, the toolbar below shows the buttons that are
available for use with Wizard Step 3 operations.
Following table summarizes basic functions of each button.
Menu Icon Command
New
wizard Load a saved status file or start a new data analysis
session.
Step 1 Step 1 (Open data file, add standard curve settings and
define gating settings).
Step 2 Step 2 (Verify curve fitting Options and Standard Curve
Options).
Step 3 Step 3 (View result data, display standard curves, data
review and presentations, data report).
Open Open a saved Status (.blpx) file.
Save
Click the icon: Save all data.
Select from the dropdown list: Save, FCS-VG files, Status
files or Result Data Files separately.
Save
Result
Data
Save Result Data only.
Option
Change standard curve-fitting options. Define outliers,
and display options.
Flag
Flag selective samples or data points from calculation. The
raw data remains intact.
UnFlag
Cancel the flag.
LEGENDplex™ Data Analysis Software-Help
10
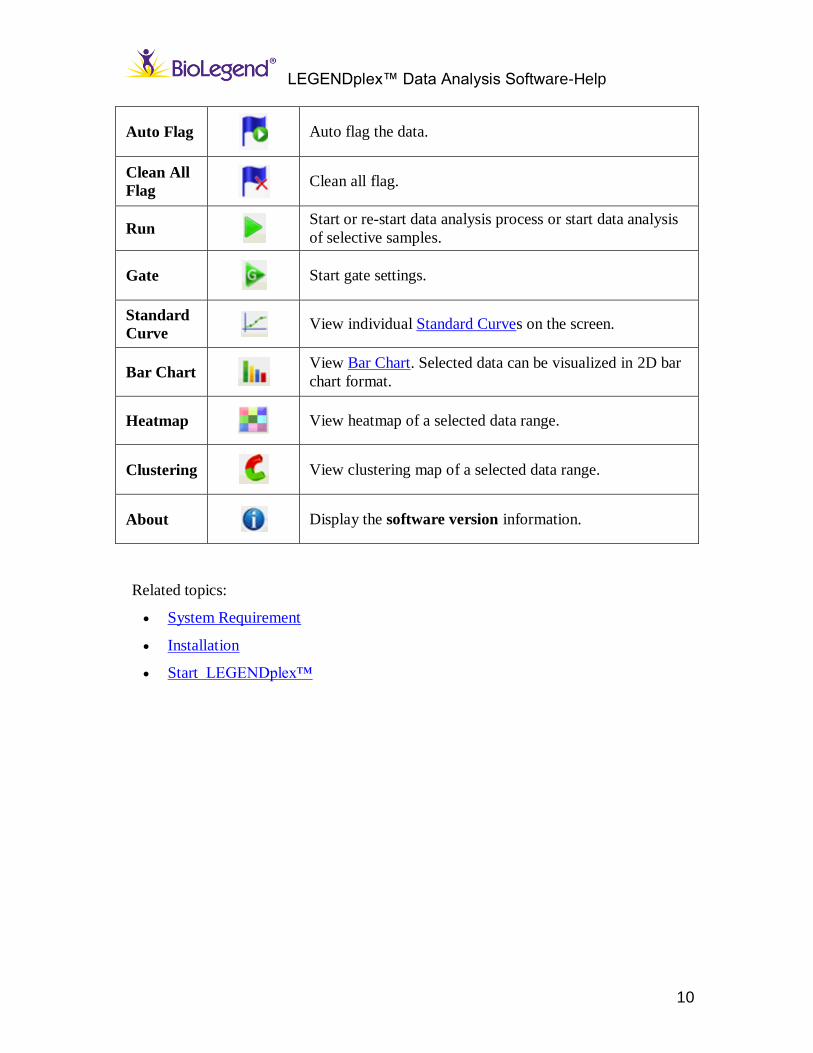
Auto Flag
Auto flag the data.
Clean All
Flag Clean all flag.
Run
Start or re-start data analysis process or start data analysis
of selective samples.
Gate
Start gate settings.
Standard
Curve View individual Standard Curves on the screen.
Bar Chart
View Bar Chart. Selected data can be visualized in 2D bar
chart format.
Heatmap
View heatmap of a selected data range.
Clustering
View clustering map of a selected data range.
About
Display the software version information.
Related topics:
System Requirement
Installation
Start LEGENDplex™
LEGENDplex™ Data Analysis Software-Installation Guide
11
Files
Status File
A status file contains the information about the status of your computer and file working
environment including all the optional settings, files layout, manual mark-outs,
completed or partially completed analysis of a data set. An analysis can be saved as a
status (*.blpx) file, which can be opened later. Working environment will be reset when
exiting the software, but a status file will memorize how that data were analyzed.
A status file (*.blpx) contains the .fcs files (or .lmd files), manual flag information,
optional settings. This feature supports both Quantitative Analysis and Qualitative
Analysis.
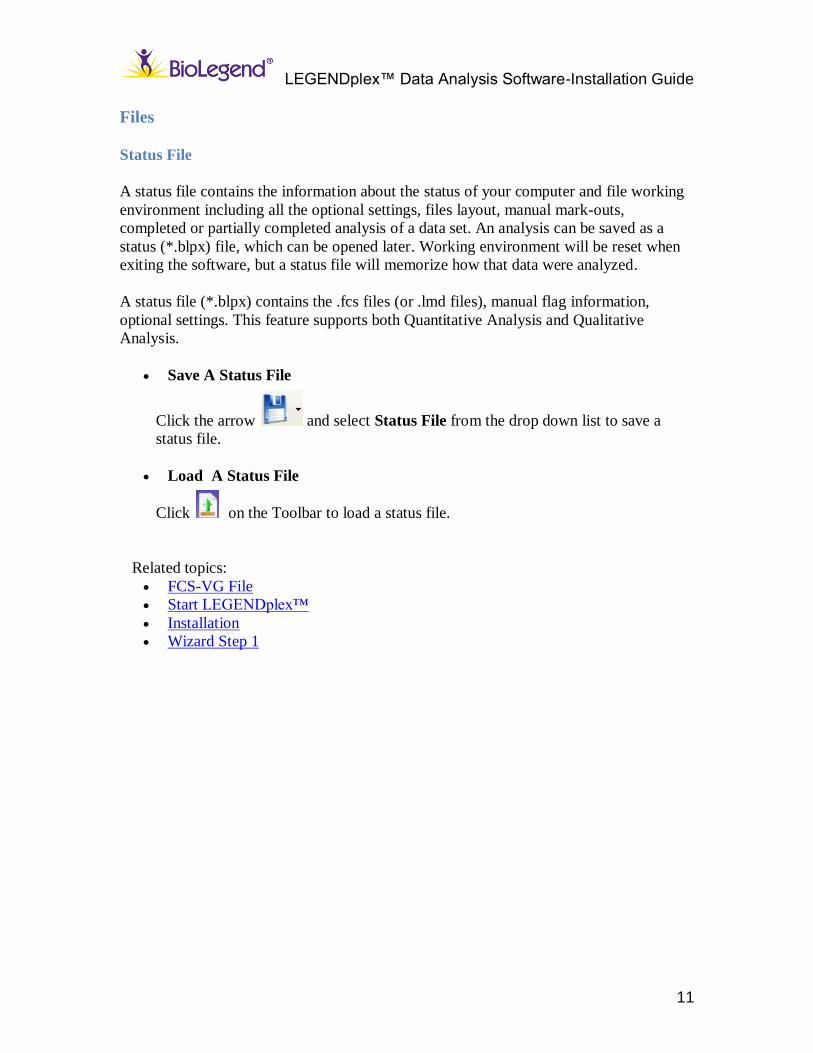
Save A Status File
Click the arrow and select Status File from the drop down list to save a
status file.
Load A Status File
Click on the Toolbar to load a status file.
Related topics:
FCS-VG File
Start LEGENDplex™
Installation Wizard Step 1
LEGENDplex™ Data Analysis Software-Installation Guide
12
FCS-VG File
The FCS-VG files are generated once you generate a report or save any result data.
The FCS-VG files can be re-analyzed further without consuming additional dongle data
points from a dongle license
See also Add Files for how to load FCS-VG files.
Related topics:
Status File
Start LEGENDplexTM
Installation
Wizard Step 1
FCS Files List
Add Files
LEGENDplex™ Data Analysis Software-Installation Guide
13
Data Analysis
Quantitative Analysis
Quantitative Analysis Wizard
Quantitative Settings
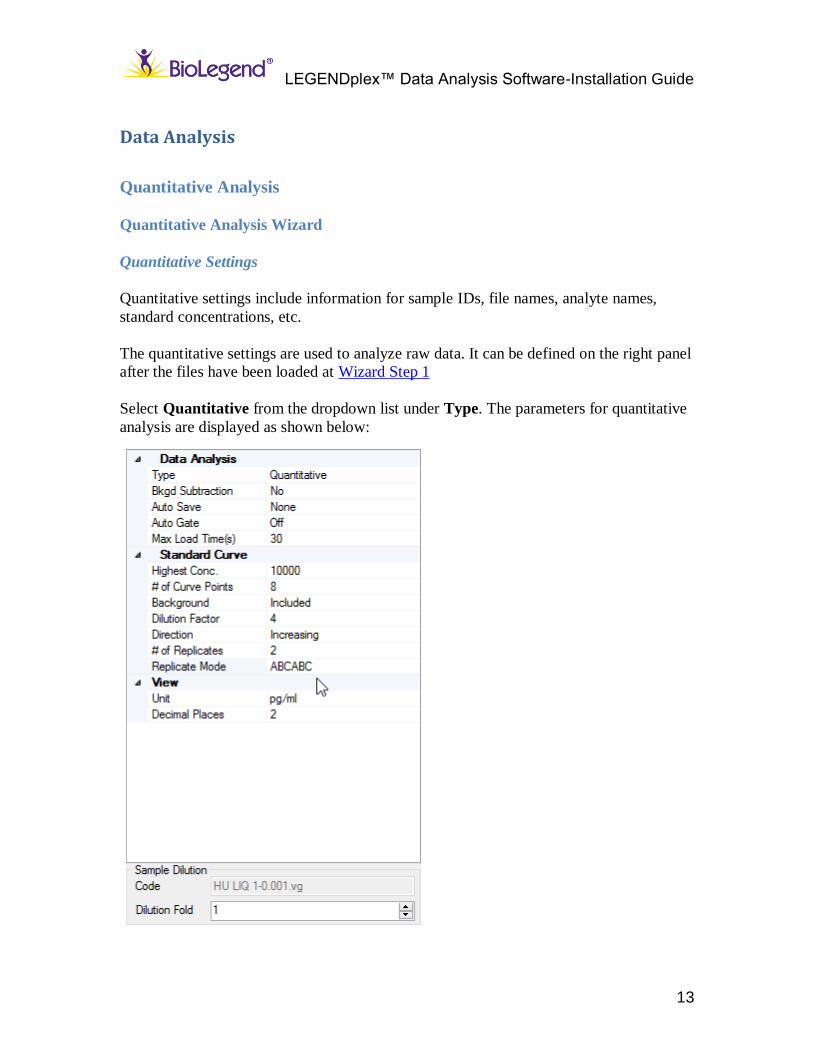
Quantitative settings include information for sample IDs, file names, analyte names,
standard concentrations, etc.
The quantitative settings are used to analyze raw data. It can be defined on the right panel
after the files have been loaded at Wizard Step 1
Select Quantitative from the dropdown list under Type. The parameters for quantitative
analysis are displayed as shown below:
LEGENDplex™ Data Analysis Software-Help
14
Data Analysis
Quantitative --- An analysis method to calculate sample signals and
concentrations using standard curves.
Background (“Bkgd”) subtraction --- The background noise subtraction
(signal intensities of the background non-specific binding noise) can be
subtracted from raw data prior to data analysis. If zero concentration the
Standard curve (C0) is present, the signal intensities of C0 will be subtracted
from the signal intensities in all remaining files including remaining standard
files and sample files. If the signal intensity of an analyte becomes negative
after subtraction, the signal intensity will be mapped to a value between 0 and 1
in the same numerical order as the original data.
Note: If the standard curve of an analyte is downward, background subtraction
will be skipped and a message will pop up to show the analyte name.
Auto Save --- Select Auto Save type (The default setting is None). Auto Save
will automatically save results and status files and consume data points from a
license dongle.
o None: Not to automatically save anything after analysis is complete.
o Data: Save the result data after analysis is complete.
o Report: Save the default report in the same file folder as raw data after
analysis is complete.
o Both: Save result data and the default report in the same file folder as raw
data after analysis is complete.
Auto Gate --- When auto gating is ON it will always gate automatically with
each file. When it's set at OFF, the first gating result will be used as a template
and applied it to other files in the same analysis. When Auto Gate is ON, it will
take longer time to perform the data calculations.
Max Load Time --- The maximum time to load.
Standard Curve
Highest Conc. --- The highest concentration of the standard curves. If not
all analytes share the same highest concentration, just use a concentration
LEGENDplex™ Data Analysis Software-Help
15
that works for most analytes. The highest concentrations for individual
analytes can be adjusted in the Modify Standard Concentration before
analysis.
# of Curve Points --- The number of standard curve points in the standard
curve that includes the background well, the number of standard points should
be bigger than 5 in order to use the 5 or 4-parameter logistic curve-fitting
methods.
Background (C 0) --- Choose whether the background noise is included or
excluded in the standard curve and sample calculations.
Dilution Factor --- Serial dilution factor for standard dilutions.
Direction --- Standard curve dilution direction: Increasing or Decreasing.
Whether a curve is Increasing or Decreasing is relative to the sequential order of
the standard concentrations increase or decrease in the FCS file selections. If the
sequential order of the highlighted files is the same as the order from C0 to C7,
the Direction should set as Increasing. If the sequential order of the highlighted
files is from C7 to C0, the direction should be Decreasing.
# of Replicates --- The number of replicates for each standard point. Sample
replicates can be defined in the file list.
Replicate Mode --- Select a replicate mode for standard curve.
o AABBCC: The AABBCC mode will replicate samples in consecutive
manner when the number of replicates is defined (e.g. sample 1, sample 1;
sample 2, sample 2 …).
o ABCABC. The ABCABC mode will replicate samples in repeating
groups with defined group size (e.g. sample 1, 2, 3, 4…; sample 1, 2, 3,
4…).
View
Decimal Places --- The decimal places to keep for all the calculated numbers in
the program
Unit --- The default unit for calculated concentrations for all analytes. If
different analytes have different units, they can be defined in Gate settings.
LEGENDplex™ Data Analysis Software-Help
16
Related topics:
Wizard Step 1
Wizard Step 2
Wizard Step 3
Start LEGENDplexTM
Edit Standard Curve
Wizard Step 1
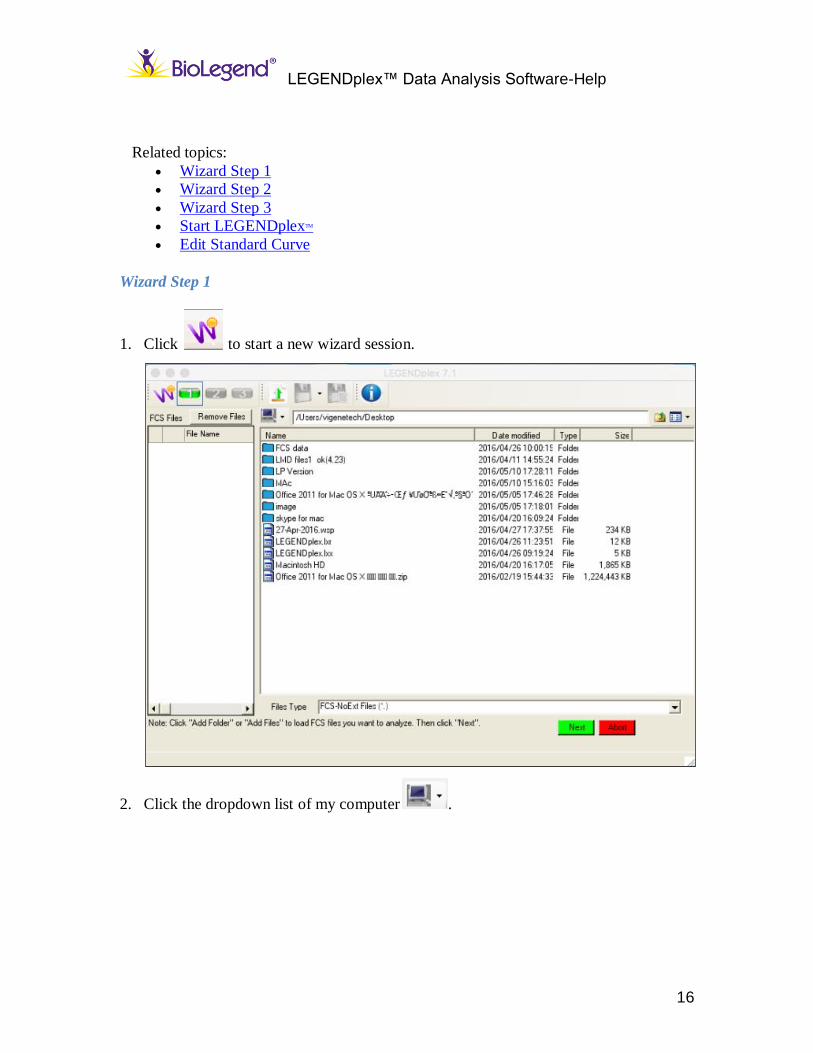
1. Click to start a new wizard session.
2. Click the dropdown list of my computer .
LEGENDplex™ Data Analysis Software-Help
17
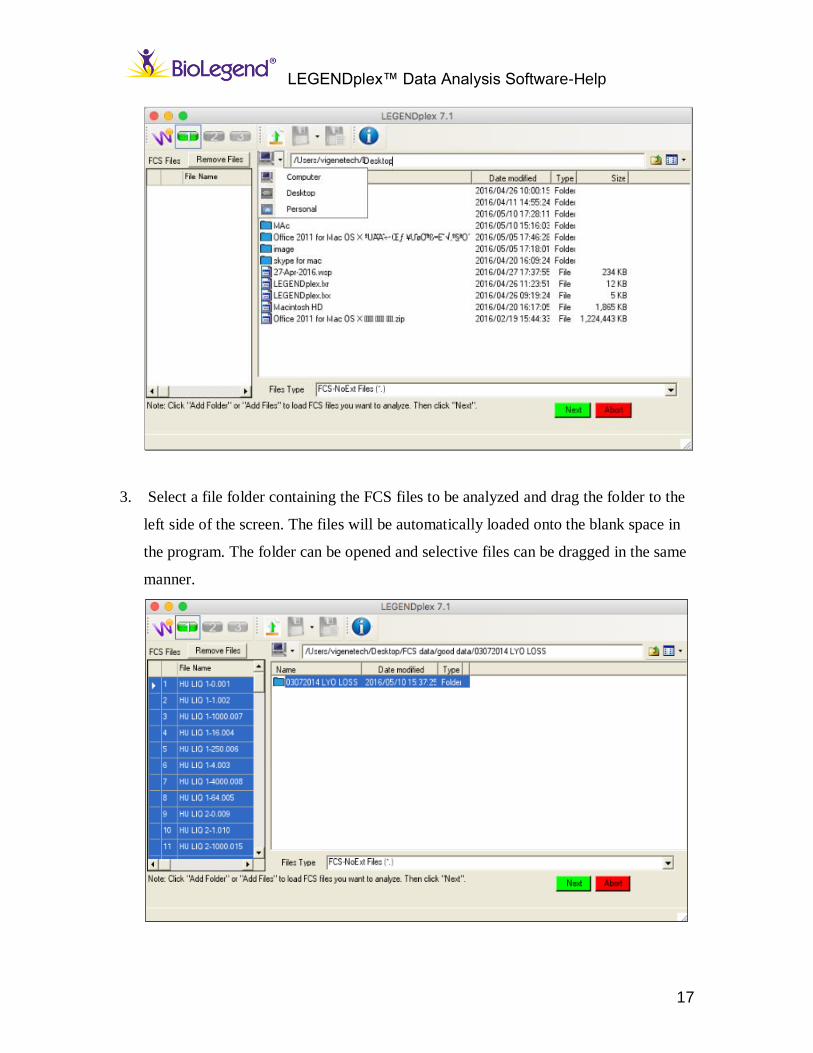
3. Select a file folder containing the FCS files to be analyzed and drag the folder to the
left side of the screen. The files will be automatically loaded onto the blank space in
the program. The folder can be opened and selective files can be dragged in the same
manner.
LEGENDplex™ Data Analysis Software-Help
18
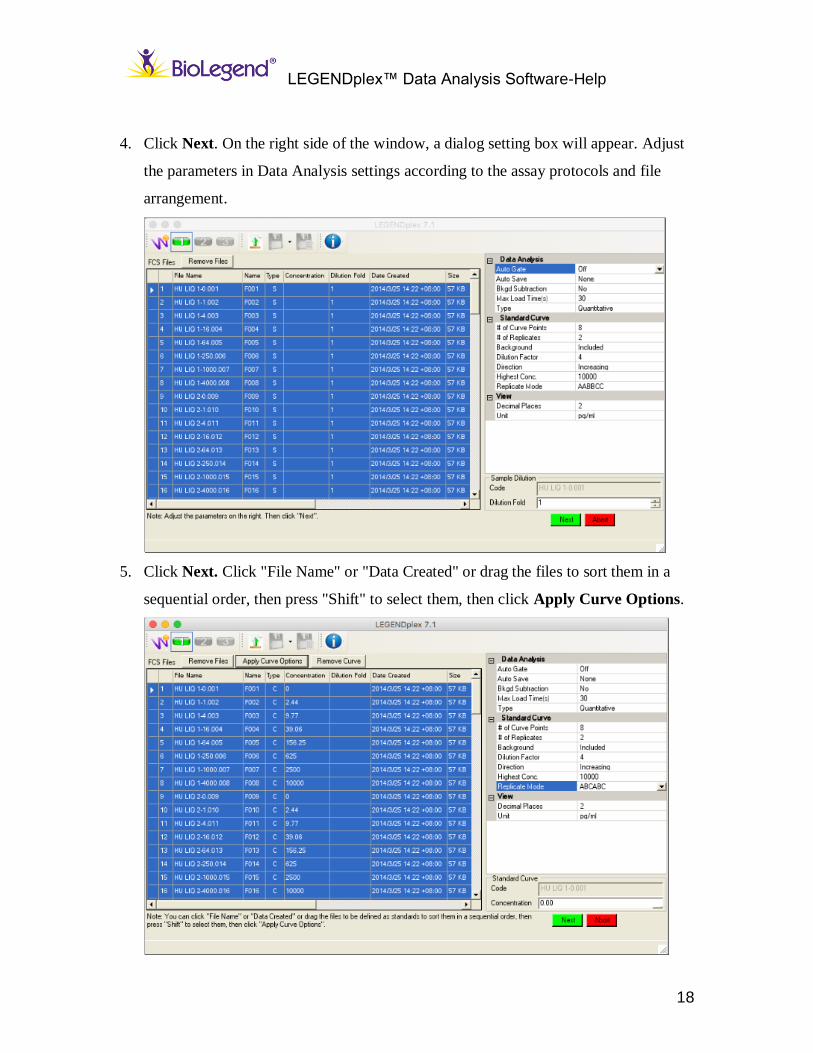
4. Click Next. On the right side of the window, a dialog setting box will appear. Adjust
the parameters in Data Analysis settings according to the assay protocols and file
arrangement.
5. Click Next. Click "File Name" or "Data Created" or drag the files to sort them in a
sequential order, then press "Shift" to select them, then click Apply Curve Options.
LEGENDplex™ Data Analysis Software-Help
19
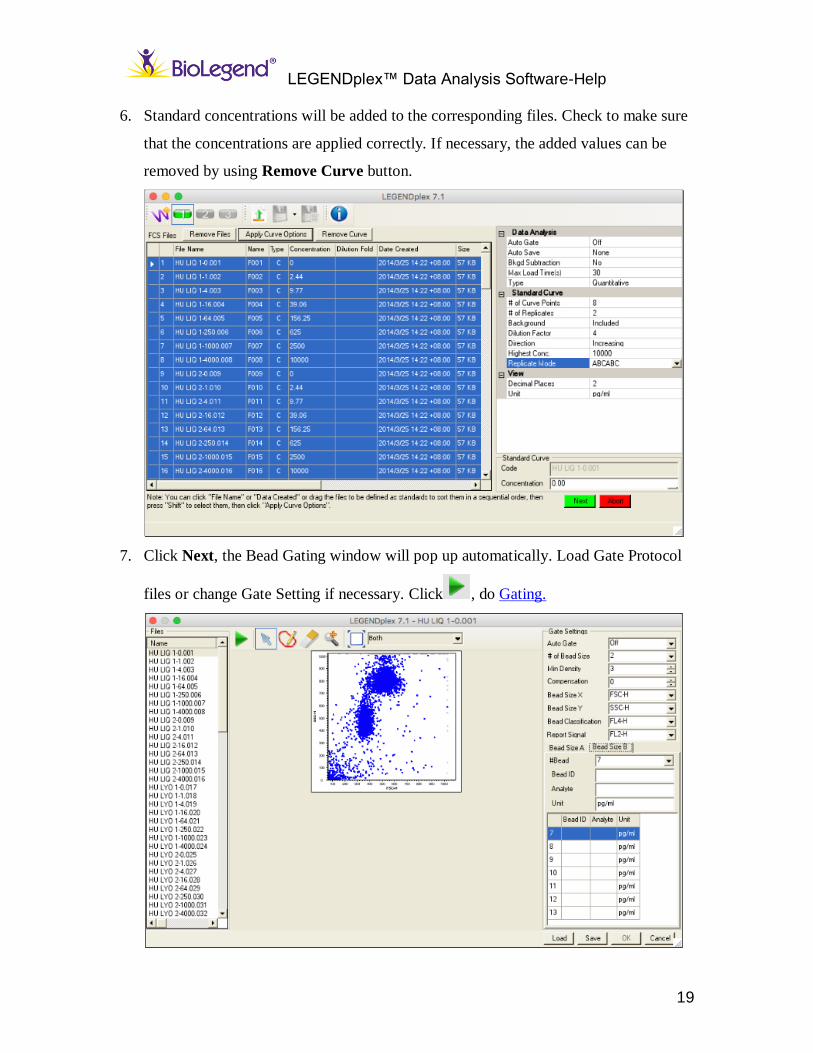
6. Standard concentrations will be added to the corresponding files. Check to make sure
that the concentrations are applied correctly. If necessary, the added values can be
removed by using Remove Curve button.
7. Click Next, the Bead Gating window will pop up automatically. Load Gate Protocol
files or change Gate Setting if necessary. Click , do Gating.
LEGENDplex™ Data Analysis Software-Help
20
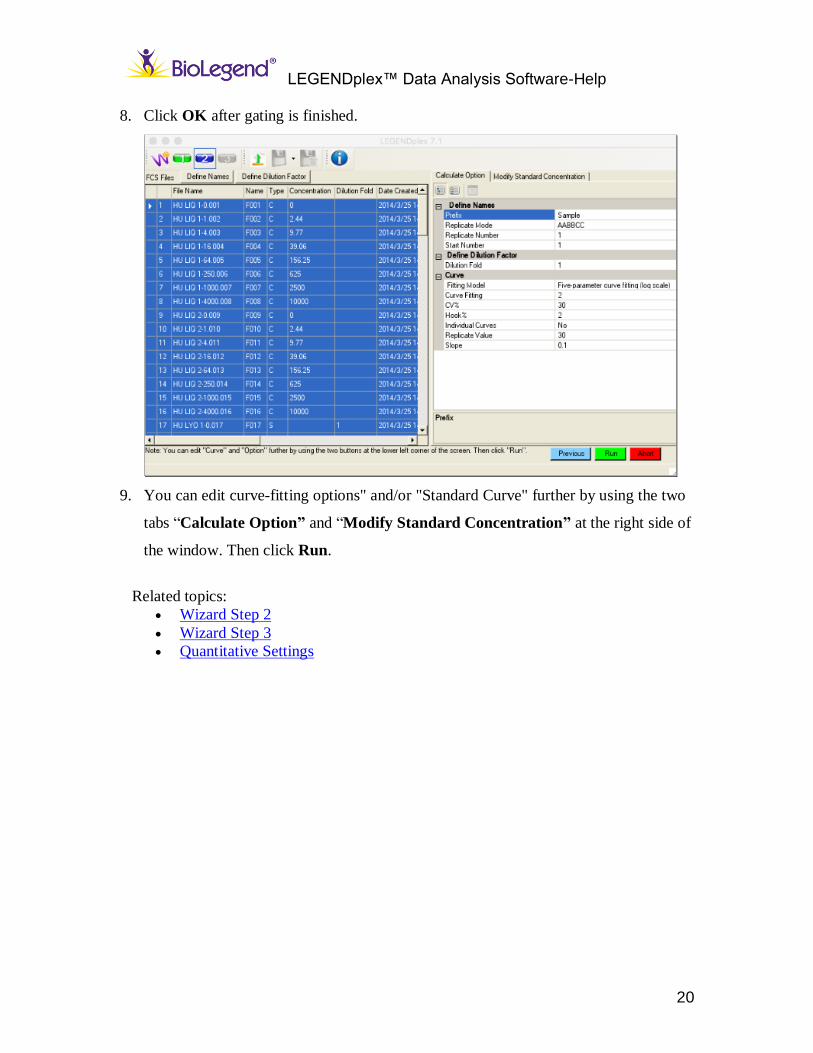
8. Click OK after gating is finished.
9. You can edit curve-fitting options" and/or "Standard Curve" further by using the two
tabs “Calculate Option” and “Modify Standard Concentration” at the right side of
the window. Then click Run.
Related topics:
Wizard Step 2
Wizard Step 3
Quantitative Settings
LEGENDplex™ Data Analysis Software-Installation Guide
21
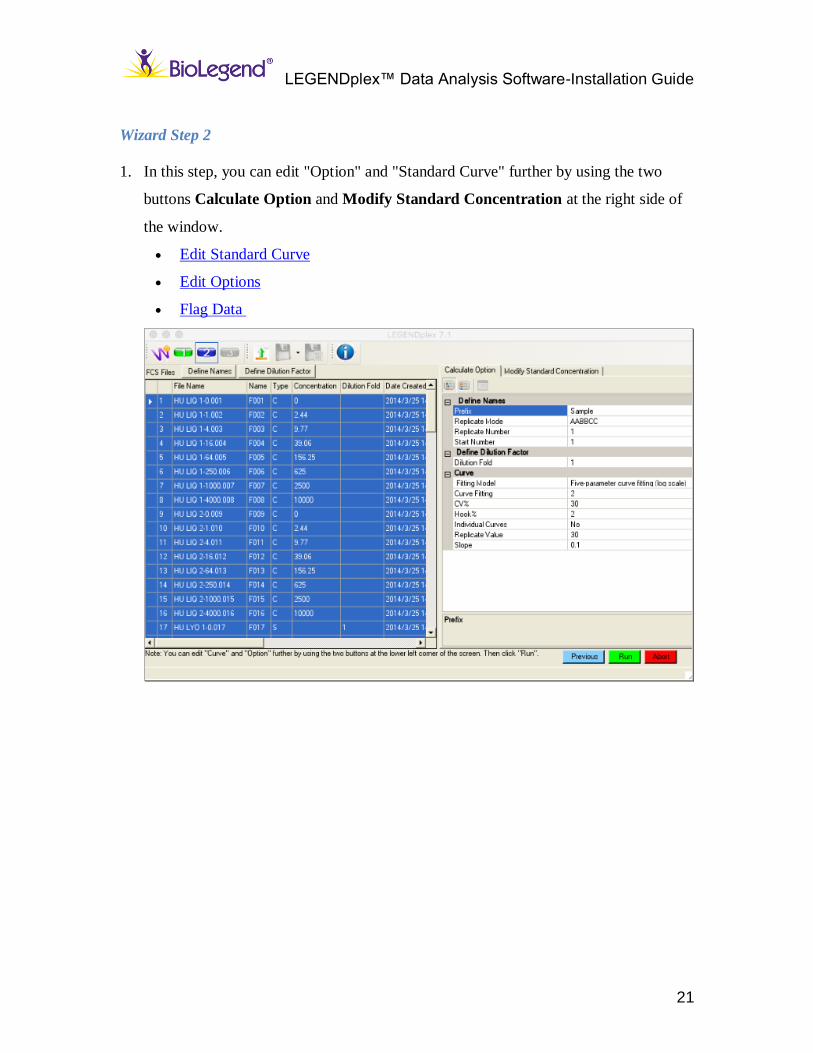
Wizard Step 2
1. In this step, you can edit "Option" and "Standard Curve" further by using the two
buttons Calculate Option and Modify Standard Concentration at the right side of
the window.
Edit Standard Curve
Edit Options
Flag Data
LEGENDplex™ Data Analysis Software-Help
22
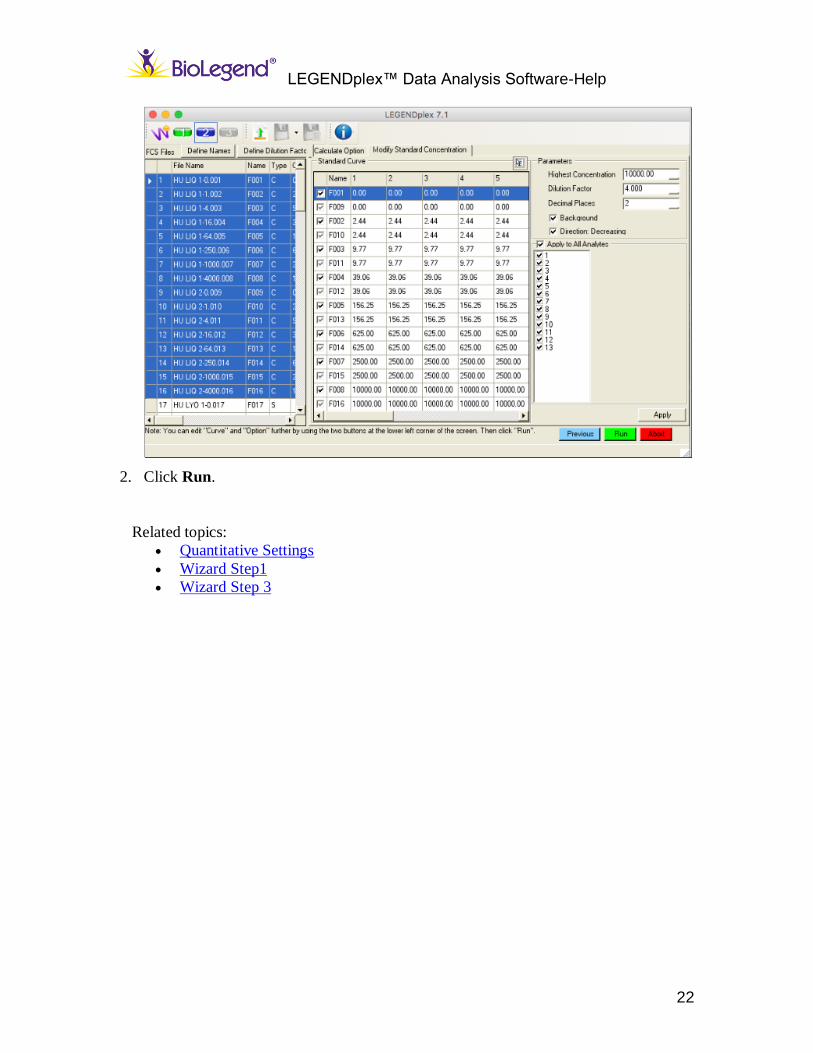
2. Click Run.
Related topics:
Quantitative Settings
Wizard Step1
Wizard Step 3
LEGENDplex™ Data Analysis Software-Installation Guide
23
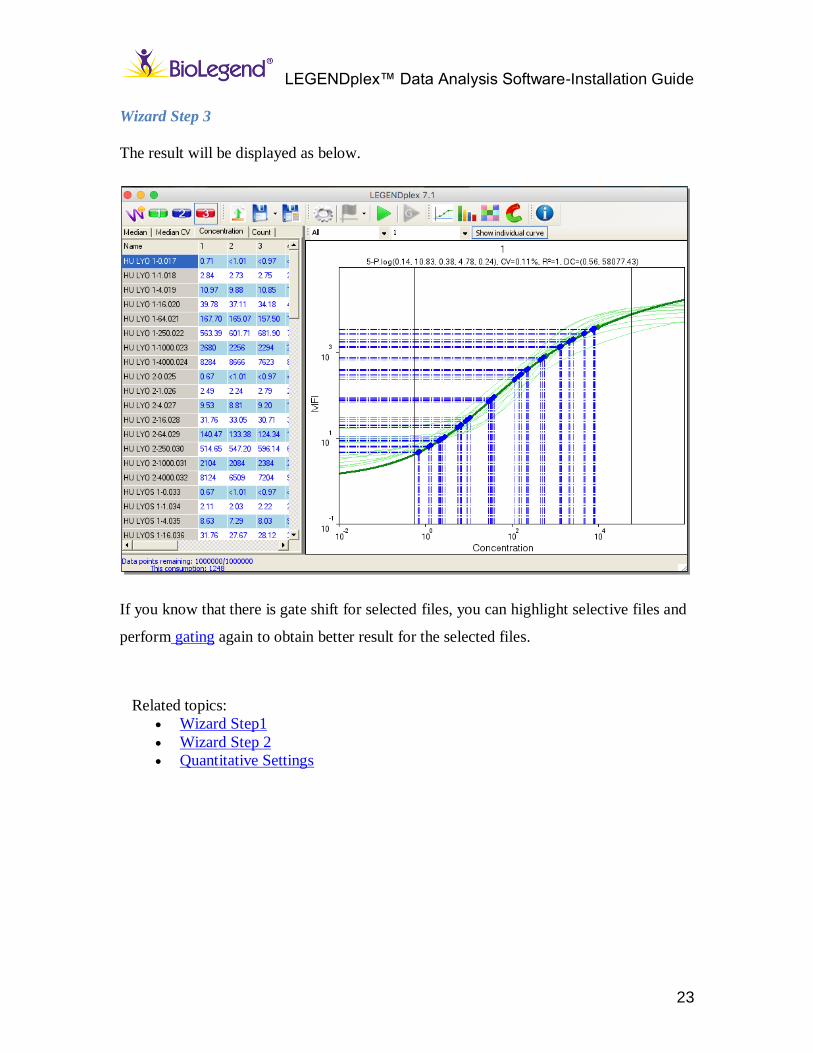
Wizard Step 3
The result will be displayed as below.
If you know that there is gate shift for selected files, you can highlight selective files and
perform gating again to obtain better result for the selected files.
Related topics:
Wizard Step1
Wizard Step 2
Quantitative Settings
LEGENDplex™ Data Analysis Software-Installation Guide
24
Quantitative Operation Items
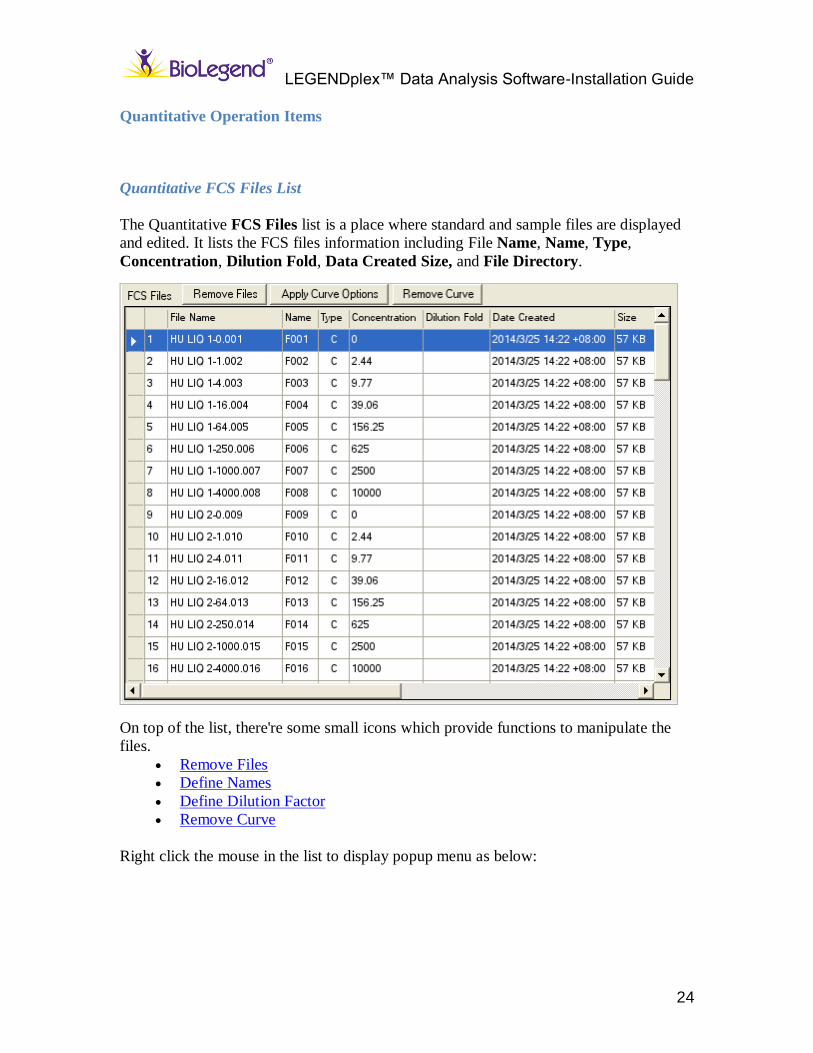
Quantitative FCS Files List
The Quantitative FCS Files list is a place where standard and sample files are displayed
and edited. It lists the FCS files information including File Name, Name, Type,
Concentration, Dilution Fold, Data Created Size, and File Directory.
On top of the list, there're some small icons which provide functions to manipulate the
files.
Remove Files
Define Names
Define Dilution Factor Remove Curve
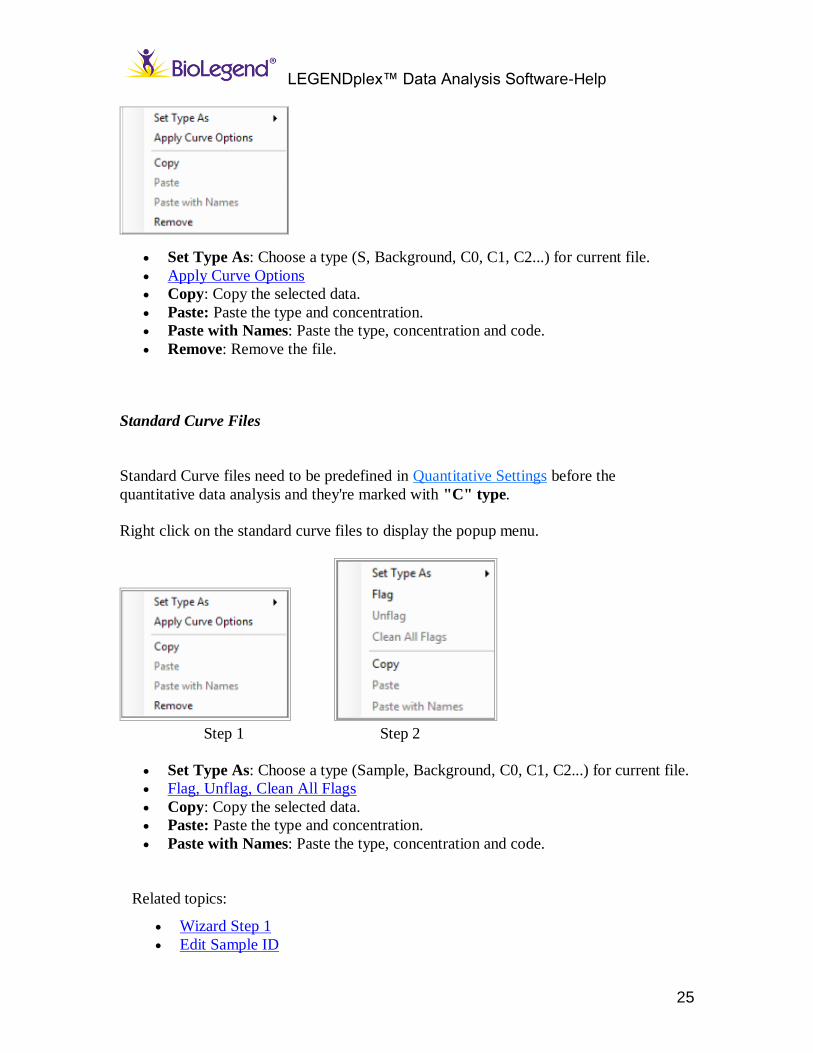
Right click the mouse in the list to display popup menu as below:
LEGENDplex™ Data Analysis Software-Help
25
Set Type As: Choose a type (S, Background, C0, C1, C2...) for current file.
Apply Curve Options
Copy: Copy the selected data.
Paste: Paste the type and concentration.
Paste with Names: Paste the type, concentration and code.
Remove: Remove the file.
Standard Curve Files
Standard Curve files need to be predefined in Quantitative Settings before the
quantitative data analysis and they're marked with "C" type.
Right click on the standard curve files to display the popup menu.
Step 1 Step 2
Set Type As: Choose a type (Sample, Background, C0, C1, C2...) for current file.
Flag, Unflag, Clean All Flags
Copy: Copy the selected data.
Paste: Paste the type and concentration.
Paste with Names: Paste the type, concentration and code.
Related topics:
Wizard Step 1
Edit Sample ID
LEGENDplex™ Data Analysis Software-Help
26
Set Standard Curve
Edit Standard Curve
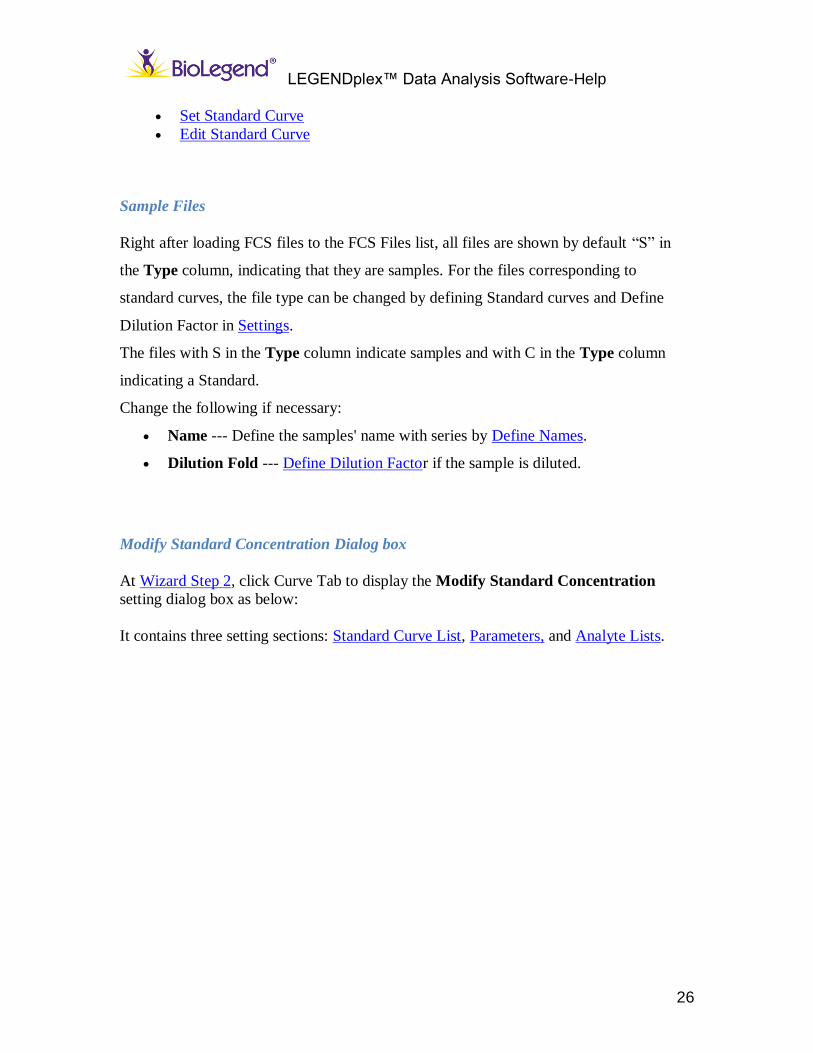
Sample Files
Right after loading FCS files to the FCS Files list, all files are shown by default “S” in
the Type column, indicating that they are samples. For the files corresponding to
standard curves, the file type can be changed by defining Standard curves and Define
Dilution Factor in Settings.
The files with S in the Type column indicate samples and with C in the Type column
indicating a Standard.
Change the following if necessary:
Name --- Define the samples' name with series by Define Names.
Dilution Fold --- Define Dilution Factor if the sample is diluted.
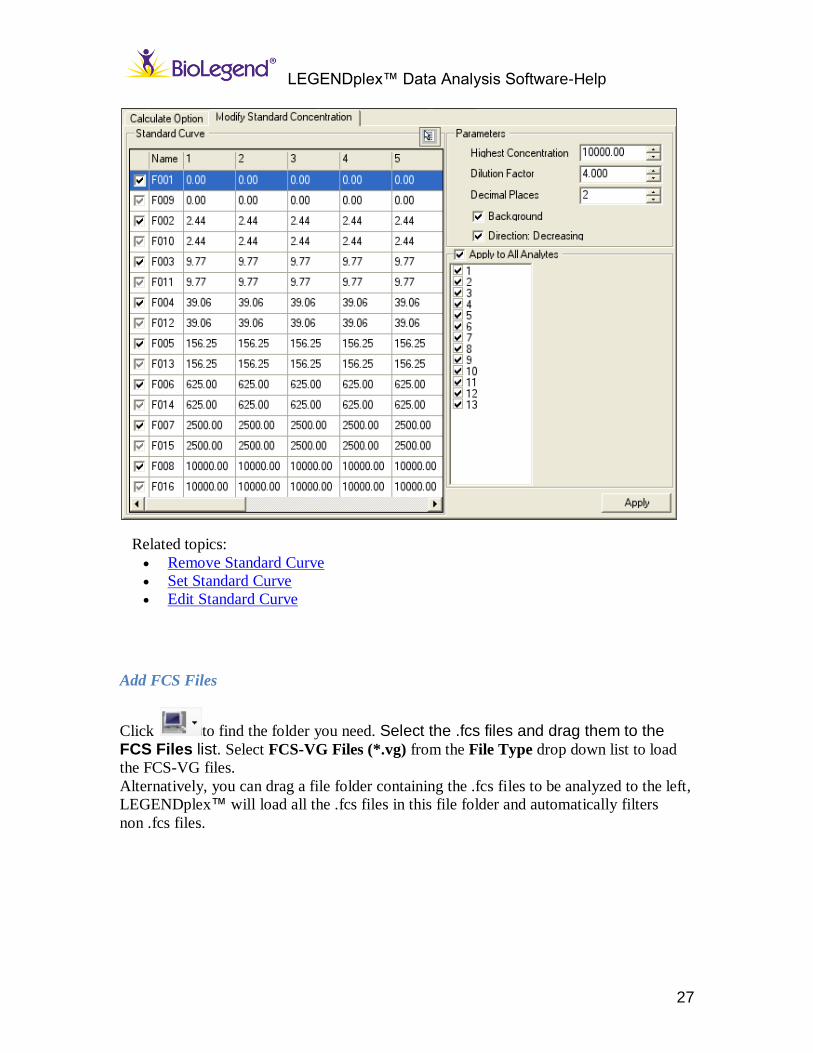
Modify Standard Concentration Dialog box
At Wizard Step 2, click Curve Tab to display the Modify Standard Concentration
setting dialog box as below:
It contains three setting sections: Standard Curve List, Parameters, and Analyte Lists.
LEGENDplex™ Data Analysis Software-Help
27
Related topics:
Remove Standard Curve
Set Standard Curve
Edit Standard Curve
Add FCS Files
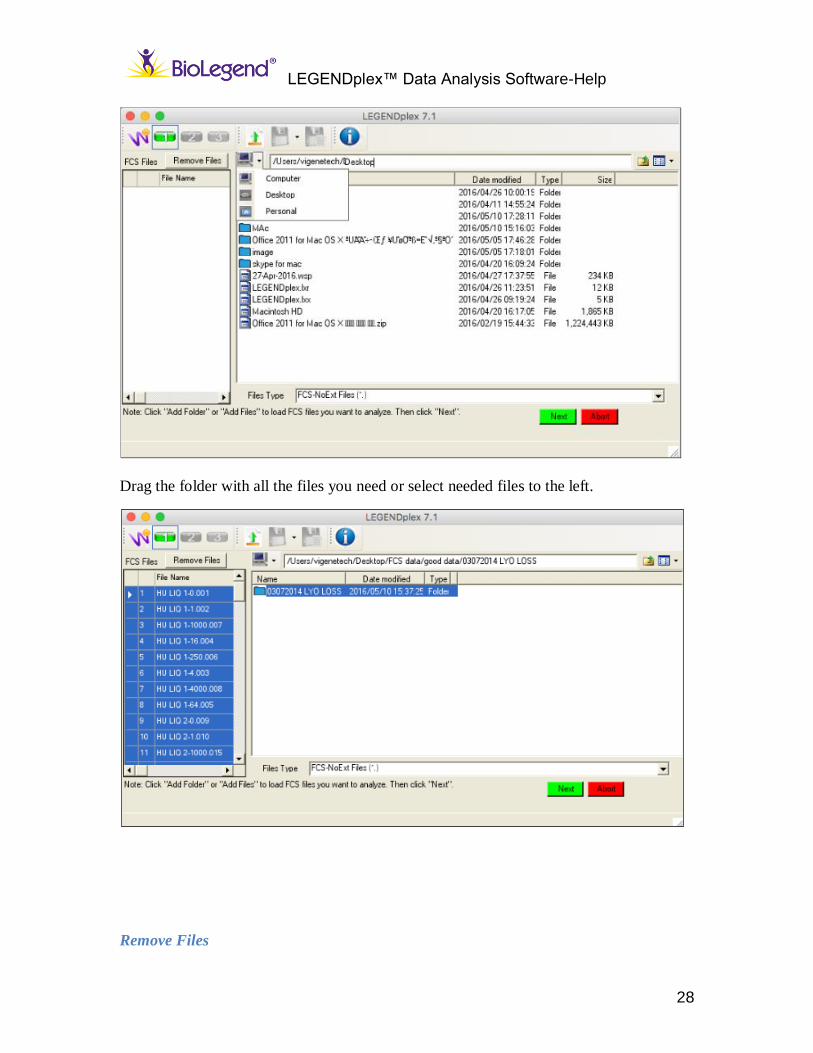
Click to find the folder you need. Select the .fcs files and drag them to the FCS Files list. Select FCS-VG Files (*.vg) from the File Type drop down list to load
the FCS-VG files. Alternatively, you can drag a file folder containing the .fcs files to be analyzed to the left,
LEGENDplex™ will load all the .fcs files in this file folder and automatically filters
non .fcs files.
LEGENDplex™ Data Analysis Software-Help
28
Drag the folder with all the files you need or select needed files to the left.
Remove Files
LEGENDplex™ Data Analysis Software-Help
29
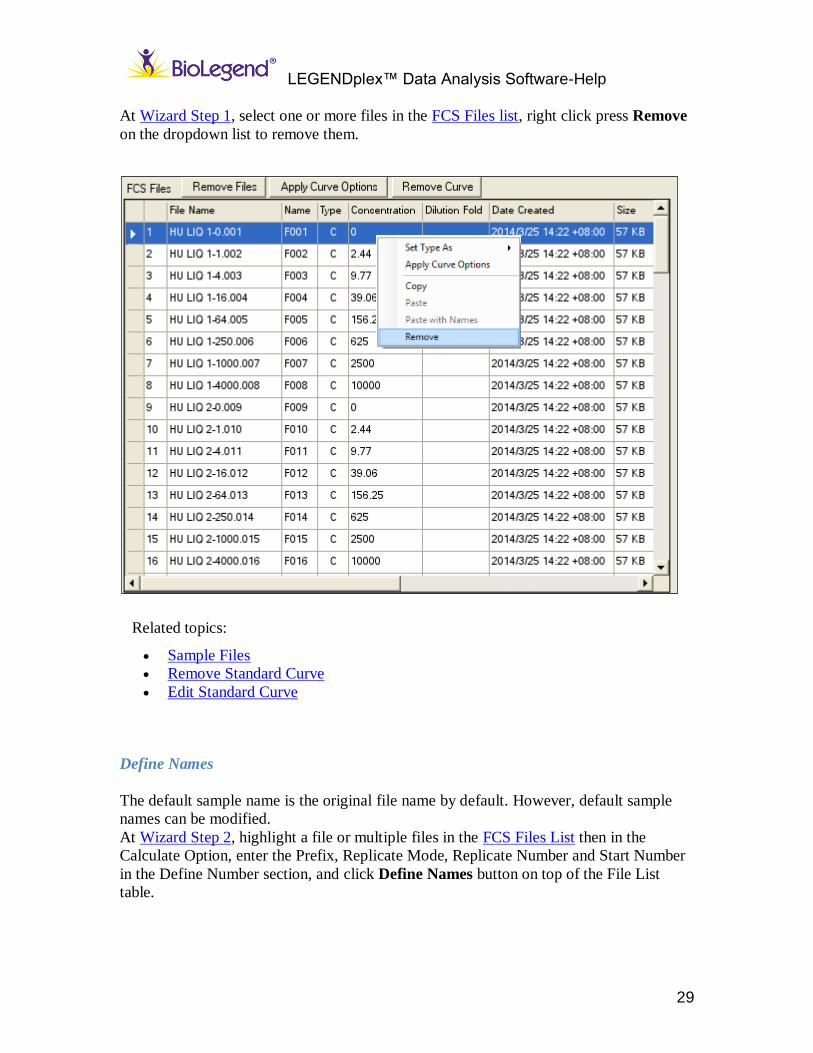
At Wizard Step 1, select one or more files in the FCS Files list, right click press Remove
on the dropdown list to remove them.
Related topics:
Sample Files
Remove Standard Curve
Edit Standard Curve
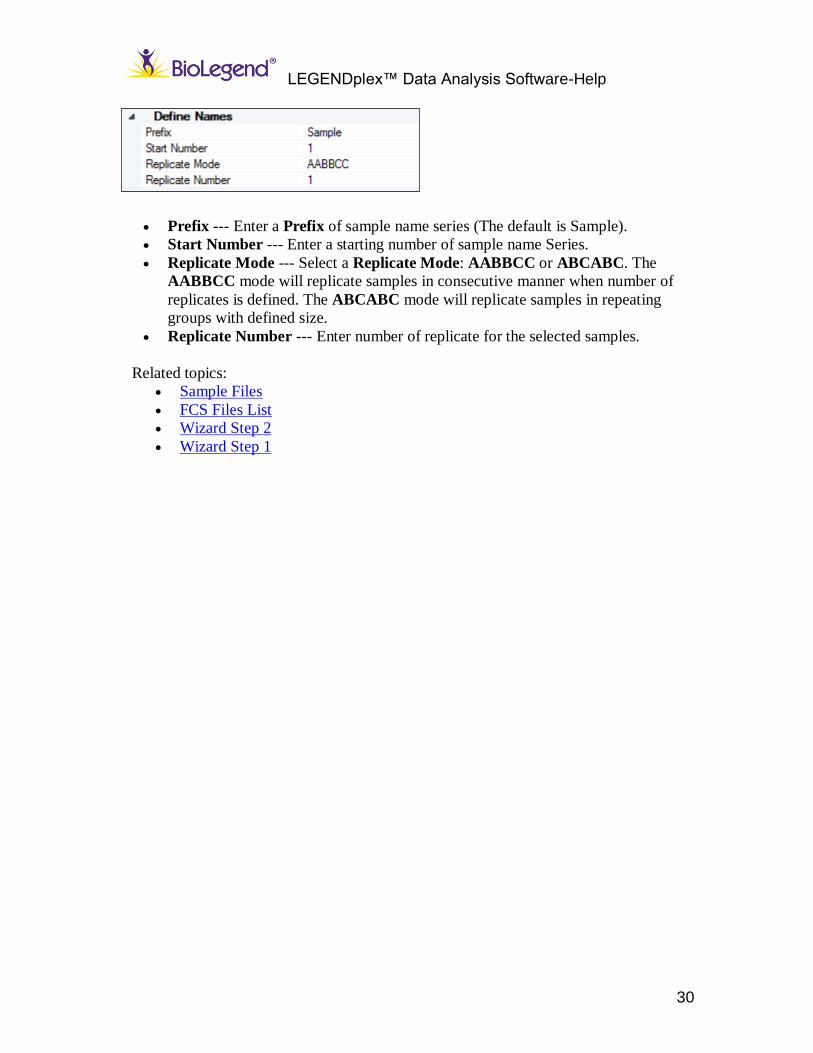
Define Names
The default sample name is the original file name by default. However, default sample
names can be modified.
At Wizard Step 2, highlight a file or multiple files in the FCS Files List then in the
Calculate Option, enter the Prefix, Replicate Mode, Replicate Number and Start Number
in the Define Number section, and click Define Names button on top of the File List
table.
LEGENDplex™ Data Analysis Software-Help
30
Prefix --- Enter a Prefix of sample name series (The default is Sample).
Start Number --- Enter a starting number of sample name Series.
Replicate Mode --- Select a Replicate Mode: AABBCC or ABCABC. The
AABBCC mode will replicate samples in consecutive manner when number of
replicates is defined. The ABCABC mode will replicate samples in repeating
groups with defined size.
Replicate Number --- Enter number of replicate for the selected samples.
Related topics:
Sample Files
FCS Files List
Wizard Step 2
Wizard Step 1
LEGENDplex™ Data Analysis Software-Installation Guide
31
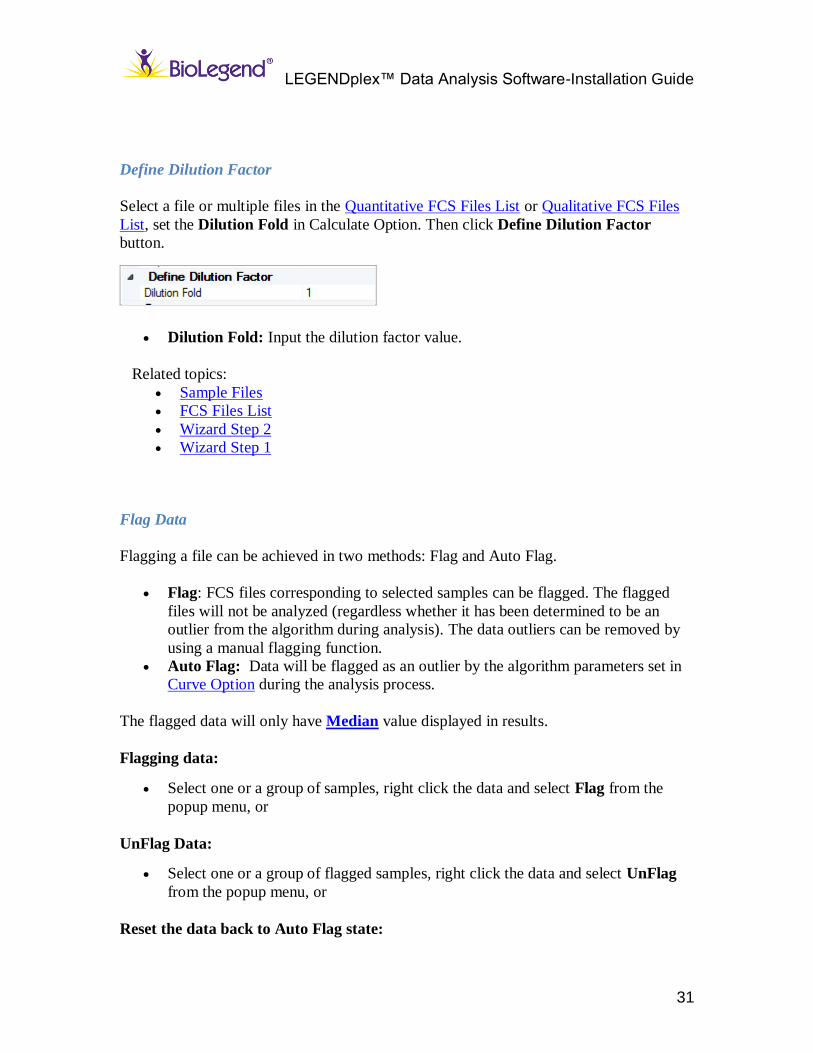
Define Dilution Factor
Select a file or multiple files in the Quantitative FCS Files List or Qualitative FCS Files
List, set the Dilution Fold in Calculate Option. Then click Define Dilution Factor
button.
Dilution Fold: Input the dilution factor value.
Related topics:
Sample Files
FCS Files List
Wizard Step 2
Wizard Step 1
Flag Data
Flagging a file can be achieved in two methods: Flag and Auto Flag.
Flag: FCS files corresponding to selected samples can be flagged. The flagged
files will not be analyzed (regardless whether it has been determined to be an
outlier from the algorithm during analysis). The data outliers can be removed by
using a manual flagging function.
Auto Flag: Data will be flagged as an outlier by the algorithm parameters set in
Curve Option during the analysis process.
The flagged data will only have Median value displayed in results.
Flagging data:
Select one or a group of samples, right click the data and select Flag from the
popup menu, or
UnFlag Data:
Select one or a group of flagged samples, right click the data and select UnFlag
from the popup menu, or
Reset the data back to Auto Flag state:
LEGENDplex™ Data Analysis Software-Help
32
Select one or a group of samples, right click the data and select Auto Flag from the
popup menu.
Data Sorting
In the FCS File list, the column title such as File Name, Data Created and Size can be
used to sort the files in ascending/descending order. Common use of the sorting function
is to arrange the order of files for standard curves to match with experimental layout so
that data can be calculated correctly.
Alternatively, files or a file can be dragged and moved to a different location within the
file list by using a mouse.
Set Standard Curve
If the FCS files for the standard curve are located consecutively and the related
parameters are correctly set in Settings, drag the mouse to select all the files that you
want to include, click or right click and select Apply Curve Options
to apply the standard curve parameters according to Settings.
LEGENDplex™ Data Analysis Software-Help
33
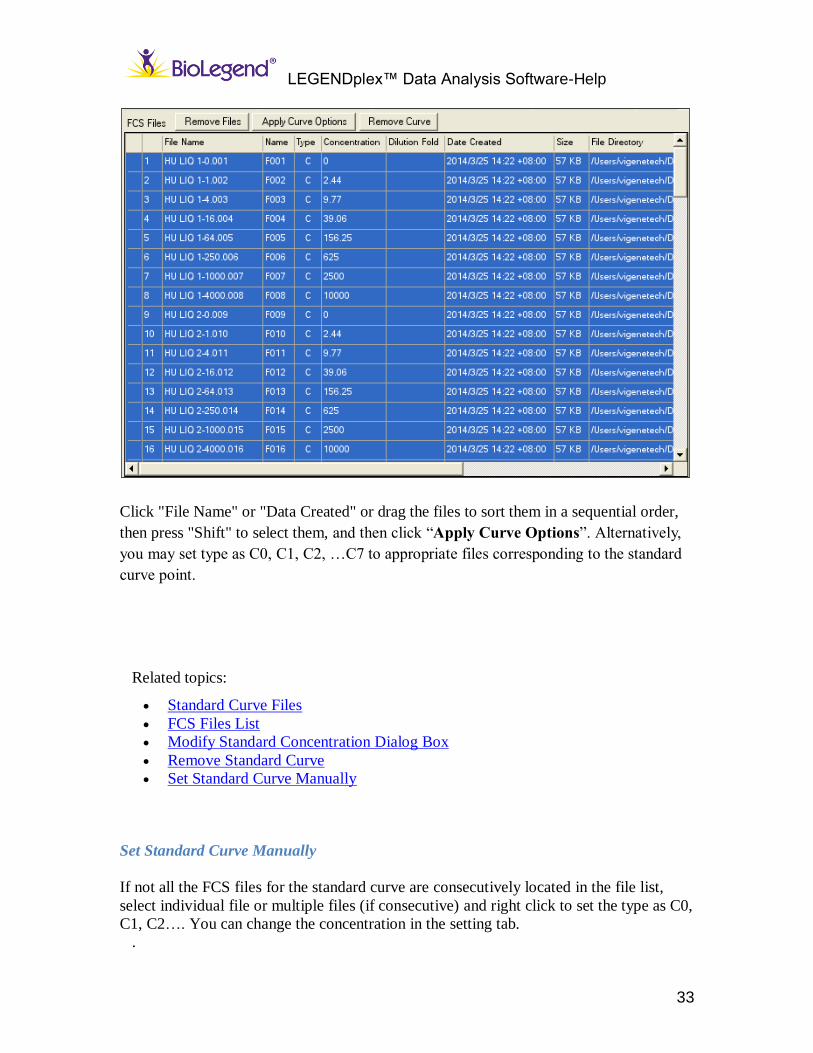
Click "File Name" or "Data Created" or drag the files to sort them in a sequential order,
then press "Shift" to select them, and then click “Apply Curve Options”. Alternatively,
you may set type as C0, C1, C2, …C7 to appropriate files corresponding to the standard
curve point.
Related topics:
Standard Curve Files
FCS Files List
Modify Standard Concentration Dialog Box
Remove Standard Curve
Set Standard Curve Manually
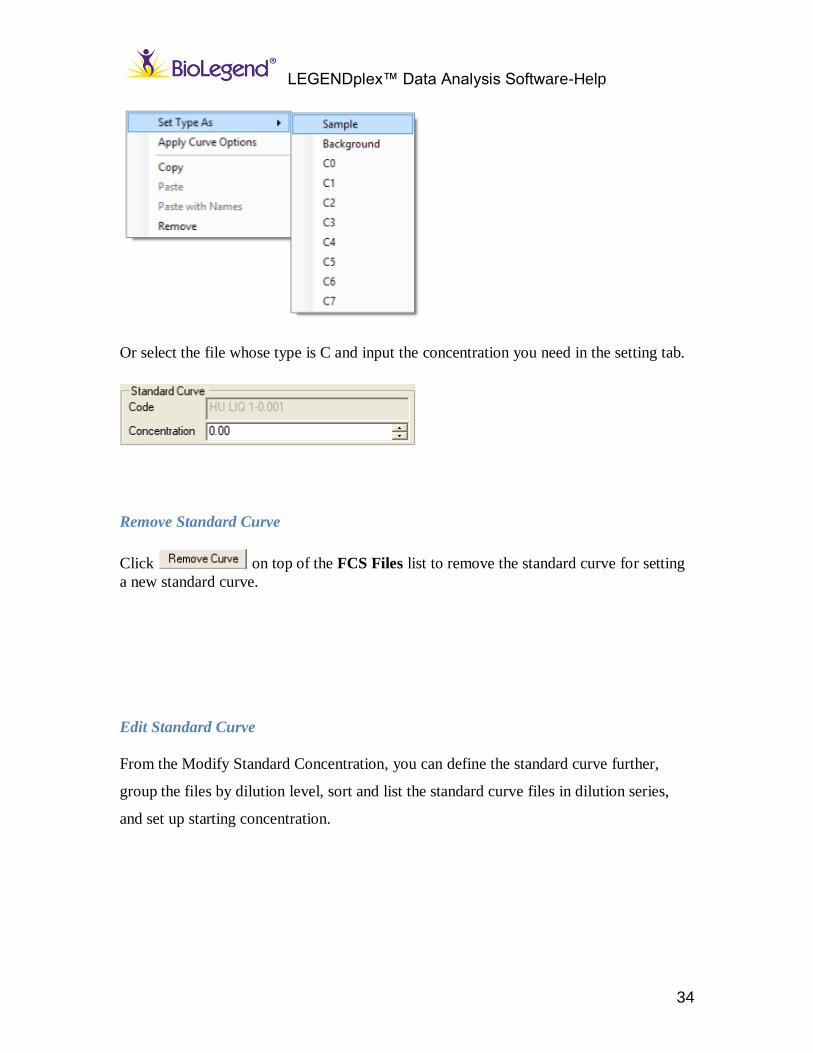
Set Standard Curve Manually
If not all the FCS files for the standard curve are consecutively located in the file list,
select individual file or multiple files (if consecutive) and right click to set the type as C0,
C1, C2…. You can change the concentration in the setting tab.
.
LEGENDplex™ Data Analysis Software-Help
34
Or select the file whose type is C and input the concentration you need in the setting tab.
Remove Standard Curve
Click on top of the FCS Files list to remove the standard curve for setting
a new standard curve.
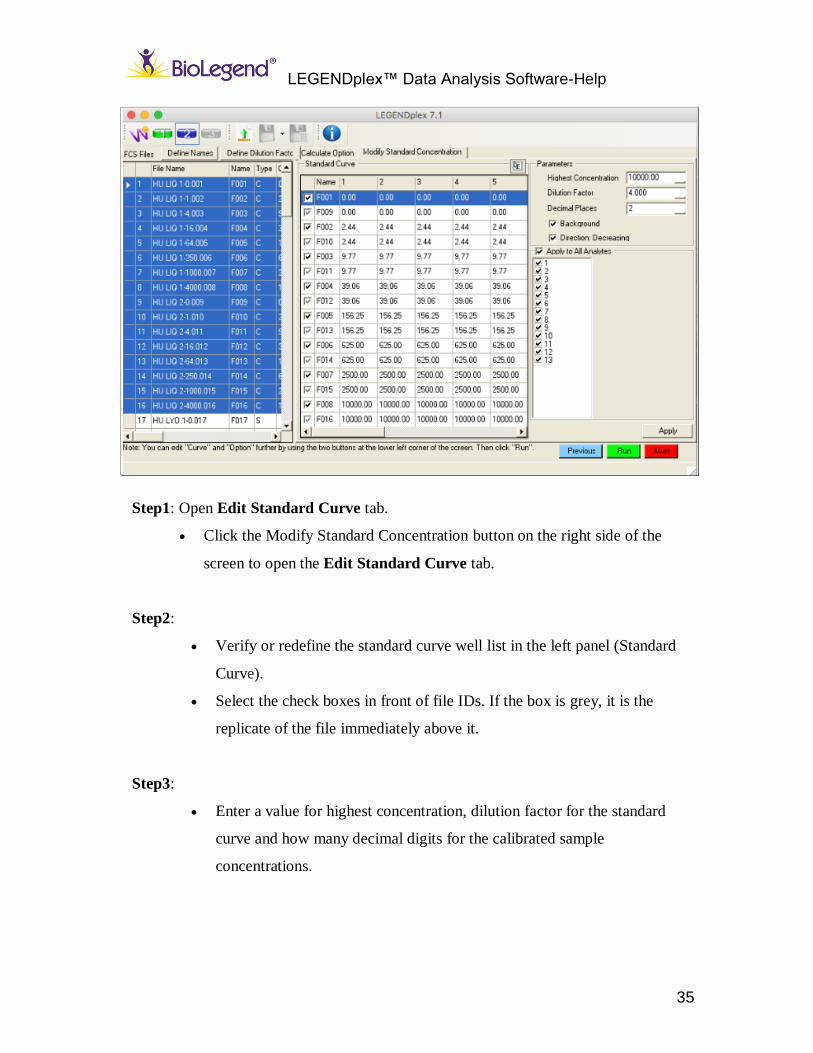
Edit Standard Curve
From the Modify Standard Concentration, you can define the standard curve further,
group the files by dilution level, sort and list the standard curve files in dilution series,
and set up starting concentration.
LEGENDplex™ Data Analysis Software-Help
35
Step1: Open Edit Standard Curve tab.
Click the Modify Standard Concentration button on the right side of the
screen to open the Edit Standard Curve tab.
Step2:
Verify or redefine the standard curve well list in the left panel (Standard
Curve).
Select the check boxes in front of file IDs. If the box is grey, it is the
replicate of the file immediately above it.
Step3:
Enter a value for highest concentration, dilution factor for the standard
curve and how many decimal digits for the calibrated sample
concentrations.
LEGENDplex™ Data Analysis Software-Help
36
Check Background (C0) check box to indicate the standard curve files
include background files. Uncheck it to indicate the standard curve files do
not include background files.
Check Direction: Increasing to define standards curve files have a serial
dilutions from low to high (upward curve shape); or Check Decreasing for
standard concentrations from high to low (downward curve shape).
Increasing is used most often with typical sandwich assays involving S
shaped curves. Decreasing is often used for competition assay curves.
If all analytes have the same starting concentrations, select Apply To All
Analytes check box (default). Click button to continue.
If not all analytes have the same starting concentrations, uncheck the box
for Apply To All Analytes, select the analytes which share the same
concentrations, enter the concentration in the Highest Concentration box
and then click .Repeat the same operations for other targets
which have different highest concentrations. When all analytes are defined,
click RUN button to continue.
If not all Analytes have the same starting concentration, uncheck the box
labeled as Apply to All Analytes. Then enter a different concentration for
the analyte(s) that differ from others and click Apply. Check the dilution
table to make sure concentrations are correct.
Related topics:
Set Standard Curve
Set Standard Curve Manually
Modify Standard Concentration Dialog Box
LEGENDplex™ Data Analysis Software-Installation Guide
37
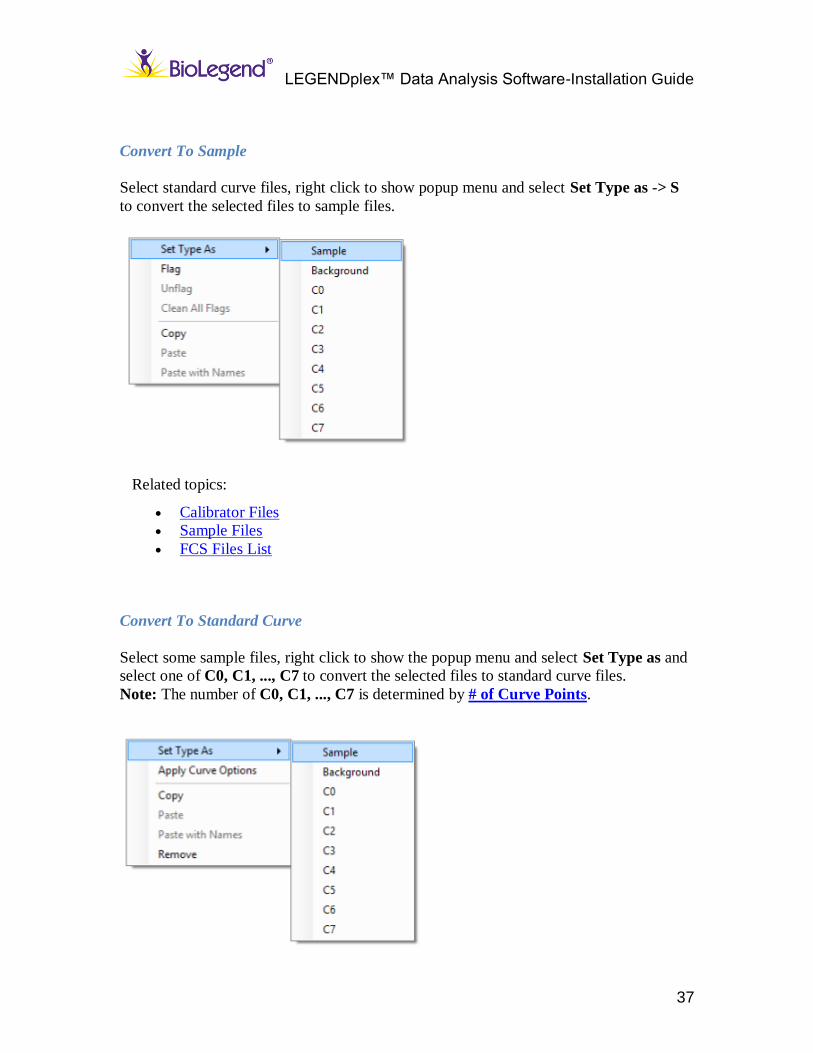
Convert To Sample
Select standard curve files, right click to show popup menu and select Set Type as -> S
to convert the selected files to sample files.
Related topics:
Calibrator Files
Sample Files
FCS Files List
Convert To Standard Curve
Select some sample files, right click to show the popup menu and select Set Type as and
select one of C0, C1, ..., C7 to convert the selected files to standard curve files.
Note: The number of C0, C1, ..., C7 is determined by # of Curve Points.
LEGENDplex™ Data Analysis Software-Help
38
Related topics:
Calibrator Files
Sample Files
FCS Files List
Replicates
Sample replicates can be defined by:
Highlight samples, click on the Define Names. Define the Replicate Mode and
Replicate Number.
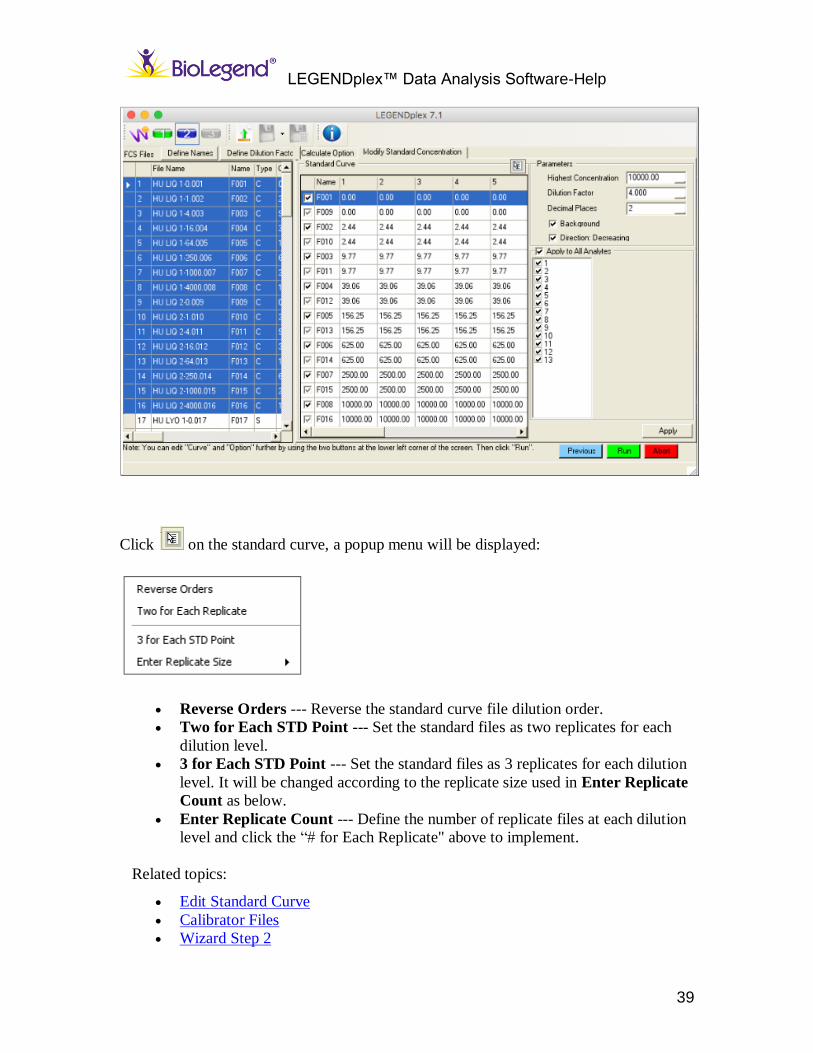
Standard Curve-Set Standard Well Dilution Order
Click Modify Standard Concentration Dialog button on the middle of the screen to open
the Modify Standard Concentration Dialog box. The Standard Curve section is shown
as below:
LEGENDplex™ Data Analysis Software-Help
39
Click on the standard curve, a popup menu will be displayed:
Reverse Orders --- Reverse the standard curve file dilution order.
Two for Each STD Point --- Set the standard files as two replicates for each
dilution level.
3 for Each STD Point --- Set the standard files as 3 replicates for each dilution
level. It will be changed according to the replicate size used in Enter Replicate
Count as below.
Enter Replicate Count --- Define the number of replicate files at each dilution
level and click the “# for Each Replicate" above to implement.
Related topics:
Edit Standard Curve
Calibrator Files
Wizard Step 2
LEGENDplex™ Data Analysis Software-Help
40
Replicates
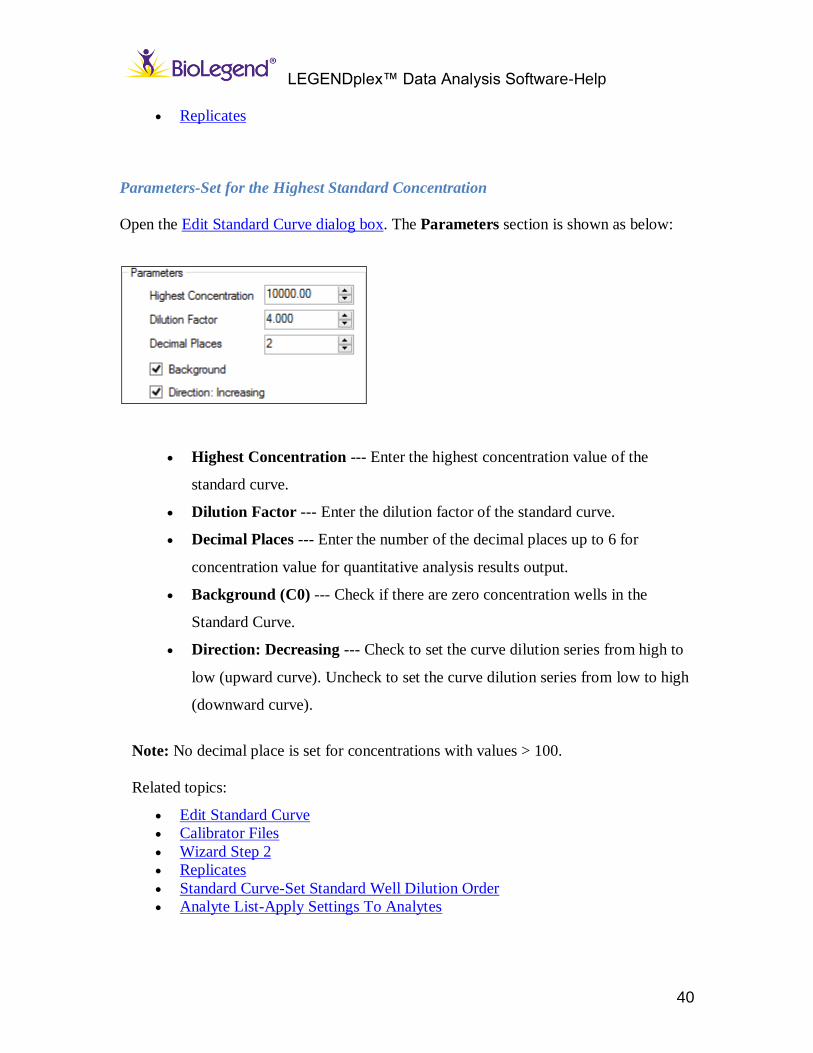
Parameters-Set for the Highest Standard Concentration
Open the Edit Standard Curve dialog box. The Parameters section is shown as below:
Highest Concentration --- Enter the highest concentration value of the
standard curve.
Dilution Factor --- Enter the dilution factor of the standard curve.
Decimal Places --- Enter the number of the decimal places up to 6 for
concentration value for quantitative analysis results output.
Background (C0) --- Check if there are zero concentration wells in the
Standard Curve.
Direction: Decreasing --- Check to set the curve dilution series from high to
low (upward curve). Uncheck to set the curve dilution series from low to high
(downward curve).
Note: No decimal place is set for concentrations with values > 100.
Related topics:
Edit Standard Curve
Calibrator Files
Wizard Step 2
Replicates
Standard Curve-Set Standard Well Dilution Order
Analyte List-Apply Settings To Analytes
LEGENDplex™ Data Analysis Software-Help
41
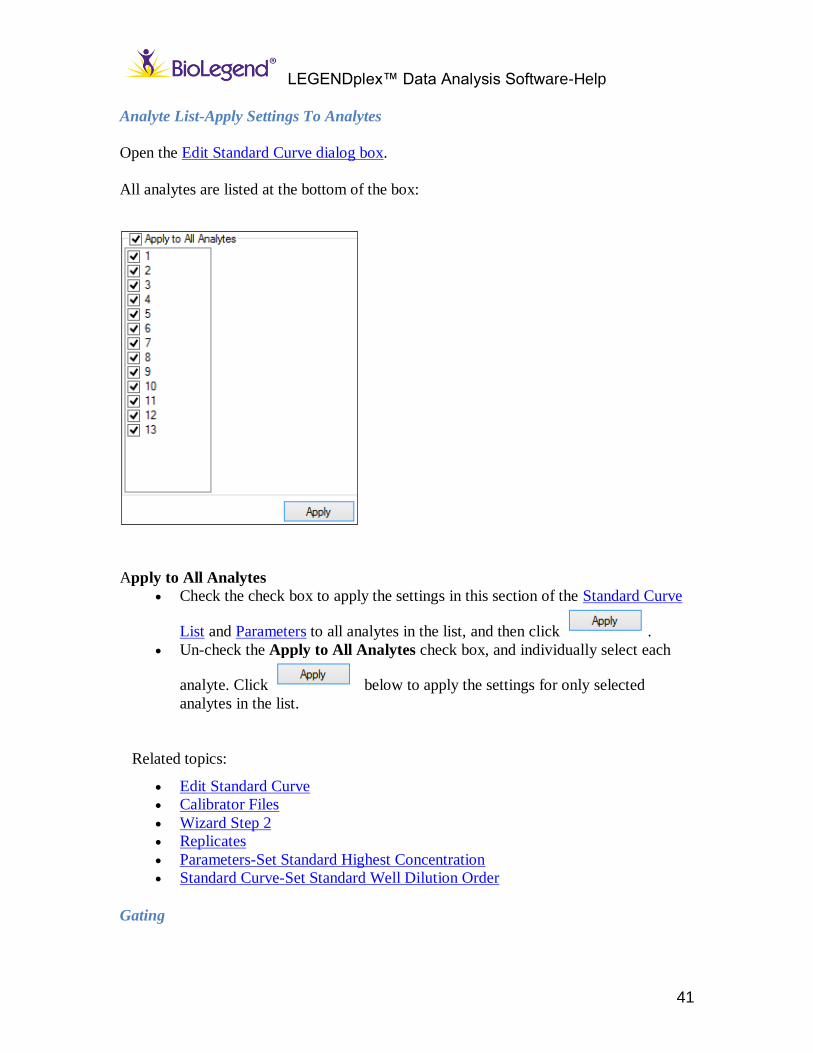
Analyte List-Apply Settings To Analytes
Open the Edit Standard Curve dialog box.
All analytes are listed at the bottom of the box:
Apply to All Analytes
Check the check box to apply the settings in this section of the Standard Curve
List and Parameters to all analytes in the list, and then click .
Un-check the Apply to All Analytes check box, and individually select each
analyte. Click below to apply the settings for only selected
analytes in the list.
Related topics:
Edit Standard Curve
Calibrator Files
Wizard Step 2
Replicates
Parameters-Set Standard Highest Concentration
Standard Curve-Set Standard Well Dilution Order
Gating
LEGENDplex™ Data Analysis Software-Help
42
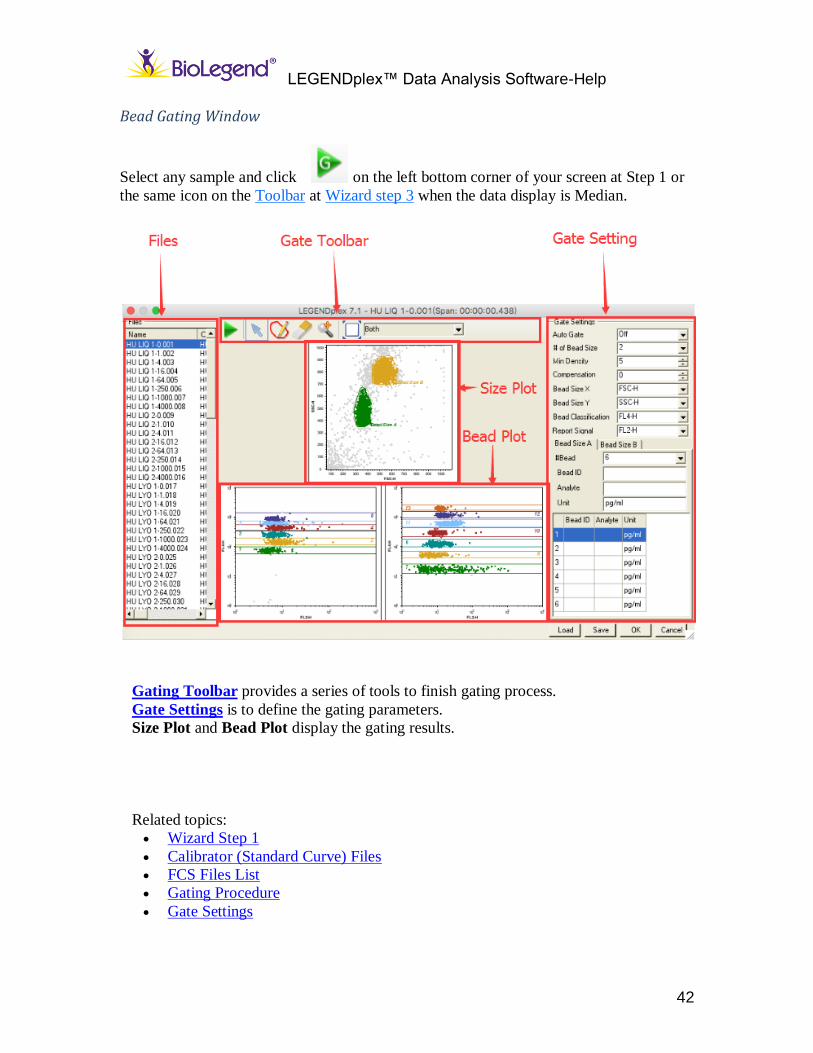
Bead Gating Window
Select any sample and click on the left bottom corner of your screen at Step 1 or
the same icon on the Toolbar at Wizard step 3 when the data display is Median.
Gating Toolbar provides a series of tools to finish gating process.
Gate Settings is to define the gating parameters.
Size Plot and Bead Plot display the gating results.
Related topics:
Wizard Step 1
Calibrator (Standard Curve) Files
FCS Files List
Gating Procedure
Gate Settings
LEGENDplex™ Data Analysis Software-Help
43
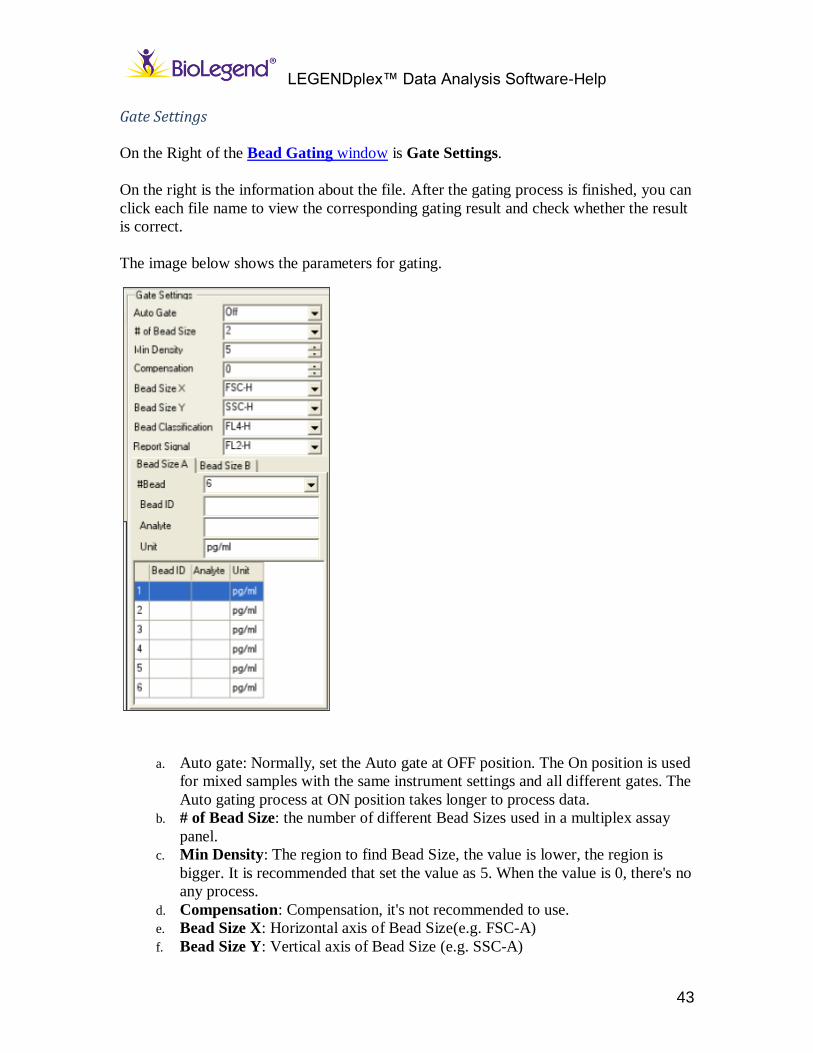
Gate Settings
On the Right of the Bead Gating window is Gate Settings.
On the right is the information about the file. After the gating process is finished, you can
click each file name to view the corresponding gating result and check whether the result
is correct.
The image below shows the parameters for gating.
a. Auto gate: Normally, set the Auto gate at OFF position. The On position is used
for mixed samples with the same instrument settings and all different gates. The
Auto gating process at ON position takes longer to process data.
b. # of Bead Size: the number of different Bead Sizes used in a multiplex assay
panel.
c. Min Density: The region to find Bead Size, the value is lower, the region is
bigger. It is recommended that set the value as 5. When the value is 0, there's no
any process.
d. Compensation: Compensation, it's not recommended to use.
e. Bead Size X: Horizontal axis of Bead Size(e.g. FSC-A)
f. Bead Size Y: Vertical axis of Bead Size (e.g. SSC-A)
LEGENDplex™ Data Analysis Software-Help
44
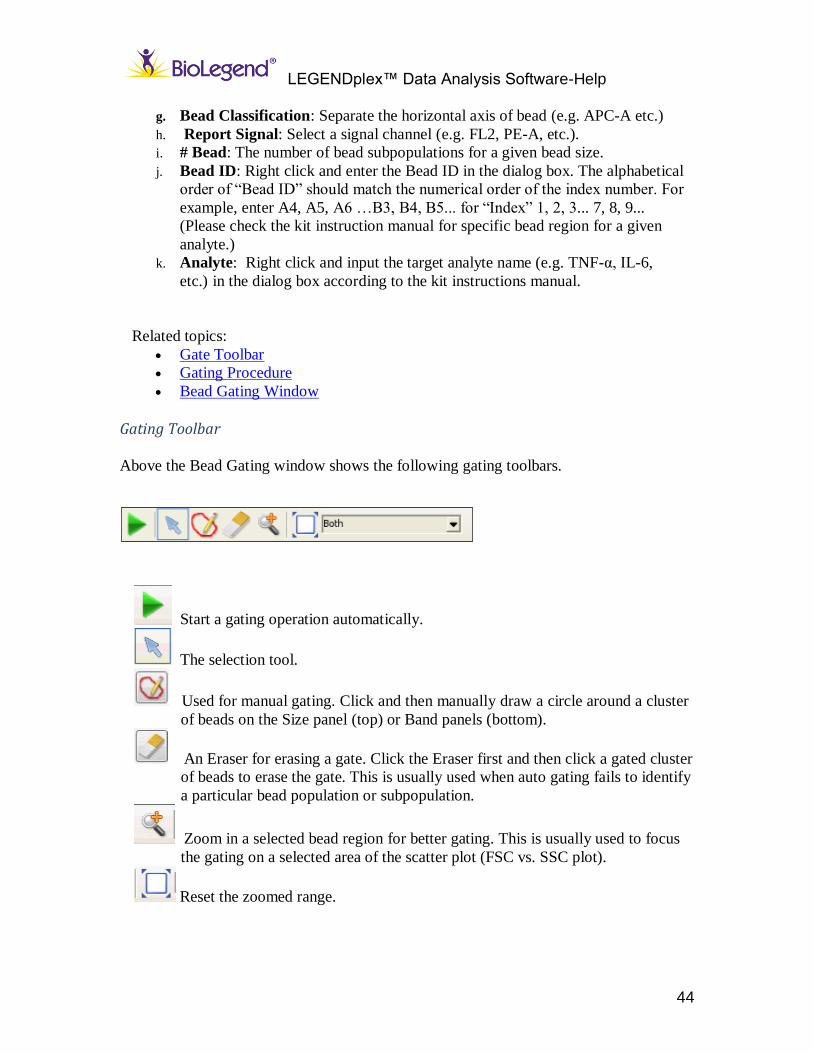
g. Bead Classification: Separate the horizontal axis of bead (e.g. APC-A etc.)
h. Report Signal: Select a signal channel (e.g. FL2, PE-A, etc.).
i. # Bead: The number of bead subpopulations for a given bead size.
j. Bead ID: Right click and enter the Bead ID in the dialog box. The alphabetical
order of “Bead ID” should match the numerical order of the index number. For
example, enter A4, A5, A6 …B3, B4, B5... for “Index” 1, 2, 3... 7, 8, 9...
(Please check the kit instruction manual for specific bead region for a given
analyte.)
k. Analyte: Right click and input the target analyte name (e.g. TNF-α, IL-6,
etc.) in the dialog box according to the kit instructions manual.
Related topics:
Gate Toolbar
Gating Procedure
Bead Gating Window
Gating Toolbar
Above the Bead Gating window shows the following gating toolbars.
Start a gating operation automatically.
The selection tool.
Used for manual gating. Click and then manually draw a circle around a cluster
of beads on the Size panel (top) or Band panels (bottom).
An Eraser for erasing a gate. Click the Eraser first and then click a gated cluster
of beads to erase the gate. This is usually used when auto gating fails to identify
a particular bead population or subpopulation.
Zoom in a selected bead region for better gating. This is usually used to focus
the gating on a selected area of the scatter plot (FSC vs. SSC plot).
Reset the zoomed range.
LEGENDplex™ Data Analysis Software-Help
45
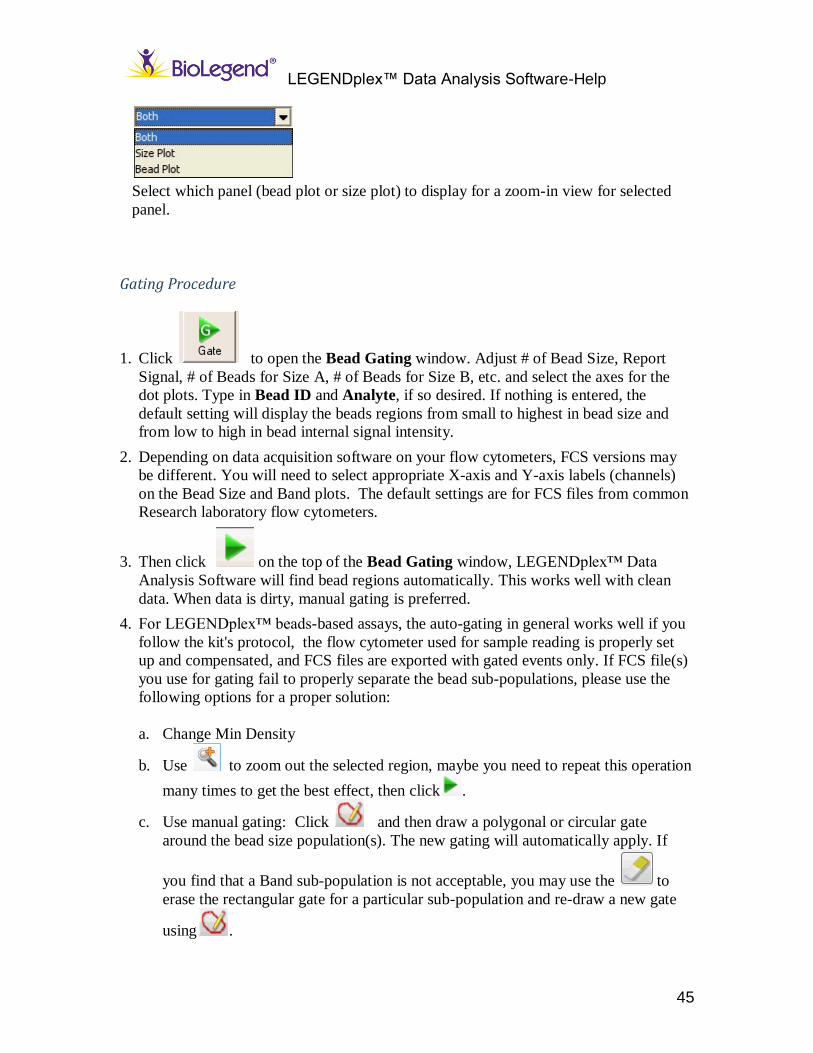
Select which panel (bead plot or size plot) to display for a zoom-in view for selected
panel.
Gating Procedure
1. Click to open the Bead Gating window. Adjust # of Bead Size, Report
Signal, # of Beads for Size A, # of Beads for Size B, etc. and select the axes for the
dot plots. Type in Bead ID and Analyte, if so desired. If nothing is entered, the
default setting will display the beads regions from small to highest in bead size and
from low to high in bead internal signal intensity.
2. Depending on data acquisition software on your flow cytometers, FCS versions may
be different. You will need to select appropriate X-axis and Y-axis labels (channels)
on the Bead Size and Band plots. The default settings are for FCS files from common
Research laboratory flow cytometers.
3. Then click on the top of the Bead Gating window, LEGENDplex™ Data
Analysis Software will find bead regions automatically. This works well with clean
data. When data is dirty, manual gating is preferred.
4. For LEGENDplex™ beads-based assays, the auto-gating in general works well if you
follow the kit's protocol, the flow cytometer used for sample reading is properly set
up and compensated, and FCS files are exported with gated events only. If FCS file(s)
you use for gating fail to properly separate the bead sub-populations, please use the
following options for a proper solution:
a. Change Min Density
b. Use to zoom out the selected region, maybe you need to repeat this operation
many times to get the best effect, then click .
c. Use manual gating: Click and then draw a polygonal or circular gate
around the bead size population(s). The new gating will automatically apply. If
you find that a Band sub-population is not acceptable, you may use the to
erase the rectangular gate for a particular sub-population and re-draw a new gate
using .
LEGENDplex™ Data Analysis Software-Help
46
However, if you click on , it will remove all manual gating.
d. Choose a different sample to gate. This is usually the most practical method.
5. Click to finish gating.
Related topics:
Wizard Step 1
Calibrator(Standard Curve) Files
FCS Files List
Gating Procedure
Gate Settings
Bead Gating Window
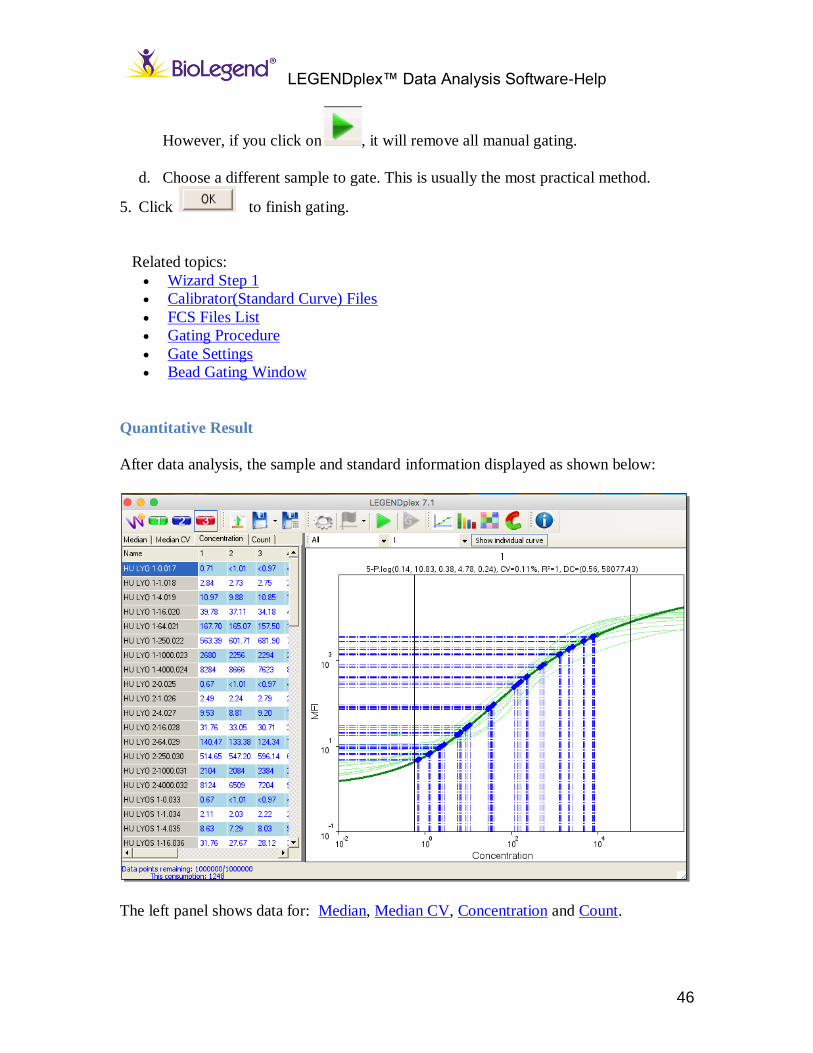
Quantitative Result
After data analysis, the sample and standard information displayed as shown below:
The left panel shows data for: Median, Median CV, Concentration and Count.
LEGENDplex™ Data Analysis Software-Help
47
The right panel shows the graphic view: standard curve and Sample Detail. Click Show
individual curve to view the individual curve information.
The Sample signal and concentrations are mapped in the standard curve(s). All sample
concentrations are mapped to a standard curve by default.
Definitions of curve fitting:
R2 --- see R2 for more information.
CV --- The Coefficient of Variation of sample replicates. (CV% = 100 x Std
Dev / Mean )
LEGENDplex™ offers other views: Bar Chart, Standard Curve, Clustering, Heatmap.
Click the tabs to switch the results views. You can right click on the graphs to save them
in the same folder of the image.
Related topics:
Wizard Step 3
Options
Toolbar
Bar Chart
Standard Curve
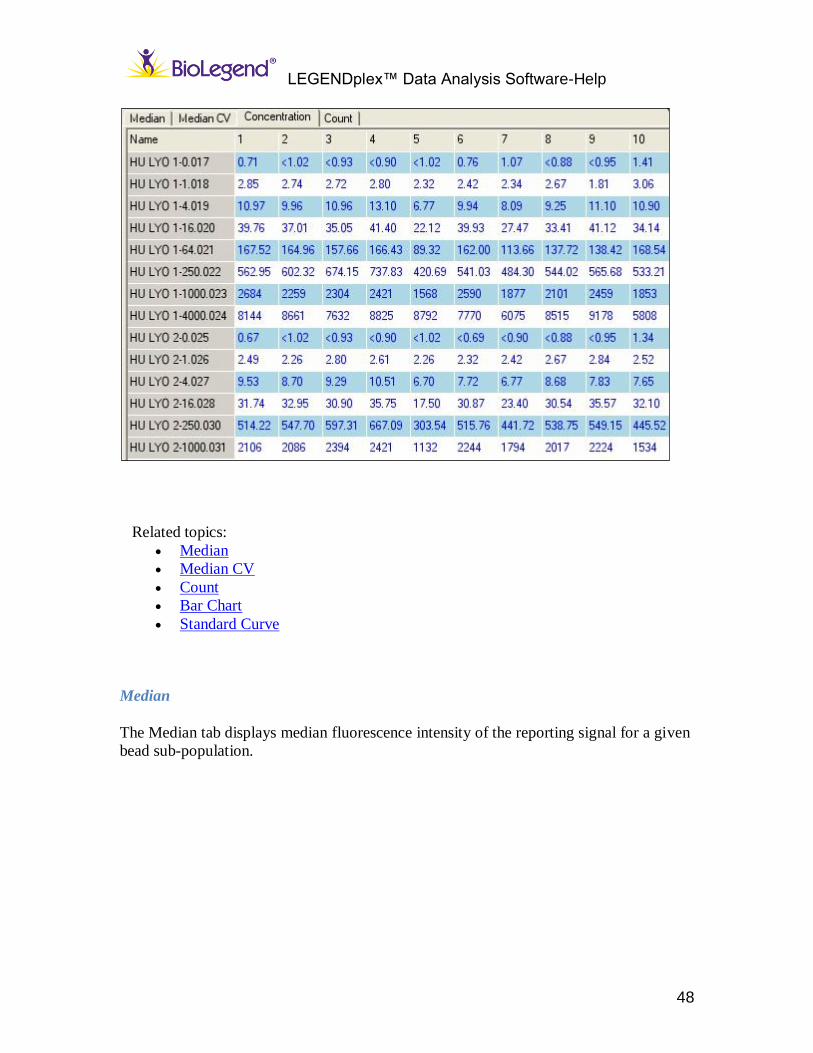
Concentration
The Concentration tab displays the calculated sample concentrations generated from the
standard curves.
LEGENDplex™ Data Analysis Software-Help
48
Related topics:
Median
Median CV
Count
Bar Chart
Standard Curve
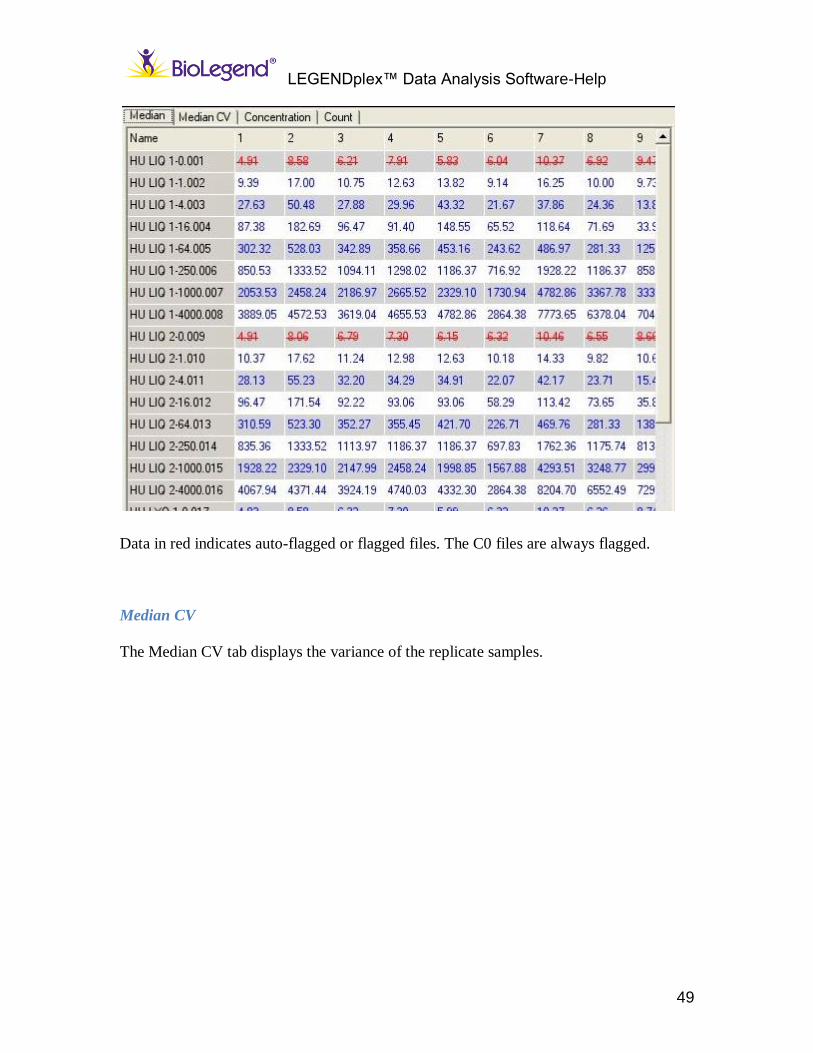
Median
The Median tab displays median fluorescence intensity of the reporting signal for a given
bead sub-population.
LEGENDplex™ Data Analysis Software-Help
49
Data in red indicates auto-flagged or flagged files. The C0 files are always flagged.
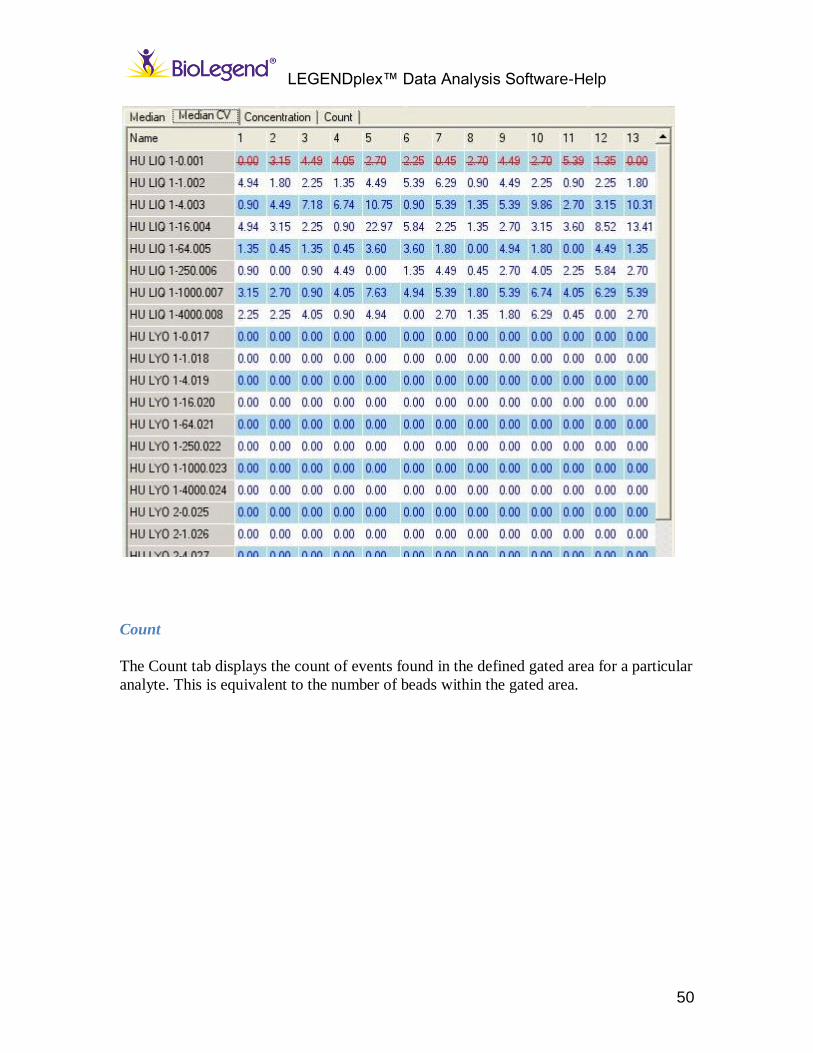
Median CV
The Median CV tab displays the variance of the replicate samples.
LEGENDplex™ Data Analysis Software-Help
50
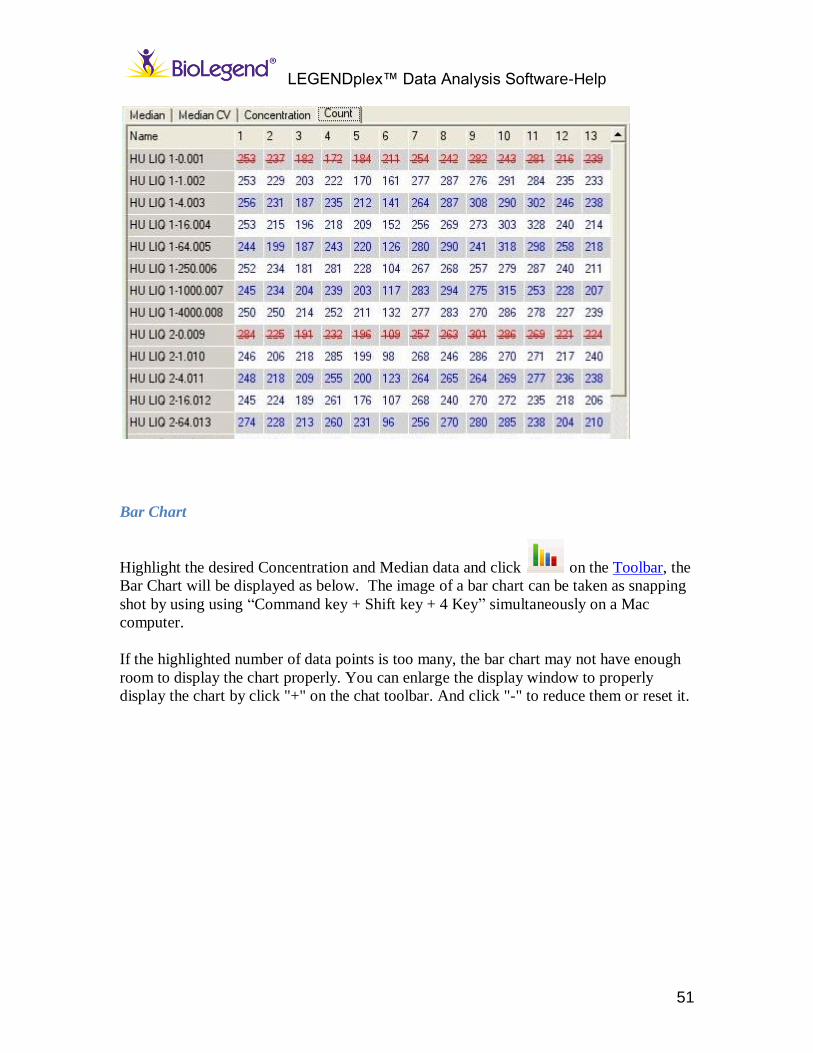
Count
The Count tab displays the count of events found in the defined gated area for a particular
analyte. This is equivalent to the number of beads within the gated area.
LEGENDplex™ Data Analysis Software-Help
51
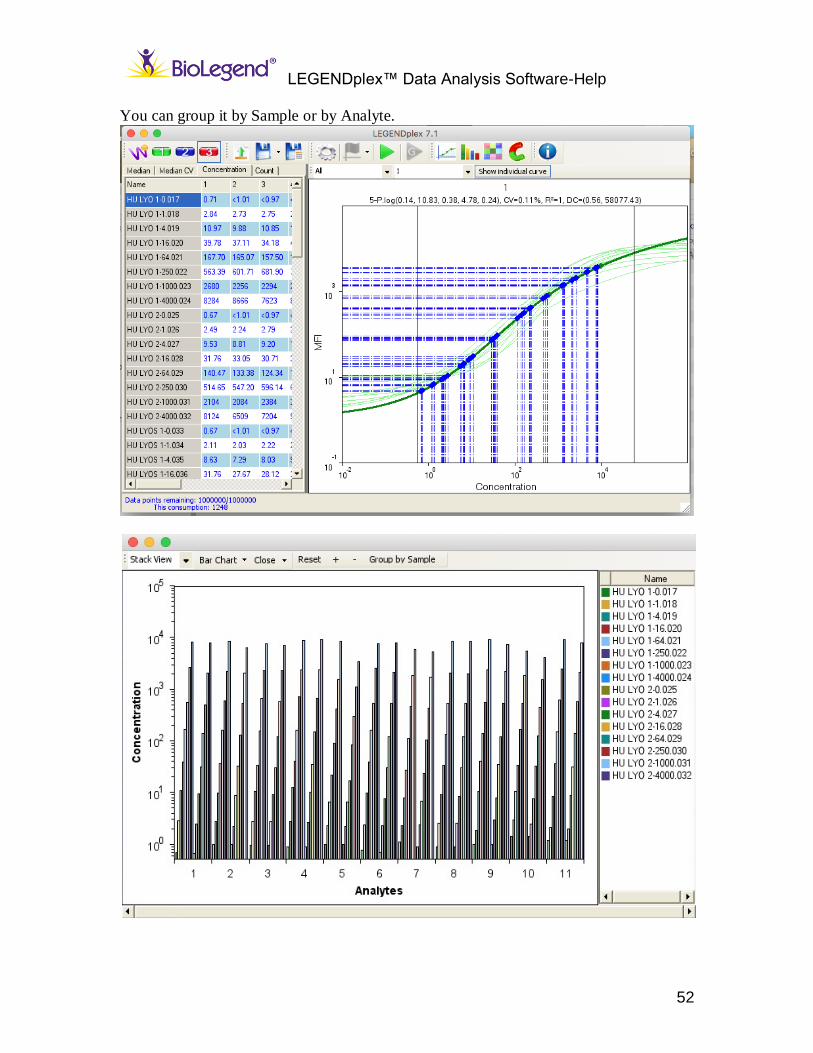
Bar Chart
Highlight the desired Concentration and Median data and click on the Toolbar, the
Bar Chart will be displayed as below. The image of a bar chart can be taken as snapping
shot by using using “Command key + Shift key + 4 Key” simultaneously on a Mac
computer.
If the highlighted number of data points is too many, the bar chart may not have enough
room to display the chart properly. You can enlarge the display window to properly
display the chart by click "+" on the chat toolbar. And click "-" to reduce them or reset it.
LEGENDplex™ Data Analysis Software-Help
52
You can group it by Sample or by Analyte.
LEGENDplex™ Data Analysis Software-Help
53
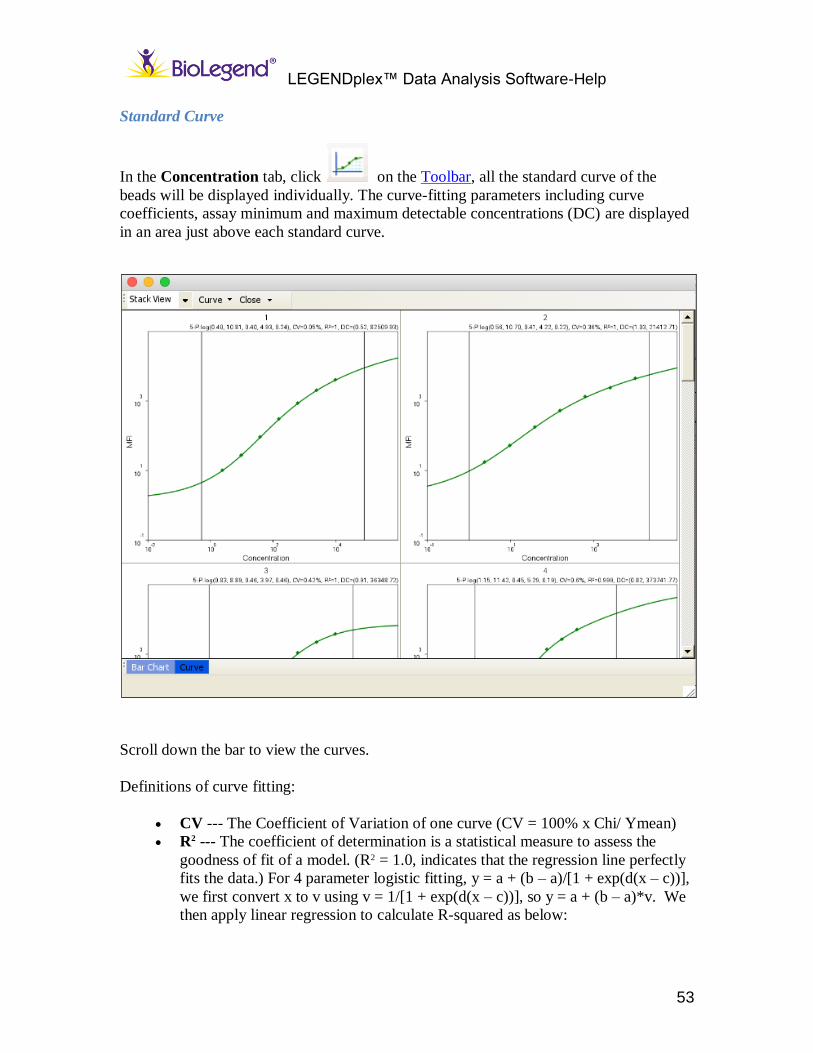
Standard Curve
In the Concentration tab, click on the Toolbar, all the standard curve of the
beads will be displayed individually. The curve-fitting parameters including curve
coefficients, assay minimum and maximum detectable concentrations (DC) are displayed
in an area just above each standard curve.
Scroll down the bar to view the curves.
Definitions of curve fitting:
CV --- The Coefficient of Variation of one curve (CV = 100% x Chi/ Ymean)
R2 --- The coefficient of determination is a statistical measure to assess the
goodness of fit of a model. (R2 = 1.0, indicates that the regression line perfectly
fits the data.) For 4 parameter logistic fitting, y = a + (b – a)/[1 + exp(d(x – c))],
we first convert x to v using v = 1/[1 + exp(d(x – c))], so y = a + (b – a)*v. We
then apply linear regression to calculate R-squared as below:
LEGENDplex™ Data Analysis Software-Help
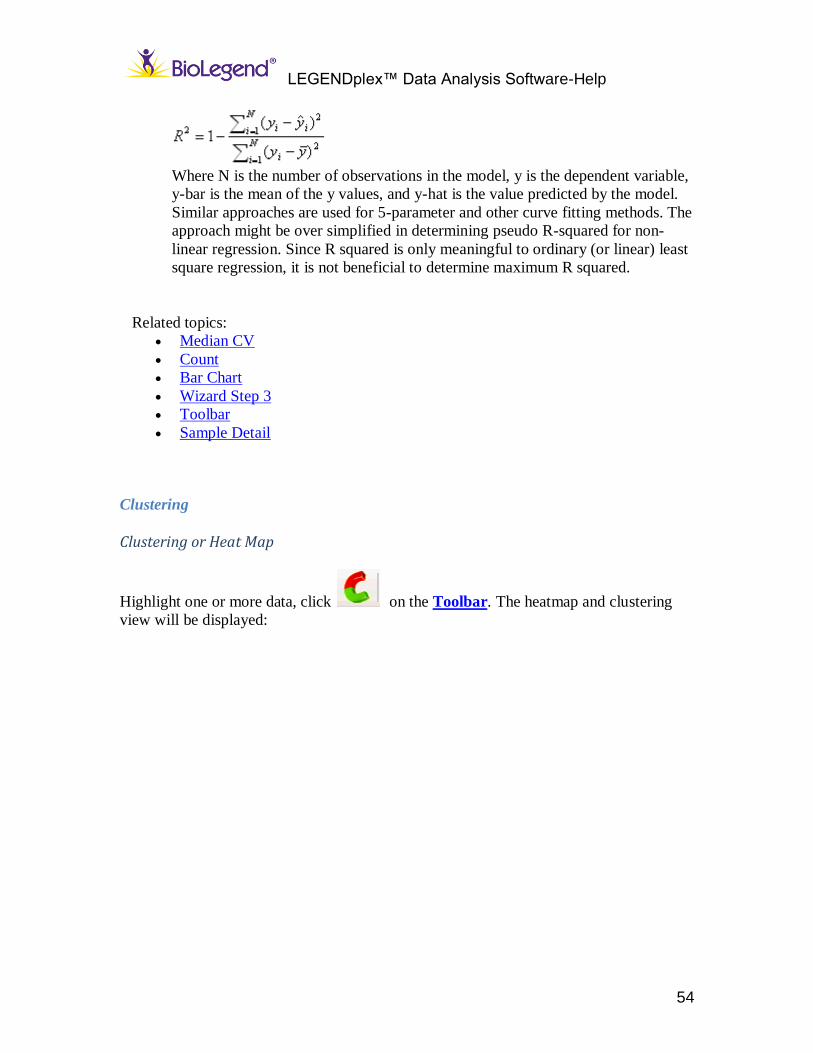
54
Where N is the number of observations in the model, y is the dependent variable,
y-bar is the mean of the y values, and y-hat is the value predicted by the model.
Similar approaches are used for 5-parameter and other curve fitting methods. The
approach might be over simplified in determining pseudo R-squared for non-
linear regression. Since R squared is only meaningful to ordinary (or linear) least
square regression, it is not beneficial to determine maximum R squared.
Related topics:
Median CV
Count
Bar Chart
Wizard Step 3
Toolbar
Sample Detail
Clustering
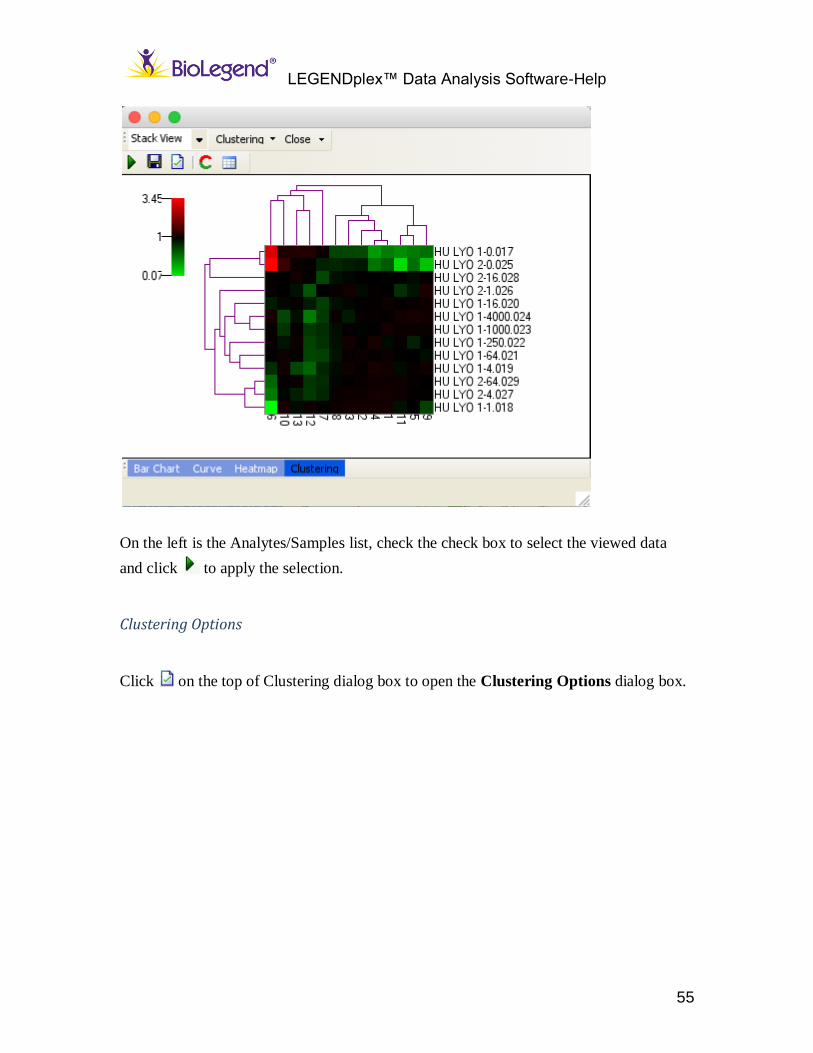
Clustering or Heat Map
Highlight one or more data, click on the Toolbar. The heatmap and clustering
view will be displayed:
LEGENDplex™ Data Analysis Software-Help
55
On the left is the Analytes/Samples list, check the check box to select the viewed data
and click to apply the selection.
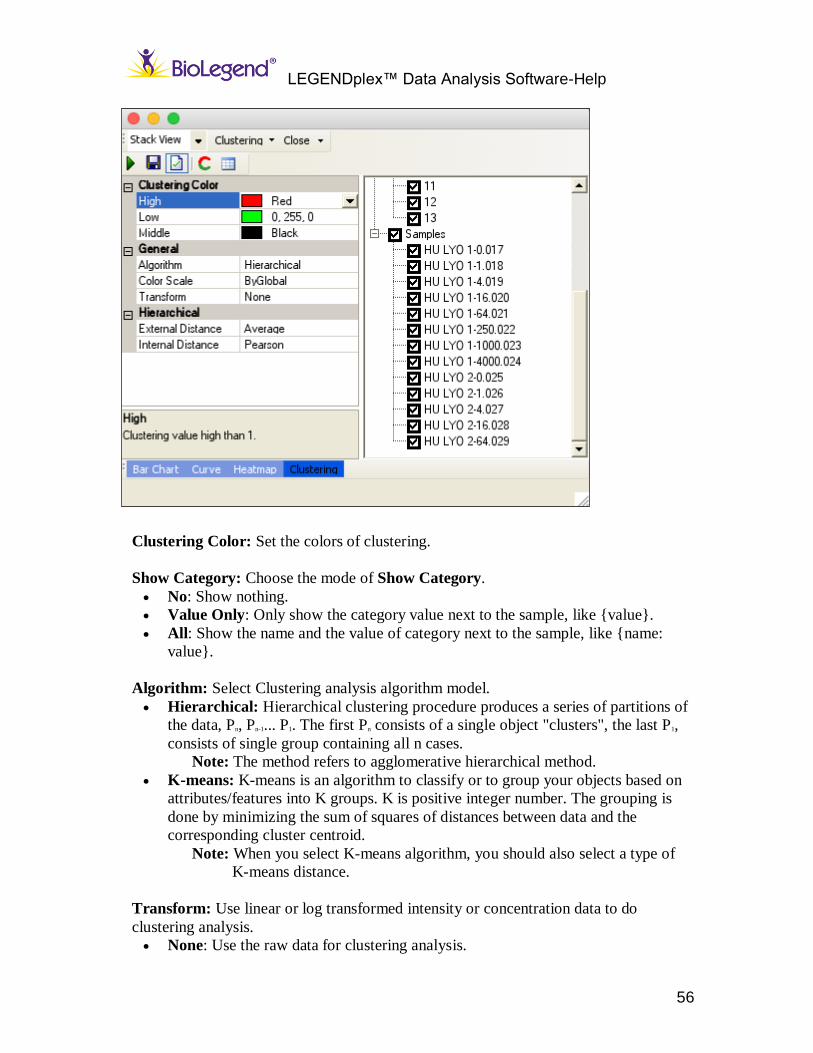
Clustering Options
Click on the top of Clustering dialog box to open the Clustering Options dialog box.
LEGENDplex™ Data Analysis Software-Help
56
Clustering Color: Set the colors of clustering.
Show Category: Choose the mode of Show Category.
No: Show nothing.
Value Only: Only show the category value next to the sample, like {value}.
All: Show the name and the value of category next to the sample, like {name:
value}.
Algorithm: Select Clustering analysis algorithm model.
Hierarchical: Hierarchical clustering procedure produces a series of partitions of
the data, Pn, Pn-1... P1. The first Pn consists of a single object "clusters", the last P1,
consists of single group containing all n cases.
Note: The method refers to agglomerative hierarchical method.
K-means: K-means is an algorithm to classify or to group your objects based on
attributes/features into K groups. K is positive integer number. The grouping is
done by minimizing the sum of squares of distances between data and the
corresponding cluster centroid.
Note: When you select K-means algorithm, you should also select a type of
K-means distance.
Transform: Use linear or log transformed intensity or concentration data to do
clustering analysis.
None: Use the raw data for clustering analysis.
LEGENDplex™ Data Analysis Software-Help
57
Log2: Transform the raw data using Log2.
Ln: Transform the raw data using Ln.
Color Scale: Clustering color can be scaled by whole data set (global) or analytes
(biomarker).
Scale by global: The heatmap colors are based on the overall (complete set) min
and max values.
Scale by biomarker: The heatmap colors are based on the biomarker min and
max values.
Color Map: Choose a color tone to present the intensity or concentration data value.
Auto Scale: Based on the data set, highest and lowest values of data define the whole
color range.
Min Scale: The lowest value of data sets for the top of color range.
Max Scale: The highest value of data sets for the top of color range.
Internal Distance: Algorithm to group similar data to one class.
Euclidean: The distance is defined as Euclidean distance.
Pearson correlation: The distance is defined as 1-r.
Pearson squared: The distance is defined as 1-r2.
External Distance: Algorithm to separate different data to two or more classes.
Average: The average of distances between all pairs of objects.
Average group: Form the groups by their mean values for each protein, that is
their mean sample, and cluster distance is now defined in terms of distance
between two such mean samples.
Single: The distance between the closest pair of objects.
Complete: The distance between the most distant pair of objects.
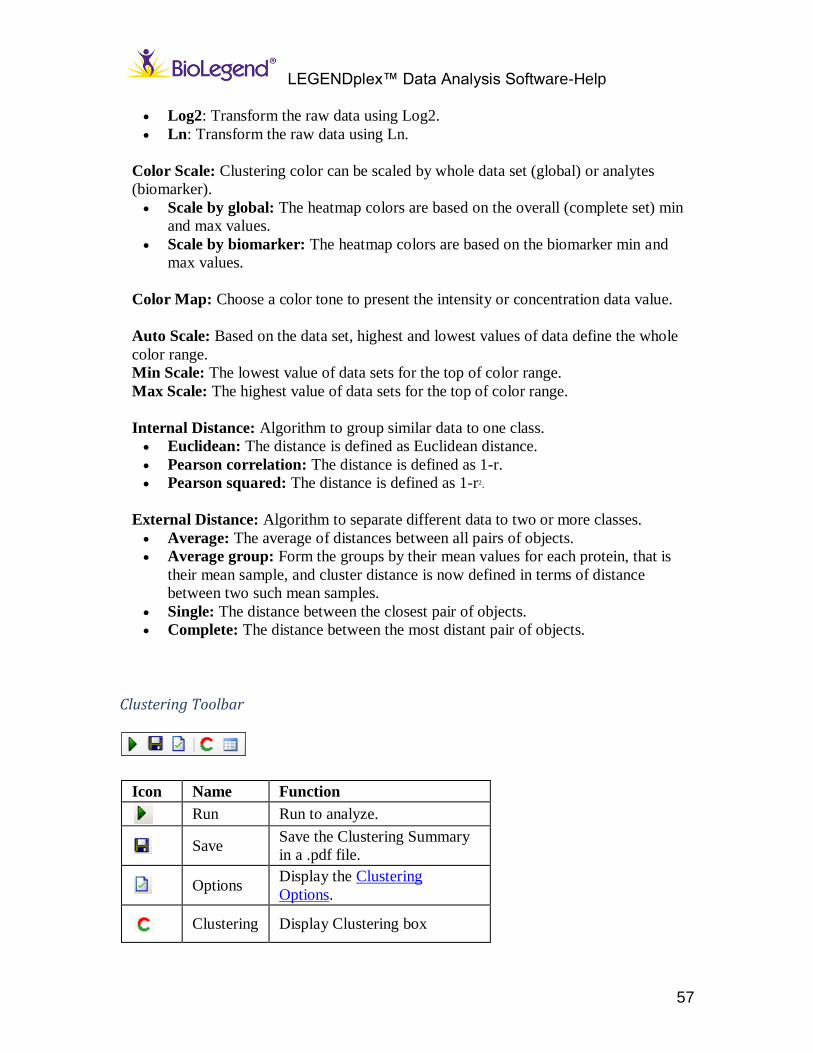
Clustering Toolbar
Icon Name Function
Run Run to analyze.
Save Save the Clustering Summary
in a .pdf file.
Options Display the Clustering
Options.
Clustering Display Clustering box
LEGENDplex™ Data Analysis Software-Help
58
Clustering
table Display Clustering table
Related topics:
Median CV
Count
Bar Chart
Standard Curve Wizard Step 3 Toolbar Clustering or Heat Map Clustering Toolbar
Output
There are 2 types of data reports: Detail and Summary. Click on the Toolbar, it will
save all result data. Click OK.
Detail: Curve Information, Curve Image, Final Sample Concentration, Analyte Detail,
count and Files Information, in .xlsx format.
Summary: Curve Information, Curve Image, Final Sample Concentration, Standard
Concentrations, MFI, Count and Files Information, in .xlsx format.
LEGENDplex™ Data Analysis Software-Installation Guide
59
Qualitative Analysis
Qualitative Analysis Wizard
Qualitative Settings
Qualitative Settings includes sample name, analyte name, positive file and blank file.
The qualitative settings are used to analyze raw data. The Settings can be predefined on
the right panel in Wizard Step1.
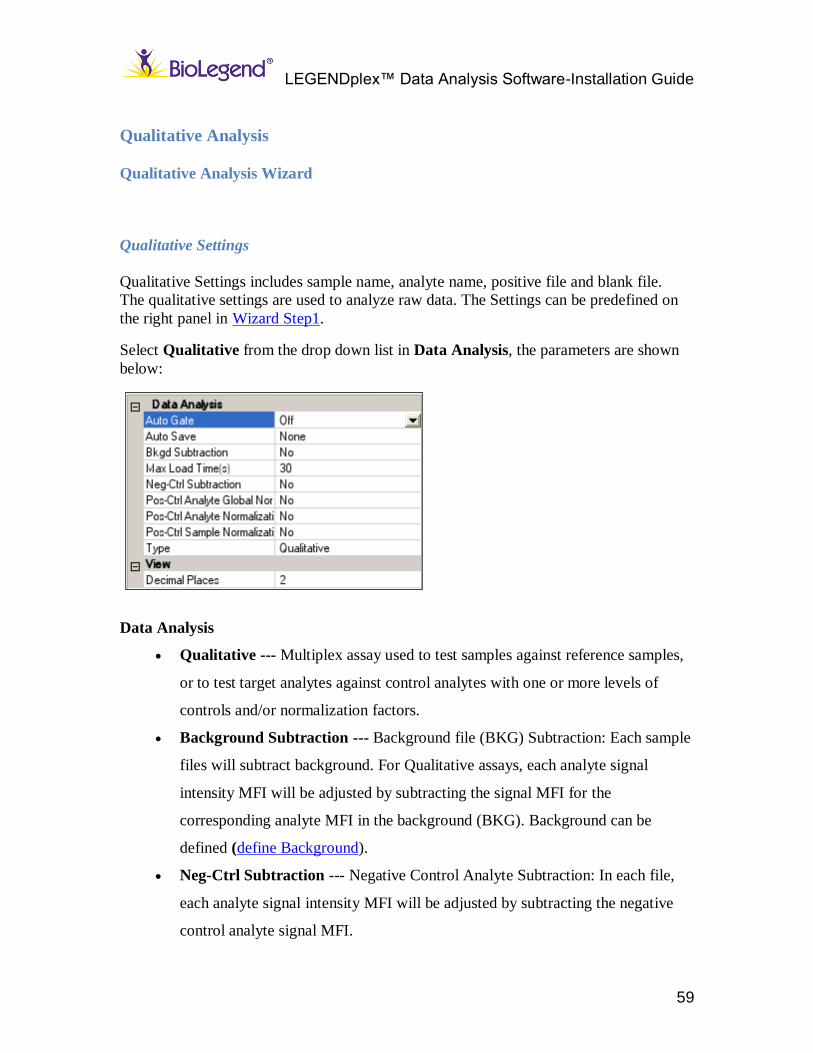
Select Qualitative from the drop down list in Data Analysis, the parameters are shown
below:
Data Analysis
Qualitative --- Multiplex assay used to test samples against reference samples,
or to test target analytes against control analytes with one or more levels of
controls and/or normalization factors.
Background Subtraction --- Background file (BKG) Subtraction: Each sample
files will subtract background. For Qualitative assays, each analyte signal
intensity MFI will be adjusted by subtracting the signal MFI for the
corresponding analyte MFI in the background (BKG). Background can be
defined (define Background).
Neg-Ctrl Subtraction --- Negative Control Analyte Subtraction: In each file,
each analyte signal intensity MFI will be adjusted by subtracting the negative
control analyte signal MFI.
LEGENDplex™ Data Analysis Software-Help
60
You should define some analyses’ Control Type as Negative Control.
Note: Background Subtraction (sample) and Negative Control Subtraction
(analyte) cannot be used at the same time in a single analysis process.
Pos-Ctrl Analyte Global Normalization --- Positive Control Analyte Global
Normalization: In each file, the MFI of the positive control analyte will be
normalized. Each analyte intensity MFI value will be adjusted by multiplying
the normalized positive control value. The normalized positive control value is
derived by dividing the signal MFI of the highest intensity positive control
analyte on the plate by the signal MFI of the positive control analyte.
You should define some analyses’ Control Type as Positive Control.
Pos-Ctrl Analyte Normalization --- Positive Control Analyte Normalization:
Each analyte signal intensity MFI in a file will be normalized to the intensity of
the MFI of the positive control analyte in the same file.
Note: Positive Control Analyte Global Normalization and Positive Control
(Analyte) Normalization cannot be used at the same time in a single
analysis process. You should define some analyses’ Control Type as
Positive Control.
Pos-Ctrl Sample Normalization --- Each sample file can be normalized to the
Pos-Ctrl Sample(s) (POS Well). The analyte signal intensities MFI of each
sample will be normalized to the signal intensity MFI of the corresponding
analyte in the positive control sample file.
You should define some file type as P (Positive).
Auto Gate --- It is recommended that the Auto Gate be set at OFF position.
Auto Save --- Select Auto Save type: (The default setting is None)
o None: Not to save anything after analysis is complete.
o Data: Save the result data in the database after analysis is complete.
o Report: Save the default report in the file folder as raw data after analysis
is complete.
o Both: Save result data and the default report in the file folder as raw data
after analysis is complete.
View
LEGENDplex™ Data Analysis Software-Help
61
Decimal Places --- The decimal places for all numbers in the program.
Related topics:
Wizard Step 1
Wizard Step 2
Wizard Step 3
Quantitative Settings
Wizard Step 1
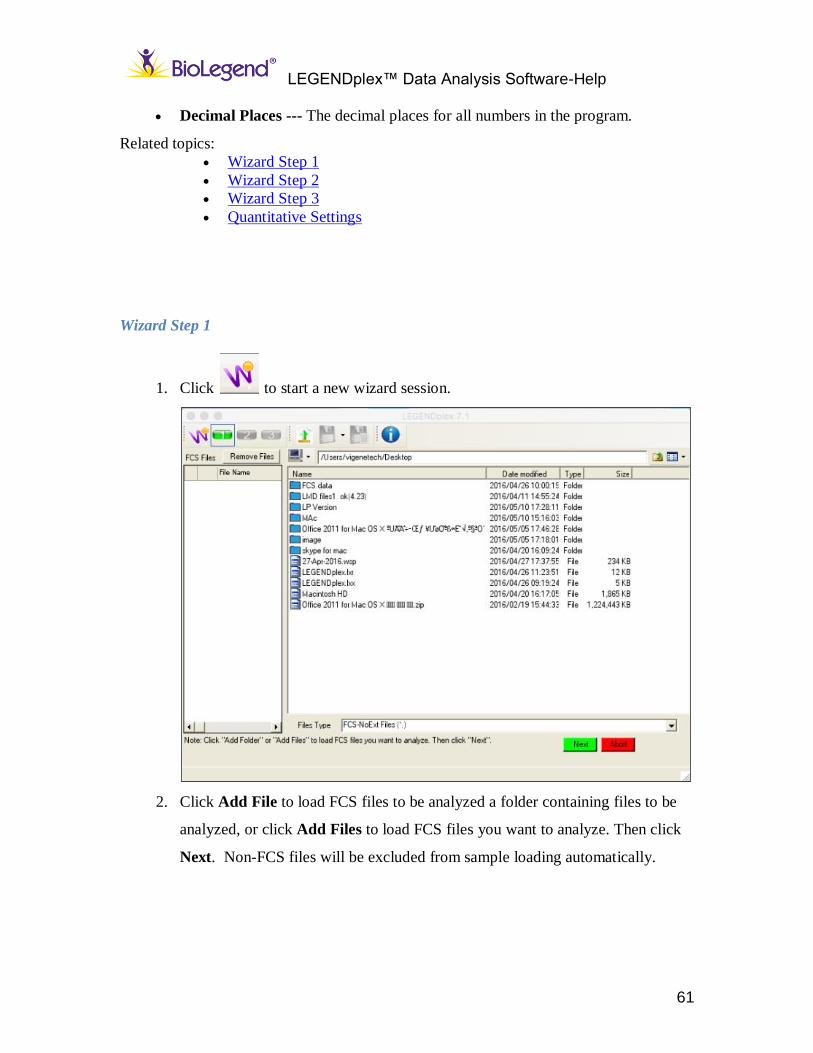
1. Click to start a new wizard session.
2. Click Add File to load FCS files to be analyzed a folder containing files to be
analyzed, or click Add Files to load FCS files you want to analyze. Then click
Next. Non-FCS files will be excluded from sample loading automatically.
LEGENDplex™ Data Analysis Software-Help
62
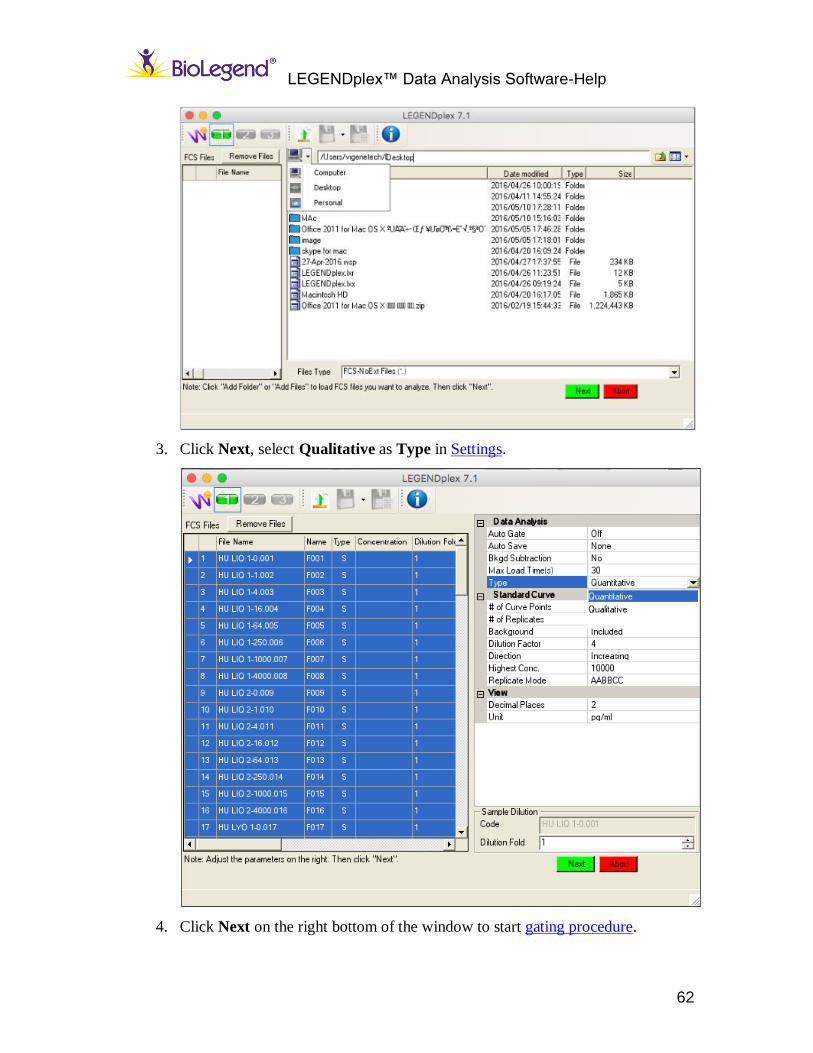
3. Click Next, select Qualitative as Type in Settings.
4. Click Next on the right bottom of the window to start gating procedure.
LEGENDplex™ Data Analysis Software-Help
63
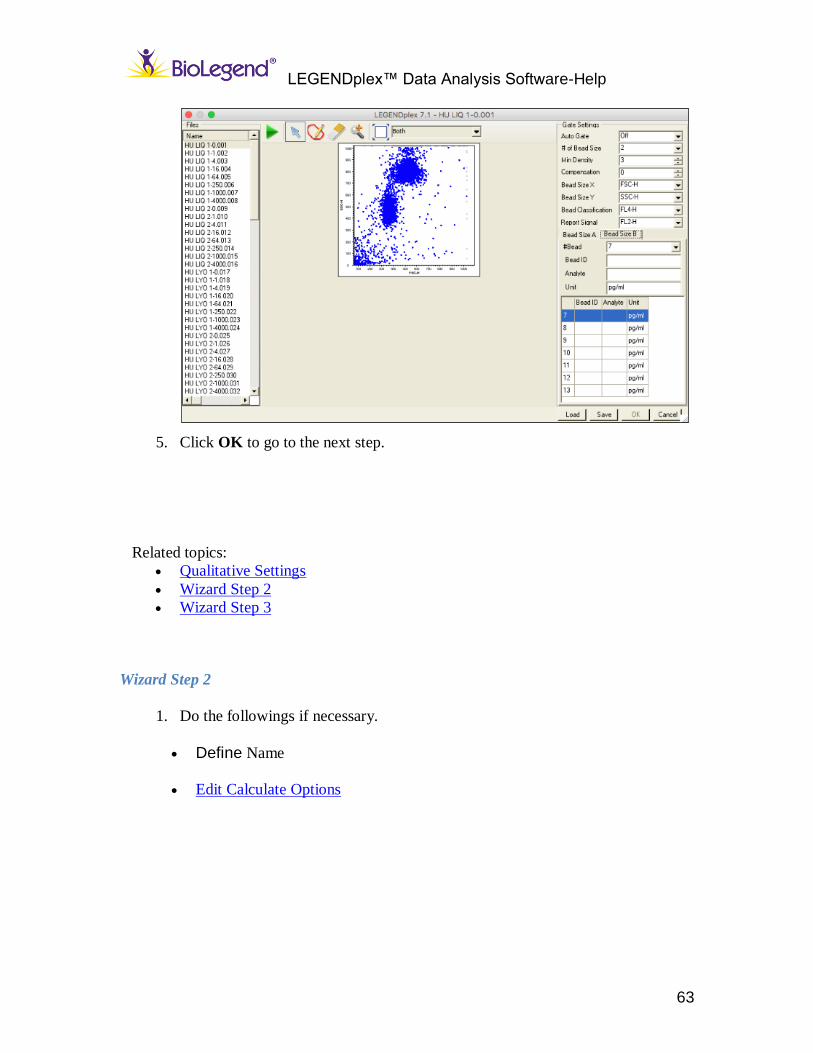
5. Click OK to go to the next step.
Related topics:
Qualitative Settings
Wizard Step 2
Wizard Step 3
Wizard Step 2
1. Do the followings if necessary.
Define Name
Edit Calculate Options
LEGENDplex™ Data Analysis Software-Help
64
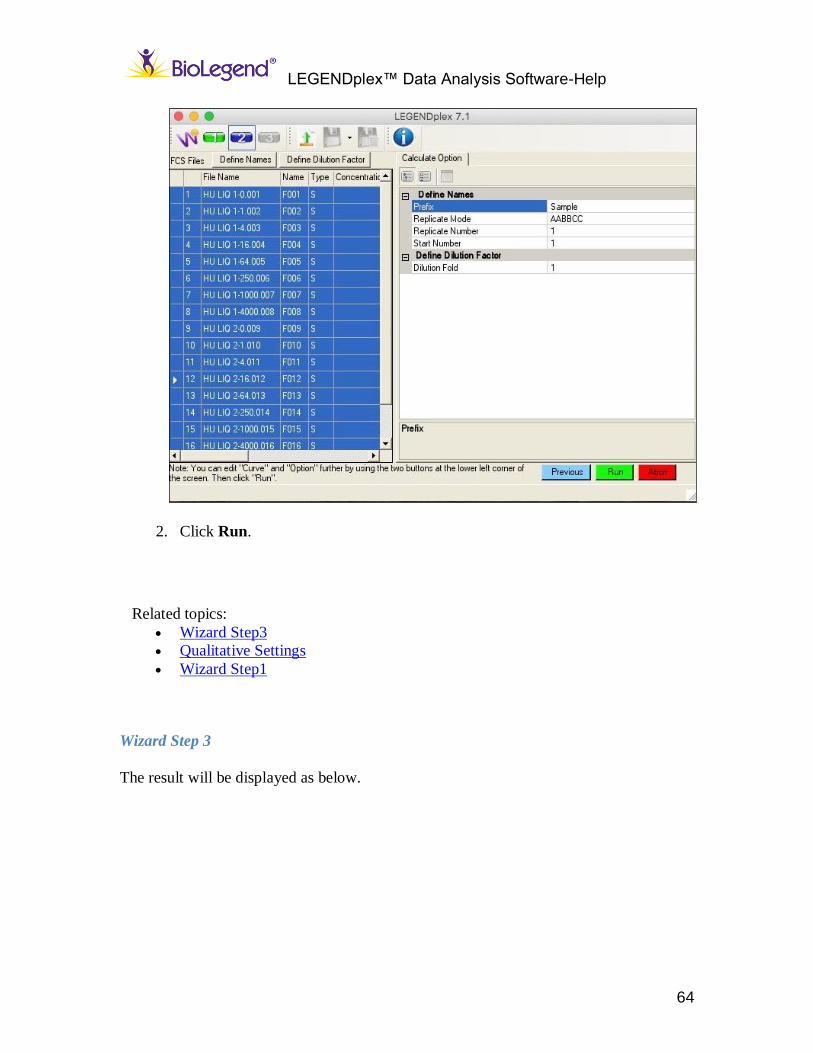
2. Click Run.
Related topics:
Wizard Step3
Qualitative Settings
Wizard Step1
Wizard Step 3
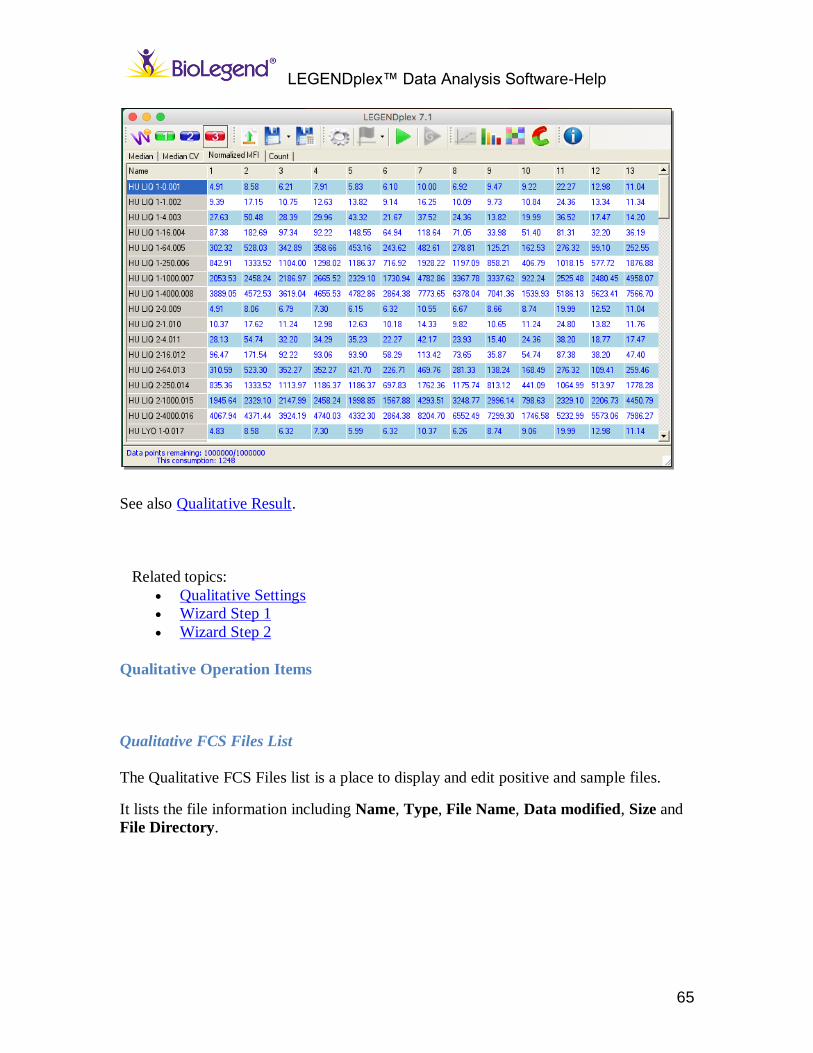
The result will be displayed as below.
LEGENDplex™ Data Analysis Software-Help
65
See also Qualitative Result.
Related topics:
Qualitative Settings
Wizard Step 1
Wizard Step 2
Qualitative Operation Items
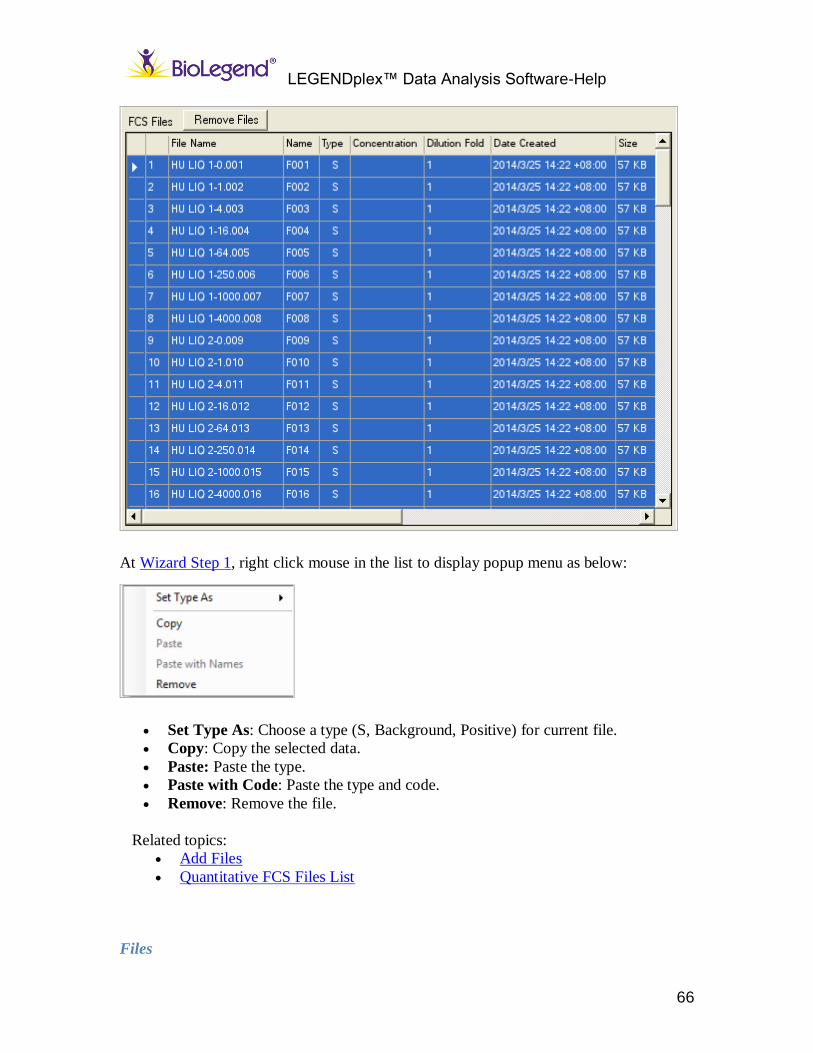
Qualitative FCS Files List
The Qualitative FCS Files list is a place to display and edit positive and sample files.
It lists the file information including Name, Type, File Name, Data modified, Size and
File Directory.
LEGENDplex™ Data Analysis Software-Help
66
At Wizard Step 1, right click mouse in the list to display popup menu as below:
Set Type As: Choose a type (S, Background, Positive) for current file.
Copy: Copy the selected data.
Paste: Paste the type.
Paste with Code: Paste the type and code.
Remove: Remove the file.
Related topics:
Add Files
Quantitative FCS Files List
Files
LEGENDplex™ Data Analysis Software-Help
67
Right after loading FCS files to the FCS Files list, all files are shown by default “S” in
the Type column, indicating they are samples.
There're 4 file types in Qualitative assay: C (Control), S (Sample), B (Background), P
(Positive). These can be converted to each other.
Do the following if necessary:
1. At Wizard Step 1, input a new sample name if necessary. Select a file or multiple files
in the Qualitative FCS Files List, then click Define Names icons to define the
samples' name with series.
2. At Wizard Step 1 and Wizard Step 2, change the sample file type by right clicking in
the Qualitative FCS Files List and then choose a type from Set Type As on the
dropdown list.
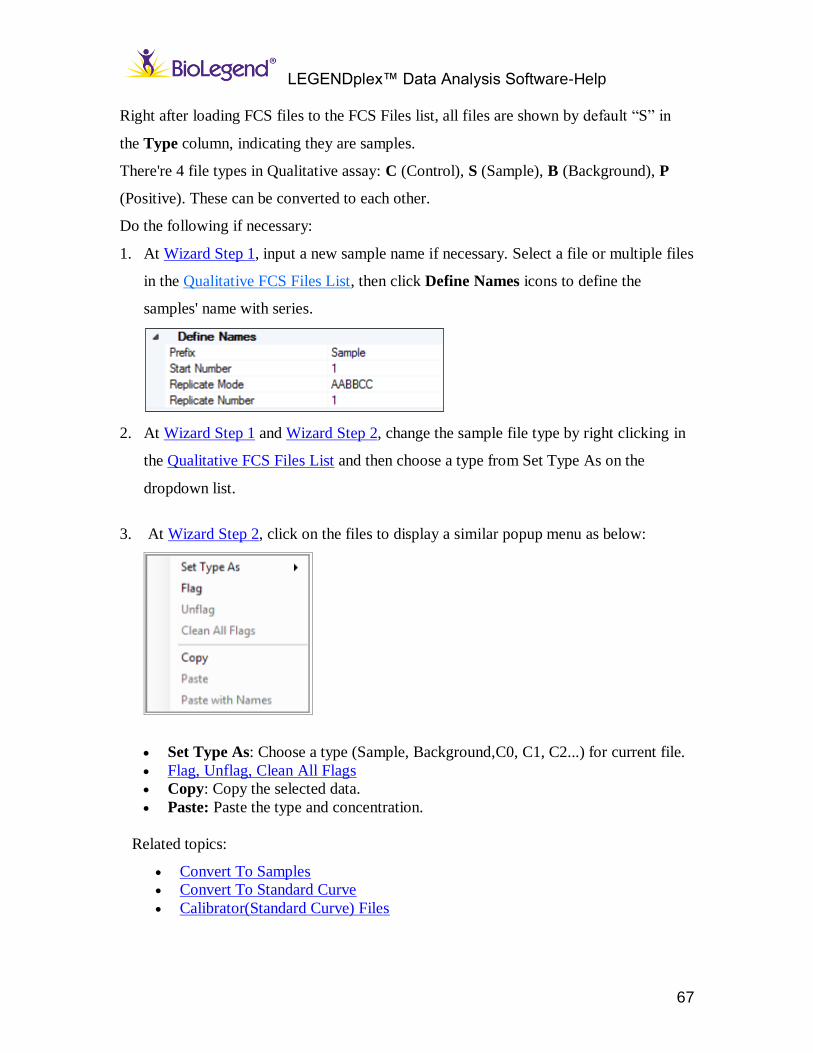
3. At Wizard Step 2, click on the files to display a similar popup menu as below:
Set Type As: Choose a type (Sample, Background,C0, C1, C2...) for current file.
Flag, Unflag, Clean All Flags
Copy: Copy the selected data.
Paste: Paste the type and concentration.
Related topics:
Convert To Samples
Convert To Standard Curve
Calibrator(Standard Curve) Files
LEGENDplex™ Data Analysis Software-Help
68
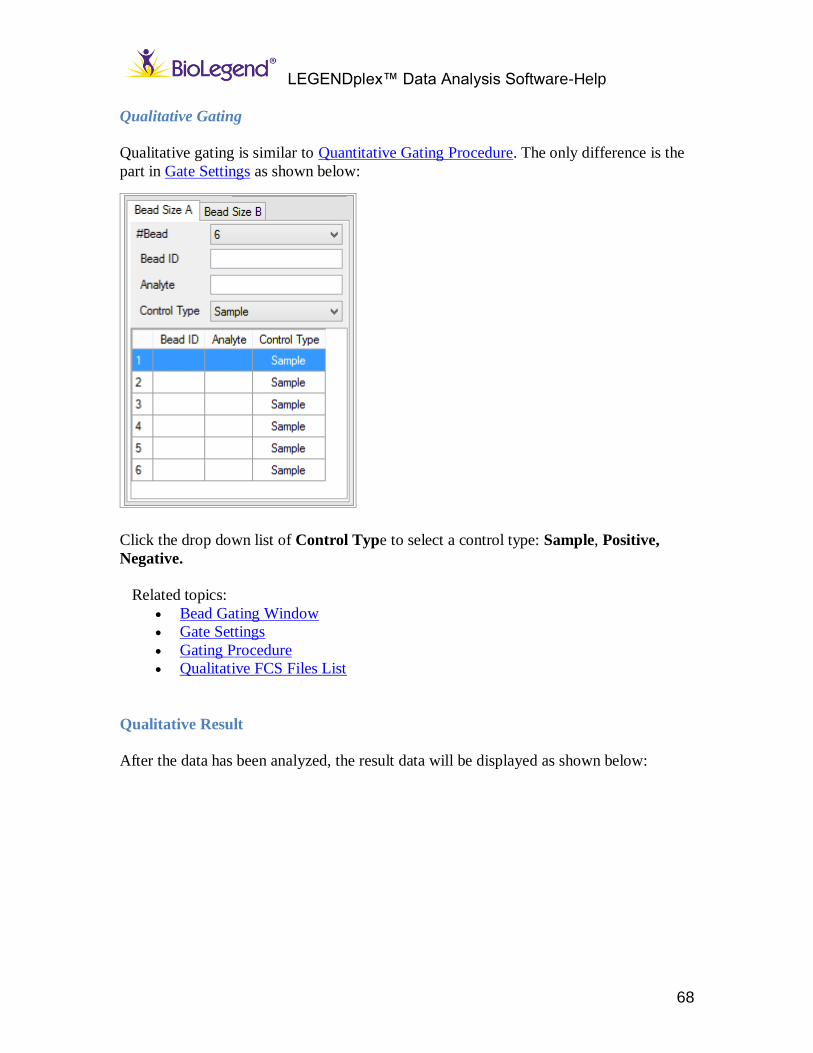
Qualitative Gating
Qualitative gating is similar to Quantitative Gating Procedure. The only difference is the
part in Gate Settings as shown below:
Click the drop down list of Control Type to select a control type: Sample, Positive,
Negative.
Related topics:
Bead Gating Window
Gate Settings
Gating Procedure
Qualitative FCS Files List
Qualitative Result
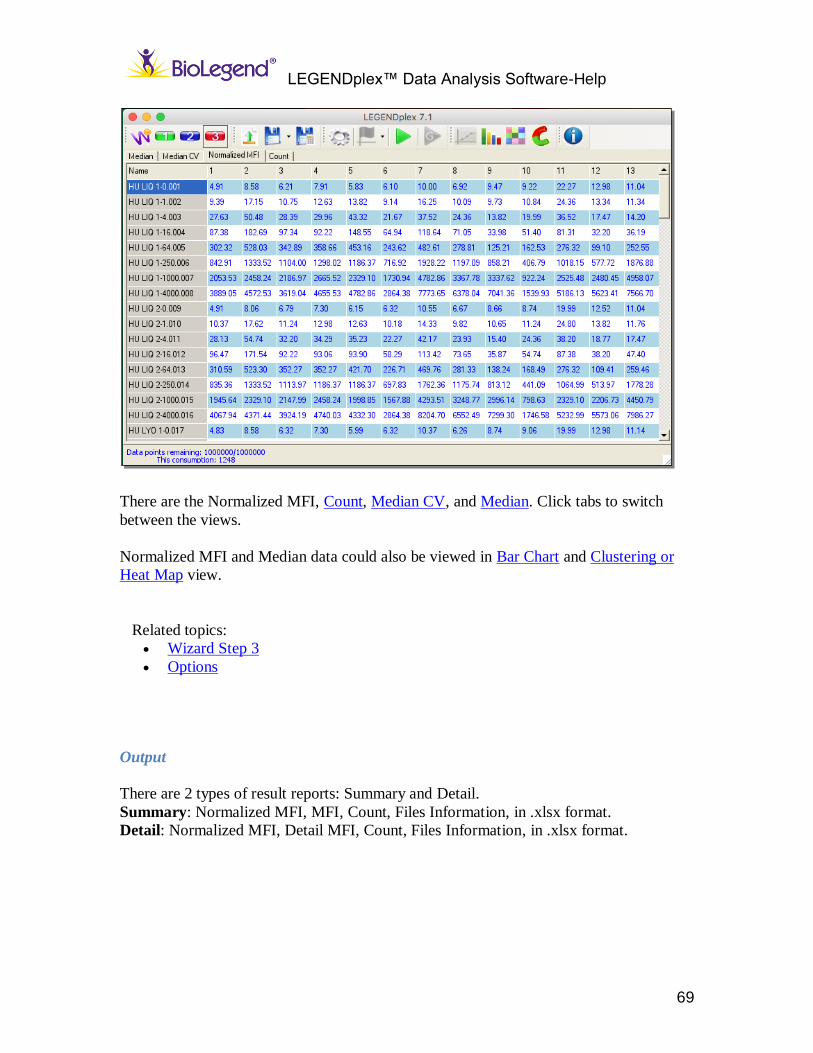
After the data has been analyzed, the result data will be displayed as shown below:
LEGENDplex™ Data Analysis Software-Help
69
There are the Normalized MFI, Count, Median CV, and Median. Click tabs to switch
between the views.
Normalized MFI and Median data could also be viewed in Bar Chart and Clustering or
Heat Map view.
Related topics:
Wizard Step 3
Options
Output
There are 2 types of result reports: Summary and Detail.
Summary: Normalized MFI, MFI, Count, Files Information, in .xlsx format.
Detail: Normalized MFI, Detail MFI, Count, Files Information, in .xlsx format.

LEGENDplex™ Data Analysis Software-Installation Guide
71
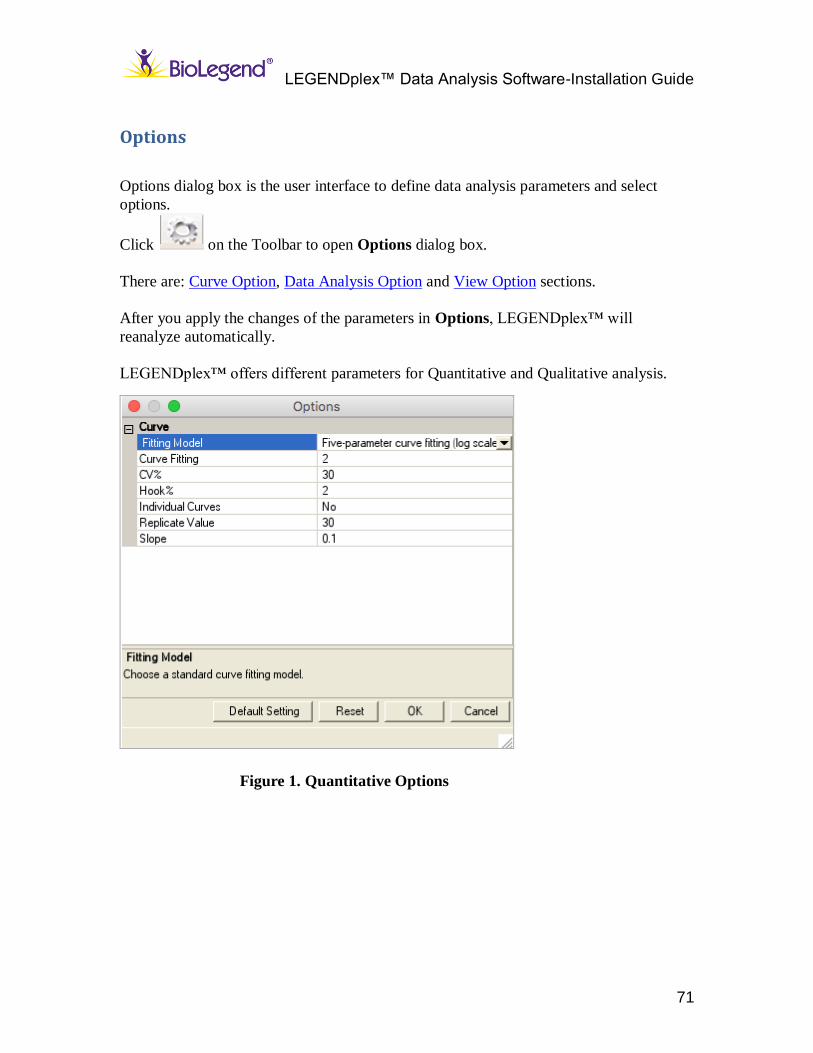
Options
Options dialog box is the user interface to define data analysis parameters and select
options.
Click on the Toolbar to open Options dialog box.
There are: Curve Option, Data Analysis Option and View Option sections.
After you apply the changes of the parameters in Options, LEGENDplex™ will
reanalyze automatically.
LEGENDplex™ offers different parameters for Quantitative and Qualitative analysis.
Figure 1. Quantitative Options
LEGENDplex™ Data Analysis Software-Help
72
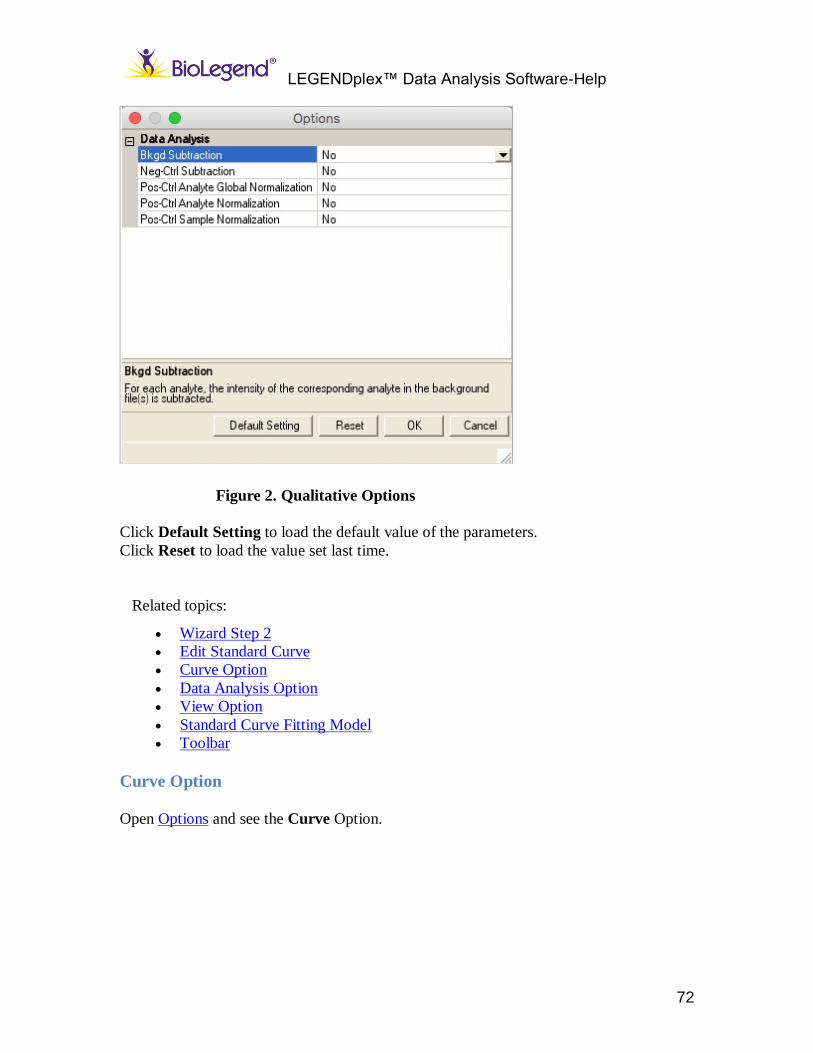
Figure 2. Qualitative Options
Click Default Setting to load the default value of the parameters.
Click Reset to load the value set last time.
Related topics:
Wizard Step 2
Edit Standard Curve
Curve Option
Data Analysis Option
View Option
Standard Curve Fitting Model
Toolbar
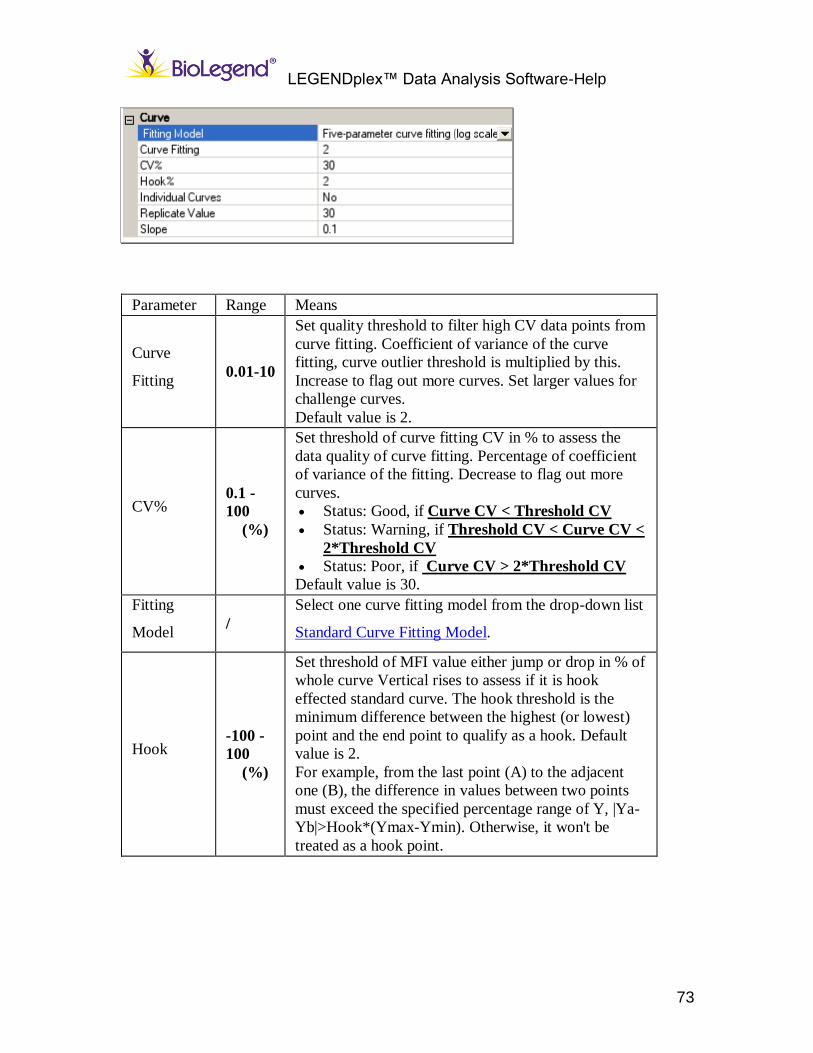
Curve Option
Open Options and see the Curve Option.
LEGENDplex™ Data Analysis Software-Help
73
Parameter Range Means
Curve
Fitting 0.01-10
Set quality threshold to filter high CV data points from
curve fitting. Coefficient of variance of the curve
fitting, curve outlier threshold is multiplied by this.
Increase to flag out more curves. Set larger values for
challenge curves.
Default value is 2.
CV% 0.1 -
100
(%)
Set threshold of curve fitting CV in % to assess the
data quality of curve fitting. Percentage of coefficient
of variance of the fitting. Decrease to flag out more
curves.
Status: Good, if Curve CV < Threshold CV
Status: Warning, if Threshold CV < Curve CV <
2*Threshold CV
Status: Poor, if Curve CV > 2*Threshold CV
Default value is 30.
Fitting
Model /
Select one curve fitting model from the drop-down list
Standard Curve Fitting Model.
Hook -100 -
100
(%)
Set threshold of MFI value either jump or drop in % of
whole curve Vertical rises to assess if it is hook
effected standard curve. The hook threshold is the
minimum difference between the highest (or lowest)
point and the end point to qualify as a hook. Default
value is 2.
For example, from the last point (A) to the adjacent
one (B), the difference in values between two points
must exceed the specified percentage range of Y, |Ya-
Yb|>Hook*(Ymax-Ymin). Otherwise, it won't be
treated as a hook point.
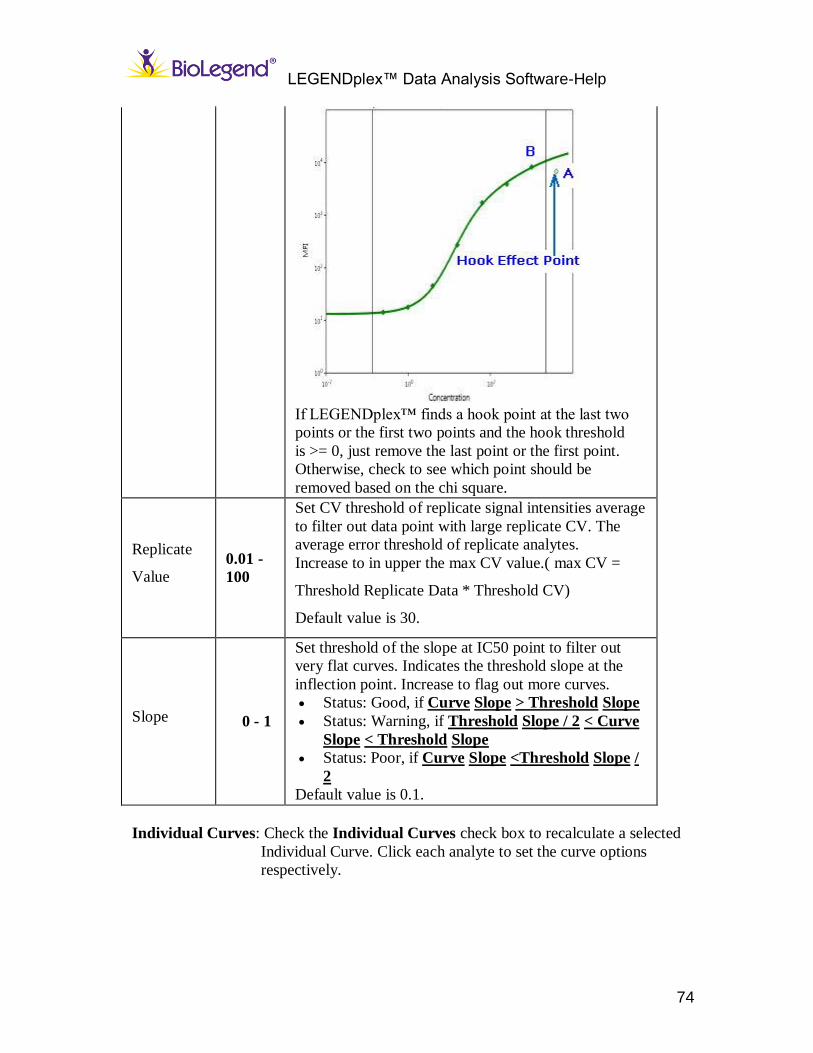
LEGENDplex™ Data Analysis Software-Help
74
If LEGENDplex™ finds a hook point at the last two
points or the first two points and the hook threshold
is >= 0, just remove the last point or the first point.
Otherwise, check to see which point should be
removed based on the chi square.
Replicate
Value 0.01 -
100
Set CV threshold of replicate signal intensities average
to filter out data point with large replicate CV. The
average error threshold of replicate analytes.
Increase to in upper the max CV value.( max CV =
Threshold Replicate Data * Threshold CV)
Default value is 30.
Slope 0 - 1
Set threshold of the slope at IC50 point to filter out
very flat curves. Indicates the threshold slope at the
inflection point. Increase to flag out more curves.
Status: Good, if Curve Slope > Threshold Slope
Status: Warning, if Threshold Slope / 2 < Curve
Slope < Threshold Slope
Status: Poor, if Curve Slope <Threshold Slope /
2
Default value is 0.1.
Individual Curves: Check the Individual Curves check box to recalculate a selected
Individual Curve. Click each analyte to set the curve options
respectively.
LEGENDplex™ Data Analysis Software-Help
75
Related topics:
Wizard Step 2
Edit Standard Curve
Data Analysis Option
View Option
Standard Curve Fitting Model
Toolbar
Flag Data
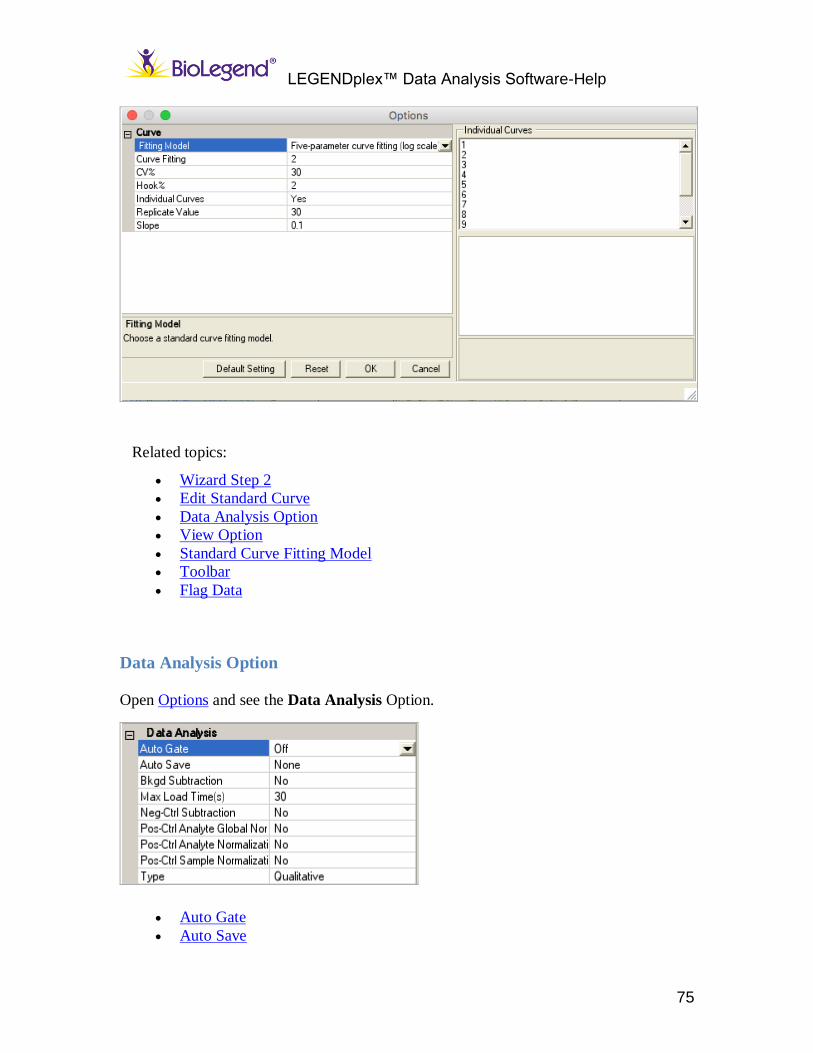
Data Analysis Option
Open Options and see the Data Analysis Option.
Auto Gate
Auto Save
LEGENDplex™ Data Analysis Software-Help
76
Background Subtraction
Neg-Ctrl Subtraction
Pos-Ctrl Analyte Global Normalization
Pos-Ctrl Analyte Normalization
Pos-Ctrl Sample Normalization
View Option
Open Options to see the View Option.
Decimal Places --- Define the decimal places displayed in the program.
Related topics:
Wizard Step 2
Edit Standard Curve
Curve Option
Data Analysis Option
Standard Curve Fitting Model
Toolbar
Median
Quantitative Result
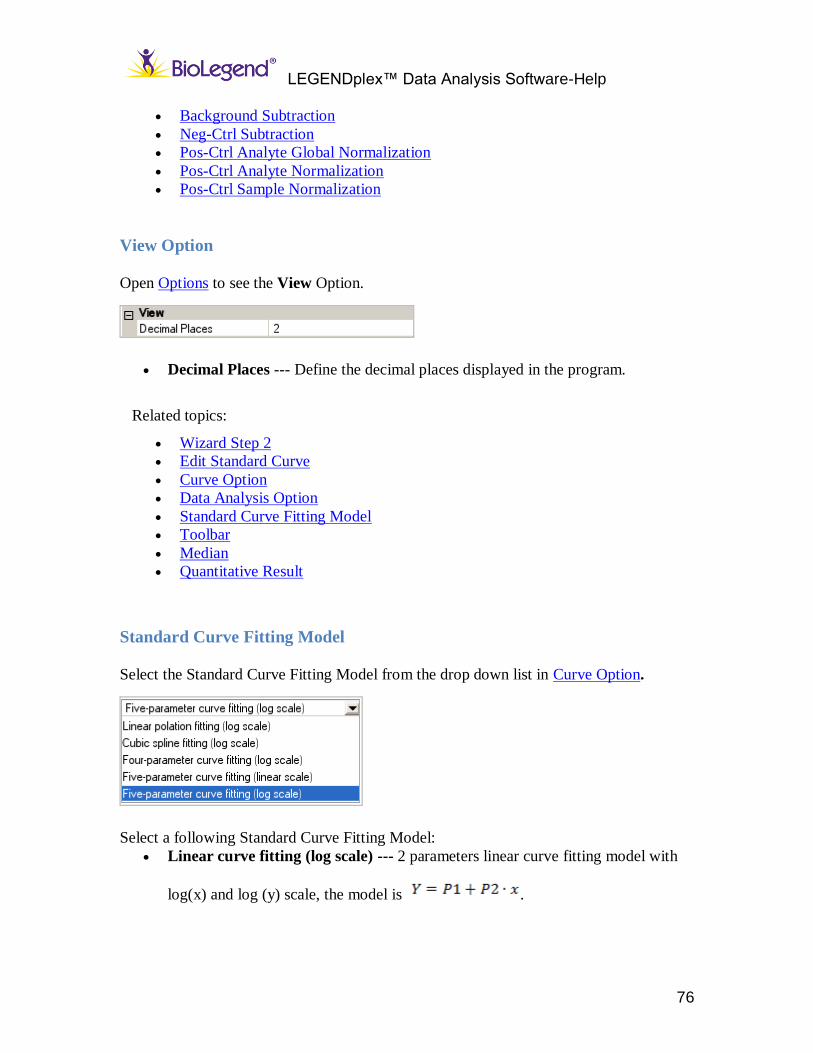
Standard Curve Fitting Model
Select the Standard Curve Fitting Model from the drop down list in Curve Option.
Select a following Standard Curve Fitting Model:
Linear curve fitting (log scale) --- 2 parameters linear curve fitting model with
log(x) and log (y) scale, the model is .
LEGENDplex™ Data Analysis Software-Help
77
Cubic spline fitting (log scale) --- 3 parameters cubic spline curve fitting model
with log(x) and log(y) scale.
Four-parameter curve fitting (log scale) --- 4 parameters non logistic curve
fitting model with log(x) and log (y) scale.
Five-parameter curve fitting (linear scale) --- 5 parameters logistic curve fitting
model with log(x) and y linear scale.
Five-parameter curve fitting (log scale) --- 5 parameters logistic curve fitting
model with log(x) and log (y) scale.
Related topics:
Options
Curve Option
Edit Standard Curve Dialog Box
Set Standard Curve
Set Standard Curve Manually

LEGENDplex™ Data Analysis Software-Installation Guide
79
Index
.
.blpx 11
A Add fcs files 29
B Bar Chart 52
C Clustering Options 55 Clustering or Heat Map 54 Concentration 49 Count 51
E edit standard curve dialog box 28
M Median 50 Median CV 50
O Open files 29
Q Qualitative Bead Gating 68 Qualitative FCS Files list 65 Qualitative Settings 58 Qualitative Wizard Step 1 60 Qualitative Wizard Step 2 63 Qualitative Wizard Step 3 64
Quantitative Bead Gating 44 Quantitative FCS Files list 26 Quantitative Settings 13 Quantitative Wizard Step 1 17 Quantitative Wizard Step 2 23 Quantitative Wizard Step 3 25
R Ribbons and Tabs 9
S Select files 29 Standard Curve 52 status file 11