Embed Size (px)
Citation preview

8/8/2019 LectureSlides_Chp6
http://slidepdf.com/reader/full/lectureslideschp6 1/24
Chp. 6 1
Potential GDP
Potential GDP is the value of real GDP when all
the economy¶s factor s of production are fully
employed.
Our changing standard of living is captured by
1. The growth of potential GDP per per son
2. Fluctuations of real GDP per per son aroundpotential GDP
Chapter 6
Jobs and Unemployment

8/8/2019 LectureSlides_Chp6
http://slidepdf.com/reader/full/lectureslideschp6 2/24
Chp. 6 2

8/8/2019 LectureSlides_Chp6
http://slidepdf.com/reader/full/lectureslideschp6 3/24
Chp. 6 3
Business Cycle
Fluctuation
s in the pace of econom
ic act
ivity
is called the business cycle.
The business cycle is a per iodic irregular up-
and down movement of total production and
other measure of economic activity.

8/8/2019 LectureSlides_Chp6
http://slidepdf.com/reader/full/lectureslideschp6 4/24
Chp. 6 4
Business Cycle
The four stages of a business cycle are expansion,
recession, peak, and trough.
Increases in overall economic activity; often
identif ied as increases in real GDP is called an
expansion. ³Peak´ is the highpoint in a business cycle.
Decreases in overall economic activity; often
identif ied as reductions in real GDP is called a
recession. ³Trough´ is a low-point in a business cycle.

8/8/2019 LectureSlides_Chp6
http://slidepdf.com/reader/full/lectureslideschp6 5/24
Chp. 6 5
Source: research.stlouisfed.org

8/8/2019 LectureSlides_Chp6
http://slidepdf.com/reader/full/lectureslideschp6 6/24
Chp. 6 6
Current Population Survey
Divide
sthe populat
ion
into
w orking-age popu lation and other s
± W orking-age popu lation is the total number of
people aged 16 year s and over who are not in a
jail, ho
spital, or
some other form of
institut
ionalcare or in the U.S. Armed Forces.
Divides the working-age population into those in
the labor force and those not in the labor
force ± Labor force is the number of people employed
plus the number unemployed.
8/8/2019 LectureSlides_Chp6
http://slidepdf.com/reader/full/lectureslideschp6 7/24
Chp. 6 7
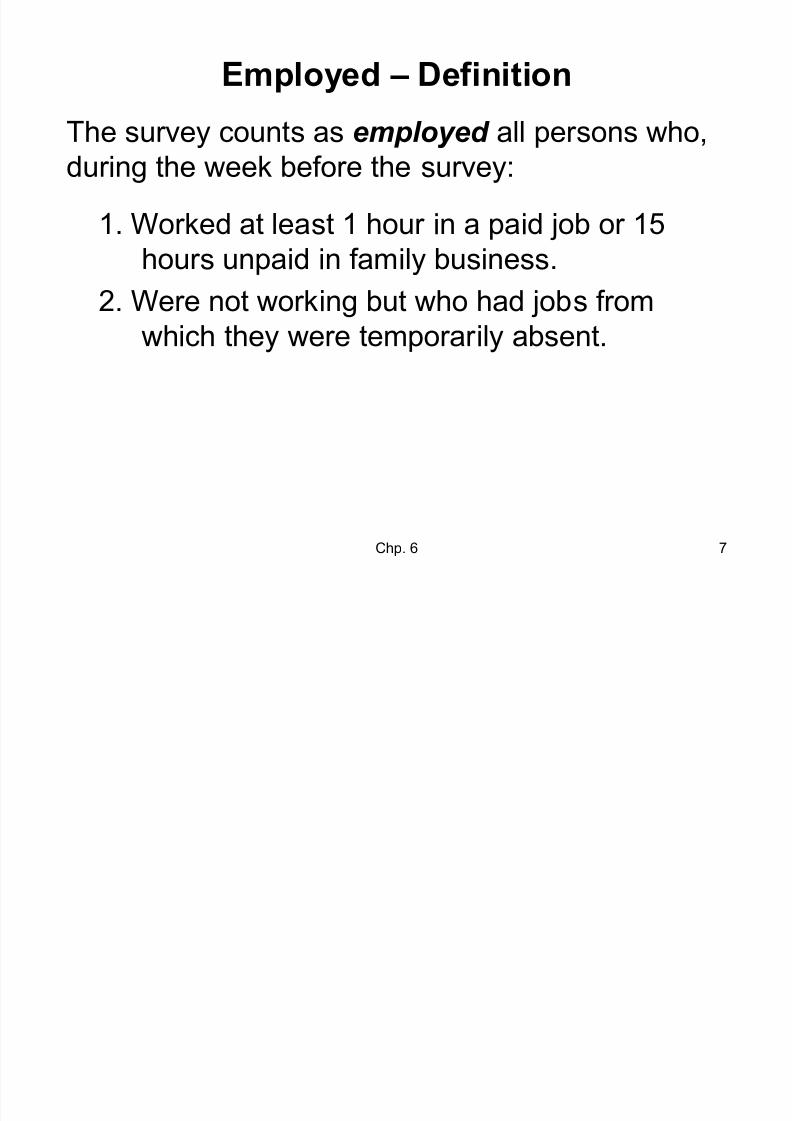
Employed ± Definition
The survey counts as employed all per sons who,dur ing the week before the survey:
1. Worked at least 1 hour in a paid job or 15
hour s unpaid in family business.
2. Were not working but who had jobs from
which they were temporar ily absent.

8/8/2019 LectureSlides_Chp6
http://slidepdf.com/reader/full/lectureslideschp6 8/24
Chp. 6 8
Unemployed ± Definition
The survey counts as u nemployed all per sons who, dur ing the week before the survey:
1. Had no employment
2. Were available for work,
and either:
1. Had made efforts to f ind employment dur ing
the previous four weeks, or
2. Were waiting to be recalled to a job from
which they had been laid off.
8/8/2019 LectureSlides_Chp6
http://slidepdf.com/reader/full/lectureslideschp6 9/24
Chp. 6 9
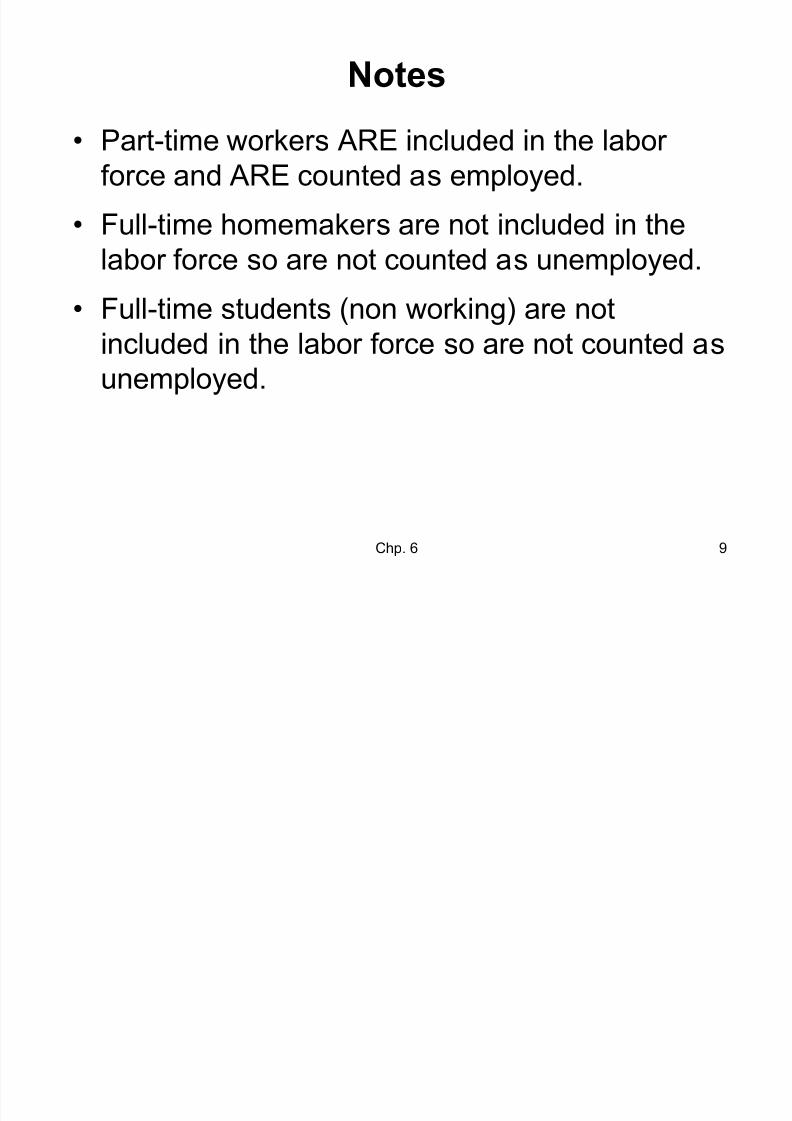
Notes
Part-time worker s ARE included in the labor force and ARE counted as employed.
Full-time homemaker s are not included in the
labor force so are not counted as unemployed.
Full-time students (non working) are not
included in the labor force so are not counted as
unemployed.

8/8/2019 LectureSlides_Chp6
http://slidepdf.com/reader/full/lectureslideschp6 10/24
Chp. 6 10
Date: June 2009

8/8/2019 LectureSlides_Chp6
http://slidepdf.com/reader/full/lectureslideschp6 11/24
Chp. 6 11
Main Labor Market Indicators
The unemployment rate
The labor force participation rate
8/8/2019 LectureSlides_Chp6
http://slidepdf.com/reader/full/lectureslideschp6 12/24
Chp. 6 12
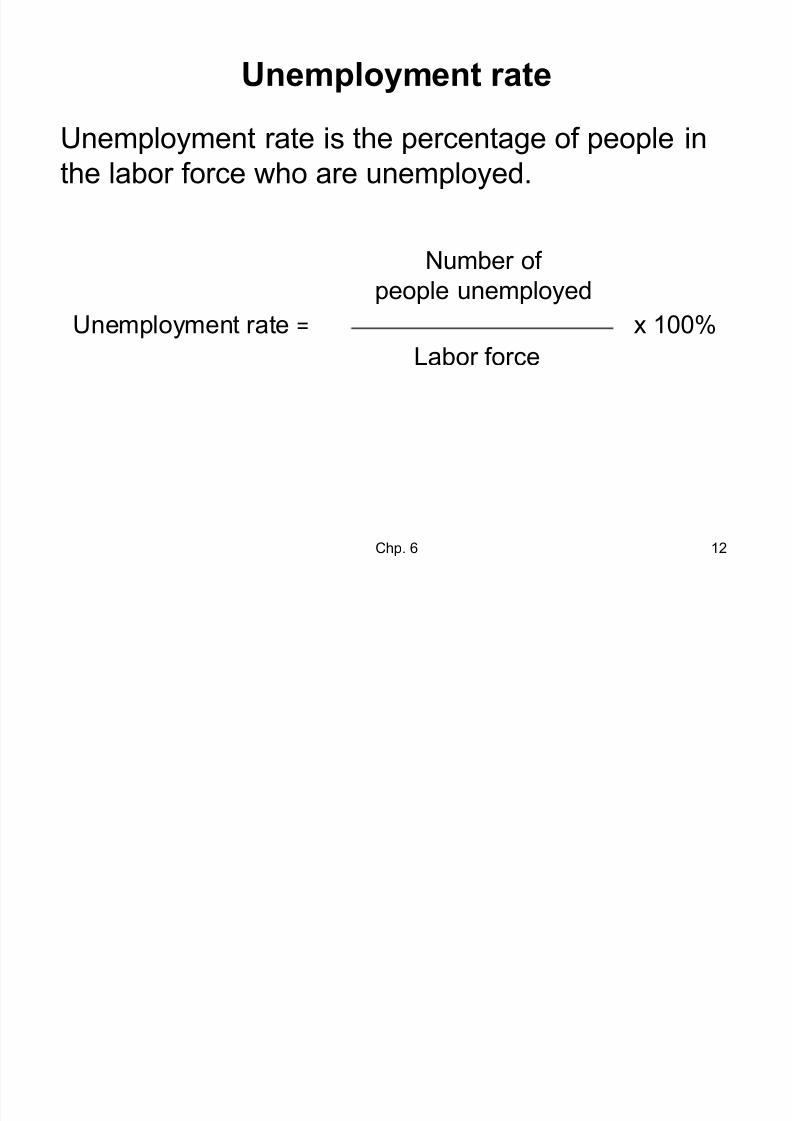
Unemployment rate
Unemployment rate is the percentage of people inthe labor force who are unemployed.
Unemployment rate =
Number of
people unemployed
x 100%
Labor force

8/8/2019 LectureSlides_Chp6
http://slidepdf.com/reader/full/lectureslideschp6 13/24
Chp. 6 13
The unemployment rate increases in recessions and
decreases in expansions.

8/8/2019 LectureSlides_Chp6
http://slidepdf.com/reader/full/lectureslideschp6 14/24
Chp. 6 14
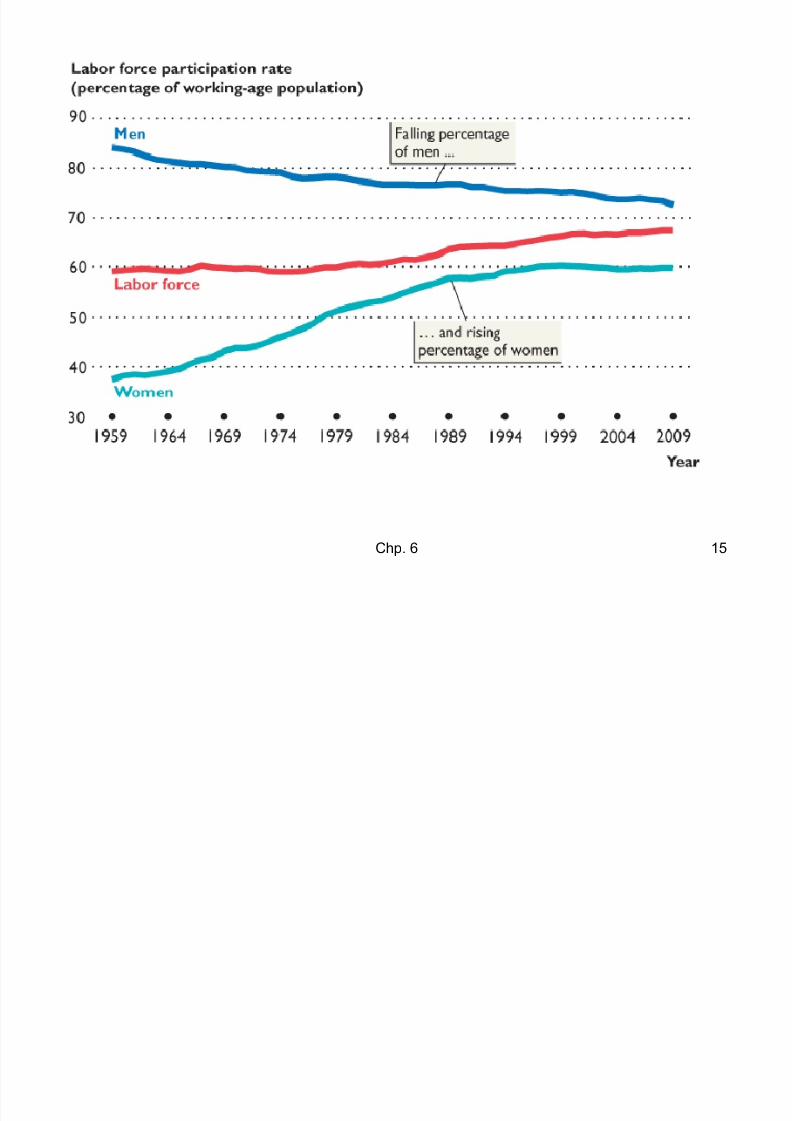
Labor force participation rate
Labor force participation rate is the percentage of the working-age population who are member s of
the labor force.
Labor force
participation rate =Working-age population
x 100%Labor force
8/8/2019 LectureSlides_Chp6
http://slidepdf.com/reader/full/lectureslideschp6 15/24
Chp. 6 15

8/8/2019 LectureSlides_Chp6
http://slidepdf.com/reader/full/lectureslideschp6 16/24
Chp. 6 16
Sources of Unemployment
People who become unemployed are J ob loser s (f ires and layoff s)²people who are
laid off from their jobs
J ob
leaver s (qu
its)²people who voluntar
ily qu
ittheir jobs
Entrant s and reentrant s²people who have just
left school or who are now looking for a job after
a per iod out of the labor force.

8/8/2019 LectureSlides_Chp6
http://slidepdf.com/reader/full/lectureslideschp6 17/24
Chp. 6 17

8/8/2019 LectureSlides_Chp6
http://slidepdf.com/reader/full/lectureslideschp6 18/24
Chp. 6 18
Mar ginally Attached Workers and
Discouraged Workers
A marginally attached w orker is a per son whodoes not have a job, is available and willing towork, has not made specif ic efforts to f ind a jobwithin the previous four weeks, but has lookedfor work sometime in the recent past.
A di scou raged w orker is a marginallyattached worker who has not made specif icefforts to f ind a job within the previous four weeks because previous unsuccessful attempts were discouraging.
They are NOT included in the labor force andhence NOT off icially counted as unemployed

8/8/2019 LectureSlides_Chp6
http://slidepdf.com/reader/full/lectureslideschp6 19/24
Chp. 6 19
Types of Unemployment
S easonal u nemployment is the
unemployment that ar ises because of
seasonal nature of some jobs.
Examples: agr icultural jobs, tour ism jobs.
Frictional u nemployment is theunemployment that ar ises from normal labor
turnover²from people enter ing and leaving
the labor force and from the ongoing creation
and destruction of jobs.Examples: Quits or f ires due to matching problems
between employer and employee; New entrants (or re-
entrants) searching for a job.

8/8/2019 LectureSlides_Chp6
http://slidepdf.com/reader/full/lectureslideschp6 20/24
Chp. 6 20
Types of Unemployment
S tr u ct u ral u nemployment is theunemployment that ar ises due to change of location of jobs or change in the requirement of skills needed to perform jobs (due to a changein technology).
Cyclical u nemployment is the fluctuatingunemployment over the business cycle thatincreases dur ing a recession (due to f ires andlayoff s) and decreases dur ing an expansion.
8/8/2019 LectureSlides_Chp6
http://slidepdf.com/reader/full/lectureslideschp6 21/24
Chp. 6 21
Full Employment
F u ll employment occur s when there is no
cyclical unemployment or, equivalently, when all
the unemployment is fr ictional, structural, or
seasonal.
± Note: Th is does NOT imply a zero unemployment
rate
Nat u ral u nemployment rate is the
unemployment rate when the economy is at full
employment.

8/8/2019 LectureSlides_Chp6
http://slidepdf.com/reader/full/lectureslideschp6 22/24
Chp. 6 22
Potential GDP
Potential GDP (³f u ll employment´ GDP) is the
level of real GDP that the economy would
produce if it were at full employment.
It can be thought of as the capacity level of the
economy, the level of real GDP that theeconomy is capable of producing on a
sustained basis.

8/8/2019 LectureSlides_Chp6
http://slidepdf.com/reader/full/lectureslideschp6 23/24
Chp. 6 23
Unemployment and Real GDP
Because the unemployment rate fluctuates
around the natural unemployment rate, real GDP
fluctuates around potential GDP.
When the unemployment rate is above the
natural rate, real GDP is below potential GDP. When the unemployment rate is below the
natural unemployment rate, real GDP is above
potential GDP.

8/8/2019 LectureSlides_Chp6
http://slidepdf.com/reader/full/lectureslideschp6 24/24
Chp. 6 24


