Embed Size (px)
Citation preview

Lectures 9-10. Latin America and the former Soviet Union:
Searching for New Development Paradigm and Fallout from
Development?

Russia: drifting to the Third World• “[F]or the first time in recent world history
one of the major industrial nations with a highly educated society has dismantled the results of several decades of economic development – however tortuous, costly, and often misdirected it may have been – and slipped into the ranks of countries that are conventionally categorized as ‘Third World’.” [Reddaway P., Glinski D., The Tragedy of Russia’s Reforms: Market Bolshevism against Democracy. Washington, D.C.: United States Institute of Peace Press, 2001, p. 3].
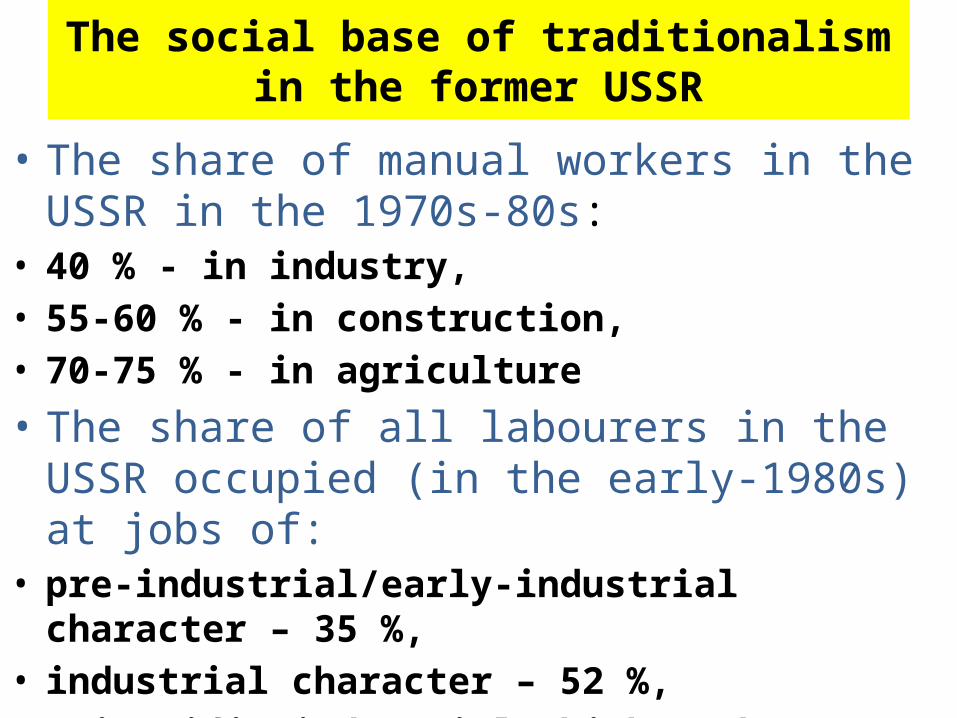
The social base of traditionalism in the former USSR
• The share of manual workers in the USSR in the 1970s-80s:
• 40 % - in industry, • 55-60 % - in construction,• 70-75 % - in agriculture
• The share of all labourers in the USSR occupied (in the early-1980s) at jobs of:
• pre-industrial/early-industrial character – 35 %,• industrial character – 52 %,• Scientific-industrial (high-tech) character – 13 %

Adam Smith as the main enemy of Russian liberal economists
“Every man, as long as he does not violate the laws of justice (my italics – V.K.), is left perfectly free to pursue his own interest his own way, and to bring his industry and capital into competition with those of any other man, or order of men.” [Smith A. An Inquiry into the Nature and Causes of the Wealth of Nations. Vol. II. Oxford: Clarendon Press, 1976, p. 687].

Social actors of market fundamentalism
• The former USSR/ Russia:• - the ruling nomenklatura (cratocracy)• - actors of shadow economy• - self-employed people and independent entrepreneurs
• Latin American countries• - bourgeoisie affiliated with TNCs• - old but modified trade-agrarian oligarchy• financial and bond market agents• - self-employed and people of ‘informal sector’ of economy

The portrait of the Russian ruling classSenhor Gato Gatuno

The Corruption Perception Index in Argentina, Brazil, and Russia, 2002-2010
COUNTRIES/YEARS I N D E X Position in the world
2002 2005 2008 2010 2002 2005 2008 2010
BRAZIL 4.0 3.7 3.5 3.7 45-49 62-63 80-84 69
MEDIAN COUNTRY *) 3.8 3.2 3.4 3.3 51 80 90 89
ARGENTINA 2.8 2.8 2.9 2.9 70 97-102
109-114
105
RUSSIA 2.7 2.4 2.1 2.1 71-76 126-129
147-150
154
• *) 2002 – Croatia;• 2005 – China, Senegal, Surinam, Morocco, Sri Lanka;• 2008 – Albania, India, Madagascar, Montenegro, Panama, Senegal,
Serbia;• 2010 – Albania, India, Jamaica, Liberia.• The total number of observed countries: 2002 – 102; 2005 – 159;
2008 – 180; 2010 – 178.

Dynamics of GDP (light blue lines) and GDP per capita (yellow lines) in Argentina, Brazil and Russia, 1990-2008, 1990=100
per cent
1990 1992 1995 1997 2000 2002 2005 2007 2008
Argentina
100 119.8 133.0 150.5 149.7 129.0 167.1 197.0 210.4
100 116.6 124.4 137.1 131.2 109.2 137.4 158.8 168.0
Brazil
100 100.7 116.4 123.4 129.7 134.2 148.0 162.7 172.3
100 97.6 108.6 111.3 112.4 113.3 119.8 128.2 134.0
Russia
100 81.2 62.1 60.6 67.2 74.0 90.5 105.1 112.5
100 81.3 62.6 61.1 68.1 75.7 94.0 109.8
117.9

De-industrialisation of Russia
Output of tractors, thousands/year
47,0
92,6
6,9 7,7
0,0
10,0
20,0
30,0
40,0
50,0
60,0
70,0
80,0
90,0
100,0
• 1970 1990 2000 2007

De-industrialisation of Russia
Output of machine-tools & equipment, thousands/year
119,0
74,2
8,9 5,1
0,0
20,0
40,0
60,0
80,0
100,0
120,0
140,0
• 1970 1990 2000 2007

Post-crisis recuperation of the Russian industry – the volume of production in December 2010 in ratio to October 2008 (=100 %)
Gas and petroleum industry
Chemical industry
Electrical, electronic and optical equipment and devices
Output of machines and equipment
Output of transport vehicles andcarrier equipment
103.2
110.1
91.4
88.5
88.0

The structure of Russian exports before the crisis of 2008-09
Exportation of Russia, 2007, billion US$
1; 41,4; 12%
2; 73,2; 21%
3; 237,4; 67%
1 2 3
• 1 – manufactured goods• 2 – semi-manufactured goods• 3 – primary goods (fuel, raw materials, etc.)

Population of Russia, mln.
• 1970 1980 1990 2000 2005 2007• Source: Russian Statistical Yearbook 2008, p.31
130,6
138,8
148,3146,3
142,8 142,0
120,0
125,0
130,0
135,0
140,0
145,0
150,0

Life expectancy at birth, 1965-2010, years
1965-66
1975-76
1985-86 1990 1995 2000 2005 2010
Argentina 66,0 68,7 71,0 71,0 72,6 73,4 74,8 75,7
Brazil 58,4 62,2 64,9 65,6 66,6 67,7 71,7 72,9
Guatemala 50,1 56,4 59,7 63,4 64,2 64,8 69,7 70,8
Russia 69,5 68,1 69,3 69,2 64,6 65,3 65,3 67,2

Poverty in Russia before the crisis, 1990-2007
• 1990 1992 1995 2000 2002 2005 2007
The rate of poverty (the share of poor in the total population, %%)
7,0
33,5
24,8
29,0
24,6
17,7
13,4
0,0
5,0
10,0
15,0
20,0
25,0
30,0
35,0
40,0

The social-economic differentiation in Russia: deciles coefficient
4,0
13,5 13,9 14,015,2
16,8
0,0
2,0
4,0
6,0
8,0
10,0
12,0
14,0
16,0
18,0
• 1990 1995 2000 2002 2005 2007• Source: Russian Statistical Yearbook 2008, p.186

“Gazprom”: Exceeding le Château des Versailles

The palace that is nobody’s property (on the bench of Black Sea)
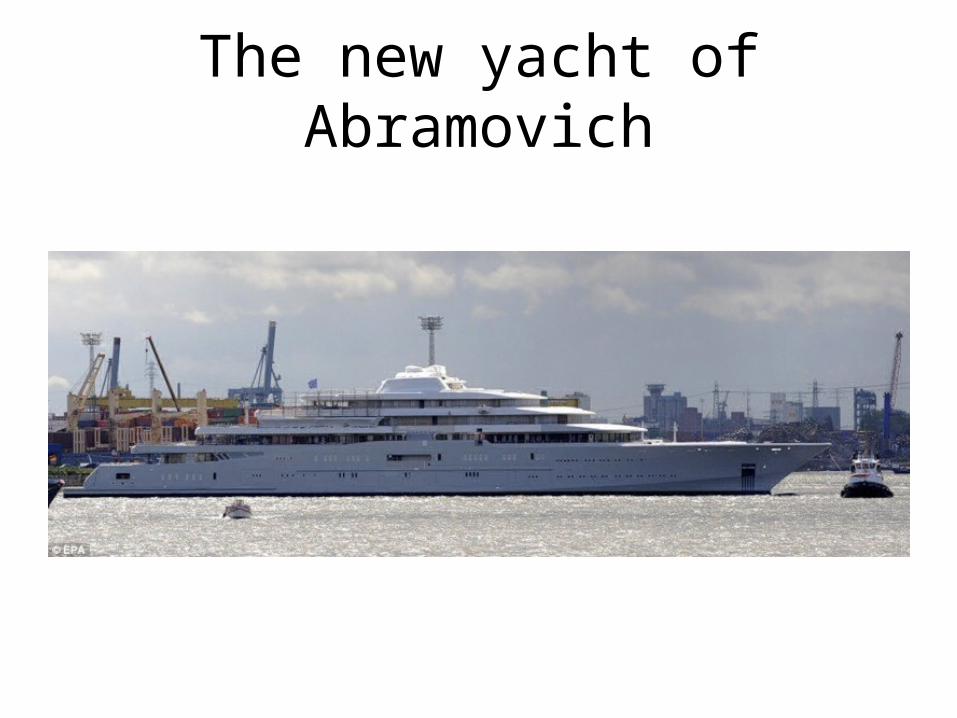
The new yacht of Abramovich

The new yacht of Abramovich
• - length: 170 m• - helicopter deck• - the system of anti-radiation defence (for the
case of nuclear war)• - submarines’ convoy• - the total costs of this “toy” – 340 mln. €