Embed Size (px)
Citation preview

College of Education
School of Continuing and Distance Education 2014/2015 – 2016/2017
Lecturers: Dr. Monica Lambon-Quayefio Dr. Nkechi S. Owoo Dr. William Bekoe
Session Overview
After learning about the measures of national income, we have to be able to interpret what these measures mean. This session provides an understanding into the interpretation economists give to these measures. It also introduces students to very useful concepts that are employed in analyzing the performance of an economy.
Slide 2
Session Overview: Objectives
• At the end of the session, the student will • Be able to define and provide interpretation of the concepts used in
national income measures. • Be able to clearly differentiate between Gross Domestic Product
and Gross National Product • Be able to explain the difference between Gross Domestic Product
and Net Domestic Product as used in the national income accounting.
• Be able to distinguish between market prices and factor cost • Be able to distinguish between Nominal GDP and Real GDP • Be able to Apply the GDP Deflator in computing Real GDP • Be able to explain why national income and national output are the
same, using the circular flow of income and output
Slide 3

Reading List
• Refer to students to relevant text/chapter or reading materials you will make available on Sakai
Slide 4
GDP and GNP
• A nation's aggregate output is most commonly measured by two very similar concepts, called gross domestic product (GDP) and gross national product (GNP).
• Gross Domestic Product (GDP) refers to output produced within a country’s borders. For example, Ghana’s GDP refers to the total output produced within Ghana by Ghanaians and non- Ghanaians.
• Gross National Product (GNP) refers to output produced by a country’s owned- factors, regardless of location. For example, Ghana’s GNP refers to the total output produced by citizens of Ghana living within Ghana and outside Ghana.
Slide 5
GDP and NDP
• Net foreign factor income is the income from foreign domestic factor sources minus foreign factor incomes earned domestically.
• Where Net Foreign income= foreign income of our citizens - the income of residents who are not citizens.
• This may be positive or negative depending on whether foreign income of citizens is greater than or less than income of residents who are not citizens.
• Therefore, to obtain Net Domestic Product, we must add Net foreign income to GDP.
• Net Domestic Product (NDP)= GDP + Net Foreign Income
Slide 6
Nominal GDP and Real GDP
• Nominal GDP is the value of final output produced in a given period, measured in the prices of that period.
• Real GDP is the value of final output produced in a given
period, adjusted for changing prices.
• Real GDP is important to society because it measures what is really produced
• Real GDP is calculated by dividing nominal GDP by the GDP deflator.
deflator GDP
GDP Nominal=GDP Real
deflator GDP
GDP Nominal=GDP Real
Slide 7
Nominal GDP and Real GDP
• The GDP deflator is the measure of current level prices relative to the level of prices in the base year
– The deflator can be used to take inflation out of nominal GDP (“deflate” nominal GDP)
– The deflator is 100 for the base year
Slide 8
Nominal GDP and Real GDP
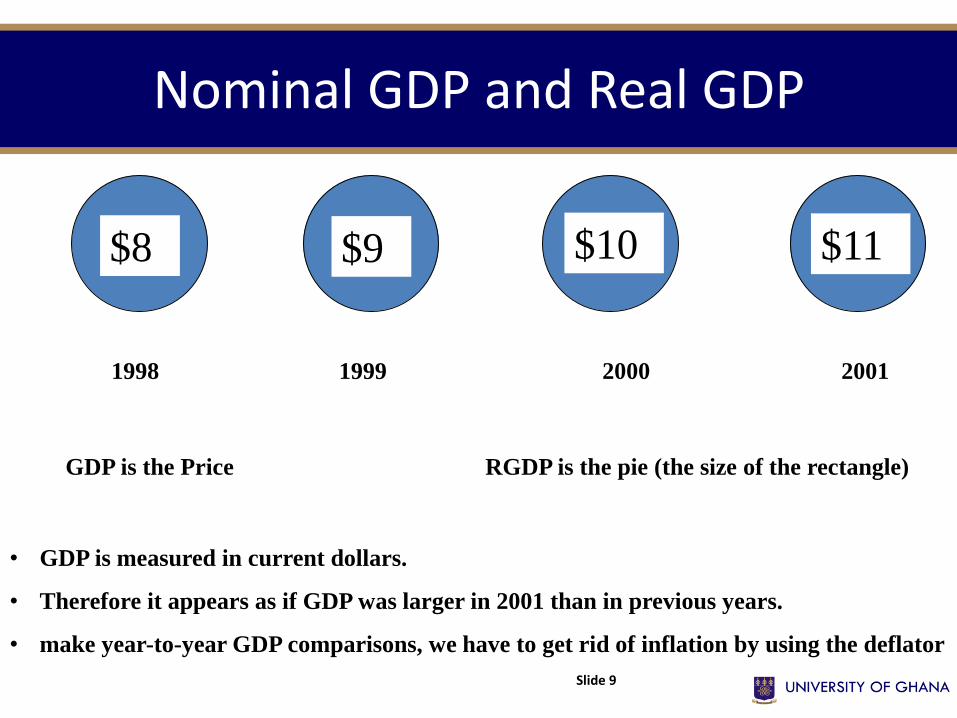
$8 $9 $10 $11
1998 1999 2000 2001
GDP is the Price RGDP is the pie (the size of the rectangle)
• GDP is measured in current dollars.
• Therefore it appears as if GDP was larger in 2001 than in previous years.
• make year-to-year GDP comparisons, we have to get rid of inflation by using the deflator
Slide 9
GDP Per Capita
• GDP Per Capita is GDP divided by the size of the population.
• it is also described to be the average GDP per person.
• In order to compare the GDP per capita in one year to another year, we would have to correct for inflation.
• GDP per capita is therefore deflated to compute the Real GDP per capita which is used for comparison across time.
Slide 10
Market Prices and Factor Cost
• GDP at market prices is defined as the total market value of all final goods and services in the domestic economy during a particular year.
- Valuing the goods and services produced in the domestic economy using current market prices.
• GDP at factor costs is defined as the total market value of all final goods and services in the domestic economy less net indirect taxes in a particular year.
– GDP (at factor prices)= GDP (market prices) – net indirect taxes
Slide 11
Market Prices and Factor Cost: Illustration
• Assume there is no government intervention and the local production of a phone is $24
• This means the market value = factor income= total cost = total value-added =$24
• However, if there is indirect tax or subsidies then
Market value ≠total value-added
• GDP at factor cost ( or total value-added)= GDP at market price – indirect business tax (IBT)+ Subsidies(S)
Slide 12
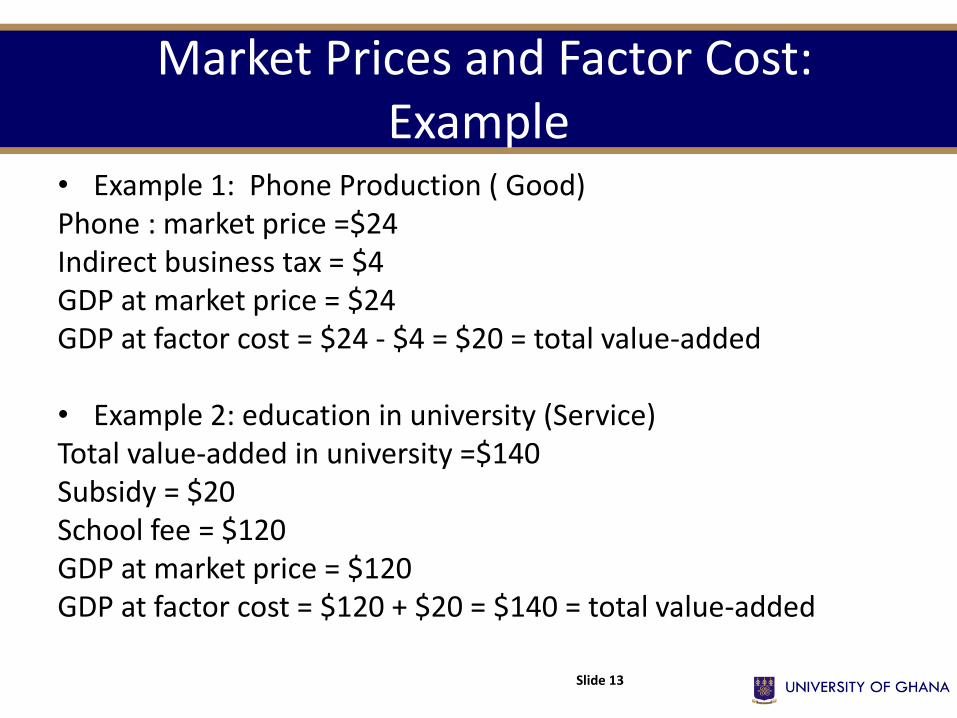
Market Prices and Factor Cost: Example
• Example 1: Phone Production ( Good) Phone : market price =$24 Indirect business tax = $4 GDP at market price = $24 GDP at factor cost = $24 - $4 = $20 = total value-added • Example 2: education in university (Service) Total value-added in university =$140 Subsidy = $20 School fee = $120 GDP at market price = $120 GDP at factor cost = $120 + $20 = $140 = total value-added
Slide 13
GDP Exceptions
• There are three major exceptions when calculating GDP.
– Intermediate Goods
– Non-Market Activities
– Unreported Incomes
Slide 14
Exceptions: Intermediate Goods
• Intermediate goods are goods or services purchased for use as input in the production of final goods or services. – For example, the engine or battery of a car are not counted, so as
to keep them from being counted twice.
Slide 15
Exceptions: Non-Market Goods
• GDP measures exclude most goods and services produced that are not sold in the market.
– A homemaker who cleans, washes, gardens, shops and cooks produces goods of value.
– Because they are not exchanged in the market they are not included in GDP.
Slide 16
Exceptions: Unreported Income
• The GDP statistics fail to capture market activities that are not reported to tax or census authorities.
• The underground economy is motivated by tax avoidance or to conceal illegal activities
Slide 17
GDP Calculation Examples
• Selling your car to a neighbor does not add to GDP.
• Selling your car to a used car dealer who sells your car to someone else for a higher price, does add to GDP.
• The value added is the dealer's services.
• Selling a stock or bond does not add to GDP.
• The stock broker's commission for the sales does add to GDP.
Slide 18
GDP Calculation Examples Contd.
• Pension payments, welfare payments, employment insurance benefits, and other government transfer payments are not included in GDP.
• The work of unpaid house spouses does not appear in GDP calculations.
Slide 19
National Income Accounting
• National Income Accounting is a set of rules and definitions for measuring economic activity in the aggregate economy – that is, in the economy as a whole.
• The total output is measured by the market (dollar) value of all final goods and services produced by an economy during a given period of time, usually a year.
• Why do we measure output in dollar value rather than actual physical units of output?
Slide 20
National Income Accounting Contd.
• It is simply because you cannot add production of 100 cars to the production of 150 phones and say we produced 150, goods.
• But, if we take quantities times market prices, we can say we produced $200,000 worth of cars and $50,000 thousand worth of pones for total output of $250,000.
Slide 21
Measuring Economic Activity
• The Gross Domestic Product is the single most used measure of total value of goods and services
• GDP measures the following:
– the total income of everyone in the economy
– the total expenditure on the economy’s output of goods and services
• For an economy as a whole income must equal expenditure
Slide 22
Methods of Calculating GDP
• An economy’s income must always be equal to its expenditure because of the national income identity
• The identity can be seen in the circular flow of income in an economy.
Slide 23
The Circular –Flow Diagram
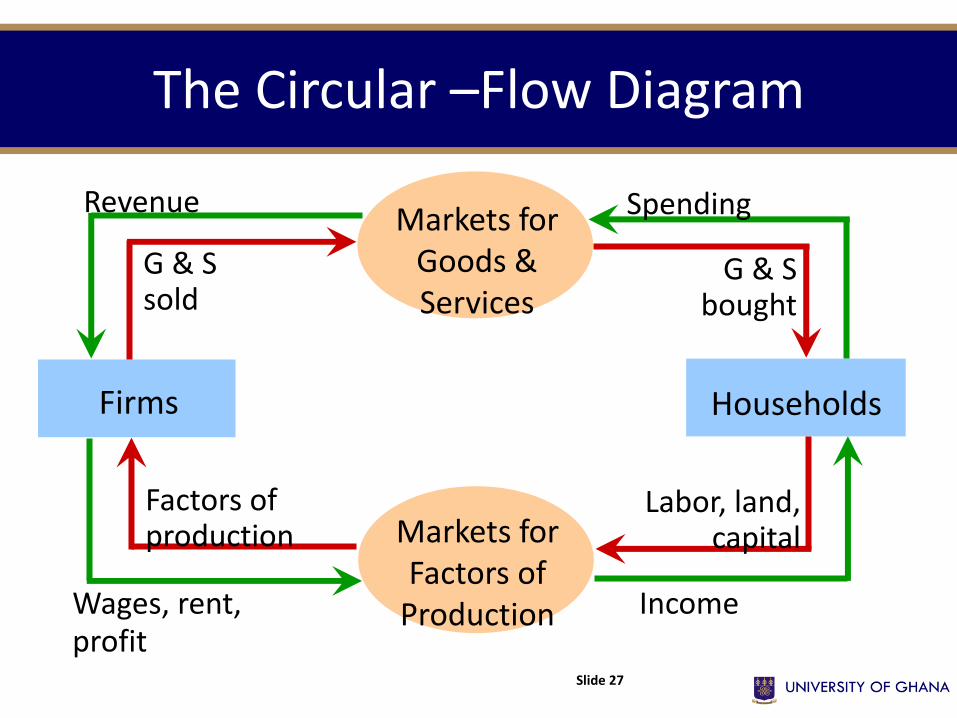
• The circular-flow diagram is a visual model of the economy which shows how money flows through markets among households and firms.
• The following are assumptions in the circular-flow diagram:
• Includes two types of “actors”:
– households
– firms
Slide 24
The Circular –Flow Diagram Contd.
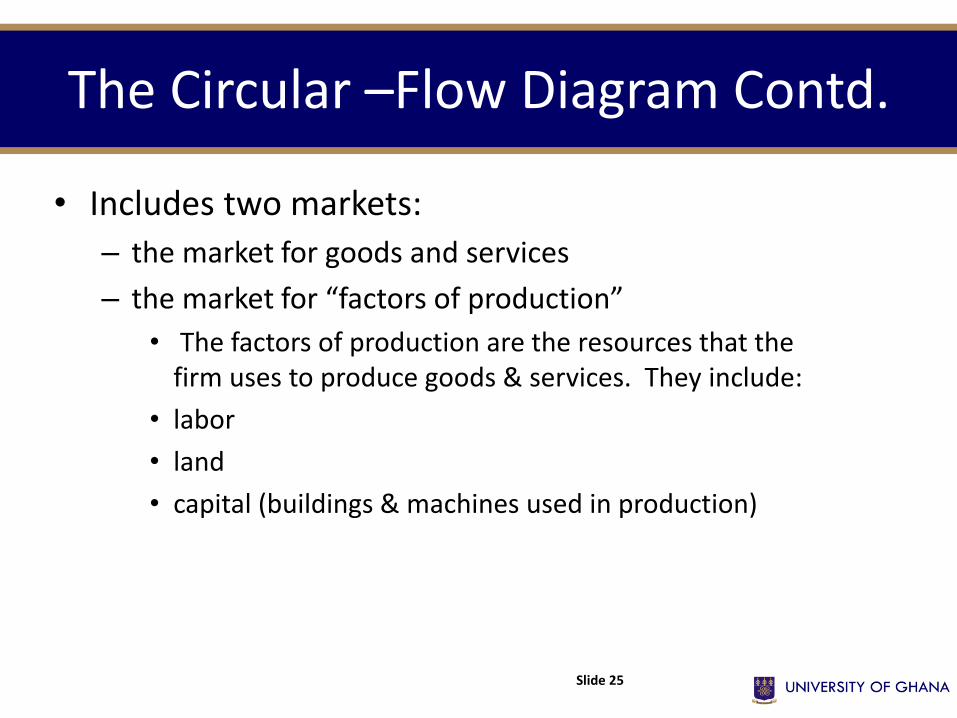
• Includes two markets:
– the market for goods and services
– the market for “factors of production”
• The factors of production are the resources that the firm uses to produce goods & services. They include:
• labor
• land
• capital (buildings & machines used in production)
Slide 25
The Circular –Flow Diagram Contd.
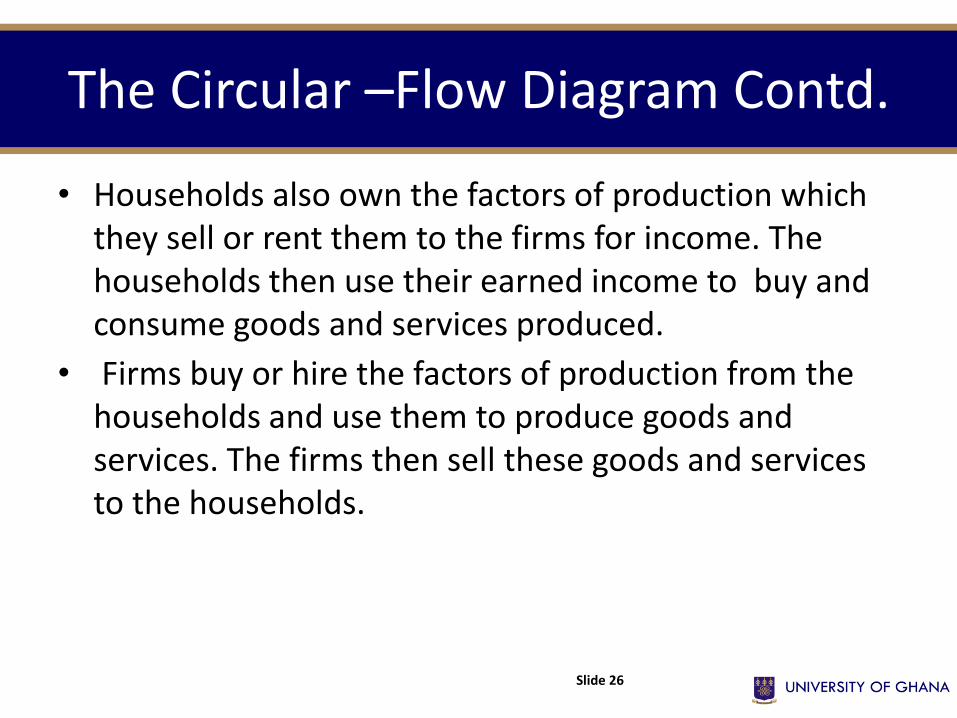
• Households also own the factors of production which they sell or rent them to the firms for income. The households then use their earned income to buy and consume goods and services produced.
• Firms buy or hire the factors of production from the households and use them to produce goods and services. The firms then sell these goods and services to the households.
Slide 26
The Circular –Flow Diagram
Households
Income
Spending
Markets for Factors of
Production
Firms
Wages, rent, profit
Factors of production
Labor, land, capital
G & S bought
G & S sold
Revenue Markets for
Goods & Services
Slide 27
Explaining the diagram
• In this diagram, the green arrows represent flows of income/payments. We are going to begin our explanation from the households (so start tracing the green arrows from the household)
• Households spend their money in the goods and services market. This then becomes revenue for the firms who also use this to pay for the factors of production . Since households own these factors of production, they ultimately receive the wages, rents and profits in the factors market.
• From the green arrow, GDP equals the total wages, rent, and profit paid by firms to households in the factor markets for their factors of production
• This completes the income part of the circular flow.
Slide 28
Explaining the diagram
• In the lower half of the diagram, the red arrows represent flows of goods & services including services of the factors of production .We are going to begin our explanation from the households (so start tracing the red arrows from the household)
• Households supply labour, land and capital in the factor market as factors of production to the firms. The firms then use these as inputs to produce goods and services.
• These goods and services are then sold in the goods and services market where the households buy the same goods and services from.
• From the red arrow, GDP equals the total amount spent by households in the market for goods and services.
Slide 29

Trial Questions for Self Assessment
• Please refer to Trial Questions Folder on Sakai to access the trial questions for this session.
Slide 30