Embed Size (px)
Citation preview
LECTURE NOTES - VII
« WATER RESOURCES »
Prof. Dr. Atıl BULU
Istanbul Technical University College of Civil Engineering
Civil Engineering Department Hydraulics Division
A.Bulu 117
CHAPTER 7
SPILLWAYS
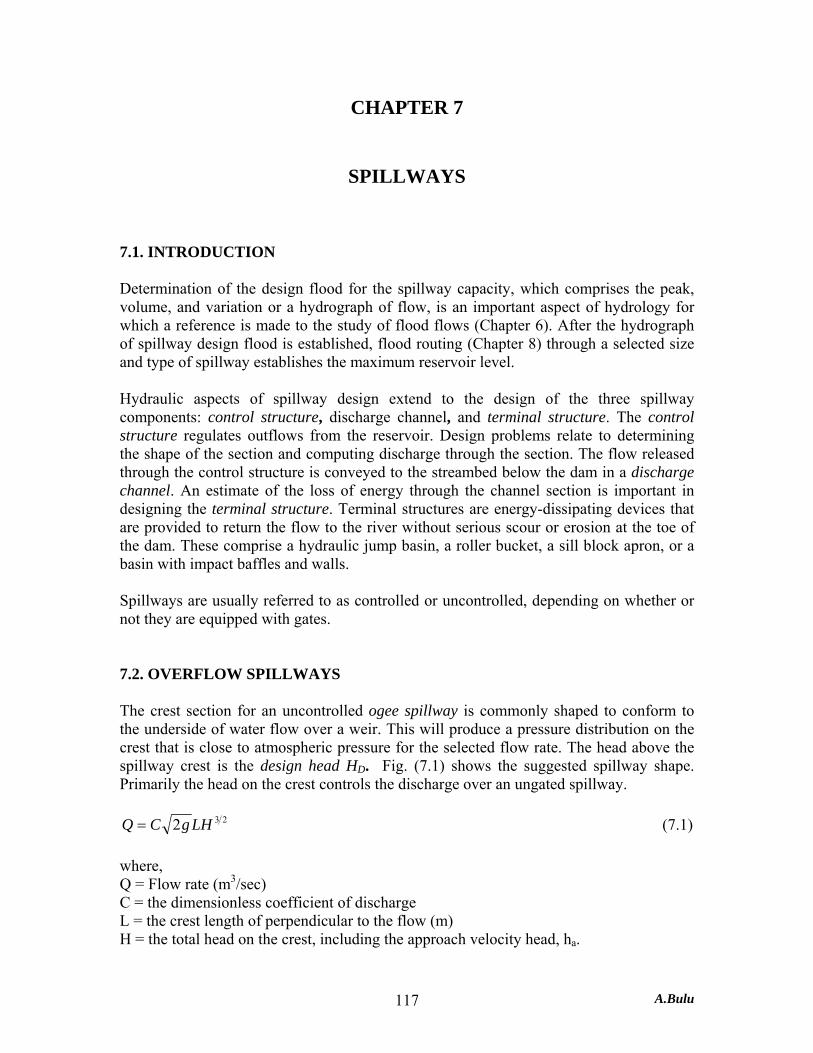
7.1. INTRODUCTION Determination of the design flood for the spillway capacity, which comprises the peak, volume, and variation or a hydrograph of flow, is an important aspect of hydrology for which a reference is made to the study of flood flows (Chapter 6). After the hydrograph of spillway design flood is established, flood routing (Chapter 8) through a selected size and type of spillway establishes the maximum reservoir level. Hydraulic aspects of spillway design extend to the design of the three spillway components: control structure, discharge channel, and terminal structure. The control structure regulates outflows from the reservoir. Design problems relate to determining the shape of the section and computing discharge through the section. The flow released through the control structure is conveyed to the streambed below the dam in a discharge channel. An estimate of the loss of energy through the channel section is important in designing the terminal structure. Terminal structures are energy-dissipating devices that are provided to return the flow to the river without serious scour or erosion at the toe of the dam. These comprise a hydraulic jump basin, a roller bucket, a sill block apron, or a basin with impact baffles and walls. Spillways are usually referred to as controlled or uncontrolled, depending on whether or not they are equipped with gates. 7.2. OVERFLOW SPILLWAYS The crest section for an uncontrolled ogee spillway is commonly shaped to conform to the underside of water flow over a weir. This will produce a pressure distribution on the crest that is close to atmospheric pressure for the selected flow rate. The head above the spillway crest is the design head HD. Fig. (7.1) shows the suggested spillway shape. Primarily the head on the crest controls the discharge over an ungated spillway.
232 LHgCQ = (7.1)
where, Q = Flow rate (m3/sec) C = the dimensionless coefficient of discharge L = the crest length of perpendicular to the flow (m) H = the total head on the crest, including the approach velocity head, ha.

A.Bulu 118
Figure 7.1. Definition sketch of overflow spillway
cross-section The coefficient C depends on the approach depth, actual shape of the crest, and upstream face slope.
Figure 7.2. Coefficient of discharge for ogee crests with vertical faces (Roberson, Cassidy, Chaudhry, 1998)
A.Bulu 119
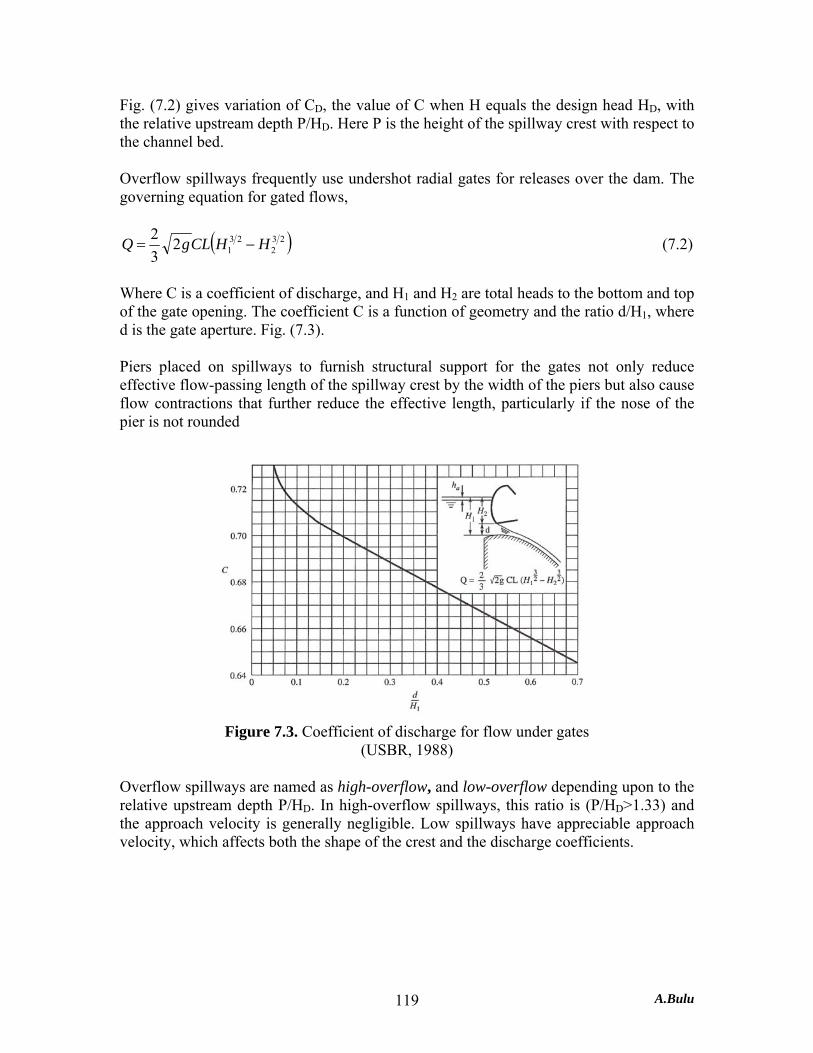
Fig. (7.2) gives variation of CD, the value of C when H equals the design head HD, with the relative upstream depth P/HD. Here P is the height of the spillway crest with respect to the channel bed. Overflow spillways frequently use undershot radial gates for releases over the dam. The governing equation for gated flows,
( )232
2312
32 HHCLgQ −= (7.2)
Where C is a coefficient of discharge, and H1 and H2 are total heads to the bottom and top of the gate opening. The coefficient C is a function of geometry and the ratio d/H1, where d is the gate aperture. Fig. (7.3).
Piers placed on spillways to furnish structural support for the gates not only reduce effective flow-passing length of the spillway crest by the width of the piers but also cause flow contractions that further reduce the effective length, particularly if the nose of the pier is not rounded
Figure 7.3. Coefficient of discharge for flow under gates
(USBR, 1988) Overflow spillways are named as high-overflow, and low-overflow depending upon to the relative upstream depth P/HD. In high-overflow spillways, this ratio is (P/HD>1.33) and the approach velocity is generally negligible. Low spillways have appreciable approach velocity, which affects both the shape of the crest and the discharge coefficients.
A.Bulu 120
7.2.1. Crest Shape of Overflow Spillways The lower surface o a nappe from a sharp-crested weir is a function of,
1. the head on the weir, 2. the slope or inclination of the weir surface, 3. the height of the crest, which influences approach velocity.
On the crest shape based on a design head HD, when the actual head is less than HD, the trajectory of the nappe falls below the crest profile, creating positive pressures on the crest, thereby reducing the discharge. On the other hand, with a higher than design head, the nappe-trajectory is higher than crest, which creates negative pressure pockets and results in increased discharge. Accordingly, it is considered desirable to underdesign the crest shape of a high overflow spillway for a design head HD, less than the head on the crest corresponding to the maximum reservoir level, He. However, with too much negative pressure, cavitation may occur. The U.S. Bureau of Reclamation (1988) recommendation has been that He/HD should not exceed 1.33. The Corps of Engineers (COE) has accordingly recommended that a spillway crest be designed so that the maximum expected head will result in an average pressure on the crest no lower than (-4.50m) of water head (U.S. Department of Army, 1986). Pressures of (-4.50m) can be approximated by the following equations (Reese and Maynord, 1987). For He, HD ≥ 10 m,
22.143.0 eD HH = (without piers) (7.3)
22.139.0 ed HH = (with piers) For He, HD < 10 m,
eD HH 70.0= (without piers) (7.4)
eD HH 74.0= (with piers)
Another empirical equation given for the maximum head on the crest for no cavitation is,
DHH 65.1max = (7.5)
The U.S. Bureau of Reclamation described the complete shape of the lower nappe by separating it into two quadrants, one upstream and one downstream from the crest (apex), as shown in Fig. (7.1). The equation for the downstream quadrant is expressed as,
A.Bulu 121
85.11
⎟⎟⎠
⎞⎜⎜⎝
⎛=
DD Hx
KHy (7.6)
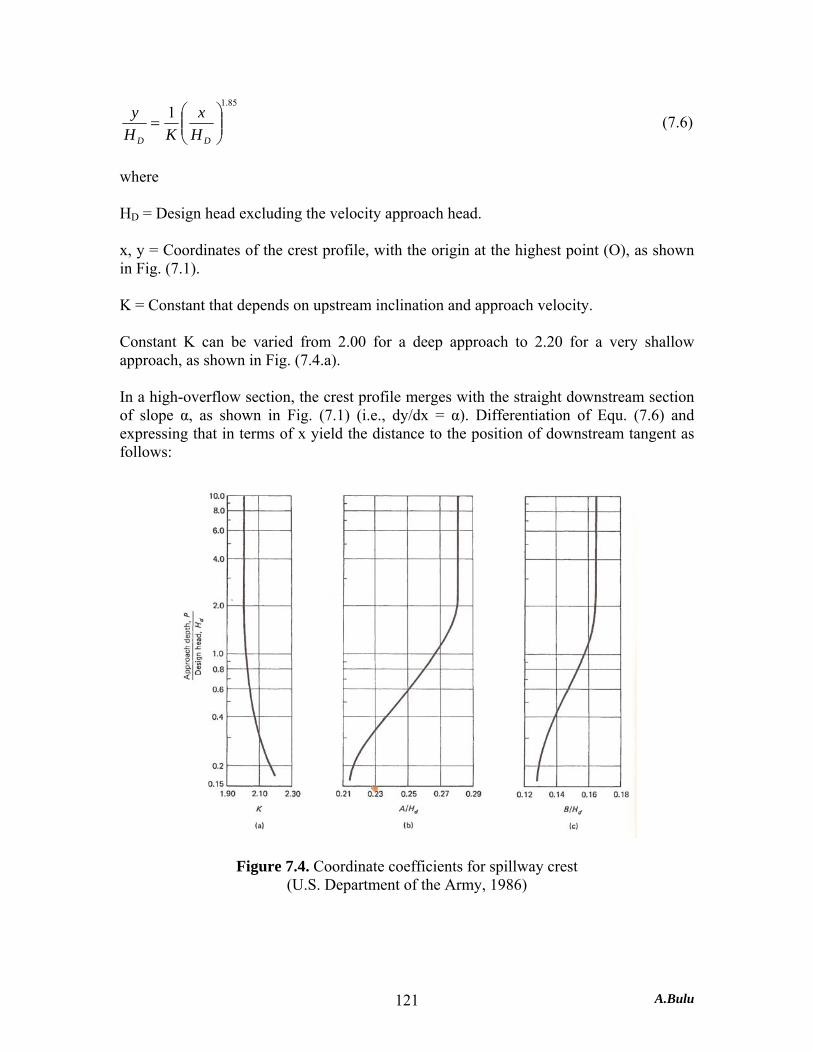
where HD = Design head excluding the velocity approach head. x, y = Coordinates of the crest profile, with the origin at the highest point (O), as shown in Fig. (7.1). K = Constant that depends on upstream inclination and approach velocity. Constant K can be varied from 2.00 for a deep approach to 2.20 for a very shallow approach, as shown in Fig. (7.4.a). In a high-overflow section, the crest profile merges with the straight downstream section of slope α, as shown in Fig. (7.1) (i.e., dy/dx = α). Differentiation of Equ. (7.6) and expressing that in terms of x yield the distance to the position of downstream tangent as follows:
Figure 7.4. Coordinate coefficients for spillway crest (U.S. Department of the Army, 1986)
A.Bulu 122
( ) 176.1485.0 αKHx
D
DT = (7.7)
where xDT = Horizontal distance from the apex to the downstream tangent point α = Slope of the downstream face. The discharge efficiency of a spillway is highly dependent on the curvature of the crest immediately upstream of the apex. To fit a single equation to the upstream quadrant had proven more difficult. An ellipse, of which both the major and minor axes vary systematically with the depth of approach, can closely approximate the lower nappe surfaces. With respect to origin at the apex, the equation of the elliptical shape for upstream quadrant is expressed as,
( ) 12
2
2
2
=−
+B
yBAx (7.8)
where x = Horizontal coordinate, positive to the right y = Vertical coordinate, positive downward A, B = One-half of the ellipse axes, as given in Fig. (7.4.b and c) for various values of approach depth and design head. For a inclined upstream face of slope FS, the point of tangency with elliptical shape can be determined by the following equation.
( ) 21222
2
BFAFAx
S
SUT
+= (7.9)
EXAMPLE 7.1: Design an overflow spillway section for a design discharge of 1500 m3/sec. The upstream water surface level is at elevation 240 m and the upstream channel floor is at 200 m. The spillway, having a vertical face, is 50 m long. Solution: 1. Assuming a high overflow spillway section, for P/HD ≥ 3, discharge coefficient CD = 0.49 from Fig. (7.2).

A.Bulu 123
2. From the discharge equation (Equ. 7.1),
mHLgC
QH
LHgCQ
e
e
e
76.5
822.135062.1949.0
15002
2
23
23
=
=××
==
=
3. Depth of water upstream = m40200240 =−
Velocity of approach = sec75.05040
15000 mV =
×=
Velocity head = mg
V 03.062.19
75.02
220 ==
4. Maximum water head = m73.503.076.5 =− 5. Height of the crest = m27.3473.500.40 =− 6. Since mmHe 1076.5 <= Design head = mHH eD 03.476.570.070.0 =×==
7. 33.150.803.427.34
>==DH
P , high overflow
8. Downstream quadrant from Equ. (7.6),
85.11
⎟⎟⎠
⎞⎜⎜⎝
⎛=
DD Hx
KHy
From Fig. (7.4.a), for 00.2,50.8 == KHP
D
85.1
85.1
15.003.42
103.4
xy
xy
=
⎟⎠⎞
⎜⎝⎛=

A.Bulu 124
Coordinates of the shape computed by this equation as follows:
9. Point of tangency: Assume a downstream slope of (2/1). From Equ. (7.7),
( )mx
x
DT
DT
98.92203.4485.0 176.1
=×××=
10. Upstream quadrant: From Fig. (7.4.b and c),
mBmA
HB
HA
HP
DDD
66.003.4165.013.103.428.0
165.0,28.050.8
=×==×=
==→=
From Equ. (7.7),
( ) 166.0
66.013.1 2
2
2
2
=−
+yx
The coordinates are computed as follows:
x (select) (m) y (computed) (m)0.25 0.015 0.50 0.07 0.75 0.17 1.00 0.35 1.13 0.66
x (select) (m) y (computed) (m)1 0.15 2 0.54 3 1.14 4 1.95 5 2.95 6 4.13 7 5.49 8 7.03 9 8.74 10 10.62
A.Bulu 125
EXAMPLE 7.2: A spillway has been designed for a head of 2.80 m with a length 200 m. The discharge coefficient is C = 049. Calculate the discharge for this head. What will the discharge be for heads of 0.20 m and 1.50 m? What is the maximum discharge that can be passed over this spillway without cavitation? Solution: At the design head,
sec203480.220062.1949.0
2
3
23
23
mQQ
LHgCQ
=
×××=
=
For H = 0.20 m, 071.080.220.0
==DH
H
From Fig. (7.2), 82.0=DC
C
sec3220.020062.1940.0
40.049.082.0
3
23
mQQ
C
=
×××=
=×=
For H = 1.50 m, 92.054.080.250.1
=→==DD C
CHH
sec73250.120062.1945.0
45.049.092.0
3
23
mQQ
C
=
×××=
=×=
The maximum head that can be without cavitation on the crest,
mHHH D
62.480.265.165.1
max
max
=×==
For 08.165.180.262.4max =→==
DD CC
HH
sec4663
62.420062.1953.0
53.049.008.1
3max
32max
mQ
Q
C
=
×××=
=×=

A.Bulu 126
7.2.2. Submerged Discharge on Overflow Spillways The coefficient of discharge decreases under the condition of submergence. Submergence can result from either excessive tailwater depth or changed crest profile. The effect of tailwater submergence on the coefficient of discharge depends upon the degree of submergence defined by hd/He and the downstream apron position, (hd+d)/He shown in Fig. (7.5). For a value of (hd+d)/He up to approximately 2, the reduction in the coefficient depends on the factor (hd+d)/He and is independent of hd/He as shown in Fig. (7.5.a), i.e., it is subject to apron effects only.
Figure 7.5. Reduction of discharge coefficient for submerged spillway: a) apron effects, when (hd+d)/He<2, b) tailwater effects, when (hd+d)/He>5 .
When (hd+d)/He is above 5, the reduction depends only on hd/He as shown in Fig. (7.4.b), i.e., tailwater effects control. For (hd+d)/He between 2 and 5, the reduction of the coefficient depends on both factors, given in Fig. (7.5.c). The effect on the discharge due to crest geometry is not well defined. Model studies are the best way to determine the coefficient.
A.Bulu 127
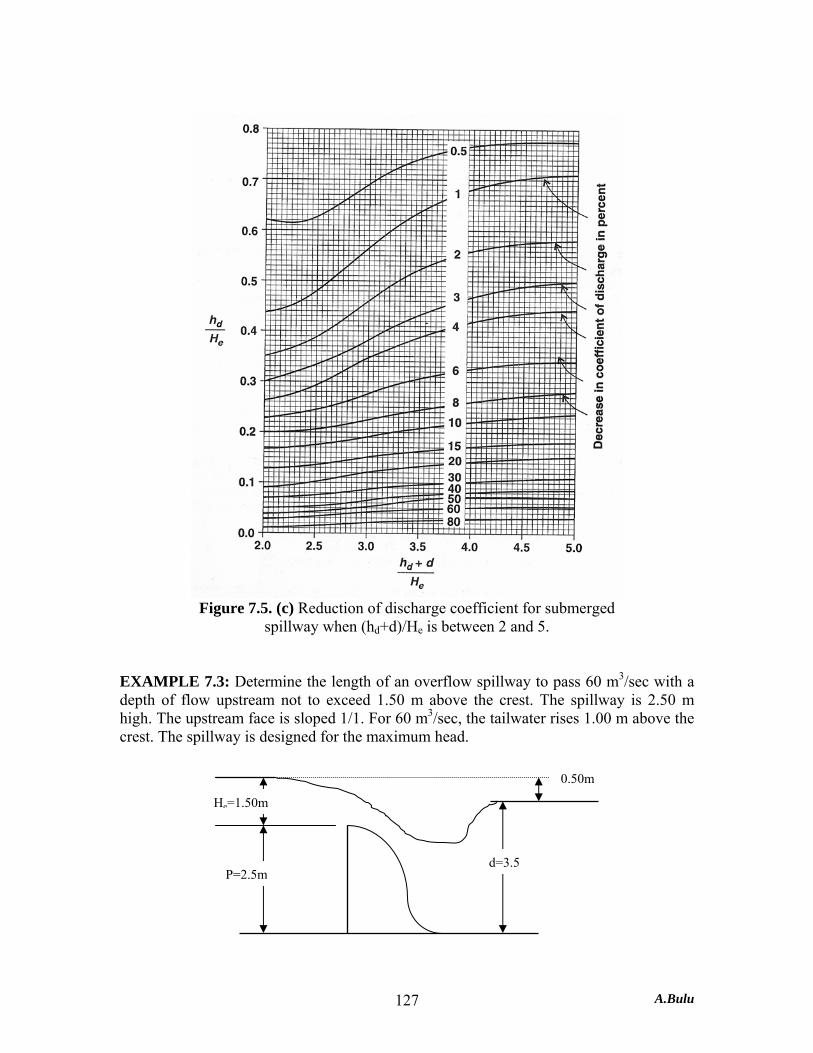
Figure 7.5. (c) Reduction of discharge coefficient for submerged
spillway when (hd+d)/He is between 2 and 5.
EXAMPLE 7.3: Determine the length of an overflow spillway to pass 60 m3/sec with a depth of flow upstream not to exceed 1.50 m above the crest. The spillway is 2.50 m high. The upstream face is sloped 1/1. For 60 m3/sec, the tailwater rises 1.00 m above the crest. The spillway is designed for the maximum head.
P=2.5m
He=1.50m
0.50m
d=3.5
A.Bulu 128
Solution: 1. Since the spillway is designed for maximum head,
mHH eD50.1== (without the approach velocity head)
2. From the figure,
( ) 33.050.150.0,67.2
50.100.4
00.450.000.150.1
====+
=+=−=
e
d
e
d
d
d
Hh
Hdh
mdhmh
From Fig. (7.5.c), % reduction = 4 %
3. First trial; 67.050.150.2
==eH
P
From Fig. (7.2), C0 = 0.48 4. Hence, ( ) 46.004.0148.0 =−×=C 5. 232 eLHgCQ =
Approximate discharge = 232 eCHgLQq ==
( )mmq sec//74.350.162.1946.0 323 =××=
Velocity of approach = ( )sec94.000.474.3
0 mV ==
Approach velocity head = mg
V 05.062.19
94.02
220 ==
6. Revised computations with velocity approach head,
mHe 55.105.050.1 =+=

A.Bulu 129
35.055.155.0
61.255.105.4
==
==+
e
d
e
d
Hh
HdH
From Fig. (7.5.c), % reduction = 3.5 % 7. Revised ( ) 463.0035.0148.0 =−×=C 8. From the discharge equation,
mL
HgCQL
e
16.1555.162.19463.0
602
23
23
=××
=
=
7.3. CHUTE OR TROUGH SPILLWAYS The chute spillway derives its name from the shape of the discharge channel component of the spillway. In this type of spillway, the discharge is conveyed from a reservoir to the downstream river level through a steep open channel as a chute implies that the velocity of flow is greater than critical velocity. This name applies regardless of the control device used at the head of the chute, which can be an overflow crest, a gated orifice or a side-channel crest. This type of structure consists of four parts as shown in Fig. (7.6). An entrance channel, a control structure or crest, the sloping chute, and a terminal structure.
Figure 7.6. Chute spillway section
The entrance channel at A is a relatively wide channel of subcritical flow. The control section at B is placed in line with or upstream from the centerline of the dam. The critical velocity occurs when the water passes over the control.
A.Bulu 130
Flows in the chute are ordinarily maintained at supercritical stage until the terminal structure DE is reached. Economy of excavation generally makes it desirable that from B to C, where a heavy cut is involved, the chute may be placed on a light slope. From C to D it follows the steep slope on the side of the river valley. An energy dissipating device is placed at the bottom valley D. The axis of the chute is kept straight as far as practicable. The velocity of flow increases rapidly in the chute with drop in elevation. It is preferable that the width of the control section, the chute, and the stilling basins are the same. Quite often, these widths are not the same, because of the design requirements of the spillway and stilling basin. Extreme care must be taken that the transitions take place gradually, or undesirable waves may develop. To prevent hydrostatic uplift under the chute, a cutoff wall (pile) is provided under the control structure and a drainage system of filters and pipes is provided. When the stilling basin is operating, there is a substantial uplift under the lower part of the chute and upstream part of the stilling basin floor. The floor must be made sufficiently heavy or be anchored to the foundation. 7.3.1. Slope of Chute Channel It is important that the slope of the chute in the upstream section BC should be sufficiently steep to maintain a supercritical flow to avoid formation of a hydraulic jump in the chute. Flow through a channel is given by Manning’s formula,
21321 SARn
Q =
(7.10) Where, Q = Discharge (m3/sec) n = Roughness (Manning) coefficient A = Cross-section area of the channel (m2) R = A/P = Hydraulic radius (m) S = Slope of bottom of channel. For a rectangular channel of depth y and width b,
yRByA ≈→= (for a wide cross-section)
Under the condition of critical flow,
32
gqyc = ,
BQq = (Discharge per meter width)
A.Bulu 131
Thus Equ. (7.10) reduces to,
⎟⎟⎠
⎞⎜⎜⎝
⎛==
==
=
31
32
22
310
22
2135
2132
1
1
gq
nqy
nqS
Syn
qBQ
SByyn
Q
c
c
c
cc
ccc
c
222.0
2
92
2910 64.12
ccc q
nq
ngS == (7.11)
The subscript c refers to the critical stage. Since the reliable information on the value of n is difficult, a conservative approach is indicated in the selection of n. The slope of the chute should be more than Sc for a supercritical flow. A review of existing spillways indicates that the actual slopes of the upstream section of the chute are 1 to 2 % or more. Unstable rapid flows occur when the Froude number exceeds 1.56 to 1.64. It is therefore likely that chutes designed with a conservative slope have a Froude number well over this limit and unstable flow will occur with bumpy surfaces. EXAMPLE 7.4: Determine the minimum slope in the upper reach of a chute section of 30 m width. The range of discharge is 150 to 2000 m3/sec. n = 0.015. Solution: 1. Under the minimum flow conditions,
( )mmq sec//530
150 3==
2. From the slope Equ. (7.11),
002.05
015.064.12222.0
2
=×
=cS
3. Under maximum flow conditions, flow depth is by using Equ. (7.10),
A.Bulu 132
my
y
y
45.6
36.22002.030
015.02000
002.030015.012000
2135
2135
=
=××
=
×××=
4. Velocity of flow for maximum discharge,
( )sec34.1045.630
2000 mAQV =
×==
5. Froude number,
30.145.681.9
34.10=
×==
gyVFr
Since 1.30 < 1.56, we have stable rapid flow. 7.3.2. Chute Sidewalls Except for converging and diverging sections, chute channels are designed with vertical sidewalls, commonly of reinforced concrete 30 to 45 cm thick. The height of the walls is designed to contain the depth of flow for the spillway design flood. The water surface profile from the control section downward is determined for this purpose. An allowance is made for pier and waves roll waves, and air entrainment. The water surface profile is computed by the methods of gradually varied flow. The initial values of discharge, velocity, and depth at the entering section are known. Since the flow in the chute is supercritical, computation proceeds in a downstream direction. It may be noted that in the steep channel, either S2 curve (when yc > y > yn) or the S3 curve (when yc > yn > y) is involved. In view of uncertainties involved in the evaluation of surface roughness, pier end waves, roll waves, and air entrainment buckling, a freeboard given by the empirical equation is added to the computed depth of the water surface profile.
( ) 310004.060.0 dVmFreeboard += (7.12)
Where, V = Mean velocity in the chute section under consideration (m/sec) d = Mean water depth (m)
A.Bulu 133
The converging and diverging transitions in the sidewalls must be made gradual. U.S. Bureau of Reclamation experiments have shown that an angular variation nor exceeding the following value will provide an acceptable transition for either contracting or an expanding channel.
rFTan
31
=α (7.13)
Where, α = Angular variation of the sidewall with respect to the channel centerline.
Fr = Froude number = gy
V
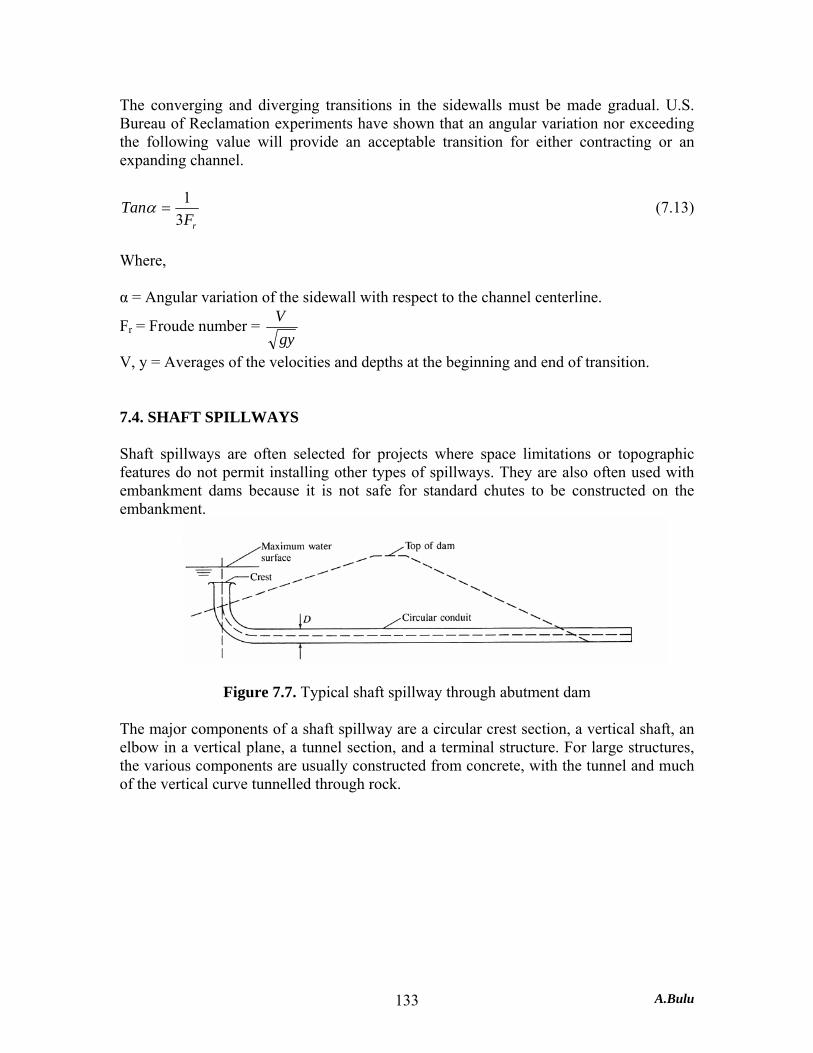
V, y = Averages of the velocities and depths at the beginning and end of transition. 7.4. SHAFT SPILLWAYS Shaft spillways are often selected for projects where space limitations or topographic features do not permit installing other types of spillways. They are also often used with embankment dams because it is not safe for standard chutes to be constructed on the embankment.
Figure 7.7. Typical shaft spillway through abutment dam
The major components of a shaft spillway are a circular crest section, a vertical shaft, an elbow in a vertical plane, a tunnel section, and a terminal structure. For large structures, the various components are usually constructed from concrete, with the tunnel and much of the vertical curve tunnelled through rock.

A.Bulu 134
7.5. SIPHON SPILLWAYS
Figure 7.8. Profile of a siphon spillway
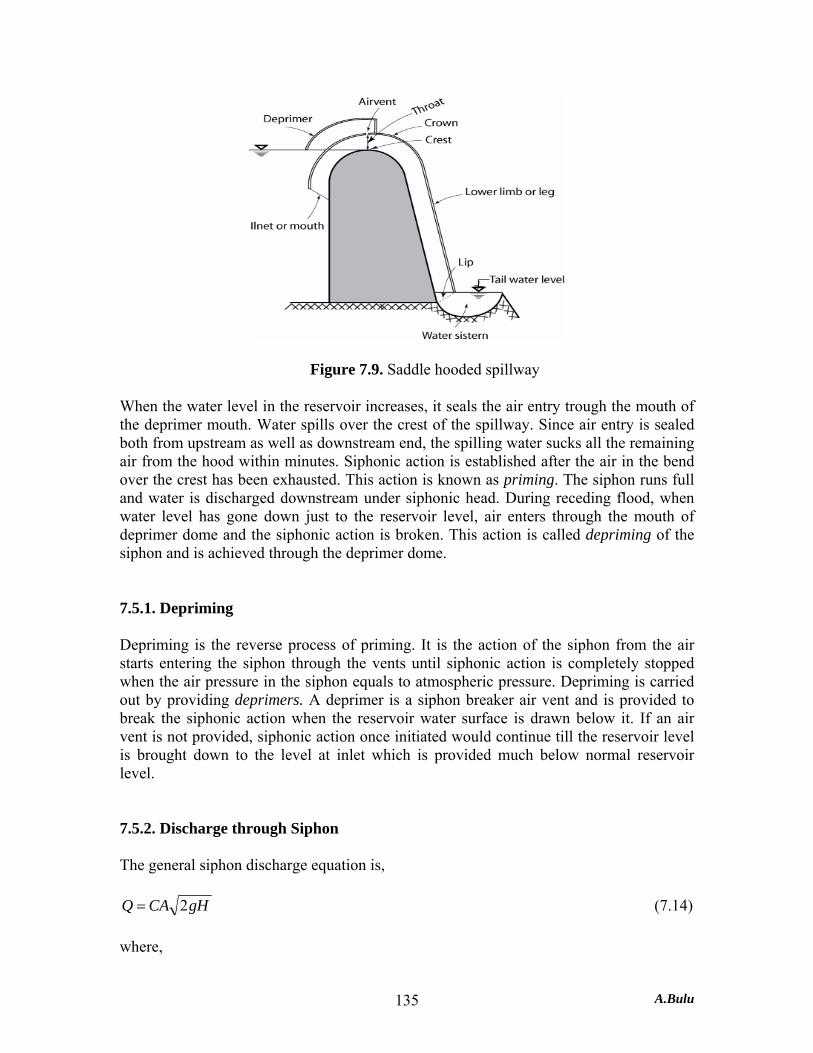
Siphon spillways are often used in low-head small capacity installations, where it is desirable to keep the reservoir level within a modest range of fluctuation, or in larger installations, where it is used as a service spillway and an auxiliary spillway carries large floods. A siphon spillway is a closed conduit consisting of an inlet, an upward sloping section, a crown with a level crest section, a downward sloping section, and an outlet. When air has been evacuated from the siphon, the full potential of the difference in head between the reservoir and the outlet is used in producing flow. Instead of allowing water to spill over the crest of a dam or weir, the surplus water may be discharged downstream through a siphon spillway consisting of one or more siphon units. A siphon spillway is the one which utilizes the siphonic action to discharge the surplus water. Generally, a siphon spillway consists of a closed conduit system formed in the shape of an inverted U, positioned so that the inside of the bend of the upper passageway is at normal reservoir level. When the water level in the reservoir rises above its normal level, water flows over the crest, and then siphonic action takes place. Continuous flow is then maintained by suction effect due to the gravity pull of the water in the lower leg of the siphon. Saddle siphon spillway consists of a reinforced concrete hood constructed over an overflow section of gravity dam. The inlet or mouth of the main hood is kept submerged in water so that floating debris does not enter the siphon. A small deprimer hood is kept above the main hood, and both these hoods are connected through an air vent. The inlet of the deprimer hood is kept just at the reservoir level. The lower limb or leg of the main hood is generally kept submerged in the tail water so that there is no air entry from the downstream end. (Fig. 7.9).
A.Bulu 135
Figure 7.9. Saddle hooded spillway When the water level in the reservoir increases, it seals the air entry trough the mouth of the deprimer mouth. Water spills over the crest of the spillway. Since air entry is sealed both from upstream as well as downstream end, the spilling water sucks all the remaining air from the hood within minutes. Siphonic action is established after the air in the bend over the crest has been exhausted. This action is known as priming. The siphon runs full and water is discharged downstream under siphonic head. During receding flood, when water level has gone down just to the reservoir level, air enters through the mouth of deprimer dome and the siphonic action is broken. This action is called depriming of the siphon and is achieved through the deprimer dome. 7.5.1. Depriming Depriming is the reverse process of priming. It is the action of the siphon from the air starts entering the siphon through the vents until siphonic action is completely stopped when the air pressure in the siphon equals to atmospheric pressure. Depriming is carried out by providing deprimers. A deprimer is a siphon breaker air vent and is provided to break the siphonic action when the reservoir water surface is drawn below it. If an air vent is not provided, siphonic action once initiated would continue till the reservoir level is brought down to the level at inlet which is provided much below normal reservoir level. 7.5.2. Discharge through Siphon The general siphon discharge equation is,
gHCAQ 2= (7.14) where,
A.Bulu 136
A = Area of the cross-section at crown, A = Lb, where L is the length and b is the height of throat. H = Operating head H = Reservoir level – Centre of outlet, if outlet is discharging freely, H = Reservoir level – Downstream tail water level if the outlet is submerged. C = Coefficient of discharge, the average value of which may be taken as 0.65.
R1 = Radius of crest, R2 = radius of crown. Consider any point P on the vertical section at the throat, and lets its radius be r. The section of the throat is rectangular, having length L and height b. Let V1, V2, and V be the velocities of flow at crest, crown, and point P respectively. The flow through the throat is governed by free vortex flow for which we have:
=× rV Constant
VrrVrV == 2211 (7.15)
Let h0 be the net operative head at the crest. This head is calculated after making due allowances of all losses occurring in the siphon, h0 = H – Losses through the siphon. (7.16) Hence,
011
1
01
2
2
ghrR
rRVV
ghV
==
= (7.17)
Consider a thin rectangular strip of thickness dr at P, and let dq be the discharge through this strip of unit length.
drghrRdrVdq ××=××= 0
1 21 (7.18)
A.Bulu 137
Hence discharge q through the throat per unit length is,
1
201
01
2
22
1
2
1
RRLnghRq
rdrghRdqq
R
R
R
R
=
== ∫∫ (7.19)
The total discharge through the siphon unit having throat length L is therefore,
1
201 2
RRLnghLRqLQ == (7.20)
The maximum value of V occurs corresponding to atmospheric pressure head of 10.33 m water head. But to prevent cavitation, the pressure at any point cannot be allowed to approach zero value. The pressure at any point should be higher than the vapour pressure of water which can be taken as 24 kPa that is 2.45 m of water head. Therefore, maximum head is assumed,
mh 88.745.233.100 =−= (7.21)
1
21 88.781.92
RRLnLRQ ×××=
1
2101
1
21
71.28
43.12
RRLogLRQ
RRLnLRQ
××=
××= (7.22)
7.5.3. Pressure Conditions in the Siphon Spillway Let, H = Total head H = Difference between upstream water level and downstream water level if the outlet end is submerged. H = Difference between upstream level and centre of the outlet if the outlet discharges freely. h = Difference in elevation in the throat and outlet end. (i.e. between points A and C) pa = Atmospheric pressure

A.Bulu 138
HL = Head loss in the whole siphon. hL = Head loss between throat and the outlet end. pvap = Absolute pressure (vapour pressure) at which the water vaporizes and air bubbles and cavitation begins. (Average value of pvap may be taken as 24 kPa which is 2.45 m water head). Applying Bernoulli’s theorem to the points D and C,
( )LC
LC
LC
aa
HHgV
HHg
V
Hg
VpHp
−=
−=
++=+
2
2
22
2
(7.23)
Hence the discharge through spillway is,
( )LHHgAQ −= 2 (7.24)
Where A is the area of cross-section of the bore. Equating this to the general siphon equation,
( )
( )2
2
1
22
CHH
HCHH
gHCAHHgA
L
L
L
−=
=−
=−
(7.25)
Let, pT = Pressure head at the throat, VT = Velocity of flow at the throat. Applying Bernoulli’s theorem between throat and the exit end, we get,
LC
w
aT
W
T hg
Vphg
Vp++=++
22
22
γγ (7.26)
Since the siphon is to run full bore and the area of section is constant between the throat and outlet end,

A.Bulu 139
Lw
a
w
T
CT
hphpVV
+=+
=
γγ (7.27)
It should be noted that the pressure pT at the throat cannot be allowed to approach zero value. Since air dissolved in water begins to separate (vaporize) much earlier than the zero value, the value pT may be assumed to be equal to pvap.
Lw
vap
w
a hpph +⎟⎟
⎠
⎞⎜⎜⎝
⎛−=γγ
Putting,
mp
w
a 33.10=γ
and mp
w
vap 45.2=γ
,
( )
L
L
hhhh
+≤+−≤
88.745.233.10
(7.28)
The maximum difference in elevation between the throat and the outlet end is limited. This limit can be slightly increased by reducing the area of outlet end, in which case VC will be greater than VT and the above equation can be modified to,
⎟⎟⎠
⎞⎜⎜⎝
⎛−−+≤
gV
gVhh TC
L 2288.7
22
(7.29)
The quantity ⎟⎟⎠
⎞⎜⎜⎝
⎛−
w
T
w
a ppγγ
or ⎟⎟⎠
⎞⎜⎜⎝
⎛−
w
vap
w
a ppγγ
is known as the sub-atmospheric pressure head
(paT) at the crest of the throat. The maximum allowable sub-atmospheric pressure head is equal to probable minimum atmospheric head at the location under consideration minus the minimum tolerable residual pressure head (pvap),
w
vap
w
a
w
aT pppγγγ
−= (7.30)
It should be noted that h is always less than H. the total head loss HL consists of,
a) Entry head loss, b) Velocity head loss, c) Conversion head loss, d) Friction head loss, e) Head loss in bends.

A.Bulu 140
Its maximum value seldom exceeds 20% of the operating head H. Again, applying the Bernoulli’s theorem between the inlet and the throat, with crest as datum,
LUT
w
T
w
a hg
Vpp++=
2
2
γγ (7.31)
hLU = Head loss from inlet to throat.
Hence, we get,
LUw
aTLU
w
T
w
aT hphppg
V−=−⎟⎟
⎠
⎞⎜⎜⎝
⎛−=
γγγ2
2
(7.32)
Taking mpp
w
vap
w
T 45.2==γγ
and mp
w
a 33.10=γ
,
( ) LUT hg
V−−= 45.233.10
2
2
(7.33)
LUT hg
V−= 88.7
2
2
(7.34)
7.5.4. Dynamic Force on Spillways When water flows over the curved surface of ogee spillway, there is continuous change of velocity, and there is change in momentum from section to section. According to Newton’s second law of motion, this change in momentum causes a force on the spillway structure. This force is known as dynamic force.
Figure 7.10. Control volume
A
B
F2
F1
FH
FVF
W

A.Bulu 141
Consider an element of water between two sections A and B on a curved surface. The resultant of the forces on the element of water is given by,
( )12 VVQF −=∑ ρ (7.35)
Where, ρ = Specific mass of the water
Rewriting the impuls-momentum equation in horizontal and vertical directions, we get,
( )( )VVV
HHH
VVQF
VVQF
12
12
−=
−=
∑∑
ρ
ρ (7.36)
The forces FH and FV on the free body of fluid include body forces which are gravity and hydrostatic pressure forces.
EXAMPLE 7.5: An ogee spillway discharges water with a head of 1.20 m over the crest. Taking the coefficient of discharge as C = 0.50, compute the dynamic force on the curved section AB which has a constant radius of 3 m. γw = 10 kN/m3. Solution: The discharge over the spillway is,
sec90.262.1920.150.0
2
2
323
23
23
mq
gCHLQq
CLHgQ
=××=
==
×=
10m
1 20m
600
A
B
y
A
B
F2
F1
FH
FVFW

A.Bulu 142
Let y1 and y2 be the depth of sheet of water at A and B, and V1 and V2 be the velocities. Assuming that there is no loss of energy and neglecting approach velocity, we may apply Bernoulli’s theorem at water surface, and at sections A and B. Thus we get,
gVy
gVy
2260cos50.120.11
22
2
210
1 +=++= (1)
22
11
2211
90.2,90.290.2
yV
yV
qyVyV
=→=
===
Substituting these in Equ.(1) and solving by trial and error gives, y1 =0.21 m, y2 = 0.20 m
sec81.1321.090.2
1 mV ==
sec50.1420.090.2
2 mV ==
The free body diagram of the curved control volume between sections A and B in which FH and FV represent components of force on the water by the curved section AB is shown in the Figure. If F1 and F2 are the resultant hydrostatic forces at section A and B, we have,
kNyF
kNyF
w
w
20.020.01021
21
11.060cos21.01021cos
21
2222
02211
=××==
=×××==
γ
αγ
The weight W of the water body in the curved portion between sections A and B is,
kNW 44.62
20.021.0323606010 =⎟
⎠⎞
⎜⎝⎛ +××××= π
Applying impulse-momentum equation for 1 m length of spillway, we get,
( )( ) 00
0122
01
60cos11.020.060cos81.1350.1490.281.9
1060cos60cos
×−+×−××=
−=+−=∑H
HH
F
VVQFFFF ρ
A.Bulu 143
kNFH 6.22=r
Similarly,
( )00
0011
60sin81.1390.281.9
1060sin11.044.6
60sin81.13060sin
×××−×+=
×−××=−−=∑
V
wVV
F
qg
FWFF γ
kNFkNF VV 82.2882.28 =→↓−=↑
Resultant force,
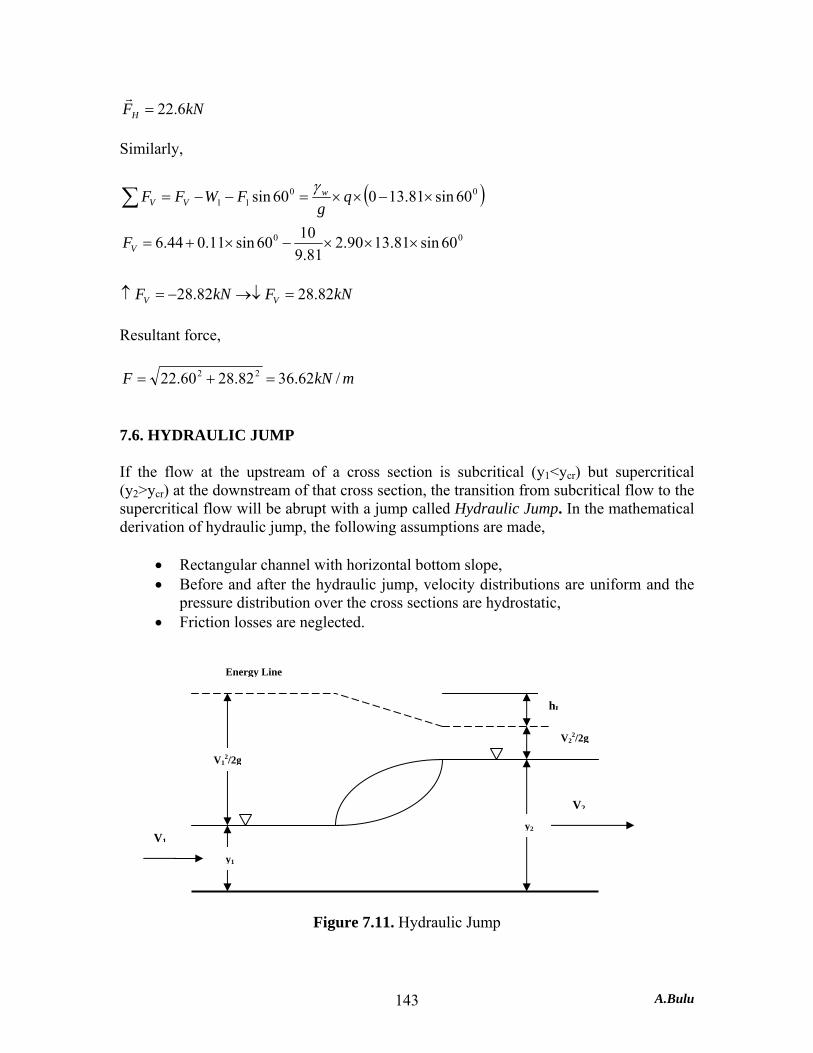
mkNF /62.3682.2860.22 22 =+= 7.6. HYDRAULIC JUMP If the flow at the upstream of a cross section is subcritical (y1<ycr) but supercritical (y2>ycr) at the downstream of that cross section, the transition from subcritical flow to the supercritical flow will be abrupt with a jump called Hydraulic Jump. In the mathematical derivation of hydraulic jump, the following assumptions are made,
• Rectangular channel with horizontal bottom slope, • Before and after the hydraulic jump, velocity distributions are uniform and the
pressure distribution over the cross sections are hydrostatic, • Friction losses are neglected.
Figure 7.11. Hydraulic Jump
V12/2g
y1
V1 y2
V2
V22/2g
hL
Energy Line
A.Bulu 144
Momentum equation will be applied to the control volume taken at the hydraulic jump section for a unit width perpendicular to the control volume,
12
22
21
22qVqVyy ρργγ
−=− (7.37)
Since,
gyqV
yqVyVyVq
ργ =
==→==1
12
22211 , (7.38)
( )
( )( ) ( )
( )
gyV
yyyy
gyV
gqyyyy
yyyyq
yyqyyyyg
yyqy
yqyyg
21
21
1
22
21
21
21
2
2121
21
212
12
22121
121
2
222
222
21
21
22
112
2
=⎟⎟⎠
⎞⎜⎜⎝
⎛+
==+
−=⎟⎟
⎠
⎞⎜⎜⎝
⎛−=+−
⎟⎟⎠
⎞⎜⎜⎝
⎛−=− ρρ
Multiplying both side of the above equation with (1/y1
3) yields,
⎟⎟⎠
⎞⎜⎜⎝
⎛×⎥⎦
⎤⎢⎣
⎡=⎟⎟
⎠
⎞⎜⎜⎝
⎛+ 3
1
21
21
1
22
21
121yg
yVyyyy
1
21
1
2
1
2 21gyV
yy
yy
=⎟⎟⎠
⎞⎜⎜⎝
⎛+ (7.39)
Since for rectangular channels,
gyVFr = (7.40)
Equ. (7.39) takes the form of,
02 21
1
2
2
1
2 =−+⎟⎟⎠
⎞⎜⎜⎝
⎛Fr
yy
yy (7.41)
A.Bulu 145
Solution of this equation and taking the positive sign of the square root gives,
( )18121 2
1
21−+= rF
yy (7.42)
The ratio of flow depths after and before the hydraulic jump (y2/y1) is a function of the Froude number of the subcritical flow before hydraulic jump. 7.6.1. Hydraulic Jump as an Energy Dissipater If we write the difference of the specific energies before after the hydraulic jump,
( ) ⎟⎟⎠
⎞⎜⎜⎝
⎛−+−=Δ
⎟⎟⎠
⎞⎜⎜⎝
⎛+−⎟⎟
⎠
⎞⎜⎜⎝
⎛+=−=Δ
gV
gVyyE
gVy
gVyEEE
22
222
22
121
22
2
21
121
(7.43)
Since,
22
11 ,
yqV
yqVVyq ==→=
( ) ⎟⎟⎠
⎞⎜⎜⎝
⎛−+−=Δ 2
221
2
2111
2 yygqyyE (7.44)
It has been derived that,
( )gqyyyy
2
21212
=+ (7.45)
( )2121
2
41
2yyyy
gq
+= (7.46)
Substituting Equs. (7.46) to (7.44),

A.Bulu 146
( ) ( )
( ) ( ) ( )
( ) ( ) ( )
( ) ( )[ ]
( )( )21
21212
21
2212112
21
122
212121
21
122
2121
22
21
21
22
212121
4
44
44
41
41
yyyyyyE
yyyyyyyyE
yyyyyyyyyyE
yyyyyyyyE
yyyyyyyyyyE
−−=Δ
++−−=Δ
−++−=Δ
−++−=Δ
−++−=Δ
The analytical equation of the energy dissipated with the hydraulic jump is,
( )21
312
4 yyyyE −
=Δ (7.47)
The power lost by hydraulic jump can be calculated by,
EQN w Δ= γ (7.48)
Where, γw = Specific weight of water = 9.81 kN/m3 Q = Discharge (m3/sec) ΔE = Energy dissipated as head (m) N = Power dissipated (kW) Some empirical equations were given to calculate the length of hydraulic as, L = 5.2y2 Safranez equation
L = 5(y2 – y1) Bakhmetef equation (7.49) L = 6(y2 – y1) Smetana equation
L = 5.6y2 Page equation

A.Bulu 147
Physical explanation of Equs. (7.42) and (7.47) gives that,
a) If 0111
21 =Δ→=→= E
yyFr (critical flow)
b) If 011
21 >Δ>→→> E
yyFr (hydraulic jump)
c) If 0111
21 <Δ→<→< E
yyFr (Energy gain is not possible. Transition from
supercritical to subcritical flow is with gradual water surface profile) 7.6.2. Physical Explanation of Critical Flow It has been derived that,
( )212122 yyygyq += (7.50)
Since for rectangular channels,
32
3
2
cr
cr
gyq
gqy
=
= (7.51)
Equation (7.39) can be written as,
( )212132 yyyyycr += (7.52)
If multiply both sides with ⎟⎟⎠
⎞⎜⎜⎝
⎛3
1
cry,
crcr yyy
yyy 2
212212 += (7.53)
Defining as,
crcr yyY
yyY 2
21
1 , ==
Equ. (7.53) takes the form of,
A.Bulu 148
022212
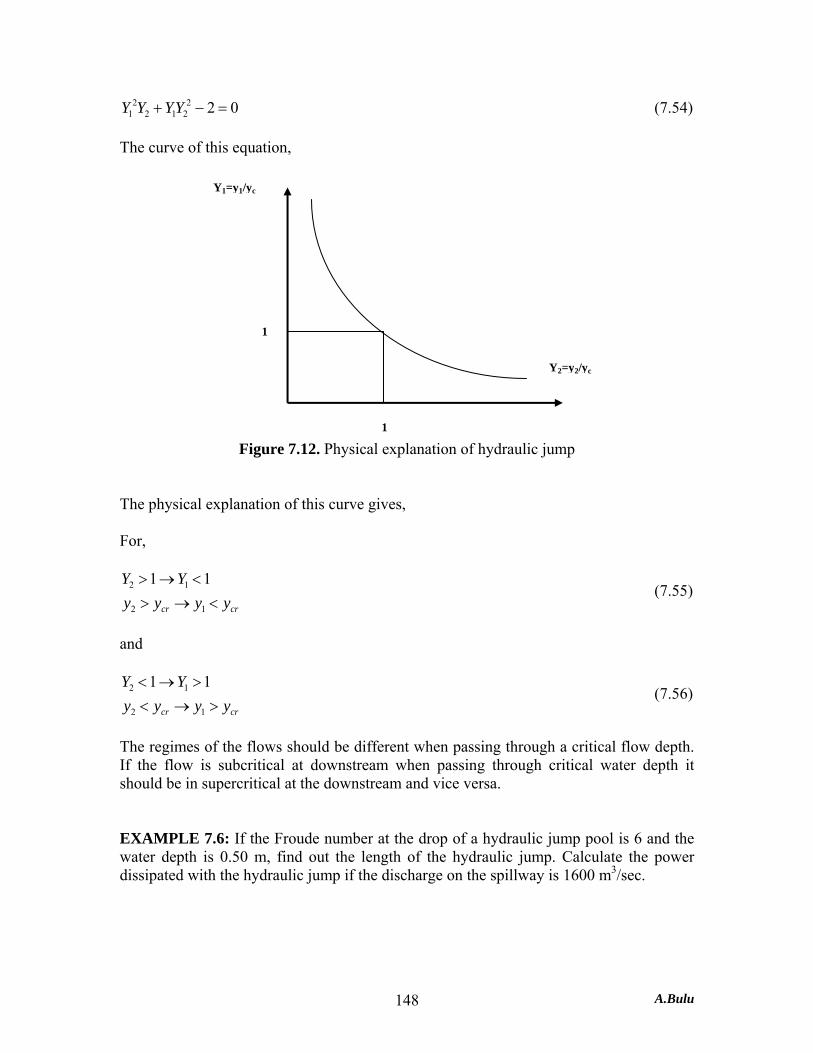
21 =−+ YYYY (7.54)
The curve of this equation,
Figure 7.12. Physical explanation of hydraulic jump
The physical explanation of this curve gives, For,
crcr yyyyYY
<→><→>
12
12 11 (7.55)
and
crcr yyyyYY
>→<>→<
12
12 11 (7.56)
The regimes of the flows should be different when passing through a critical flow depth. If the flow is subcritical at downstream when passing through critical water depth it should be in supercritical at the downstream and vice versa. EXAMPLE 7.6: If the Froude number at the drop of a hydraulic jump pool is 6 and the water depth is 0.50 m, find out the length of the hydraulic jump. Calculate the power dissipated with the hydraulic jump if the discharge on the spillway is 1600 m3/sec.
Y1=y1/yc
Y2=y2/yc
1
1
A.Bulu 149
Solution: Using the equation of the ratio of water depths,
( )( )
myyyy
Fryy
485.08
8168121
18121
12
2
1
2
21
1
2
=×=×=
=−×+=
−+=
The length of hydraulic jump by different equations,
myL 8.2042.52.5 2 =×=×= (Safranez)
( ) ( ) myyL 5.175.0455 12 =−×=−= (Bakhmetef)
( ) ( ) myyL 215.0466 12 =−×=−= (Smetana)
myL 4.2246.56.5 2 =×=×= (Page)
It is preferred to be on the safe side with the hydraulic structures. Therefore, the longest result will be chosen. The length of the hydraulic jump will be taken as L = 22.4 m for design purposes. Energy dissipated as head,
( )
( ) mE
yyyyE
36.545.04
5.04
43
21
312
=××
−=Δ
−=Δ
The power dissipated with the hydraulic jump,
kWNN
EQN w
8413136.5160081.9
=××=
Δ= γ
7.7. ENERGY DISSIPATER HYDRAULIC STRUCTURES

A.Bulu 150
Hydraulic structures are designed so that hydraulic jumps occur under controlled conditions in a structure called a stilling basin. The positioning of a hydraulic jump on an unobstructed horizontal surface is very sensitive to the close match of sequent depths. If the downstream depth matches the sequent depth y2, the hydraulic jump will occur as desired on the apron. If the downstream depth is less than y2, y3<y2, the jump will occur downstream from the apron (a swept-out jump), and the river will become exposed to high scouring velocities. If the downstream depth is greater than y2, y3>y2, the jump will be submerged. Although a submerged jump is preferable to a swept-out jump, much of the initial kinetic energy remains in the form of a submerged jet, which alone can result in considerable scour. A carefully designed stilling basin will not only improve the dissipation characteristics of a hydraulic jump, it will shorten its length and stabilize the position of the jump so that it is not sensitive to fluctuations in tailwater levels. This latter attribute makes the design safer,
Figure 7.13
Stilling basins are often furnished with appurtenances such as chute blocks, baffle blocks, and end sills. Chute blocks, located at the entrance to the stilling basin, help initially to spread some of the water in the vertical plane. The resisting force of the baffle blocks on the flow (reaction to the drag on the block) helps the downstream hydrostatic pressure force create and stabilize the jump. Because of their blunt shape, cavitation on the blocks can be a concern when velocities are high. The sill at the end of the basin lifts the flow away from the downstream bed and produces a return current that deposits bed material immediately downstream from the stilling basin. Because stilling basin block arrangements are difficult to design analytically, their design must be based on experimental methods. Standard designs have been developed through both observations of existing installations and a systematic series of model studies. Three types of stilling basins are developed by the U.S. Bureau of Reclamation are shown in Fig. (7.13-7.15).
A.Bulu 151
The dimensions D1 and D2 in the Figures take the same as y1 and y2, respectively. The lengths LII, LIII and LIV are given as follows,
( )[ ]5.4055.00.4 12 −+= FryLII for 4.5<Fr1<10 (7.57)
235.4 yLII = for Fr1>10
( )[ ]5.4073.04.2 12 −+= FryLIII for 4.5<Fr1<10 (7.58)
28.2 yLIII = for Fr1>10
( )[ ]5.240.02.5 12 −+= FryLIV (7.59)
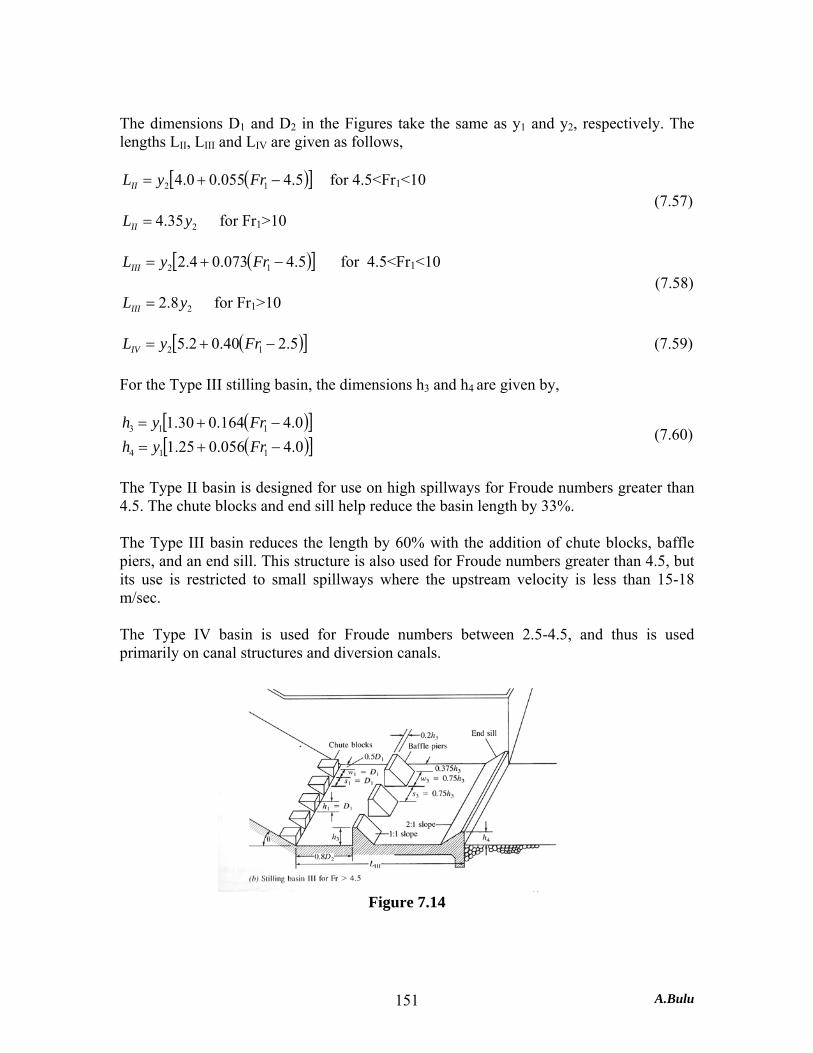
For the Type III stilling basin, the dimensions h3 and h4 are given by,
( )[ ]( )[ ]0.4056.025.1
0.4164.030.1
114
113
−+=−+=
FryhFryh
(7.60)
The Type II basin is designed for use on high spillways for Froude numbers greater than 4.5. The chute blocks and end sill help reduce the basin length by 33%. The Type III basin reduces the length by 60% with the addition of chute blocks, baffle piers, and an end sill. This structure is also used for Froude numbers greater than 4.5, but its use is restricted to small spillways where the upstream velocity is less than 15-18 m/sec. The Type IV basin is used for Froude numbers between 2.5-4.5, and thus is used primarily on canal structures and diversion canals.
Figure 7.14
A.Bulu 152
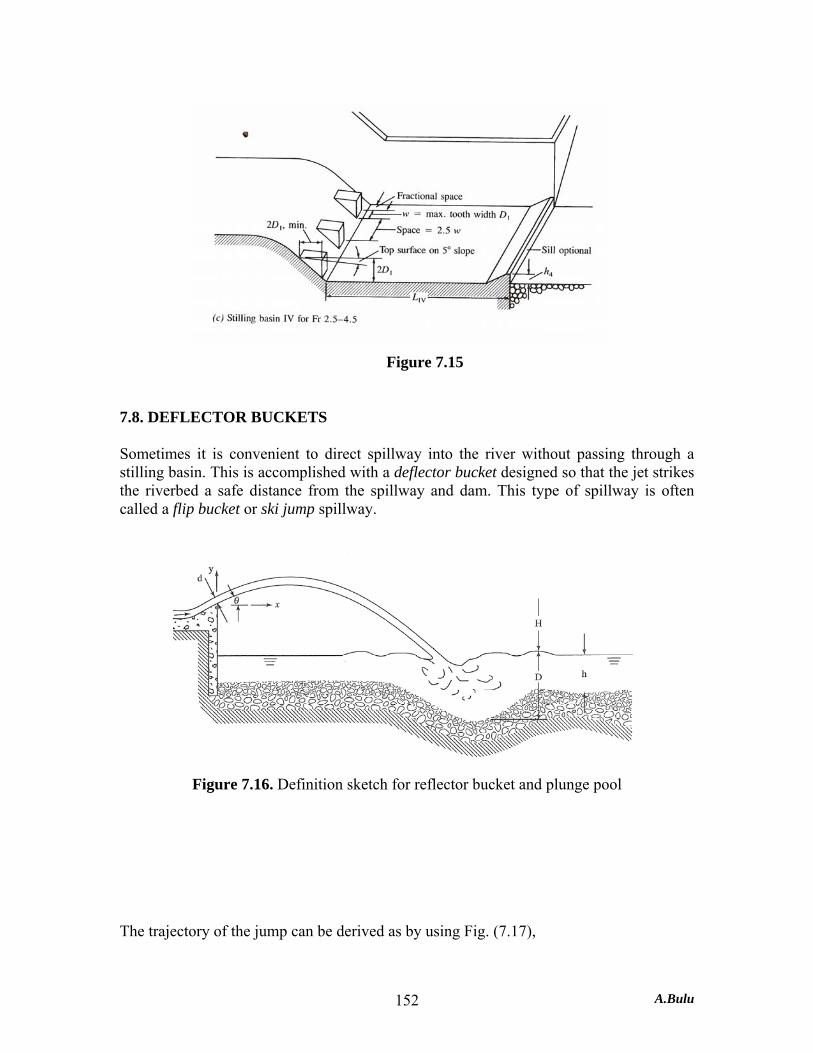
Figure 7.15
7.8. DEFLECTOR BUCKETS Sometimes it is convenient to direct spillway into the river without passing through a stilling basin. This is accomplished with a deflector bucket designed so that the jet strikes the riverbed a safe distance from the spillway and dam. This type of spillway is often called a flip bucket or ski jump spillway.
Figure 7.16. Definition sketch for reflector bucket and plunge pool
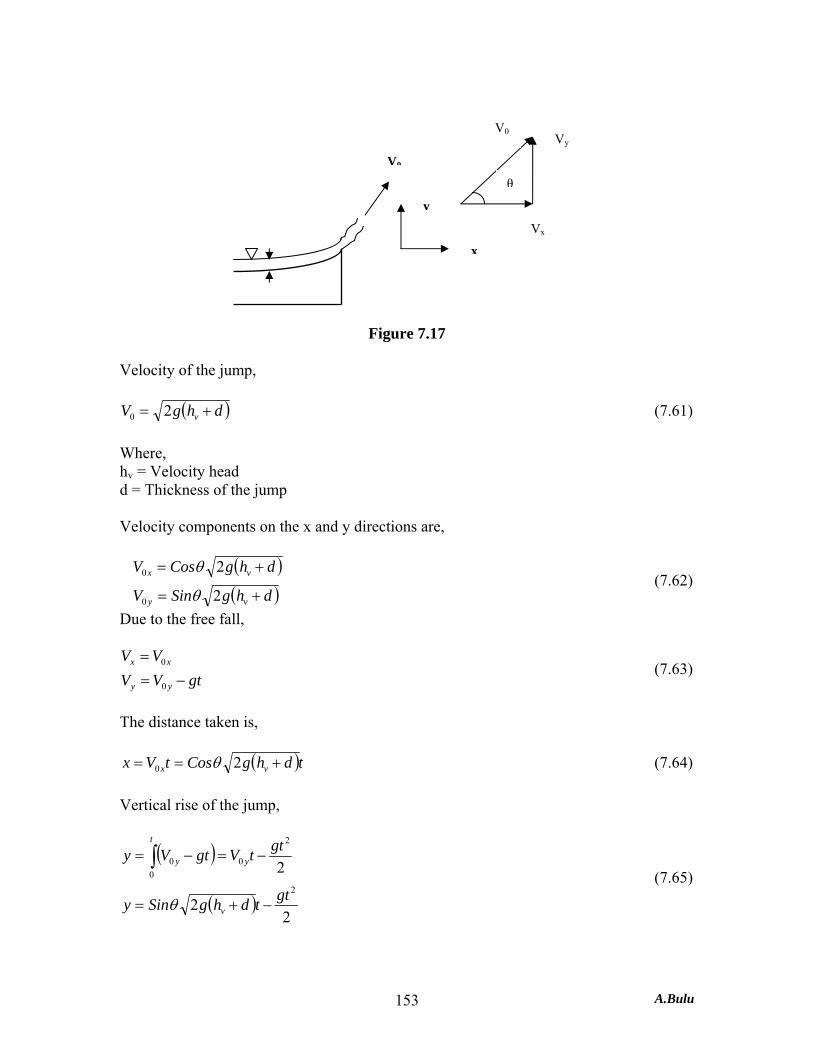
The trajectory of the jump can be derived as by using Fig. (7.17),
A.Bulu 153
Figure 7.17
Velocity of the jump,
( )dhgV v += 20 (7.61) Where, hv = Velocity head d = Thickness of the jump Velocity components on the x and y directions are,
( )( )dhgSinV
dhgCosV
vy
vx
+=
+=
2
2
0
0
θ
θ (7.62)
Due to the free fall,
gtVVVV
yy
xx
−==
0
0 (7.63)
The distance taken is,
( )tdhgCostVx vx +== 20 θ (7.64) Vertical rise of the jump,
( )
( )2
2
22
2
00
0
gttdhgSiny
gttVgtVy
v
y
t
y
−+=
−=−= ∫
θ
(7.65)
V0 Vy
Vx
θ
x
y
V0
A.Bulu 154
Eliminating t by,
( )dhgCosxt
v +=
2θ (7.66)
Substituting this to equation (7.65),
( )( ) ( )dhgCos
xgdhgCos
xdhgSinyvv
v+××
×−+
×+=222
2 2
2
θθθ
( )dhCosxxy
v +−=
θθ 2
2
4tan (7.67)
When the free jet discharging from the deflection bucket falls into an erodible riverbed, a plunge pool is eroded to a depth that depends primarily on the unit discharge and to a lesser extent the size of the fall, tailwater depth and particle size. U.S. Bureau of Reclamation proposes,
54.0225.090.1 qHD = (7.68)
where D = Depth of scour measured from the tailwater (meters) q = Discharge per unit width (m3/sec/m) H = Drop in elevation from reservoir water surface to tailwater (meters)