Embed Size (px)
Citation preview
Microeconomics Exam – 12 June 2015 – 8:45am Royal Ballroom Randwick Racecourse Opportunity Cost and Comparative Advantage
Production Possibility Curve (PPC): captures all maximum output possibilities for two or more goods, given a set of inputs if all the available inputs are used
o Efficient production points: all resources used efficiently o Inefficient production points: resources used inefficiently
Absolute advantage: when an agent can carry on an activity using less resources (eg. time) than another agent
Opportunity cost: the value of the next best alternative to that particular action (slope of the curve)
o Eg. OCbananas: 𝑙𝑜𝑠𝑠 𝑖𝑛 𝑟𝑎𝑏𝑏𝑖𝑡𝑠
𝑔𝑎𝑖𝑛 𝑖𝑛 𝑏𝑎𝑛𝑎𝑛𝑎𝑠 or OCrabbits:
𝑙𝑜𝑠𝑠 𝑖𝑛 𝑏𝑎𝑛𝑎𝑛𝑎𝑠
𝑔𝑎𝑖𝑛 𝑖𝑛 𝑟𝑎𝑏𝑏𝑖𝑡𝑠
Comparative advantages: when an agent has a lower opportunity cost of carrying on an activity than another agent
o Everyone is better off if an agent specialises in the activity for which they have a comparative advantage
Low-hanging fruit principle (increasing opportunity cost): in the process of increasing production of any good, one first employs those resources with the lowest opportunity cost
Shifts in PPC: o Increase in infrastructure (factories, equipment etc.) o Increase in population and therefore labour force o Advancements in knowledge/technology (education, research and development, IT and
communication technologies) Consumption Possibility Curve (CPC): shows all combinations of the two goods that agents in
economies can consume (open economy) o If a country is closed: PPC = CPC because agents consume what they produce o If a country is open: CPC > PPC because part of production can be traded which relieves
restrictions on consumption Critiques of model:
o Assumed no psychological costs of performing only one activity o Assumed no transaction costs (transportation, negotiation etc.) o Specialisation comes with risks as economic and global environment changes o Does not take into account preferences or social norms (political, religious etc.) that
might prevent trade Tutorial Notes
o Curve PPC = opportunity cost is increasing (moving down) o Straight PPC = opportunity cost is constant o No PPC = no limitations, everything is attainable o Flatter slope = lower opportunity cost of product on x-axis o The greater the difference in opportunity cost, the greater the trade benefits
Perfectly Competitive Markets
Markets: the market for a given good or service is the set of all the consumers and suppliers who are willing to buy and sell that good or service
Market Equilibrium: occurs when the price and the quantity of a given good is stable Characteristics of perfectly competitive markets
o Consumers and suppliers are price-takers: both are stuck at the prevailing market price and there is no reason for either to change behaviours (lose customers or fail to acquire good)
o Homogeneous goods: all suppliers sell exactly the same product o No externality: all production costs and benefits are incurred by the consumer (an
external cost is a cost incurred by someone who is not involved in the production/consumption of the good)
o Goods are excludable and rival: suppliers can prevent consumers from consuming a certain good and, once consumed, that good becomes unavailable to other consumers
o Full information: suppliers and consumers are perfectly informed regarding characteristics of the good (quality and price)
o Free entry and exit Supply in a perfectly competitive market
o Marginal benefit: the extra benefit accrued by producing that unit o Marginal cost: the extra cost of producing that unit o Cost-benefit principle: an action should be taken if the marginal benefit is greater than
the marginal cost o Economic surplus: the difference between the marginal benefit and marginal cost of
taking that action o The law of supply: the tendency for a producer to offer more of a certain good or service
when the price of that good or service increases How to derive the supply curve for a firm
o Entrepreneur pays sunk cost: costs that once paid cannot be recovered (eg. loan for machinery)
o Fixed factor of production: cost associated with it does not vary with the quantity produced (the short run is a period of time during which at least 1 FOP is fixed eg. machinery)
o Variable factor of production: cost associated with it tends to vary with the number of units produced (the long run is a period of time during which all FOP are variable eg. labour)
o Calculating: Variable Cost = 𝐴𝑉𝐶
𝑄 Total Cost =
𝐴𝑇𝐶
𝑄 Marginal Cost =
∆𝑇𝐶
∆𝑄
o Profit: difference between total revenues and total costs o Shut down condition in the short run: Profit of Production < Fixed Cost o Exit Condition in the long run: Profit of Production < 0
Factors shifting supply curve: o Technology: reducing the unit cost of production o Input prices: change in the price of inputs will affect the production capacity of a
firm/industry which is reflected in supply o Expectations: expected future price/demand changes make suppliers adjust their
behaviour to take advantage of/shield themselves from new opportunities o Change in pricing for other products: shift in productive focus to their high demand
good o Number of suppliers: Increased number of suppliers right shift in AS Curve
Price elasticity of supply o Definition: denotes the percentage change in the quantity supplied resulting from a very
small percentage change in price
o PES = 𝑃𝐴
𝑄𝐴 ×
1
(∆𝑃
∆𝑄)
o Supply curves have the tendency to be upwards sloping: increased prices = increased quantity supplied
o A product is: Elastic if elasticity of supply > 1 Unit Elastic if elasticity of supply = 1 Inelastic if elasticity of supply < 1
Determinants of price elasticity of supply (What affects the willingness of sellers to adjust their productive decisions after a price change)
o Availability of raw materials: increased availability = more elastic o Factors mobility: if a firm can easily divert its FOP from one good to another, then it can
rapidly increase production of those goods if in demand = more elastic
o Inventories/excess capacity: increased inventories/capacity = more elastic o Time horizon: if time horizon is long enough, producers can search for alternative
inputs and revise their production plans more conveniently Vertical interpretation: price indicates minimum amount of money the producer is willing to
accept Horizontal interpretation: quantity indicates how many units the producer is willing to supply
at this price Demand in a perfectly competitive market
o Utility: way of expressing the satisfaction that an individual derives from consumption, measured in utils per unit of time
o Decreasing marginal utility: implies that the utility from consuming an extra unit of a given good decreases with the number of units that have been previously consumed
o Quantity demanded: quantity of a given good or services that maximises the utility experienced by the individual consuming it
o Substitution effect: captures the change in the quantity demanded of a given good following a change in its relative price
o Income effect: captures the changes in the quantity demanded of a given good following the reduction in the consumer’s purchasing power
Unlike the substitution effect (which always reduces the quantity consumed following an increase in price) the income effect can go either way
Normal good: increased income = increased consumption (expensive wine)
Inferior good: increased income = decreased consumption (fast food) o Law of demand: demand curves have the tendency of being downward sloping
(increased price = decreased demand) Demand Curve
o Displays: the relationship between the price of a given food or service and the quantity demanded of it
Horizontal interpretation: start at price and find associated quantity Vertical interpretation: start at quantity and find associated price indicating the
amount of money a consumer is willing to pay (reservation price) o Substitute: when an increase in the price of one good causes an increase in the quantity
demanded of the other (shifting curve to right) o Complements: when a decrease in the price of one good causes an increase in the
quantity demanded of the other Factors shifting the demand curve to the right
o Successful marketing campaign o Decrease in price of complements o Increase in price of substitutes o Increase in income for a normal good o Decrease in income for an inferior good o Positive shit in consumer’s preference o Expectations of an increase in future prices pushing buyers to purchase good early o Population growth
Price elasticity of demand o Displays: the percentage change in quantity demanded resulting from a very small
percentage change in price o PED is almost always negative (when price increases, quantity demanded decreases
downward sloping) o Demand is:
Elastic if PED is > 1 Unit elastic if PED = 1 Inelastic if PED < 1
Determinants of price elasticity of demand
o Availability of substitutes: increased substitutes = more elastic o Definition of a good: broader definition = less elastic o Income share: increased share of income needed = more elastic o Time horizon: longer time horizon = more elastic (buyers can search for alternatives)
Demand and Supply: an Equilibrium Analysis Obtaining aggregate demand and supply curves: horizontal sum of the individual demand and
supply curves Excess supply: quantity supplied is more than demanded Excess demand: quantity demanded is more than supplied Equilibrium price and quantity: represents the price such that the quantity supplied equals the
quantity demanded Reservation price (buyer): highest price a buyer is willing to pay for a given good Reservation price (seller): lowest price a seller is willing to accept for a given good
o Reflects the opportunity costs associated with acquiring (for the buyer) and producing (for the sellers) the good, measured in dollars
Rationing rule: the buyers who value the good more will be the first to buy it Consumer surplus: the difference between what a consumer pays for a good/service and what
she is willing to pay for it (ie. her reservation price) Producer surplus: the difference between the price a seller receives for a good/service and
what he is willing to receive for it (ie. his reservation price) Total consumer surplus: area below demand curve and above equilibrium Total producer surplus: area above supply curve and below equilibrium Tutorial Notes:
o Adjustment process when price below equilibrium: consumers with higher reservation prices offer more for good and seller will increase price until these consumers purchase
Pareto efficiency: situation where it is impossible to make any individual better off without making at least one other person worse off a state where no pareto improvements can occur (market equilibrium is pareto efficient)
o Pareto improvement: action in an economy that makes at least one person better off and no one worse off
o Society should facilitate markets in their quest of maximising social surplus and achieving pareto efficiency – once this is achieved, society should consider how to redistribute the surplus in order to realise other goals such as equality of resources
o Total economic surplus is maximised o No additional opportunity for gains at the expense of anyone else as all gains have been
captured o In the short run: profits are positive o In the long run: economic profit = 0 as price equals minimum ATC
Markets have ability to push firms to produce at the lowest possible total cost likely to occur in long run
o If firms maximise profit new firms will enter increasing supply pushing down prices
o Entry continues until the point where profits = 0 and the market price = minimum average total cost
Invisible hand principle: an individuals independent efforts to maximise gains will generally be beneficial for society and result in a socially optimal allocation of resources
In the long run: demand shifts have no effect on equilibrium price as new suppliers enter the market and price remains stable at the minimum ATC (this only holds true if all firms have the same identical product technology)
Government Intervention Interfering with Market Forces Price ceiling: represents a maximum allowable price imposed by the government
o Forces prices down = excess demand
o Buyers with highest reservation price will acquire good at a lower price (surplus increases [A’] compared with the surplus they get in absence of price ceiling [A])
o Reduction in quantity producers supply certain consumers left unserved (B) consumers are also worse off (C C’)
o Total surplus before price ceiling = A + B + C, total surplus after price ceiling = A’ + C’ o If government wanted to help low-income households, lump sum would be more
efficient instead of reducing total surplus o Winners from policy usually those with high reservation prices
Deadweight loss: loss in economic surplus due to market being prevented from reaching the equilibrium price and quantity where marginal benefit equals marginal cost
Price floor: minimum allowable price imposed by the government o Generates excess supply producers benefit from higher price levels o Consumers and producers who are unable to sell their products are worse off o Decrease in total surplus o Deadweight loss
Taxation: tax revenues used to redistribute wealth within a society
o Equilibrium price increases equilibrium quantity decreases o Reduction in surplus fro the consumers o Consumers bear only a fraction of the tax burden because they suffer an increase in
price smaller than the full tax amount (difference between Ptax and P*) o Producers marginal revenue = Ptax – 1 (loss in producer surplus [compare S with S’])
Inelastic demand: burden falls more on consumers Elastic demand: burden falls on producers Unit elastic: burden shared equally
o Government better off (tax × no. of units) o Deadweight loss: after tax, market reaches an equilibrium price and quantity where
marginal benefit = marginal cost + tax o If vital services provided by tax come at a cost of dead weight loss then society will be
better off with tax The more elastic supply and demand is, the larger deadweight loss and lower tax
revenues Subsidy: opposite of a tax (government pays firms)
o Marginal cost decreases by tax amount o Supply curve shifts to right o Reduction in price o Increased in quantity exchanged o Change in surplus from C + P to C’ + P’ – S o Subsidy creates a deadweight loss
International Trade
A country can gain from trade by moving towards specialising in goods they have a comparative advantage in making and then exporting these goods
Domestic price: equilibrium price that would occur without international trade (Pd) World price: equilibrium price on the international market (Pw) Small open economy: participates in an international market for goods and services but its
production or consumption is small enough compared to the rest of the world that it’s supply or demand does not affect Pw
If Pd < Pw, the country has a comparative advantage and will become an exporter Exporting Country:
o Closed Economy Consumer surplus: A + B + C Producer surplus: E + F
o Open Economy
Consumer surplus: A Producer surplus: B + C + D + E + F Gains from trade: extra total surplus available in an open economy compared to
closed economy Importing Country:
o Closed Economy Consumer surplus: A Producer surplus: B + E
o Open economy Consumer Surplus: A + B + C + D Producer surplus: E
Winners and losers from international trade o Total surplus is higher with trade
Domestic consumers lose surplus when goods are exported Domestic producers lose surplus when importing
o Benefits from trade: Consumers have access to a wider variety of goods Producers may be able to take advantage of economies of scale by selling to a
larger market Domestic monopolies or oligopolies might face international competition,
reducing market power The flow of idea and technologies is faster and easier
Trade Restrictions o Tariff: a tax on imported goods or services
Domestic consumers lose H + I + J + K Consumers lose more than what producers and government gain Deadweight loss I + K
o Quota: a limit on the quantity of goods or services permitted to be imported Consumers lose H + I + J + K Producers gain H Quotas can be corrupt
Imperfectly Competitive Markets Market Power (monopoly): if the firm has the ability to set its own price (AKA price takers or
setters) when they increase price they don’t lose all of their consumers Imperfectly competitive market: market composed by firms that have some market power Forms of imperfectly competitive markets:
o Monopoly: only one firm in the market, hence their demand curve coincides with the market demand curve (eg. Microsoft, Australia post, local natural gas companies)
o Monopolistic competition: large number of firms each producing a slightly differentiated product (eg. the restaurant industry and petrol stations)
Provides a measure of market power Italian restaurants can raise prices without losing all sales as Japanese food is not a perfect substitute
o Oligopolistic competition: small number of firms that sell goods that are close substitutes (eg. Fairfax, grocery retailers, banks)
Determinants of market power o Barriers to entry:
Control over scarce resources: if a firm has exclusive control over some key inputs of production it may be impossible for other firms to enter the market (eg. OPEC’s control over oil)
Government created barriers to entry: by issuing patents, offering copyright protection and granting licenses (eg. pharmaceutical company owning rights for a particular drug monopoly in the market)
Increasing returns to scale: increasing returns to scale (economies of scale) when the ATC of producing a good decreases with the amount of the good produced
Firm also becomes more profitable with size (a single firm producing a large quantity can do so more efficiently than a large number of firms producing a small amount)
Industries featuring economies of scale dominated by a small number of large firms (natural monopoly) (eg. public utilities such as water/electricity/gas require costly infrastructure to operate and therefore feature increasing returns to scale)
Monopoly Definition: a market structure where there is only one firm operating in the market Demand curve for monopolist is downward sloping and measure marginal benefit or
reservation price for different amounts of the good that are consumed o Reflects
Marginal revenue: ∆𝑟𝑒𝑣𝑒𝑛𝑢𝑒
∆𝑞𝑢𝑎𝑛𝑡𝑖𝑡𝑦
Increasing supply: consumers gain from having more foods in the market however the monopolist would be worse off:
o Profit decreases when extra workers are hired o In order to sell extra unit and attract new customers, monopolist must reduce the price
The implicit cost in increasing quantity sold, leading to an equilibrium production level lower than the socially optimal level
o Socially optimal level of output: expand production until marginal benefit equals marginal cost
Monopoly equilibrium production o Invisible hand principle does not apply: in this case when the monopolist maximises its
profits the result is not socially optimal Government Regulation
o Competition law: intended to foster market competition by regulating the anti-competitive conduct of firms
Ensure consumers are charged the lowest possible prices o Government intervention may create inefficiencies: a single firm producing a large
quantity of a good can do so more efficiently than a large number of firms producing small quantities
o In order to restore the socially optimal outcome in the presence of a natural monopoly, governments often regulate the price at which the monopolist is allowed to sell its products
o Average cost pricing: government forces monopolist to set the price and quantity at the intersection of the ATC curve and the demand curve (eliminating positive profits accrued)
However, the government can only estimate the ATC Firms have no incentive to invest in new technology to lower production cost –
they make 0 profit Firms output is allocatively inefficient: price asked for goods produced exceeds
their marginal cost Government could set price ceiling to lower price May force monopolist to make negative profits
First degree price discrimination o Occurs when the monopolist knows the reservation price of each consumer and is able
to charge each consumer his marginal benefit (or reservation price) o Cost benefit principle: monopolist should expand production until the marginal revenue
is equal to the marginal cost
o When a monopolist can engage in first degree price discrimination they are actually selling the socially optimal quantity (which maximises social surplus)
o Distribution of surplus becomes uneven (consumers have 0 surplus after being charged their reservation price)
Second degree price discrimination o Monopolist charges different prices depending on quantity demanded by each
consumer o By offering discounts to larger purchases, the monopolist distinguishes between high
and low reservation price Third degree price discrimination
o Monopolist charges different prices depending on observable consumer attributes such as location
o Shift in surplus from monopolist to consumer Oligopoly
Definition: a market structure that features a small number of firms Australian examples: grocery retailing, media outlet industry, banking sector Actions of one firm have a direct impact on the other firms
o Strategic interactions among firms: in making its own decision, a firm tries to anticipate what other firms are about to do
Use game theory to study interactions All games are simultaneous: players move simultaneously or, alternatively, are unaware of the
other players actions Simple entry game: social networking industry
o Face limited competition: owing to high barriers to entry o Economies of scale and network economies o Developing infrastructure/large user base is costly o May take years before fixed costs mitigated by advertisement income
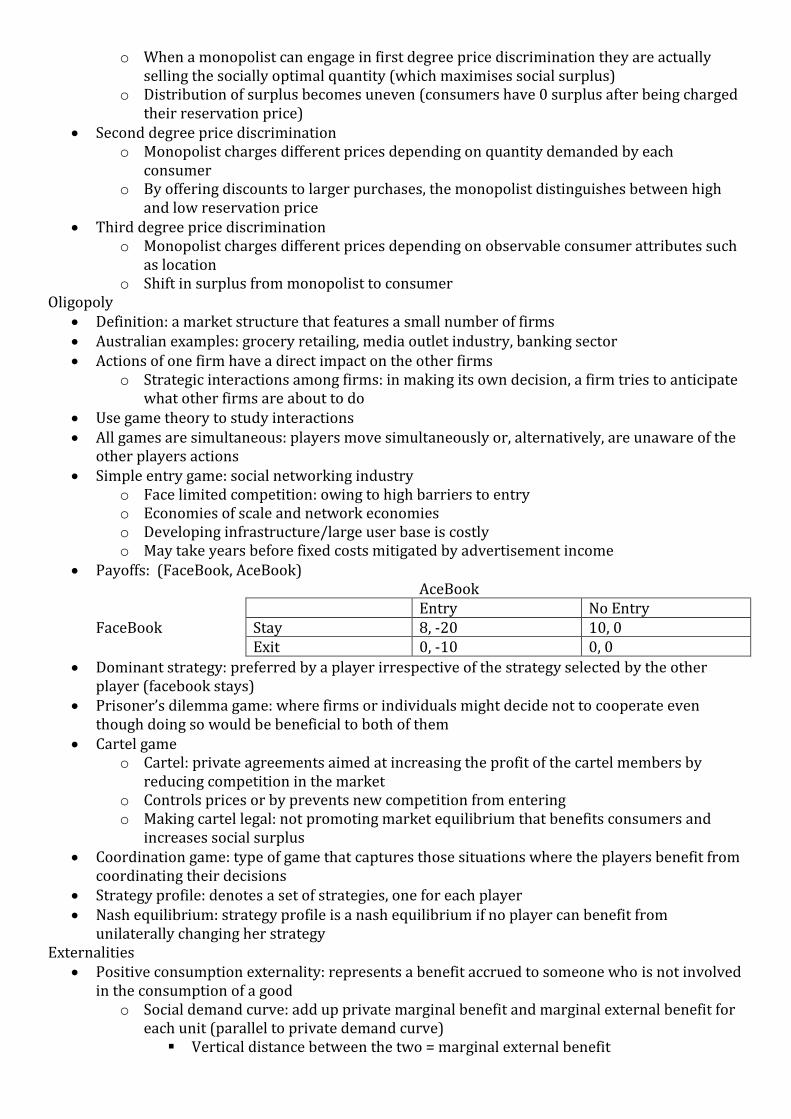
Payoffs: (FaceBook, AceBook) AceBook
Entry No Entry FaceBook Stay 8, -20 10, 0
Exit 0, -10 0, 0
Dominant strategy: preferred by a player irrespective of the strategy selected by the other player (facebook stays)
Prisoner’s dilemma game: where firms or individuals might decide not to cooperate even though doing so would be beneficial to both of them
Cartel game o Cartel: private agreements aimed at increasing the profit of the cartel members by
reducing competition in the market o Controls prices or by prevents new competition from entering o Making cartel legal: not promoting market equilibrium that benefits consumers and
increases social surplus Coordination game: type of game that captures those situations where the players benefit from
coordinating their decisions Strategy profile: denotes a set of strategies, one for each player Nash equilibrium: strategy profile is a nash equilibrium if no player can benefit from
unilaterally changing her strategy Externalities
Positive consumption externality: represents a benefit accrued to someone who is not involved in the consumption of a good
o Social demand curve: add up private marginal benefit and marginal external benefit for each unit (parallel to private demand curve)
Vertical distance between the two = marginal external benefit
o By making consumption decisions without accounting for their external benefit, you are not maximising social surplus
o Deadweight loss due to presence of positive consumption externalities o Limitations of invisible hand principle
Doing what’s best for you maximises own satisfaction but does not translate into optimal consumption level for society
o Under-consumption sold by private negotiation o Inefficiency arising from externalities solved without government intervention = Coase
theorem If trade in an externality is possible and there are no transaction costs,
bargaining will lead to an efficient outcome regardless of the initial allocation of property rights
o Positive consumption externalities Fitness activities: reduces health care costs incurred to society Vaccinations: reduces likelihood that others get infected Bike to work: reduces traffic congestion and pollution Education: positive impact on society in form of increased productivity Social networking: potential to enrich experience for other members Fire protection services: individual reduces likelihood that a fire originated in
their home may spread to others Negative production externality: represents a cost incurred by someone who is not involved in
the production of a given good o Maximise social surplus when social marginal cost = marginal benefit o Over production resolved with private bargaining o Negative production externalities
Harmful production activities: firms impose cost on society by increasing pollution (eg. global warming)
Excessive risk taking: banks can start global financial crises that can affect millions of people
Over-fishing: run the risk of depleting stock of fish in ocean Externalities in large markets
o M = market equilibrium, o O = socially optimal price and quantity o Deadweight loss: market operating at M o Coase’s condition no longer applies: the sheer number of buyers/sellers creates high
transaction costs during negotiation o Government interventon (taxes and subsidies) necessary to fix what the market cannot
handle on its own Subsidy: equal to marginal external benefit would shift the private demand curve
to right to the point where the new private demand curve (including subsidy) is identical to social demand curve
Social optimal quantity is then realised (point O) Tax: tax equal to marginal external cost would shift the private supply curve to
left to point where new private supply curve (including tax) intersects the private demand curve (point O)
Tutorial Notes: o To find socially optimal quantity, equate MC with AD
o Negative consumption externality: cost incurred by someone who is not involved in the
consumption of a given good Smoking: imposes health cost on people surrounding them Alcohol abuse: increases health care costs incurred by society Driving: increases traffic congestion and pollution
o Positive production externality: benefit accrued to someone not involved in the production of a given good
Beneficial production activities: firm benefits firms surrounding (eg. airport shops)
New production technologies: firm creates useful knowledge for other firms On-the-job training: improves employee’s productivity useful for other firms
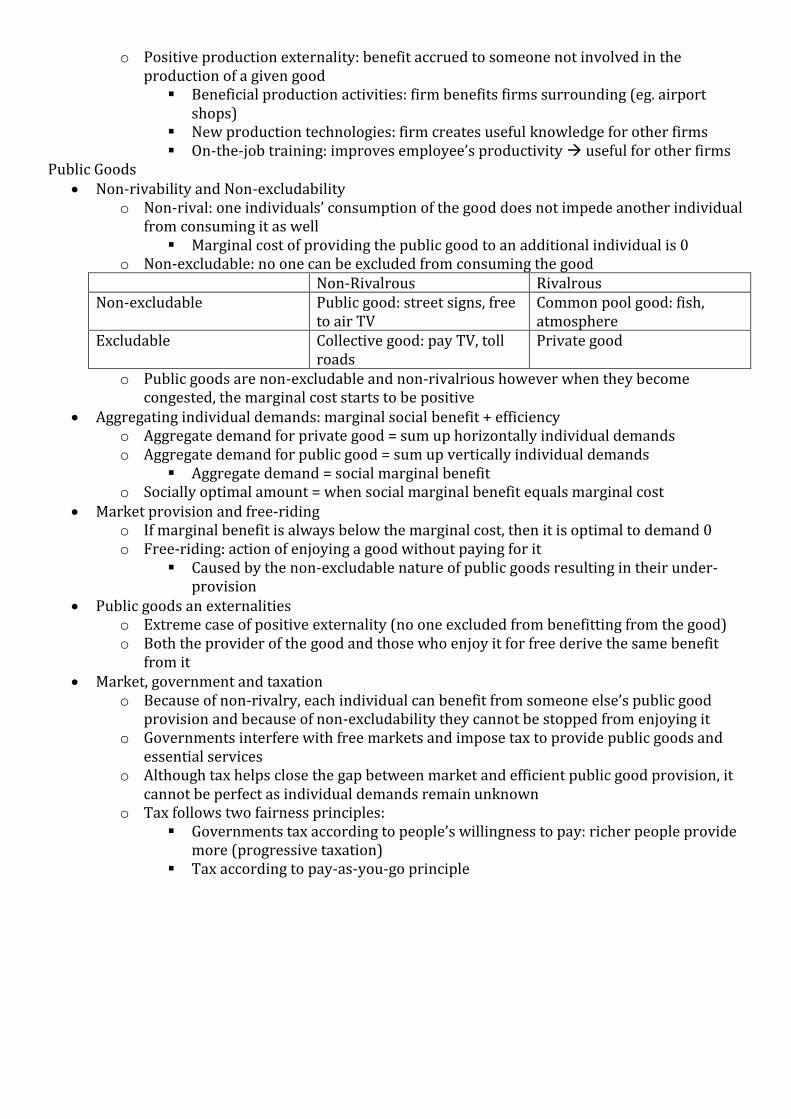
Public Goods Non-rivability and Non-excludability
o Non-rival: one individuals’ consumption of the good does not impede another individual from consuming it as well
Marginal cost of providing the public good to an additional individual is 0 o Non-excludable: no one can be excluded from consuming the good
Non-Rivalrous Rivalrous Non-excludable Public good: street signs, free
to air TV Common pool good: fish, atmosphere
Excludable Collective good: pay TV, toll roads
Private good
o Public goods are non-excludable and non-rivalrious however when they become congested, the marginal cost starts to be positive
Aggregating individual demands: marginal social benefit + efficiency o Aggregate demand for private good = sum up horizontally individual demands o Aggregate demand for public good = sum up vertically individual demands
Aggregate demand = social marginal benefit o Socially optimal amount = when social marginal benefit equals marginal cost
Market provision and free-riding o If marginal benefit is always below the marginal cost, then it is optimal to demand 0 o Free-riding: action of enjoying a good without paying for it
Caused by the non-excludable nature of public goods resulting in their under-provision
Public goods an externalities o Extreme case of positive externality (no one excluded from benefitting from the good) o Both the provider of the good and those who enjoy it for free derive the same benefit
from it Market, government and taxation
o Because of non-rivalry, each individual can benefit from someone else’s public good provision and because of non-excludability they cannot be stopped from enjoying it
o Governments interfere with free markets and impose tax to provide public goods and essential services
o Although tax helps close the gap between market and efficient public good provision, it cannot be perfect as individual demands remain unknown
o Tax follows two fairness principles: Governments tax according to people’s willingness to pay: richer people provide
more (progressive taxation) Tax according to pay-as-you-go principle