Embed Size (px)
Citation preview

Lecture Notes in Geoinformation and Cartography
Series Editors: William Cartwright, Georg Gartner, Liqiu Meng, Michael P. Peterson
Peter van Oosterom • Sisi Zlatanova • Friso Penninga • Elfriede Fendel (Eds.)
Advances in 3D Geoinformation Systems With 235 Figures

Editors: Peter van Oosterom Jaffalaan 9 2628 BX, Delft The Netherlands E-mail: [email protected] Sisi Zlatanova Jaffalaan 9 2628 BX, Delft The Netherlands E-mail: [email protected]
Friso Penninga Jaffalaan 9 2628 BX, Delft The Netherlands E-mail: [email protected] Elfriede M. Fendel Jaffalaan 9 2628 BX, Delft The Netherlands E-mail: [email protected]
ISBN 978-3-540-72134-5 SSpringer Berlin Heidelberg New York Library of Congress Control Number: 2007939908 This work is subject to copyright. All rights are reserved, whether the whole or part of the material is concerned, specifically the rights of translation, reprinting, reuse of illustra-tions, recitation, broadcasting, reproduction on microfilm or in any other way, and stor-age in data banks. Duplication of this publication or parts thereof is permitted only under the provisions of the German Copyright Law of September 9, 1965, in its current version, and permission for use must always be obtained from Springer-Verlag. Violations are li-able to prosecution under the German Copyright Law. Springer is a part of Springer Science+Business Media springeronline.com © Springer-Verlag Berlin Heidelberg 2008 The use of general descriptive names, registered names, trademarks, etc. in this publica-tion does not imply, even in the absence of a specific statement, that such names are ex-empt from the relevant protective laws and regulations and therefore free for general use. Cover design: deblik, Berlin Production: A. Oelschläger Typesetting: Camera-ready by the Editors Printed on acid-free paper 30/2132/AO 54321

Preface
Society is expecting and demanding more 3D support since users have ex-perienced the added value in emerging visualisation applications such as 3Dglobe based interfaces, navigation systems presenting a 3D perspective, etc.Due to the rapid developments in sensor techniques more 3D data have be-come available. Effective algorithms for (semi) automatic object reconstruc-tion are required. Integration of existing 2D objects with height data is anon-trivial process, and further research is needed. The resulting 3D modelscan be maintained in several forms: TEN (Tetrahedral Network), construc-tive solid geometry (CSG) models, regular polytopes, TIN boundary rep-resentation and 3D volume quad edge structure, layered/topology models,voxel based models, 3D models used in urban planning/polyhedrons, andn-dimensional models including time. 3D analysis and 3D simulation tech-niques explore and extend the possibilities of spatial applications. In sucha dynamic scientific environment, it is very important to have high qualityand an open exchange of ideas on these new developments. It is also veryimportant to carefully review and document the progress that is made. Thisbook and the associated 3D GeoInfo workshop are an attempt to achievethis goal. The workshop is the second in a series on 3D geo-information. Theprevious event took place in Kuala Lumpur, Malaysia, on 7-8 August 2006(http://www.fksg.utm.my/3dgeoinfo2006). Selected papers from the firstworkshop were published in ‘Innovations in 3D Geo Information Systems’,Springer-Verlag, 2006. The current (2007) workshop was held in Delft, theNetherlands, while future discussions on 3D issues are expected to be held inSeoul, South Korea, on 12-14 November 2008. The chapters in this book arethe result of the ‘2nd International Workshop on 3D Geo-Information: Re-quirements, Acquisition, Modelling, Analysis, Visualisation’ (12-14 December2007, Delft, the Netherlands). The workshop’s website contains many details,including the programme of the event (http://www.3d-geoinfo-07.nl).The five themes – mentioned in the sub-title – give a good indication ofthe thematic scope and the chapters in this book, which have been organisedaccordingly. The chapters have been selected based on a full-paper submis-
v

vi Preface
sion and were thoroughly reviewed by three members of the internationalprogramme committee. The authors of the best and most original submis-sions were asked to submit revised versions based on these comments. Ad-ditionally, this book contains two chapters that are related to the invitedkey-notes, both with a Geo-ICT industry origin (TeleAtlas: ‘Maps Get Real,Digital Maps evolving from mathematical line graphs to virtual reality mod-els’ and Oracle: ‘On Valid and Invalid Three-Dimensional Geometries’). Thesechapters together make up the main part of the book. During the workshopthere were also working group sessions organised according to each of the spe-cific themes: Requirements & Applications, Acquisition, Modelling, Analysis,and Visualisation. All of the working group sessions followed a given format:current problems to be solved, potential solutions, and recommendations bythe working group. The discussions started with a position paper that wasusually prepared by the chairs of the working groups. These position papersare also included in the last part of this book. The discussion sessions werecoordinated by the chair, and the concluding summaries of the results werepresented at the closing plenary session.
This series of workshops is an excellent opportunity for the exchange ofideas on 3D requirements and the comparison of the different techniques of3D acquisition, modeling and simulation. The 3D GeoInfo workshops aim tobring together international state-of-the-art research in the field of 3D geo-information. They offer an interdisciplinary forum to researchers in the closelyrelated fields of 3D data collection, modelling, management, data analysis,and visualisation. We hope that this series will become a very interestingyearly event with many sparkling discussions on all aspects of handling 3Dgeo-information!
The editors of this book would like to thank the co-organisers (EvelineVogels, Marc van Kreveld and George Vosselman) for the pleasant cooper-ation from the first initial idea to organise the workshop through the finalpreparations. Further, we are grateful to all of the authors for their originalcontributions (also to the authors of contributions that were not selected).Special thanks to the members of the programme committee; they had thedifficult task of critically reviewing the contributions and providing construc-tive comments, thus enhancing the quality of the chapters included in thisbook. The editors are also grateful to the support provided by the AdvancedGaming and Simulation (AGS) research centre and the two projects RGI-011‘3D topography’ and RGI-013 ‘Virtual reality for urban planning and secu-rity’, funded by the Dutch Program ‘Space for Geo-information’.
Delft, Peter van OosteromOctober 2007 Sisi Zlatanova
Friso PenningaElfriede M. Fendel
viii Organisation
Organisation
Programme chair Peter van Oosterom,Delft University of Technology
Local organising committeePeter van Oosterom Delft University of TechnologySisi Zlatanova Delft University of TechnologyFriso Penninga Delft University of TechnologyElfriede Fendel Delft University of TechnologyEveline Vogels Delft University of TechnologyGeorge Vosselman ITC EnschedeMarc van Kreveld Utrecht University
Programme committeeAlias Abdul-Rahman University of Technology Malaysia
(Malaysia)Bart Beers Cyclomedia (the Netherlands)Tim Bevan 1Spatial (United Kingdom)Roland Billen University of Liege (Belgium)Lars Bodum Aalborg University (Denmark)Arnold Bregt Wageningen University and Research
Centre (the Netherlands)Styli Camateros Bentley (Canada)Volker Coors University of Applied Sciences Stuttgart
(Germany)Andrew Frank TU Wien (Austria)Georg Gartner TU Wien (Austria)Christopher Gold University of Glamorgan
(United Kingdom)Cecil Goodwin TeleAtlas (USA)

Organisation ix
Armin Gruen ETH Zurich (Switzerland)Norbert Haala University of Stuttgart (Germany)Muki Haklay University College London
(United Kingdom)John Herring Oracle Corporation (USA)Daniel Holweg Fraunhofer Institute Darmstadt (Germany)Thomas Kolbe Technical University Berlin (Germany)Marc van Kreveld Utrecht University (the Netherlands)Hugo Ledoux Delft University of Technology
(the Netherlands)Jiyeong Lee University of North Caroline at Charlotte
(USA)Paul Longley University College London
(United Kingdom)Twan Maintz Utrecht University (the Netherlands)Paul van der Molen FIG/ITC Enschede (the Netherlands)Martien Molenaar ITC Enschede (the Netherlands)Stephan Nebiker Fachhochschule Nordwestschweiz
(Switzerland)Andras Ossko FIG/Budapest Land Office (Hungary)Peter van Oosterom Delft University of Technology
(the Netherlands)Chris Parker Ordnance Survey (United Kingdom)Wanning Peng ESRI (USA)Friso Penninga Delft University of Technology
(the Netherlands)Norbert Pfeifer TU Wien (Austria)Clemens Portele Interactive Instruments (Germany)Jonathan Raper City University London (United Kingdom)Carl Reed Open Geospatial Consortium (USA)Massimo Rumor University of Padova (Italy)Aidan Slingsby City University London (United Kingdom)Jantien Stoter ITC Enschede (the Netherlands)Rod Thompson Queensland Government (Australia)George Vosselman ITC Enschede (the Netherlands)Peter Widmayer ETH Zurich (Switzerland)Peter Woodsford 1Spatial / Snowflake (United Kingdom)Alexander Zipf University of Applied Sciences FH Mainz
(Germany)Sisi Zlatanova Delft University of Technology
(the Netherlands)
List of Contributors
Alias Abdul RahmanDepartment of Geoinformatics, Faculty of Geoinformation Science and Engi-neering, Universiti Teknologi Malaysia, Malaysia e-mail: [email protected]
Thierry BadardCentre for Research in Geomatics and Geomatics Department, LavalUniversity, Quebec, Canada
Jens BasanowUniversity of Bonn (Cartography), Germany, e-mail: [email protected]
Karine BedardCentre for Research in Geomatics and Geomatics Department, LavalUniversity, Quebec, Canada
Ahmad BiniazDepartment of Computer Science and Engineering, Shiraz University, Irane-mail: [email protected]
Martin BreunigInstitute for Geoinformatics and Remote Sensing, University of Osnabruck,Germany, e-mail: [email protected]
Bjorn BroscheitInstitute for Geoinformatics and Remote Sensing, University of Osnabruck,Germany, e-mail: [email protected]
Arno BuckenInstitute of Man-Machine-Interaction, RWTH Aachen, Germany, e-mail:[email protected]
Edgar ButwilowskiInstitute for Geoinformatics and Remote Sensing, University of Osnabruck,
xi

xii List of Contributors
Germany, e-mail: [email protected]
Eddie CurtisSnowflake Software, United Kingdom, e-mail: [email protected]
Gholamhossein DastghaibyfardDepartment of Computer Science and Engineering, Shiraz University, Irane-mail: [email protected]
Etienne DesgagneCentre for Research in Geomatics and Geomatics Department, LavalUniversity, Quebec, Canada
Jurgen DollnerHasso-Plattner-Institute at the University of Potsdam, Germany, e-mail:[email protected]
Ludvig EmgardSWECO Position AB, Sweden, e-mail: [email protected]
Rob van EssenTele Atlas NV, ’s-Hertogenbosch, the Netherlands e-mail:[email protected]
Andrew U. FrankDepartment of Geoinformation and Cartography, Technical UniversityVienna, Austria e-mail: [email protected]
Tassilo GlanderHasso-Plattner-Institute at the University of Potsdam, Germany, e-mail:[email protected]
Christopher GoldUniversity of Glamorgan, Pontypridd, Wales, United Kingdom, e-mail:[email protected]
Baris M. KazarOracle USA, Inc., USA, e-mail: [email protected]
Dave KidnerUniversity of Glamorgan, Pontypridd, Wales, United Kingdom, e-mail:[email protected]
Henk de KluijverdBvision, Utrecht, the Netherlands, e-mail: [email protected]
Ravi KothuriOracle USA, Inc., USA, e-mail: [email protected]
Marc van KreveldDepartment of Information and Computing Sciences, Utrecht University,the Netherlands, e-mail: [email protected]
List of Contributors xiii
Tobias KrugerLeibniz Institute of Ecological and Regional Development (IOER), Dresden,Germany, e-mail: [email protected]
Vinaykumar KurakulaL.I.G ‘B’ 543, Hyderabad, India, e-mail: [email protected]
Hugo Ledouxsection GIS Technology, OTB, Delft University of Technology, the Nether-lands, e-mail: [email protected]
Jiyeong LeeDepartment of Geoinformatics, University of Seoul, 90 Jeonnong-dong,Dongdaemun-gu. Seoul, 130-743, South Korea, e-mail: [email protected]
Gotthard MeinelLeibniz Institute of Ecological and Regional Development (IOER), Dresden,Germany, e-mail: [email protected]
Shyamalee MukherjiCentre of Studies in Resources Engineering, Indian Institute of Technology,Bombay, India e-mail: [email protected]
Pascal NeisUniversity of Bonn (Cartography), Germany, e-mail: [email protected]
Steffen NeubauerUniversity of Bonn (Cartography), Germany, e-mail: [email protected]
Peter van Oosteromsection GIS Technology, OTB, Delft University of Technology, the Nether-lands, e-mail: [email protected]
Sander Oude ElberinkInternational Institute for Geo-Information Science and Earth Observation(ITC), Enschede, the Netherlands e-mail: [email protected]
Friso Penningasection GIS Technology, OTB, Delft University of Technology, the Nether-lands, e-mail: [email protected]
Jacynthe PouliotCentre for Research in Geomatics and Geomatics Department, LavalUniversity, Quebec, Canada e-mail: [email protected]
Shi PuInternational Institute for Geo-information Science and Earth Observation,Enschede, the Netherlands, e-mail: [email protected]
Jonathan Raper
xiv List of Contributors
The giCentre, Department of Information Science, City University, London,United Kingdom e-mail: [email protected]
Siva RavadaOracle USA, Inc., USA, e-mail: [email protected]
Paul RichmondUniversity of Sheffield, United Kingdom, e-mail: [email protected]
Daniela RomanoUniversity of Sheffield, United Kingdom e-mail: [email protected]
Jurgen RossmanInstitute of Man-Machine-Interaction, RWTH Aachen, Germany e-mail:[email protected]
Arne SchillingUniversity of Bonn (Cartography), e-mail: [email protected]
Aidan SlingsbyThe giCentre, Department of Information Science, City University, London,United Kingdom e-mail: [email protected]
Jantien StoterITC Enschede, Department of Geo Information Processing, the Netherlands,e-mail: [email protected]
Chen Tet KhuanDepartment of Geoinformatics, Faculty of Geoinformation Scienceand Engineering, Universiti Teknologi Malaysia, Malaysia e-mail:[email protected]
Vincent ThomasCentre for Research in Geomatics and Geomatics Department, LavalUniversity, Quebec, Canada
Andreas ThomsenInstitute for Geoinformatics and Remote Sensing, University of Osnabruck,Germany, e-mail: [email protected]
Rodney ThompsonDepartment of Natural Resources and Water, Queensland, Australia, e-mail:[email protected]
Rebecca TseUniversity of Glamorgan, Pontypridd, Wales, United Kingdom, e-mail:[email protected]
Alexander ZipfUniversity of Bonn (Cartography), Germany, e-mail: [email protected]

List of Contributors xv
Sisi Zlatanovasection GIS Technology, OTB, Delft University of Technology, theNetherlands, e-mail: [email protected]

Contents
Part I Keynotes
1 Maps Get Real: Digital Maps evolving from mathematicalline graphs to virtual reality models . . . . . . . . . . . . . . . . . . . . . . 3Rob van Essen
2 On Valid and Invalid Three-Dimensional Geometries . . . . . 19Baris M. Kazar1, Ravi Kothuri1, Peter van Oosterom2 and SivaRavada1
Part II Papers
Theme I: Requirements & Applications
3 Navigable Space in 3D City Models for Pedestrians . . . . . . . 49Aidan Slingsby and Jonathan Raper
4 Towards 3D Spatial Data Infrastructures (3D-SDI) basedon open standards – experiences, results and future issues 65Jens Basanow, Pascal Neis, Steffen Neubauer, Arne Schilling, andAlexander Zipf
5 Re-using laser scanner data in applications for 3Dtopography . . . . . . . . . . . . . . . . . . . . . . . . . . . . . . . . . . . . . . . . . . . . . . . 87Sander Oude Elberink
6 Using Raster DTM for Dike Modelling . . . . . . . . . . . . . . . . . . . 101Tobias Kruger and Gotthard Meinel
7 Development of a Web Geological Feature Server(WGFS) for sharing and querying of 3D objects . . . . . . . . . . 115
xvii
xviii Contents
Jacynthe Pouliot, Thierry Badard, Etienne Desgagne, KarineBedard, and Vincent Thomas
Theme II: Acquisition
8 Using 3D-Laser-Scanners and Image-Recognitionfor Volume-Based Single-Tree-Delineation and-Parameterization for 3D-GIS-Applications . . . . . . . . . . . . . . . 131Jurgen Rossmann and Arno Bucken
9 Automatic building modeling from terrestrial laserscanning . . . . . . . . . . . . . . . . . . . . . . . . . . . . . . . . . . . . . . . . . . . . . . . . . . 147Shi Pu
10 3D City Modelling from LIDAR Data . . . . . . . . . . . . . . . . . . . . 161Rebecca (O.C.) Tse, Christopher Gold, and Dave Kidner
Theme III: Modelling
11 First implementation results and open issues on thePoincare-TEN data structure . . . . . . . . . . . . . . . . . . . . . . . . . . . . . 177Friso Penninga and Peter van Oosterom
12 Drainage reality in terrains with higher-order Delaunaytriangulations . . . . . . . . . . . . . . . . . . . . . . . . . . . . . . . . . . . . . . . . . . . . . 199Ahmad Biniaz and Gholamhossein Dastghaibyfard
13 Surface Reconstruction from Contour Lines or LIDARelevations by Least Squared-error Approximation usingTensor-Product Cubic B-splines . . . . . . . . . . . . . . . . . . . . . . . . . . 213Shyamalee Mukherji
14 Modelling and Managing Topology in 3D GeoinformationSystems1 . . . . . . . . . . . . . . . . . . . . . . . . . . . . . . . . . . . . . . . . . . . . . . . . . 229Andreas Thomsen, Martin Breunig, Edgar Butwilowski, andBjorn Broscheit
15 Mathematically provable correct implementation ofintegrated 2D and 3D representations . . . . . . . . . . . . . . . . . . . . 247Rodney Thompson1,2 and Peter van Oosterom1
16 3D Solids and Their Management In DBMS . . . . . . . . . . . . . . 279Chen Tet Khuan, Alias Abdul-Rahman, and Sisi Zlatanova
17 Implementation alternatives for an integrated 3DInformation Model . . . . . . . . . . . . . . . . . . . . . . . . . . . . . . . . . . . . . . . 313Ludvig Emgard1,2 and Sisi Zlatanova1

Contents xix
Theme IV: Analysis
18 Serving CityGML via Web Feature Services in the OGCWeb Services - Phase 4 Testbed . . . . . . . . . . . . . . . . . . . . . . . . . . 331Eddie Curtis
19 Towards 3D environmental impact studies: example ofnoise . . . . . . . . . . . . . . . . . . . . . . . . . . . . . . . . . . . . . . . . . . . . . . . . . . . . . 341Jantien Stoter1, Henk de Kluijver2, and Vinaykumar Kurakula3
20 The Kinetic 3D Voronoi Diagram: A Tool for SimulatingEnvironmental Processes . . . . . . . . . . . . . . . . . . . . . . . . . . . . . . . . . 361Hugo Ledoux
Theme V: Visualisation
21 Techniques for Generalizing Building Geometry ofComplex Virtual 3D City Models . . . . . . . . . . . . . . . . . . . . . . . . . 381Tassilo Glander and Jurgen Dollner
22 Automatic Generation of Residential Areas usingGeo-Demographics . . . . . . . . . . . . . . . . . . . . . . . . . . . . . . . . . . . . . . . 401Paul Richmond and Daniela Romano
Part III Position papers
23 Working Group I – Requirements and Applications – PositionPaper:Requirements for 3D in Geographic Information SystemsApplications . . . . . . . . . . . . . . . . . . . . . . . . . . . . . . . . . . . . . . . . . . . . . . 419Andrew U. Frank
24 Working Group II – Acquisition – Position Paper:Data collection and 3D reconstruction . . . . . . . . . . . . . . . . . . . . 425Sisi Zlatanova
25 Working Group III – Modelling – Position Paper:Modelling 3D Geo-Information . . . . . . . . . . . . . . . . . . . . . . . . . . . 429Christopher Gold
26 Working Group IV – Analysis – Position Paper:Spatial Data Analysis in 3D GIS . . . . . . . . . . . . . . . . . . . . . . . . . . 435Jiyeong Lee
27 Working Group V – Visualization – Position Paper:3D Geo-Visualization . . . . . . . . . . . . . . . . . . . . . . . . . . . . . . . . . . . . . 439Marc van Kreveld

Part I
Keynotes
Chapter 1
Maps Get Real: Digital Maps evolvingfrom mathematical line graphs to virtualreality models
Rob van Essen
Abstract
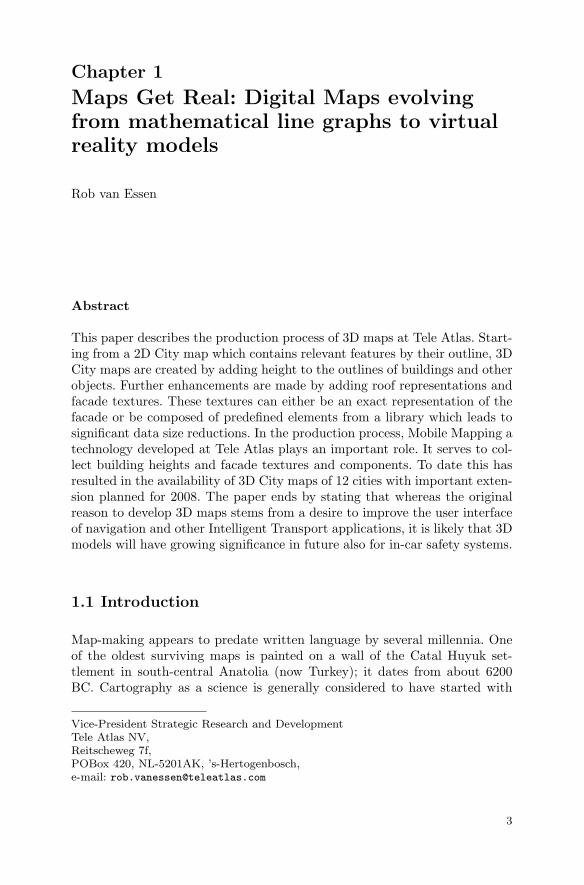
This paper describes the production process of 3D maps at Tele Atlas. Start-ing from a 2D City map which contains relevant features by their outline, 3DCity maps are created by adding height to the outlines of buildings and otherobjects. Further enhancements are made by adding roof representations andfacade textures. These textures can either be an exact representation of thefacade or be composed of predefined elements from a library which leads tosignificant data size reductions. In the production process, Mobile Mapping atechnology developed at Tele Atlas plays an important role. It serves to col-lect building heights and facade textures and components. To date this hasresulted in the availability of 3D City maps of 12 cities with important exten-sion planned for 2008. The paper ends by stating that whereas the originalreason to develop 3D maps stems from a desire to improve the user interfaceof navigation and other Intelligent Transport applications, it is likely that 3Dmodels will have growing significance in future also for in-car safety systems.
1.1 Introduction
Map-making appears to predate written language by several millennia. Oneof the oldest surviving maps is painted on a wall of the Catal Huyuk set-tlement in south-central Anatolia (now Turkey); it dates from about 6200BC. Cartography as a science is generally considered to have started with
Vice-President Strategic Research and DevelopmentTele Atlas NV,Reitscheweg 7f,POBox 420, NL-5201AK, ’s-Hertogenbosch,e-mail: [email protected]
3
4 Rob van Essen
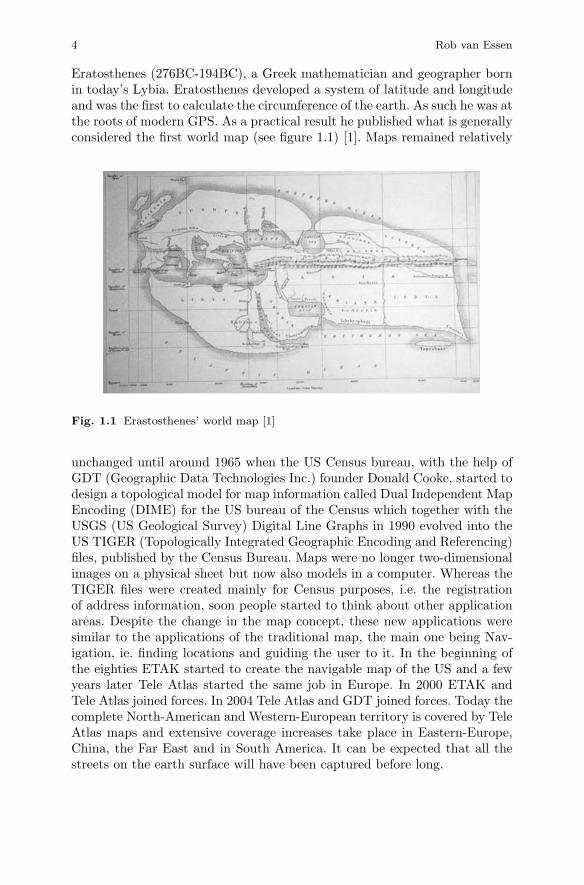
Eratosthenes (276BC-194BC), a Greek mathematician and geographer bornin today’s Lybia. Eratosthenes developed a system of latitude and longitudeand was the first to calculate the circumference of the earth. As such he was atthe roots of modern GPS. As a practical result he published what is generallyconsidered the first world map (see figure 1.1) [1]. Maps remained relatively
Fig. 1.1 Erastosthenes’ world map [1]
unchanged until around 1965 when the US Census bureau, with the help ofGDT (Geographic Data Technologies Inc.) founder Donald Cooke, started todesign a topological model for map information called Dual Independent MapEncoding (DIME) for the US bureau of the Census which together with theUSGS (US Geological Survey) Digital Line Graphs in 1990 evolved into theUS TIGER (Topologically Integrated Geographic Encoding and Referencing)files, published by the Census Bureau. Maps were no longer two-dimensionalimages on a physical sheet but now also models in a computer. Whereas theTIGER files were created mainly for Census purposes, i.e. the registrationof address information, soon people started to think about other applicationareas. Despite the change in the map concept, these new applications weresimilar to the applications of the traditional map, the main one being Nav-igation, ie. finding locations and guiding the user to it. In the beginning ofthe eighties ETAK started to create the navigable map of the US and a fewyears later Tele Atlas started the same job in Europe. In 2000 ETAK andTele Atlas joined forces. In 2004 Tele Atlas and GDT joined forces. Today thecomplete North-American and Western-European territory is covered by TeleAtlas maps and extensive coverage increases take place in Eastern-Europe,China, the Far East and in South America. It can be expected that all thestreets on the earth surface will have been captured before long.

1 Maps Get Real 5
The first navigation systems hit the European market around 1995. Thesewere closely tight to the car and therefore called in-car navigation systems.The tight bond with the car was caused by the fact that the GPS signalwhich enabled the car to position itself was distorted for use by non-USmilitary purposes by the US Military. As a consequence navigation was verysimilar to traditional nautical navigation. After the initial (inaccurate) (GPS)fix, a process called dead reckoning was started which on basis of directionand distance sensors estimated the new positions of the car. As soon as itwas possible to match the position of the car with a position on the map(e.g. when the car turned into a side street), the estimated position wascorrected. This process is called map matching. Dead reckoning and mapmatching tied navigation to the car because the sensors which these processesrequired, (gyro-) compasses, odometers, wheel sensors etc. were generally notpart of the navigation system but external components built in the car. Thesenavigation systems typically had one of two types of user interface. First therewas the low cost interface where the user was guided by icons on a small(monochrome) display. The other type combined the icon based guidancewith an image of the map around the vehicles position on a (color) display.Both interfaces were generally combined with audible instructions.
In 2000, US President Clinton ‘turned off Selective Availability’ or, in otherwords, he removed the distortion from the GPS signal. As a result the GPSsignal increased its accuracy to such an extent that positioning without thehelp of external sensors became possible and navigation was no longer tiedto the car. This initiated what can be called the biggest change in modernland navigation to date. Navigation was leaving the car, devices dramaticallydropped in price and navigation became main stream and mass market. Thischange gave rise to a series of very important changes in digital maps andin the process of digital mapping. One of these is the subject of the paper:The adaptation of the displayed image of the map to the requirements of themass-market. The general public had only limited appreciation for the verystrong technical connotation of the digital line graphs displayed on the earlynavigation systems. The first step to respond to these requirements was toturn back to the ‘traditional’ paper cartography and to apply the map displayprinciples common there. In paper maps, roads were no lines but linear areasand buildings were rectangles and not points. I.e. objects were representedby their outlines rather then by a mathematical abstraction. The result ofapplying these ‘traditional’ map principles onto the digital map is the 2DCity map.
Still, significant portions of the population have problems reading such amap. At the same time, the gaming industry was showing the way: Comput-ers made it possible to display virtual reality in consumer applications notas a model but rather as it is, as virtual reality, without the actual corre-spondence between a map image at a certain location and the view at thatlocation in reality though. The map was leaving its traditional two dimen-sional shelter and became three dimensional. The 3D City Map was born.
6 Rob van Essen
Clearly, 3D computer models of buildings had been developed before, in thegaming industry but also by academia and government researchers [3]. Thedescribed development can be considered novel because these 3D models werecreated in an accurate geographic reference frame (thus justifying the termmap) in an industrial production environment focused on large scale produc-tion for mass-market applications. Tele Atlas has been leading the way in theprocess of adapting the map to the requirements of the mass-market. It wasthe first to publish a 2D City map for navigation applications and the firstcorresponding 3D City Map products also came from Tele Atlas. This paperdescribes the process how Tele Atlas realized these new products.
Essential in these processes is the Tele Atlas’ Mobile Mapping technology.The paper will first give a description of Mobile Mapping. Secondly it willshortly describe the production process of 2D City maps after which the 3DCity map process is described. Finally some outlook on the future will begiven where it is likely that these virtual reality models not only appeal tothe user but also fulfill requirement of a new generation of in-car systemswhich focus on increasing safety and reducing environmental consequences.
1.2 Capturing Reality: Mobile Mapping
1.2.1 The early days
Mobile mapping is a technology developed by Tele Atlas. It was first launchedin 1990 as a result of a Eureka project [2]. At that time, geometrically cor-rect paper map material often was the basic source for digital maps. Clearly,the information which could be derived from these paper sources was notsufficient to create a navigable map. Therefore, also a wide-variety of othersources had to be used ranging form postal files, tourist maps and construc-tion plans of new road geometry. In addition it was necessary to actually goto the spot and check the information on correctness and currentness and fillin the information which was not available on any other source like one-waytraffic regulations or prohibited turn information. The thought behind MobileMapping was that instead of sending a surveyor who had to manually cap-ture the information to send a vehicle equipped with camera’s which recordreality and afterwards interpret the images in an optimally tuned office en-vironment. The project resulted in thousands of video tapes. Difficulties ofhandling these large amounts of media and accessing individual images se-quences finally made the project less successful than originally anticipatedand the project was stopped.

1 Maps Get Real 7
Fig. 1.2 First generation Mobile Mapping van (1990)
1.2.2 Mobile Mapping re-invented
In 2004 technology had made big leaps compared to 1990. Positioning andcamera technology had improved and completely new, random access storagemedia had become available at considerable lower prices. As a result also bigadvances in Mobile Mapping technology had been achieved (see also [4]). Thiswas for Tele Atlas the signal to revisit the concept of Mobile Mapping. Theresult was a highly accurately positioned vehicle equipped with up-to six dig-ital camera’s of which the two forward facing were stereo camera’s allowinggeometrically accurate measurements in the images. The positional accuracyachieved is sub-half-meter. The pictures have a resolution of 1300x1000 pixels.The novel aspect of this new generation of mobile mapping was not so muchthe technical components but more the support for industrial productionprocesses. Aspects of this include quasi-continuous operation by none expertpeople at typical traffic speeds positioned highly accurately and seamlesslyin different countries. The main thought behind the Mobile Mapping conceptin 2005 was similar to that of 1987. Instead of sending surveyors to checkand complete the content of the database it was better to record reality andto extract the information in an optimally tuned office environment. In thisrespect had the need for Mobile Mapping considerably increased comparedto 1990. This was the consequence of the ever increasing content of a digi-tal map database. Next to the needs of simple navigation applications nowalso the need of advanced safety applications requiring the inclusion of in-formation like lanes, traffic signs, curve information, traffic lights etc. hadto be accommodated [5]. In addition, it became apparent that Mobile Map-ping also can fulfill the need of improved map display requirements. This

8 Rob van Essen
Fig. 1.3 Second generation Mobile Mapping vehicle (2005)
will be the further detailed in the following sections. Currently Mobile Map-ping is extensively used by Tele Atlas. World wide, 50 vehicles are drivingthe streets resulting 250 TB of imagery yearly. These images are interpretedby highly trained database experts and the necessary content is extracted.When customer complaints come in via the Tele Atlas’ Customer Feedbacksystem ‘MapInsight’ the images corresponding to the complaint position areinterpreted which in a large number of cases leads to a resolution of thecomplaint.
1.2.3 Mobile Mapping: the future
The potential of Mobile Mapping is by far not exploited fully yet. Contentsrequirements are still increasing. And a lot of this new contents can be cap-tured using Mobile Mapping. 3D information is one example which will bedealt with later. Another example is content which can be captured using ad-ditional sensors on the Mobile Mapping van. A typical example of this is theslope of roads which is required to optimize the automatic gearbox of trucksresulting in significant fuel consumption decreases. In current prototyping ac-tivities, slope is being captured with Mobile Mapping by a 3D gyro installedin the vehicle. Other sensors include laser scanners which enable collectionof banking (transverse slope) and street lay out. Novel aspects of these de-velopments mainly relate to the use of different sensors in combination andexploiting the synergies, also referred to as sensor fusion. Another field where
1 Maps Get Real 9
further developments are expected is the automatic interpretation of images.Currently research on automatic object recognition techniques is undertakenat Tele Atlas and the first results have been adopted in production. The ex-pectation is that in future more and more of the information present in theMobile Mapping images can be extracted automatically.
1.3 Advanced Map Display
1.3.1 2D City Maps
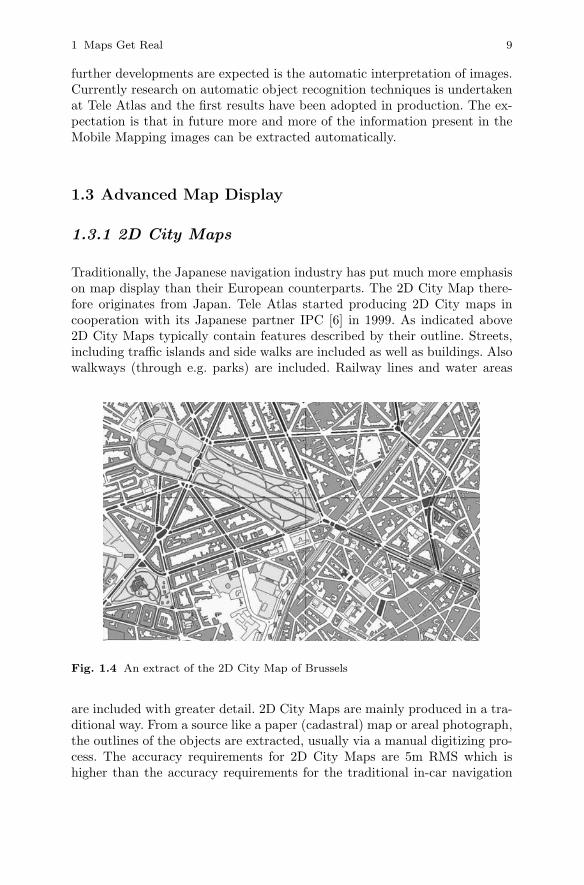
Traditionally, the Japanese navigation industry has put much more emphasison map display than their European counterparts. The 2D City Map there-fore originates from Japan. Tele Atlas started producing 2D City maps incooperation with its Japanese partner IPC [6] in 1999. As indicated above2D City Maps typically contain features described by their outline. Streets,including traffic islands and side walks are included as well as buildings. Alsowalkways (through e.g. parks) are included. Railway lines and water areas
Fig. 1.4 An extract of the 2D City Map of Brussels
are included with greater detail. 2D City Maps are mainly produced in a tra-ditional way. From a source like a paper (cadastral) map or areal photograph,the outlines of the objects are extracted, usually via a manual digitizing pro-cess. The accuracy requirements for 2D City Maps are 5m RMS which ishigher than the accuracy requirements for the traditional in-car navigation
10 Rob van Essen
road network. Because the two need to fit, there is a final production stepinvolving the possible adaptation of the original navigation network geometryto the geometry of the 2D City Map.
1.3.2 3D City Maps
Basically, a 3D City Map is a 2D City map in which a height attributehas been attached to the building outlines and possibly to the sidewalks.The buildings can have been extended with a roof and the facades of thebuildings can have been assigned a certain texture. In addition standard 3Drepresentation of road furniture objects like traffic signs, traffic lights, trees,fences etc. can have been added. Also 3D Landmarks should be mentionedhere as potential components, which are separately description further down.From all the ‘can’s’ in the above description it becomes clear that a 3D CityModel can take on very different shapes. Tele Atlas decided to go for a modelin which roofs and facade textures are included. Variation occurs in the typeof texture which is used. This will be elaborated further down. Despite allthe variance possible, there is one very important fixed factor and that isthat 3D Building representations are defined as extended 2D City maps. Theconsequence of this is that they are perfectly aligned with the navigation roadnetwork and that they thus can be deployed in navigation systems.
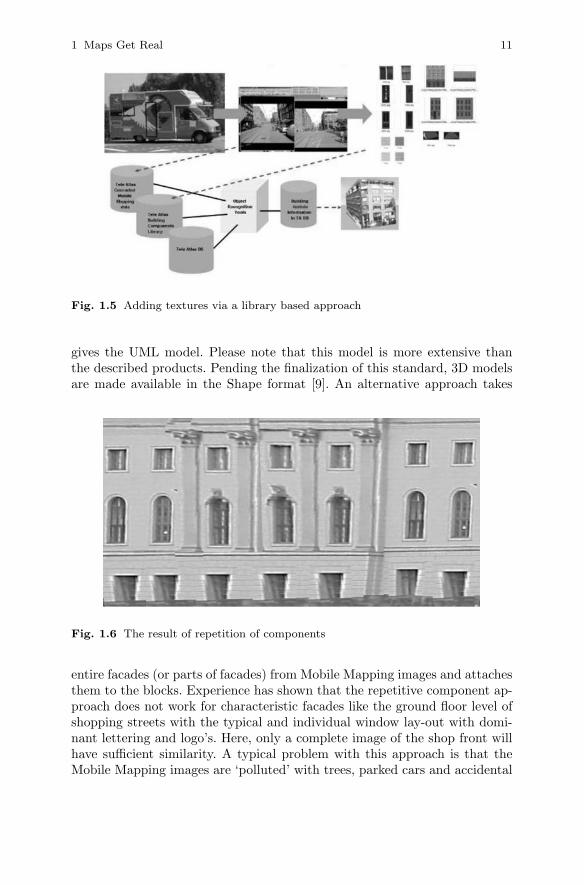
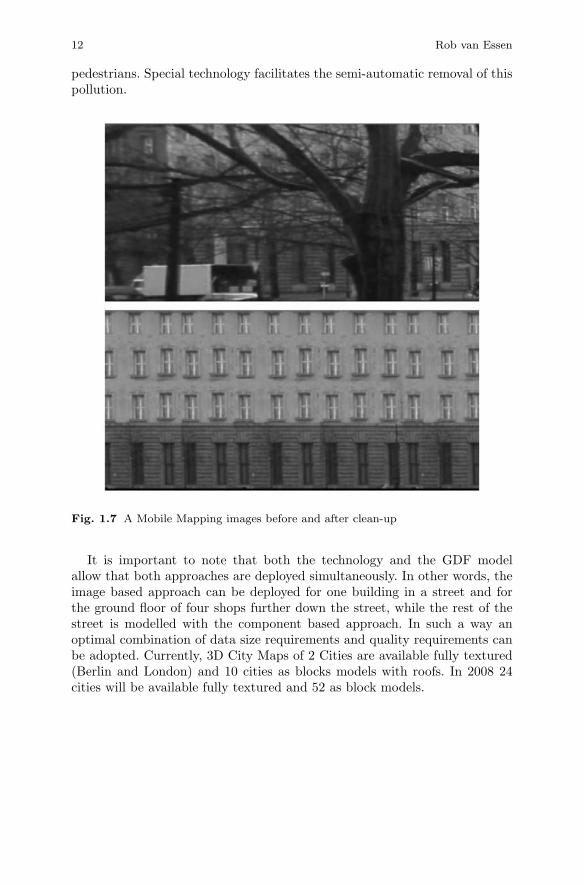
Building height is derived from externally acquired photogrammetric ele-vation models. By subtracting the terrain height from normal digital eleva-tion models, building heights are acquired and attached to the correspondingbuilding outlines. This leads to good results in the majority of the cases.Where this is not the case building heights are derived from the stereoscopiccamera imagery of the Mobile Mapping vehicles. Facade textures are alsoderived from Mobile Mapping images. The approach taken here depends onthe ‘commercial’ value of the facade. The most basic approach makes use ofstandard components from a library [7]. This library contains typical facadecomponents like windows, doors and wall textures. The library has been builtduring a manual pre-process on basis of mobile mapping imagery. Dependingon what the 3D City map operator sees on the Mobile Mapping images hewill compose the facade using different components from the library. This isa semi-automatic process in which technology interprets the image and pro-poses a limited set of components to the operator. It is clear that such anapproach facilitates the re-use of components which will greatly reduce thestorage requirements for these types of models. In a lot of cases, facades havea repetitive character. The model has been designed such that this repeti-tive character also is explicitly supported thus further reducing storage anddata size consequences. The component based model has been successfullyproposed for standardization to ISO/TC204 SWG3.1: GDF. The next ver-sion of GDF4.0 [8] , GDF5.0 will contain the model described. Figure 1.8
1 Maps Get Real 11
Fig. 1.5 Adding textures via a library based approach
gives the UML model. Please note that this model is more extensive thanthe described products. Pending the finalization of this standard, 3D modelsare made available in the Shape format [9]. An alternative approach takes
Fig. 1.6 The result of repetition of components
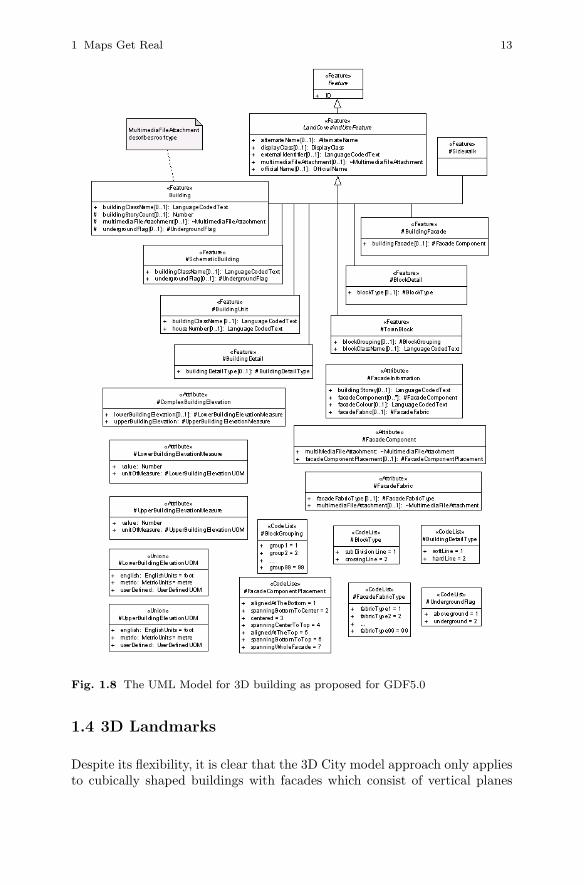
entire facades (or parts of facades) from Mobile Mapping images and attachesthem to the blocks. Experience has shown that the repetitive component ap-proach does not work for characteristic facades like the ground floor level ofshopping streets with the typical and individual window lay-out with domi-nant lettering and logo’s. Here, only a complete image of the shop front willhave sufficient similarity. A typical problem with this approach is that theMobile Mapping images are ‘polluted’ with trees, parked cars and accidental
12 Rob van Essen
pedestrians. Special technology facilitates the semi-automatic removal of thispollution.
Fig. 1.7 A Mobile Mapping images before and after clean-up
It is important to note that both the technology and the GDF modelallow that both approaches are deployed simultaneously. In other words, theimage based approach can be deployed for one building in a street and forthe ground floor of four shops further down the street, while the rest of thestreet is modelled with the component based approach. In such a way anoptimal combination of data size requirements and quality requirements canbe adopted. Currently, 3D City Maps of 2 Cities are available fully textured(Berlin and London) and 10 cities as blocks models with roofs. In 2008 24cities will be available fully textured and 52 as block models.
1 Maps Get Real 13
Fig. 1.8 The UML Model for 3D building as proposed for GDF5.0
1.4 3D Landmarks
Despite its flexibility, it is clear that the 3D City model approach only appliesto cubically shaped buildings with facades which consist of vertical planes

14 Rob van Essen
Fig. 1.9 An example of a 3D City Model of the city of Graz
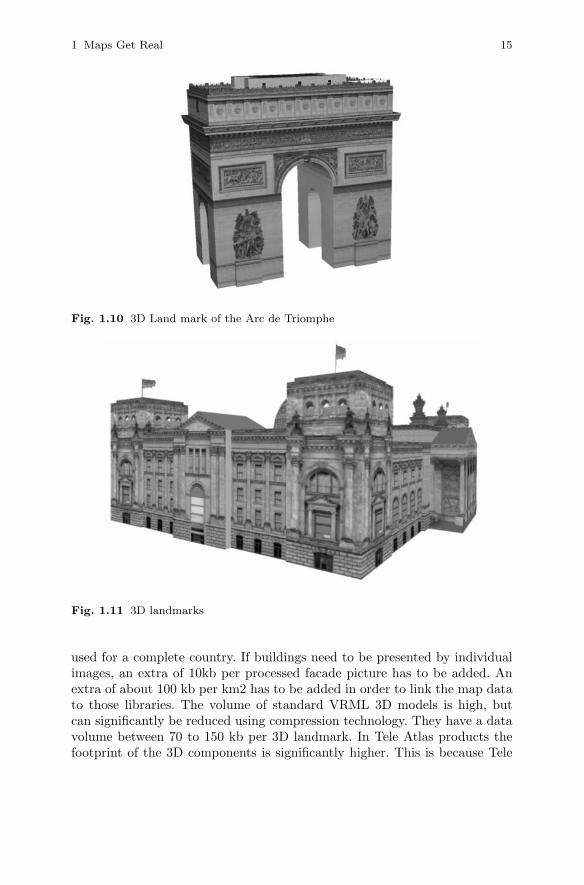
only. Consequently not all building can be modelled with it. Notable exam-ples where this will be the case include the Arc de Triomphe in Paris or theGurkin Building in London. These buildings or rather ”constructions” can bemodelled as 3D Landmarks.. 3D Landmarks are created by photographing theobject from all sides with an accurately positioned digital camera. With spe-cial software the images are interpreted and converted in a so called wireframemodel. Planes are identified in this wire frame model and the correspondingpicture parts are identified and transformed and added to the planes. Thisresults in a high quality 3D model of the object. 3D Landmarks are treated asan object external to the digital map. A proper connection between the twois a pointer to a location which is in fact an absolute WGS ’84 coordinate. Asecond horizontal coordinate assures that aspects like direction and scalingare properly taken care of. The high quality of the 3D Landmark also makesthe methodology fit to represent buildings which do have a cubic shape butwhich because of their prominence need to be modelled with higher qualitythan the 3D City models.
1.5 Data Volumes
Data volumes are important criteria for on- and off-board navigation appli-cations. The GDF model of the component based approach facilitates veryefficient data size requirements. Research has shown that a standard noncompressed Tele Atlas 2D City Map needs about 200 kb/km2. For the basic3D block models an additional 75 kb/km2 is required. For the productionof complete 3D block models with roof types and generic facade informa-tion 330kb for the complete library has to be added. Those libraries can be
1 Maps Get Real 15
Fig. 1.10 3D Land mark of the Arc de Triomphe
Fig. 1.11 3D landmarks
used for a complete country. If buildings need to be presented by individualimages, an extra of 10kb per processed facade picture has to be added. Anextra of about 100 kb per km2 has to be added in order to link the map datato those libraries. The volume of standard VRML 3D models is high, butcan significantly be reduced using compression technology. They have a datavolume between 70 to 150 kb per 3D landmark. In Tele Atlas products thefootprint of the 3D components is significantly higher. This is because Tele

16 Rob van Essen
Atlas customers have expressed the desire to make an own trade-off betweendata size and quality and apply corresponding data compression techniques.
1.6 Storage of 3D data
In the recent past, an interesting trend has become visible: The use of offthe shelf relational database technology for storing and managing geographicdata and even delivering geospatial applications. More and more geographicfeatures are natively supported by relational database products. With respectto 3D the recent version of the Oracle database product contains interestingnew features. This Oracle 11g database has as one of the key features supportfor 3D. Oracle targeted its software development in supporting 3-dimensionaldata toward specific applications such as:
1. GIS for city planning and property rights2. City modelling and adopting features to support CityGML guidelines3. Business Intelligence for real estate and advertising4. Virtual-Reality solutions
Specifically, the 3D data types that are supported include points, lines, poly-gons and solids, as well as multi-points, multi-lines and multi-surfaces. Itfollows Geography Markup Language (GML) 3.1.1 [10] and ISO19107 [11]specifications. Support for simple solids includes closed surfaces such as acubes or pyramids. 3D support for arcs or parametric surfaces is not in-cluded. These enhancements will support large, high density and volume 3Dcity models. Additional new data types support the massive volumes of pointdata, such as point clouds, obtained from laser scanners and LiDAR, as wellas triangulated irregular networks. Part of Oracle 11g are also many spatialfunctions to manage and operate on 3D data. Tele Atlas contributed to theOracle 11g beta testing effort. As a consequence, the 3D models described inthe previous sections are compliant to Oracle 11g 3D model and easy uploadof the Tele Atlas 3D models in Oracle 11g is provided. This trend has alsoinfluenced the GDF standardisation where in the upcoming version 5.0 alsoa database neutral relational storage model is supported, which is compli-ant to the SQL/MM standard [12]. In version 5.0, a syntactic model will beprovided, modelling the entities of the GDF conceptual model one to one inrelations, e.g. node, edge, face, point, feature, line feature, area feature etc.In future, it is likely that GDF will also provide semantic model, by splittingthe generic table further according to feature themes. Also, the current 2.5Dmodel can be extended towards a 3D model, by supporting corresponding ge-ometric primitives such as solids. Thus, the GDF relational extensions are tobe seen complementary to the commercial off-the-shelf solutions from Oracleand others.