Embed Size (px)
Citation preview
372Sy
mp
osi
um
19:
Geo
scie
nce
an
d G
eoin
form
atio
n
Platform Geosciences, Swiss Academy of Science, SCNATSwiss Geoscience Meeting 2014
19. Geoscience and Geoinformation - From data acquisition to modelling and visualisation
Nils Oesterling, Adrian Wiget, Massimiliano Cannata
Swiss Geological Survey – swisstopo,
Swiss Geodetic Commission,
Swiss Geotechnical Commission,
Swiss Geophysical Commission,
Swiss Hydrogeological Society
TALKS:
19.1 Aubert M., Haeberlin Y., Mohamed I.M., Marguerat P., Zwahlen F., Bünzli M-A., Vogt M-L., Tschopp J., Kraiem A., Tchang T., Ali A., Sénégas O., Bazoun J.: Making information available to stakeholders for improved management of groundwater resources in arid Chad
19.2 Brodhag S., Oesterling, N.: The Data Model Borehole Data – A structure for digital one-dimensional subsurface data
19.3 Cannata M., Antonovic M.: SITGAP 2.0 – Comprehensive system for risk management
19.4 Hoffmann M., Cannata M., Antonovic M.: Novel architecture for a borehole management system
19.5 Malard A., Jeannin P-Y., Weber E., Vouillamoz J.: KARSYS: a GIS- and 3D-based approach for the characterization of karst aquifers
19.6 Neyer F., Limpach P., Gsell T., Geiger A., Beutel J.: Permanent rock glacier monitoring with a stereo pair of optical cameras
19.7 Thueler L., Brunner P., Zwahlen Z.: Groundwater vulnerability mapping in forested catchments
19.8 Thüring M.: Mobile Phone Apps for Rock Mass Rating in Engineering Geology
19.9 Tokarczyk P., Rieckermann J., Blumensaat F., Leitao J.P., Schindler K.: UAV-based mapping of surface imperviousness for water runoff modelling
19.10 Wegner J.D., Montoya-Zegarra J.A., Schindler K.: Extraction of road networks from aerial photos with minimum cost paths and PN-Potts potentials
19.11 Zurfluh F., Girardin C., Strasse C., Montani S., Biaggi D.: Work for geologists – use for engineers: An example of handling extensive amount of geological information within a big construction project
373
Sym
po
siu
m 1
9: G
eosc
ien
ce a
nd
Geo
info
rmat
ion
Platform Geosciences, Swiss Academy of Science, SCNATSwiss Geoscience Meeting 2014
POSTERS:
P 19.1 Avelar S., Hanselmann K., Vasconcelos C.: Data Analysis for Modeling Dissolution of Carbonate Minerals in Hypersaline Lagoon Water
P 19.2 Calpini C., Simpson G., Frischknecht C., Girardclos S.: From data treatment to tsunami hazard assessment in lakes: the challenging case of Lake Geneva
P 19.3 Negro F., Kerrou J.: Regional hydrogeological modelling of the central Jura in the area of Neuchâtel. Part 1 : 3D geological modelling
P 19.4 Kerrou J., Negro F.: Regional hydrogeological modelling of the central Jura in the area of Neuchâtel. Part 2 : 3D groundwater f low and mass transport modelling
P 19.5 Mock S., Allenbach R., Reynolds L., Baumberger R., Herwegh M.: 3D structural modelling of the Swiss Molasse Basin in the Canton of Bern
P 19.6 Le Cotonnec A., Ventra D., Moscariello A.: Architecture and property distribution of coal-bearing successions in Late Carboniferous f luvio-deltaic deposits (SE Kentucky, USA)
P 19.7 Yuzugullu O., Erten E., Hajnsek I.: Growth Stage Determination of Rice Fields: EMS Model Search Space Solution
374Sy
mp
osi
um
19:
Geo
scie
nce
an
d G
eoin
form
atio
n
Platform Geosciences, Swiss Academy of Science, SCNATSwiss Geoscience Meeting 2014
19.1
Making information available to stakeholders for improved management
of groundwater resources in arid Chad
Maëlle Aubert1, Yves Haeberlin1, Ismael Musa Mohamed2, Pascal Marguerat3, François Zwahlen4, Marc-André Bünzli5, Marie-Louise Vogt1/2, Jennifer Tschopp1, Amira Kraiem1, Tiffany Tchang1, Adam Ali1, Olivier Sénégas1, Janvier Bazoun1/2
1 UNOSAT, United Nations Institute for Training and Research (UNITAR), Palais des Nations, CH-1211 Genève ([email protected])2 Ministère de l’Elevage et de l’Hydraulique (MEH), N’Djaména, Tchad3swisstopo, Seftigenstrasse 264, CH-3084 Wabern4 Centre d’Hydrogéologie et de Géothermie (CHYN), Rue Emile-Argand 11, CH-2000 Neuchâtel5 Humanitarian Aid and SHA, Swiss Agency for Development and Cooperation (SDC), Sägestrasse 77, Köniz, CH-3003 Bern
Water resources are substantial in the Republic of Chad, but are unevenly distributed, locally difficult to access and above all poorly identified. The establishment of an active, sustainable and sovereign management of surface and ground waters, essential for achieving the development goals of Chad, necessitates improved knowledge of the resources and national capacity in the sector. Considering the situation, in 2009 the Chadian government asked the Swiss Agency for Development and Cooperation (SDC) to prepare a detailed concept paper addressing how to map Chad´s water resources. In 2012, an agreement was signed between the Water Ministry (currently Ministère de l’Elevage et de l’Hydraulique) and the SDC to support this initiative. This agreement gave birth to ResEau, a project implemented and managed by the Ministry and the United Nations Operational Satellite Applications Programme (UNITAR-UNOSAT), with the support of esteemed partners, including the Federal Office of Topography (swisstopo) and the Centre d’Hydrogéologie et de Géothermie (CHYN). The project is designed for a nine-year period lasting until 2020, at which point the entire country´s water potential will have been mapped.
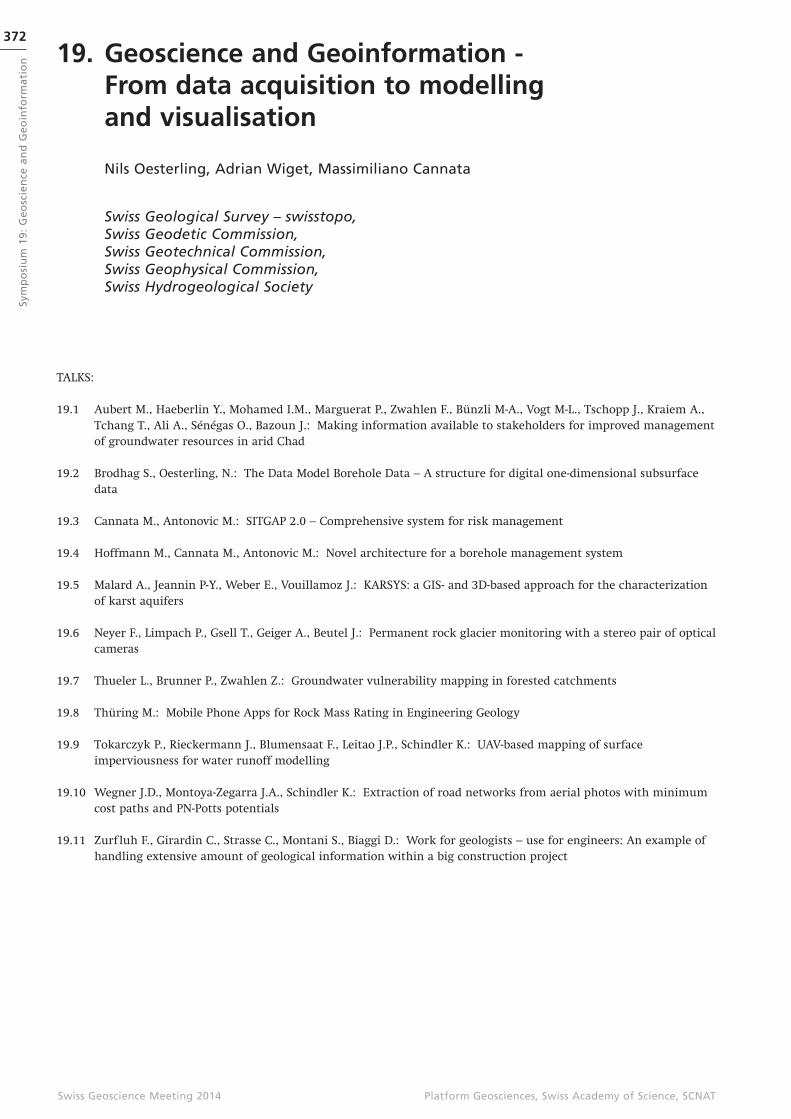
The first phase of the ResEau project focuses on developing a knowledge base for the northern and eastern regions of Chad. To achieve this, the ResEau team has created a GIS and water library database, including geological, hydrological and well/borehole information for Chad. From this database two hydrogeological atlases are being prepared by UNOSAT and gra-phically edited by swisstopo, with the release of state of the art paper maps: a survey map series at a 1:500,000 scale and a facility and resource map series at a 1:200,000 scale. The survey maps illustrate the nature, location and productivity of regional and other minor aquifers. A detailed note at the back of the map provides a description of the hydrogeological units and rainfall, water quality, and socio-economic information to better understand the regional context. The facility and resource maps, prepared for urban areas or near remarkable hydrological sites, provide detailed information on water resources in these zones. In June 2014, three of the nine planned maps at 1:500,000 scale (Ennedi, Wadi Fira Est and Ouadi Kadja), and the first of the fifteen planned maps at 1:200,000 scale (Am Zoer) have been published in paper print and numerical formats (Figure 1). These maps, resulting from a combination of satellite and well/borehole data, offer a new synthesis of the region´s hydrogeology at an unprecedented level of detail; they will also buttress future Chadian hydro-geological expertise on a large scale. Validation via targeted field missions reinforces the scientific quality of these pro-ducts. A final control occurs when the pre-print maps are submitted to the Chadian Ministry´s expertise.Indeed, besides backstopping validation by taking advantage of their knowledge of the territory, this process ensures that the maps being produced correspond to the needs of the Chadian government.
The publication of the 1:500,000 Ennedi hydrogeological sheet (Fig. 1) has already contributed to improving the knowledge and understanding of regional and local aquifers and thereby the water resources in the towns of Fada and Amdjarass. Key information learnt from the mapping and hydrogeological syntheses of the region covered by this map (16-18°N, 21-24°E) includes:
• Cambrian sandstones are a good regional aquifer, with water circulation over the basement contact, and perennial resurgences expressed by sources and gueltas (Archéï, Bachikélé).
• Fada sits on a multilayer Silurian sandstone aquifer, with the upper layer feeding the palm trees.• Alluvial zones hold locally shallow, non-perennial water bodies, whose behavior and production are related to wadi
hydrogeological regime and sand/clay composition of the sediments.• Mortcha plain is very unfavorable for groundwater; only low-productive saprolite aquifers have been found at the
foot of the sandstone massif.• There is no evidence for fossil groundwater in this region; chemical and isotopic analyses indicate modern rechar-
ge from meteoric water.The above facts do not point to a water shortage in the region, but draw attention to the need to take measures to better preserve and manage the fragile resource.
The water-related knowledge acquired by the ResEau team, as illustrated by the Ennedi example, is duly documented
375
Sym
po
siu
m 1
9: G
eosc
ien
ce a
nd
Geo
info
rmat
ion
Platform Geosciences, Swiss Academy of Science, SCNATSwiss Geoscience Meeting 2014
through the publication of scientific reports and transferred to professionals in Chad. The goal is that by the end of the project, the Chadian government will possess a comprehensive water database to conduct its own studies and better ma-nage the country´s water resources. Furthermore, the ResEau project is implementing complementary activities (GIS and hydrological formations, media,..) that aim to bring together the actors that have a stake in managing Chad´s water re-sources.
Figure 1. Hydrogeological survey map of the Republic of Chad at 1:500,000 scale, Ennedi sheet. (left) front side of map; (right) explana-
tory note and synoptic maps on the back side.
19.2
The Data Model Borehole Data – A structure for digital one-dimensional
subsurface data
Sabine Brodhag1, Nils Oesterling1
1 Federal Office of Topography swisstopo, Swiss Geological Survey, Seftigenstrasse 264, CH-3084 Wabern ([email protected])
Every year more and more boreholes are drilled in Switzerland. These boreholes provide important and unique informa-tion about the geological underground, for example its composition, structure etc. This information is key for understan-ding the subsurface and therefore, an essential basis for tackling various challenges of our society. Examples are: const-ruction of housing and traffic infrastructure, supply of energy, water and other natural resources, protection for natural hazards etc.
The drilling of a borehole requires, in general, a permission of a cantonal or federal authority. This permission typically includes the condition to deliver the generated borehole data (e.g. well profile) to the respective authority. Several norms (e.g. SN 640 034; SN 670 004), guidelines and recommendations (e.g. by cantonal granting authorities) exist for analogue recordings of this data (e.g. description of the cuttings, illustration of well profile). This is different for digital data. Up to now, no common definition and structure of such data and no recommendation for its acquisition, storage and exchange exists neither on cantonal nor on a federal level. For this reason, many borehole data are delivered in an incomplete and incompatible state to the authorities. An efficient exchange of digital borehole data is therefore not possible. This problem applies not only to administration but also to scientific or economic drilling projects, where efficient data exchange is needed.
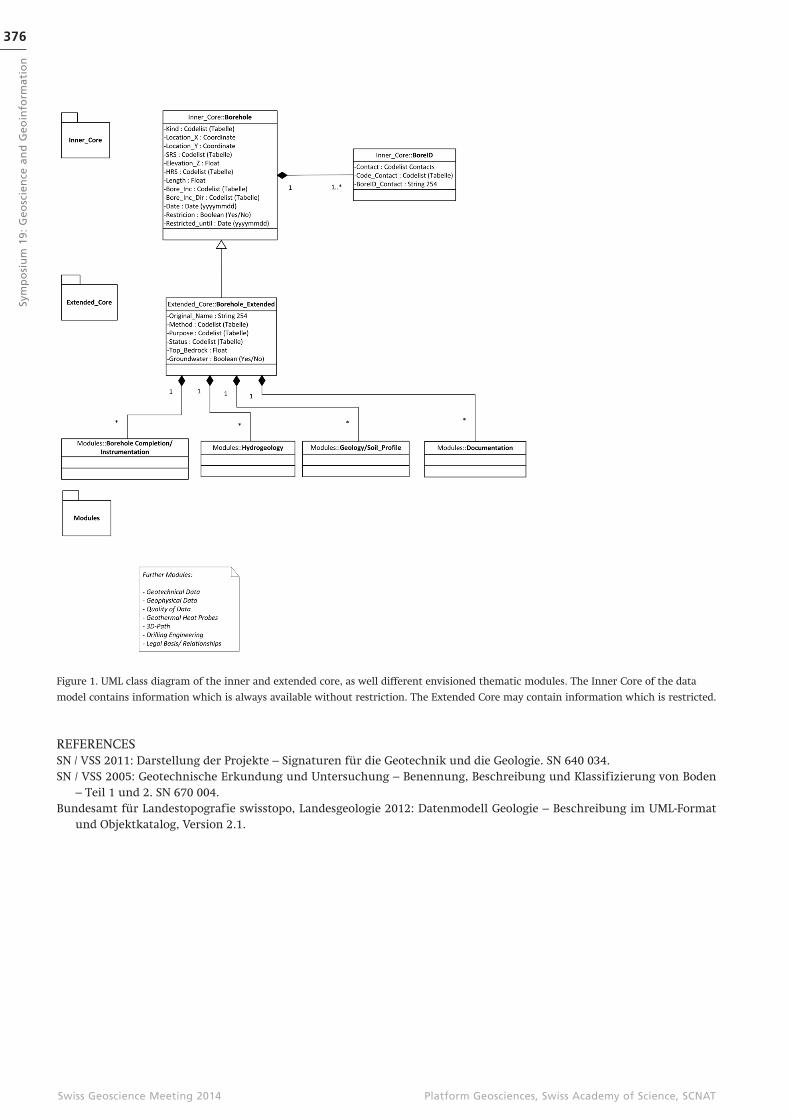
In order to tackle this problem, swisstopo established together with cantonal and federal offices and the private sector a working group which developed a common minimal data model for borehole data. This model describes various borehole types, soundings and artificial outcrops as a one-dimensional (linear) geometry and which can be represented as a single point at the earth’s surface.
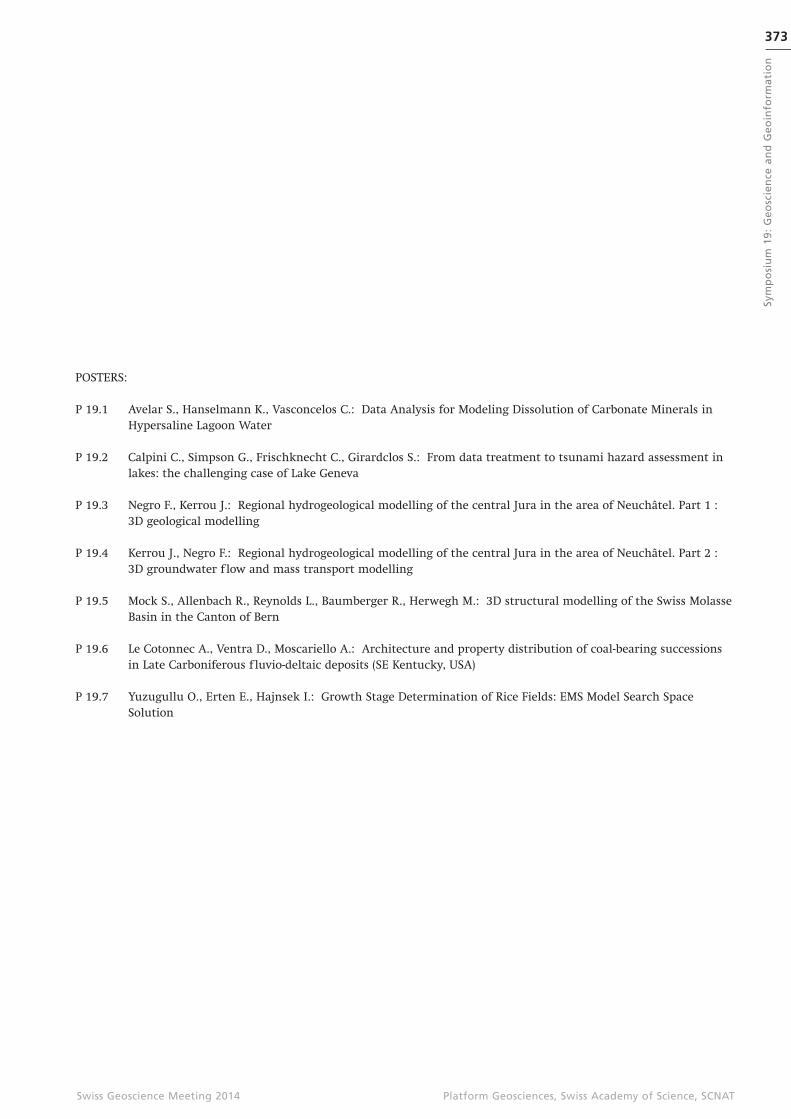
Since the access to borehole data is frequently restricted, the data model is separated into an inner core (where informa-tion is always freely available) and an extended core (information may be access-restricted) (Fig. 1). Apart from this two-part core, the data model may be extended by various thematic modules, some of which are currently in development.
The Data Model Borehole Data is a supplement to the Data Model Geology (Swisstopo) and specifies borehole data in gre-ater detail. In addition to these two data models, swisstopo is working on a data model for metadata associated with geological documents (e.g. geological reports).
376Sy
mp
osi
um
19:
Geo
scie
nce
an
d G
eoin
form
atio
n
Platform Geosciences, Swiss Academy of Science, SCNATSwiss Geoscience Meeting 2014
Figure 1. UML class diagram of the inner and extended core, as well different envisioned thematic modules. The Inner Core of the data
model contains information which is always available without restriction. The Extended Core may contain information which is restricted.
REFERENCES SN / VSS 2011: Darstellung der Projekte – Signaturen für die Geotechnik und die Geologie. SN 640 034.SN / VSS 2005: Geotechnische Erkundung und Untersuchung – Benennung, Beschreibung und Klassifizierung von Boden
– Teil 1 und 2. SN 670 004.Bundesamt für Landestopografie swisstopo, Landesgeologie 2012: Datenmodell Geologie – Beschreibung im UML-Format
und Objektkatalog, Version 2.1.
377
Sym
po
siu
m 1
9: G
eosc
ien
ce a
nd
Geo
info
rmat
ion
Platform Geosciences, Swiss Academy of Science, SCNATSwiss Geoscience Meeting 2014
19.3
SITGAP 2.0 – Comprehensive system for risk management
Massimiliano Cannata1, Milan Anotnovic1
1 Institute of Earth Sciences, SUPSI, Campus Trevano, 6952 Canobbio, Switzerland ([email protected])
Several studies on climate changes have predicted an increase in high-intensity precipitations in Europe, which is likely inc-rease the frequency and magnitude of natural hazards. Wherever is possible the more appropriate and auspicated risk ma-nagement approach is a wise land use planning regulation in order to reduce as much as possible people and valuable objects exposition. Unfortunately, in most of the cases, people and developed areas are located in areas alredy threaten by different types of risks like, for example, f loodings of nearby rivers, inundations from surronding lakes or landslides from the nearby mountain slopes. In all these cases, where the delocation of people and economic activities is not applicable, an early warning system may support the risk reduction by means of timely intervention actions and emergency plan actuation.
Thanks to impressive technological advances the visionary concept of the Digital Earth (Gore 1992, 1998) is being realizing: geospatial coverages and monitoring systems data are increasingly available on the Web, and more importantly, in a stan-dard format. As a result, today is possible to develop innovative decision support systems (Molinari et al. 2013) which mesh-up several information sources and offers special features for risk scenarios evaluation. In agreement with the ex-posed view, the authors have recently developed a new Web system whose design is based on the Service Oriented Architecture pattern. Open source software (e.g.: Geoserver, PostGIS, OpenLayers) has been used throughout the whole system and geospatial Open Standards (e.g.: SOS, WMS, WFS) are the pillars it rely on.
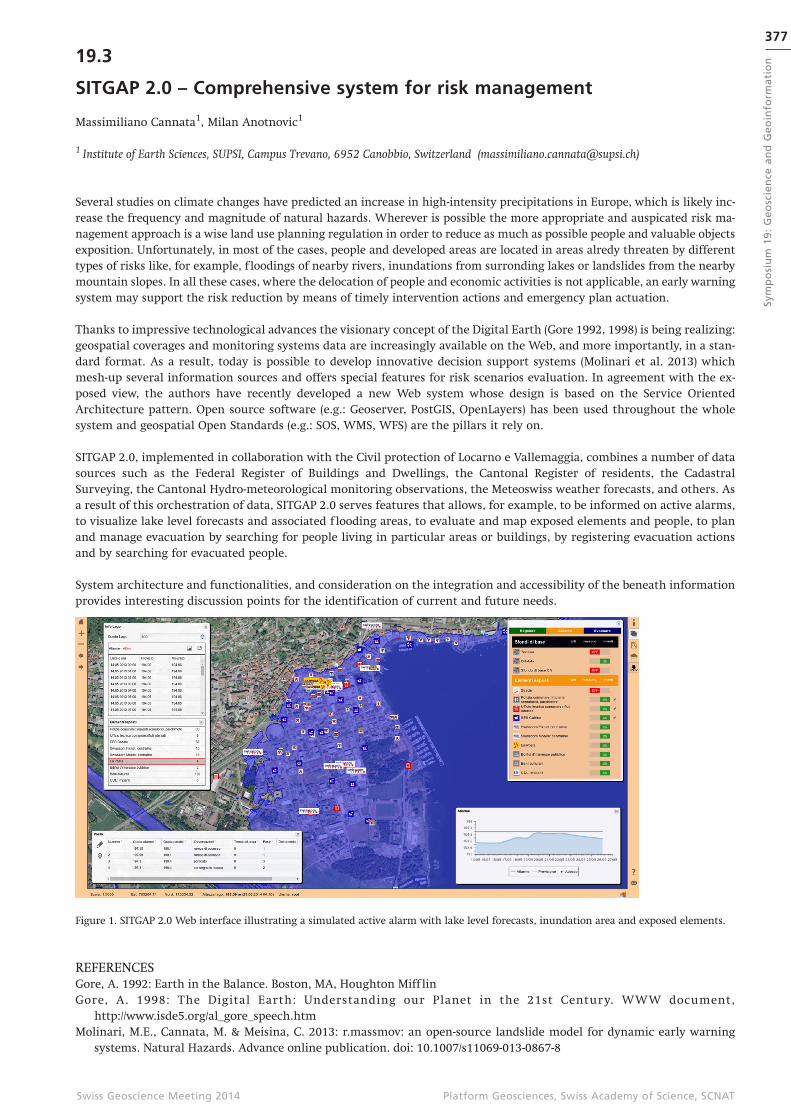
SITGAP 2.0, implemented in collaboration with the Civil protection of Locarno e Vallemaggia, combines a number of data sources such as the Federal Register of Buildings and Dwellings, the Cantonal Register of residents, the Cadastral Surveying, the Cantonal Hydro-meteorological monitoring observations, the Meteoswiss weather forecasts, and others. As a result of this orchestration of data, SITGAP 2.0 serves features that allows, for example, to be informed on active alarms, to visualize lake level forecasts and associated f looding areas, to evaluate and map exposed elements and people, to plan and manage evacuation by searching for people living in particular areas or buildings, by registering evacuation actions and by searching for evacuated people.
System architecture and functionalities, and consideration on the integration and accessibility of the beneath information provides interesting discussion points for the identification of current and future needs.
Figure 1. SITGAP 2.0 Web interface illustrating a simulated active alarm with lake level forecasts, inundation area and exposed elements.
REFERENCES Gore, A. 1992: Earth in the Balance. Boston, MA, Houghton Miff linGore, A. 1998: The Digital Earth: Understanding our Planet in the 21st Century. WWW document,
http://www.isde5.org/al_gore_speech.htmMolinari, M.E., Cannata, M. & Meisina, C. 2013: r.massmov: an open-source landslide model for dynamic early warning
systems. Natural Hazards. Advance online publication. doi: 10.1007/s11069-013-0867-8
378Sy
mp
osi
um
19:
Geo
scie
nce
an
d G
eoin
form
atio
n
Platform Geosciences, Swiss Academy of Science, SCNATSwiss Geoscience Meeting 2014
19.4
Novel architecture for a borehole management system
Marcus Hoffmann1, Massimiliano Cannata1, Milan Antonovic1
1 Institute of Earth Science, University of Applied Sciences and Arts of Southern Switzerland, Campus Trevano 32, CH-6952 Canobbio (marcus.hoffmann @supsi.ch)
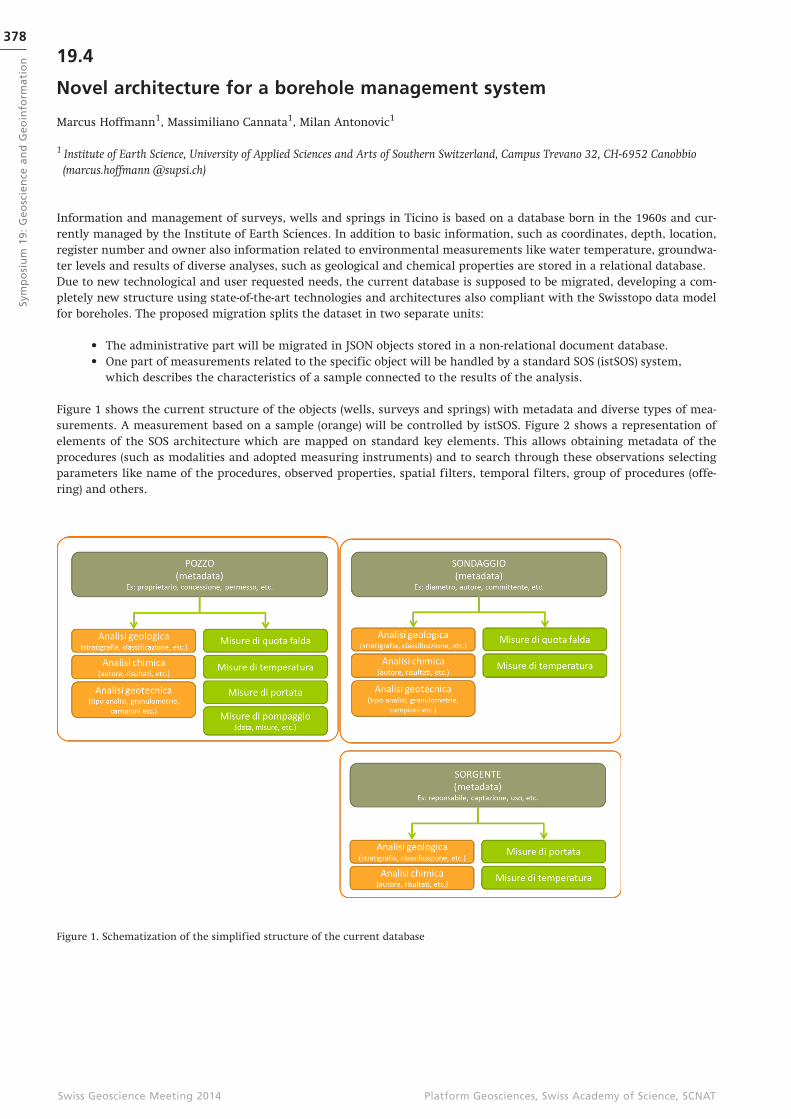
Information and management of surveys, wells and springs in Ticino is based on a database born in the 1960s and cur-rently managed by the Institute of Earth Sciences. In addition to basic information, such as coordinates, depth, location, register number and owner also information related to environmental measurements like water temperature, groundwa-ter levels and results of diverse analyses, such as geological and chemical properties are stored in a relational database. Due to new technological and user requested needs, the current database is supposed to be migrated, developing a com-pletely new structure using state-of-the-art technologies and architectures also compliant with the Swisstopo data model for boreholes. The proposed migration splits the dataset in two separate units:
• The administrative part will be migrated in JSON objects stored in a non-relational document database.• One part of measurements related to the specific object will be handled by a standard SOS (istSOS) system,
which describes the characteristics of a sample connected to the results of the analysis.
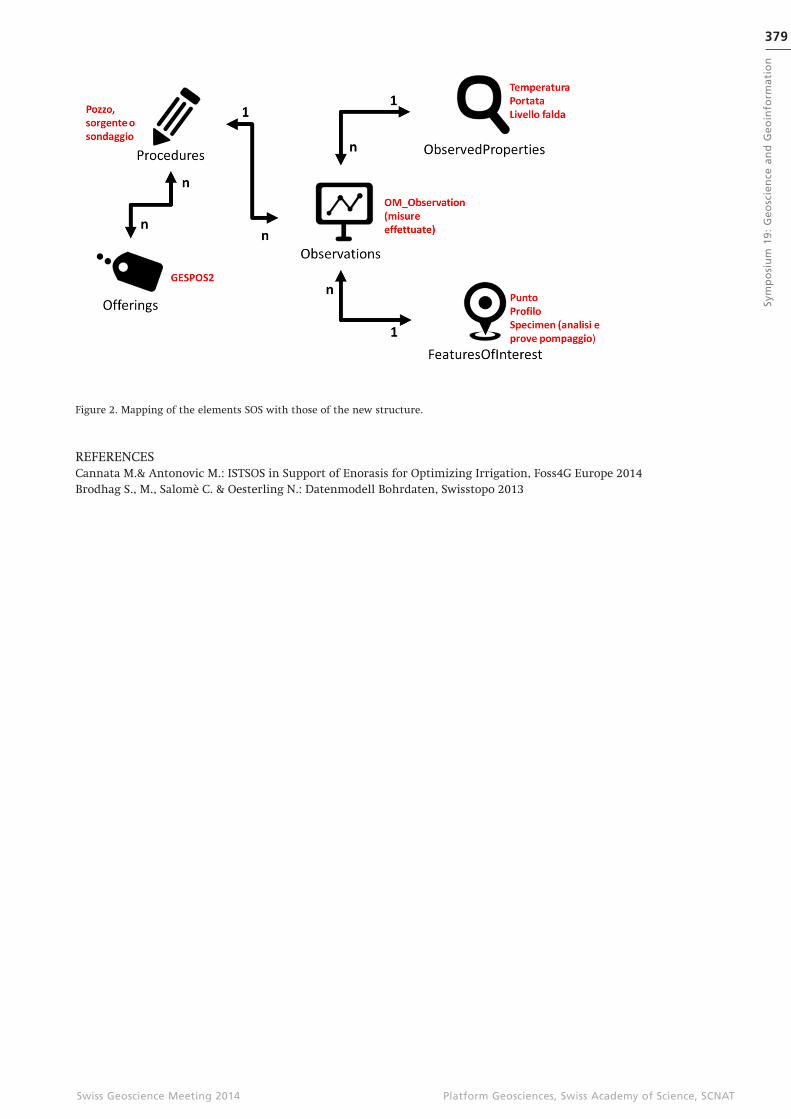
Figure 1 shows the current structure of the objects (wells, surveys and springs) with metadata and diverse types of mea-surements. A measurement based on a sample (orange) will be controlled by istSOS. Figure 2 shows a representation of elements of the SOS architecture which are mapped on standard key elements. This allows obtaining metadata of the procedures (such as modalities and adopted measuring instruments) and to search through these observations selecting parameters like name of the procedures, observed properties, spatial filters, temporal filters, group of procedures (offe-ring) and others.
Figure 1. Schematization of the simplified structure of the current database
379
Sym
po
siu
m 1
9: G
eosc
ien
ce a
nd
Geo
info
rmat
ion
Platform Geosciences, Swiss Academy of Science, SCNATSwiss Geoscience Meeting 2014
Figure 2. Mapping of the elements SOS with those of the new structure.
REFERENCESCannata M.& Antonovic M.: ISTSOS in Support of Enorasis for Optimizing Irrigation, Foss4G Europe 2014Brodhag S., M., Salomè C. & Oesterling N.: Datenmodell Bohrdaten, Swisstopo 2013
380Sy
mp
osi
um
19:
Geo
scie
nce
an
d G
eoin
form
atio
n
Platform Geosciences, Swiss Academy of Science, SCNATSwiss Geoscience Meeting 2014
19.5
KARSYS:
a GIS- and 3D-based approach for the characterization of karst aquifers
Arnauld Malard, Pierre-Yves Jeannin, Eric Weber, Jonathan Vouillamoz1
1 Swiss Institute for Speleology and Karst Studies, La Chaux-de-Fonds, [email protected], www.swisskarst.ch
Only few methods do exist for the characterization of karst aquifers and rare are those which explicitly integrate 3D geo-logical / hydrological data and hydraulic principles in a systematic way. The KARSYS approach (Jeannin et al. 2013) – al-ready presented during the previous SGM’s meetings – has been applied over a large part of the Swiss karst territory and abroad (Swisskarst project, Malard 2013) and it now entails a concrete and continuous workflow which basically combines: Database, GIS procedures and 3D Geological and hydrological modeling in order to address a large spectrum of pragmatic karst-related questions (mostly spatial issues as resources mapping, hazards in construction, geothermal probes regula-tions, etc.). Recent improvements and extensions have been implemented to the basic approach with the aim to address questions related to hydrological simulations (temporal issues: resources assessment, f lood hazards, hazards in construc-tion, etc.) whose results could be coupled with the physical karst model to provide a concrete image of the aquifer / sys-tem’s functioning. The approach requires the use of common GIS, 3D modelling and hydrologic software programs as well as various dedicated home-made scripts and plugins to ensure the programs interoperability and the data integrity all along the workflow. The approach also includes a GIS dedicated data model which has been developed for (i) applying KARSYS and (ii) documenting karst aquifers properties.
The talk will present the workflow of a KARSYS application in the frame of f lood hazards assessment from data acquisition to the implementation of a hydraulic pipe-f low model, passing through (i) the establishment of a conceptual karst aquifer model, (ii) the generation of a realistic (hydraulically-designed) conduits network, (iii) the simulation of the karst system’s discharge rate and (iv) the evaluation of the related impact on the ground.
Advantages of this GIS- and 3-based approach are:
• KARSYS could be applied even with limited data and the model may be continuously refined by the implementation of additional data
• KARSYS could be applied at different scales by selecting appropriate data, providing results on the whole aquifer or solely on a selected karst system
• KARSYS provides spatial information which could be stored and surveyed through a dedicated GIS-database (Malard et al. in press) or transferred semi-automatically into hydrologic and hydraulic pro-grams to provide temporal results. Finally spatial and temporal results could be combined to provide realistic image of the aquifer / system functioning.
REFERENCESJeannin, P.-Y., Eichenberger, U., Sinreich, M., Vouillamoz, J., Malard, A., & Weber, E. 2013: KARSYS: a pragmatic approach
to karst hydrogeological system conceptualisation. Assessment of groundwater reserves and resources in Switzerland. Environmental Earth Sciences 69(3), 999-1013.
Malard, A. 2013: SWISSKARST: comprendre et documenter les systèmes karstiques de Suisse. Geosciences Actuel 1: 15-18.Malard, A., Jeannin, P., Sinreich, M., Weber, E., Vouillamoz, J., & Eichenberger, U. in press: Praxisorientierter Ansatz zur
Kartographischen Darstellung von Karst-Grundwasserressourcen - Erfahrungen aus dem SWISSKARST-Projekt. Grundwasser - Zeitschrift der Fachsektion Hydrogeologie.
381
Sym
po
siu
m 1
9: G
eosc
ien
ce a
nd
Geo
info
rmat
ion
Platform Geosciences, Swiss Academy of Science, SCNATSwiss Geoscience Meeting 2014
19.6
Permanent rock glacier monitoring with a stereo pair of optical cameras
Fabian Neyer1, Philippe Limpach1, Tonio Gsell2, Alain Geiger1, and Jan Beutel2
1 Institute for Geodesy and Photogrammetry, ETH Zürich, Robert-Gnehm-Weg 15, CH-8093 Zürich ([email protected])2 Computer Engineering and Networks Laboratory, ETH Zürich, Gloriastrasse 35, CH-8092 Zürich
Rock glaciers are of great interest to permafrost and natural hazard researchers because global warming is predicted to have a particular impact on the overall kinematic state of these perennially frozen ice/rock mixtures, thus changing their surface f low velocity and risk for slope failures. In recent years, remote sensing has become a very popular and powerful tool to study surface changes like the motion of rock glaciers. While radar interferometry (especially InSAR) is suitable for covering large areas, other methods prevail by an increased local accuracy in space and time (e.g. GPS, laser scanning, optical imaging).
With the fast development of high quality consumer cameras, optical image data acquisition in remote areas has become easier and significantly cheaper over the past few years. Due to the demand of surface displacement measurements for monitoring purposes, optical cameras are getting more and more popular also for continuous quantitative analyses. While normalized cross-correlation is the most popular algorithm in this research field, we use a highly adaptive robust least-squares matching strategy for tracking image features with sub-pixel accuracy.
Within the X-sense project (Nano-Tera, SNF), optical cameras, weather stations, and a number of low-cost GPS devices were installed in the project area (Mattertal Valley, Switzerland). Because the camera positioning locations were not assumed to be stable over long time periods (lack of stable bedrock), GPS devices are integrated in the camera installation.
This work presents some results of monitoring the upper part of the Grabengufer rock glacier with optical cameras apply-ing least-squares feature matching and image rectification procedures. Using a stereo pair of permanently installed optical cameras, we reliably detect small 3-dimensional displacements corresponding to a sub-pixel level in various regions of the rock glacier. Modeling and compensating various environmental and hardware related effects (e.g., camera motion, image distortion variations) significantly improve the reliability of the results. For an independent validation of our estimates, we use two GPS stations that are permanently installed in different areas of the rock glacier and in the field of view of both cameras.
Our results show, that reliable cm to dm displacement estimates over relatively large areas can be obtained with high quality off-the-shelf cameras. Accounting for camera motion and distortion compensation by self-calibration significantly improves the accuracy. The combination of our proposed processing strategy, including optical cameras and low-cost GPS devices, and the permanently installed optical cameras delivering images in almost real-time, are valuable results for further studies.
382Sy
mp
osi
um
19:
Geo
scie
nce
an
d G
eoin
form
atio
n
Platform Geosciences, Swiss Academy of Science, SCNATSwiss Geoscience Meeting 2014
19.7
Groundwater vulnerability mapping in forested catchments
Lorienne Thueler1, Philip Brunner1 & François Zwahlen1
1 Center for Hydrogeology and Geothermics (CHYN), University of Neuchâtel, Emile-Argand 11, CH-2000 Neuchâtel ([email protected])
Groundwater vulnerability mapping provides the basis for the delimitation of groundwater protection zones. In Switzerland, three methods have been defined to establish groundwater protection zones. These methods depend of the type of aquifer: karstic (EPIK: (Doerfliger and Zwahlen 1998)), fractured (DISCO: (Pochon and Zwahlen 2003)) and uncon-solidated aquifers (Biaggi, Schwienbacher et al. 2012). These methods, in particular EPIK, tend to overestimate the vulne-rability of groundwater originated from forested catchment and therefore overestimate the protection zones in such kind of ecosystems. This effect is particularly important in Switzerland, where 42% of groundwater protection zones are located in forests (Meylan 2003). Until now, none of the existing methods has taken into account the specific characteristics of forest hydrology.
This study presents a new methodology named ForSIG (Thueler 2014), developed for groundwater vulnerability mapping in forested catchments. This method is semi-quantitative, based on a Parametric System Model. Sensitivity criteria cont-rolling the functions of transfer/retention of pollutants are parameterized, rated and weighted. Vulnerability maps are created using GIS tools by superposing layers that contain sensitivity criteria. The particularity of the ForSIG method is that it takes into account the hydrological characteristics of forested catchments. Sensitivity criteria that were not previ-ously considered were added to ForSIG: forest composition (softwood vs. hardwood ratio) and forest structure (repartition of the tree ages within the stands).
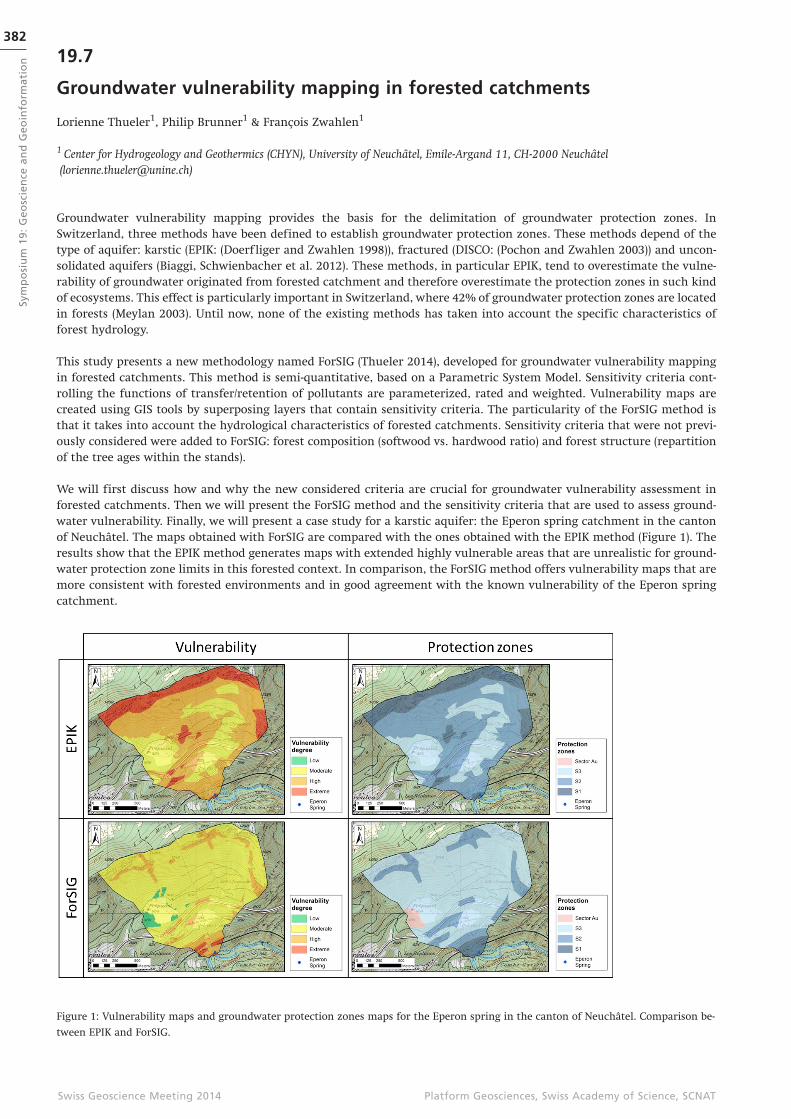
We will first discuss how and why the new considered criteria are crucial for groundwater vulnerability assessment in forested catchments. Then we will present the ForSIG method and the sensitivity criteria that are used to assess ground-water vulnerability. Finally, we will present a case study for a karstic aquifer: the Eperon spring catchment in the canton of Neuchâtel. The maps obtained with ForSIG are compared with the ones obtained with the EPIK method (Figure 1). The results show that the EPIK method generates maps with extended highly vulnerable areas that are unrealistic for ground-water protection zone limits in this forested context. In comparison, the ForSIG method offers vulnerability maps that are more consistent with forested environments and in good agreement with the known vulnerability of the Eperon spring catchment.
Figure 1: Vulnerability maps and groundwater protection zones maps for the Eperon spring in the canton of Neuchâtel. Comparison be-
tween EPIK and ForSIG.
383
Sym
po
siu
m 1
9: G
eosc
ien
ce a
nd
Geo
info
rmat
ion
Platform Geosciences, Swiss Academy of Science, SCNATSwiss Geoscience Meeting 2014
REFERENCESBiaggi, D., Schwienbacher, S. & Guldenfels, L. 2012: Zones de protection des eaux souterraines en roches meubles. Guide
Pratique. L’environnement pratique, Office Fédéral de l’Environnement (OFEV), Berne, Suisse, 58.Doerf liger, N. & Zwahlen, F. 1998: Groundwater vulnerability mapping in karstic regions (EPIK). Application to
groundwater protection zone: practical guide, Office Fédéral de l’Environnement, des Forêts et du Paysage (OFEFP), Berne, Suisse, 56.
Meylan, B. 2003: Der Wald sorgt für sauberes Trinkwasser, Fachzeitschrift gwa - Gas Wasser Abwasser, 3, 191 - 199.Pochon, A. & Zwahlen, F. 2003: Délimitation des zones de protection des eaux souterraines en milieu fissuré. Guide
pratique. L’environnement pratique, Office Fédéralde l’Environnement, des Forêts et du Paysage (OFEFP), Office Fédéral des Eaux et de la Géologie (OFEG), Berne, Suisse, 83.
Thueler, L. 2014: Estimation et cartographie des aquifères en milieu forestier, PhD thesis, University of Neuchâtel, Neuchâtel, Suisse, 165.
19.8
Mobile Phone Apps for Rock Mass Rating in Engineering Geology
Manfred Thüring
Lombardi SA, Via R. Simen 19, CH-6648 Minusio ([email protected])
One of the main tasks in engineering geology is to deliver a characterization of the rock mass and the derived geotechni-cal parameters to be used in the engineering design and construction process.
The most commonly used assessment schemes, Bieniawski’s rock mass rating (RMR) and Barton’s rock mass quality (Q) are based on the sum or the product of the main aspects of rock masses, such as it’s intact properties and the condition of discontinuities as the main weakening element.
The assessment of RMR and Q are usually done in the field using tabulated forms on paper sheets and evaluated later on in the office. Smartphones are omnipresent and can be used for this kind of data recording, using electronic forms. Additionally, they can be used to record structural data, the current location, and for photographic documentation. Furthermore, the data can be stored on the device and sent by e-mail in order to reduce the risk of data loss. The data can be processesed for reporting.This technology promises thus a big potential to simplify the working life of an engineering geologist.
The assessment methods of RMR and Q have been programmed for personal usage using the user-friendly and freely available programming environment Android Studio (site: developer.android.com). The environment offers the possibility to develop apps for mobile phones and tablets running Android OS in the programming language Java with relatively little effort. Only basic programming knowledge is required.
REFERENCESBieniawski, Z.T: Engineering Rock Mass Classifications, John Wiley and Sons, New York, 1989.Barton, N.R. (2002): Some new Q-value correlations to assist in site characterization and tunnel design. International
Journal of Rock Mechanics and Mining Sciences 39 (2): 185-216.
384Sy
mp
osi
um
19:
Geo
scie
nce
an
d G
eoin
form
atio
n
Platform Geosciences, Swiss Academy of Science, SCNATSwiss Geoscience Meeting 2014
19.9
UAV-based mapping of surface imperviousness for water runoff modelling
Piotr Tokarczyk1, Jörg Rieckermann2, Frank Blumensaat2/3, Joao Paulo Leitao2 & Konrad Schindler1
1 Institute of Geodesy and Photogrammetry , ETH Zurich, Stefano-Franscini-Platz 5, 8093 Zürich2 Swiss Federal Institute of Aquatic Science and Technology, Eawag, Überlandstrasse 133, 8600 Dübendorf3 Institute of Environmental Engineering, Chairs of Urban Water Management, ETH Zurich, Stefano-Franscini-Platz 5, 8093 Zürich
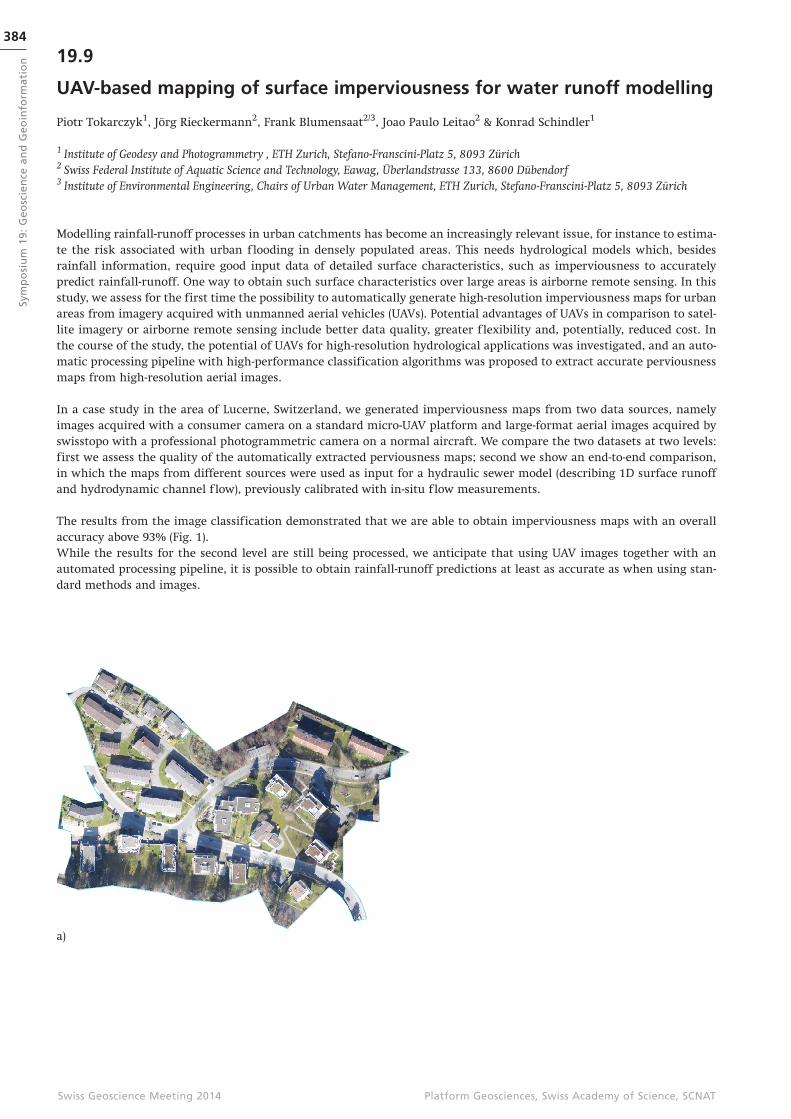
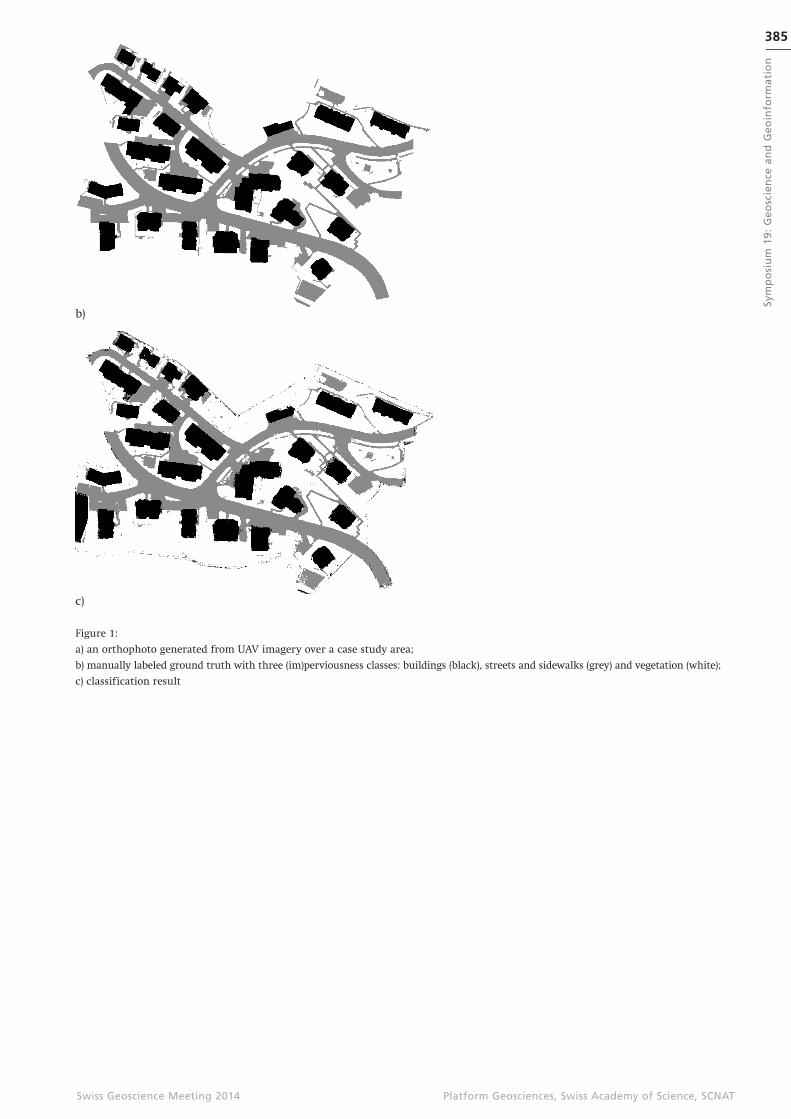
Modelling rainfall-runoff processes in urban catchments has become an increasingly relevant issue, for instance to estima-te the risk associated with urban f looding in densely populated areas. This needs hydrological models which, besides rainfall information, require good input data of detailed surface characteristics, such as imperviousness to accurately predict rainfall-runoff. One way to obtain such surface characteristics over large areas is airborne remote sensing. In this study, we assess for the first time the possibility to automatically generate high-resolution imperviousness maps for urban areas from imagery acquired with unmanned aerial vehicles (UAVs). Potential advantages of UAVs in comparison to satel-lite imagery or airborne remote sensing include better data quality, greater f lexibility and, potentially, reduced cost. In the course of the study, the potential of UAVs for high-resolution hydrological applications was investigated, and an auto-matic processing pipeline with high-performance classification algorithms was proposed to extract accurate perviousness maps from high-resolution aerial images.
In a case study in the area of Lucerne, Switzerland, we generated imperviousness maps from two data sources, namely images acquired with a consumer camera on a standard micro-UAV platform and large-format aerial images acquired by swisstopo with a professional photogrammetric camera on a normal aircraft. We compare the two datasets at two levels: first we assess the quality of the automatically extracted perviousness maps; second we show an end-to-end comparison, in which the maps from different sources were used as input for a hydraulic sewer model (describing 1D surface runoff and hydrodynamic channel f low), previously calibrated with in-situ f low measurements.
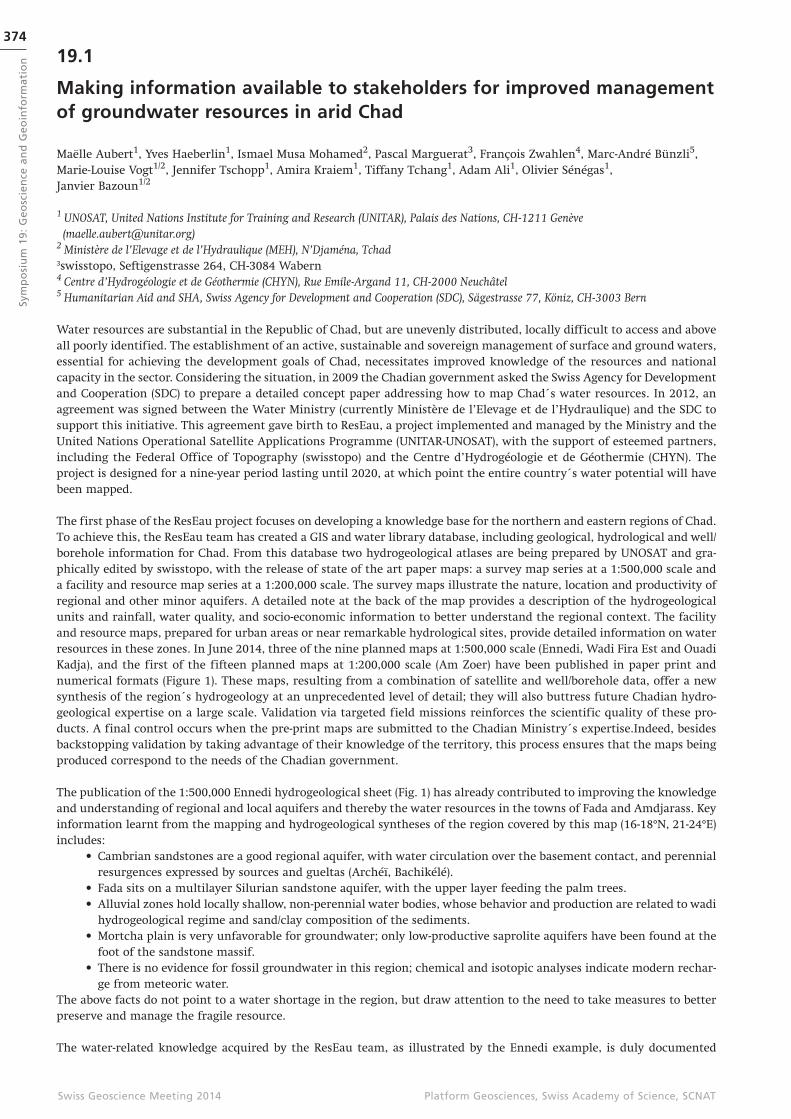
The results from the image classification demonstrated that we are able to obtain imperviousness maps with an overall accuracy above 93% (Fig. 1). While the results for the second level are still being processed, we anticipate that using UAV images together with an automated processing pipeline, it is possible to obtain rainfall-runoff predictions at least as accurate as when using stan-dard methods and images.
a)
385
Sym
po
siu
m 1
9: G
eosc
ien
ce a
nd
Geo
info
rmat
ion
Platform Geosciences, Swiss Academy of Science, SCNATSwiss Geoscience Meeting 2014
b)
c)
Figure 1:
a) an orthophoto generated from UAV imagery over a case study area;
b) manually labeled ground truth with three (im)perviousness classes: buildings (black), streets and sidewalks (grey) and vegetation (white);
c) classification result
386Sy
mp
osi
um
19:
Geo
scie
nce
an
d G
eoin
form
atio
n
Platform Geosciences, Swiss Academy of Science, SCNATSwiss Geoscience Meeting 2014
19.10
Extraction of road networks from aerial photos with minimum cost paths
and PN-Potts potentials
Jan Dirk Wegner, Javier A. Montoya-Zegarra, and Konrad Schindler
Photogrammetry and Remote Sensing, ETH Zürich, Stefano-Frascini-Platz 5, CH-8093 Zürich ([email protected])
We present a probabilistic representation of network structures in images. Our target application is the extraction of ur-ban roads from aerial images. Roads appear as thin, elongated, partially curved structures forming a loopy graph, and this complex layout requires a prior that goes beyond standard smoothness and co-occurrence assumptions. In the proposed model the network is represented as a union of 1D paths connecting distant (super-)pixels. A large set of putative candidate paths is constructed in such a way that they include the true network as much as possible, by searching for minimum cost paths in the foreground (road) likelihood. Selecting the optimal subset of candidate paths is posed as MAP inference in a higher-order conditional random field. Each path forms a higher-order clique with a type of clique potential, which at-tracts the member nodes of cliques with high cumulative road evidence to the foreground label. That formulation induc-es a robust PN-Potts model (Kohli et al., 2009), for which a global MAP solution can be found efficiently with graph cuts. Experiments with two road data sets show that the proposed model significantly improves per-pixel accuracies as well as the overall topological network quality with respect to several baselines.
In our approach the road network is thought of as the union of many elongated paths. In this way, network extraction can be cast as the search for a set of paths that together cover the entire network. The proposed method follows the recov-er-and-select strategy:
In the recover step a large, over-complete set of potential candidatepaths is generated, by finding the most road-like connections betweenmany different pairs of seed points. The aim of candidate generation ishigh recall, ideally the candidate set covers the entire road network, atthe cost of also containing many false positives that do not lie (completely) on roads.
In the select step undesired false positives are pruned from the candidate set to yield a reduced set still covering as much as possible of the network, but with few false positives. This second step is formulatedas the minimization of a global higher-order CRF energy, and can be solved to global optimality.
In more detail, our system consists of the following steps: First, an image is segmented into superpixels, which are from then on treated as the smallest entities (nodes) to be labeled. Per superpixel a feature vector is extracted and fed to a bina-ry Random Forest classifier, which assigns each superpixel a unary road likelihood. Next, promising candidate paths are generated. To that end, superpixels with high road likelihoods are sampled randomly as seed nodes and linked with min-imum cost paths. The hope is that road superpixels that have high background probability, e.g. due to a cast shadow, will be covered by a minimum cost path and thus become member of a clique where the majority of superpixels votes for road. The superpixels of each candidate path form a higher-order clique in a CRF. The potentials of these higher-order cliques are based on the PN-Potts model of Kohli et al. (2009) that enforces label consistency within large cliques, meaning that su-perpixels within the clique are penalized for deviating from the majority label. In that sense, our method could be seen as an anisotropic “smoothing along the paths”. The resulting CRF energy can be minimized with a graph cut, leading to a global optimum of the binary labeling task. Note that working with the actual long-range paths (cliques) is conceptually different from methods that divide long paths into short segments and classify each segment separately (Türetken et al., 2012). Like (Wang et al., 2011; Türetken et al., 2011) we prefer to work with complete paths, so as not to lose any connec-tivity information.
REFERENCESKohli, P., Ladicky, L., Torr, P.H.S., 2008. Robust higher order potentials for enforcing label consistency, in: IEEE
Conference on Computer Vision and Pattern Recognition.Türetken, E., González, G., Blum, C., Fua, P., 2011. Automated Reconstruction of Dendritic and Axonal Trees by Global
Optimization with Geometric Priors. Neuroinformatics 9, 279 – 302.Türetken, E., Benmansour, F., Fua, P., 2012. Automated Reconstruction of Tree Structures using Path Classifiers and
Mixed Integer Programming, in: IEEE Conference on Computer Vision and Pattern Recognition.Wang, Y., Narayanaswamy, A., Roysam, B., 2011. Novel 4-D open-curve active contour and curve completion approach for
automated tree structure extraction, in: IEEE Conference on Computer Vision and Pattern Recognition.
387
Sym
po
siu
m 1
9: G
eosc
ien
ce a
nd
Geo
info
rmat
ion
Platform Geosciences, Swiss Academy of Science, SCNATSwiss Geoscience Meeting 2014
19.11
Work for geologists – use for engineers:
An example of handling extensive amount of geological information
within a big construction project
Florian Zurfluh1, Claude Girardin1, Christoph Strasser1, Sara Montani1 & Daniele Biaggi1
1 Geotechnisches Institut AG, Bümplizstrasse 15, CH-3027 Bern ([email protected])
During big construction projects usually an immense amount of data is accumulated and it’s the task of consulting geo-logists to deliver engineers well-structured and concisely presented information out of the “data chaos”. In each step of a project (“Vorprojekt”, “Generelles Projekt” and “Ausführungsprojekt”) new data can be generated, often by different com-panies with various labelling systems. In addition, the dimensions or localisation of the planned construction can be ad-justed. Therefore f lexible instruments to handle and visualize geological data are needed. We will present two such suita-ble tools applied in a current project:
a) Project-related Geo Portalb) Geological 3D-model
As example we selected the planed highway bypass construction at Biel/Bienne. We will focus on the content, the utility and also the limits of the tools.
a) Project-related Geo Portal
The main goal of the project-related Geo Portal is to make available all relevant data in a clearly arranged, centrally stored and easily manageable way. Particularly regular measurements (i.e. groundwater level) should be directly evaluable. In the current example, the solution for this task is a GIS based database, which is available via internet. This geo-referenced map includes all important measurement stations. Each station has a link to:
• borehole data (PDF)• groundwater level (updated periodically, a recent diagram is drawn automatically and download of
data is possible)• chemical analyses• properties such as for example hydraulic conductivity
If the raw data is processed properly, the Geo Portal is a very efficient tool to get an overview of all available and immedi-ately usable data. The access is only protected by password, which makes it easily accessible by every involved person.
b) Geological 3D-model
The geology at the planned construction area in the central part of Biel/Bienne is relatively complicated. Several lithologies with different geotechnical and hydrogeological properties occur within a small area. Most of them have complex geomet-rical limits and if the planned locality of the construction is modified, relevant changes in the geological underground are expected. To have a f lexible tool for planning and visualisation, a geological 3D-model was built.
Inputdata of the geological 3D-model:
• Borehole data (own drillcores and from archives),• Geological surface map of the Geological Atlas of Switzerland 1:25’000,• Digital Elevation Model (DEM).
After data collection, the borehole information had to be synchronized. We simplified the multifaceted geological situati-on at Biel/Bienne into 15 lithological units. The model was built using leapfrog mining software. A sedimentological ap-proach was chosen (i.e. each unit has either “depositional” or “erosional” properties -> important for interpolation). The modelled area has the dimensions of 7.2 km (E-W) x 5.5 km (N-S) and includes the information of 178 boreholes. The de-epest borehole has a length of 250 m and the average length is 25 m (Median 20 m). To construct the dipping of the geo-logical units the model parameter was extended, although finally just the area around the planed highway path is needed.

388Sy
mp
osi
um
19:
Geo
scie
nce
an
d G
eoin
form
atio
n
Platform Geosciences, Swiss Academy of Science, SCNATSwiss Geoscience Meeting 2014
The outlines of the modelled geological units are exported to CAD-formats, which then are used by engineers to construct transects at the desired localities. It is possible to inspect the model via free available visualisation software, where a fast overview can be gathered.
In summary, the most important gains of the model are:
• Fast and f lexible construction of transects (in CAD-formats),• Visualisation of complex geological units or structures, e.g. surface of solid rock (Molasse),• Calculation of volumes of intended amount of excavated material (supply management).
Nevertheless, the model has its limits:
• Uncertainty is 2 m at areas with high density of information and about 5 m where a medium density of boreholedata is present,
• Optimal balance between smoothing factors (influences uncertainty) and file size has to be found,• Certain CAD software cannot deal with the exported volumes -> 3D-layers had to be generated separately,• The large extent of the model (which is needed for accurate modelling) produces large file sizes,• Initially, the model was calculated using LV03 reference system. Nowadays the products have to be in
LV95 coordinates -> each export has to be transformed.
The two presented tools permit the handling of large amount of data and are useful tools in the interacting work of geo-logists and engineers.
389
Sym
po
siu
m 1
9: G
eosc
ien
ce a
nd
Geo
info
rmat
ion
Platform Geosciences, Swiss Academy of Science, SCNATSwiss Geoscience Meeting 2014
P 19.1
Data Analysis for Modeling Dissolution of Carbonate Minerals in
Hypersaline Lagoon Water
Silvania Avelar, Kurt Hanselmann & Crisógono Vasconcelos
Geological Institute, ETH Zurich, Sonnegstrasse 5, CH-8092 Zürich ([email protected])
The characterization of the mineral dissolution/precipitation process involves a large number of parameters, which in turn results in large databases that must be interpreted with the aid of non-trivial statistical methods. In order to test and find an appropriate model to predict dissolution and precipitation of three carbonate minerals - calcite, aragonite and dolomi-te - in high salinity medium, we need precise and complete physico-chemical data of water drawn from different modern environments and conditions around the world. The model should make it possible to evaluate the influence of several parameters, for example, temperature, pH, anions, cations, total alkalinity and others, on mineral phase formation, as well as the likelihood of carbonate precipitation to occur in modern dolomite-forming environments. For that, it is essential to verify the existing data before using it for the intended predictions, as incomplete and imprecise data can only give a li-mited view with great uncertainty of the studied area. Unfortunately, there is at present not a single set of physico-chemi-cal data publically available that is suitable enough to make assumptions about the conditions the data reflect.
The goal of this study is to establish a database of carbonate mineral formation in hypersaline lagoons that enables subsequent modeling and visualization of the data and better monitoring programs in such environments. An inventory was prepared with physico-chemical data collected over recent years by a number of different authors, who addressed water chemistry in brackish to hypersaline lagoons in Região dos Lagos of Rio de Janeiro, Brazil, where active precipita-tion of dolomite occurs (Höhn 1987, Vasconcelos and McKenzie 1997, Moreira et al 2004, Voegeli 2012, Bahniuk 2013). A complete physico-geochemical dataset of a hypersaline coastal lagoon, Lagoa Vermelha, was compiled in order to be inclu-ded into the predictive carbonate precipitation model. This database requires precise data and reliable procedures for the verification of assumptions of the model. Missing data was either calculated according to the data assessment criteria or supplemented with data from a similar site, which was the nearby Brejo dos Espinhos lagoon.
The analysis of the physico-chemical data of Lagoa Vermelha used traditional chemical formulations (Stumm and Morgan 1996). We analysed the values of all existing data, evaluated their precision, corrected where necessary according to phy-sico-chemical laws, and compiled a reliable set of data for the intended prediction model. Various relations between the physico-chemical data of Lagoa Vermelha were examined. The data analysis gives insights into the behavior of parameters of a modern dolomite-forming system.
This work can help to design proper data collection protocols for future studies on the formation of carbonate mineral phases in hypersaline lagoons and on the dissolution/ precipitation of calcite, aragonite and dolomite. Our study is still in its early stages; however, our observations already suggest that besides physico-chemical factors, external factors, for ex-ample microbes, might be involved in the dolomite precipitation process.
Further work includes specific comparison studies of physico-chemical data of Lagoa Vermelha, Rio de Janeiro, with data from another classic site of modern dolomite formation, the Coorong lakes, South of Australia. We also plan to propose a model to predict dissolution and precipitation of minerals, which will be based on machine learning tech-niques (Hastie et al 2001, Bishop 2006).
REFERENCESBahniuk, A. 2013: Coupling Organic and Inorganic Methods of Study Growth and Diagenis of Modern Microbial
Carbonates, Rio de Janeiro State, Brazil: Implications for Interpreting Ancient Microbialite Facies Development. PhD Thesis, ETH Zurich, Switzerland.
Bishop, C. 2006: Pattern Recognition and Machine Learning. Berlin: Springer-Verlag.Hastie, T., Tibshirani, R. & Friedman J. 2001: The Elements of Statistical Learning, Springer-Verlag.Höhn, A. 1987: Geochemie einer Östlich von Rio de Janeiro gelegenen Hypersalinen Lagune. PhD Thesis, Johannes
Gutenberg-Universität in Mainz, Germany.Moreira, N.F., Walter, L.M., Vasconcelos, C., McKenzie, J.A. & McCall, P.J., 2004: Role of sulfide oxidation in
dolomitization: Sediment and pore-water geochemistry of a modern hypersaline lagoon system, Geology, 32, 701-704.Vasconcelos, C. & McKenzie, J.A. 1997: Microbial mediation of modern dolomite precipitation and diagenesis under
anoxic conditions (Lagoa Vermelha, Rio de Janeiro, Brazil). Journal of Sedimentary Research, 67, 378-390.Voegeli, N. 2012: Implications of Elevated Strontium Values in Microbial Mediated Dolomites: Brejo do Espinho and Lagoa
Vermelha, Brazil. Master’s Thesis, Department of Earth Sciences, Geological Institute, ETH Zurich. August 2012.Stumm, W. & Morgan, J. J. 1996: Aquatic Chemistry, John Wiley & Sons.
390Sy
mp
osi
um
19:
Geo
scie
nce
an
d G
eoin
form
atio
n
Platform Geosciences, Swiss Academy of Science, SCNATSwiss Geoscience Meeting 2014
P 19.2
From data treatment to tsunami hazard assessment in lakes:
the challenging case of Lake Geneva
Caroline Calpini1, Guy Simpson1, Corine Frischknecht1, Stéphanie Girardclos1,2
1 Section of Earth and environmental sciences, University of Geneva, rue des Maraîchers13, 1205 Geneva (Swizerland) ([email protected])2 Institute for environmental sciences, Route de Drize 7, 1227 Carouge, (Switzerland)
Up to now catastrophic events linked to tsunami waves, such as the Indian Ocean Tsunami (2004) and the Tohoku-Oki Tsunami (2011), have raised strong societal interest in understanding and assessing risk associated with these disasters. However, killer waves are not only restricted to oceanic water bodies but can also occur in lakes.
This research focuses on the tsunami hazard within the Lake Geneva basin. Lake Geneva results from the Quaternary glaciations in Europe, and with an area of around 580 km2 and a volume of 89 km3, is considered the largest lake in Western Europe. It is formed by two sub-basins named “Grand Lac” and “Petit Lac”.
Previous seismic, sedimentological and modelling studies in Lake Geneva have shown that at least five large sublacustrine mass failures triggered meter-amplitude tsunami waves along the shores during the last 4000 years (Kremer, 2014; Kremer et al., 2012), representing an annual average frequency of 0.0013 yr-1. The oldest event (between 1872 and 1608 B.C.) is interpreted to have been caused by a cascading earthquake-mass movement-tsunami chain of events, whereas the youngest tsunami event (563 A.D.) is interpreted as being triggered by a rockfall causing a collapse of the Rhone Delta (Kremer et al., 2012).
Key parameters characterizing a tsunami are wave heights, speed and propagation path, wavelength (distance between two waves propagating) and inundation zone in meters (run-up). These are obtained using a new physical tsunami wave model based on a Non-Oscillatory central differencing scheme (Nessyahu & Tadmor, 1990) developed using Matlab. In order to be capable of obtaining maximum run-up distance on the lake shore, and all the other associated parameters, the model re-quires initial data describing the lake and its surroundings, meaning a combination of information related to topography and bathymetry. To obtain this data, a specific geoprocessing tool has been developed under ArcGIS for data treatment and for data exportation in the format required by the tsunami model under Matlab. At the moment, the tsunami hazard as-sessment is deterministic, allowing consideration of several possible source locations around the lake.
Since the last tsunami event (563 A.D.), the Lake Geneva region has evolved into a major economic and urban area; the Swiss part of Lake Geneva region makes 15% of the Swiss PIB (Grob, 2008). Most of the lake shores are inhabited and/or occupied by human infrastructure (e.g. factories, roads, cities). It is therefore important to understand and to model ts-unami wave propagation in order to assess potential consequences that could occur whatever the trigger event would be.
REFERENCESFritsche, S., & Fäh, D. 2009: The 1946 magnitude 6.1 earthquake in the Valais: site-effects as contributor to the damage,
Swiss Journal of Geosciences, 102(3), 423–439. Grob, U. 2008: Le Bassin lémanique: centre financier, fief horloger, eldorado pour les sièges d’entreprises, La Vie
Économique (Die Volkswirtschaft), 37–41.Kremer, K. 2014: Reconstructing 4000 years of event history in deep Lake Geneva (Switzerland – France): Insights from
the sedimentary record, PhD thesis University of Geneva, 221 pp.Kremer, K., Simpson, G. & Girardclos, S. 2012: Giant Lake Geneva tsunami in ad 563, Nature Geoscience, 5, 756–757.Nessyahu, H. & Tadmor, E. 1990: Non-oscillatory central differencing for hyperbolic conservation laws, Journal of
Computational Physics, 87(2), 408–446.
391
Sym
po
siu
m 1
9: G
eosc
ien
ce a
nd
Geo
info
rmat
ion
Platform Geosciences, Swiss Academy of Science, SCNATSwiss Geoscience Meeting 2014
P 19.3
Regional hydrogeological modelling of the central Jura in the area of
Neuchâtel. Part 1 : 3D geological modelling
François Negro1 & Jaouher Kerrou1
1 The Centre for Hydrogeology and Geothermics (CHYN), University of Neuchâtel, Emile-Argand 11, CH-2000 Neuchâtel ([email protected])
The canton of Neuchâtel is located in the central part of the Jura fold and thrust belt at the northwestern limit of the Molasse basin. The structure of this part of the Jura is a succession of thrust-related folds, composed of Mesozoic to Cenozoic cover rocks detached from their pre-Triassic basement, and limited by several major tear faults. Three main aquifers are recognised within the cover series in this area. These are from top to bottom: the upper Malm, the Dogger and the upper Muschelkalk. The main goal of this study is to understand the behaviour of groundwater f low in this multi-layered aquifer system and especially in the two main regional reservoirs, namely the upper Malm and the Dogger. This study is divided in two parts: part 1 presents the construction of the 3D geological model (this abstract) and part 2 (see companion abstract) the results of 3D groundwater f low and mass transport modelling.
3D geological modelling has been performed using 3D Geomodeller software (BRGM, Intrepid Geophysics). The model (80x80x5 km box) extends from the Pontarlier fault to the west, to city of Biel to the east. It is bounded to the north by the Doubs river and to the south by the lake of Neuchâtel. The 3D model has been built with a compilation of the availab-le geological data in the area (geological maps, cross-sections, boreholes). Geological formations have been grouped accor-ding to their hydrogeological properties (i.e. aquifer or aquiclude). Around 90 geological cross-sections have been used to constrain the model at depth. Available interpretations of seismic lines have been used to constrain the deep structure of the model. Furthermore, only major tectonic structures relevant for groundwater f low have been included.
We present and discuss the structure of the 3D geological model and the way the model has been discretized into an un-structured 3D finite element mesh for groundwater f low and mass transport modelling (see companion abstract).
392Sy
mp
osi
um
19:
Geo
scie
nce
an
d G
eoin
form
atio
n
Platform Geosciences, Swiss Academy of Science, SCNATSwiss Geoscience Meeting 2014
P 19.4
Regional hydrogeological modelling of the central Jura in the area of
Neuchâtel. Part 2 : 3D groundwater flow and mass transport modelling
Jaouher Kerrou1 & François Negro1
1 The Centre for Hydrogeology and Geothermics (CHYN), University of Neuchâtel, Rue Emile-Argand 11, CH-2000 Neuchâtel – Suisse ([email protected])
A large number of studies have been conducted on the geology and the groundwater resources in the region of Neuchâtel (e.g. Kiraly, 1973; Pasquier et al., 1999, 2006). This study aims to synthesize the available data in order to setup a regional hydrogeological numerical model that can be used : to understand the behaviour of groundwater f low and mass transfer in the multilayered aquifer system and especially in the two main regional reservoirs, namely the upper Malm and the Dogger; to evaluate groundwater resources and their vulnerability; and further to evaluate the regional geothermal poten-tial. This study is presented in two parts: part 1 presents the building of the 3D geological model (see companion abstract) and part 2 (this abstract) the results of 3D groundwater f low and mass transport modelling.
In a first step, a hydrogeological conceptual model was setup. The model of 2200 Km2 area extends from the Pontarlier fault to the west, to city of Biel to the east. It is bounded to the north by the Doubs river and to the south by the lake of Neuchâtel. The conceptual model is based on 3D geological modelling (c.f Part 1) of the folded Jura in the area of Neuchâtel accounting for geological cross-sections, deep borehole data and seismic lines. Geological formations have been grouped according to their hydrogeological properties (i.e. aquifer or aquiclude). The resulting model is a multilayered system of 10 hydrogeological units from Trias to Tertiary age.
Then, the regional geological model has been discretized into an unstructured 3D finite element mesh. The latter was constructed by integrating different structures such as the rivers network, the extension of major faults, the surface geol-ogy, the location of the main karstic springs. This mesh was then refined near rivers and faults. In total, the 3D mesh contains more than 7 million elements and 4 million nodes. The f low boundary conditions are mainly specified hydraulic heads (Dirichlet type) along the major rivers. Inflow fluxes (Neumann type) derived from hydrological balance were at-tributed elsewhere on the top surface to represent direct recharge by rain water. Moreover, specified hydraulic heads were attributed on the lake f loor and the lateral boundaries. No f low conditions were assumed at the bottom.
The groundwater f low and mass transport equations, in an equivalent porous medium approach were solved using a stan-dard finite element method. First, the recharge spreading layer was calibrated by adjusting the inflow fluxes and the hydraulic conductivities of the outcropping formations against hundreds of hydraulic heads and springs f low rates mea-surements. Then, the depth-dependent hydraulic parameters of the main aquifers were calibrated by inverse modelling. After, a sensitivity analysis has been performed to point out the hydraulic role of major faults. The results so far are pre-sented and discussed.
REFERENCES Kiraly, L., 1973 : Notice et carte hydrogéologique du canton de Neuchâtel. Bulletin de la Société Neuchateloise de Sciences
Naturelles, 96. Pasquier, F., Bouzelboudjen, M. & Zwahlen, F., 1999 : Carte Hydrogéologique de la Suisse, Sarine, feuille n° 6. Commission
Géotechnique Suisse et Service Hydrologique et Géologique National.Pasquier, F., Zwahlen, F. & Bichet, V., 2006 : Carte hydrogéologique de la Suisse, Vallorbe-Léman nord, feuille n° 8.
Commission géotechnique suisse.
393
Sym
po
siu
m 1
9: G
eosc
ien
ce a
nd
Geo
info
rmat
ion
Platform Geosciences, Swiss Academy of Science, SCNATSwiss Geoscience Meeting 2014
P 19.5
3D structural modelling of the Swiss Molasse Basin in the Canton of Bern
Samuel Mock1, Robin Allenbach2, Lance Reynolds2, Roland Baumberger2 & Marco Herwegh1
1 Institute of Geological Sciences, University of Bern, Baltzerstrasse 1+3, CH-3012 Bern ([email protected])2 Federal Office of Topography swisstopo, Swiss Geological Survey, Seftigenstrasse 264, CH-3084 Wabern
In recent years the Swiss Molasse Basin has come under closer scrutiny for exploring geothermal energy, CO2 sequestrati-on and nuclear waste disposal potentials but also infrastructure and the planning of land use. 3D geological models have become an important instrument for addressing these issues. Their relevance expected to increase in the future. The “GeoMol CH” project, under the coordination of the Swiss Geological Survey(swisstopo), will produce a 3D model of the Swiss Molasse Basin. This model will serve as a valuable tool for the aforementioned topics. Our model of the Molasse Basin in the Canton of Bern forms part of the “GeoMol CH” project and will be built at a scale of 1:50’000. It is based on the Seismic Atlas of the Swiss Molasse Basin (Sommaruga et al., 2012) and studies done by Nagra (e.g. Meier, 2010; Roth et al., 2010). The final model will contain 12 geological horizons, from the top of the bedrock down to the base of the Mesozoic, thus including the major Cenozoic and Mesozoic strata. Furthermore, tectonic structures visible at the modeled scale will be incorporated into the model.
The 3D model covers an area of approximately 1’700 km2 and reaches depths of about 5 km. This model is based mainly on interpretations of 2D reflection seismic and well data. It is necessary to include geological surface data in the modelling process, as the Cenozoic horizons are poorly discernable in the seismics. For fault interpretation, we will be applying an integrative approach using seismic data, as well as digital elevation models and orthophotos for verifying the lateral and vertical continuity of the structures. This poster, presents our modelling methodology and initial results.
REFERENCES Meier, B. P. 2010: Ergänzende Interpretation ref lexionsseismischer Linien zwischen dem östlichen und westlichen
Molassebecken. Arbeitsbericht NAB 10-40, unpublished, Nagra, Wettingen.Roth, P., Naef, H., and Schnellmann, M. 2010: Kompilation und Interpretation der Reflexionsseismik im Tafeljura und
Molassebecken der Zentral- und Nordostschweiz, Arbeitsbericht NAB 10-39, unpublished, Nagra, Wettingen.Sommaruga, A., Eichenberger, U., and Marillier, F. 2012: Seismic Atlas of the Swiss Molasse Basin. Beitr. Geol. Schweiz,
Geophysik, 44..
394Sy
mp
osi
um
19:
Geo
scie
nce
an
d G
eoin
form
atio
n
Platform Geosciences, Swiss Academy of Science, SCNATSwiss Geoscience Meeting 2014
P 19.6
Architecture and property distribution of coal-bearing successions in Late
Carboniferous fluvio-deltaic deposits (SE Kentucky, USA)
Le Cotonnec, A., Ventra, D., Moscariello, A.
Section des Sciences de la Terre et de l’Environnement, Université de Genève, Rue des Maraîchers 13, CH-1205 Genève
The exploration of coal-bearing reservoirs for hydrocarbon resources, both conventional and unconventional worldwide, has increased the interest in similar f luvial/estuarine successions. In this context, East Kentucky offers excellent outcrop analogues for Carboniferous f luvial-dominated deltaic where facies associations, depositional environments and sequence-stratigraphic patterns can be observed in detail. Extensive roadcuts and a vast database of well/core data (coal and gas exploration), available at the KGS (Kentucky Geological Survey) make of East Kentucky an excellent field laboratory for studying clastic sedimentology and stratigraphy in coal-bearing successions.
The middle Pennsylvanian Pikeville and Hyden Formations are very well exposed along the US highways 23 and 119 in Pike County (SE Kentucky). The local stratigraphy is well known thanks to numerous studies focused on very extensive Pennsylvanian coal beds, used as stratigraphic markers for outcrop correlation. Both formations were deposited in a fore-land basin adjacent to the then-active Appalachian orogeny. Fluvio-deltaic systems fed by the orogen prograded toward west and northwest across the basin, subject to periodic transgressions driven by high-amplitude glacio-eustatic base-level changes during the Late Palaeozoic Gondwanan glaciation.
Here we show preliminary results from two outcrops (Burning Fork and John’s Creek) along the US119, allowing 3D in-terpretations and modelling, and covering respectively an area of 0.5km2 and 0.15 km2. They were studied through de-tailed logging at facies scale and high-resolution rock sampling for characterization of porosity and permeability and for QEMScan rock-typing analyses. The dominant facies associations allow us to distinguish deposits from three main deposi-tional environments: low- to high-sinuosity rivers in coastal plains; paralic (estuarine or deltaic) settings; shallow-marine settings. Successions are formed by vertically stacked, erosively based depositional sequences with thickness from a few meters to a few tens of meters, with general architecture comprising three main elements: river-dominated valley fills; transitional sediments of coastal to marginal-marine environments, including coalbeds; and extensive marine shales lo-cally intercalated with prograding mouth-bar deposits.
Integrated with available subsurface datasets, logs will be used to derive 3D facies and architectural models (Petrel) of sandstone bodies, with an aim to link their properties to sequence-stratigraphic phase.
P 19.7
Growth Stage Determination of Rice Fields: EMS Model Search Space
Solution
Onur Yüzügüllü1, Esra Erten2, Irena Hajnsek1
1 Earth Observation and Remote Sensing, Institute of Environmental Engineering, ETH Zürich ([email protected])2 Department of Geomatics Engineering, Istanbul Technical University
Rice crop based products have always been one of the most important crops in history of economy and mankind. In the last years, rice field monitoring have gained importance under the topic of precise agriculture of large areas. In this con-text, remote sensing techniques have been utilized for several applications including growth monitoring, product estima-tion and illness detection.
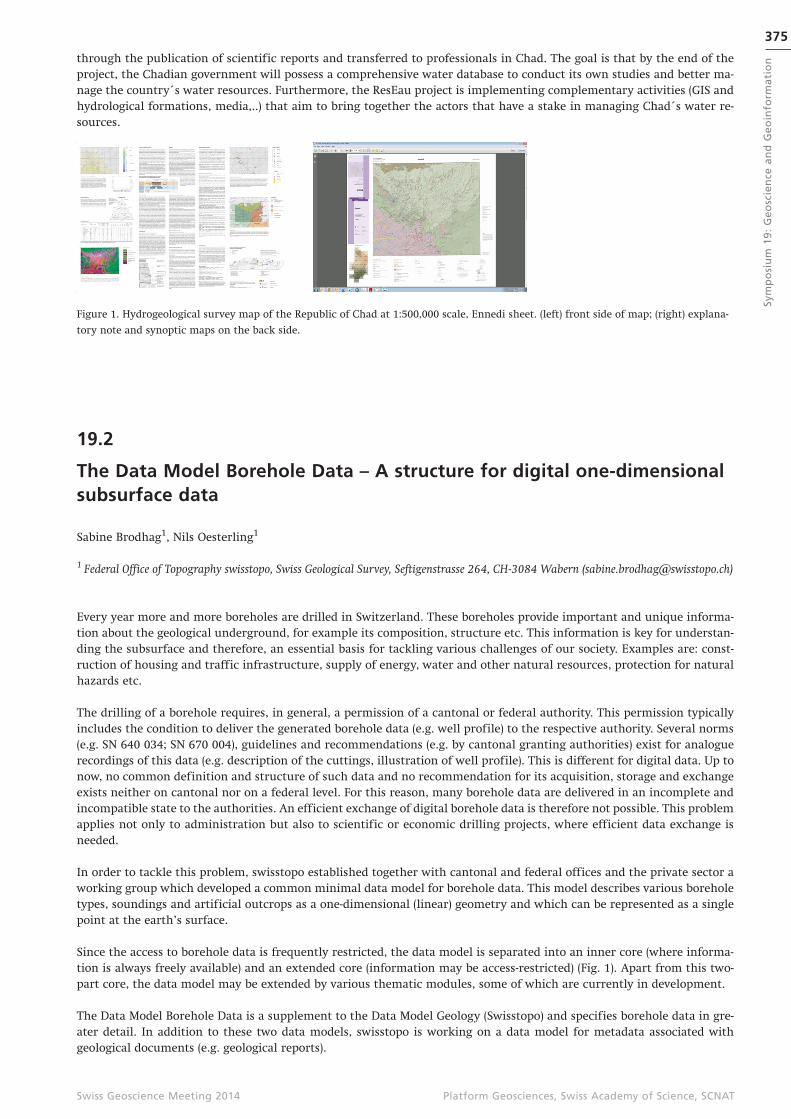
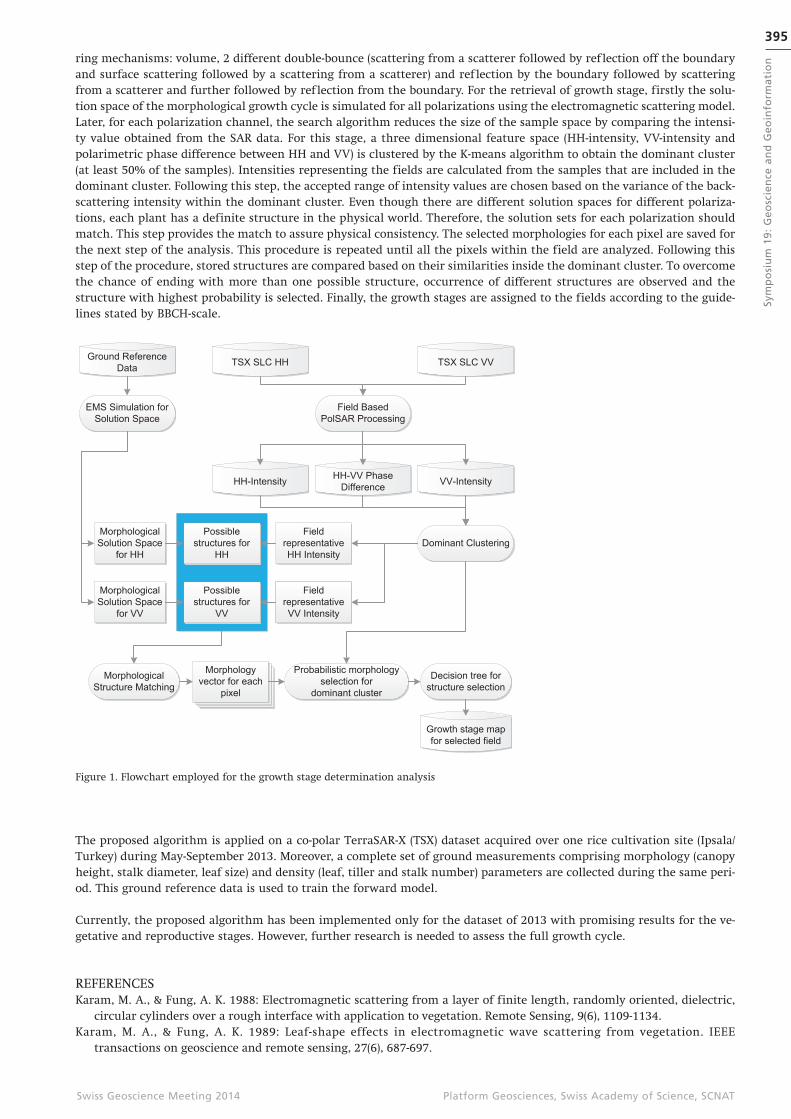
The objective of this study is to provide an algorithm to determine the growth stage of rice fields using polarimetric SAR (PolSAR) data. The proposed strategy to determine the growth stage of rice fields is outlined in Figure 1. Here, the electro-magnetic scattering model, which consists of stalks (Karam & Fung, 1988) and deciduous leaves (Karam & Fung, 1989) is first considered. This forward scattering model, based on the radiative transfer approach, considers four different scatte-
395
Sym
po
siu
m 1
9: G
eosc
ien
ce a
nd
Geo
info
rmat
ion
Platform Geosciences, Swiss Academy of Science, SCNATSwiss Geoscience Meeting 2014
ring mechanisms: volume, 2 different double-bounce (scattering from a scatterer followed by reflection off the boundary and surface scattering followed by a scattering from a scatterer) and reflection by the boundary followed by scattering from a scatterer and further followed by reflection from the boundary. For the retrieval of growth stage, firstly the solu-tion space of the morphological growth cycle is simulated for all polarizations using the electromagnetic scattering model. Later, for each polarization channel, the search algorithm reduces the size of the sample space by comparing the intensi-ty value obtained from the SAR data. For this stage, a three dimensional feature space (HH-intensity, VV-intensity and polarimetric phase difference between HH and VV) is clustered by the K-means algorithm to obtain the dominant cluster (at least 50% of the samples). Intensities representing the fields are calculated from the samples that are included in the dominant cluster. Following this step, the accepted range of intensity values are chosen based on the variance of the back-scattering intensity within the dominant cluster. Even though there are different solution spaces for different polariza-tions, each plant has a definite structure in the physical world. Therefore, the solution sets for each polarization should match. This step provides the match to assure physical consistency. The selected morphologies for each pixel are saved for the next step of the analysis. This procedure is repeated until all the pixels within the field are analyzed. Following this step of the procedure, stored structures are compared based on their similarities inside the dominant cluster. To overcome the chance of ending with more than one possible structure, occurrence of different structures are observed and the structure with highest probability is selected. Finally, the growth stages are assigned to the fields according to the guide-lines stated by BBCH-scale.
Ground Reference
DataTSX SLC VVTSX SLC HH
Field Based
PolSAR Processing
HH-Intensity VV-IntensityHH-VV Phase
Difference
Dominant Clustering
EMS Simulation for
Solution Space
Morphological
Solution Space
for VV
Morphological
Solution Space
for HH
Field
representative
VV Intensity
Field
representative
HH Intensity
Possible
structures for
HH
Possible
structures for
VV
Morphological
Structure Matching
Probabilistic morphology
selection for
dominant cluster
Decision tree for
structure selection
Growth stage map
for selected field
Field
representative
VV Intensity
Morphology
vector for each
pixel
Figure 1. Flowchart employed for the growth stage determination analysis
The proposed algorithm is applied on a co-polar TerraSAR-X (TSX) dataset acquired over one rice cultivation site (Ipsala/Turkey) during May-September 2013. Moreover, a complete set of ground measurements comprising morphology (canopy height, stalk diameter, leaf size) and density (leaf, tiller and stalk number) parameters are collected during the same peri-od. This ground reference data is used to train the forward model.
Currently, the proposed algorithm has been implemented only for the dataset of 2013 with promising results for the ve-getative and reproductive stages. However, further research is needed to assess the full growth cycle.
REFERENCESKaram, M. A., & Fung, A. K. 1988: Electromagnetic scattering from a layer of finite length, randomly oriented, dielectric,
circular cylinders over a rough interface with application to vegetation. Remote Sensing, 9(6), 1109-1134.Karam, M. A., & Fung, A. K. 1989: Leaf-shape effects in electromagnetic wave scattering from vegetation. IEEE
transactions on geoscience and remote sensing, 27(6), 687-697.