Embed Size (px)
Citation preview

Lecture 8 Net Present Value and
Calculating the Best Alternative

What CEOs do for a living
CEO
Business1
Business2
Opportunity1
Opportunity2

Investment Alternatives
• The object is to take capital earned, borrowed or from investors and allocate it in a fashion that earns the highest return for the shareholders of the company.
• There needs to be an appropriate balance of long and short term returns.
• More complex and as simple as a matter of dollars and cents.
Question: What are some investment alternatives for a company?

What are typical investment alternatives. . .
• Invest in – product line a or product line b
– Advertising
– Information Systems
– A new factory
– Buy-back companies stock
– Acquisition
– Employee bonus or salary raise
– Hire more HR personnel
– etc.,etc.
The Criteria is:Which investment(s) gives the highest return?

Question
• How do you calculate which gives the highest return?

Principal of Equivalence
• The state of being equal in value– amount– discount assumptions– Time transactions occur
All investments must be normalized to give equivalence so comparisons can be made

Net Present Value of an Investment
• Holds for all investments
• Takes into account inflation, cost of capital, corporate expectations of return
• Reduces all times to a common point

Calculation of Net Present Value
n
tt
t
k
ANPV
0 1
Where k is the expected rate of return
A sub t is the cash flow in the period t
Choose the programs whose NPV is highest consistent with strategy, risk, resource, etc.

Calculation of Payback Period
0
10
n
tt
t
r
A
Where r = discount rate
is the cash flow in period t
tAtA
tA

Preparing an economic feasibility study
• Compare product Returns on Investmentexample: Sample business plan pro forma
Dollars
Time
(Years)

What should the discount rate be?
• For a start-up
• For a growth company
• For a mature company
• For an Aerospace company

To calculate NPV, first assume a cash flow
-4000
-2000
0
2000
4000
6000
8000
10000
1 2 3 4 5 6 7 8 9 10 11 12Time (Years)
CashFlow
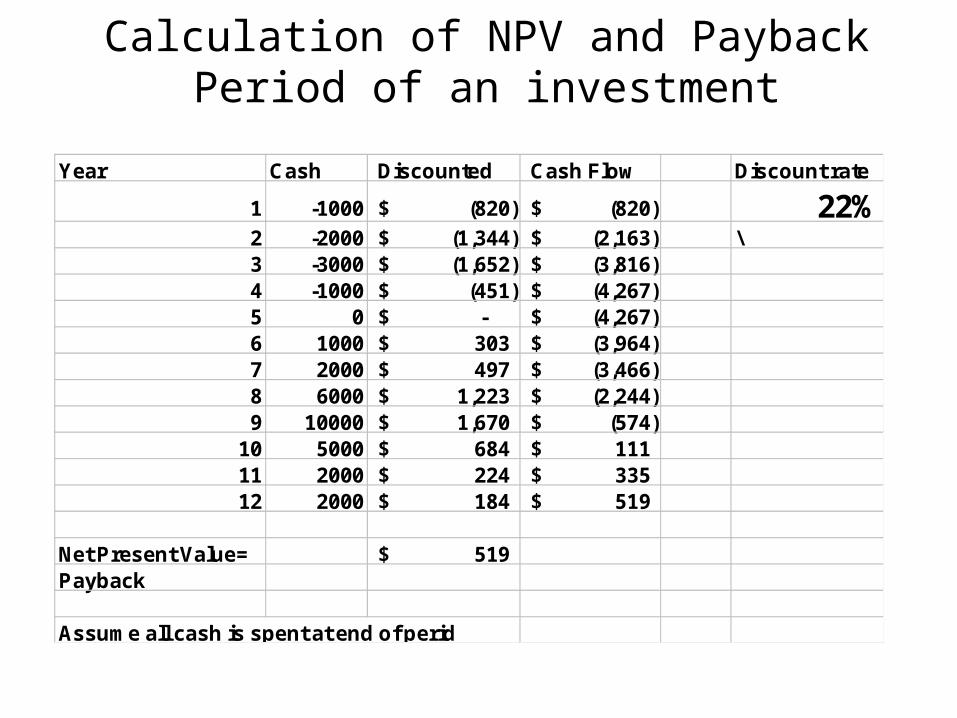
Calculation of NPV and Payback Period of an investment
Year Cash Discounted Cash Flow Discount rate
1 -1000 (820)$ (820)$ 22%2 -2000 (1,344)$ (2,163)$ \3 -3000 (1,652)$ (3,816)$ 4 -1000 (451)$ (4,267)$ 5 0 -$ (4,267)$ 6 1000 303$ (3,964)$ 7 2000 497$ (3,466)$ 8 6000 1,223$ (2,244)$ 9 10000 1,670$ (574)$
10 5000 684$ 111$ 11 2000 224$ 335$ 12 2000 184$ 519$
Net Present Value= 519$ Payback
Assume all cash is spent at end of perid

Calculation of Internal Rate of Return (IRR) for a project
• Calculate a discount rate (k) that reduces the NPV of a project to zero
n
tt
t
k
ANPV
0 10

Calculation of Internal Rate of Return IRR) of an investment
-1000
-500
0
500
1000
1500
20 21 22 23 24 25 26 27 28 29
NPV($) VsDiscount Rate(%)
IRR=24.3%

Net Present Value
• What are the Problems with this analysis methodology?
Fudge earningsMacroeconomic effects
inflationcrashwar
CompetitionDisruptive techPersonnel change

What’s wrong with this picture?
• Predictions are very difficult- especially when they involve the future.– Extrinsic
• Markets change• Competitors change• Macro-economic conditions change
– Intrinsic• The analyses are based on flawed assumptions
– Program delays– Manufacturing snafus– Technologies not ready– Externalities (out of your control)– Many other reasons
Then why does everybody do it?

Advantages of a quantitative methodology
Screen out the losersSensitivity analysisTargetCommon language

Sensitivity Analysis
• Reduce (Increase) Price
• Change Product Development Time
• Consider competitive response

Some thoughts on how to increase profitsP=SP-C
1. Increase Selling PriceIncrease Customer Value
• Put extra features in product which require little marginal cost
• Provide extra service
• Target less competitive segment of the market
• Get to market before competition
• Price at the maximum the customer is willing to pay
Price models should reflect customer value- not cost (except in government contracts if you wish to avoid jail
Note in English gardening magazine: Even though seed sales are at an all time high, the price is not expected to come down

• Why?
Some thoughts on how to increase profitsP=SP-C
2. Decrease Selling Price
Undermine competetionIncrease sales volumeChange business modelBuild base

• Do it right the first time
• Don’t commit to detailed design until you have customers specs firmthen don’t change
• Build a manufacturable product. Bring manufacturing in early
• Don’t overload with features that the customer doesn’t want that are costly to develop
• Manage tightly to schedule with appropriate risk and risk reduction plans
• Use rigid phase exit criteria
All of these consistent with Fast C/T
Some thoughts on how to increase profitsP=SP-C
3. Decrease Product Development (NRE) and Manufacturing (RE) costs

• Effect on product price in being first to market?
• Effect on total revenue of turning out products faster?
• Effect on Cost?
Some thoughts on how to increase profitsP=SP-C
4. Decrease Cycle Time for product Development

Assume the decision is made to invest in developing new products
• How do you make the decision on which new product to invest in?
• What are the criteria for this decision-making process?
• How do we maximize profit? – in the long range– in the short range

Portfolio Analysis
Reward (NPV)
Risk
Game Changers
KillBread and Butter
Pearls

D
C
B
A
Reward (NPV)
Risk
Kill
Game Changers
Bread and Butter
Pearls
A Portfolio of 6 programs
G
F
Note: area = program cost

How do you allocate?
Not by NPV and Payback Period alone
But. . .• Portfolio Balance (long/short) • Strategically Important vs Tactically Important• Product Families and Platforms• Future Sales Model• Available Resource
– People and Dollars
• Customers demands

Data for Rank ordered List
Project Name IRR NPV StrategicImportance
Probability ofTechnical Success
Alpha 20% 10.0 5 80%
Beta 15% 2.0 2 70%
Gamma 10% 5.0 3 90%
Delta 17% 12.0 2 65%
Epsilon 12% 20.0 4 90%
Omega 22% 6.0 1 85%

Rank Ordered by discounting returns by probability of success
Project Name IRR NPV StrategicImportance
Ranking Score
Alpha 16.0 (2) 8.0 (2) 5 (1) 1.67 (1)
Epsilon 10.8 (4) 18.0 (1) 4 (2) 2.33 (2)
Delta 11 (3) 7.8 (3) 2 (4) 3.33 (3)
Omega 18.7 (1) 5.1 (4) 1 (6) 3.67 (4)
Gamma 9.0 (6) 4.5 (5) 3 (3) 4.67 (5)
Beta 10.5 (5) 1.4 (6) 2 (4) 5.0 (6)

Some references
• Economist Quarterly
• Using markets– http://www.economist.com/displaystory.cfm?st
ory_id=5244000
• Methodologies– http://www.class.uh.edu/MediaFutures/
forecasting.html