Embed Size (px)
Citation preview

2/16/2016
1
LECTURE 6:ESTIMATION OF NUTRIENT
REQUIREMENT
TOPICS OF DISCUSSION
1. Estimation of Fertilizer RequirementA. A Simple Approach Plant nutrient Expected yield
B. Yield Response2. Best Management Practices
2/16/2016
2
1. A SIMPLE APPROACH
Nutrient requirement depends on1. Targeted yield and soil nutrient supply2. Type of fertilizer and recovery3. Timing (which is dependent on the maturity
of variety)
To estimate fertilizer requirements weneed to know1. Target yield2. Crop yield with no fertilizer3. Fertilizer recovery
Example1. Target yield: 4.5 t/ha2. Yield without fertilizer: 1.5 t/ha3. Yield from the fertilizer: 4.5 – 1.5 = 3 t/ha4. Approximate fertilizer needed per tonne of
cropN = 15 - 20 kg N/ton yieldP = 2.5 – 3 kg P/ton yieldK = 15 – 20 kg K/ton yield
2/16/2016
3
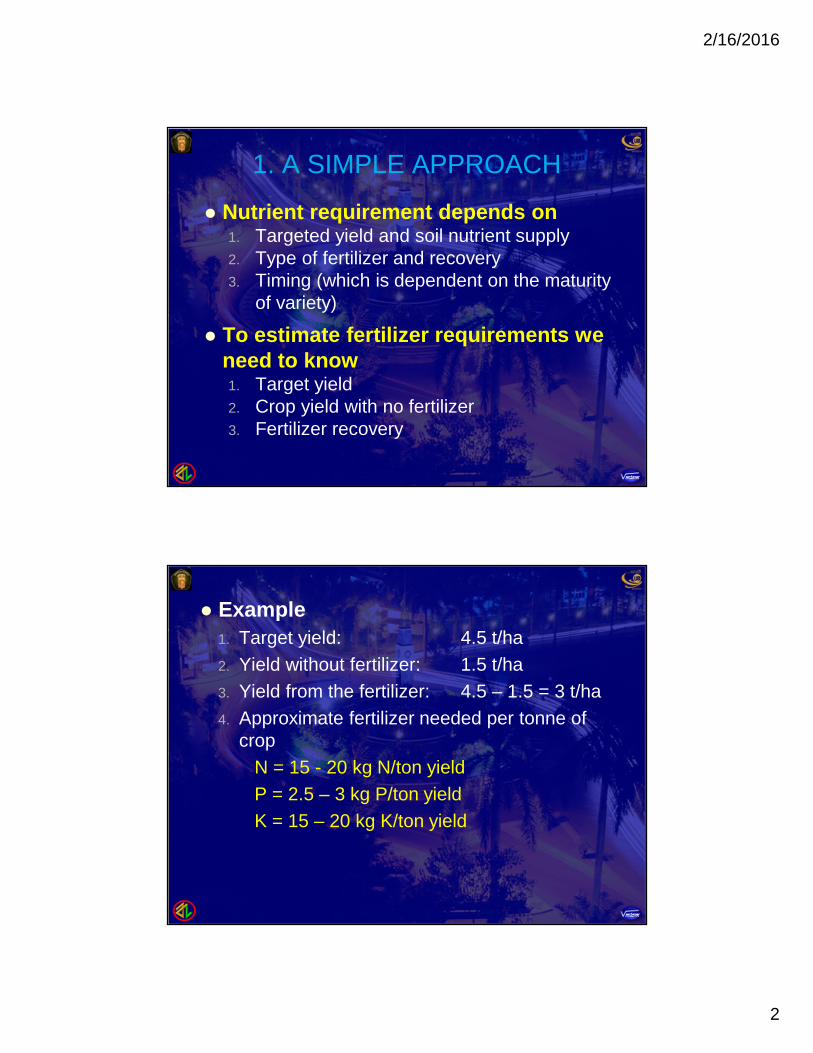
Thus to get additional yield of 3 tonnes grainper/ha the crop require an additional 3 (15 - 20) = 45 – 60 kg N/ha 3 (2.5 – 3.0) = 7.5 – 9 kg P/ha 3 (15 – 20 ) = 45 – 60 kg K/ha
N recovery is typically of the order of 50% thus (45-60 kg N per ha)/0.5 90-120 kg N per ha
The use of slow release of urea (super granules)by deep placement increases the recovery ofN and thus the quantity of fertilizer can bereduced.
If 1/3 N as basal , 1/3 at mid tillering and 1/3 atpanicle initiation, the recovery of N is of theorder of 35% basal application 45% at tillering 65% at panicle initiation
Therefore 1/3 x 30% + 1/3 x 45% + 1/3 x 65% =48% total recovery.
If there is no basal, 1/3 delayed, 2/3 at PI, thenthe recovery in the order of 40% and 60% ofapplied N respectively.
Therefore 1/3 x 40% + 2/3 x 60% = 53% totalrecovery.
2/16/2016
4
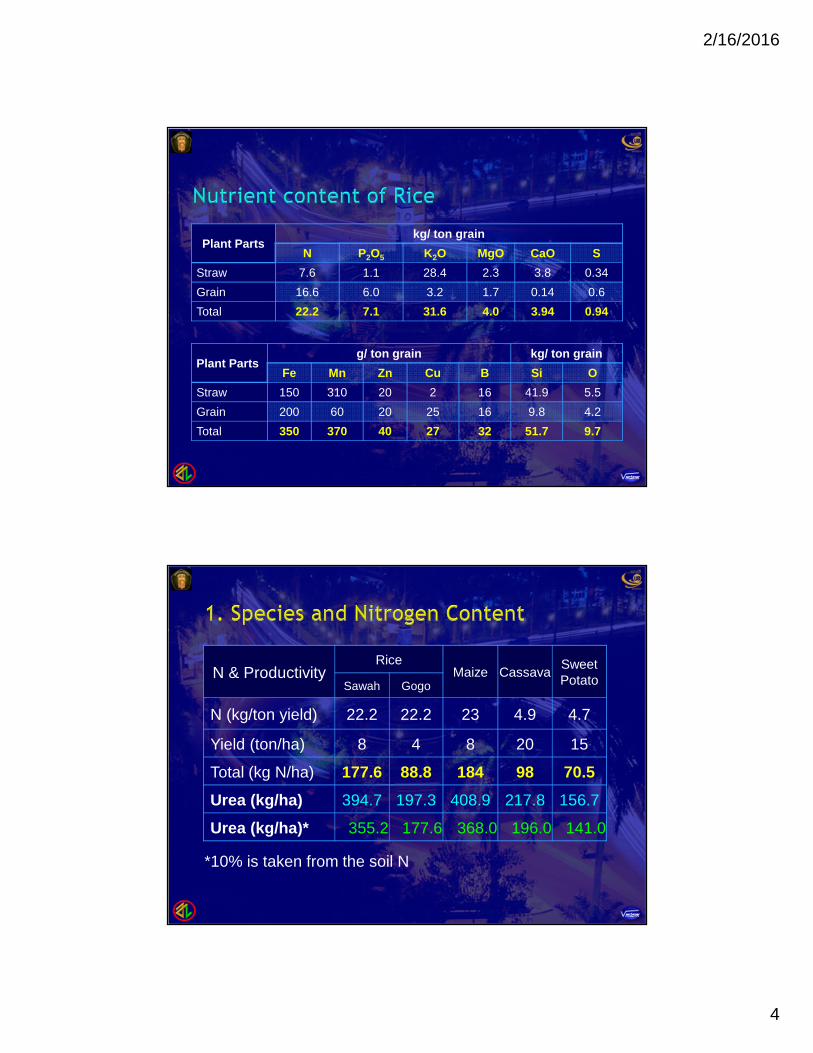
Plant Partskg/ ton grain
N P2O5 K2O MgO CaO SStraw 7.6 1.1 28.4 2.3 3.8 0.34Grain 16.6 6.0 3.2 1.7 0.14 0.6Total 22.2 7.1 31.6 4.0 3.94 0.94
Plant Partsg/ ton grain kg/ ton grain
Fe Mn Zn Cu B Si OStraw 150 310 20 2 16 41.9 5.5Grain 200 60 20 25 16 9.8 4.2Total 350 370 40 27 32 51.7 9.7
N & ProductivityRice
Maize Cassava SweetPotatoSawah Gogo
N (kg/ton yield) 22.2 22.2 23 4.9 4.7
Yield (ton/ha) 8 4 8 20 15
Total (kg N/ha) 177.6 88.8 184 98 70.5
Urea (kg/ha) 394.7 197.3 408.9 217.8 156.7
Urea (kg/ha)* 355.2 177.6 368.0 196.0 141.0
*10% is taken from the soil N
2/16/2016
5
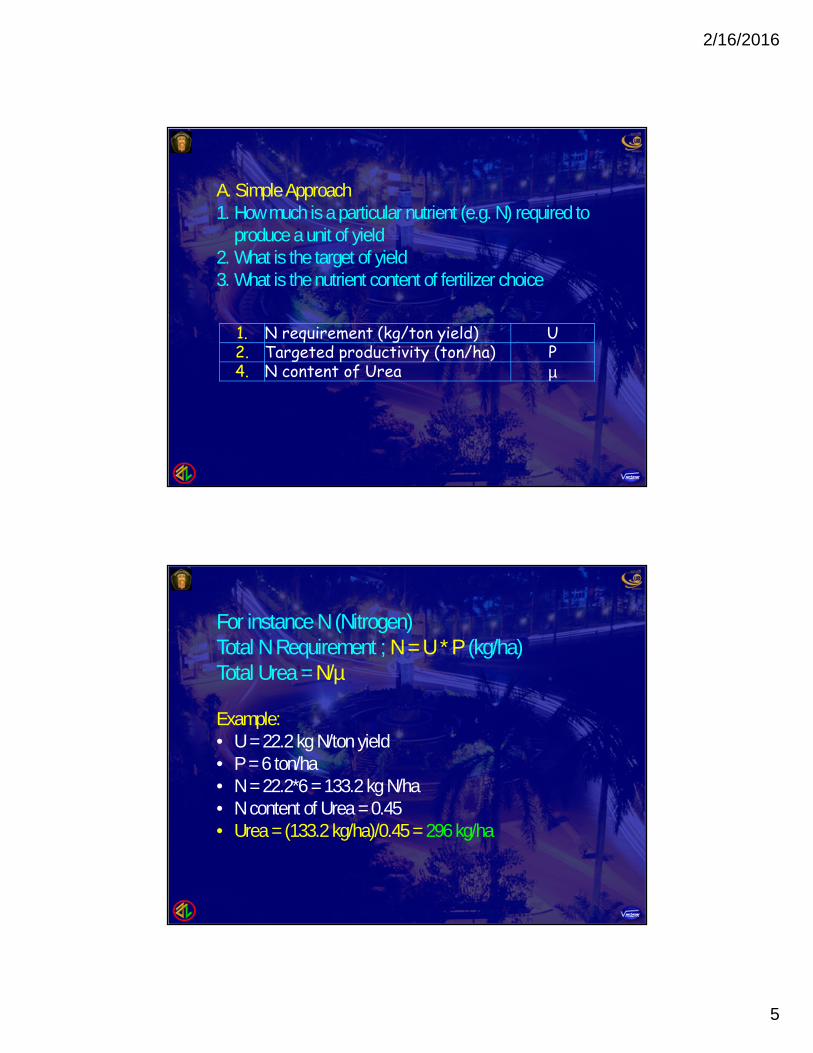
1. N requirement (kg/ton yield) U2. Targeted productivity (ton/ha) P4. N content of Urea µ
A. Simple Approach1. How much is a particular nutrient (e.g. N) required to
produce a unit of yield2. What is the target of yield3. What is the nutrient content of fertilizer choice
For instance N (Nitrogen)Total N Requirement ; N = U * P (kg/ha)Total Urea = N/µ
Example:• U = 22.2 kg N/ton yield• P = 6 ton/ha• N = 22.2*6 = 133.2 kg N/ha• N content of Urea = 0.45• Urea = (133.2 kg/ha)/0.45 = 296 kg/ha
2/16/2016
6
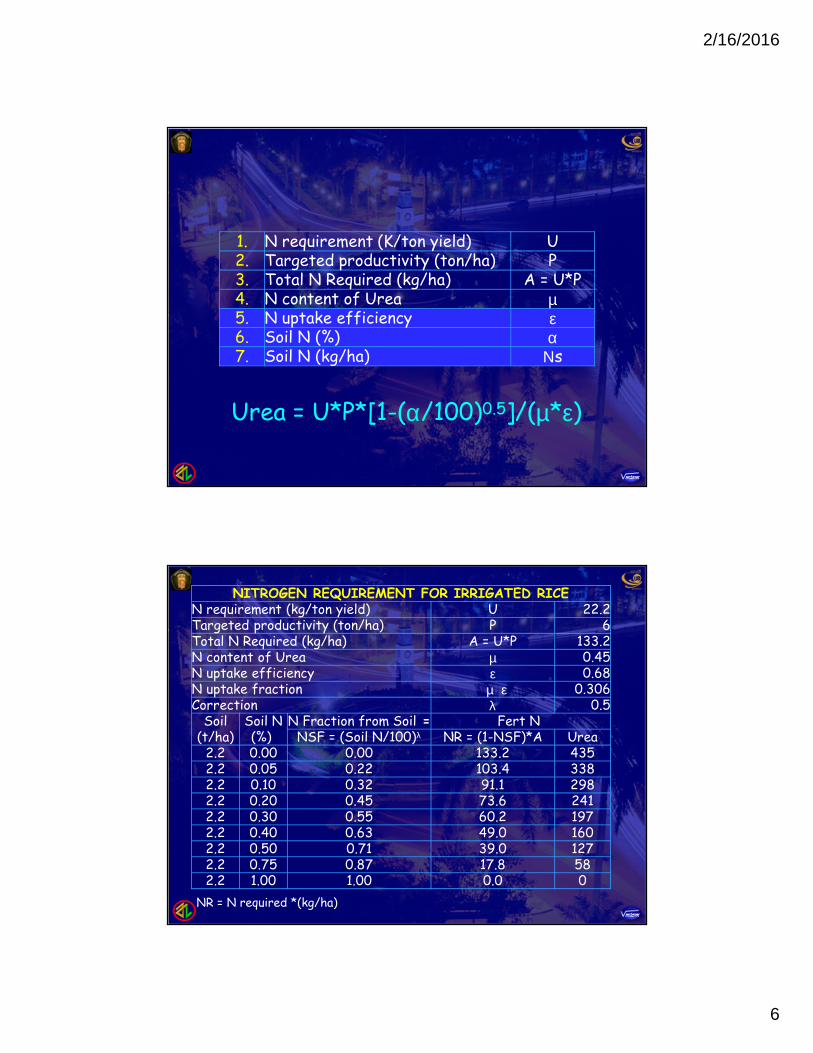
1. N requirement (K/ton yield) U2. Targeted productivity (ton/ha) P3. Total N Required (kg/ha) A = U*P4. N content of Urea µ5. N uptake efficiency ε6. Soil N (%) α7. Soil N (kg/ha) Νs
Urea = U*P*[1-(α/100)0.5]/(µ*ε)
NITROGEN REQUIREMENT FOR IRRIGATED RICEN requirement (kg/ton yield) U 22.2Targeted productivity (ton/ha) P 6Total N Required (kg/ha) A = U*P 133.2N content of Urea µ 0.45N uptake efficiency ε 0.68N uptake fraction µ ε 0.306Correction λ 0.5
Soil(t/ha)
Soil N(%)
N Fraction from Soil = Fert NNSF = (Soil N/100)λ NR = (1-NSF)*A Urea
2.2 0.00 0.00 133.2 4352.2 0.05 0.22 103.4 3382.2 0.10 0.32 91.1 2982.2 0.20 0.45 73.6 2412.2 0.30 0.55 60.2 1972.2 0.40 0.63 49.0 1602.2 0.50 0.71 39.0 1272.2 0.75 0.87 17.8 582.2 1.00 1.00 0.0 0
NR = N required *(kg/ha)
2/16/2016
7
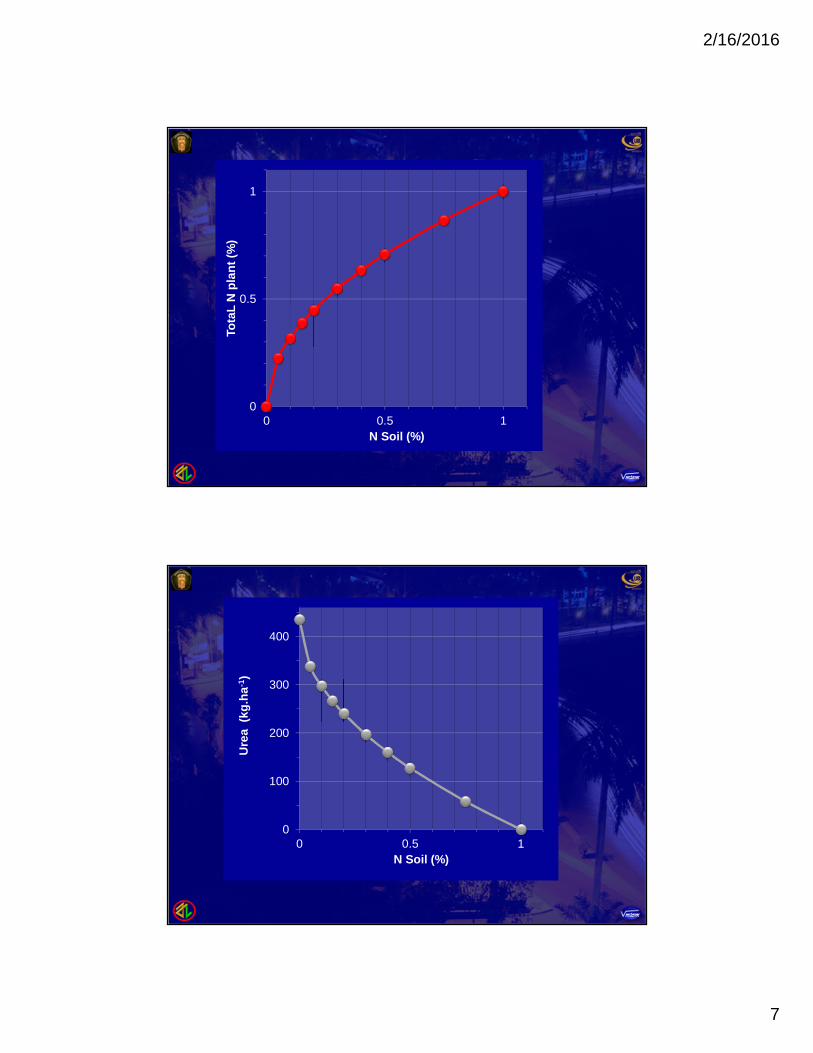
0
0.5
1
0 0.5 1
Tota
L N
pla
nt (%
)
N Soil (%)
0
100
200
300
400
0 0.5 1
Ure
a (k
g.ha
-1)
N Soil (%)
2/16/2016
8
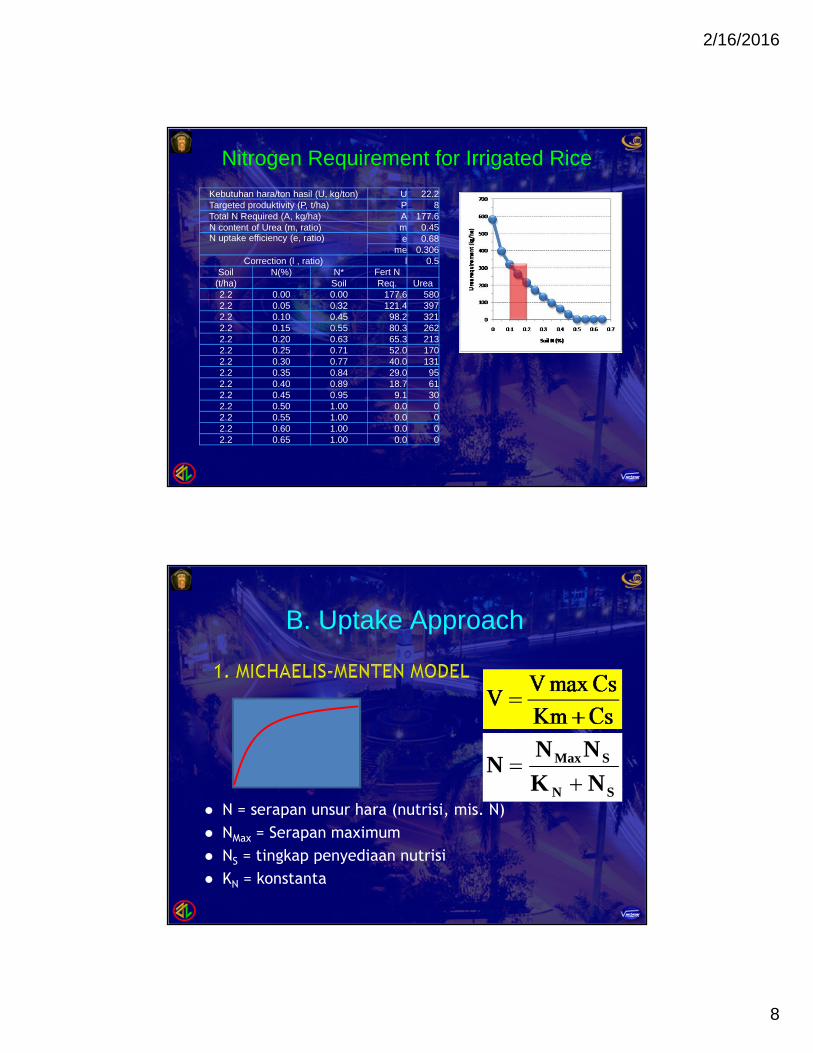
Nitrogen Requirement for Irrigated RiceKebutuhan hara/ton hasil (U, kg/ton) U 22.2Targeted produktivity (P, t/ha) P 8Total N Required (A, kg/ha) A 177.6N content of Urea (m, ratio) m 0.45N uptake efficiency (e, ratio) e 0.68
me 0.306Correction (l , ratio) l 0.5
Soil N(%) N* Fert N(t/ha) Soil Req. Urea2.2 0.00 0.00 177.6 5802.2 0.05 0.32 121.4 3972.2 0.10 0.45 98.2 3212.2 0.15 0.55 80.3 2622.2 0.20 0.63 65.3 2132.2 0.25 0.71 52.0 1702.2 0.30 0.77 40.0 1312.2 0.35 0.84 29.0 952.2 0.40 0.89 18.7 612.2 0.45 0.95 9.1 302.2 0.50 1.00 0.0 02.2 0.55 1.00 0.0 02.2 0.60 1.00 0.0 02.2 0.65 1.00 0.0 0
B. Uptake Approach
N = serapan unsur hara (nutrisi, mis. N) NMax = Serapan maximum NS = tingkap penyediaan nutrisi KN = konstanta
SN
SMax
NK
NNN
2/16/2016
9
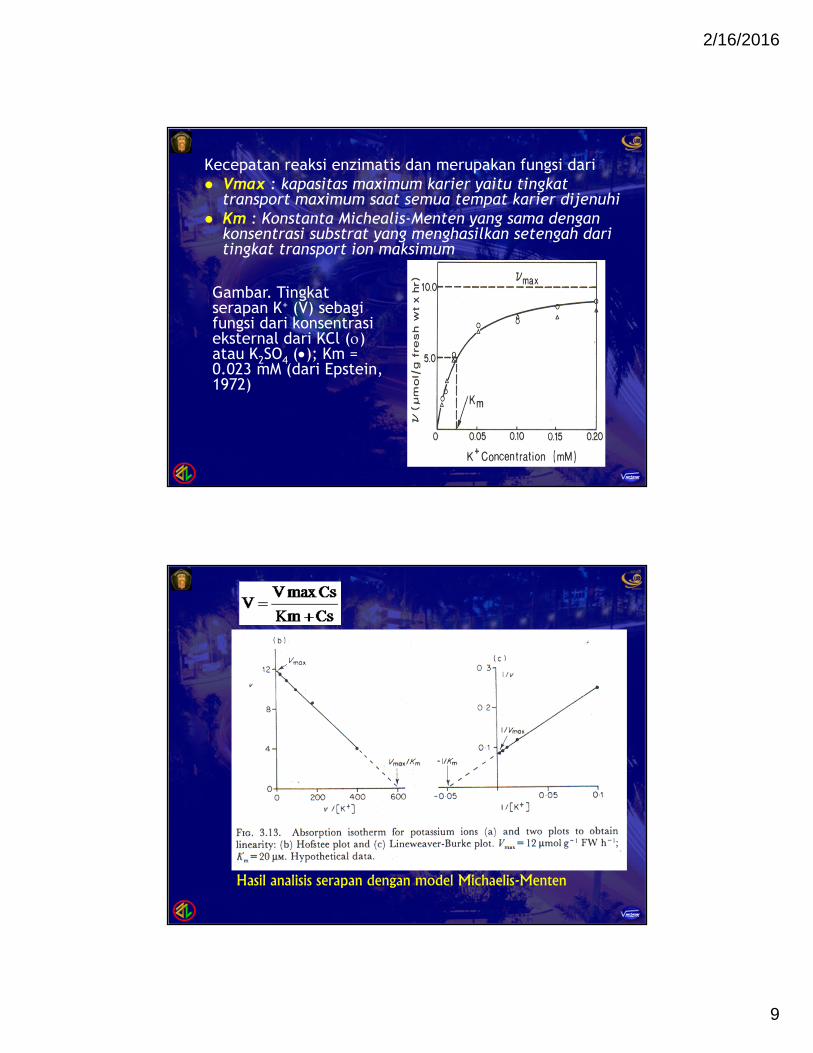
Kecepatan reaksi enzimatis dan merupakan fungsi dari Vmax : kapasitas maximum karier yaitu tingkat
transport maximum saat semua tempat karier dijenuhi Km : Konstanta Michealis-Menten yang sama dengan
konsentrasi substrat yang menghasilkan setengah daritingkat transport ion maksimum
Gambar. Tingkatserapan K+ (V) sebagifungsi dari konsentrasieksternal dari KCl ()atau K2SO4 (); Km =0.023 mM (dari Epstein,1972)
Hasil analisis serapan dengan model Michaelis-Menten
2/16/2016
10
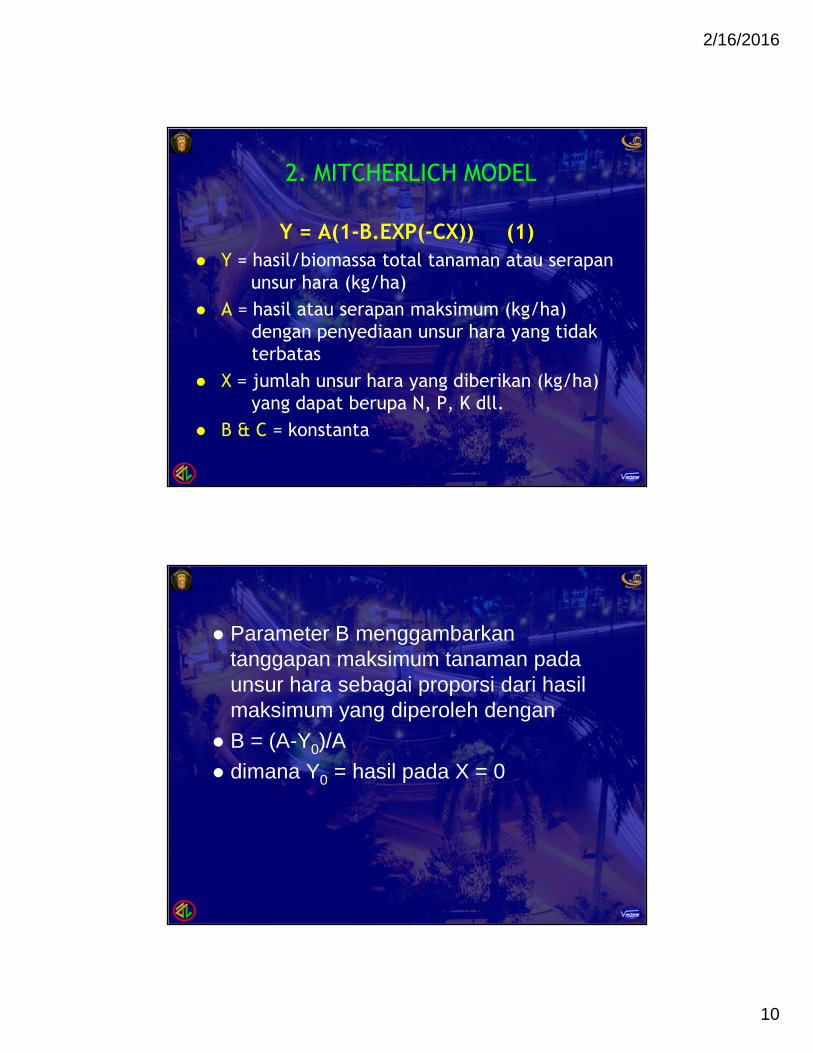
2. MITCHERLICH MODEL
Y = A(1-B.EXP(-CX)) (1) Y = hasil/biomassa total tanaman atau serapan
unsur hara (kg/ha) A = hasil atau serapan maksimum (kg/ha)
dengan penyediaan unsur hara yang tidakterbatas
X = jumlah unsur hara yang diberikan (kg/ha)yang dapat berupa N, P, K dll.
B & C = konstanta
Parameter B menggambarkantanggapan maksimum tanaman padaunsur hara sebagai proporsi dari hasilmaksimum yang diperoleh dengan
B = (A-Y0)/A dimana Y0 = hasil pada X = 0
2/16/2016
11
0
1000
2000
3000
4000
5000
0 30 60 90 120 150
Dosis pupuk nitroge n (kg N/ha )
Hasil
biji (
kg/ha
)
B=1&C=-0.025B=0.5&C=-0.05
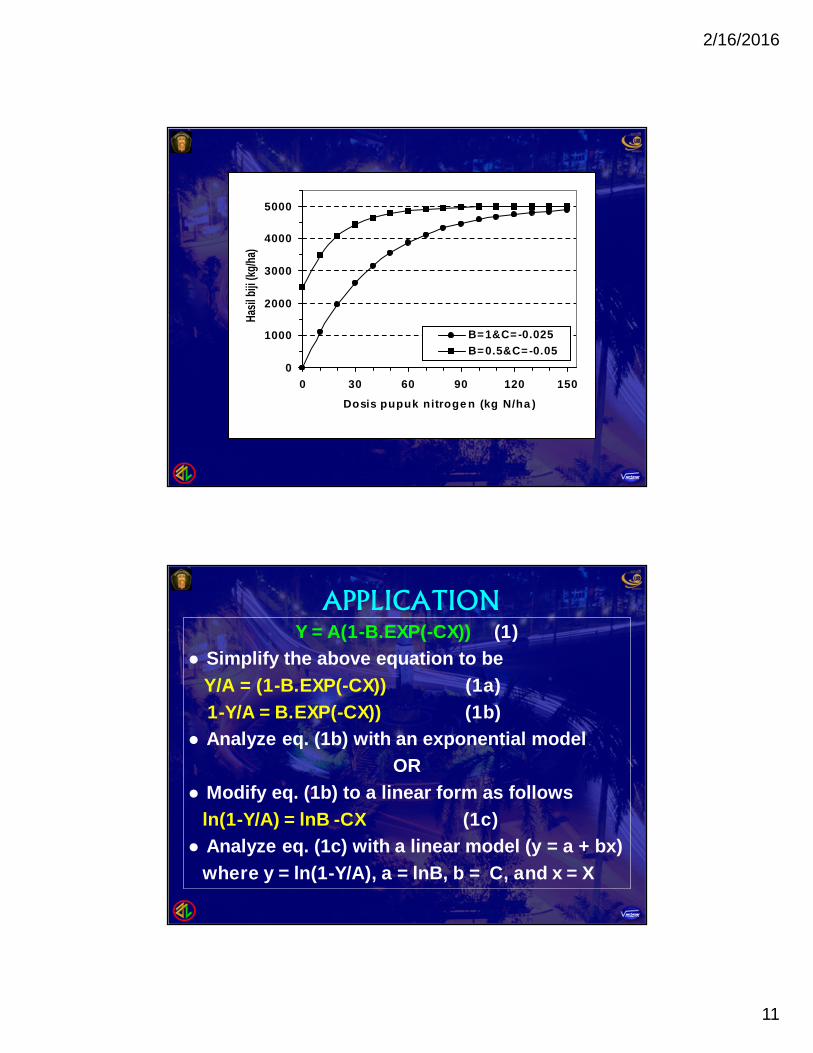
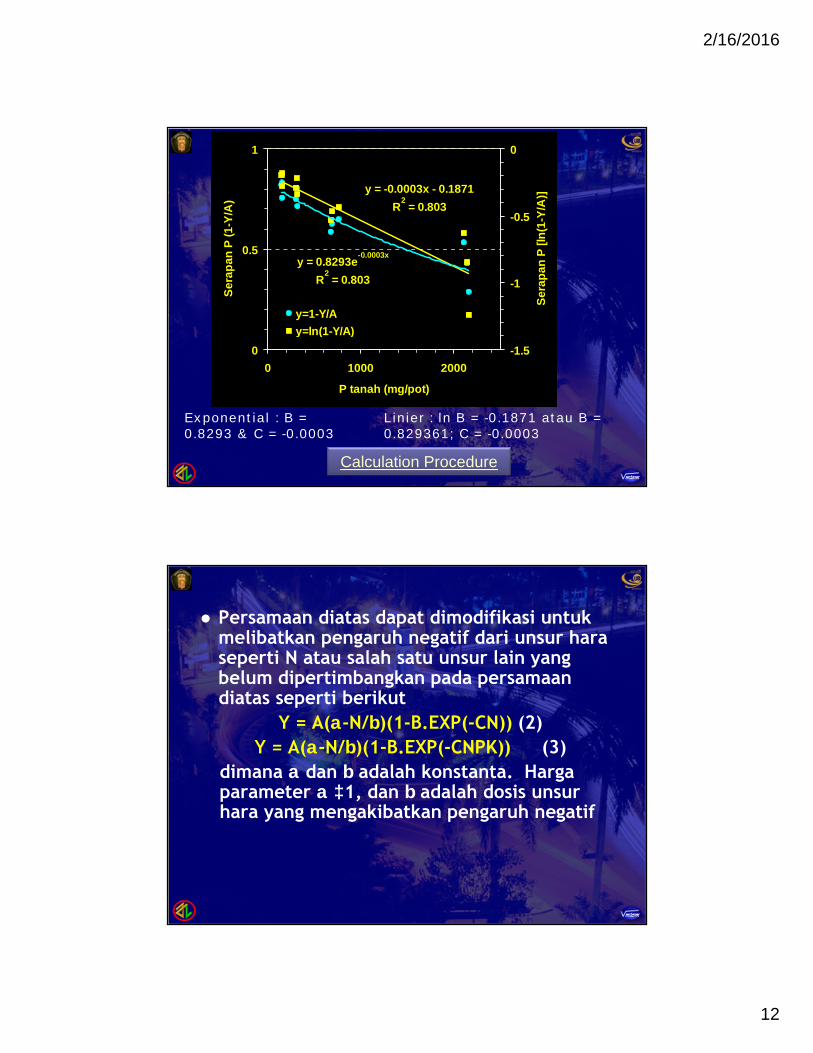
APPLICATIONY = A(1-B.EXP(-CX)) (1)
Simplify the above equation to beY/A = (1-B.EXP(-CX)) (1a)1-Y/A = B.EXP(-CX)) (1b)
Analyze eq. (1b) with an exponential modelOR
Modify eq. (1b) to a linear form as followsln(1-Y/A) = lnB -CX (1c) Analyze eq. (1c) with a linear model (y = a + bx)
where y = ln(1-Y/A), a = lnB, b = C, and x = X
2/16/2016
12
y = -0.0003x - 0.1871R
2 = 0.803
y = 0.8293e-0.0003x
R2 = 0.803
0
0.5
1
0 1000 2000
P tanah (mg/pot)
Sera
pan
P (1
-Y/A
)
-1.5
-1
-0.5
0
Sera
pan
P [ln
(1-Y
/A)]
y=1-Y/Ay=ln(1-Y/A)
Exponential : B =0.8293 & C = -0.0003
Linier : ln B = -0.1871 atau B =0.829361; C = -0.0003
Calculation Procedure
Persamaan diatas dapat dimodifikasi untukmelibatkan pengaruh negatif dari unsur haraseperti N atau salah satu unsur lain yangbelum dipertimbangkan pada persamaandiatas seperti berikut
Y = A(-N/)(1-B.EXP(-CN)) (2)Y = A(-N/)(1-B.EXP(-CNPK)) (3)
dimana dan adalah konstanta. Hargaparameter 1, dan adalah dosis unsurhara yang mengakibatkan pengaruh negatif
2/16/2016
13
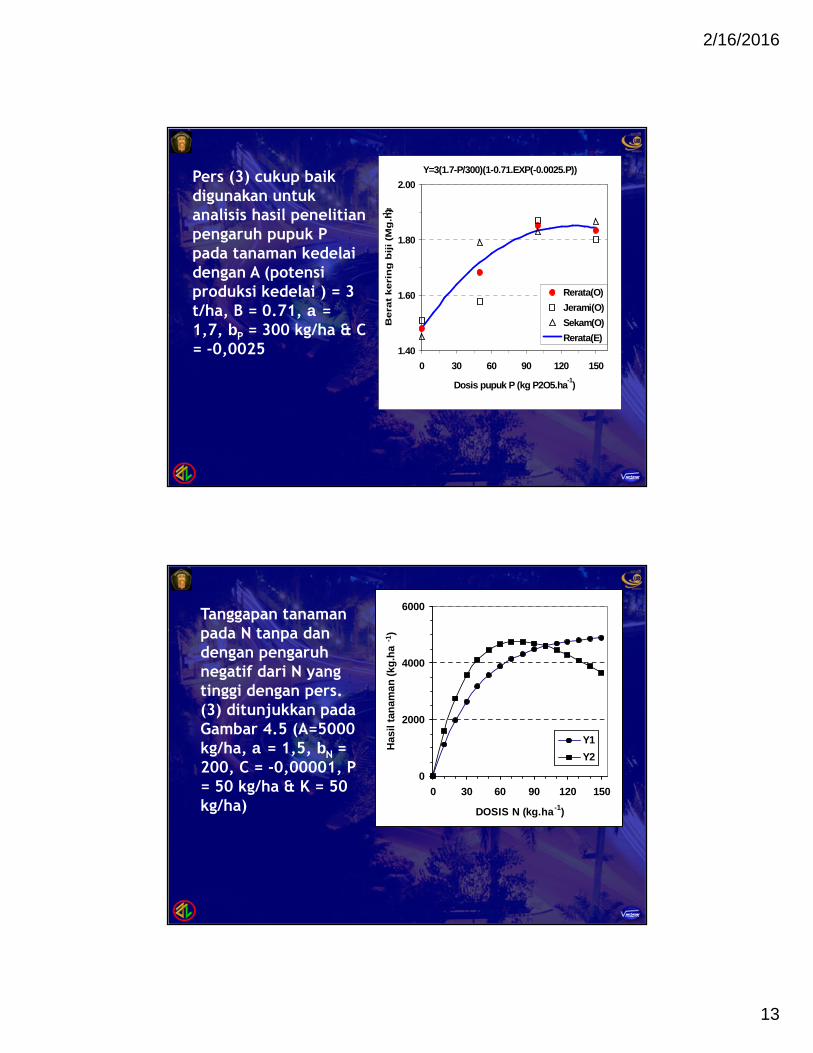
Y=3(1.7-P/300)(1-0.71.EXP(-0.0025.P))
1.40
1.60
1.80
2.00
0 30 60 90 120 150
Dosis pupuk P (kg P2O5.ha-1)B
erat
ker
ing
biji
(M
g.h
a-1)
Rerata(O)Jerami(O)Sekam(O)Rerata(E)
Pers (3) cukup baikdigunakan untukanalisis hasil penelitianpengaruh pupuk Ppada tanaman kedelaidengan A (potensiproduksi kedelai ) = 3t/ha, B = 0.71, =1,7, P = 300 kg/ha & C= -0,0025
0
2000
4000
6000
0 30 60 90 120 150
DOSIS N (kg.ha -1)
Has
il ta
nam
an (k
g.ha
-1)
Y1Y2
Tanggapan tanamanpada N tanpa dandengan pengaruhnegatif dari N yangtinggi dengan pers.(3) ditunjukkan padaGambar 4.5 (A=5000kg/ha, = 1,5, N =200, C = -0,00001, P= 50 kg/ha & K = 50kg/ha)
2/16/2016
14
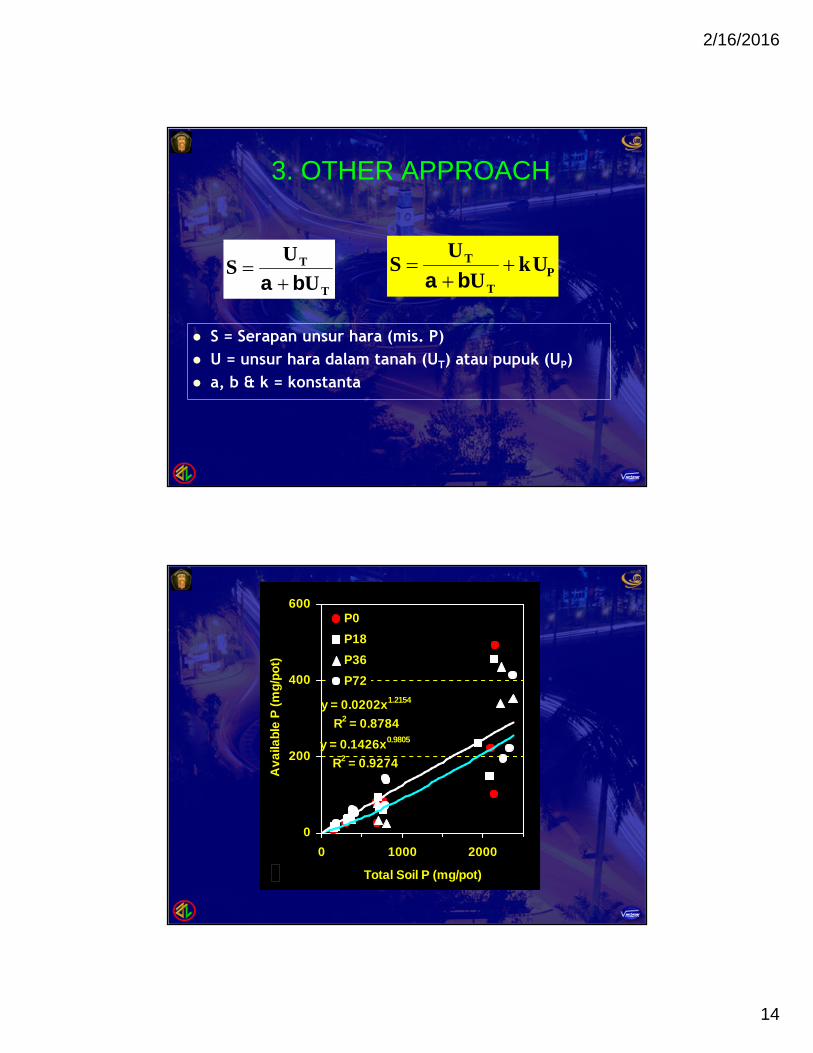
3. OTHER APPROACH
S = Serapan unsur hara (mis. P) U = unsur hara dalam tanah (UT) atau pupuk (UP) a, b & k = konstanta
T
T
UU
S
PT
T kUU
US
y = 0.0202x1.2154
R2 = 0.8784y = 0.1426x0.9805
R2 = 0.9274
0
200
400
600
0 1000 2000
Total Soil P (mg/pot)
Ava
ilabl
e P
(mg/
pot)
P0P18P36P72
A
2/16/2016
15
0
100
200
0 1000 2000
Soil Total P (mg/pot)
Tota
l Pla
nt P
(mg/
pot)
P0P18P36P72
+P
-P
B
0
100
200
0 300 600
Available Soil P (mg/pot)
Tota
l Pla
nt P
(mg/
pot)
P0P18P36P72
+P
-P
C
2/16/2016
16
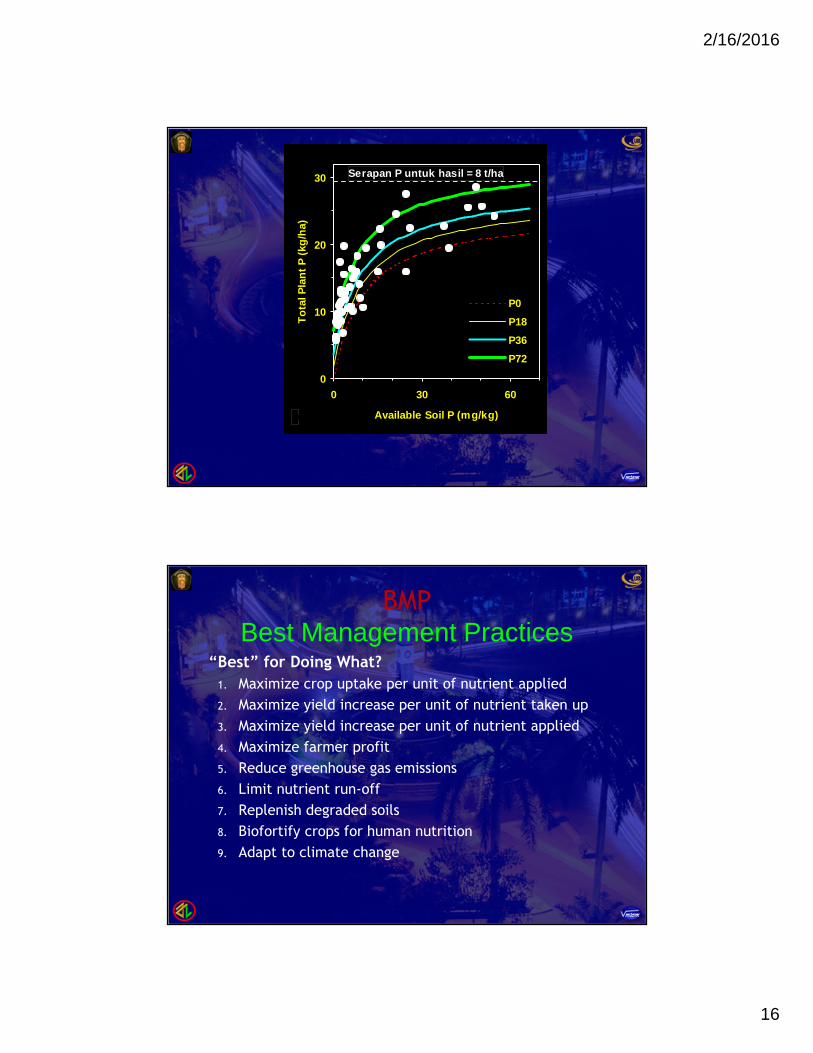
0
10
20
30
0 30 60
Available Soil P (mg/kg)
Tota
l Pla
nt P
(kg/
ha)
P0P18P36P72
D
Serapan P untuk hasil = 8 t/ha
BMPBest Management Practices
“Best” for Doing What?1. Maximize crop uptake per unit of nutrient applied2. Maximize yield increase per unit of nutrient taken up3. Maximize yield increase per unit of nutrient applied4. Maximize farmer profit5. Reduce greenhouse gas emissions6. Limit nutrient run-off7. Replenish degraded soils8. Biofortify crops for human nutrition9. Adapt to climate change
2/16/2016
17
BMPA Simple Principle
1. Right product(s) – Match fertilizer (andother sources of nutrients) to crop needs
2. Right time – Make nutrients available whencrops need them
3. Right place – Keep nutrients where cropscan use them
4. Right rate – Match amount of fertilizer tocrop needs
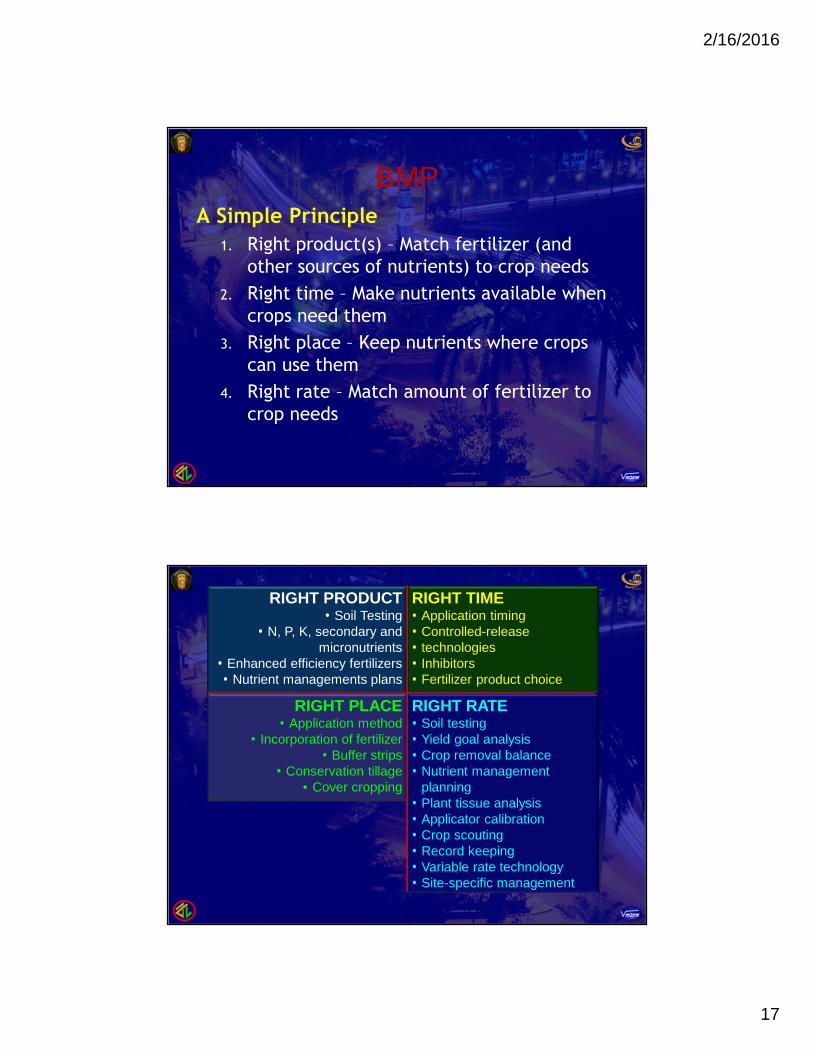
RIGHT PRODUCT• Soil Testing
• N, P, K, secondary andmicronutrients
• Enhanced efficiency fertilizers• Nutrient managements plans
RIGHT TIME• Application timing• Controlled-release• technologies• Inhibitors• Fertilizer product choice
RIGHT PLACE• Application method
• Incorporation of fertilizer• Buffer strips
• Conservation tillage• Cover cropping
RIGHT RATE• Soil testing• Yield goal analysis• Crop removal balance• Nutrient management
planning• Plant tissue analysis• Applicator calibration• Crop scouting• Record keeping• Variable rate technology• Site-specific management
2/16/2016
18
The development of information andcommunication technology has led to thegrowing awareness of soil nutrient variability, the possibility of higher yields, improved quality, and stricter environmental regulationsrequiring reduced nutrient leaching, runoff, and loss.
Technologies used in agriculture include Geographic Information Systems (GIS), the Global Positioning System (GPS), Remote Sensing (RS),in-field sensors, yield monitoring and mapping, hand-held computers, and variable-rate technology (VRT).
2/16/2016
19
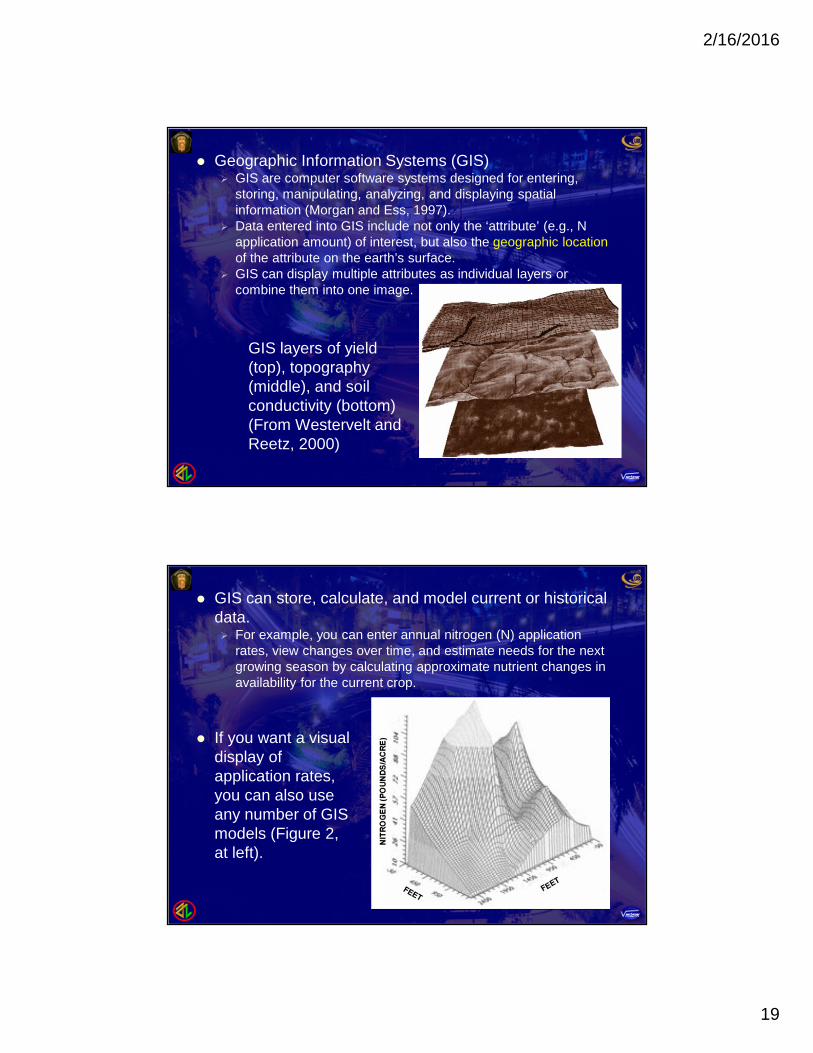
Geographic Information Systems (GIS) GIS are computer software systems designed for entering,
storing, manipulating, analyzing, and displaying spatialinformation (Morgan and Ess, 1997).
Data entered into GIS include not only the ‘attribute’ (e.g., Napplication amount) of interest, but also the geographic locationof the attribute on the earth’s surface.
GIS can display multiple attributes as individual layers orcombine them into one image.
GIS layers of yield(top), topography(middle), and soilconductivity (bottom)(From Westervelt andReetz, 2000)
GIS can store, calculate, and model current or historicaldata. For example, you can enter annual nitrogen (N) application
rates, view changes over time, and estimate needs for the nextgrowing season by calculating approximate nutrient changes inavailability for the current crop.
If you want a visualdisplay ofapplication rates,you can also useany number of GISmodels (Figure 2,at left).
2/16/2016
20
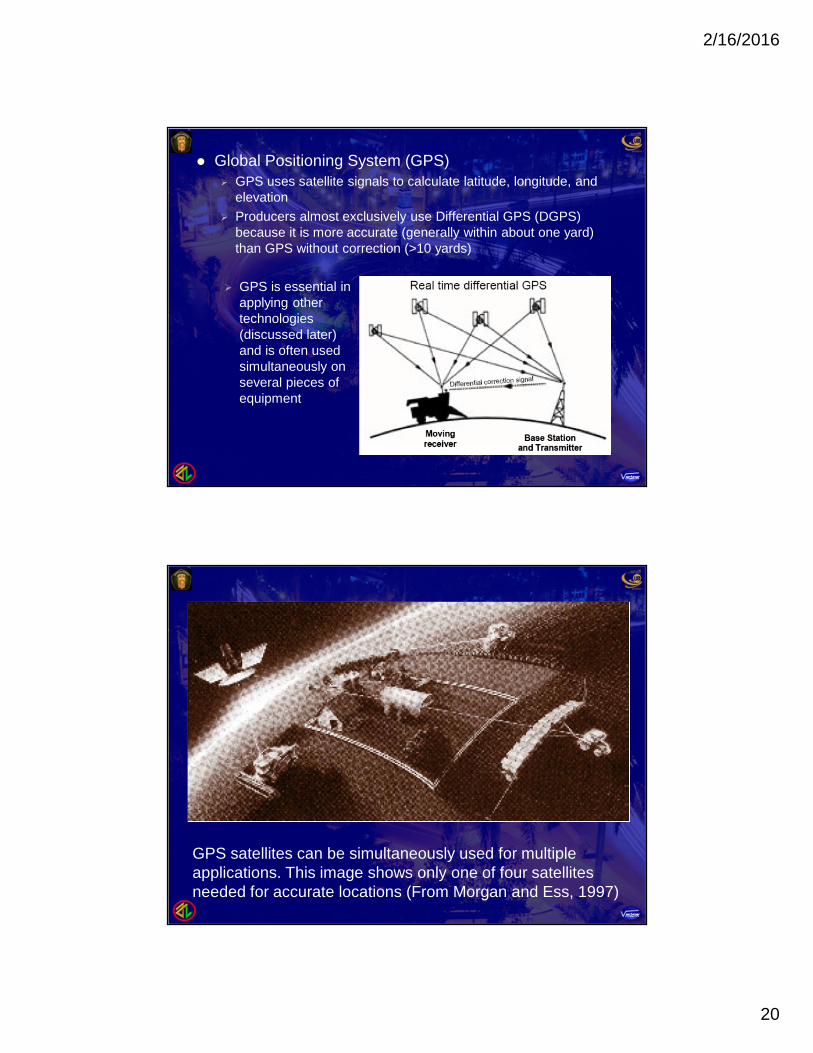
Global Positioning System (GPS) GPS uses satellite signals to calculate latitude, longitude, and
elevation Producers almost exclusively use Differential GPS (DGPS)
because it is more accurate (generally within about one yard)than GPS without correction (>10 yards)
GPS is essential inapplying othertechnologies(discussed later)and is often usedsimultaneously onseveral pieces ofequipment
GPS satellites can be simultaneously used for multipleapplications. This image shows only one of four satellitesneeded for accurate locations (From Morgan and Ess, 1997)
2/16/2016
21
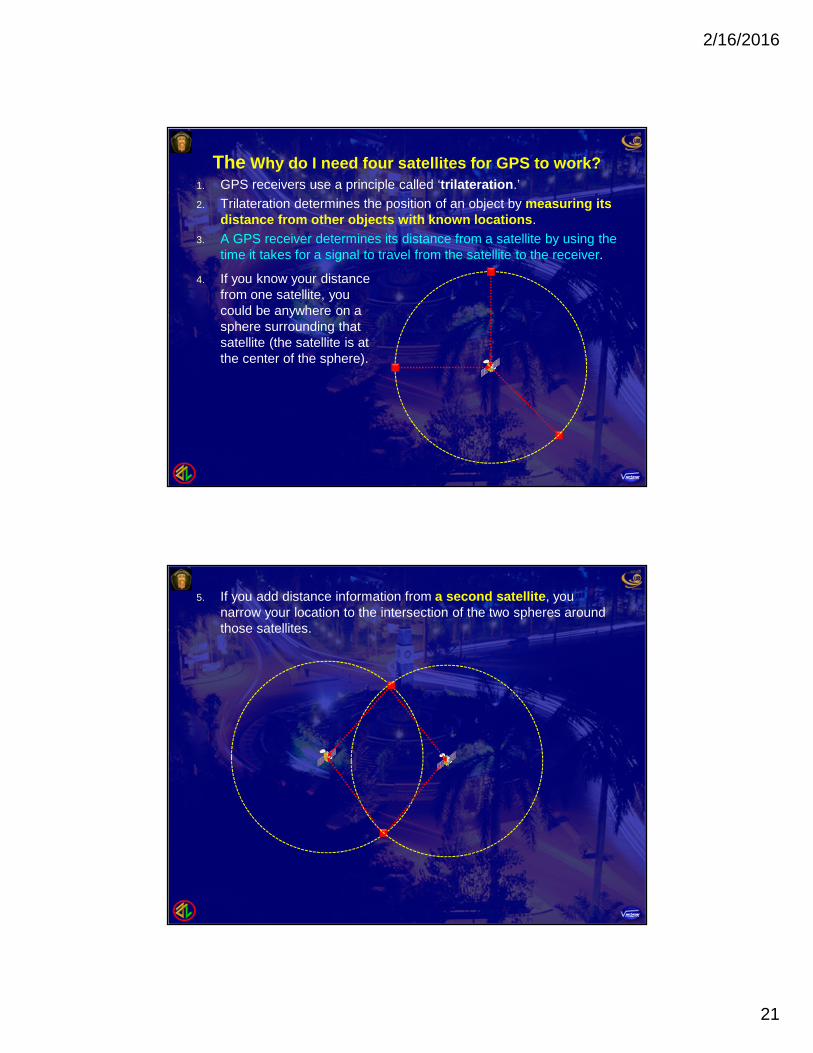
The Why do I need four satellites for GPS to work?1. GPS receivers use a principle called ‘trilateration.’2. Trilateration determines the position of an object by measuring its
distance from other objects with known locations.3. A GPS receiver determines its distance from a satellite by using the
time it takes for a signal to travel from the satellite to the receiver.
4. If you know your distancefrom one satellite, youcould be anywhere on asphere surrounding thatsatellite (the satellite is atthe center of the sphere).
5. If you add distance information from a second satellite, younarrow your location to the intersection of the two spheres aroundthose satellites.
2/16/2016
22
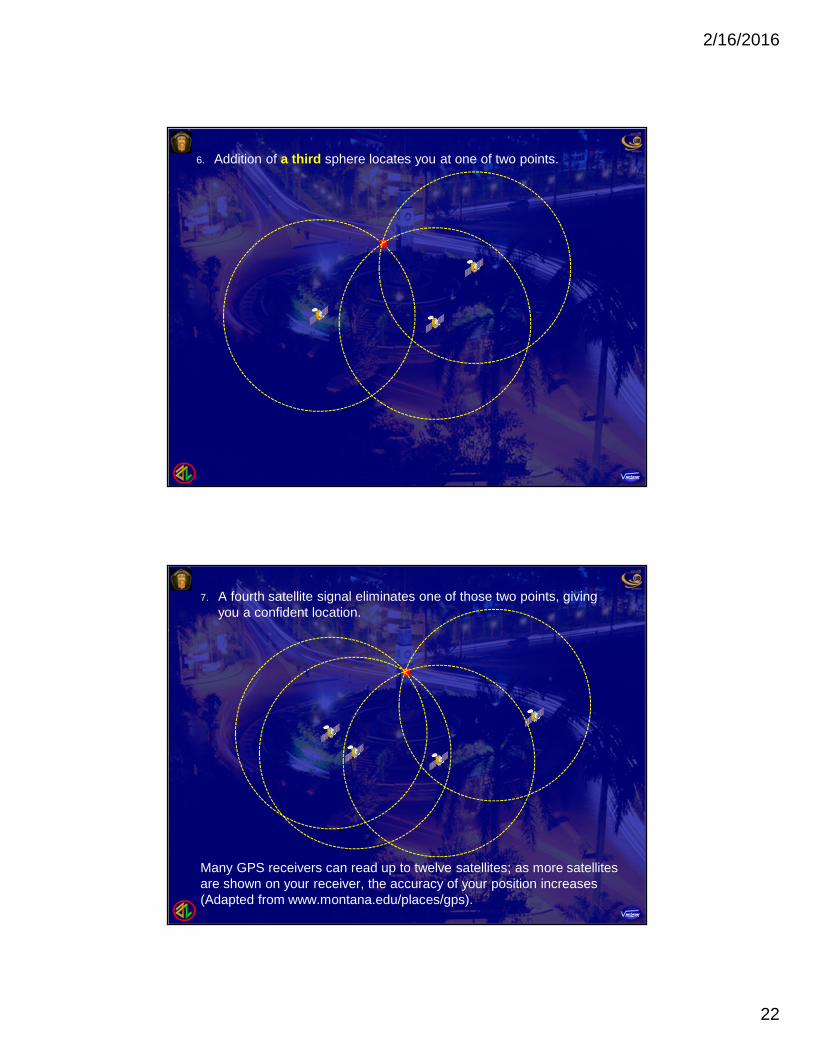
6. Addition of a third sphere locates you at one of two points.
7. A fourth satellite signal eliminates one of those two points, givingyou a confident location.
Many GPS receivers can read up to twelve satellites; as more satellitesare shown on your receiver, the accuracy of your position increases(Adapted from www.montana.edu/places/gps).
2/16/2016
23
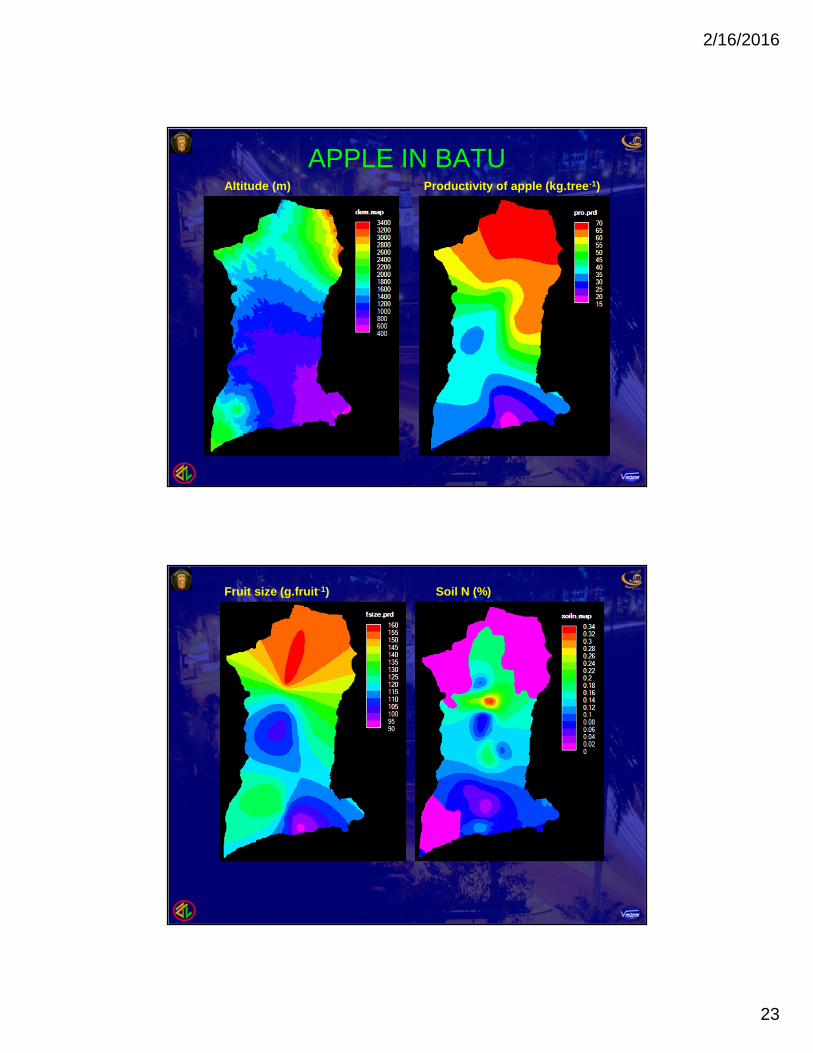
APPLE IN BATUAltitude (m) Productivity of apple (kg.tree-1)
Fruit size (g.fruit-1) Soil N (%)

![KERAGAMAN FENOTIPE DAN HERITABILITAS KEDELAI …digilib.unila.ac.id/22109/20/SKRIPSI TANPA PEMBAHASAN.pdf · keragaman fenotipe dan heritabilitas kedelai (glycine max [l.] merril)](https://img.pdfslide.us/doc/110x75/5c798f4c09d3f2990f8c5c24/keragaman-fenotipe-dan-heritabilitas-kedelai-tanpa-pembahasanpdf-keragaman.jpg)