Embed Size (px)
Citation preview
Lecture 3: Measures of effect Risk Difference, Attributable Fraction, Risk Ratio and Odds Ratio with examples in Stata
Lecture 3: Measures of effectRisk Difference, Attributable Fraction, Risk
Ratio and Odds Ratiowith examples in Stata
Dankmar Bohning
Southampton Statistical Sciences Research InstituteUniversity of Southampton, UK
Advanced Statistical Methods in EpidemiologyFebruary 4-6, 2013
1 / 31
Lecture 3: Measures of effect Risk Difference, Attributable Fraction, Risk Ratio and Odds Ratio with examples in Stata
Measures of differences in disease occurrence
Risk difference
Attributable Fraction
Calculating in STATA
Risk Ratio
Odds Ratio
Calculating in STATA
2 / 31
Lecture 3: Measures of effect Risk Difference, Attributable Fraction, Risk Ratio and Odds Ratio with examples in Stata
Measures of differences in disease occurrence
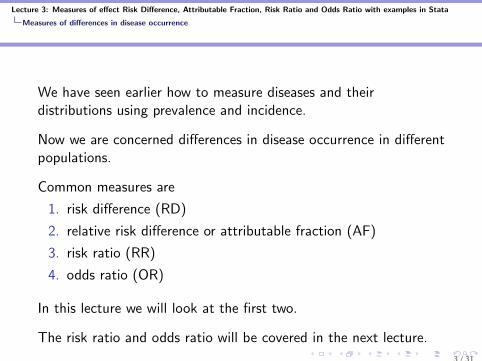
We have seen earlier how to measure diseases and theirdistributions using prevalence and incidence.
Now we are concerned differences in disease occurrence in differentpopulations.
Common measures are
1. risk difference (RD)
2. relative risk difference or attributable fraction (AF)
3. risk ratio (RR)
4. odds ratio (OR)
In this lecture we will look at the first two.
The risk ratio and odds ratio will be covered in the next lecture.
3 / 31
Lecture 3: Measures of effect Risk Difference, Attributable Fraction, Risk Ratio and Odds Ratio with examples in Stata
Risk difference
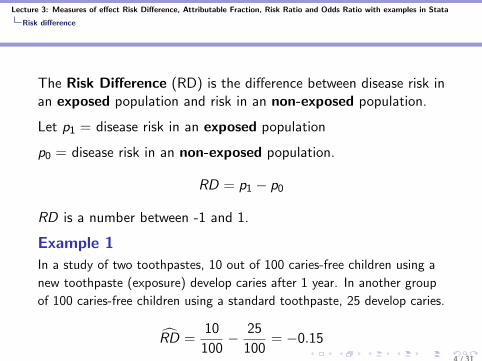
The Risk Difference (RD) is the difference between disease risk inan exposed population and risk in an non-exposed population.
Let p1 = disease risk in an exposed population
p0 = disease risk in an non-exposed population.
RD = p1 − p0
RD is a number between -1 and 1.
Example 1
In a study of two toothpastes, 10 out of 100 caries-free children using a
new toothpaste (exposure) develop caries after 1 year. In another group
of 100 caries-free children using a standard toothpaste, 25 develop caries.
RD =10
100− 25
100= −0.15
4 / 31
Lecture 3: Measures of effect Risk Difference, Attributable Fraction, Risk Ratio and Odds Ratio with examples in Stata
Risk difference
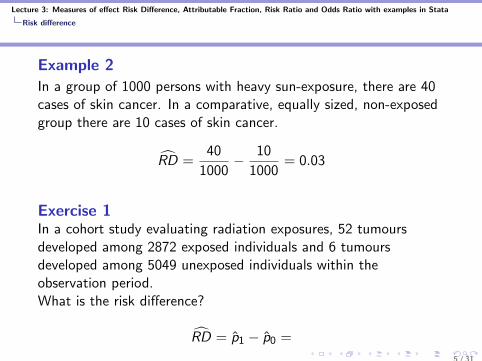
Example 2
In a group of 1000 persons with heavy sun-exposure, there are 40cases of skin cancer. In a comparative, equally sized, non-exposedgroup there are 10 cases of skin cancer.
RD =40
1000− 10
1000= 0.03
Exercise 1In a cohort study evaluating radiation exposures, 52 tumoursdeveloped among 2872 exposed individuals and 6 tumoursdeveloped among 5049 unexposed individuals within theobservation period.What is the risk difference?
RD = p1 − p0 =
5 / 31

Lecture 3: Measures of effect Risk Difference, Attributable Fraction, Risk Ratio and Odds Ratio with examples in Stata
Risk difference
Distribution of number of diseased
Suppose that in a cohort study,
Y1 out of n1 exposed individuals and
Y0 out of n0 non-exposed individuals
developed the disease.
Assume that the probability p1 of developing the disease is thesame for everyone in the exposed group
Similarly, assume that the probability p0 of developing the diseaseis the same for everyone in the non-exposed group
Then Y1 ∼ B(n1, p1) distribution
And Y0 ∼ B(n0, p0) distribution6 / 31
Lecture 3: Measures of effect Risk Difference, Attributable Fraction, Risk Ratio and Odds Ratio with examples in Stata
Risk difference
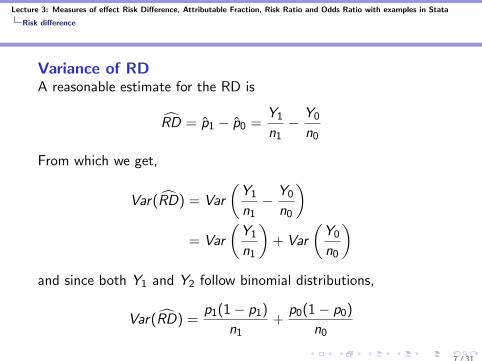
Variance of RDA reasonable estimate for the RD is
RD = p1 − p0 =Y1
n1− Y0
n0
From which we get,
Var(RD) = Var
(Y1
n1− Y0
n0
)= Var
(Y1
n1
)+ Var
(Y0
n0
)and since both Y1 and Y2 follow binomial distributions,
Var(RD) =p1(1− p1)
n1+
p0(1− p0)
n0
7 / 31
Lecture 3: Measures of effect Risk Difference, Attributable Fraction, Risk Ratio and Odds Ratio with examples in Stata
Risk difference
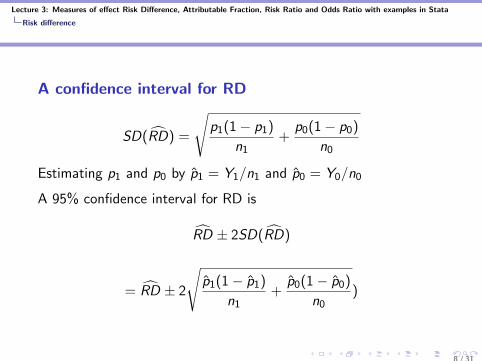
A confidence interval for RD
SD(RD) =
√p1(1− p1)
n1+
p0(1− p0)
n0
Estimating p1 and p0 by p1 = Y1/n1 and p0 = Y0/n0
A 95% confidence interval for RD is
RD ± 2SD(RD)
= RD ± 2
√p1(1− p1)
n1+
p0(1− p0)
n0)
8 / 31
Lecture 3: Measures of effect Risk Difference, Attributable Fraction, Risk Ratio and Odds Ratio with examples in Stata
Risk difference
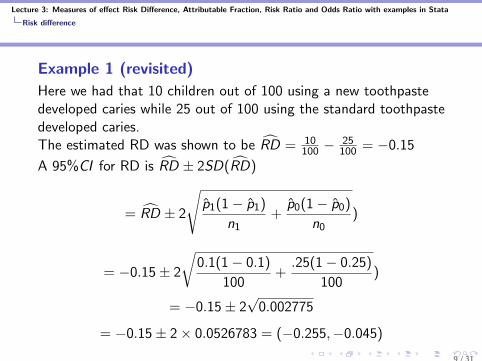
Example 1 (revisited)
Here we had that 10 children out of 100 using a new toothpastedeveloped caries while 25 out of 100 using the standard toothpastedeveloped caries.The estimated RD was shown to be RD = 10
100 −25100 = −0.15
A 95%CI for RD is RD ± 2SD(RD)
= RD ± 2
√p1(1− p1)
n1+
p0(1− p0)
n0)
= −0.15± 2
√0.1(1− 0.1)
100+
.25(1− 0.25)
100)
= −0.15± 2√
0.002775
= −0.15± 2× 0.0526783 = (−0.255,−0.045)
9 / 31
Lecture 3: Measures of effect Risk Difference, Attributable Fraction, Risk Ratio and Odds Ratio with examples in Stata
Risk difference
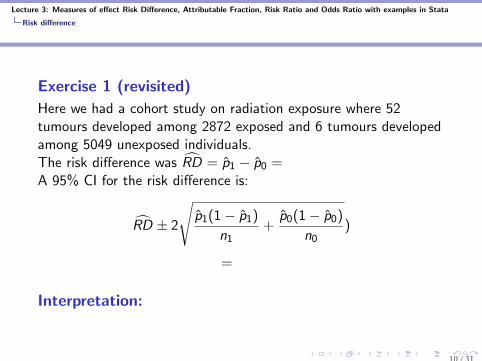
Exercise 1 (revisited)
Here we had a cohort study on radiation exposure where 52tumours developed among 2872 exposed and 6 tumours developedamong 5049 unexposed individuals.The risk difference was RD = p1 − p0 =A 95% CI for the risk difference is:
RD ± 2
√p1(1− p1)
n1+
p0(1− p0)
n0)
=
Interpretation:
10 / 31
Lecture 3: Measures of effect Risk Difference, Attributable Fraction, Risk Ratio and Odds Ratio with examples in Stata
Attributable Fraction
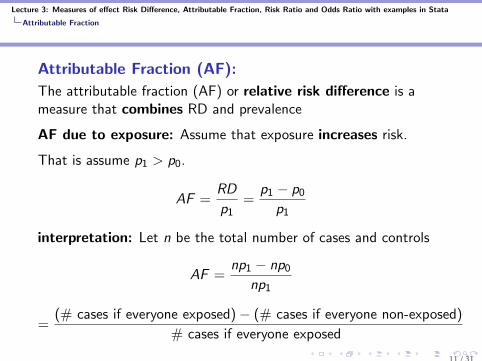
Attributable Fraction (AF):
The attributable fraction (AF) or relative risk difference is ameasure that combines RD and prevalence
AF due to exposure: Assume that exposure increases risk.
That is assume p1 > p0.
AF =RD
p1=
p1 − p0
p1
interpretation: Let n be the total number of cases and controls
AF =np1 − np0
np1
=(# cases if everyone exposed)− (# cases if everyone non-exposed)
# cases if everyone exposed
11 / 31

Lecture 3: Measures of effect Risk Difference, Attributable Fraction, Risk Ratio and Odds Ratio with examples in Stata
Attributable Fraction
AF = proportion of cases due to exposure
= proportion of avoidable cases due to exposure
AF is a relative measure:Effects with similar risks will have similar attributable fractions.
Scenario A): p1 = 1/10, p0 = 1/100RD = 0.1− 0.01 = 0.09 ∼ 0.1
AF = 0.09/0.1 = 0.90
Scenario B): p1 = 1/100, p0 = 1/1000
RD = 0.01− 0.001 = 0.009 ∼ 0.01
AF = 0.009/0.01 = 0.90
12 / 31
Lecture 3: Measures of effect Risk Difference, Attributable Fraction, Risk Ratio and Odds Ratio with examples in Stata
Attributable Fraction
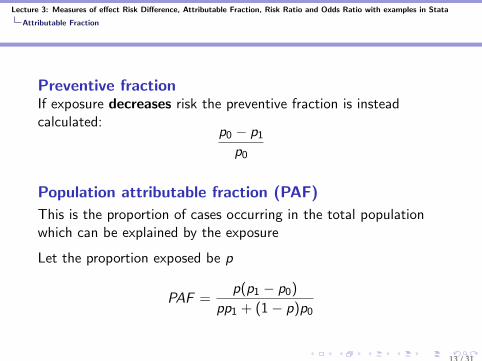
Preventive fractionIf exposure decreases risk the preventive fraction is insteadcalculated:
p0 − p1
p0
Population attributable fraction (PAF)
This is the proportion of cases occurring in the total populationwhich can be explained by the exposure
Let the proportion exposed be p
PAF =p(p1 − p0)
pp1 + (1− p)p0
13 / 31
Lecture 3: Measures of effect Risk Difference, Attributable Fraction, Risk Ratio and Odds Ratio with examples in Stata
Calculating in STATA
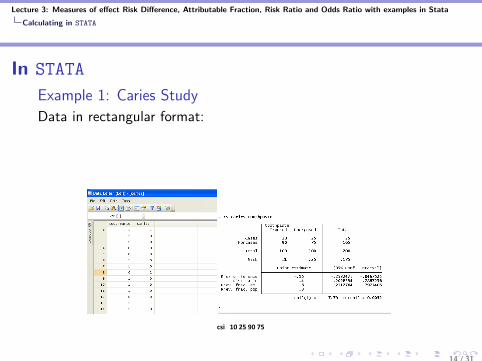
In STATA
Example 1: Caries Study
Data in rectangular format:
csi 10 25 90 75
14 / 31
Lecture 3: Measures of effect Risk Difference, Attributable Fraction, Risk Ratio and Odds Ratio with examples in Stata
Risk Ratio
Risk ratio (RR):
The risk ratio or relative risk is the ratio of disease risk in anexposed to disease risk in an non-exposed population.
RR =p1
p0
where p1 is disease risk in exposed and p0 is disease risk innon-exposed population.
I RR is a number between 0 and ∞.
Interpretation:
For example, RR=2 means that disease occurrence is 2 times morelikely in exposure group than in non-exposure group.
RR=1 means no effect of exposure.
15 / 31
Lecture 3: Measures of effect Risk Difference, Attributable Fraction, Risk Ratio and Odds Ratio with examples in Stata
Risk Ratio
Example 1
In a study of two toothpastes, 10 out of 100 caries-free childrenusing a new toothpaste (exposure) develop caries after 1 year. Inanother group of 100 caries-free children using a standardtoothpaste, 25 develop caries.
RR =10
100/
25
100= 0.40
Example 2
In a group of 1000 persons with heavy sun-exposure, there are 40cases of skin cancer. In a comparative, equally sized, non-exposedgroup there are 10 cases of skin cancer.
RR =40
1000/
10
1000= 40
16 / 31
Lecture 3: Measures of effect Risk Difference, Attributable Fraction, Risk Ratio and Odds Ratio with examples in Stata
Risk Ratio
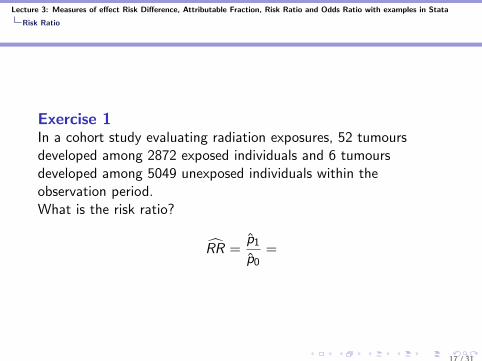
Exercise 1In a cohort study evaluating radiation exposures, 52 tumoursdeveloped among 2872 exposed individuals and 6 tumoursdeveloped among 5049 unexposed individuals within theobservation period.What is the risk ratio?
RR =p1
p0=
17 / 31
Lecture 3: Measures of effect Risk Difference, Attributable Fraction, Risk Ratio and Odds Ratio with examples in Stata
Risk Ratio
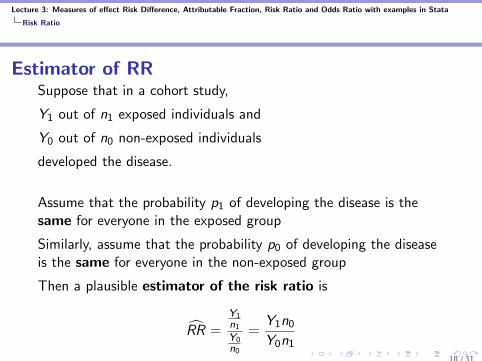
Estimator of RRSuppose that in a cohort study,
Y1 out of n1 exposed individuals and
Y0 out of n0 non-exposed individuals
developed the disease.
Assume that the probability p1 of developing the disease is thesame for everyone in the exposed group
Similarly, assume that the probability p0 of developing the diseaseis the same for everyone in the non-exposed group
Then a plausible estimator of the risk ratio is
RR =Y1n1
Y0n0
=Y1n0
Y0n1
18 / 31
Lecture 3: Measures of effect Risk Difference, Attributable Fraction, Risk Ratio and Odds Ratio with examples in Stata
Risk Ratio
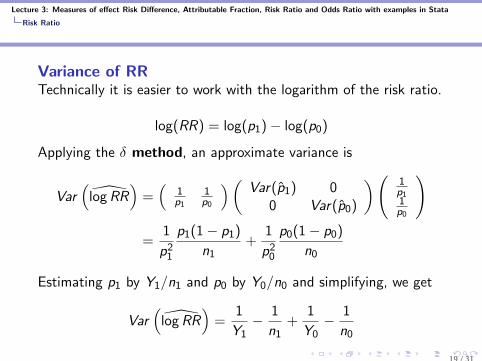
Variance of RRTechnically it is easier to work with the logarithm of the risk ratio.
log(RR) = log(p1)− log(p0)
Applying the δ method, an approximate variance is
Var(
log RR)
=(
1p1
1p0
)( Var(p1) 00 Var(p0)
)( 1p11p0
)
=1
p21
p1(1− p1)
n1+
1
p20
p0(1− p0)
n0
Estimating p1 by Y1/n1 and p0 by Y0/n0 and simplifying, we get
Var(
log RR)
=1
Y1− 1
n1+
1
Y0− 1
n0
19 / 31
Lecture 3: Measures of effect Risk Difference, Attributable Fraction, Risk Ratio and Odds Ratio with examples in Stata
Risk Ratio
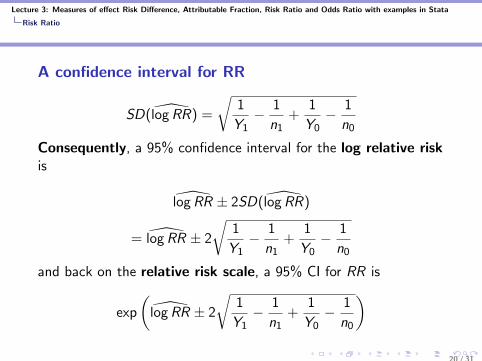
A confidence interval for RR
SD( log RR) =
√1
Y1− 1
n1+
1
Y0− 1
n0
Consequently, a 95% confidence interval for the log relative riskis
log RR ± 2SD( log RR)
= log RR ± 2
√1
Y1− 1
n1+
1
Y0− 1
n0
and back on the relative risk scale, a 95% CI for RR is
exp
(log RR ± 2
√1
Y1− 1
n1+
1
Y0− 1
n0
)20 / 31
Lecture 3: Measures of effect Risk Difference, Attributable Fraction, Risk Ratio and Odds Ratio with examples in Stata
Risk Ratio
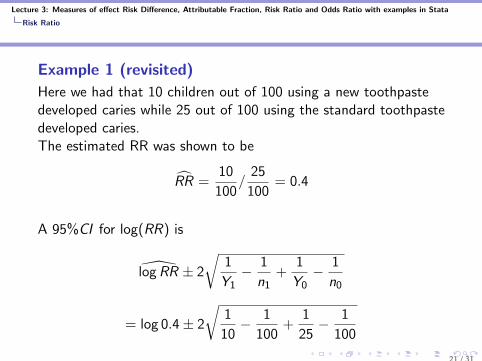
Example 1 (revisited)
Here we had that 10 children out of 100 using a new toothpastedeveloped caries while 25 out of 100 using the standard toothpastedeveloped caries.The estimated RR was shown to be
RR =10
100/
25
100= 0.4
A 95%CI for log(RR) is
log RR ± 2
√1
Y1− 1
n1+
1
Y0− 1
n0
= log 0.4± 2
√1
10− 1
100+
1
25− 1
100
21 / 31
Lecture 3: Measures of effect Risk Difference, Attributable Fraction, Risk Ratio and Odds Ratio with examples in Stata
Risk Ratio
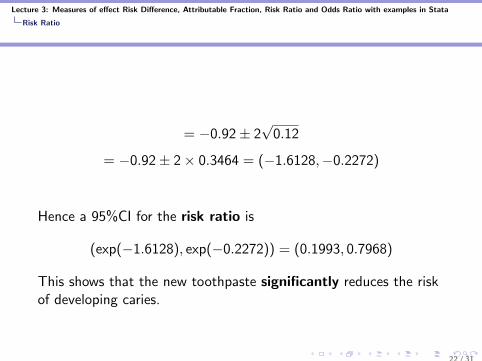
= −0.92± 2√
0.12
= −0.92± 2× 0.3464 = (−1.6128,−0.2272)
Hence a 95%CI for the risk ratio is
(exp(−1.6128), exp(−0.2272)) = (0.1993, 0.7968)
This shows that the new toothpaste significantly reduces the riskof developing caries.
22 / 31
Lecture 3: Measures of effect Risk Difference, Attributable Fraction, Risk Ratio and Odds Ratio with examples in Stata
Risk Ratio
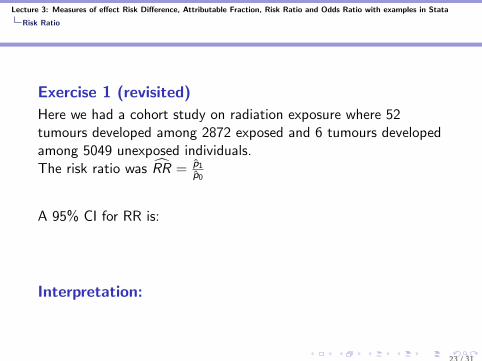
Exercise 1 (revisited)
Here we had a cohort study on radiation exposure where 52tumours developed among 2872 exposed and 6 tumours developedamong 5049 unexposed individuals.The risk ratio was RR = p1
p0
A 95% CI for RR is:
Interpretation:
23 / 31
Lecture 3: Measures of effect Risk Difference, Attributable Fraction, Risk Ratio and Odds Ratio with examples in Stata
Risk Ratio
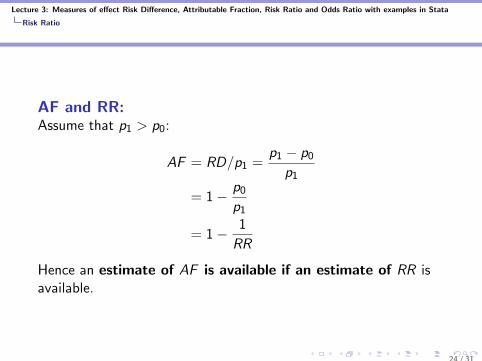
AF and RR:Assume that p1 > p0:
AF = RD/p1 =p1 − p0
p1
= 1− p0
p1
= 1− 1
RR
Hence an estimate of AF is available if an estimate of RR isavailable.
24 / 31
Lecture 3: Measures of effect Risk Difference, Attributable Fraction, Risk Ratio and Odds Ratio with examples in Stata
Odds Ratio
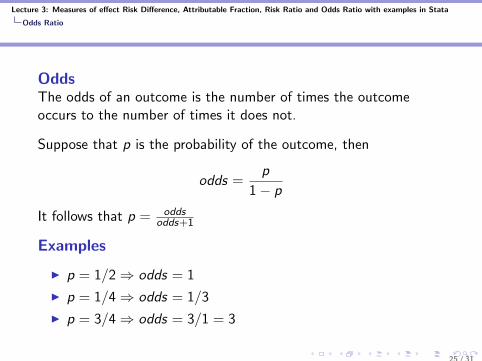
OddsThe odds of an outcome is the number of times the outcomeoccurs to the number of times it does not.
Suppose that p is the probability of the outcome, then
odds =p
1− p
It follows that p = oddsodds+1
Examples
I p = 1/2⇒ odds = 1
I p = 1/4⇒ odds = 1/3
I p = 3/4⇒ odds = 3/1 = 3
25 / 31
Lecture 3: Measures of effect Risk Difference, Attributable Fraction, Risk Ratio and Odds Ratio with examples in Stata
Odds Ratio
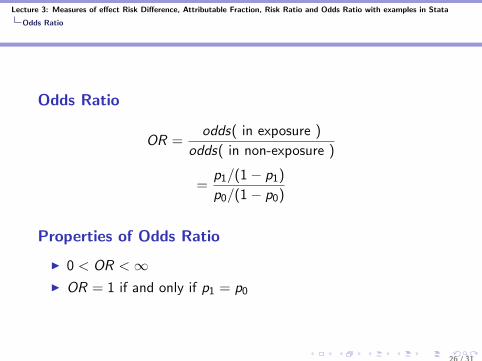
Odds Ratio
OR =odds( in exposure )
odds( in non-exposure )
=p1/(1− p1)
p0/(1− p0)
Properties of Odds Ratio
I 0 < OR <∞I OR = 1 if and only if p1 = p0
26 / 31
Lecture 3: Measures of effect Risk Difference, Attributable Fraction, Risk Ratio and Odds Ratio with examples in Stata
Odds Ratio
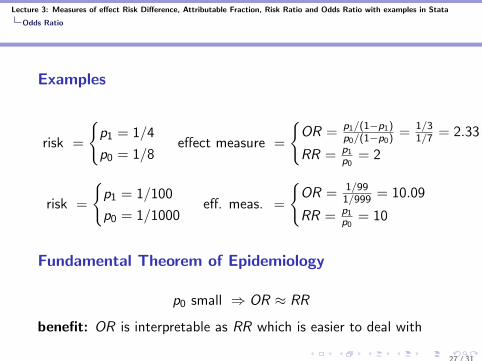
Examples
risk =
{p1 = 1/4
p0 = 1/8effect measure =
{OR = p1/(1−p1)
p0/(1−p0)= 1/3
1/7 = 2.33
RR = p1p0
= 2
risk =
{p1 = 1/100
p0 = 1/1000eff. meas. =
{OR = 1/99
1/999 = 10.09
RR = p1p0
= 10
Fundamental Theorem of Epidemiology
p0 small ⇒ OR ≈ RR
benefit: OR is interpretable as RR which is easier to deal with
27 / 31
Lecture 3: Measures of effect Risk Difference, Attributable Fraction, Risk Ratio and Odds Ratio with examples in Stata
Odds Ratio
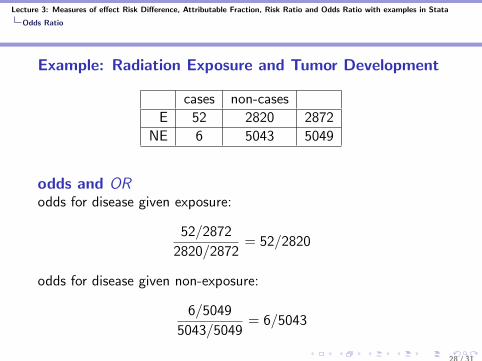
Example: Radiation Exposure and Tumor Development
cases non-cases
E 52 2820 2872
NE 6 5043 5049
odds and ORodds for disease given exposure:
52/2872
2820/2872= 52/2820
odds for disease given non-exposure:
6/5049
5043/5049= 6/5043
28 / 31
Lecture 3: Measures of effect Risk Difference, Attributable Fraction, Risk Ratio and Odds Ratio with examples in Stata
Odds Ratio
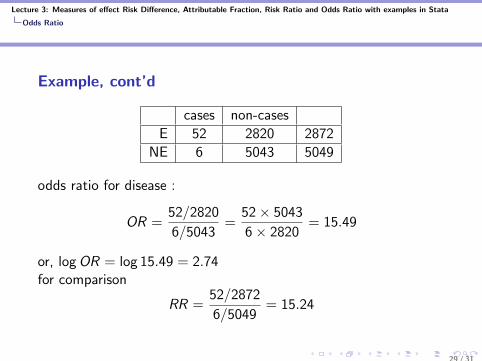
Example, cont’d
cases non-cases
E 52 2820 2872
NE 6 5043 5049
odds ratio for disease :
OR =52/2820
6/5043=
52× 5043
6× 2820= 15.49
or, log OR = log 15.49 = 2.74for comparison
RR =52/2872
6/5049= 15.24
29 / 31
Lecture 3: Measures of effect Risk Difference, Attributable Fraction, Risk Ratio and Odds Ratio with examples in Stata
Odds Ratio
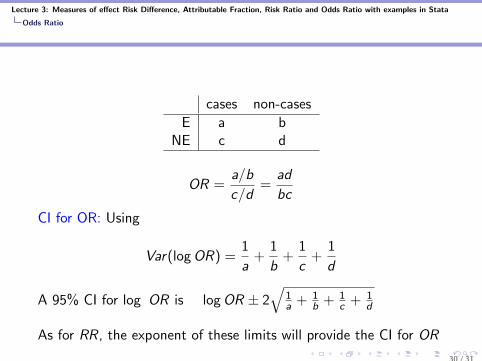
cases non-cases
E a bNE c d
OR =a/b
c/d=
ad
bc
CI for OR: Using
Var(log OR) =1
a+
1
b+
1
c+
1
d
A 95% CI for log OR is log OR ± 2√
1a + 1
b + 1c + 1
d
As for RR, the exponent of these limits will provide the CI for OR
30 / 31

Lecture 3: Measures of effect Risk Difference, Attributable Fraction, Risk Ratio and Odds Ratio with examples in Stata
Calculating in STATA
In STATA
Example: Radiation Exposure and Tumor Development
31 / 31


![Summary Measures [Ratio, Proportion, Rate]](https://img.pdfslide.us/doc/110x75/5868de8c1a28ab01578bdcb0/summary-measures-ratio-proportion-rate.jpg)