Embed Size (px)
Citation preview

LECTURE 2
1.Complex Network Models
2.Properties of Protein-Protein Interaction Networks
3.Usage of KNApSack Database

Complex Network Models:
Average Path length L, Clustering coefficient C, Degree Distribution P(k) help understand the structure of the network.
Some well-known types of Network Models are as follows:
•Regular Coupled Networks
•Random Graphs
•Small world Model
•Scale-free Model
•Hierarchical Networks

Diamond Crystal
Graphite Crystal
Regular networks
Both diamond and graphite are carbon

Regular network (A ring lattice)
Average path length L is high
Clustering coefficient C is high
Degree distribution is delta type.
1 2 43
1P(k)
5

Random Graph
Erdos and Renyi introduced the concept of random graph around 40 years ago.

Random Graph
p=0 p=0.1
p=0.15 p=0.25
N=10
Emax = N(N-1)/2
=45

p=0.25
Average path length L is Low
Clustering coefficient C is low
Degree distribution is exponential type.
( )!
k
P k ek
Random Graph

Usually to compare a real network with a random network we first generate a random network of the same size i.e. with the same number of nodes and edges.
Other than Erdos Reyini random graphs there are other type of random graphs
A Random graph can be constructed such that it matches the degree distribution or some other topological properties of a given graph
Geometric random graphs
Random Graph

Small world model (Watts and Strogatz)Oftentimes,soon after meeting a stranger, one is surprised to find that they have a common friend in between; so they both cheer:
“What a small world!”
What a small world!!
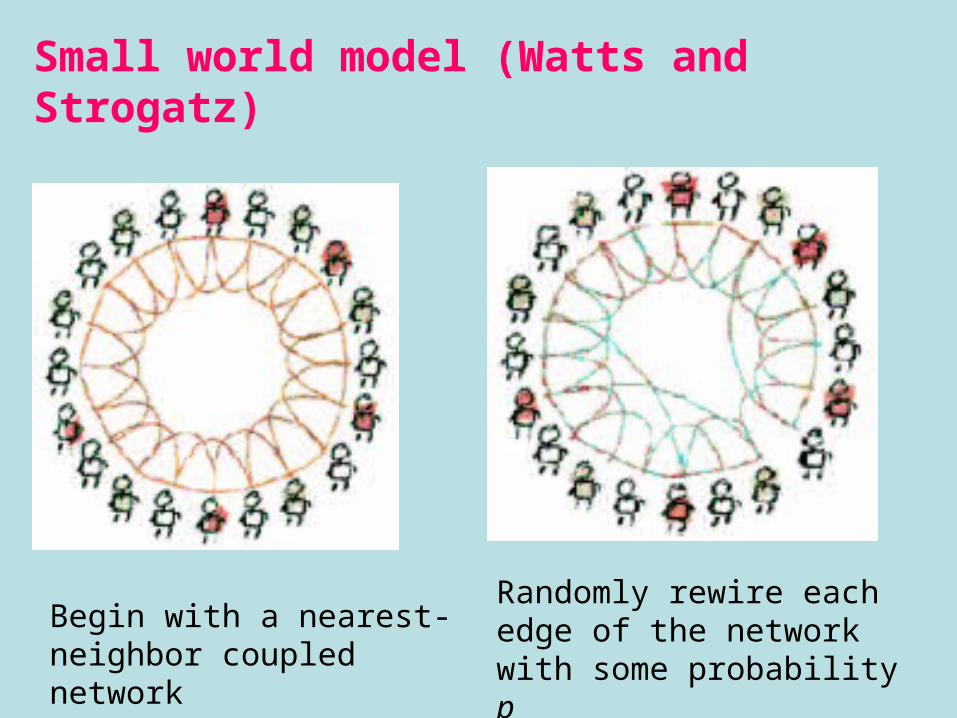
Small world model (Watts and Strogatz)
Begin with a nearest-neighbor coupled network
Randomly rewire each edge of the network with some probability p
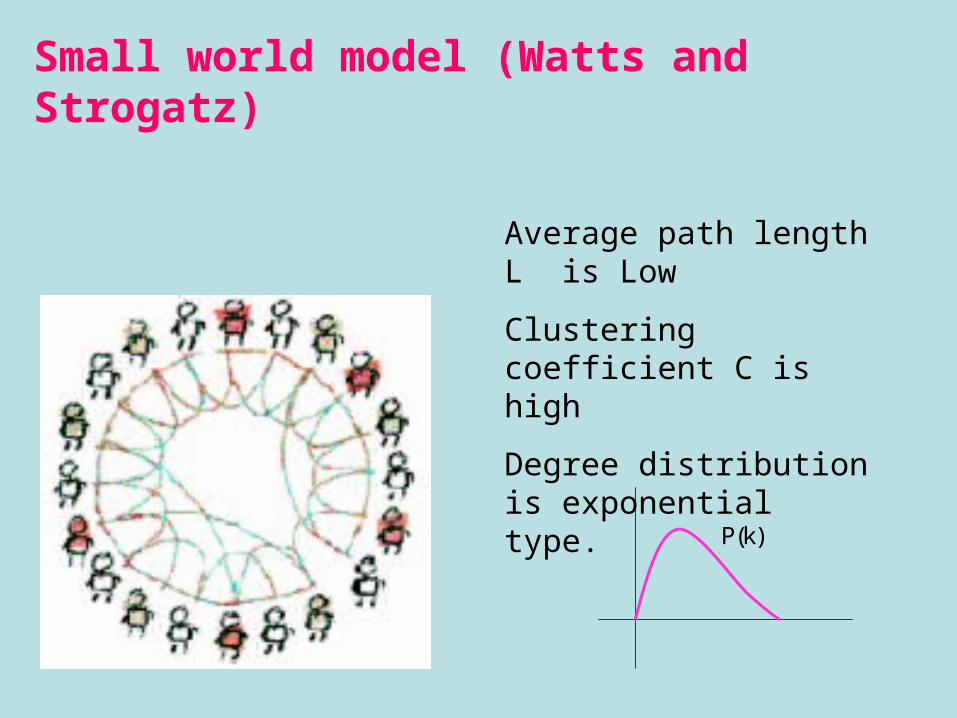
Small world model (Watts and Strogatz)
Average path length L is Low
Clustering coefficient C is high
Degree distribution is exponential type.
P(k)

Start with a small number of nodes; at every time step, a new node is introduced and is connected to already-existing nodes following Preferential Attachment (probability is high that a new node be connected to high degree nodes)
Scale-free model (Barabási and Albert)

Average path length L is Low
Clustering coefficient C is not clearly known.
Degree distribution is power-law type.
0.0001
0.001
0.01
0.1
1
10 100 10001
γ=3
γ=2
P(k) ~ k-γ

Scale-free networks exhibit robustnessRobustness – The ability of complex systems to maintain their function even when the structure of the system changes significantlyTolerant to random removal of nodes (mutations)
Vulnerable to targeted attack of hubs (mutations) – Drug targets

The term “scale-free” refers to any functional form f(x) that remains unchanged to within a multiplicative factor under a rescaling of the independent variable x i.e. f(ax) = bf(x).
This means power-law forms (P(k) ~ k-γ), since these are the only solutions to f(ax) = bf(x), andhence “power-law” is referred to as “scale-free”.
Scale-free model (Barabási and Albert)

Hierarchical Graphs
The starting point of this construction is a small cluster of four densely linked nodes (see the four central nodes in figure).Next, three replicas of this module are generated and the three external nodes of the replicated clusters connected to the central node of the old cluster, which produces a large 16-node module. Three replicas of this 16-node module are then generated and the 12 peripheral nodes connected to the central node of the old module, which produces a new module of 64 nodes.
NETWORK BIOLOGY: UNDERSTANDING THE CELL’S FUNCTIONAL ORGANIZATIONAlbert-László Barabási & Zoltán N. Oltvai
NATURE REVIEWS | GENETICS VOLUME 5 | FEBRUARY 2004 | 101

Hierarchical Graphs
The hierarchical network model seamlessly integrates a scale-free topology with an inherent modular structure by generating a network that has a power-law degree distribution with degree exponent γ = 1 +ln4/ln3 = 2.26 and a large, system-size independent average clustering coefficient <C> ~ 0.6. The most important signature of hierarchical modularity is the scaling of the clustering coefficient, which follows C(k) ~ k –1 a straight line of slope –1 on a log–log plot
NETWORK BIOLOGY: UNDERSTANDING THE CELL’S FUNCTIONAL ORGANIZATIONAlbert-László Barabási & Zoltán N. Oltvai
NATURE REVIEWS | GENETICS VOLUME 5 | FEBRUARY 2004 | 101

NETWORK BIOLOGY: UNDERSTANDING THE CELL’S FUNCTIONAL ORGANIZATIONAlbert-László Barabási & Zoltán N. Oltvai
NATURE REVIEWS | GENETICS VOLUME 5 | FEBRUARY 2004 | 101
Comparison of random, scale-free and hierarchical networks
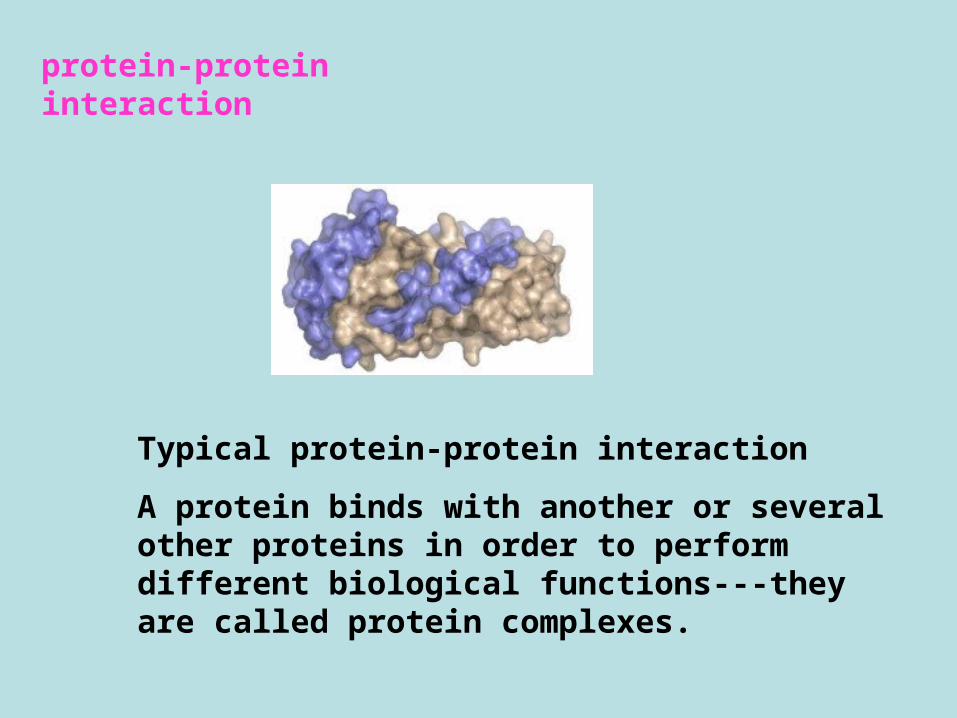
Typical protein-protein interaction
A protein binds with another or several other proteins in order to perform different biological functions---they are called protein complexes.
protein-protein interaction

PROTEIN-PROTEIN INTERACTIONSby Catherine RoyerBiophysics Textbook Online
protein-protein interaction
This complex transport oxygen from lungs to cells all over the body through blood circulation

PROTEIN-PROTEIN INTERACTIONSby Catherine RoyerBiophysics Textbook Online
protein-protein interaction
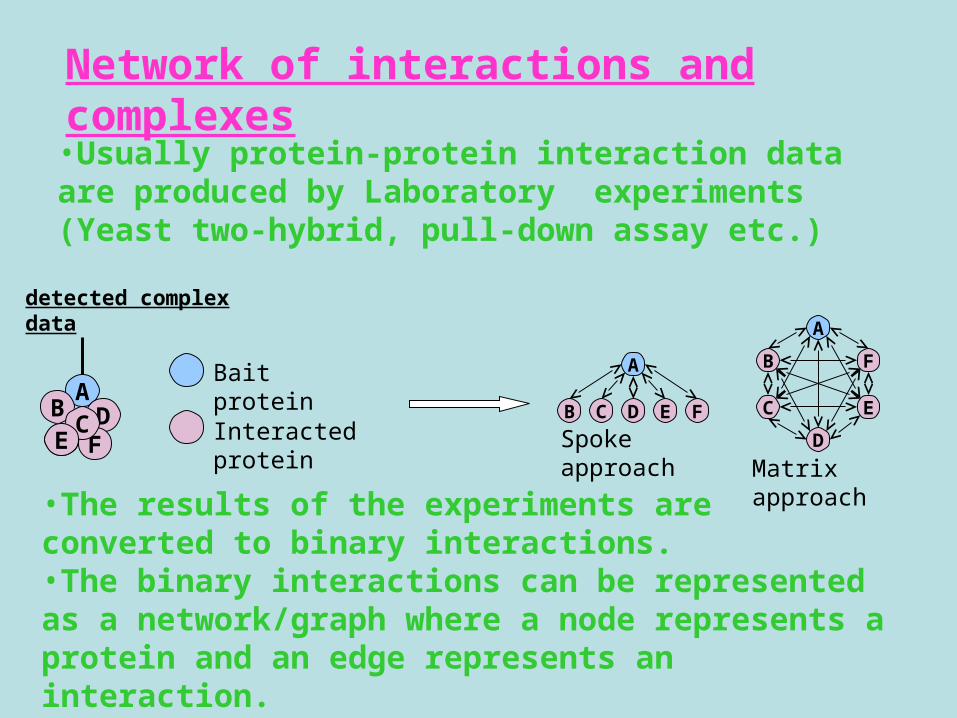
•Usually protein-protein interaction data are produced by Laboratory experiments (Yeast two-hybrid, pull-down assay etc.)
Network of interactions and complexes
•The results of the experiments are converted to binary interactions.•The binary interactions can be represented as a network/graph where a node represents a protein and an edge represents an interaction.
AD
F
BC
E
Bait protein
Interacted protein
A
B FD EC
Spoke approachC
B
D
F
E
A
Matrix approach
detected complex data
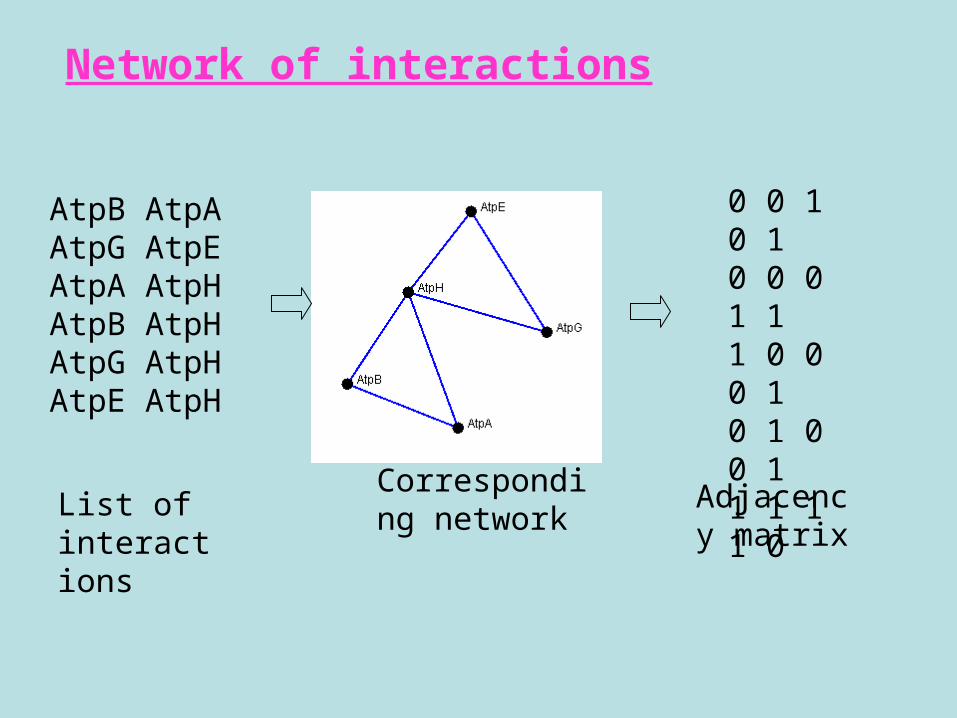
AtpB AtpAAtpG AtpEAtpA AtpHAtpB AtpHAtpG AtpHAtpE AtpH
0 0 1 0 1 0 0 0 1 1 1 0 0 0 1 0 1 0 0 1 1 1 1 1 0
List of interactions
Corresponding network
Adjacency matrix
Network of interactions
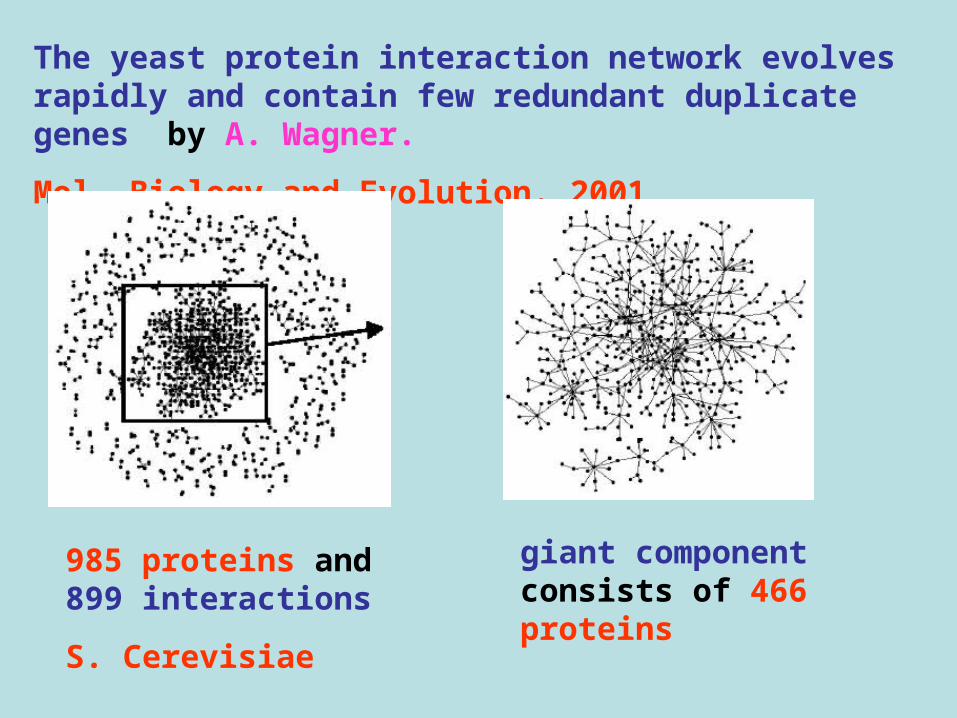
The yeast protein interaction network evolves rapidly and contain few redundant duplicate genes by A. Wagner.
Mol. Biology and Evolution. 2001
985 proteins and 899 interactions
S. Cerevisiae
giant component consists of 466 proteins

The yeast protein interaction network evolves rapidly and contain few redundant duplicate genes by A. Wagner.
Mol. Biol. Evol. 2001
Average degree ~ 2
Clustering co-efficient = 0.022
Degree distribution is scale free

An E. coli interaction network from DIP (http://dip.mbi.ucla.edu/).
300 proteins and 287 interactions
E. coli
Giant component
93 proteins
Components of this graph has been determined by applying Depth First Search Algorithm
There are total 62 components

An E. coli interaction network from DIP (http://dip.mbi.ucla.edu/).
Average degree ~ 1.913
Clustering co-efficient = 0.29
0
0.5
1
1.5
2
2.5
0 0.5 1 1.5 2
Log(Degree)
Lo
g(N
o. o
f N
od
e)
Degree distribution ~ scale free

Lethality and Centrality in protein networks byH. Jeong, S. P. Mason, A.-L. Barabasi, Z. N. OltvaiNature, May 2001
1870 proteins and 2240 interactions
S. Cerevisiae
Almost all proteins are connected
Degree distribution is scale free

Average degree 5.42
Clustering co-efficient = 0.18
Giant component consists of
4385 proteins
PPI network based on MIPS database consisting of 4546 proteins12319 interactions

0
0.5
1
1.5
2
2.5
3
3.5
0 0.5 1 1.5 2 2.5 3
Degree distribution ~ scale free
PPI network based on MIPS database consisting of 4546 proteins12319 interactions

# of
proteins
# of
Interac.
Average degree
Clustering Coeffi.
Giant
Compo.
Degree Distribu.
985 899 ~2 0.022 Exist
47.3%
Power
law
300 287 1.913 0.29 Exist
31%
Almost
Power
law
1870 2240 ______ ______ Exist
~100%
Power
law
4546 12319 5.42 0.18 Exist
~96%
Not exactly
Power
law
A complete PPI network tends to be a connected graph
And tends to have Power law distribution

Introduction to KNApSaCK database
http://kanaya.aist-nara.ac.jp/KNApSAcK/

34
0
600
±1 ±0.1 ±0.01 ±0.001
# of candidates for molecular formula
accurate mass: 226.0477
251
321
Chorismic acid Isochorismic acid
597
FT-MS high accurate MW for metabolites [molecular weight (ppm)]
KNApSAcK: Species-metabolite relation DB
±1 ±0.1 ±0.01 ±0.001
C10H10O6
Error level for FT-MS
Molecular formulaCandidatesof Metabolites
Since 2004
(Mw margin )

35
Now!
Since 2004
Species Metabolite
Last updata 2010/3/31 50,054 unique metabolites102,005 species-metabolite relations

36
Current Status of KNApSAcK project
Plant kingdom (Predicted)-- 200,000 D. Strack and R. Dixon (2003)
Known NPs (Predicted)-- 50,000 /Plants, Luca and Pierre, (2000)
KNApSAcK(last updata 2009/5/21)-- 50,054 unique metabolites 102,005 species-metabolite relations
Model speciesArabidopsis thaliana-- 5,000 ca. 1/3 of 1200 protein typesHuman-- 2,500 Ryals (2004)Bacteria (E. coli, B. subtilis)-- 800 – 1700
Systematization of Species-metabolite relation DB(KNApSAcK)
Basic study:--Metabolomics (Systems Biol)-- Evolution of NPs-- Gene to metabolite relations
Applied works:-- Food Sciences -- Health creation-- Herbal medicine-- Drug development by Herb.
37
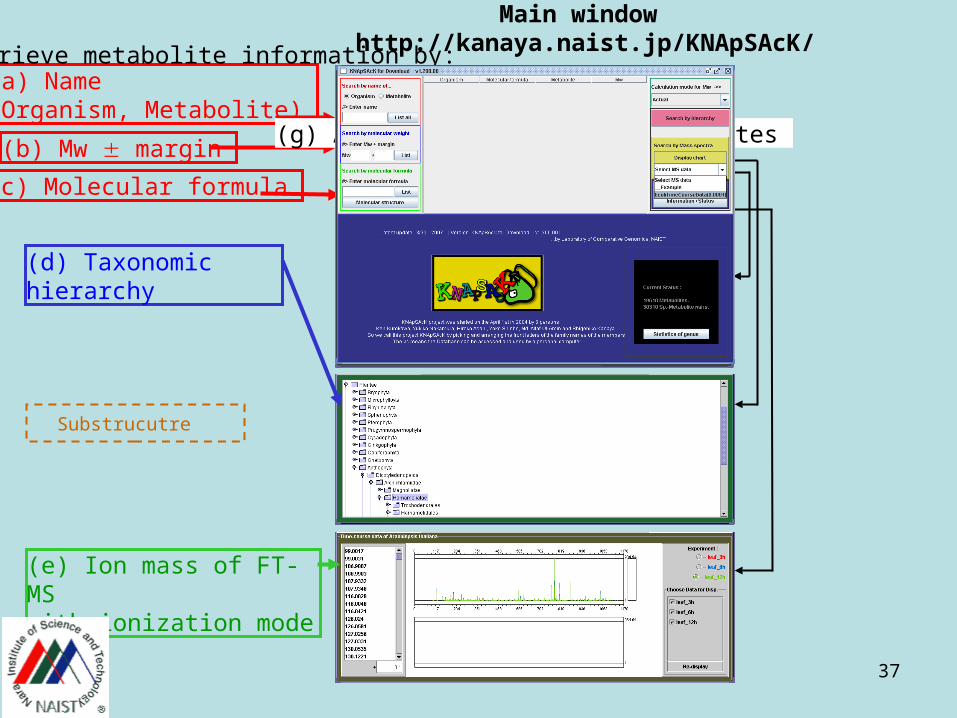
(a) Name(Organism, Metabolite)
(b) Mw margin
(c) Molecular formula
(d) Taxonomic hierarchy
(e) Ion mass of FT-MSwith ionization mode
(h) Mode selection
(g) A list of retrieved metabolites
We can retrieve metabolite information by:
Substrucutre
Main window http://kanaya.naist.jp/KNApSAcK/

38
Metabolites can be linked to KNApSAcK easily by Keywords (Organism, Metabolite, Molecular Formula)
39
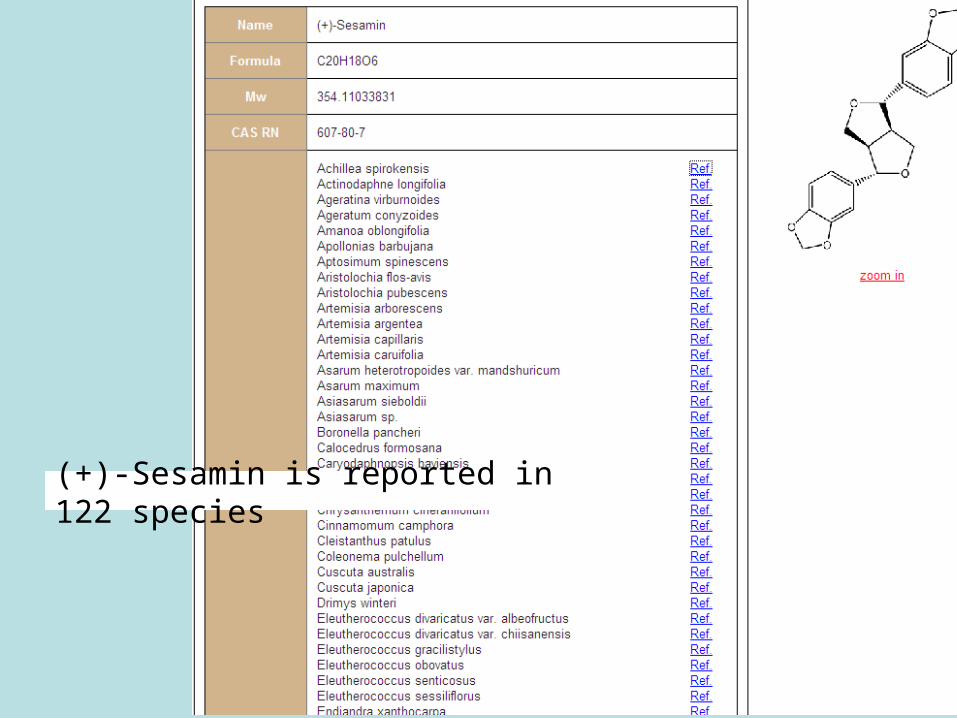
(+)-Sesamin is reported in 122 species

40
Input: Allium cepa38 Metabolites

41
KNApSAcK ( http:/kanaya.naist.jp/KNApSAcK ) (Since 2004)
0 5 10 15 20
Bioinformatics Methodology Development
Review Article
Metabolomics Non-targeted Analysis
Target of Research
0 5 10
Rattus norvegicus
Curcuma longa
E. coli
Salanum lycopersicum
Fragaria x ananassa
Arabidopsis thaliana
Brassica oleracea
Papers utilized KNApSAcK DB to examine metabolomics ( Thanks!) Davey, M.P., et al., Metabolomics, (2009)
Hounsome, N. et al., Postharvest Biol. Technol., (2009) 6 papers-2009 (Red, Foreign country)Xie,Z., et al., J.Exp.Botany,60, 87-97, (2009) Giavalisco, Anal.Chem.(2009)Draper et al., BMC Bioinformatics, (2009)
Shroff et al., PNAS (2009)
Malitsky, S.,., et al., Plant Physiol., (2008) 17 papers-2008 (Red, Foreign country)
Warner, E., et al., J.Chromatography B,(2008)Fait, A., et al., Plant Physiol., 148, 730-750 (2008)Mintz-Oron, S., et al., Plant Physiol., 147, 823-851, (2008)Hanhineva, K., et al., Phytochemistry, 69, 2463-2481 (2008)Bottcher,C., et al., Plant Physiol.,147,2107-2120, (2008)Farder, A. et al., J. Nutrition, 138, 1282-1287, (2008) Mintz-Oron, S., et al., Plant Physiol.,147,823-825, (2008)
Overy, D.P., et al., Nature Protocols, 3, 471-485, (2008)
Dunn, W.B., Physical Biol.,5, 1-24, (2008)Akiyama, K., In Silico Biol., 8, 27, (2008)Sawada, Plant Cell Physiol., (2008)Arita,M. and Suwa, K., BioData Mining, 1,7.1-8 (2008)Saito, K. et al., Trends in Plant Sci.,13, 36-43, (2008)Akiyama, K., et al., In Silico Biol., 8, 339-345, (2008)Takahashi, H., Anal. Bioanal Chem. (in press) (2008)Iijima, Y., et al., Plant J., 54, 949-962, (2008)
Want, E.J. et al., J. Proteome Res., 6, 459-468, (2007) 10 papers-2007Sofia, M., et al., Trends in Anal. Chem., 26, 855-866, (2007)Hummel, J., et al., Topics in Curr. Genet., 18, 75-95, (2007)Gaida, A., and Neumann, S., J. Int. Bioinf., (2007)Griffiths,W.J.,Metabolomics,Metabolonomics and Metabolite Profiling,(Royal Soc.Chem.),2007Ohta, D., et al., Anal.Biol. Chem.(2007)Nakamura, Y., et al., Planta, (2007)Suzuki, H., et al., Phytochemistry, (2007)Sakakibara, K., et al., , J .Biol. Chem.,282, 14932-14941, (2007)Saito, K. et al., Trends in Plant Sci., 13, 36-42, (2007)
Kikuchi, K and Kakeya, H., Natuure Chem. Biol., 2, 392-394, (2006) 4 papers-2006Oikawa, A.,et al., Plant Physiol., 142, 398-413, (2006)Shinbo, Y., et al., Biotchnol. Agric. Forestry, 57, 166-181, (2006)Shinbo, Y., et al., J. Comput. Aided Chem., 7, 94-101, (2006)since 2004Web-sites linked to KNApSAcK(WikiBook) http://en.wikibooks.org/wiki/Metabolomics/Databases (UC Davis ) http://fiehnlab.ucdavis.edu/staff/kind/Metabolomics/Structure_Elucidation/(KEGG) http://fire3.scl.genome.ad.jp/dbget-bin/www_bfind?knapsack(TAIR-Metabolomics Resource – Databases) http://www.arabidopsis.org/portals/metabolome/metabolome_database.jsp/( LECO manual ) Form No. 203-821-333(PubMed) referred by C-IDhttp://metabolomics.jp/wiki/
42

We learnt
1.Properties of some complex network models
2.Properties of Protein-Protein Interaction Networks
3.Usage of KNApSack Database