Embed Size (px)
Citation preview

“Explosive percolation andcascades on interdependent networks”
Lecture 17, May 27, 2014

Announcements
• Homeworks
– HW3 and HW3b due today– HW3a (project progress report) due Fri May 30
• NetSci 2014 attendance and volunteering
– Visiting Scholar, Trivik Verma, is coordinating.– Expect an email this week with final details.– Tasks: Pass out name tags (starting at 8:15am); Pass
around microphone for audience questions; etc– Location and maps at www.netsci2014.net
• Project presentations

13 Class projects
1. Optimal Location For a New Business∗
Harika Sabella, Mohammad Adil, Sugeerth Murugesan2. Contagion in Social Resistace Networks∗
Haochen Wu, Felipe Aviles Lucero, Jaime Jackson, Aleksander Zujev, Elizabeth Zarrindast3. Community Detection and Resilience
G. Badeau, W. Cuello, R. Starr4. Open-Source Collaboration and Following∗
Grace Benefield, Casey Casalnuovo5. The Effect of Signed Network Topology on Binary Neurons
Tom Chartrand, Alec Boyd6. Who Triggers a Weibo Event?
Xiaotao Feng, Jiahui Guan7. Hierarchical Structure of Wikipedia
Brian Weston, Jay Gokhale, Ali Emara8. Characterizing fMRI-based functional networks during attention-demanding tasks at rest
Ben Kubit, Saeedeh Komijani9. Maternal/fetal effects of Bis(2-ethylhexyl) phthalate on hormone regulation during gestation
in Zinc deficient rats: a network analysis approachCarlos Ruvalcaba, Trevor Ramsay, and Heidi Kucera

13 Class projects, cont
10. California Winegrower Social Networks: Environmental Certifications and PracticesMichael Levy and Ryan Parker
11. Opinion Dynamics with reluctant agents∗
Hoi-To Wai, Christopher Patton12. Extraction and Reasoning about Roles in Power Networks∗
Andrew Smith13. Yelp Data challenge - Communities for A Better Yelp
Edmund Yan, Leyuan Wang
∗ Speaking Thurs May 29(See detailed schedule online)
• 15 mins total for each presentation (including Q&A)
• Guidelines for presentation and for project report to be posted.

The past decade, a “Science of Networks”:(Physical, Biological, Social)
• Geometric versus virtual (Internet versus WWW).
• Natural /spontaneously arising versus engineered /built.
• Each network may optimize something unique.
• Fundamental similarities and differencesto guide design/understanding/control.
• Interplay of topology and function ?
• Up until now, studied largelyas individual networks in isolation .
NRC, 2005

Dynamics of networks – A key distinction
• Dynamical process taking place on a network substrate– Information flows– Epidemic spreading– Synchronization, etc.
• Dynamics of the nodes and edges constituting the network– Network growth/decline; edge intermittency; etc.
Key issue: separation of timescales.
i.e., when is the network substrate essentially static over thetimescale of the dynamical process? .... (e.g web crawling;routing tables in mobile ad hoc networks; epidemic spreading(Volz and Meyers Proc. Royal Society, B. 2007; Mucha et. al. Science 328, 2010.)

Dynamical processes on (static) networks(Durrett, Random Graph Dynamics, Cambridge Univ. Press (2006))
(Barrat, Barthelemy, Vespignani Dyn. Proc. on Complex Networks, Cambridge (2008))
• Diffusion
• Spreading / Percolation / Contact processes / Epidemics
• Synchronization – fireflies, Josephson junctions, ad hocsensor networks ...
• Searching on networks (WWW, P2P, sensor nets, social nets)
• Flows: data, materials, transportation, biochemical (on manylevels – genes, proteins, metabolites)
• Traffic, congestion, jamming
• Cascades / Avalanches / Sandpiles

Dynamics of the underlying network
• Network growth (long list here.... see next slide)
• Vulnerability to node and edge deletion
• Online Social Networks: shrinking diameter and densification
• Link intermittency (Internet)
• Shifting centrality (AS level internet)
• Ad hoc / MANETS (wireless radio communications)(self-org algorithms, capacity, scaling, energy conservation)
• Network shrinking (nodes – banking, garment industry)
• Coevolution:(socio-technical – land use/population growth)(biological – gene regulatory/ppi (conserved motifs) / ecosystems )

Dynamics of the network: growth
• Random graphs (Erdos-Renyi 1959, 1960; Gilbert 1959; Bollobas 1985)
• Configuration models (Bollobas 1980, Molloy and Reed 1995)
• Randomly grown graphs (CHKNS 2001)
• Growth by Preferential Attachment (Polya 1923; Yule 1925; Zipf 1949;Simon 1955; Price 1976; Barabasi-Albert 1999)
• Growth by copying (WWW inspired) (Kumar et. al. FOCS 2000); Copyingwith mutation (bio inspired) (e.g., DMC – Vazquez et. al. 2003))
• Non-linear PA (Krapivsky-Redner 2000, 2001); Geometric PA (Flaxman-Frieze-Vera 2006); PA from optimization (DBCBK 2007)
• Growth with feedback (White-Kejzar-Tsallis-Farmer 2006; R.D.-Roy 2008)
• Growth with choice (Bohman-Frieze 2001....)

Beyond topology: The Flows are the network!(e.g., Matisziw, Grubesic (2010))
• Networks across space and time / Structure and function.
• Internet2 flows over one day show large variation.
• “Vulnerable” nodes and edges depends on time of day.
Extreme sensitivity to details of flows!! (Need heuristic models of flows.)
See also: 1) Braess’ Paradox; 2) Kurant and Thiran PRL 89 (2006).

“Vulnerability” – network structure perspective
(The Percolation phase transition)Emergence of giant connected component in a random network
• Communications, Transportation, Synchronization, ... versus
• Spread of human or computer viruses

Connectivity in random networks• Solomonoff, Rapoport, “Connectivity of random nets”, Bull. of Math. Biophysics, 1951.• P. Erdos and A. Renyi, “On random graphs”, Publ. Math. Debrecen. 1959.• P. Erdos and A. Renyi, “On the evolution of random graphs”,
Publ. Math. Inst. Hungar. Acad. Sci. 1960.• E. N. Gilbert, “Random graphs”, Annals of Mathematical Statistics, 1959.
●
●
●
●
●
●
●●●
●
●●
●
●
●
●
●
●
●
●
●
●
●
●
●
●
●
●
●
●
●
●
●
●
●
●
●
●
●
●
●
● ●
●
●
●
●
●
●●●
●
●
●
●
●
●
●
●
●
●
●
●●
●
●
●
●
●
●
●
●
●●
●
●
●
●
●
●
●●
●
●
●
●
●
●
●
●● ●
●
●
●
●
●
●
●
●
●
●
●
●
●
●
●
● ●
●
●
●
●
●
●●
●
●
●●
●
●
●
●
●
●
●
●●
●
●
●
●
●
●●
● ●●
●
●
●
●
●
●
●
●
●
●
●
●
●
●
●●
●
●
●
●
●
●
●
●
●
●
●
●
●
●
●
●
●
●
●
●
●
●
●
●
●
●
●
●
●
●
●
●
●●
●
●
●
●
●
●
●
●
●
●
●
●
●
●
●
●
●
●
●
●
●
●
●
●
●
●
●
●
●
●
●
●
●
●
●
●
●
●
●
●
●
●
● ●
●
●
● ●
●●
●
●
●
●
●
●
●
●●
●
●
●
●
●
●
●
●
●
●
● ●
●
●
●
●
●
●
●
●
●
●
●
●
●
●
●●
●
●
●
●
●
●
●
●
●
●
●
●
●
●●
●
●
●
●
●
●
●
●
●
• Start with N isolated vertices.
• Add random edges one-at-a-time.E = N(N − 1)/2 total edges possible.
• After E edges, probability p of anyedge is p = E/E = 2E/N(N − 1)
What does the resulting graph look like?(Typical member of the ensemble)

N=300
●
●
●
●
●
●●
●
●
●
●
●
●
●
●
●
●
●
●
●
●
● ●
● ●
●
●
●
●
●
●
●
●
●
●
●
●
●
●
●
●●
●
●
●
●●
●
●
●●
●
●
●
●
●
●
●
●
●
●
●
●
●
●
●
●
●
●●
●
●
●
●●
●
●
●
●
●
●
●
●
●
●
●
●
●
●
●
●
●
●
●
●
●
●
●
●
●
●
●
●
●
●
●
●
●
●
●
●
●
●
●
●
●
●
●
●
●
●
●
●
●
● ●
●
●
●
●
●
●
●
●
●
●
●
●
●
●
●
●
●
●
●
●
●
●
●
●
●
●
●
●
●
●
●
●
●
●
●● ●
●●
●
●
●
●
●●
●
●
●
●
●
●
● ●
●
●
●
●
●
●
●
●
●
●
●●
●
●
●
●
●●
●
●
●
●
●
●
●
●
●
●
●
●
●
●
●
●
●
●
●
●
●
●
●
●
●
●
●
●
●
●
●
●
●
●
●●
●
●
●
●
●
●
●
●
●
●●
●
● ●
●
●
●
●
●
●
●
●
●
●
●
●
●
●●
●
●
●
●
●
●
●
●
●
●
●
●
●
●
●
●
●
●
●
●
●
●
●
●
●
●
●●
●
●
●
●
●
●
●
●
●
●
●
●
●
●
●
●
●
●
●
●
●
●
●●
●
●
●
●
●
●
● ●
●
●
●
●
●
●
●
●
●
●
●●
●
●
●
●
●
●
●
●
●
●
●
●●
●
●
●
●
●
●
●
●●
●
●
●
●
●
●
●●
●
●
●
●
●
●
●
●
●
●●
●
●
●
●
●
●
●
●
●
●
●
●
●
●
●
●
●
● ●
●
●
●
●
●
●
●
●
● ●
● ●
●
●
●
●
●
● ●
●
●
●
●
●
●
●
●
●
●●
●
●
●
●
●
●
●
●
●
●
●
●
●
●
●
●
●
●
●
●
●
●
●
●
●
●
●
●
●
●
●
●
●
●
●
●
● ●
●
●
●
●
●
●
●
●
●●
●
●
●
●
●
●
●
●
●
●
●
●
●
●
●●
●
●
●
●
●●
●
●
●
●
●●
●
●
●
●
●
●
●
●
●
●
●
●
●●
●
●
●
●
●
●
●
●
●
●
●
●
●
●
●
●●
●
●
●
●
●
●
●
●
●
●
●
●
●
●
●
●
●
●
● ●
●
●
●
●
●
●
●
●
●
●
●
●
●
●
●
●
●
●
●
●
●
●
●
●
●
●
●
●
●
●
●
●
●
●
●
●
●●
●
●
●
●
●
●
●
●
●
●
●
p = 1/400 = 0.0025 p = 1/200 = 0.005

Emergence of a “giant component”Phase transition in connectivity
• pc = 1/N .
• p < pc, Cmax ∼ log(N)
• p > pc, Cmax ∼ A ·N
(Ave node degree t = pN
so tc = 1.)
A continuous (smooth) transition at pc.

Can any limited perturbation change the phase transition?[Bohman, Frieze, RSA 19, 2001]
[Achlioptas, D’Souza, Spencer, 2009]
• Possible to Enhance or Delay the onset?
• The “Product Rule” (An “Achlioptas Process”)– Choose two edges at random each step.– Add only the desirable edge and discard the other.
(Enhance) (Delay)
• The Power of Two ChoicesAzar; Broder; Mitzenmacher; Upfal; Karlin;

ProdRule: Explicit example
●
●
●
●
●●●
● ●
●
●
●
●
●
●
●
● ●
●
●
●
●
●
●
●
●
●
●
●
●
●●
●
●
●
●●
●●
●
●
●
●
●
●
●
●
●
●
●
●
●
●
●
●●●
● ●
●
●
●
●
●
●
●
● ●
●
●
●
●
●
●
●
●
●
●
●
●
●●
●
●
●
●●
●●
●
●
●
●
●
●
●
●
●
●
●
(A) (B)
e1
e2
• Prod e1 = (7)× (2) = 14
• Prod e2 = (4)× (4) = 16
• To enhance choose e2. To delay choose e1.

Product Rule
• Enhance – similar to ERbut with earlier onset.
• Delay –changes fromcontinuous todiscontinuoustransition!

The window ∆ from Cmax = n1/2 to Cmax = 0.5n
• Let e0 denote the last edge added for which Cmax < n1/2.(Note ER has n2/3 at pc.)
• Let e1 denote the first edge added for which Cmax > 0.5n.
• Let ∆ = e1 − e0.
0e+00 2e+07 4e+07 6e+07
1.0
1.1
1.2
1.3
1.4
1.5
Δ/n
2/3
n0e+00 3e+07 6e+07
0.19
0.21
o+
ERBF
Δ
n
PR ∆ ∼ n2/3 ER (and BF) ∆ ∼ n.
∆ for PR is sublinear in n.

Delayed Product Rule: Discontinuous change
• Edge density, t = e/n. (Find ec = 0.888n as n→∞).
• For t < tc, Cmax < n1/2, where tc→ 0.888... from below.
• For t > tc, Cmax > 0.5n, where tc→ 0.888... from above.
1e+06 5e+06 2e+07 1e+08
0.87
60.
880
0.88
40.
888
n
t/n
e0/n
= 0.88814 – 2.18n-0.38
+ e1/n
= 0.88809+ 0.015n-0.24
t
Jumps “instantaneously” from Cmax = n1/2 to 0.5n.

Why this is surprising
Percolation theory, a theoretical underpinning for :
• Onset of epidemic spreading
• Flow through porous media / random transport
• Vulnerability and resilience of networks
– Many prior variants (bond, site, directed, ...) on many types ofnetworks and lattices; All continuous transitions.
– Continuous: accompanied by critical scaling which canprovide warning signs.
– Abrupt: detection, intervention, recovery more challenging,esp. cascading failures.

“Explosive Percolation in Random Networks”From nγ to greater than 0.6n “instantaneously”
Cmax jumps from sublinear nγ Nontrivial Scaling behaviorsto≥ 0.5n innβ edges, with β, γ < 1 . γ+ 1.2β = 1.3 for A ∈ [0.1, 0.6]
oooo
ooooooo
ooooo
oooooooo
oooooo
ooooo
ooooo
ooooo
ooooo
ooooo
ooooo
ooooo
ooooo
ooooo
ooooo
ooooo
ooooo
ooooo
ooooo
ooooo
ooooo
ooooo
ooooo
ooooo
ooooo
ooooo
ooooo
ooooo
ooooo
ooooo
ooooo
ooooo
ooooo
ooooo
ooooo
ooooo
ooooo
ooooo
ooooo
ooooo
ooooo
ooooo
ooooo
ooooo
ooooo
ooooo
ooooo
ooooo
ooooo
ooooo
ooooo
ooooo
ooooo
ooooo
ooooo
ooooo
ooooo
ooooo
ooooo
ooooo
ooooo
ooooo
ooooo
ooooo
ooooo
ooooo
ooooo
ooooo
ooooo
ooooo
ooooo
ooooo
ooooo
ooooo
ooooo
ooooo
ooooo
ooooo
ooooo
ooooo
ooooo
ooooo
ooooo
ooooo
ooooo
ooooo
ooooo
ooooo
ooooo
ooooo
ooooo
ooooo
ooooo
ooooo
ooooo
ooooo
ooooo
ooooo
ooooo
ooooo
ooooo
ooooo
ooooo
ooooo
ooooo
ooooo
ooooo
ooooo
ooooo
ooooo
ooooo
ooooo
ooooo
ooooo
ooooo
ooooo
ooooo
ooooo
ooooo
ooooo
ooooo
ooooo
ooooo
ooooo
ooooo
ooooo
ooooo
ooooo
ooooo
ooooo
ooooo
ooooo
ooooo
ooooo
ooooo
ooooo
ooooo
ooooo
ooooo
ooooo
ooooo
ooooo
ooooo
ooooo
ooooo
ooooo
ooooo
ooooo
ooooo
ooooo
ooooo
ooooo
ooooo
ooooo
ooooo
ooooo
ooooo
ooooo
ooooo
ooooo
ooooo
ooooo
ooooo
ooooo
ooooo
ooooo
ooooo
ooooo
ooooo
ooooo
ooooo
ooooo
ooooo
ooooo
ooooo
ooooo
ooooo
ooooo
ooooo
ooooo
ooooo
ooooo
ooooo
ooooo
ooooo
ooooo
ooooo
ooooo
ooooo
ooooo
ooooo
ooooo
ooooo
ooooo
ooooo
ooooo
ooooo
ooooo
ooooo
ooooo
ooooo
ooooo
ooooo
ooooo
ooooo
ooooo
ooooo
ooooo
ooooo
ooooo
ooooo
ooooo
ooooo
ooooo
ooooo
ooooo
ooooo
ooooo
ooooo
ooooo
ooooo
ooooo
ooooo
ooooo
ooooo
ooooo
ooooo
ooooo
ooooo
ooooo
ooooo
ooooo
ooooo
ooooo
ooooo
ooooo
ooooo
ooooo
ooooo
ooooo
ooooo
ooooo
ooooo
ooooo
ooooo
ooooo
ooooo
ooooo
ooooo
ooooo
ooooo
ooooo
ooooo
ooooo
ooooo
ooooo
ooooo
ooooo
ooooo
ooooo
ooooo
ooooo
ooooo
ooooo
ooooo
ooooo
ooooo
ooooo
ooooo
ooooo
ooooo
ooooo
ooooo
ooooo
ooooo
ooooo
ooooo
ooooo
ooooo
ooooo
ooooo
ooooo
ooooo
ooooo
ooooo
ooooo
ooooo
ooooo
ooooo
ooooo
ooooo
ooooo
ooooo
ooooo
ooooo
ooooo
ooooo
ooooo
ooooo
ooooo
ooooo
ooooo
ooooo
ooooo
ooooo
ooooo
ooooo
ooooo
ooooo
ooooo
ooooo
ooooo
ooooo
ooooo
ooooo
ooooo
ooooo
ooooo
ooooo
ooooo
ooooo
ooooo
ooooo
ooooo
ooooo
ooooo
ooooo
ooooo
ooooo
ooooo
ooooo
ooooo
ooooo
ooooo
ooooo
ooooo
ooooo
ooooo
ooooo
ooooo
ooooo
ooooo
ooooo
ooooo
ooooo
ooooo
ooooo
ooooo
ooooooooooooooooooooooooo
ooooooooooooooo
0.1 0.2 0.3 0.4 0.5 0.614 15 16 17
0.6
0.7
0.8
0.9
γ
β
n
0.6
0.7
0.8
0.9
0.2
Rel Err o > 0.02o < 0.02o < 0.015o < 0.01o < 0.005
1x10⁶ 4x10⁶ 8x10⁶ 32x106
0.4 0.6
Achlioptas, D’Souza, Spencer, Science, 323 (5920), 2009

Many more EP systems and mechanisms now discovered(Condensed list here)
Lattice percolation, power law graphs, cluster aggregation:• R. Ziff, Phys. Rev. Lett. 103, 045701 (2009).• Y. S. Cho, J. S. Kim, J. Park, B. Kahng, D. Kim, Phys. Rev. Lett. 103, 135702 (2009).• F. Radicchi, S. Fortunato, Phys. Rev. Lett. 103, 168701 (2009).• E. J. Friedman, A. S. Landsberg, Phys. Rev. Lett. 103, 255701 (2009).• Y.S. Cho, B. Kahng, D. Kim, Phys. Rev. E (R), 2010.• R. M. D’Souza, M. Mitzenmacher, Phys. Rev. Lett. 104, 195702 (2010).• Araujo, Andrade Jr, Ziff, Herrmann, Phys. Rev. Lett. 106, 095703 (2011).• Nagler, Levina, Timme, Nature Physics 7, 265 (2011).• Gomez-Gardenes, Gomez, Arenas, Moreno, Phys. Rev. Lett. 106, 128701 (2011).
Observed in real world:• Rozenfeld, Gallos, Makse; Eur. Phys. J. B, 75, 305-310, (2010). (PHN)• Pan, Kivela, Jari Saramaki, Kaski, Kertesz, Phys. Rev. E 83, (2011). (Communities)• Y. Kim, Y.-k. Yun, and S.-H. Yook, Phys. Rev. E 82, 061105 (2010). (Nanotubes)• Growth of Wikipedias (Bounova, personal communication.)
Alternate mechanisms (with out edge competition):• Araujo, Herrmann, Phys. Rev. Lett. 105, 035701 (2010).• W. Chen, R. M. D’Souza, Phys. Rev. Lett. 106, 115701 (2011).

Accompanying commentary:Can the evolution of real-world networks be accurately modeled?
(See also Borgatti Science 323, 2009. Social networks vs random graphs)
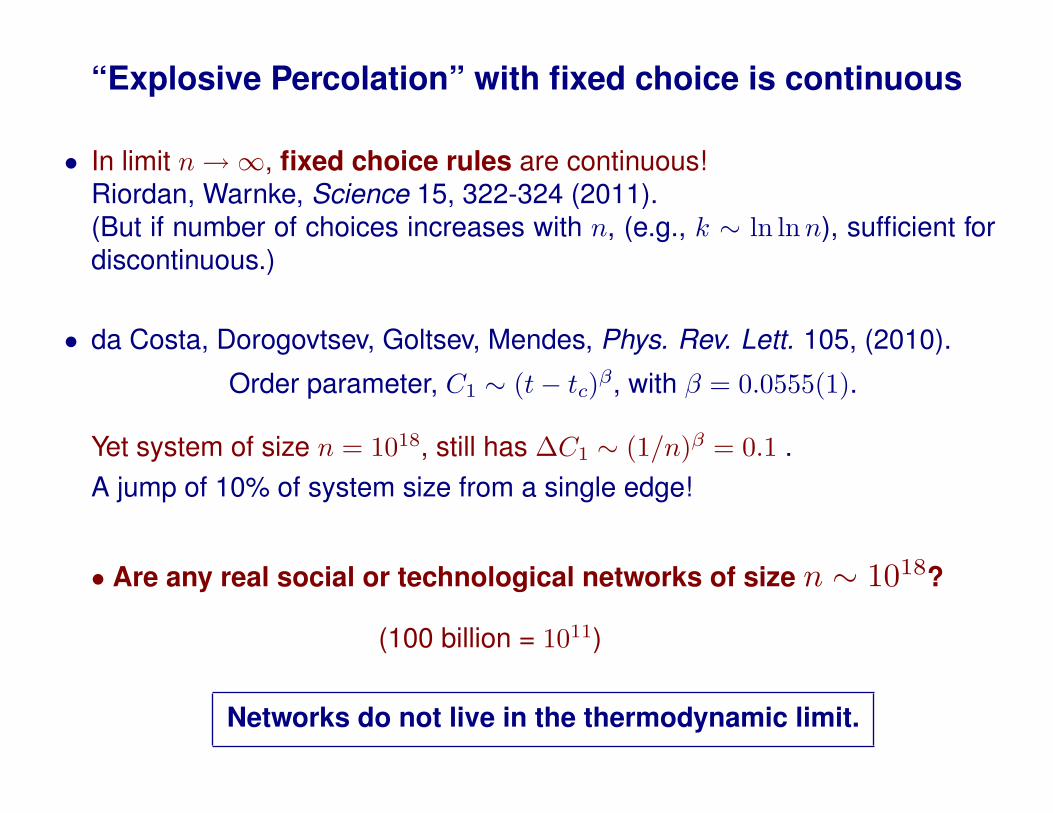
“Explosive Percolation” with fixed choice is continuous
• In limit n→∞, fixed choice rules are continuous!Riordan, Warnke, Science 15, 322-324 (2011).(But if number of choices increases with n, (e.g., k ∼ ln lnn), sufficient fordiscontinuous.)
• da Costa, Dorogovtsev, Goltsev, Mendes, Phys. Rev. Lett. 105, (2010).
Order parameter, C1 ∼ (t− tc)β, with β = 0.0555(1).
Yet system of size n = 1018, still has ∆C1 ∼ (1/n)β = 0.1 .A jump of 10% of system size from a single edge!
• Are any real social or technological networks of size n ∼ 1018?
(100 billion = 1011)
Networks do not live in the thermodynamic limit.

Mechanisms for truly discontinuous percolation
• Fixed choice on a lattice of d < 6 , Cho et al. Science 338, 2013.
• Control only of the largest cluster– Araujo, N. A. M. & Herrmann, H. J. , et al.Phys. Rev. Lett. 105, 035701 (2010), Phys. Rev. Lett. 106, (2011).
– W. Chen & R.D. Phys. Rev. Lett. 83 (2011); Chen, Zheng, R. D. EPL 100 (2012).Growth by overtaking.Common in ecology and business.
• Cooperative/correlated phenomena– Bizhani, Paczuski, Grassberger,PRE 86 (2012)
– L. Cao, J. M. Schwarz, PRE 86 (2012).
• Dressing up a simple structureBoettcher, Singh, Ziff, Nature Comm., 3:787 (2012).
• Restricted Erdos-RenyiPanagiotou, et. al. Elec. Notes. Disc. Math. 2011.
● ● ● ● ●●●●●●●●●●●●●●●●●●●●●●●●●●●●●●●●●●●●●●●●●●●●●●●●●●●●●●●●●●●●●●●●●●●●●●●●●●●●●●●●●●●●●●●●●●●●●●●●●●●●●●●●●●●●●●●●●●●●●●●●●●●●●●●●●●●●●●●●●●●●●●●●●●●●●●●●●●●●●●●●●●●●●●●●●●●●●●●●●●●●●●●●●●●●●●●●●●●●●●●●●●●●●●●●●●●●●●●●●●●●●●●●●●●●●●●●●●●●●●●●●●●●●●●●●●●●●●●●●●●●●●●●●●●●●●●●●●●●●●●●●●●●●●●●●●●●●●●●●●●●●●●●●●●●●●●●●●●●●●●●●●●●●●●●●●●●●●●●●●●●●●●●●●●●●●●●●●●●●●●●●●●●●●●●●●●●●●●●●●●●●●●●●●●●●●●●●●●●●●●●●●●●●●●●●●●●●●●●●●●●●●●●●●●●●●●●●●●●●●●●●●●●●●●●●●●●●●●●●●●●●●●●●●●●●●●●●●●●●●●●●●●●●●●●●●●●●●●●●●●●●●●●●●●●●●●●●●●●●●●●●●●●●●●●●●●●●●●●●●●●●●●●●●●●●●●●●●●●●●●●●●●●●●●●●●●●●●●●●●●●●●●●●●●●●●●●●●●●●●●●●●●●●●●●●●●●●●●●●●●●●●●●●●●●●●●●●●●●●●●●●●●●●●●●●●●●●●●●●●●●●●●●●●●●●●●●●●●●●●●●●●●●●●●●●●●●●●●●●●●●●●●●●●●●●●●●●●●●●●●●●●●●●●●●●●●●●●●●●●●●●●●●●●●●●●●●●●●●●●●●●●●●●●●●●●●●●●●●●●●●●●●●●●●●●●●●●●●●●●●●●●●●●●●●●●●●●●●●●●●●●●●●●●●●●●●●●●●●●●●●●●●●●●●●●●●●●●●●●●●●●●●●●●●●●●●●●●●●●●●●●●●●●●●●●●●●●●●●●●●●●●●●●●●●●●●●●●●●●●●●●●●●●●●●●●●●●●●●●●●●●●●●●●●●●●●●●●●●●●●●●●●●●●●●●●●●●●●●●●●●●●●●●●●●●●●●●●●●
1 5 10 50 5002e
−05
1e−
045e
−04
5e−
03
Rank
Siz
e/N
+ ++
+++++++++++++++++++++++++++++++++++++++++++++++++++++++++++++++++++++++++++++++++++++++++++++++++++++++++++++++++++++++++++++++++++++++++++++++++++++++++++++++++++++++++++++++++++++++++++++++++++++++++++++++++++++++++++++++++++++++++++++++++++++++++++++++++++++++++++++++++++++++++++++++++++++++++++++++++++++++++++++++++++++++++++++++++++++++++++++++++++++++++++++++++++++++++++++++++++++++++++++++++++++++++++++++++++++++++++++++++++++++++++++++++++++++++++++++++++++++++++++++++++++++++++++++++++++++++++++++++++++++++++++++++++++++++++++++++++++++++++++++++++++++++++++++++++++++++++++++++++++++++++++++++++++++++++++++++++++++++++++++++++++++++++++++++++++++++++++++++++++++++++++++++++++++++++++++++++++++++++++++++++++++++++++++++++++++++++++++++++++++++++++++++++++++++++++++++++++++++++++++++++++++++++++++++++++++++++++++++++++++++++++++++++++++++++++++++++++++++++++++++++++++++++++++++++++++++++++++++++++++++++++++++++++++++++++++++++++++++++++++++++++++++++++++++++++++++++++++++++++++
Rank−size top 1000 at t=t_c
o+
PRER

Additional esoteric behaviors of EP systems
• Multiple giant components !W. Chen, R. D., Phys. Rev. Lett. 106 115701 (2011).
0 0.2 0.4 0.6 0.8 10
1
2
3
4
5
6
7
α
N(α
,0.1
n)
(a)
0 0.5 1.0 1.50
0.2
0.4
0.1
0.3
0.5
t/n
(b)
C1
C2
C3
104
106
108
105
107
0.98
1.00
1.02
1.04
n
pc≈ 0.998t /n ~ 0.998~c
• An (infinite) series of discontinuous transitions possible
– Nagler, Tiessen, Gutch, Phys. Rev. X 2, 031009 (2012).– Chen, Cheng, Zheng, Chung, R.D., Nagler, Phys Rev E 88, 042152 (2013).
• Explosive Percolation: Repeatedly apply a patch / band-aid / temporaryfix. When the inevitable happens, it is with explosive consequences.

In reality a collection of interacting networks:(multi-type nodes, multi-plex edges)
Networks:
TransportationNetworks/Power grid(distribution/collection networks)
Biological networks- protein interaction- genetic regulation- drug design
Computernetworks
Social networks- Immunology- Information- Commerce
• E-commerce→WWW→ Internet→ Power grid→ River networks.
• Biological virus → Social contact network → Transportation networks →Communication networks→ Power grid→ River networks.
Coupling of like scales across space and time
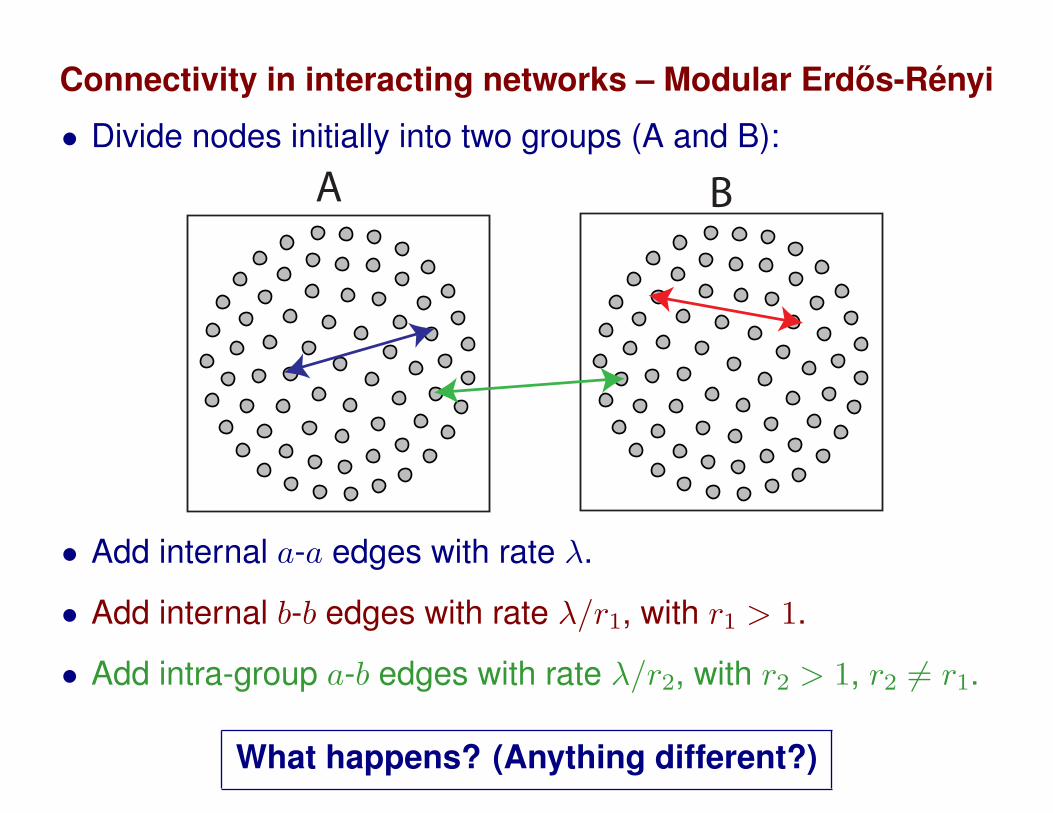
Connectivity in interacting networks – Modular Erdos-Renyi
• Divide nodes initially into two groups (A and B):
A B
• Add internal a-a edges with rate λ.
• Add internal b-b edges with rate λ/r1, with r1 > 1.
• Add intra-group a-b edges with rate λ/r2, with r2 > 1, r2 6= r1.
What happens? (Anything different?)

Percolation on interacting networks,using random graph models
(E. Leicht and R. D’Souza, arXiv:0907.0894)
a
b
edges to aedges to b
System of two networks Connectivity for an individual node
• Probability distribution nodes in network a: pakakb• For the the system: {pakakb, p
bkakb}
• Build generating function formalism for interacting networks.(i.e., properties of the ensemble of networks with {pakakb, p
bkakb})

Wiring which respects group structures percolates earlier!A B
0.0
0.2
0.4
0.6
0.8 1.0 1.2 1.4 1.6
Frac
tion
of n
odes
–k
SL1
SL2
SER
“Cooperative enhancement”
aa rate λ
bb rate λ/r1, w/ r1 = 2
ab rate λ/r2, w/ r2 = 6

Generating functions, topology, and percolation cascadesin coupled infrastructure networks
• Sergey Buldyrev, Roni Parshani, Gerald Paul, H. Eugene Stanley, ShlomoHavlin, “Catastrophic cascade of failures in interdependent networks”Nature 464, 1025-1028• Though power law degree dist make a single network more robust to
random failure, makes a coupled network more susceptible.
• Modeling a blackout in Italy
continue this process until no further splitting and link removal canoccur (Fig. 2d). We find that this process leads to a percolation phasetransition for the two interdependent networks at a critical threshold,p5 pc, which is significantly larger than the equivalent threshold for asingle network. As in classical network theory21–25, we define the giantmutually connected component to be themutually connected clusterspanning the entire network. Below pc there is no giant mutuallyconnected component, whereas above pc a giant mutually connectedcluster exists.
Our insight based on percolation theory is that when the networkis fragmented, the nodes belonging to the giant component connect-ing a finite fraction of the network are still functional, whereas thenodes that are part of the remaining small clusters become non-functional. Therefore, for interdependent networks only the giant
mutually connected cluster is of interest. The probability that twoneighbouring A-nodes are connected by A«B links to two neigh-bouring B-nodes scales as 1/N (Supplementary Information). Hence,at the end of the cascade process of failures, above pc only very smallmutually connected clusters and one giant mutually connected clus-ter exist, in contrast to traditional percolation, wherein the clustersize distribution obeys a power law. When the giant componentexists, the interdependent networks preserve their functionality; ifit does not exist, the networks split into small fragments that cannotfunction on their own.
We apply our model first to the case of two Erdo0 s–Renyi net-works21–23 with average degrees ÆkAæ and ÆkBæ. We remove a randomfraction, 12 p, of the nodes in network A and follow the iterativeprocess of forming a1-, b2-, a3-, …, b2k- and a2k11-clusters as
a11
a12
a13
a11
a12
a13
a31
a32
a33
a34
b21
b22
b23
b24
b21
b22
b23
b24
Attack
Stage 1 Stage 2 Stage 3A B
a b c d
Figure 2 | Modelling an iterative process of a cascade of failures. Eachnode in network A depends on one and only one node in network B, and viceversa. Links between the networks are shown as horizontal straight lines, andA-links and B-links are shown as arcs. a, One node from network A isremoved (‘attack’). b, Stage 1: a dependent node in network B is alsoeliminated and network A breaks into three a1-clusters, namely a11, a12 anda13. c, Stage 2: B-links that link sets of B-nodes connected to separate a1-clusters are eliminated and network B breaks into four b2-clusters, namely
b21, b22, b23 and b24. d, Stage 3: A-links that link sets of A-nodes connected toseparate b2-clusters are eliminated and network A breaks into four a3-clusters, namely a31, a32, a33 and a34. These coincidewith the clusters b21, b22,b23 and b24, and no further link elimination and network breaking occurs.Therefore, each connected b2-cluster/a3-cluster pair is a mutually connectedcluster and the clusters b24 and a34, which are the largest among them,constitute the giant mutually connected component.
a b c
Figure 1 | Modelling a blackout in Italy. Illustration of an iterative process ofa cascade of failures using real-world data from a power network (located onthe map of Italy) and an Internet network (shifted above the map) that wereimplicated in an electrical blackout that occurred in Italy in September200320. The networks are drawn using the real geographical locations andevery Internet server is connected to the geographically nearest powerstation. a, One power station is removed (red node on map) from the powernetwork and as a result the Internet nodes depending on it are removed fromthe Internet network (red nodes above the map). The nodes that will bedisconnected from the giant cluster (a cluster that spans the entire network)
at the next step are marked in green. b, Additional nodes that weredisconnected from the Internet communication network giant componentare removed (red nodes above map). As a result the power stationsdepending on them are removed from the power network (red nodes onmap). Again, the nodes that will be disconnected from the giant cluster at thenext step are marked in green. c, Additional nodes that were disconnectedfrom the giant component of the power network are removed (red nodes onmap) as well as the nodes in the Internet network that depend on them (rednodes above map).
LETTERS NATURE |Vol 464 | 15 April 2010
1026Macmillan Publishers Limited. All rights reserved©2010

Flows on interconnected networksMotivation: modern power grids
• Power grid=a collection ofinterdependentgrids.
• Blackoutscascade fromone grid toanother.
• How to assessimpact ofincreasinginterconnectivity?
Source: NPR
Synchronization another fundamental aspect:• Motter, A. E., Myers, S. A., Anghel, M., & Nishikawa, T., Nature Physics, (2013).

Bak-Tang-Wiesenfeld PRL 1987: self-organized criticality
Sandpile model on networks
• Start with a network
• Drop units of load randomly on nodes
• Each node has a threshold.Here = degree.
• Load on a node ≥ threshold ⇒ node topples, moves load to neighbors
42 3
3
3

Sandpile model on networks
• Start with a network
• Drop units of load randomly on nodes
• Each node has a threshold.Here = degree.
• Load on a node ≥ threshold ⇒ node topples, moves load to neighbors
• Neighbors may topple. Etc. Cascade (or avalanche) of topplings.
42 3
3
3
Power-law distribution of avalanche sizes, P (s) ∼ s−3/2

Power law tails (Universal behavior)
Avalance size follows power law distribution P (s) ∼ s−3/2
Power law tails seem to characterize the sizes of electrical blackouts,financial fluctuations, neuronal avalanches, earthquakes, landslides, overspillin water reservoirs, forest fires and solar flares.
15
onset of a giant component (which happens at φ22 = 1�2 when�→ 0). The rational numbers in Eq. (12b) are indicative only:excluding φ00 and φ22, we have no reason to offer as to whythe φij should be close to relatively small ratios (and this maywell be accidental).
As � → 0, this analytical work indicates that φ22 convergesto 1�2 from below. In Monte Carlo simulations, Eq. (4b) re-ports φ22 ≈ 0.53 for N = 106 and � = 10−3, which appearsto indicate convergence from above. This discrepancy is rec-onciled by considering that our analytical work first takes thelimit N → ∞ and then takes the limit � → 0. For a fixed0 < �� 1, Monte Carlo simulations support a convergence ofφ22 to values slightly below 1�2 when the network size is in-creased, and the converged values are closer to 1�2 for smallerfixed values of �.
VII. CONCLUSION
The BTW sandpile process is an archetypal example of self-organized criticality (SOC), a term blanketing any system Xthat has a critical point as an attractor. We argue that, althoughthis article focuses on the BTW sandpile process on networks,the understanding and tools developed herein are applicable toa vast array of models Y that approximate an SOC system X .
The first step is to acknowledge that X and Y are differ-ent dynamical systems obeying different rules. Typically, thesystem of interest X has many more degrees of freedom thanY does. If X approaches a stable equilibrium, then intricatecorrelations may emerge among its numerous degrees of free-dom. When measurements of X’s equilibrium state are usedto fix Y ’s degrees of freedom, most of these correlations arelost. For this reason, Y may not accurately approximate X .
This phenomenon likely occurs whenever quantities of in-terest in X have a power law behavior due to SOC. For ex-ample, if Y is a branching process predicting said quantity ofinterest, then R0, the mean of its branching probability distri-bution, should be close to unity if the resulting distribution isto have a power law. This requirement is the lesson of the ap-parent paradox surrounding Eqs. (2)–(3). Counterintuitively,“better” assumptions can make a model worse, because ac-counting for more correlations can break criticality.
What is impressive and surprising about the work of Goh etal. [19–21] is that despite missing many important correlations
(that we demonstrated here) their approximation manages tocorrectly predict the power law tail behavior. Specifically,given the exponent of a power law degree distribution, theirapproximation Y predicts the asymptotic behavior of the cas-cade size distribution of the model X . We conjecture that thissuccess results from universality, i.e., that their model Y liesin the same universality class as the system X (see Sec. III Aand mathematical justifications in Sec. S2 of the SupplementalMaterial).
In general, when interested only in “macroscopic” objects(here the asymptotic behaviors of the cascade size distribu-tion), it may suffice to reproduce in a model Y the “symme-tries” of a process X (here the branching number R0 = 1 andthe asymptotic behavior of the branching distribution). Otherdetails may not matter.
In other contexts, a macroscopic understanding may notsuffice. To calculate microscopic quantities, a microscopicunderstanding of the process is likely required. In the con-text of the BTW process, we studied the internal workings ofa cascade (Sec. IV), which enabled the possibility to distin-guish cascade size and area (Sec. V). Our microscopic mod-eling culminates in Sec. VI with our zero-parameter model:we design a branching process (at the level of Y ) that itselfhas SOC, and the critical point to which it converges is com-patible with values observed in simulations (at the level of X).We then used this model to explore the BTW process in rangesprohibitively costly to simulate.
While we acknowledge that this last model was obtained ina quite specific context, its success serves as a proof of con-cept. More generally, this zero-parameter, critical approxi-mation of an SOC system paves the road for powerful, self-consistent and microscopically accurate models of real worldsystems that self-organize to critical points.
ACKNOWLEDGMENTS
We thank Kwang-Il Goh for useful discussion, and wegratefully acknowledge funding from the Defense Threat Re-duction Agency Basic Research Award HDTRA1-10-1-0088and from the Army Research Laboratory Cooperative Agree-ment W911NF-09-2-0053. CDB was funded by the Depart-ment of Defense (DoD) through the National Defense Science& Engineering Graduate Fellowship (NDSEG) Program.
[1] I. Dobson, B. A. Carreras, V. E. Lynch, and D. E. Newman,Chaos 17, 026103 (2007).
[2] X. Gabaix, P. Gopikrishnan, V. Plerou, and H. E. Stanley, Na-ture 423, 267 (2003).
[3] J. M. Beggs and D. Plenz, J, Neurosci. 23, 11167 (2003).[4] D. E. Juanico and C. Monterola, J. Phys. A 40, 9297 (2007).[5] T. Ribeiro, M. Copelli, F. Caixeta, and H. Belchior, PLoS ONE
5, e14129 (2010).[6] A. Saichev and D. Sornette, Phys. Rev. E 70, 046123 (2004).[7] S. Hergarten, Natural Hazards and Earth System Sciences 3,
505 (2003).
[8] G. L. Mamede, N. A. M. Araujo, C. M. Schneider, J. C.de Araújo, and H. J. Herrmann, Proc. Natl. Acad. Sci. U.S.A.109, 7191 (2012).
[9] P. Sinha-Ray and H. J. Jensen, Phys. Rev. E 62, 3216 (2000).[10] B. D. Malamud, G. Morein, and D. L. Turcotte, Science 281,
1840 (1998).[11] E. T. Lu and R. J. Hamilton, Astrophys. J. 380, L89 (1991).[12] M. Paczuski, S. Boettcher, and M. Baiesi, Phys. Rev. Lett. 95,
181102 (2005).[13] P. Bak, C. Tang, and K. Wiesenfeld, Phys. Rev. Lett. 59, 381
(1987).

BTW cascades on sparsely coupled networks
C. Brummitt, R. M. DSouza, E. A. Leicht PNAS 109 (12), 2012.
Two-type network: a and bImpact of increased a-b links.
pa(ka, kb), pb(ka, kb)(Configuration model)
Branching process treatment
qab(rba, rbb) := the branch(children) distribution for
an ab-shedding.

Main findings: For an individual network, optimal p∗
• (Blue curve) self-inflicted cascades (second network is reservoir).
• (Red curve) inflicted from the second network
• (Gold curve) Neglecting the origin of the cascade

Optimal interdependence
“Some networking is good. Too much is overwhelming.”How interdependent should X be?
Financial networksAndrew Haldane/Bank of England
and conclusions established in this study will be relevant to thesystemic investigations of global economic problems.
Discussion
We have studied the crisis spreading dynamics on globaleconomic system using a simple toy model of crisis spreading ontop of the global macroeconomic network built from theinternational trade data. Focusing on the role of the networktopology at the local and global level, we have shown that theimpact of a country to the spread of crisis is not fully captured byits simple macroeconomic index such as GDP, but its connectivityprofile is also instrumental for a better understanding. Beyond the
direct impact, the indirect impacts propagating through weak linksform a significant part of the avalanche process of crisis spreading.At the local or regional scale, we have shown that the strongregional blocs leading to clustering of weak links can aggravate thecrisis spreading, by accumulating impact through the densemultilateral connectivity within the blocs. At the same time, onthe global scale, the current structure of global macroeconomicnetwork harbors higher tolerance to extreme crises than the more‘‘globalized’’ network structures obtained by randomized globalnetworks. These results may have an interesting implication on thehidden cost of the ongoing globalization movement: In a moreglobalized macroeconomic network in which the regional andcontinental clustering continues to become untangled via estab-
Figure 11. Results of the modified crisis spreading model with CAB. Displayed are (A) the cumulative counts of avalanche sizes, (B) theavalanche profile of countries with the ten largest avalanche sizes, and (C) the avalanche network of the modified model. One may note that similarityof the overall results to those of the original model (Figs. 2, 6, and 8B, respectively), despite some quantitative changes in the numeric values. In themodified model, we recover the power-law-like P(A) at f/t<7; the indirect avalanches constitute the dominant part of the avalanche profiles; and theavalanche network maintains the continental clustering pattern.doi:10.1371/journal.pone.0018443.g011
Crisis Spreading in Global Macroeconomic Network
PLoS ONE | www.plosone.org 9 March 2011 | Volume 6 | Issue 3 | e18443
Economies
Lee et al., PLoS ONE 2010
InfrastructuresL. Dueñas-Osorio
Saturday, May 19, 12
• Financial markets: Battiston, et al., J. of Econ. Dyn. & Control 36 (2012).
• Synchronization: Hunt., Korniss, Szymanski. PRL, 2010.
• “Islanding” in power grids: Andersson, et al. IEEE Trans. Power Systems, 2005.
• “Islanding” among traders: Saavedra, Hagerty, Uzzi, PNAS, 2011, PLoS ONE 2011.
Network Theory and Network ScienceMuch left to understand
• Connecting dynamics of and dynamics on in individual networks
• Activating and inhibiting links
• Flows
• Strategic interactions
• Co-evolution and interactions of interdependent neworks
• Validation
• Modeling real systems...